Article

Columnar Aerosol Optical Property Characterization and Aerosol Typing Based on Ground-Based Observations in a Rural Site in the Central Yangtze River Delta Region

1
School of Geographical Sciences, Nanjing University of Information Science & Technology, Nanjing 210044, China
2
Aerospace Information Research Institute, Chinese Academy of Sciences, Beijing 100101, China
3
China Sciences Prowise (Beijing) Technology Co., Ltd., Beijing 100101, China
*
Author to whom correspondence should be addressed.
Remote Sens. 2022, 14(2), 406; https://doi.org/10.3390/rs14020406
Submission received: 3 December 2021 / Revised: 10 January 2022 / Accepted: 13 January 2022 / Published: 16 January 2022
(This article belongs to the Section Atmospheric Remote Sensing)

Abstract

:
Accurate and updated aerosol optical properties (AOPs) are of vital importance to climatology and environment-related studies for assessing the radiative impact of natural and anthropogenic aerosols. We comprehensively studied the columnar AOP observations between January 2019 and July 2020 from a ground-based remote sensing instrument located at a rural site operated by Central China Comprehensive Experimental Sites in the center of the Yangtze River Delta (YRD) region. In order to further study the aerosol type, two threshold-based aerosol classification methods were used to investigate the potential categories of aerosol particles under different aerosol loadings. Based on AOP observation and classification results, the potential relationships between the above-mentioned results and meteorological factors (i.e., humidity) and long-range transportation processes were analyzed. According to the results, obvious variation in aerosol optical depth (AOD) during the daytime, as well as throughout the year, was revealed. Investigation into AOD, single-scattering albedo (SSA), and absorption aerosol optical depth (AAOD) revealed the dominance of fine-mode aerosols with low absorptivity. According to the results of the two aerosol classification methods, the dominant aerosol types were continental (accounting for 43.9%, method A) and non-absorbing aerosols (62.5%, method B). Longer term columnar AOP observations using remote sensing alongside other techniques in the rural areas in East China are still needed for accurate parameterization in the future.

Graphical Abstract

1. Introduction

Accurate characterization of aerosol optical properties (AOPs)—for example, the aerosol fine/coarse-mode extinction coefficient, single-scattering albedo, and asymmetry factor—is critically important for studies related to climate model parameterization [1,2], quantitative remote sensing [3], and atmospheric pollution and human health problems [4]. In the past two decades, both surface-level [5,6,7] and columnar [8,9] AOPs have been comprehensively observed and investigated globally due to the rapid development of optical observation instruments and remote sensing technology, including ground-based (e.g., sun photometer) and satellite-based sensors. Despite larger spatial coverage of satellite-based aerosol optical property observations, relatively lower accuracy is achieved by satellite-based sensors—mainly because of uncertainty introduced in the decoupling of radiance contributions from the surface and from aerosols. Ground-based aerosol property retrievals, however, achieve higher accuracy through the use of sky radiance observations obtained in almucantar and principal plane modes [10,11].
Aside from AOP observations, much attention is also paid to the classification of columnar aerosols, so as to further learn about the long-range transportation and potential source(s) of aerosol particles [12,13,14]. These efforts include aerosol typing and component analysis studies carried out directly from measured radiance [14], or indirectly, based on AOP inversions (e.g., AAOD) [15,16,17]. Most indirect aerosol typing methods involve classification of AOP observations based on a set of predefined thresholds consisting of two or more AOP parameters, such as AOD–Ångström exponent (AE) [8,18], and fine-mode fraction (FMF)–SSA [19,20]. Although threshold values may vary slightly across different regions, the threshold-based classification method does provide a simple and efficient means of aerosol type determination [13].
The Yangtze River Delta (YRD) region is a hotspot of atmospheric environmental studies, due to the presence of abundant aerosol emission sources (e.g., vehicles, industry); thus, numerous studies of AOPs have been conducted in recent decades [21,22,23,24]. Using surface-based instruments (e.g., aethalometer and nephelometer) and sun photometers, the absorption and scattering properties of near-surface and columnar particles have been widely investigated [25]. Obvious seasonal variation in surface or columnar aerosol concentrations has been observed through multiple studies, and different patterns have been revealed. High aerosol loading as well as high absorption and scattering coefficients are observed in winter; meanwhile, the lowest loading recorded was in summer [26]. As for columnar-AOP-observation-related studies, seasonal variation in AOD was slightly different among previous studies, with the highest AOD in spring [27], summer, and autumn [21]. Based on an analysis of spatiotemporal variation in AOPs, many studies have further examined the aerosol characterization and source apportionment of different aerosol types. Employing Cloud-Aerosol Lidar and Infrared Pathfinder Satellite Observations (CALIPSO) aerosol subtype products, Reddy et al. [27] found that polluted dust and polluted continental aerosols dominate the aerosols in winter, while polluted dust is dominant in spring at the coastal site of Zhoushan, which is in the southern part of the YRD. Shen and Cao [28] further supported the conclusion of dominance of polluted dust in spring by observing an urban site in Nanjing, using ground-based light detection and ranging (Lidar). Air quality is typically poor in winter in the YRD, with a high aerosol concentration of particulate matter near the surface, and unfavorable weather conditions [29]. Source apportionment analysis conducted over some megacities in the YRD region revealed that air masses from Northwest China and the North China Plain are the main contributors to the pollution events in winter [30], while the Zhejiang and Anhui regions contribute the greatest black carbon (BC) concentrations to the northern Nanjing region in winter [29]. The difference between these studies mainly stems from different vertical distribution of aerosols throughout the four seasons, while the differences between columnar AOP observations are caused by the diversified aerosol compositions and complex species across different observation sites.
Based on the above-mentioned literature review, we can conclude that further investigation is still needed for AOP observation and source apportionment analysis in the YRD region. For one thing, since the promulgation of the action plan for comprehensive treatment of air pollution in autumn and winter 2019–2020 in the Yangtze River Delta by the Ministry of Ecology and Environment of China [31], many measures to comprehensively tackle air pollution over the YRD have been taken. However, whether these measures are effective requires continuous observation, investigation, and research which, thus, are still needed for the characterization of complex spatiotemporal variations in AOPs in this region. Furthermore, to the best of our knowledge, the observation of columnar AOPs over the rural background site located near the center of the YRD is still limited [32]. Thus, more AOP observations are still needed over the YRD region in order to further investigate aerosol type and the potential causes of the temporal variations.
The main objectives of the present study were as follows:
(1)
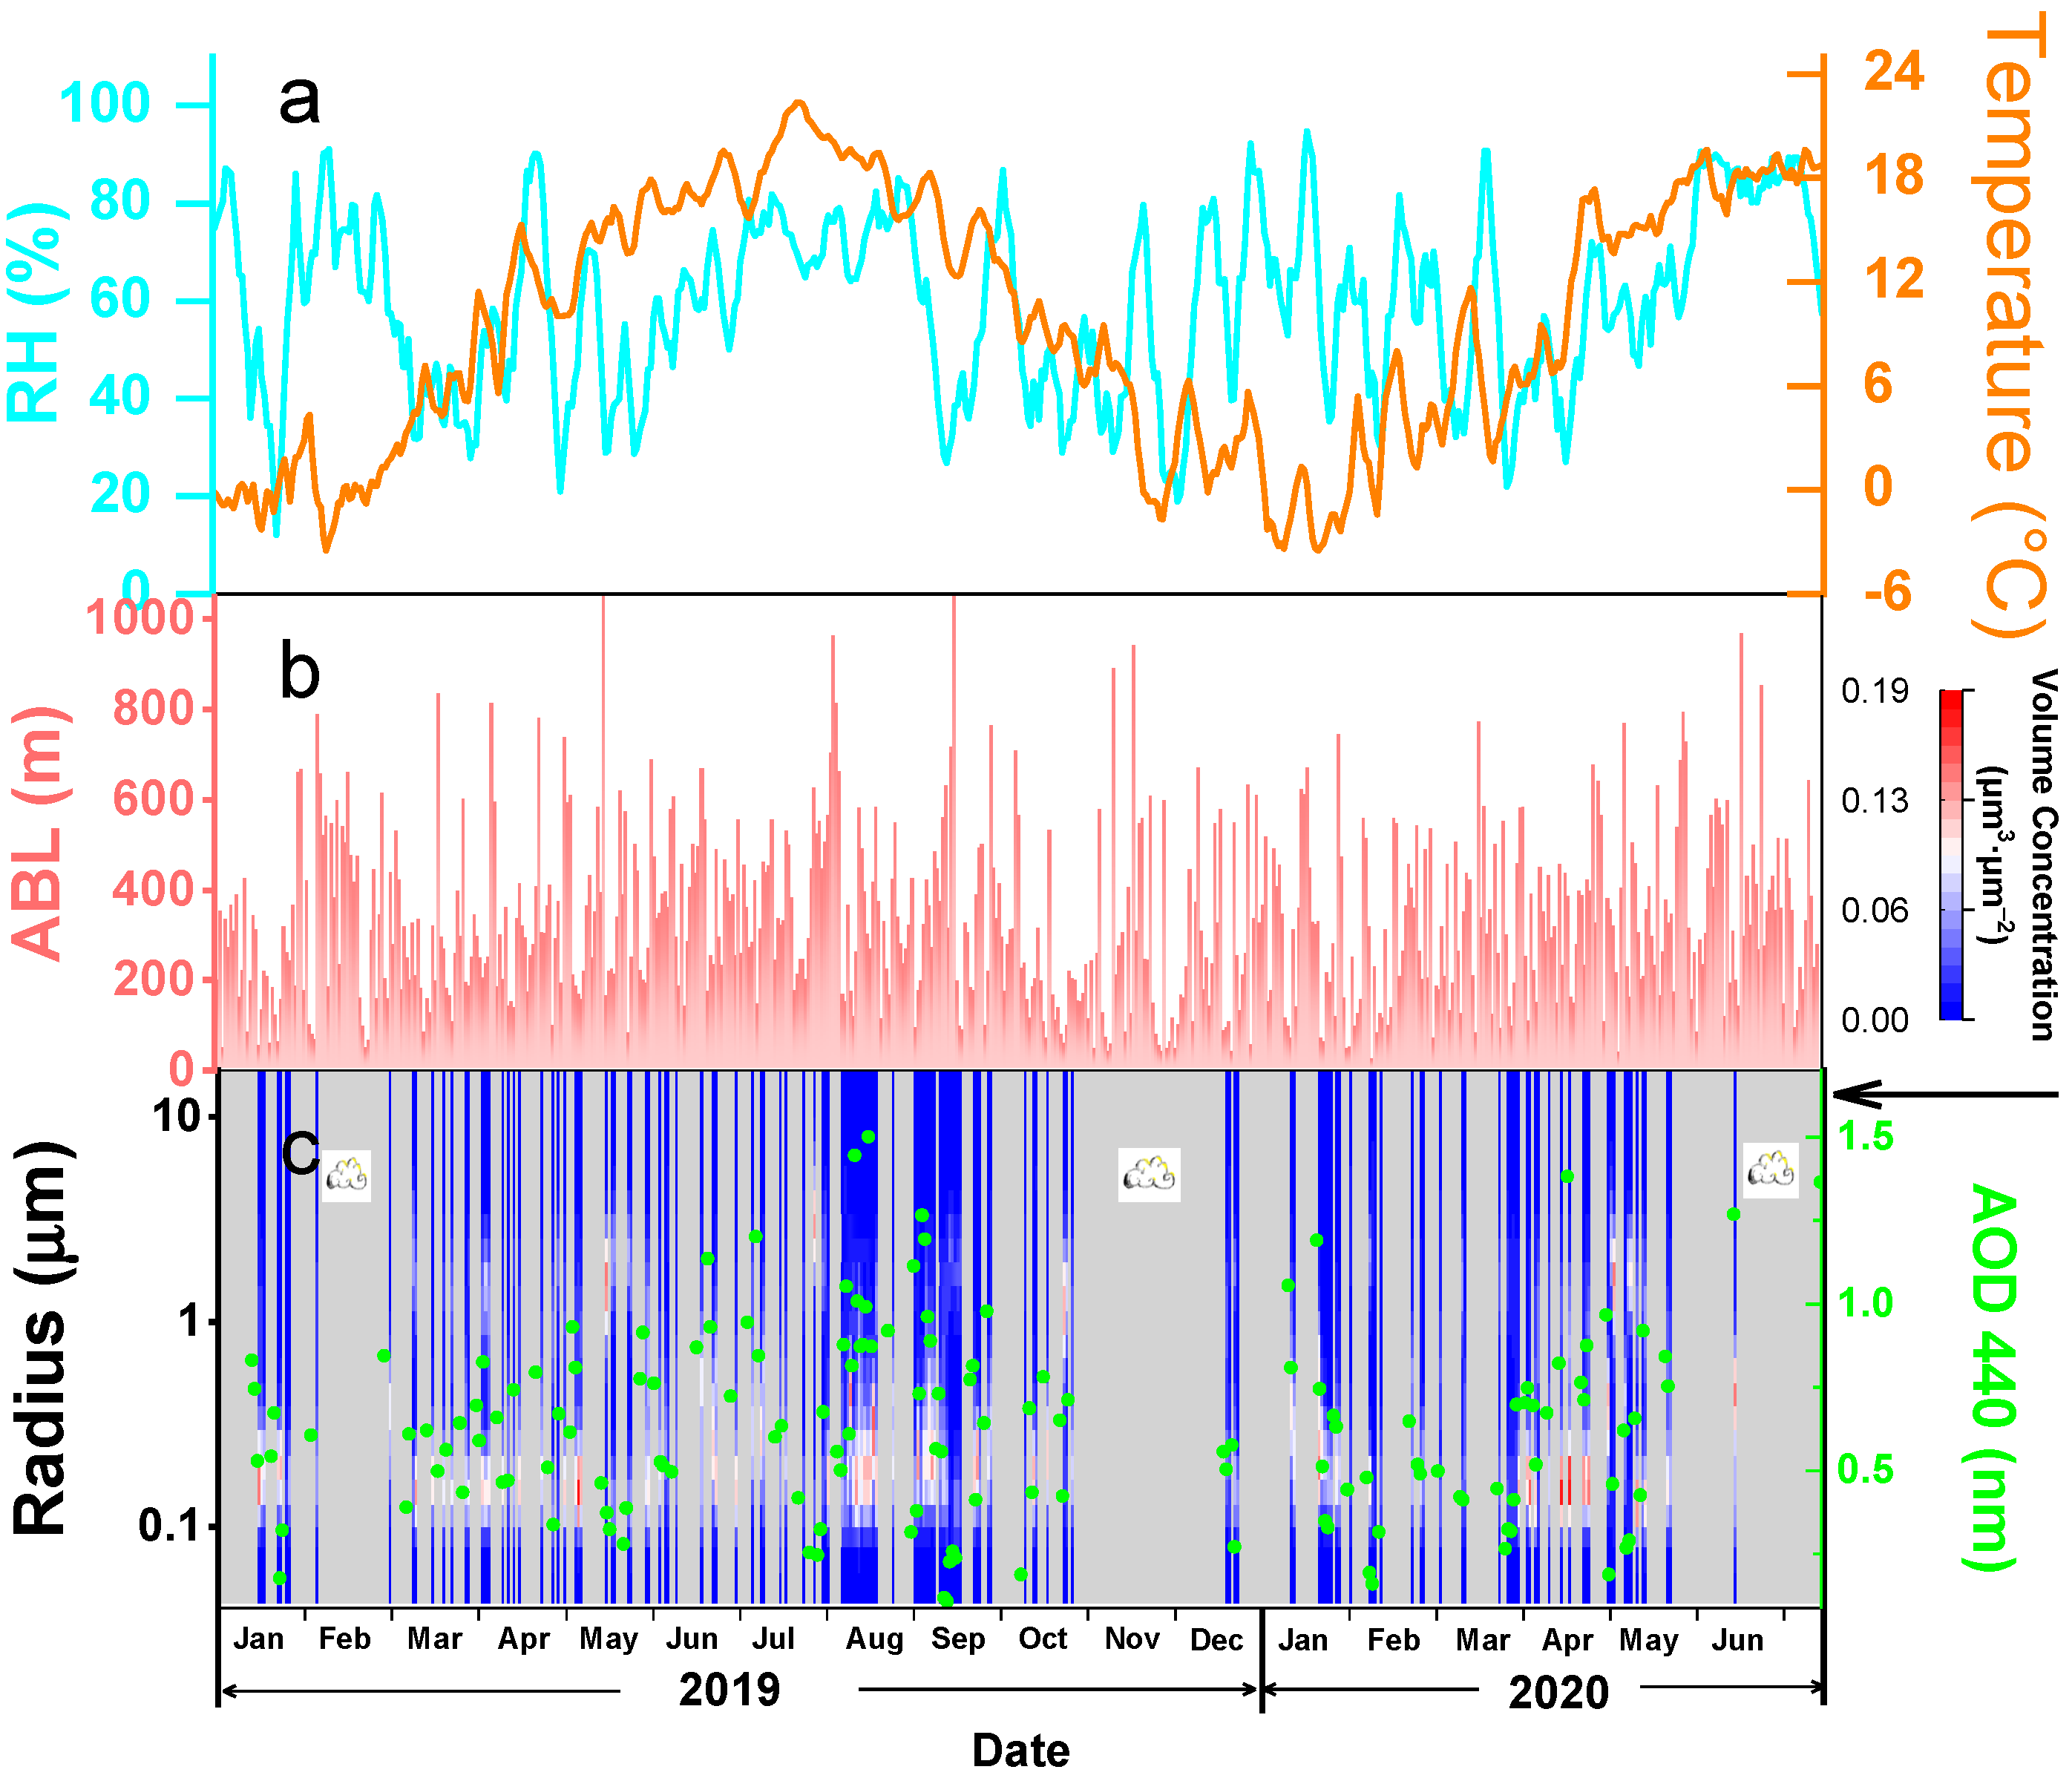
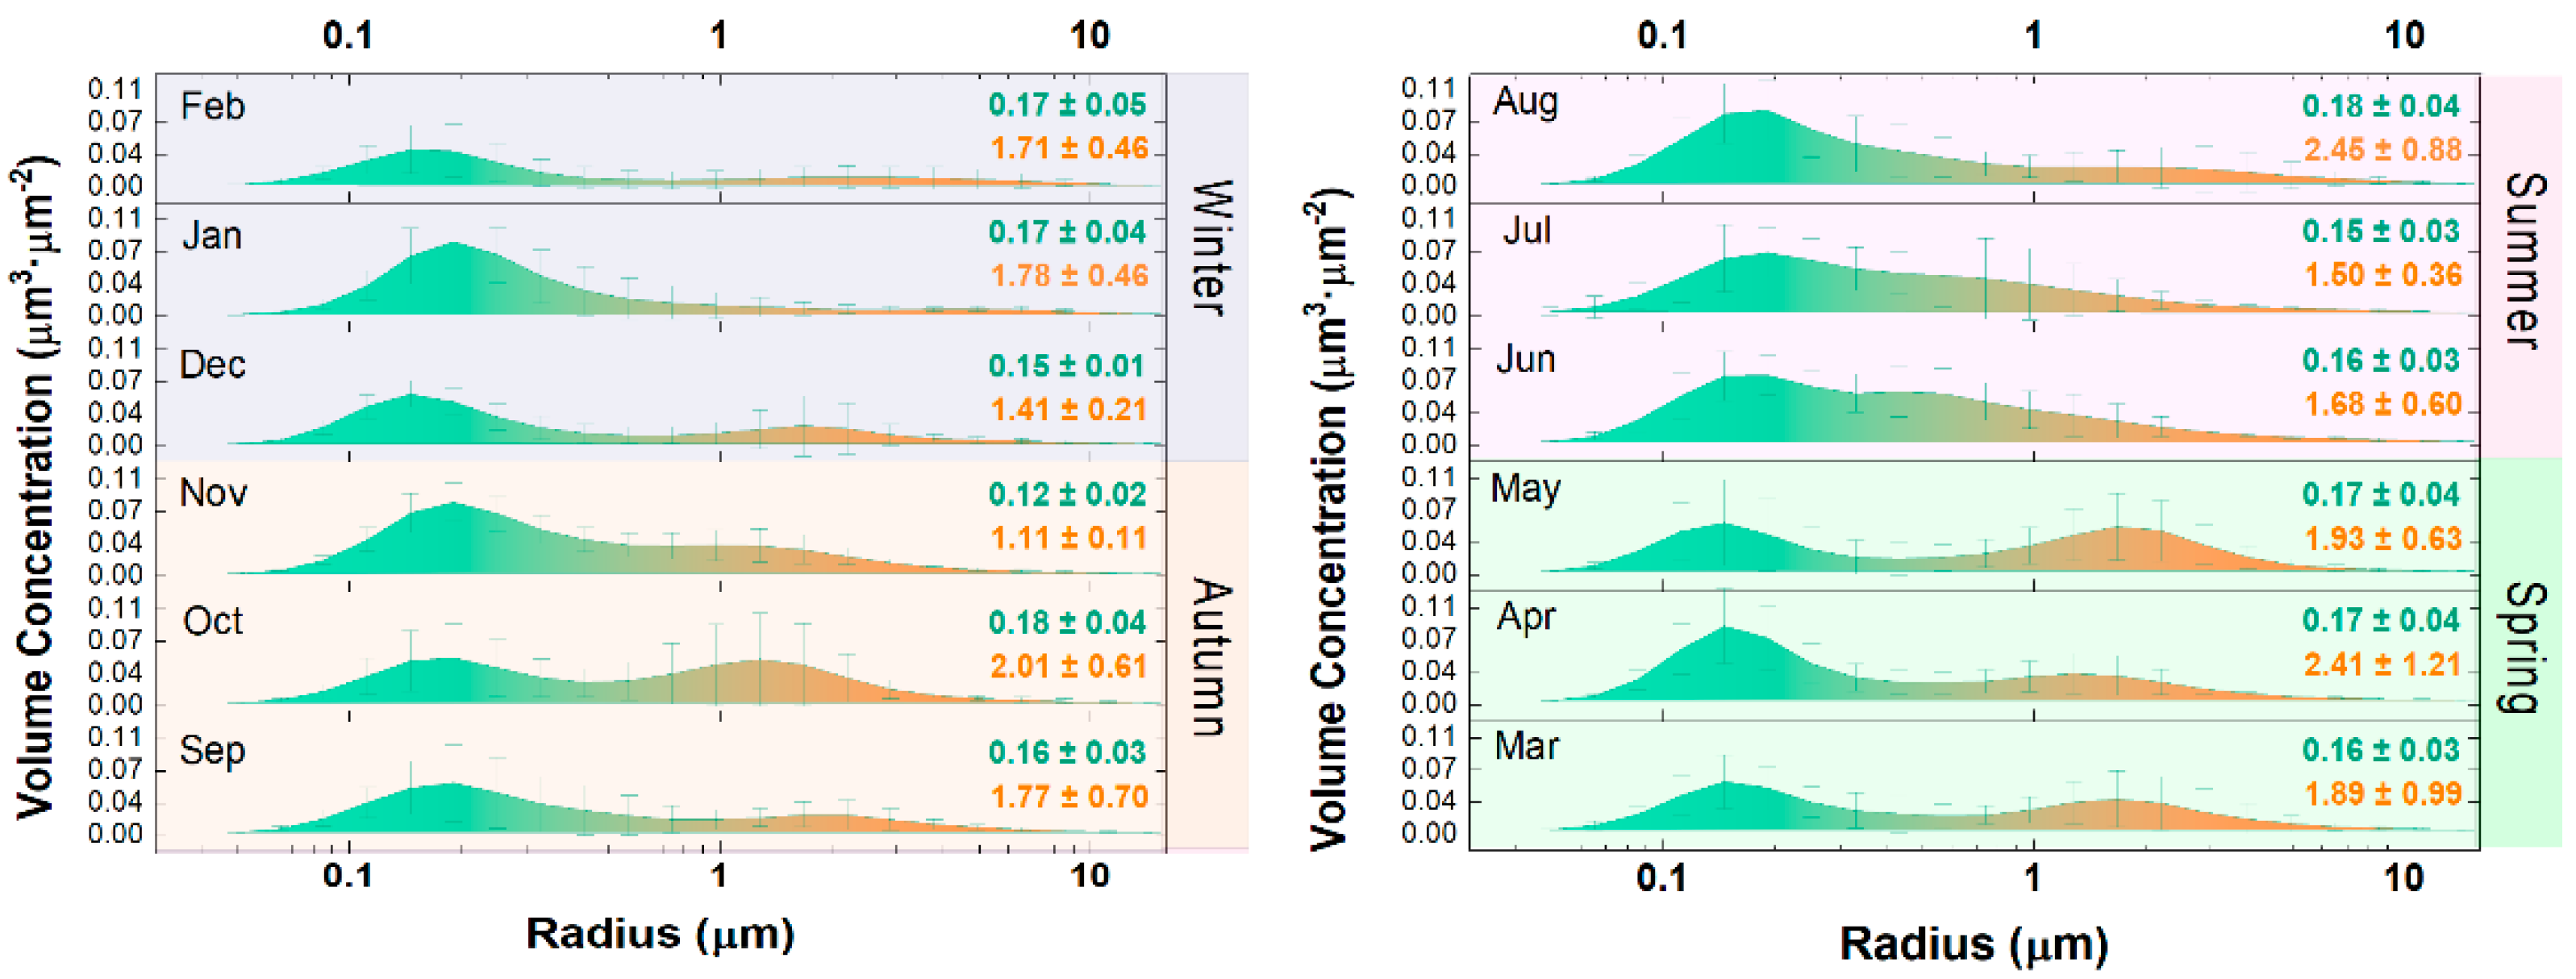
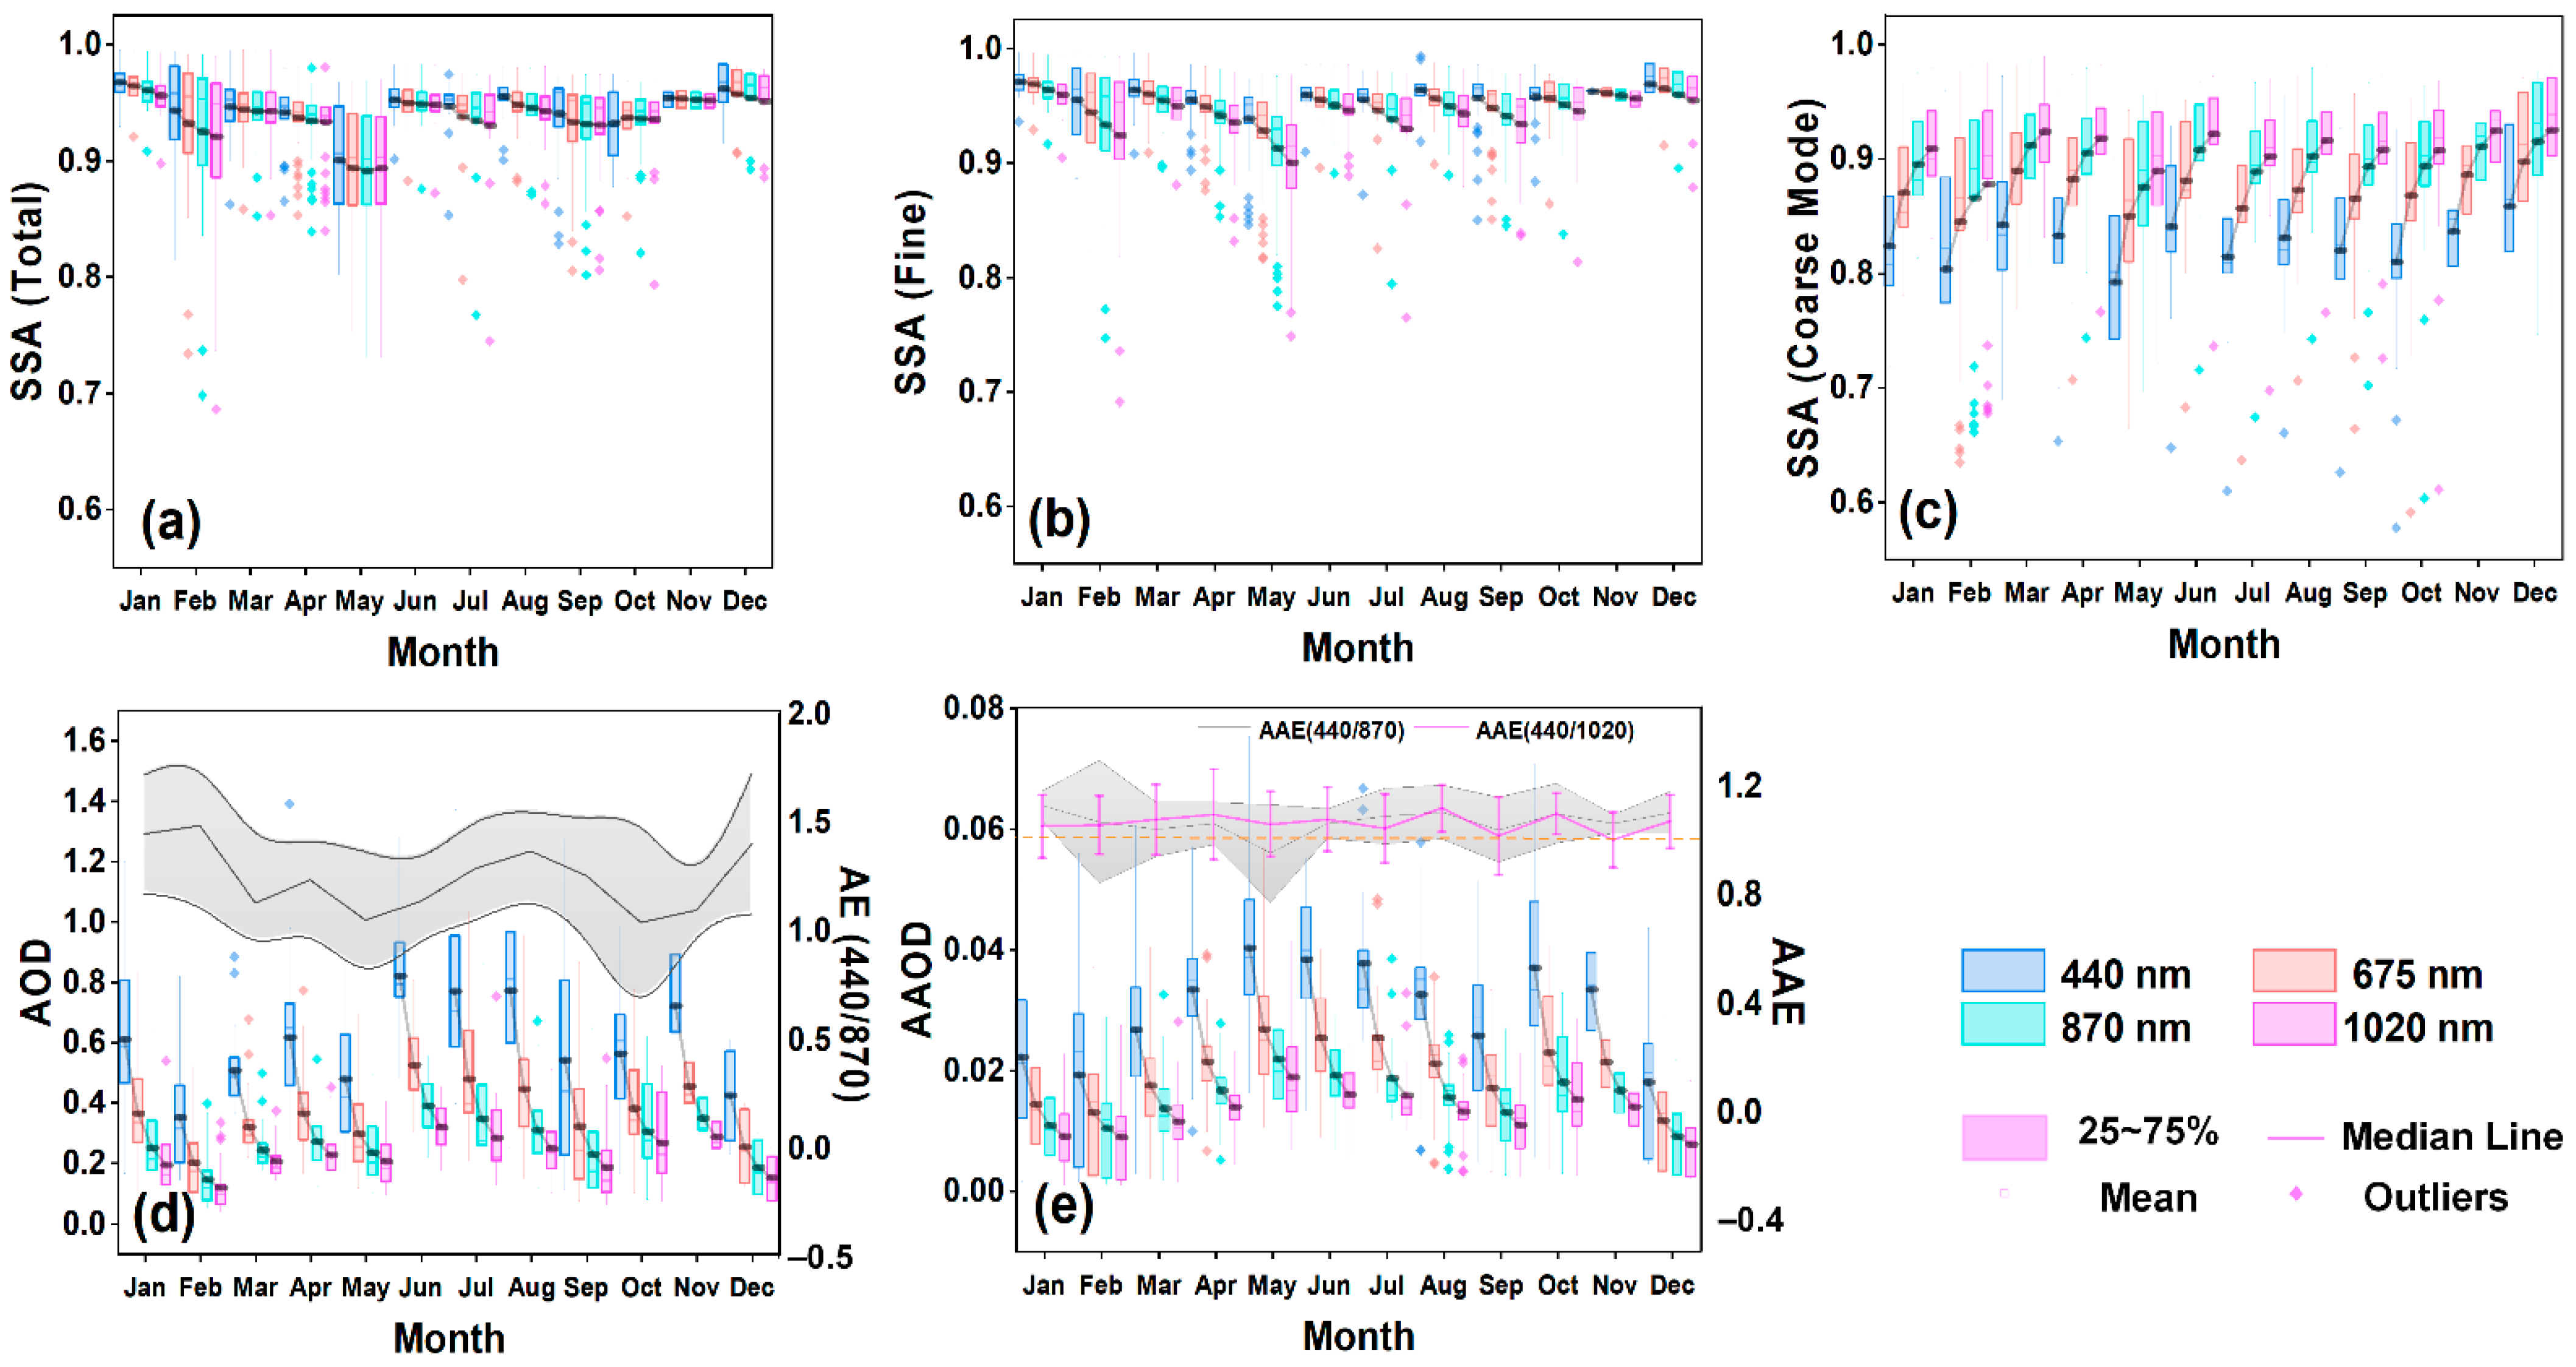
The one-and-a-half-year-long (January 2019–July 2020) variation in columnar AOPs—including SSA, volume size distribution (VSD), AOD, and FMF—were analyzed;
(2)
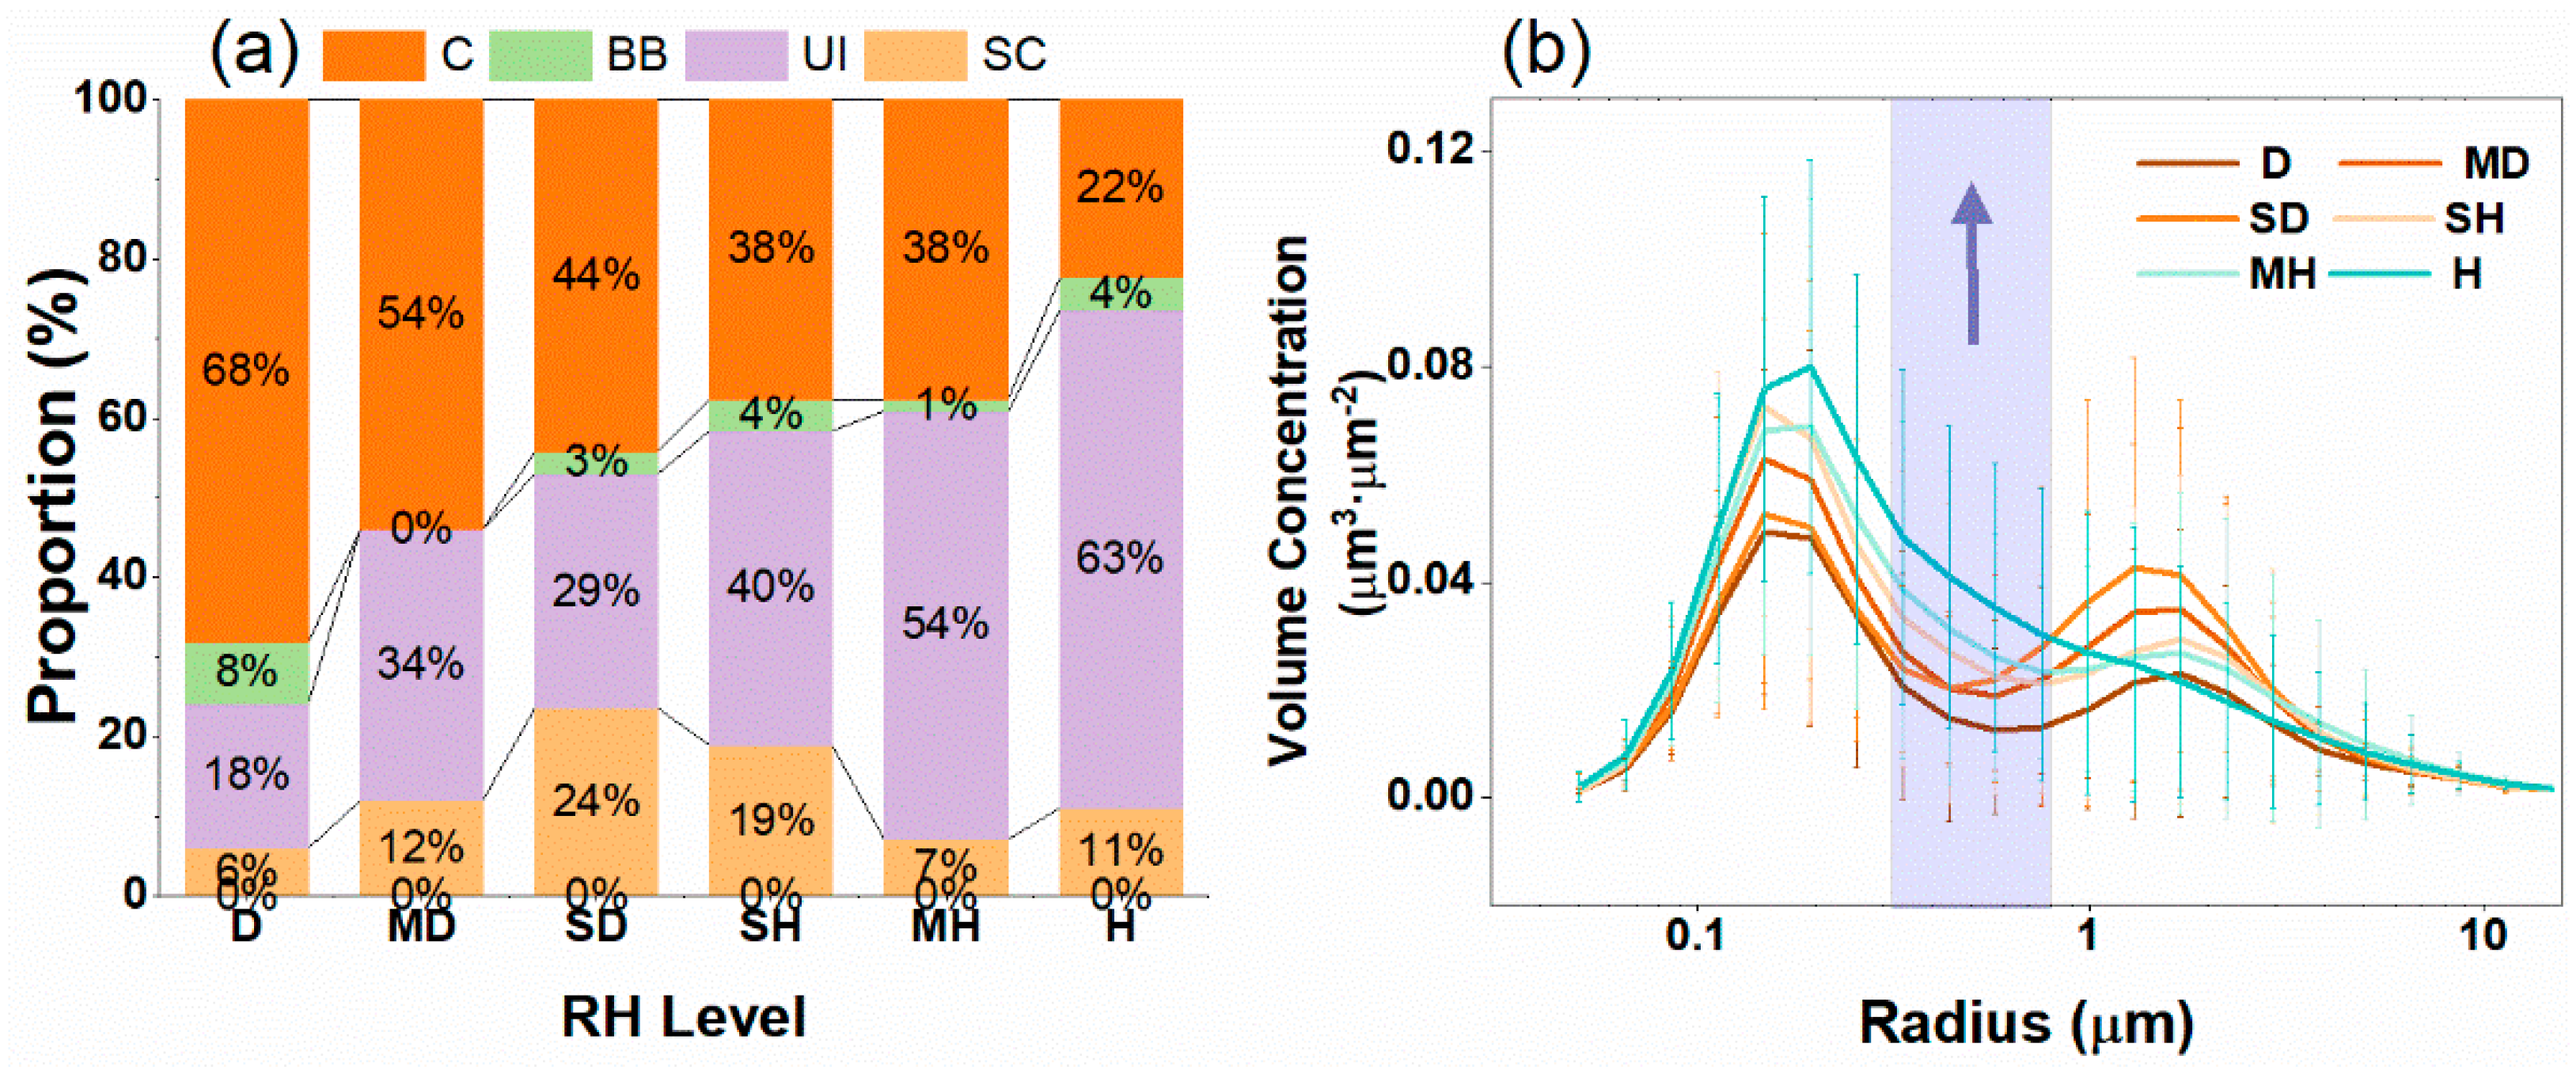
The relationships between AOPs and meteorological parameters—especially relative humidity (RH)—were analyzed in order to further investigate the effects of hygroscopic growth, as well as the impact on aerosol type;
(3)
The AOPs during two episodes characterized by typical meteorological and aerosol loading conditions were analyzed.
The following section introduces the datasets and methodology (Section 2), followed by the discussion (Section 3) of the results of the AOPs and aerosol types, and their connection to meteorological factors. Finally, our main conclusions are summarized in Section 4.

2. Materials and Methods

2.1. Introduction to Study Area

The Nanjing validation site is a part of the Central China Comprehensive Experimental sites (CCCES) observation network [33]. The site is located in Shangxing County, Liyang City, Jiangsu Province—a county lying in the central part of the Yangtze River Delta region, and which is rich in mineral resources and modern industry. The underlying surface type of the Nanjing validation site, however, mainly consists of cropland and farmland. As has been pointed out in the introduction, most AOP observation studies in the YRD region in the past five years have mainly focused on urban areas. Thus, observations for one-and-a-half years from this site could well fill the gap in the rural areas affected by the possible air pollution from the nearby megacities.

2.2. Ground-Based Observations

The ground-based AOP information in this study is derived from sky radiance measurements using a CE-318 sun photometer deployed on the roof of the Nanjing validation site’s experimental building (119.215° E, 31.502° N, ~50 m a.s.l.). The model of optical head was CE318TP9, equipped with nine standard channels (340, 380, 440, 500, 675, 870, 937, 1020, and 1640 nm) as well as three polarized channels (infrared, ultraviolet, and visible). The study period of the present study was January 2019–July 2020.
Much attention is paid to the accuracy of the instruments, and calibration work is annually conducted by CIMEL Corporation. Instruments are annually calibrated at a high-altitude site in Beijing by comparison with a master instrument calibrated using the Langley method at Aerosol Robotic Network (AERONET)/PHOTONS sites. The calibration method achieves high accuracy for both solar and sky radiance (<±0.01 for AOD at wavelength >0.44 µm, and uncertainty for sky radiance measurements between 3% and 5%), which is comparable to that of AERONET [34] and other aerosol observation networks [35].
Based on radiance observations from both principal plane and almucantar modes, an AOP inversion algorithm, which is similar to the AERONET V2.0 inversion algorithm, was employed to decode the aerosol physical information, such as size distribution, volume concentration, and light-absorptive properties at multiple wavelengths [11]. The details of the algorithms are explained in a previous study [32]. According to Sinyuk et al. [36], retrieval accuracy of SSA would decrease under low aerosol loading. Therefore, before investigating temporal and spatial variations in AOPs, records with AOD at 440 nm (AOD 440 nm) less than 0.4 were screened to ensure that only inversions with high-quality assurance were used for analysis.

2.3. Meteorological Parameters
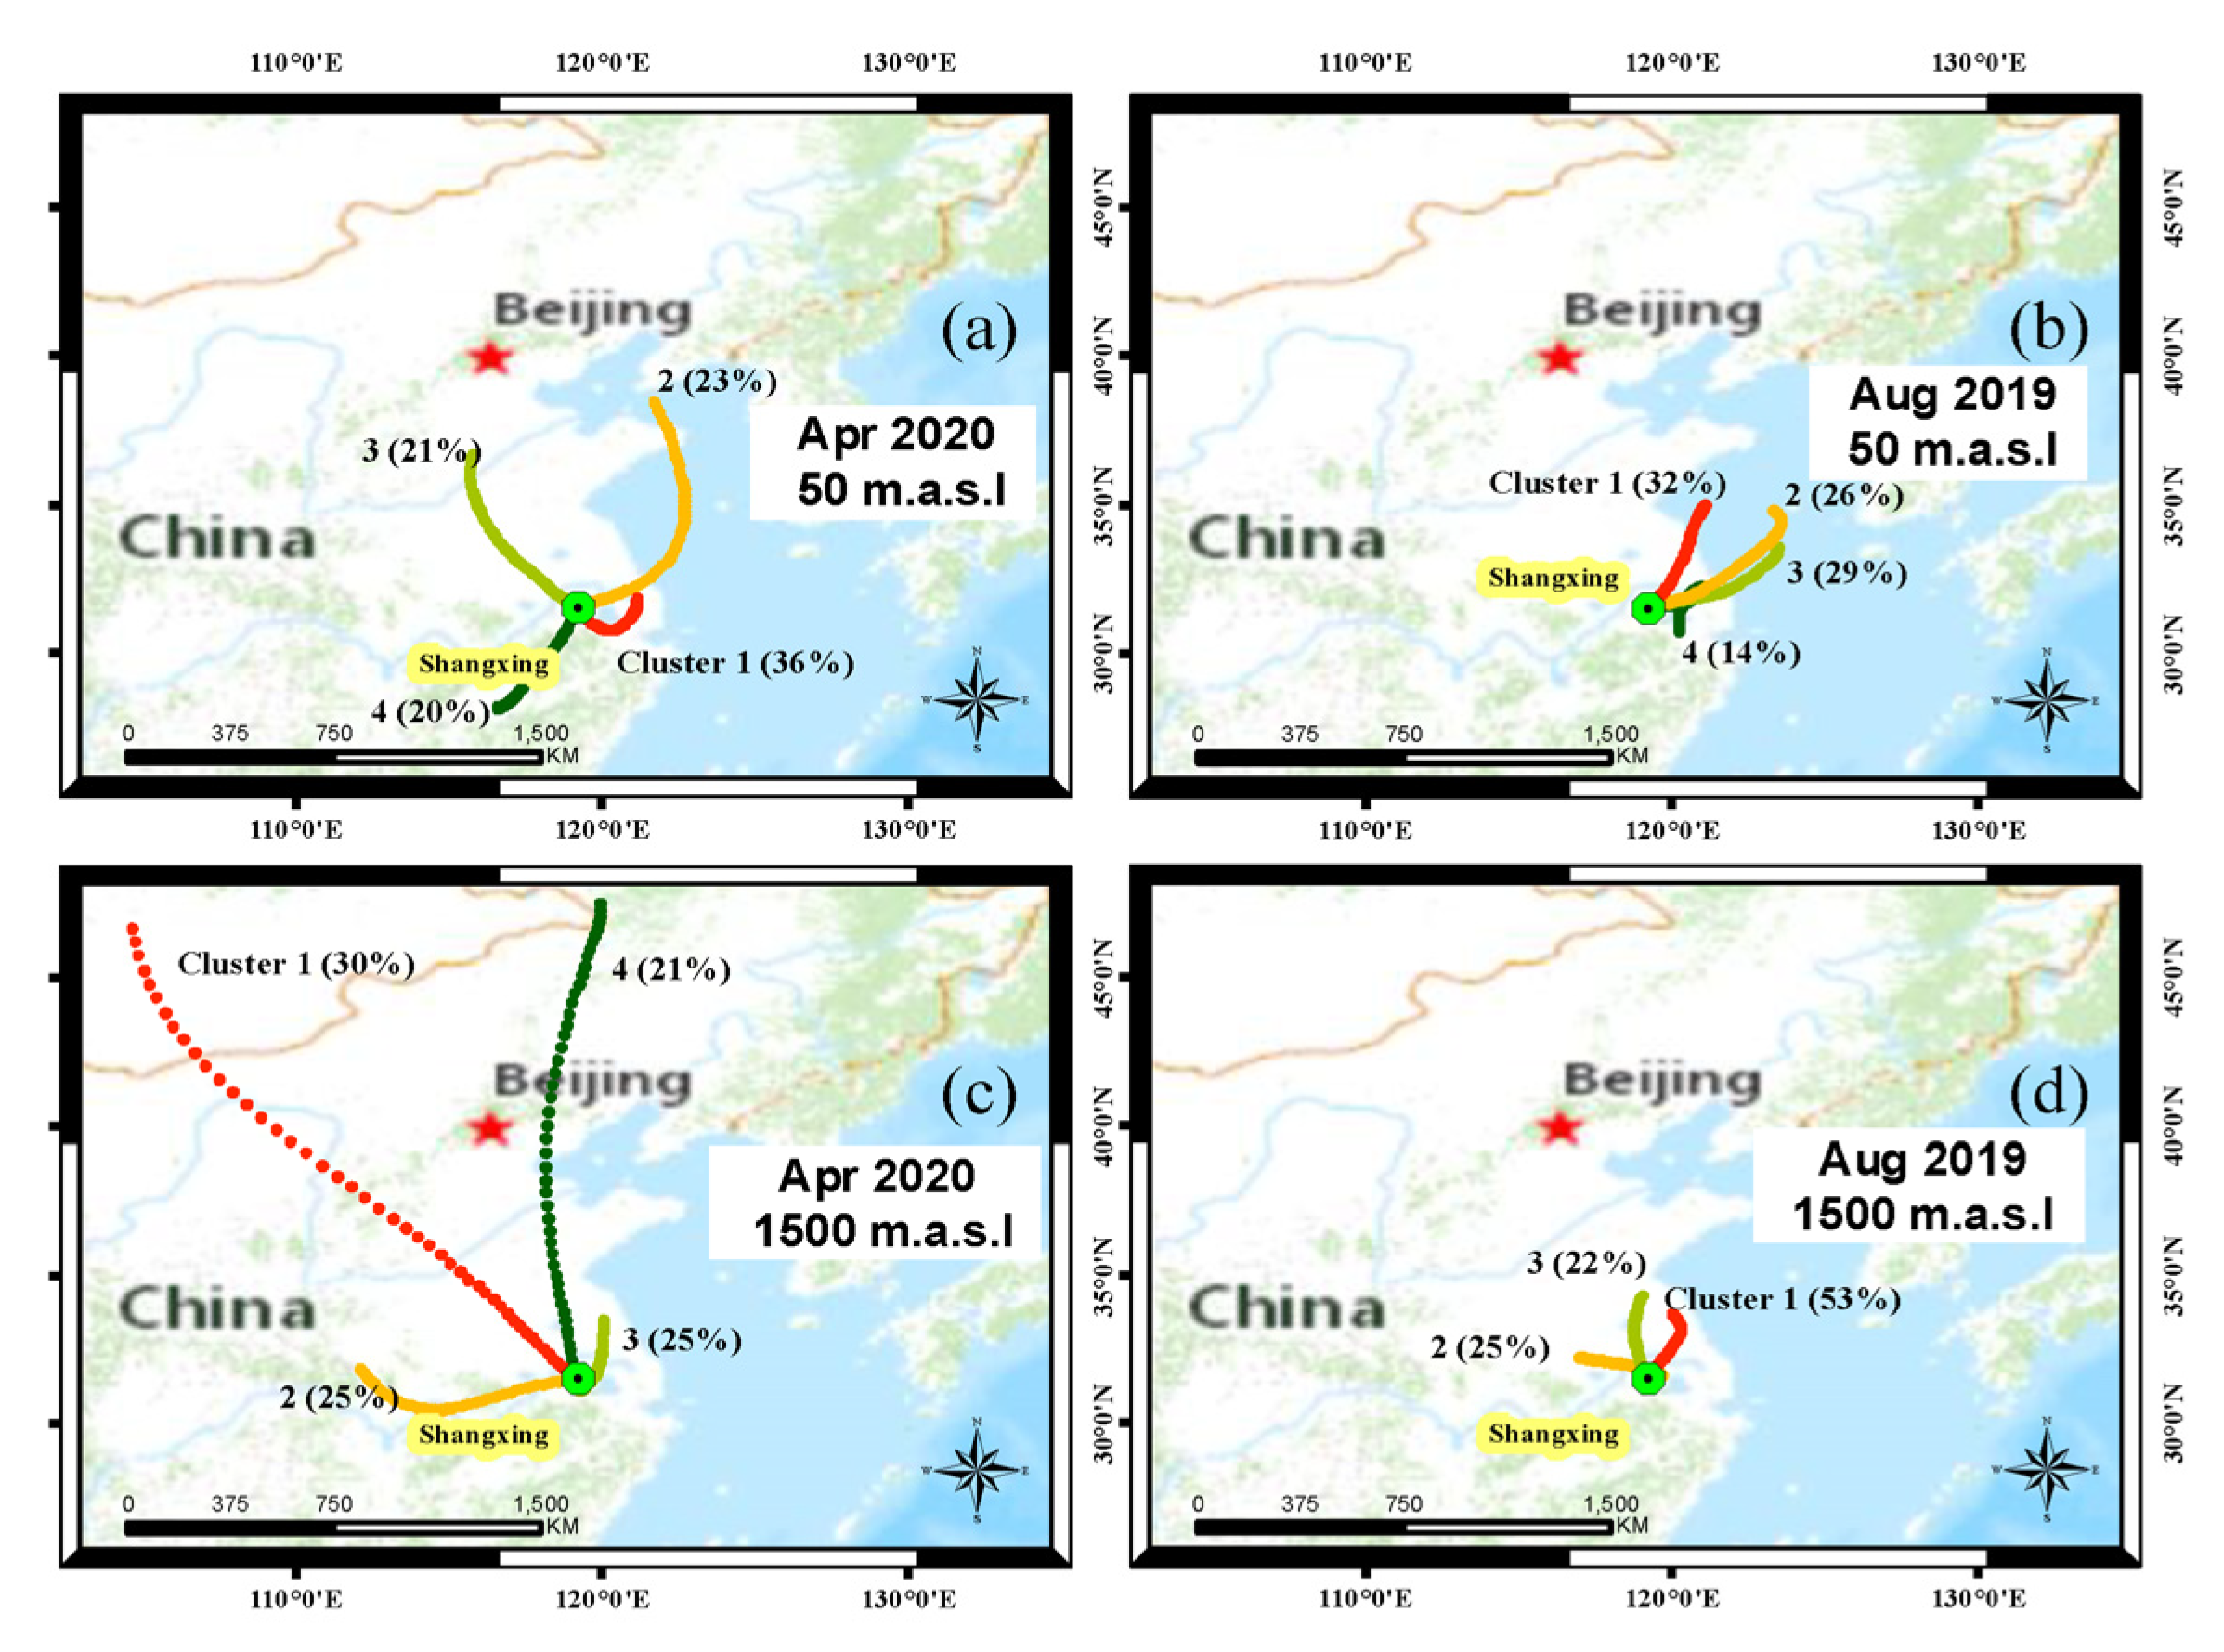
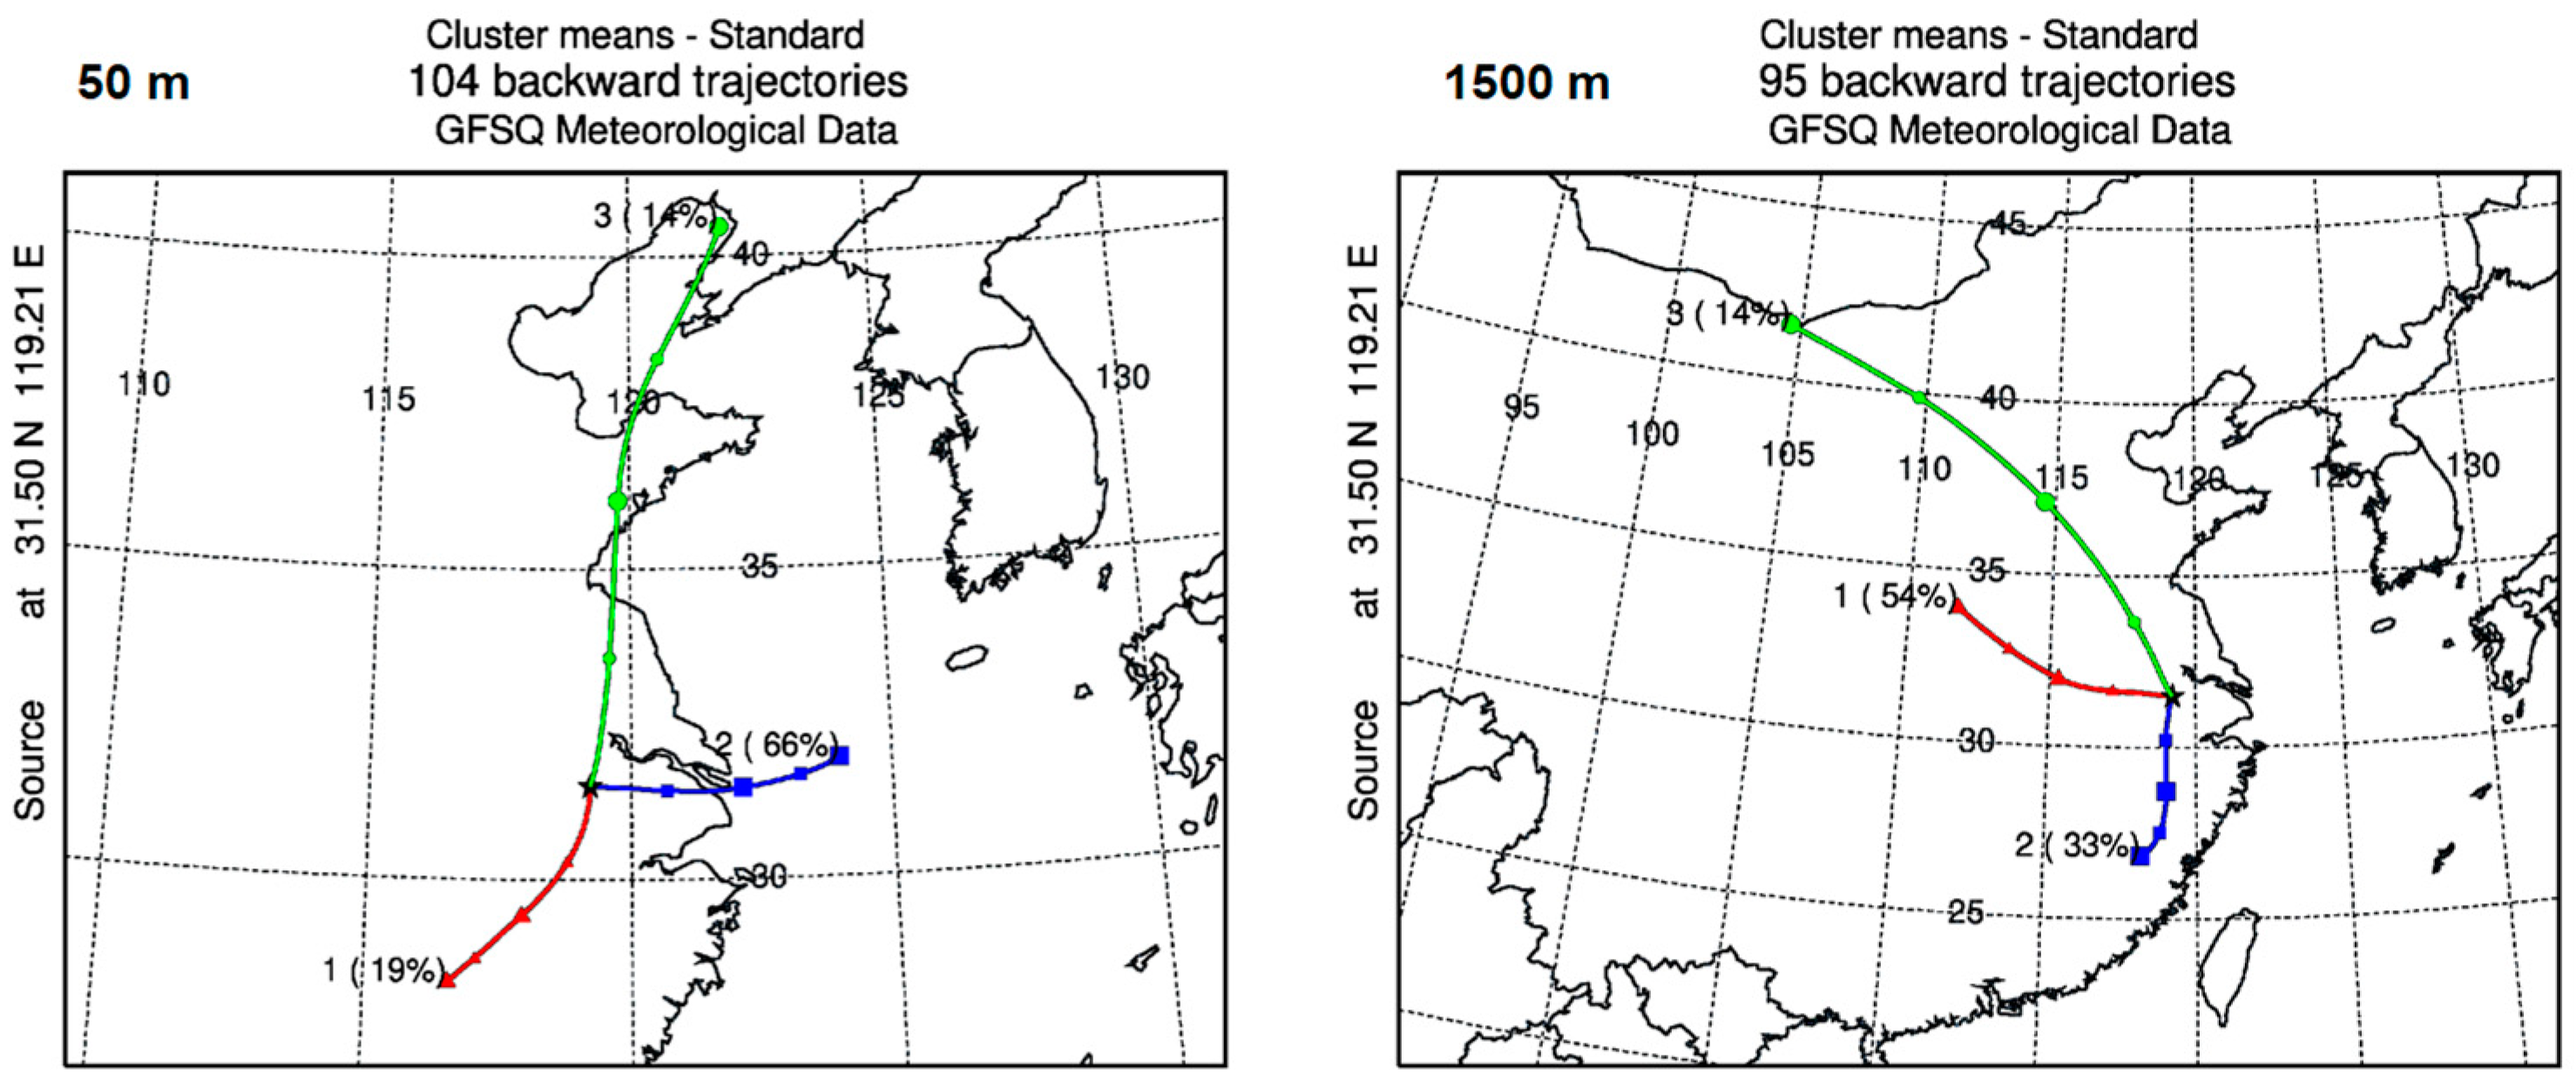
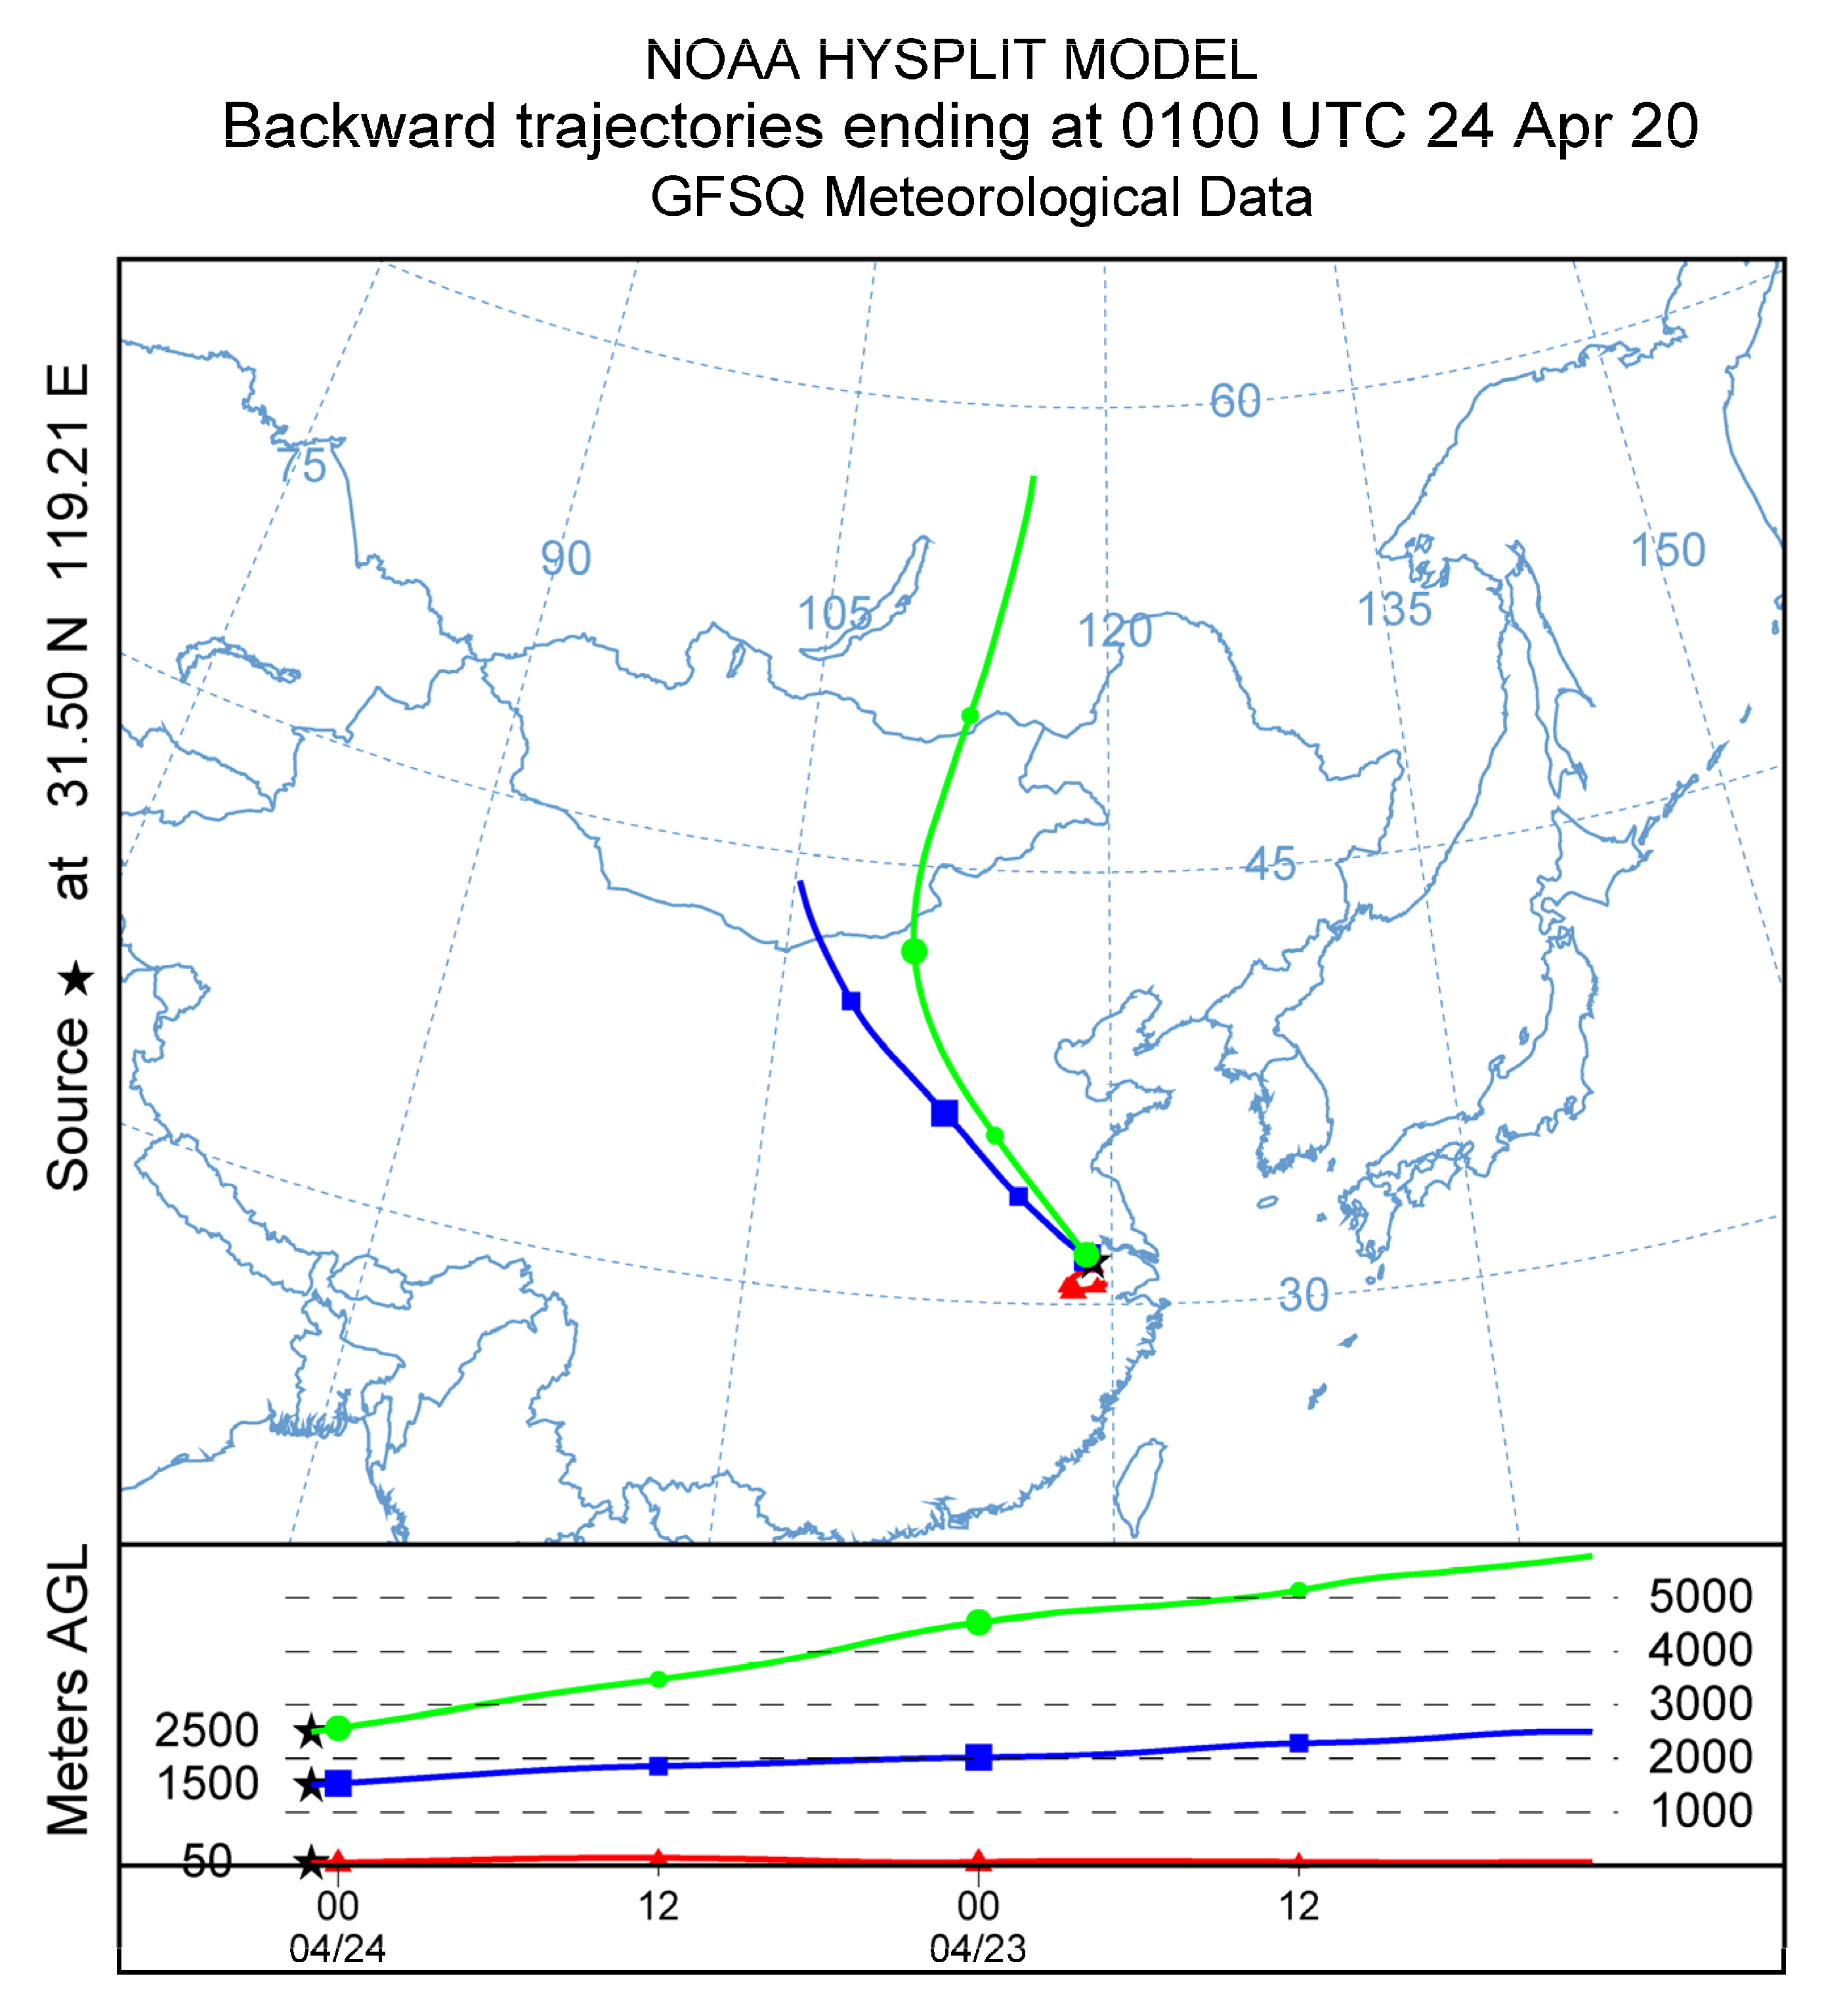
ERA5 involves 4D-Var data assimilation and model simulations from the European Centre for Medium-Range Weather Forecasts (ECMWF)’s Integrated Forecast System (IFS). As a comprehensive reanalysis, ERA5 assimilates multisource observations from both the upper air and near-surface areas. The parameters employed in this study include the instantaneous observations of u and v wind components 10 m above the surface, as well as the boundary layer height, temperature, and relative humidity. All of these parameters are on an hourly basis, and have a horizontal spatial resolution of 0.25 × 0.25° in the format of NetCDF. Other details can be found in [37].

2.4. HYSPLIT

The 48-h back-trajectories arriving at the Nanjing validation site were calculated every 6 h using the Hybrid Single-Particle Lagrangian Integrated Trajectory (HYSPLIT) model version 5.1.0 [38], which is widely used for research related to simulation of the particle transportation process. The meteorological data files imported into the model are from the NCEP/NCAR Reanalysis dataset [39].

2.5. Aerosol Typing Methods

In the present study, two aerosol classification methods were employed to classify AOP observations throughout the study period.
Method A classifies AOP observations with the combination of SSA and FMF. In order to better distinguish between anthropogenic aerosol particles with varying degrees of absorptivity without geolocation information, Lee et al. [19] proposed this method based on both SSA and FMF, accounting for the radiation absorptivity and size information of aerosols. According to this method, all AOP observations are first classified into three categories according to FMF (550 nm): AOP observations with FMF less than 0.4 are classified as coarse-mode aerosols, while those with FMF greater than 0.6 are classified as fine-mode aerosols; those with FMF between 0.4 and 0.6 are classified as “mixture”. The AOP observations in the fine- and coarse-mode groups are further classified into subcategories based on SSA (440 nm): the observations in the coarse-mode category with SSA less than 0.95 are defined as “dust”; otherwise, they are categorized as “undefined”. For the fine-mode category, those observations with SSA greater than 0.95 are classified as “non-absorbing (NA)” aerosols; otherwise, they are categorized as absorbing aerosols.
Exploiting the fact that the ratio between AOD and two different wavelengths (i.e., AROD) correlates well with aerosol chemical composition [40], Method B conducts aerosol typing based on the combination of AOD and AROD [41]. Basic aerosol types of maritime, continental, desert dust (DD), urban industry (UI), and biomass burning (BB) are included in the results of this method. The definitions of each aerosol type can be found in the work of Dubovik et al. [42] (Table A2). These results are also calculated with predefined thresholds, which are obtained from numerical simulations with Mie scattering and a multi-log-normal particle size distribution model [41]. The thresholds used for classification in this study are from the following references, and have been applied for aerosol classification over different parts of the world.
These two aerosol classification methods have been widely used, and multiple studies have proven that these two methods can classify the aerosols well [43,44]. According to the findings of Chen et al. [13], although the classification results seem rough compared to chemical composition analysis, the results from different threshold-based methods are generally consistent, and could reflect the dominant aerosol type in a certain region.

3. Results and Discussion

3.1. Temporal Variation in Aerosol Optical Properties

3.1.1. Hourly and Daily Variation

Meteorological conditions impose a large impact on the transportation of air masses and the hygroscopic growth of aerosol particles. Moreover, changes in emission sources and in atmospheric processes can lead to secondary aerosols. Thus, these conditions should be considered seriously, along with the AOPs [45,46,47,48]. Daily variation in relative humidity at 850 hPa (in %), temperature at 850 hPa (in °C), and boundary layer height (in meters) is shown in Figure 1. The main cause of missing data (gray are in panel c) was unfavorable weather (e.g., cloudy, rainy). Located near the center of the YRD region, the climate type of the Nanjing observation site is subtropical monsoon.
In order to investigate the basic characteristics of AOP temporal variation, hourly and monthly variation analyses were conducted in the present study, the results of which can be seen in Figure 2. AOD at 440 nm was selected in this study to indicate the aerosol extinction coefficient in this section. Green bars denote the fine-mode AOD, while the orange bars denote coarse-mode AOD. According to the AERONET algorithm, fine-mode aerosols are typically defined as particles with effective radii <0.992 μm, while coarse-mode effective radii are >0.992 μm [49,50]. The blue curved line, centered around the blue translucent band, denotes the FMF of the corresponding wavelength, defined as the ratio between fine-mode AOD and total AOD at a wavelength of 440 nm. Monthly peak FMF was reached in August (0.92 ± 0.10). Relatively low FMF can be seen in spring and autumn (e.g., October and May), both of which had relatively high loadings of coarse-mode AOD (around 0.1 in March and May, and around 0.07 in November), owing to long-range desert dust transportation [21].
Monthly variation analyses revealed that high fine-mode aerosol loading appeared from June to August (~0.7). Low aerosol loading (~0.30–0.58), however, was observed in the winter. One of the factors contributing to high AOD (fine) in summer may be attributed to hygroscopic growth in the YRD under the condition of high RH, as can be seen in Figure 1a [32]. Another possible factor could be the effect of resuspension promoted by the drier soil and a decrease in secondary nitrates [51]. A moderate level of aerosol loading (~0.35–0.70) appeared in spring and autumn.
Diurnal variation in AOD is of importance to quantitative remote sensing, atmospheric correction, and emission source apportionment [52]. In addition to the seasonal AOP variation, notable characteristics could also be found from hourly analyses. It is worth noting that the available time range was 6 a.m.–5 p.m. (local time), because of missing data at night. The diurnal variation in AOD here was much stronger (between 0.3 and 0.7) than observations from some other regions [53]. During the daytime, FMF (440 nm) exhibited a bimodal pattern, with peaks reached around 10 a.m. and 2 p.m. (local time) at the level of 0.91 ± 0.15 and 0.90 ± 0.10, respectively. When focusing on the two modes of aerosols separately, a similar symmetrical hourly trend can be seen, in that the averaged fine-mode AOD (440 nm) first decreases from 6 a.m. (~0.64 ± 0.34) to 12 p.m. (~0.32 ± 0.12), and then gradually increases in the afternoon, to a peak of ~0.67 ± 0.41 at 5 p.m. This interesting phenomenon of AOD being high in the morning and at dusk, and low around noon (i.e., 12–2 p.m.) was also observed in previous studies conducted in China [54,55]. This same pattern was also observed in some studies focusing on near-surface aerosol optical properties [56,57,58]. This result is determined by both meteorological conditions and local emissions. For one thing, diurnal variation in AOD is influenced by many boundary layer dynamics [59]. In the morning (before 8 a.m.) and afternoon (after 3 p.m.), the relatively lower boundary layer leads to a stable atmosphere structure, impeding the vertical mixing and dispersion process of aerosols in other directions (including horizontal transport of aerosols), which is conducive to the accumulation of aerosols. In addition, relatively low wind speed and high RH in the early morning after sunrise may also give rise to the formation of haze events, increasing AOD levels [52]. Local emissions from vehicles during rush hour in the morning are another important contributor to absorbing aerosols.

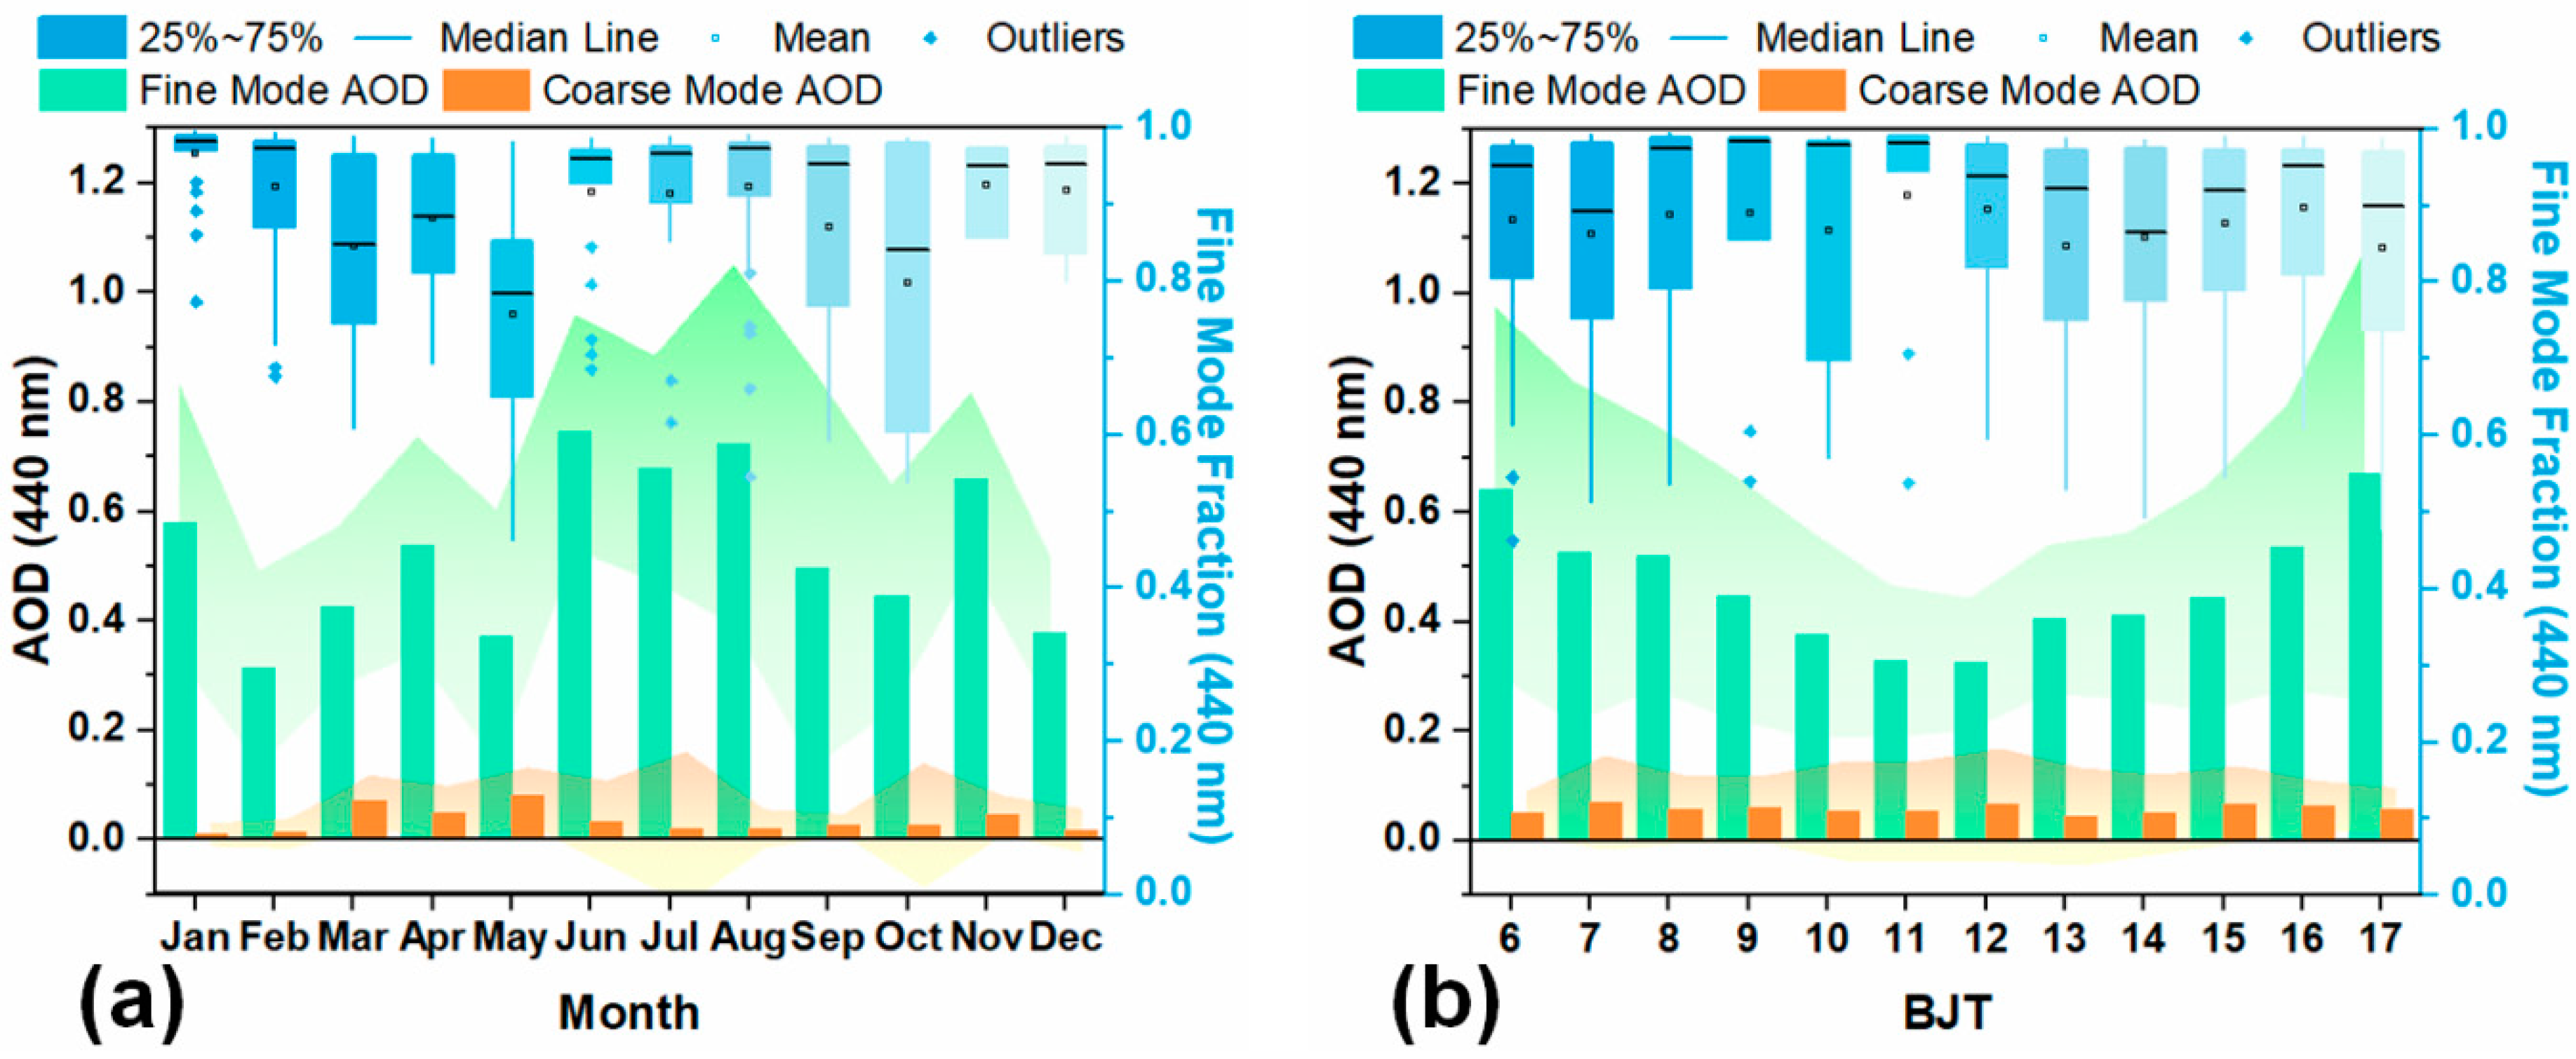
3.1.2. Monthly Variation

The monthly variations in VSD are shown in Figure 3. The monthly values were obtained by averaging all of the real-time observations in one month. From Figure 3, we can see that throughout the year, except for October and May, fine-mode aerosols are the dominant type of total columnar aerosol particles. The bi-mode, however, is more frequent in spring and autumn, with higher loadings of coarse-mode aerosols—possibly due to the impact of sandstorms originating from Northwest China [60]. Monomodal distribution patterns can be vividly observed during the DJF and JJA periods. An interesting phenomenon is that during the summertime, the volume concentration of particles with a moderate radius (~0.4–0.9 μm) is higher (>0.05 μm3·μm−2) than in other periods. Meanwhile, from Table A1, we can also see that fine-mode effective radii in JJA were larger (~0.20 ± 0.03 μm) than in observations from other periods, indicating the long-range transport of coarse particles or the possible growth of aerosol particles. The most probable reason for this phenomenon is hygroscopic growth of the fine-mode water-soluble aerosol particles, especially under humid conditions [61,62].

3.2. Wavelength Dependence
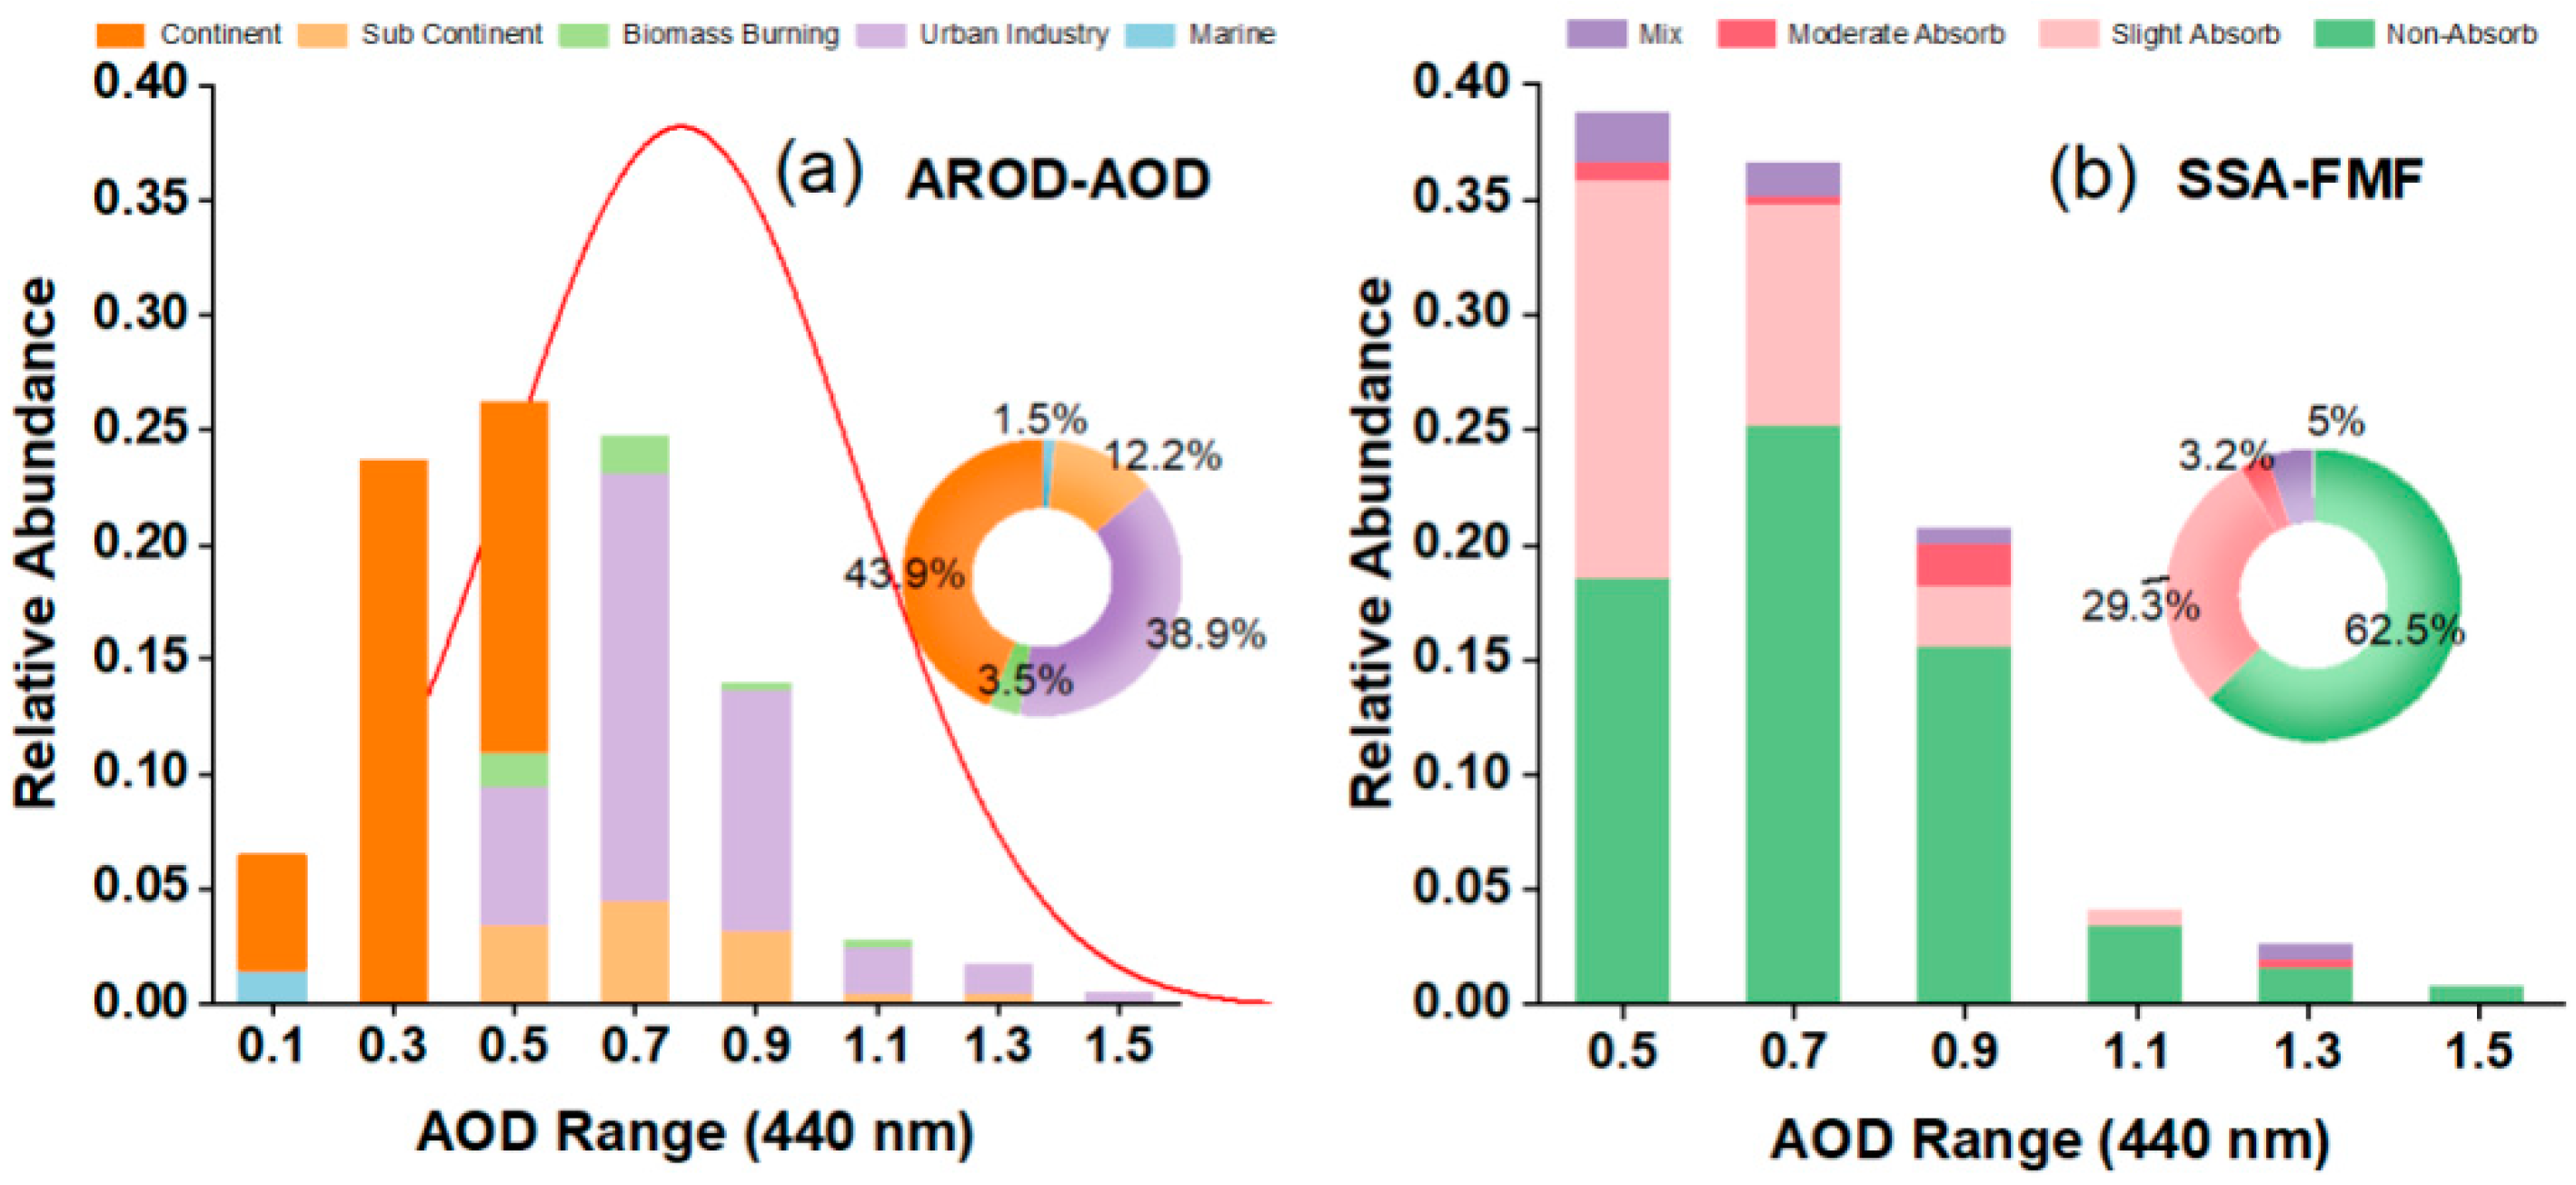
The chemical composition, mixing state, and size and shape of the aerosol particles have a large impact on the optical properties of aerosols, one of which is the wavelength dependence of different particles [40,63]. In order to further investigate the light-scattering/absorption properties of aerosols during the study period, we mainly selected the absorptivity-related properties, including the multiband AOD, AAOD, and SSA of fine/coarse-mode particles.
SSA is defined as the ratio of the scattering coefficient and extinction coefficient. Serving as an important parameter of radiative effect estimation [64], the spectral variation in SSA is widely used for climate-related research. A narrow range of SSA (440 nm) was found throughout the year, with the average SSA (440 nm) ranging from 0.90 to 0.96. A high SSA is consistent with previous research [32], and it is significantly higher than the values observed over the North China Plain [65]. The lowest average SSA was observed in May (around 0.89). However, the next month (June) saw a sharp increase in SSA 440 (0.955), which could be attributed to the hygroscopic growth of water-soluble aerosol particles [66].
As pointed out by Dubovik et al. [10,42], SSA is determined by two factors—particle size and composition. A relatively sharp decrease in SSA with wavelength was found in the winter months of DJF and the summer months of JA, which could be a result of the presence of biomass burning and urban industry aerosols [10]. The steepest decrease in wavelengths occurred in February. The spectral SSA in October was different from that in other months; a high absorption capacity in the blue band and much lower absorption capacity at longer wavelengths were observed. The spectral variation pattern is typical of mineral dust aerosols, showing low SSA at shorter wavelengths due to the high absorption of iron oxides [65,67]. The monthly fine-mode SSA was high for all months except May, with the average (black dot) value at 440 nm exceeding 0.94, indicating the high scattering and low absorptive ability during these months. The relatively low value of fine-mode SSA in May was mainly caused by desert dust aerosols. As for the wavelength dependence of the fine-mode SSA, a negative correlation was found between SSA and wavelength for all months, and the steepest slope appeared in May.
For the variation in coarse-mode SSA, a positive correlation was found between the SSA and wavelength, with the SSA at 440 nm being the lowest in each month. The spectral slope of each month was relatively similar, indicating a relatively stable aerosol type composition during the study period [11]. Relatively high coarse-mode SSA was found in June and December, with the average SSA at 440 nm exceeding 0.83. A lower SSA was found for the coarse-mode SSA compared with the fine-mode SSA, as can also be seen in Table A1, which can be explained by the absorbing nature of desert dust aerosols [14]. Furthermore, a larger difference in SSA values was found when the wavelength increased from 440 to 1020 nm for coarse-mode aerosols versus for fine-mode aerosols (~0.10 and −0.04 for coarse-mode and fine-mode aerosols, respectively). The spectral variation in fine/coarse-mode aerosol SSA in the present study differs considerably from the results observed in other regions, such as the Indo-Gangetic Plain (IGP) dominated by desert dust, which showed a strong correlation between SSA and wavelength [63] for both fine- and coarse-mode aerosols. In addition, our findings differ from those of research conducted at other YRD sites [32], in that decreasing SSA with wavelength was observed in each month except for October in the present site, as a result of high dust aerosol loadings.
Spectral variation in AOD is an important indicator of aerosol type and composition, and the ratio between AOD observations at two wavelengths can be used for aerosol type classification [40]. In Figure 4d, decreasing AOD with wavelength can be seen for each month; the sharpest decrease, which could be inferred from the slope of the gray lines between different wavelength boxes in Figure 4d, appears in June, July, and August (JJA). The steep slope of the multi-wavelength AOD in the summer months indicates the possible abundance of accumulation-mode aerosols [63]. To clearly probe aerosol size information, the monthly AE between 440 and 870 nm was calculated in this study based on simultaneous observations of multiband AOD at the two corresponding wavelengths. Previous studies have highlighted that AE could serve as a good indicator of the ratio between the loadings of accumulation-mode aerosols (radii < 1 μm) and coarse-mode aerosols (radii > 1 μm). In addition to JJA, high AE values were also observed in the winter months (DJF), with averaged AE (440/870) exceeding 1.40. The sharp intermonth variation in AE is closely connected with the change in aerosol composition as well as size spectra [63], as shown in Figure 4d. The highest AE in winter months (DJF) could be well explained by the lowest concentration of coarse-mode particles (~0.01 μm3/μm2 in January) and a high concentration of accumulation-mode aerosols (~0.09 μm3/μm2 in January). Furthermore, the relatively flat slope between AOD and wavelength could thus be explained by high fine- and coarse-mode aerosol loadings in both SON and MAM, which could be explained by the long-range transport of desert dust and locally generated pollution [50,60].
As an important indicator of the contribution of absorption aerosols to total AOD, spectral AAOD can be obtained from the equation of AAOD ( λ ) = k · λ AAE , where k denotes absorption aerosol loading and AAE is the absorption Ångström exponent. The monthly variation in absorptive aerosol optical depth (AAOD) shows that the AOP reaches peaks in spring (May) and autumn (October), with the average AAOD (440 nm) reaching 0.04 and 0.035, respectively. The relatively high AAOD in these two months indicates the increased abundance of aerosols with high absorptivity, including desert dust and black carbon, the latter of which is produced by biomass burning commonly seen during harvest season in China [68]. The relatively low magnitude of AAOD in the winter months (DJF, <0.02 for AAOD 440 nm) is notable, which is consistent with the findings of previous research in the YRD region [32]. Seasonal patterns of higher AAOD in spring and fall, as found by Che et al. [32], were also found in the present study. However, the AAOD here (0.018–0.04) was obviously lower than the AAOD over sites near the city of Hangzhou, as well as over the North China Plain [65], at 440 nm. This may be connected to the weaker absorptivity of aerosols over the Nanjing validation site, located far away from industries and the population.
As for the wavelength dependence of AAOD in each month, we can find a steeper decrease in AAOD with increasing wavelength in the summer months (JJA), along with a moderate decrease in the winter months (DJF) (Figure 4e). This can also be seen in the monthly variation in the Absorption Ångström Exponent (AAE). In the present study, AAE was calculated using two wavelength pairs, i.e., 440/870 and 440/1020 nm. The AAE calculated from wavelengths of 440 and 870 nm showed seasonal variation throughout the whole year. According to Figure 4e, relatively low AAE (440/870) can be observed in spring, increasing in summer and winter, with the lowest AAE (440/870) reached in May (~0.95 ± 0.18) and the highest in January (~1.12 ± 0.06) Throughout the year, the absorption Ångström exponents from both wavelength pairs were all close to unity (ranging between 0.95 and 1.12), indicating the possible dominance of urban/industrial aerosols over the study region [69]. According to Russell et al. [69], Giles et al. [70], and Dumka et al. [63], higher AAE values could be explained by a possible increase in the fractions of biomass burning and desert dust aerosols, which have a much higher AAE than the urban/industrial aerosols. The aerosol typing analysis is further discussed in the next section. Another interesting phenomenon in Figure 4e is the slight monthly variation between the AAEs calculated from the 440/870 pair and from the 440/1020 pair,—especially in the months of MAM (spring) and SON (winter). Higher AAE (440/1020) in spring and fall versus that from the 440/870 wavelength pair is owed to the possible presence of desert dust, as was also found in the Bahrain region in the research of Russell et al. [69].

3.3. Aerosol Typing

Comparison of Results from Two Aerosol Typing Methods

Aerosol classification analysis can be applied to the AOP observations to facilitate characterization of aerosols, as well as the apportionment of potential sources of aerosols [13,40]. Based on the parameters analyzed above, two threshold methods, using AOD-AROT and SSA-FMF parameter pairs, respectively, were employed to classify all of the observations throughout the study period. As mentioned above, observations with AOD (440 nm) of less than 0.4 were screened out for quality assurance. The classification results at different aerosol loadings can be seen in Figure 5. The reason for using both classification methods in the current study instead of a single method was that the two methods classify aerosols into different systems, with the AOD–AROT classifying aerosols into types related to the type of the dominant aerosol particles, while the other method classifies them into types related to the level of absorptivity (i.e., non-/moderately/slightly absorbing), thus more comprehensively characterizing the aerosols in the study region.
Results obtained from both methods show general consistency. The aerosol type classification throughout the study period, based on the count distribution of AOD at 440, is shown in Figure 5a,b. Throughout the study period, the dominant aerosol types were continental (43.9%), UI (38.9%), and subcontinental (12.2%), according to the AOD–AROT relationship method. Compared with continental aerosols, the subcontinental aerosols suffer more impacts from anthropogenic and natural emissions based on continental aerosols [41]. The high fraction of UI aerosols, which have non-absorbing properties, is mainly caused by emissions from local industry and anthropogenic sources in the YRD region [71,72]. The marine aerosol type only accounts for a slight proportion (around 1.50%) during a low-aerosol-loading period (when AOD 440 nm is between 0.1 and 0.3).
The dominant aerosol type found by the SSA–FMF classification method was non-absorbing (NA) aerosols (accounting for 62.5% of all of the high-quality observations). This is consistent with the previous results for the low absorptivity of UI aerosols [42]. The dominance of the NA aerosols indicates the prevalence of particles that can scatter more light back into the air, such as those from vehicle exhausts [71] and household emissions [73]. This could well explain the dominance of close-to-unity AAE throughout the year, as observed in Figure 4. From Figure 5b, we can also see that the episodes with high aerosol loadings (AOD 440 nm larger than 0.9) are also dominated by the NA type aerosols, as can be demonstrated by the moderate-to-high SSA throughout the year (Figure 4d), and is consistent with the findings of Che et al. [32]. No highly absorbing aerosols were observed throughout the whole study period.

3.4. Relationship between Aerosol Properties and Meteorological Factors

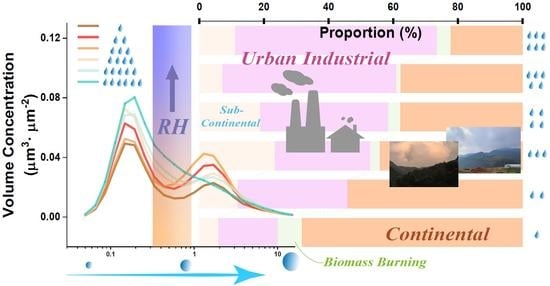
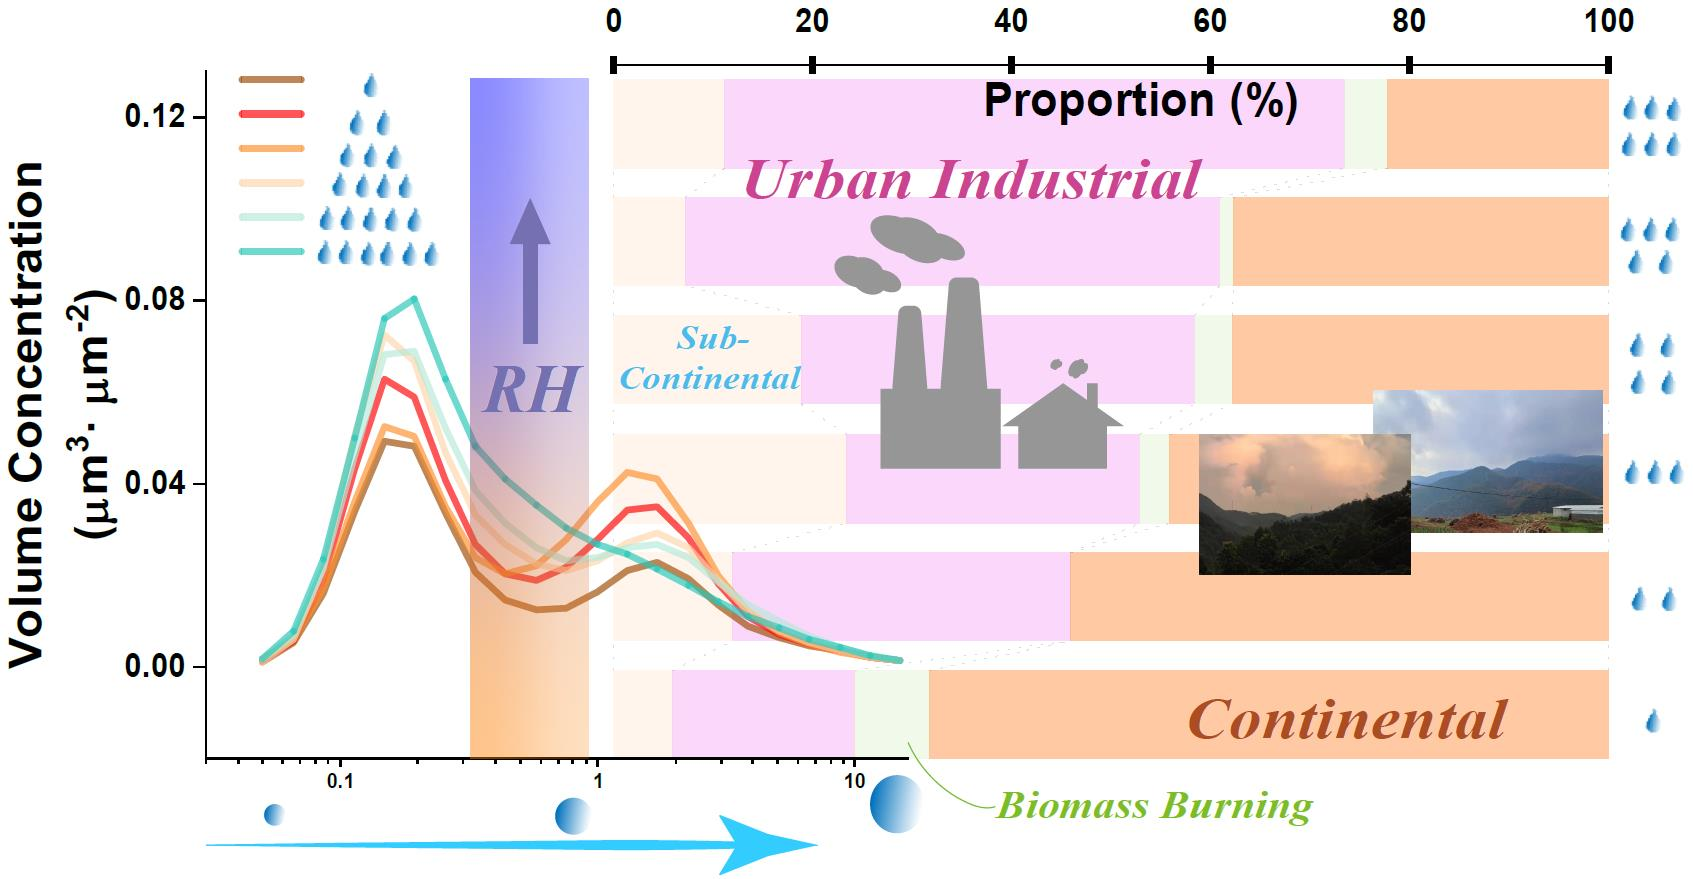
3.4.1. AOP under Different RH Levels

Meteorological factors, such as humidity, can have a large impact on the hygroscopic process of aerosols, thus affecting VSD and AOD [61,74]. Relative humidity (RH) was used to quantify the humidity in this study.
The process of hygroscopic growth could be examined by the variation in VSD with increasing RH, as can be vividly seen in Figure 6b. In order to study the variation more clearly, the number of RH levels here was enlarged to six groups: D (dry; RH < 15%), MD (moderately dry; RH between 15% and 25%), SD (slightly dry; RH between 25% and 35%), SH (slightly humid; RH between 35% and 50%), MH (moderately humid; RH between 50% and 60%), and H (humid; RH greater than 60%). The selection of thresholds above was mainly determined by the distribution of RH, in order to ensure that an adequate number of observations are available in each rank. A vivid volume increase with RH can be observed for some accumulation-mode aerosols with a large radius (between 0.335 and 0.992 μm; purple area in Figure 6b). The radius of water-soluble aerosols increases under high RH conditions, thus increasing the volume concentration. Furthermore, the obvious growth in this specific radius range may be closely related to the high volume fraction of water-soluble aerosols—especially for the urban industry and continental aerosols [61].

3.4.2. Aerosol Type Occurrence Frequency under Different RH Levels
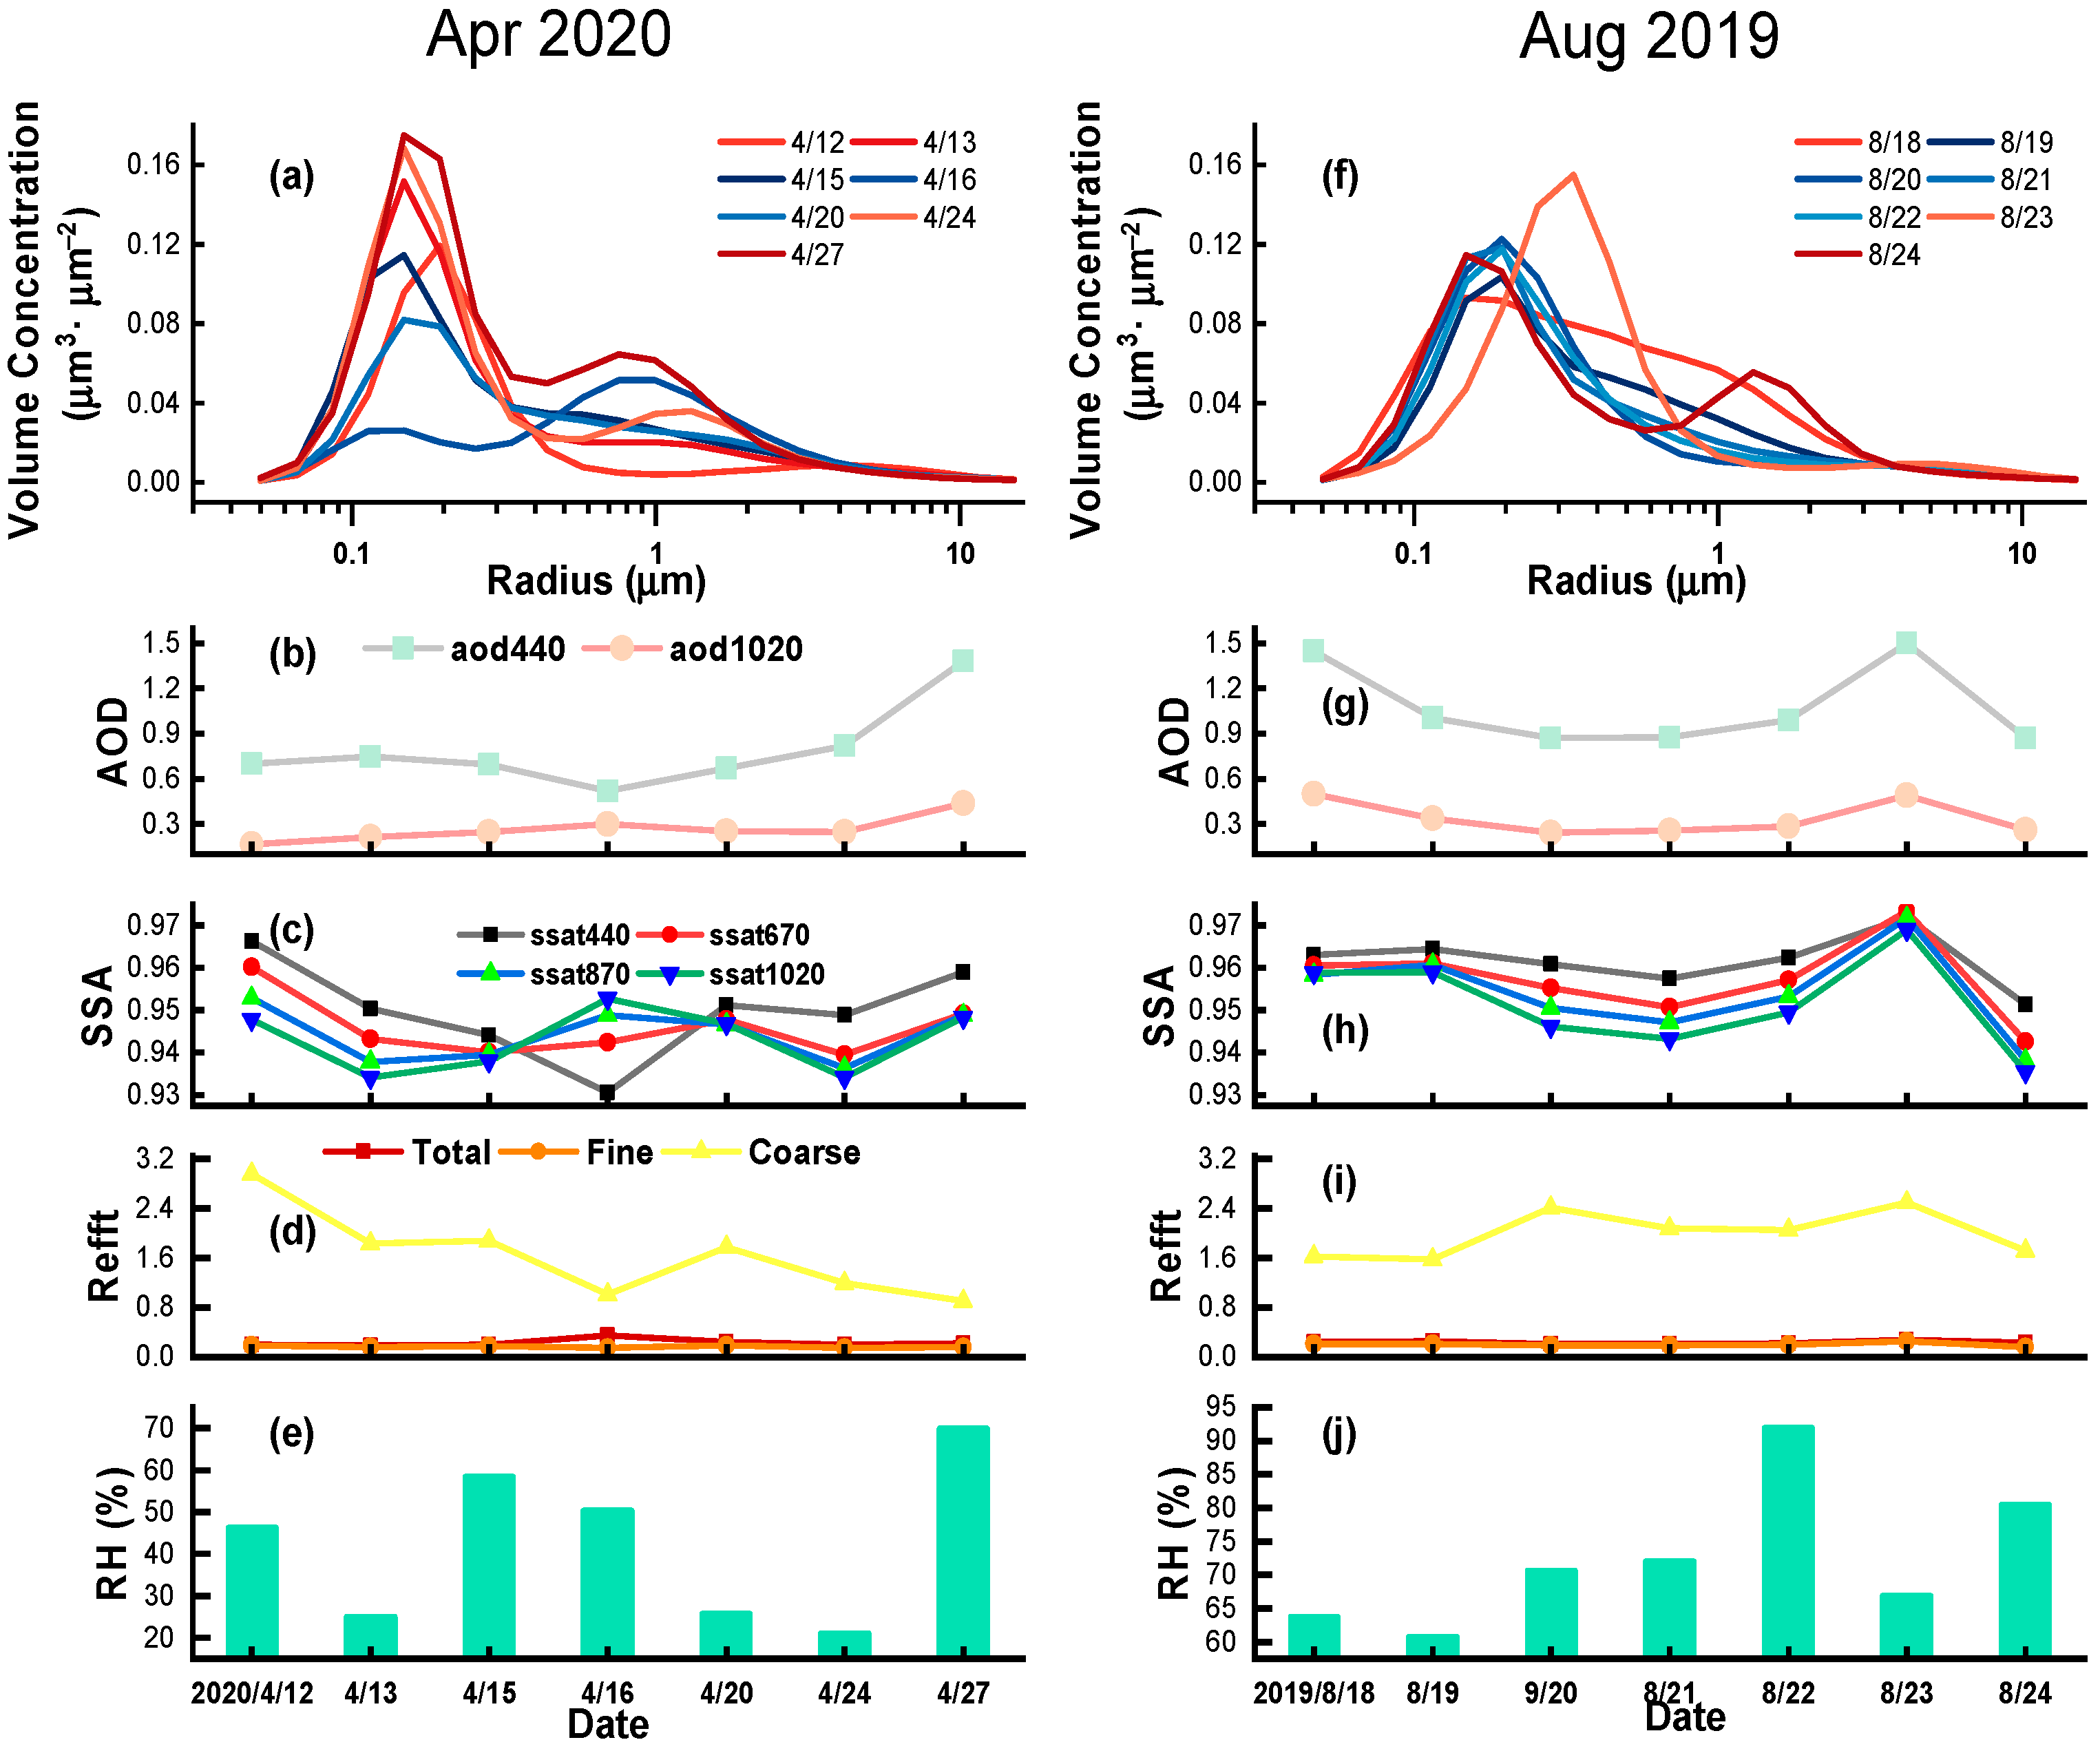
The relationship between RH and aerosol type was investigated, and the results are shown in Figure 6a, using the classification results from the AROD–AOD method. In this section, we also use the six RH levels defined in the previous section. As shown in Figure 6a, the proportion of continental aerosols decreased gradually from 68% at the D rank to ~22% at the H rank. This can be explained by the transport of aerosols from the continent, which occurs when it is relatively dry. Meanwhile, the urban industrial aerosols accounts for a growing proportion from ranks D (18%) to H (63%), becoming the dominant aerosol type. The results indicate increasing scattering efficiency of aerosols with RH, which could be explained by the enhancement of the hygroscopic growth of water-soluble aerosols, which have greater light-scattering properties [75]. Note that the aerosol type “marine” was excluded from analysis here due to insufficient sample volume.

3.5. Case Study

For further understanding of the underlying determining factors behind the variation in aerosol compositions at different times and under different meteorological conditions (i.e., RH conditions), several short-term episodes were selected to learn more about the transport and vertical distribution of columnar aerosols. Two episodes with high aerosol loadings and distinct meteorological conditions were selected in the current study.

3.5.1. Episode 1: 12–27 April 2020

The first period was from 12–27 April 2020, which witnessed a heavy pollution episode with a high concentration of fine-mode aerosols. Extremely high loading of fine-mode aerosol concentration, which reached as high as 0.17 (μm3·μm−2), could be observed on four days (12, 13, 24, and 27 April; plotted in orange and brown), as shown in Figure 7a. According to Figure 1c, the large concentration of accumulation-mode aerosols during this period was rare throughout the whole study period. To investigate the possible reason for this abnormal phenomenon, we carried out the daily back-trajectory analysis (runtime: 48 h) using HYSPLIT during the episode at two different levels (50 and 1500 m a.s.l). Cluster analysis was further applied on the daily trajectory results. According to the results of clustering analysis shown in Figure 8a,c, at the 50 m level, the majority of air masses arriving at the site originated from central Shanghai as well as northeastern Zhejiang Province (36%, Cluster 1), which are highly populated and developed in industry. The local emissions were from vehicles and household cooking, and were mainly composed of fine-mode particles. Furthermore, relatively high RH on 27 April (~70%) enhanced the hygroscopic growth of the aerosols. When comparing the results with the trajectory clusters of April 2019 (Figure A1), we can see that the dominant aerosol masses at the 50 m level were from the East China Sea (~66%), and that they may be the main reason for the abnormally high volume of accumulation-mode aerosols in April 2020. Another interesting phenomenon worth noting is the aerosol characteristics on 16 April, where the volume concentration of fine-mode aerosols is obviously lower than that of the coarse-mode aerosols, as can be seen in Figure 7a; in addition, positive correlation between wavelength and SSA can be seen (Figure 7c), and the ratio between AOD 1020 nm and AOD 440 nm is high (~0.5). Seventy-two-hour back-trajectory analysis reveals that this is closely related to the possible regional transportation of desert dust aerosols from Northwest China and Mongolia (Figure A2). As noted in Section 3.2 and [40,63], high AROT for 1020 nm (>0.5) and positive correlation between SSA and wavelength are typical features of dust aerosols.

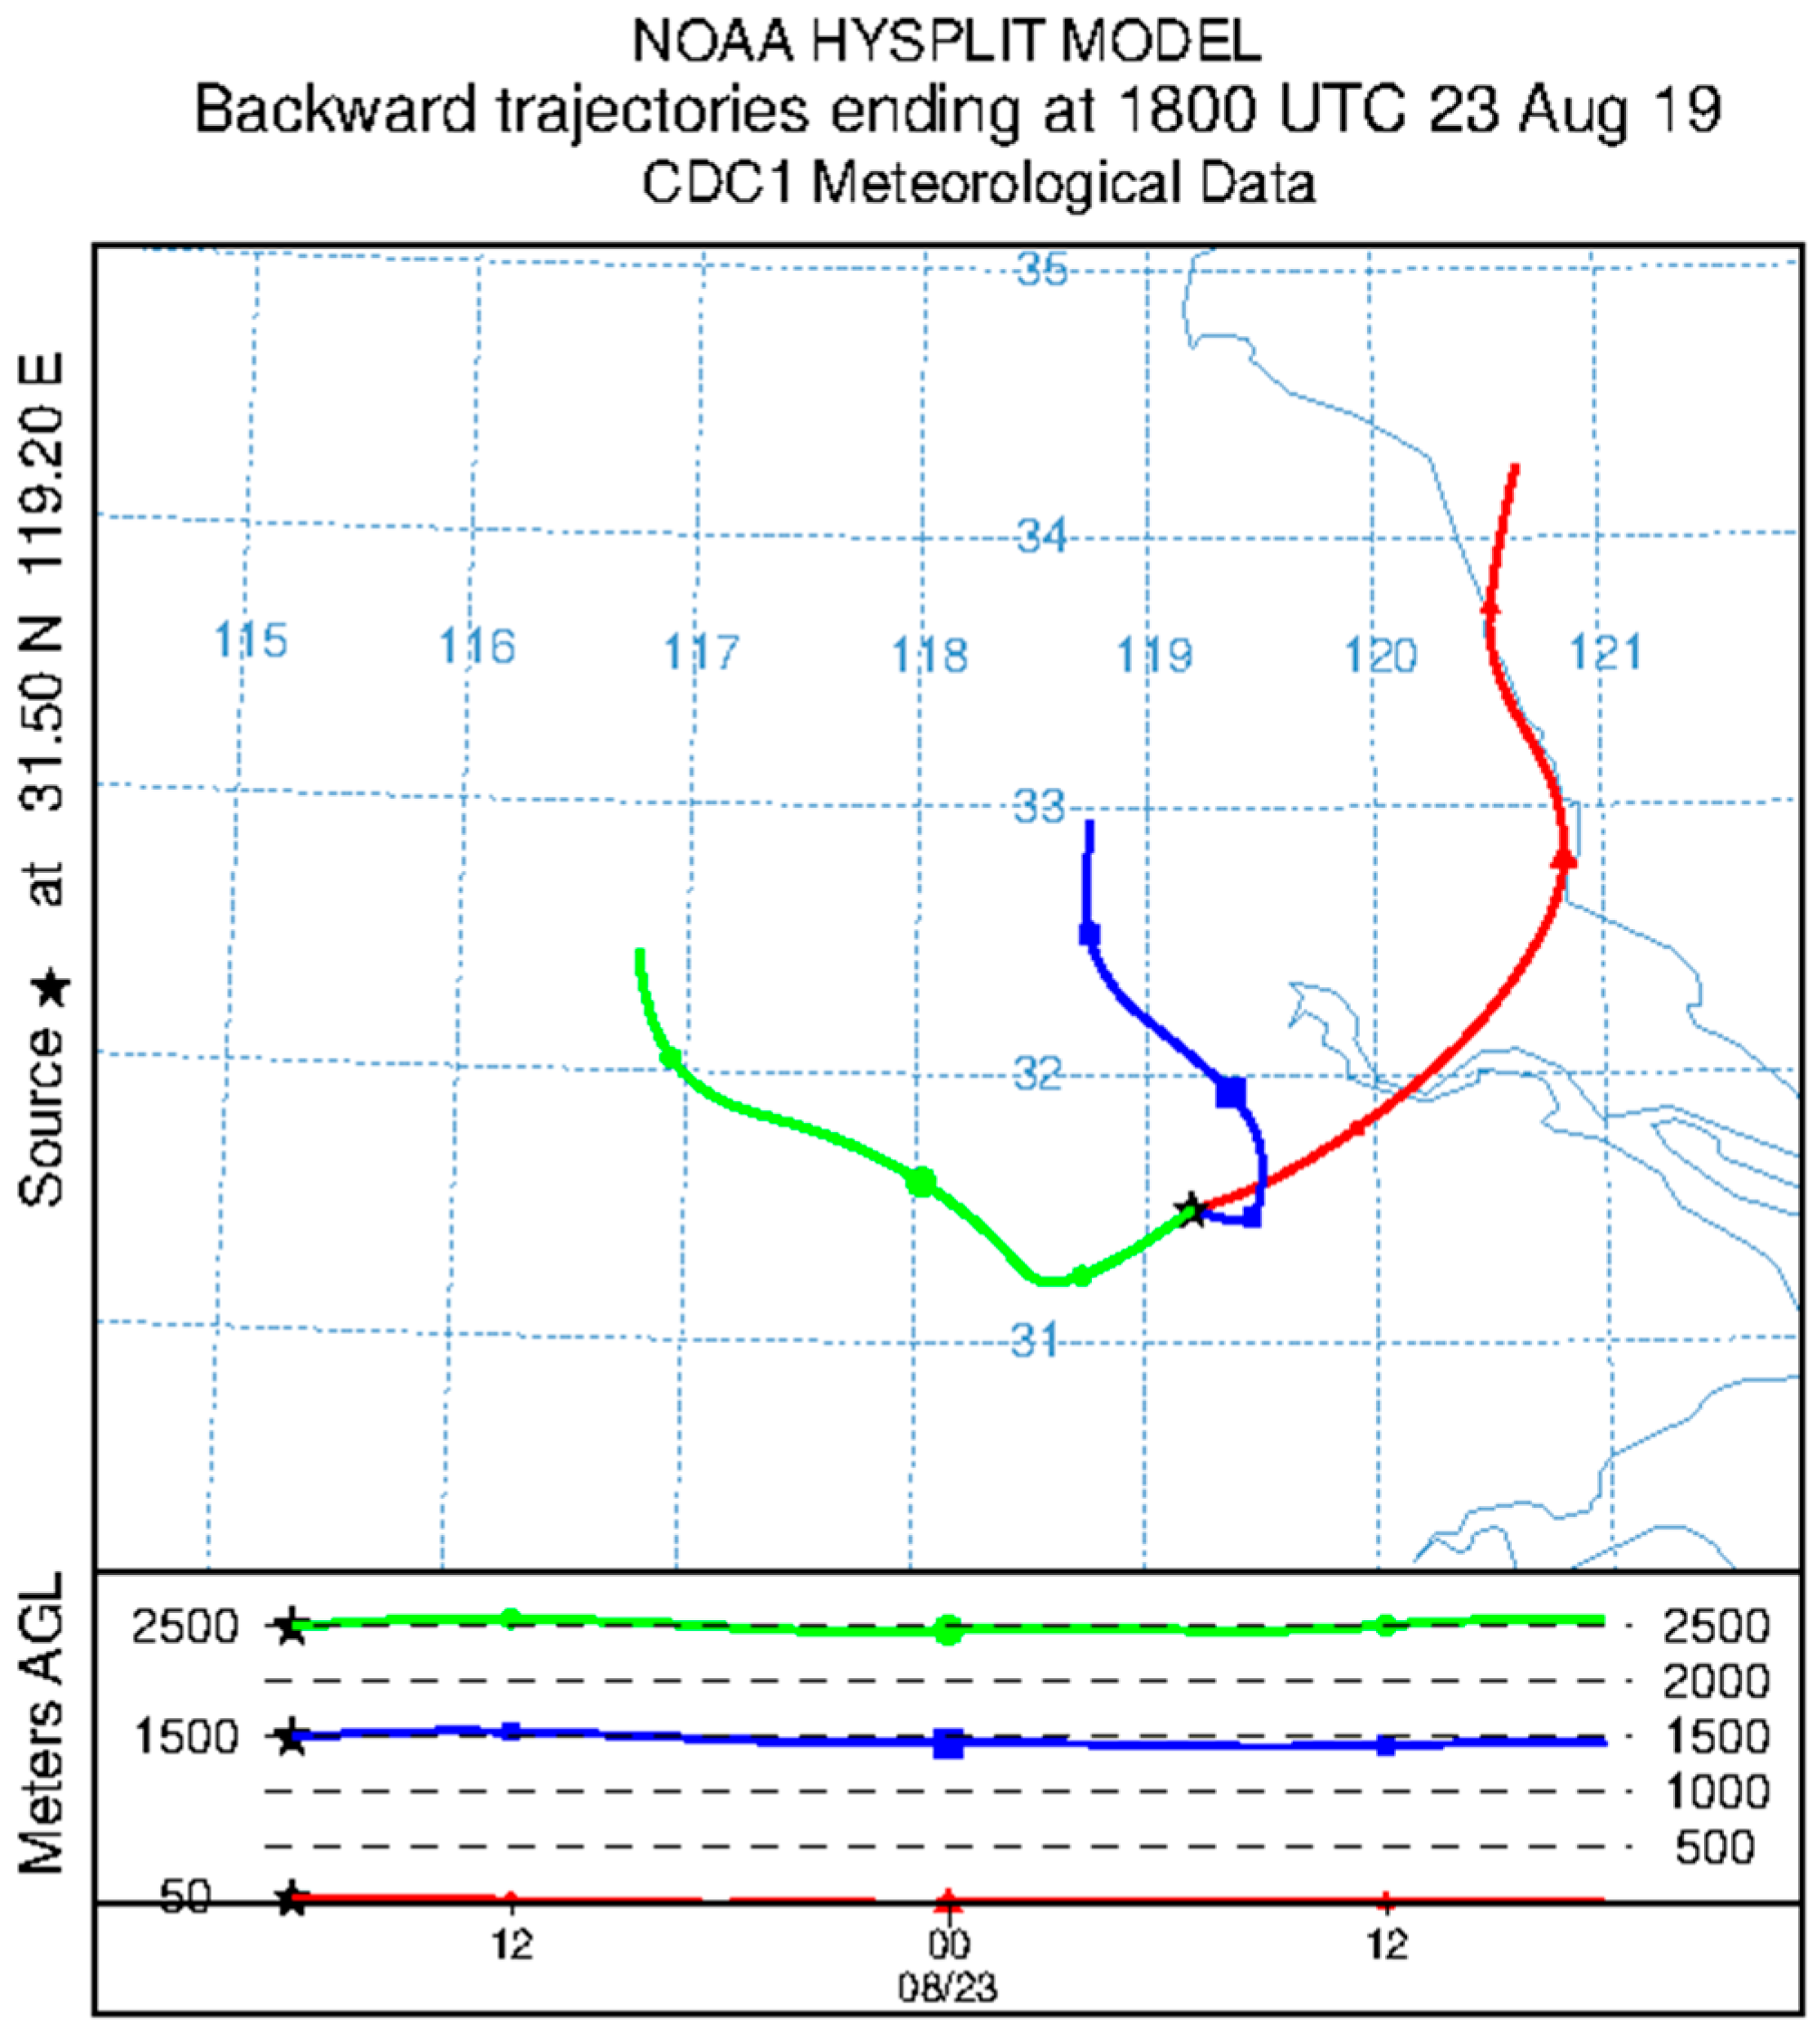
3.5.2. Episode 2: 18–24 August 2019

The episode from 18–24 August 2019 was selected due to high loadings of fine-mode aerosols in mid-August (Figure 1c), as well as the dominance of the “UI” aerosol type based on the previous section. According to Figure 8, during the study period, air masses arriving at the Nanjing validation site (119.21° E, 31.50° N) near the ground (50 m AGL) mainly included those originating from the East China Sea and Yellow Sea (accounting for ~86%), along with masses from Shanghai and northern Zhejiang Province (~14%). It is worth noting that a smaller wavelength dependence of SSA (narrower distribution) was found in the second period compared to the first one—especially on 23 August —according to Figure 7h. The possible reason for this is also the abundance of water-soluble aerosol particles, which have lower absorptivity, leading to flat variation in SSA with wavelength. It is also notable that the aerosol volume concentration on 23 August 2019 reached a peak, with AOD 440 nm reaching as much as 1.45. According to 36-h back-trajectory analysis (Figure A3), the cause of the sudden increase on 24 August 2019 was the transportation of air masses with high RH from the East China Sea, as well as coastal areas of Jiangsu, which is highly populated and is the source of anthropogenic aerosols.

4. Conclusions

By comprehensively studying the temporal variation, the wavelength dependence of AOPs, aerosol typing, and the relationships between AOPs and meteorological factors (i.e., RH), analysis was conducted based on the columnar AOP observations from a rural site near the center of the YRD during January 2019–July 2020, filling the gap of columnar AOP observations in the rural YRD. The following conclusions were reached:
(1) In terms of the temporal analysis, monthly variations in fine-/coarse-mode AOD and volume size distribution analysis show the pattern of the highest fine-mode AOD (440 nm) in summer (around 0.7) and relatively low AOD in winter and spring (around 0.3). For AOD variation during the daytime, an obvious symmetrical distribution pattern was observed, with the lowest fine-/coarse-mode AOD around 12 p.m. (local time), and the highest in the morning and afternoon, as a result of meteorological and anthropogenic factors;
(2) Strong wavelength dependence was observed for fine-/coarse-mode AOD, AAOD, and SSA, indicating the potential dominance of efficiently scattering fine-mode aerosols;
(3) Aerosol classification analysis reveals the dominance of the urban industry aerosol type (accounting for ~38.9% for the whole period), which exhibited low absorptivity throughout the study period. As for the seasonal variation in different aerosol types, aerosols appear to be efficiently scattering in summer, dominated by non-absorbing particles over the study area;
(4) Backward trajectory analysis of an episode in April 2020 reveals that the extremely high loading of fine-mode aerosols at the Nanjing validation site was mainly caused by local anthropogenic emissions from the YRD region (accounting for more than 36% at the 50 m level).
The present study provides aerosol optical property observations at a cropland (rural)-based site located near several megacities, including Nanjing. More AOP observation studies are needed in the future in order to obtain more comprehensive knowledge about aerosol optical properties in the countryside region, using remote sensors such as ground-based Lidar and remote sensing images.

Author Contributions

Conceptualization, Y.X. and X.G.; data curation, Y.S., W.S. and Q.H.; formal analysis, Y.X. and X.G.; funding acquisition, X.G.; investigation, Y.S.; methodology, Y.X. and T.C.; software, Y.S.; supervision, T.C.; visualization, W.S.; writing—original draft, Y.S.; writing—review and editing, W.S. and Q.H. All authors have read and agreed to the published version of the manuscript.

Funding

This work was funded in part by the National Natural Science Foundation of China under grant 42176176, in part by the Guangxi Innovative Development Grand Grant under grant GuikeAA18118038, and in part by the Land Observation Satellite Supporting Platform of the National Civil Space Infrastructure Project.

Institutional Review Board Statement

Not applicable.

Data Availability Statement

The ERA5 dataset are publicly available in Copernicus Climate Change Service (C3S) Climate Data Store at https://doi.org/10.24381/cds.bd0915c6 (accessed on 14 October 2021) [76,77]. The AOP observations presented in this study are available on request from the corresponding author.

Acknowledgments

We thank CCCES (Central China Comprehensive Experimental Sites) for the observation data used in this study. We are grateful to the NOAA Air Resources Laboratory (ARL) for the provision of the HYSPLIT transport and dispersion model [78]. We also thank the ECMWF for the ERA5 data used in the present study, which were downloaded from the Copernicus Climate Change Service (C3S) Climate Data Store. The results contain modified C3S information from 2021. Neither the European Commission nor the ECMWF are responsible for any use that may be made of the Copernicus information or the data it contains. We thank Feiyu Peng and Qiancheng Dai from the Nanjing University of Information Science and Technology for valuable suggestions on the arrangements of the figures and tables in this study. We also thank GISUNI [79] for providing the base maps used in this study.

Conflicts of Interest

The authors declare no conflict of interest.

Appendix A

Table A1. Monthly and seasonal variations in size- and light-absorptivity-related AOPs. Both mean values and standard deviations are given.
MonthSSAt440 1SSAf440 1SSAc440 1Refft 2 (µm)Refff 2 (µm)Reffc 2 (µm)AAOD440 3AAE440/870 4AE440/870 5
January0.97 ± 0.010.97 ± 0.010.82 ± 0.060.23 ± 0.040.19 ± 0.033.00 ± 1.280.02 ± 0.011.12 ± 0.061.45 ± 0.27
February0.94 ± 0.050.95 ± 0.030.80 ± 0.100.22 ± 0.060.15 ± 0.032.79 ± 1.170.02 ± 0.011.06 ± 0.231.48 ± 0.34
March0.95 ± 0.030.96 ± 0.020.84 ± 0.060.29 ± 0.090.16 ± 0.041.75 ± 0.610.03 ± 0.011.04 ± 0.101.13 ± 0.24
April0.94 ± 0.020.95 ± 0.020.83 ± 0.050.24 ± 0.050.16 ± 0.021.60 ± 0.440.03 ± 0.011.06 ± 0.081.24 ± 0.19
May0.90 ± 0.050.94 ± 0.030.79 ± 0.080.34 ± 0.150.14 ± 0.031.59 ± 0.410.04 ± 0.010.95 ± 0.181.05 ± 0.32
June0.95 ± 0.020.96 ± 0.010.84 ± 0.060.26 ± 0.040.20 ± 0.031.79 ± 0.540.04 ± 0.011.06 ± 0.051.14 ± 0.16
July0.95 ± 0.030.95 ± 0.020.81 ± 0.070.26 ± 0.060.20 ± 0.041.84 ± 0.550.04 ± 0.011.08 ± 0.101.29 ± 0.25
August0.96 ± 0.020.96 ± 0.010.83 ± 0.050.26 ± 0.090.19 ± 0.042.02 ± 0.470.03 ± 0.011.10 ± 0.101.37 ± 0.19
September0.94 ± 0.040.96 ± 0.030.82 ± 0.070.28 ± 0.100.17 ± 0.041.97 ± 0.410.03 ± 0.011.03 ± 0.121.25 ± 0.25
October0.93 ± 0.030.96 ± 0.020.81 ± 0.060.34 ± 0.150.17 ± 0.031.88 ± 0.900.04 ± 0.021.10 ± 0.111.04 ± 0.51
November0.95 ± 0.010.96 ± 0.000.84 ± 0.030.27 ± 0.020.20 ± 0.021.73 ± 0.480.03 ± 0.011.06 ± 0.031.09 ± 0.05
December0.96 ± 0.020.97 ± 0.020.86 ± 0.090.22 ± 0.060.16 ± 0.022.10 ± 1.000.02 ± 0.011.10 ± 0.081.40 ± 0.32
1 SSAt440, SSAf440, and SSAc440 denote single-scattering albedo (440 nm) for total, fine-mode, and coarse-mode aerosols, respectively. 2 Refft, Refff, and Reffc denote the effective radius for total, fine-mode, and coarse-mode aerosols, respectively. 3 AAOD440 denotes absorption aerosol optical depth (440 nm). 4 AAE440/870 denotes absorption Ångström exponent calculated by AAOD at 440 nm and 870 nm. 5 AE440/870 denotes Ångström exponent calculated by AOD at 440 nm and 870 nm.
Table A2. Definition of key aerosol types (reference: Dubovik et al., 2002 [42]).
Description
Biomass burningProduced by forest and grassland fires
Urban/industrialFrom fossil fuel combustion in populated industrial regions
ContinentalFrom the continent; mainly composed of fine particles (radii < 0.6 µm) [80]
SubcontinentalGreatly influenced by anthropogenic emissions or natural sources, which have abnormally high AOT440 [41]
MarineOriginating from the ocean
Desert DustBlown into the atmosphere by wind
Figure A1. The backward trajectory analysis of April 2019. The black star denotes the Shangxing validation Site.
Remotesensing 14 00406 g0a1
Figure A2. Backward trajectories arriving at the Shangxing validation site on 24 April 2019 at 50, 1500, and 3000 m levels, in red, blue, and green respectively.
Remotesensing 14 00406 g0a2
Figure A3. Same as Figure A2, but for 23 August 2019.
Remotesensing 14 00406 g0a3

References

  1. Michou, M.; Nabat, P.; Saint-Martin, D. Development and basic evaluation of a prognostic aerosol scheme (v1) in the CNRM Climate Model CNRM-CM6. Geosci. Model. Dev. 2015, 8, 501–531. [Google Scholar] [CrossRef] [Green Version]
  2. Mcnaughton, C.S. Constraining Climate Model Simulations of Aerosol Size Distributions over the North Pacific and North America Using in-situ Airborne Measurements; UMI, University of Hawai’I, Manoa. 2008. Available online: https://www.proquest.com/dissertations-theses/constraining-climate-model-simulations-aerosol/docview/304600533/se-2?accountid=28241 (accessed on 14 October 2021).
  3. Hsu, N.C.; Jeong, M.J.; Bettenhausen, C.; Sayer, A.M.; Tsay, S.C. Enhanced Deep Blue aerosol retrieval algorithm: The second generation. J. Geophys. Res. Atmos. 2013, 118, 9296–9315. [Google Scholar] [CrossRef]
  4. Li, M.; Shen, F.; Sun, X. 2019–2020 Australian bushfire air particulate pollution and impact on the South Pacific Ocean. Sci. Rep. 2021, 11, 12288. [Google Scholar] [CrossRef]
  5. Li, X.; Dong, Y.; Dong, Z.; Du, C.; Chen, C. Observed changes in aerosol physical and optical properties before and after precipitation events. Adv. Atmos. Sci. 2016, 33, 931–944. [Google Scholar] [CrossRef]
  6. Wang, J.; Virkkula, A.; Gao, Y.; Lee, S.; Shen, Y.; Chi, X.; Nie, W.; Liu, Q.; Xu, Z.; Huang, X.; et al. Observations of aerosol optical properties at a coastal site in Hong Kong, South China. Atmos. Chem. Phys. 2017, 17, 2653–2671. [Google Scholar] [CrossRef] [Green Version]
  7. Luoma, K.; Virkkula, A.; Aalto, P.; Petäjä, T.; Kulmala, M. Over a 10-year record of aerosol optical properties at SMEAR II. Atmos. Chem. Phys. 2019, 19, 11363–11382. [Google Scholar] [CrossRef] [Green Version]
  8. Viswanatha Vachaspati, C.; Reshma Begam, G.; Nazeer Ahammed, Y.; Raghavendra Kumar, K.; Reddy, R.R. Characterization of aerosol optical properties and model computed radiative forcing over a semi-arid region, Kadapa in India. Atmos. Res. 2018, 209, 36–49. [Google Scholar] [CrossRef]
  9. Tutsak, E.; Koçak, M. Optical and microphysical properties of the columnar Aerosol burden over the Eastern Mediterranean: Discrimination of Aerosol types. Atmos. Environ. 2020, 229, 117463. [Google Scholar] [CrossRef]
  10. Dubovik, O.; Sinyuk, A.; Lapyonok, T.; Holben, B.N.; Mishchenko, M.; Yang, P.; Eck, T.F.; Volten, H.; Muñoz, O.; Veihelmann, B.; et al. Application of spheroid models to account for aerosol particle nonsphericity in remote sensing of desert dust. J. Geophys. Res. Atmos. 2006, 111, D11208. [Google Scholar] [CrossRef] [Green Version]
  11. Dubovik, O.; King, M.D. A flexible inversion algorithm for retrieval of aerosol optical properties from Sun and sky radiance measurements. J. Geophys. Res. Atmos. 2000, 105, 20673–20696. [Google Scholar] [CrossRef] [Green Version]
  12. Schmeisser, L.; Backman, J.; Ogren, J.A.; Andrews, E.; Asmi, E.; Starkweather, S.; Uttal, T.; Fiebig, M.; Sharma, S.; Eleftheriadis, K.; et al. Seasonality of aerosol optical properties in the Arctic. Atmos. Chem. Phys. 2018, 18, 11599–11622. [Google Scholar] [CrossRef] [Green Version]
  13. Chen, Q.-X.; Shen, W.-X.; Yuan, Y.; Tan, H.-P. Verification of aerosol classification methods through satellite and ground-based measurements over Harbin, Northeast China. Atmos. Res. 2019, 216, 167–175. [Google Scholar] [CrossRef]
  14. Li, L.; Dubovik, O.; Derimian, Y.; Schuster, G.L.; Lapyonok, T.; Litvinov, P.; Ducos, F.; Fuertes, D.; Chen, C.; Li, Z.; et al. Retrieval of aerosol components directly from satellite and ground-based measurements. Atmos. Chem. Phys. 2019, 19, 13409–13443. [Google Scholar] [CrossRef] [Green Version]
  15. Choi, Y.; Ghim, Y.S.; Holben, B.N. Identification of columnar aerosol types under high aerosol optical depth conditions for a single AERONET site in Korea. J. Geophys. Res. Atmos. 2016, 121, 1264–1277. [Google Scholar] [CrossRef] [Green Version]
  16. Hamill, P.; Giordano, M.; Ward, C.; Giles, D.; Holben, B. An AERONET-based aerosol classification using the Mahalanobis distance. Atmos. Environ. 2016, 140, 213–233. [Google Scholar] [CrossRef]
  17. Choi, Y.; Ghim, Y.S. Variations in major aerosol components from long-term measurement of columnar aerosol optical properties at a SKYNET site downwind of Seoul, Korea. Atmos. Environ. 2021, 245, 117991. [Google Scholar] [CrossRef]
  18. Kalapureddy, M.C.R.; Kaskaoutis, D.G.; Ernest Raj, P.; Devara, P.C.S.; Kambezidis, H.D.; Kosmopoulos, P.G.; Nastos, P.T. Identification of aerosol type over the Arabian Sea in the premonsoon season during the Integrated Campaign for Aerosols, Gases and Radiation Budget (ICARB). J. Geophys. Res. Atmos. 2009, 114, D17203. [Google Scholar] [CrossRef] [Green Version]
  19. Lee, J.; Kim, J.; Song, C.H.; Kim, S.B.; Chun, Y.; Sohn, B.J.; Holben, B.N. Characteristics of aerosol types from AERONET sunphotometer measurements. Atmos. Environ. 2010, 44, 3110–3117. [Google Scholar] [CrossRef]
  20. Su, X.; Cao, J.; Li, Z.; Li, K.; Xu, H.; Liu, S.; Fan, X. Multi-Year Analyses of Columnar Aerosol Optical and Microphysical Properties in Xi’an, a Megacity in Northwestern China. Remote Sens. 2018, 10, 1169. [Google Scholar] [CrossRef] [Green Version]
  21. Sun, T.; Che, H.; Qi, B.; Wang, Y.; Dong, Y.; Xia, X.; Wang, H.; Gui, K.; Zheng, Y.; Zhao, H.; et al. Aerosol optical characteristics and their vertical distributions under enhanced haze pollution events: Effect of the regional transport of different aerosol types over eastern China. Atmos. Chem. Phys. 2018, 18, 2949–2971. [Google Scholar] [CrossRef] [Green Version]
  22. Kang, N.; Kumar, K.R.; Hu, K.; Yu, X.; Yin, Y. Long-term (2002–2014) evolution and trend in Collection 5.1 Level-2 aerosol products derived from the MODIS and MISR sensors over the Chinese Yangtze River Delta. Atmos. Res. 2016, 181, 29–43. [Google Scholar] [CrossRef]
  23. Li, M.; Wang, T.; Xie, M.; Li, S.; Zhuang, B.; Chen, P.; Huang, X.; Han, Y. Agricultural Fire Impacts on Ozone Photochemistry Over the Yangtze River Delta Region, East China. J. Geophys. Res. Atmos. 2018, 123, 6605–6623. [Google Scholar] [CrossRef]
  24. Yang, Y.; Xu, X.; Zhang, Y.; Zheng, S.; Wang, L.; Liu, D.; Gustave, W.; Jiang, L.; Hua, Y.; Du, S.; et al. Seasonal size distribution and mixing state of black carbon aerosols in a polluted urban environment of the Yangtze River Delta region, China. Sci. Total Environ. 2019, 654, 300–310. [Google Scholar] [CrossRef]
  25. Yu, X.; Ma, J.; Raghavendra Kumar, K.; Zhu, B.; An, J.; He, J.; Li, M. Measurement and analysis of surface aerosol optical properties over urban Nanjing in the Chinese Yangtze River Delta. Sci. Total Environ. 2016, 542, 277–291. [Google Scholar] [CrossRef]
  26. Shen, Y.; Virkkula, A.; Ding, A.; Wang, J.; Chi, X.; Nie, W.; Qi, X.; Huang, X.; Liu, Q.; Zheng, L.; et al. Aerosol optical properties at SORPES in Nanjing, east China. Atmos. Chem. Phys. 2018, 18, 5265–5292. [Google Scholar] [CrossRef] [Green Version]
  27. Reddy, K.R.O.; Zhang, X.; Bi, L. Seasonal aerosol variations over a coastal city, Zhoushan, China from CALIPSO observations. Atmos. Res. 2019, 218, 117–128. [Google Scholar] [CrossRef]
  28. Shen, J.; Cao, N. Comprehensive observation and analysis of aerosol optical properties and vertical distribution in Nanjing, China. Atmos. Environ. 2020, 239, 117767. [Google Scholar] [CrossRef]
  29. Xiao, S.; Yu, X.; Zhu, B.; Kumar, K.R.; Li, M.; Li, L. Characterization and source apportionment of black carbon aerosol in the Nanjing Jiangbei New Area based on two years of measurements from Aethalometer. J. Aerosol. Sci. 2020, 139, 105461. [Google Scholar] [CrossRef]
  30. Wang, H.L.; Qiao, L.P.; Lou, S.R.; Zhou, M.; Ding, A.J.; Huang, H.Y.; Chen, J.M.; Wang, Q.; Tao, S.K.; Chen, C.H.; et al. Chemical composition of PM2.5 and meteorological impact among three years in urban Shanghai, China. J. Clean. Prod. 2016, 112, 1302–1311. [Google Scholar] [CrossRef]
  31. Notice on Printing and Distributing the Action Plan for Comprehensive Treatment of Air Pollution in Autumn and Winter 2019–2020 in the Yangtze River Delta. Available online: https://www.mee.gov.cn/xxgk2018/xxgk/xxgk03/201911/t20191112_741901.html (accessed on 9 October 2021).
  32. Che, H.; Qi, B.; Zhao, H.; Xia, X.; Eck, T.F.; Goloub, P.; Dubovik, O.; Estelles, V.; Cuevas-Agulló, E.; Blarel, L.; et al. Aerosol optical properties and direct radiative forcing based on measurements from the China Aerosol Remote Sensing Network (CARSNET) in eastern China. Atmos. Chem. Phys. 2018, 18, 405–425. [Google Scholar] [CrossRef] [Green Version]
  33. Su, Y.; Xie, Y.; Tao, Z.; Hu, Q.; Yu, T.; Gu, X. Validation and inter-comparison of MODIS and VIIRS aerosol optical depth products against data from multiple observation networks over East China. Atmos. Environ. 2021, 247, 118205. [Google Scholar] [CrossRef]
  34. Holben, B.N.; Eck, T.F.; Slutsker, I.A.; Tanre, D.; Buis, J.P.; Setzer, A.; Vermote, E.; Reagan, J.A.; Kaufman, Y.J.; Nakajima, T.; et al. AERONET—A Federated Instrument Netowrk and Data Archive for Aerosol Characterization. Remote Sens. Environ. 1998, 66, 1–16. [Google Scholar] [CrossRef]
  35. Li, Z.Q.; Xu, H.; Li, K.T.; Li, D.H.; Xie, Y.S.; Li, L.; Zhang, Y.; Gu, X.F.; Zhao, W.; Tian, Q.J.; et al. Comprehensive Study of Optical, Physical, Chemical, and Radiative Properties of Total Columnar Atmospheric Aerosols over China: An Overview of Sun–Sky Radiometer Observation Network (SONET) Measurements. Bull. Am. Meteorol. Soc. 2018, 99, 739–755. [Google Scholar] [CrossRef]
  36. Sinyuk, A.; Holben, B.N.; Eck, T.F.; Giles, D.M.; Lyapustin, A. The AERONET Version 3 aerosol retrieval algorithm, associated uncertainties and comparisons to Version 2. Atmos. Meas. Tech. 2020, 13, 3375–3411. [Google Scholar] [CrossRef]
  37. Dragani, R.; Hersbach, H.; Poli, P.; Pebeuy, C.; Hirahara, S.; Simmons, A.; Dee, D. Recent Reanalysis Activities at ECMWF: Results from ERA-20C and Plans for ERA5. In Agu Fall Meeting, Reading, United Kingdom. 2015. Available online: https://agu.confex.com/agu/fm15/webprogram/Paper60279.html (accessed on 14 October 2021).
  38. Stein, A.F.; Draxler, R.R.; Rolph, G.D.; Stunder, B.J.B.; Cohen, M.D.; Ngan, F. NOAA’s HYSPLIT Atmospheric Transport and Dispersion Modeling System. Bull. Am. Meteorol. Soc. 2015, 96, 2059–2077. [Google Scholar] [CrossRef]
  39. Kalney, E.; Kanamitsu, M.; Kistler, R.; Collins, W.; Deaven, D.; Gandin, L.; Iredell, M.; Saha, S.; White, G.; Woollen, J.; et al. The NCEP/NCAR 40-year reanalysis project. Bull. Am. Meteorol. Soc. 1996, 77, 437–472. [Google Scholar] [CrossRef] [Green Version]
  40. Yuan, Y.; Shuai, Y.; Li, X.-W.; Liu, B.; Tan, H.-P. Using a new aerosol relative optical thickness concept to identify aerosol particle species. Atmos. Res. 2014, 150, 1–11. [Google Scholar] [CrossRef]
  41. Chen, Q.-X.; Yuan, Y.; Shuai, Y.; Tan, H.-P. Graphical aerosol classification method using aerosol relative optical depth. Atmos. Environ. 2016, 135, 84–91. [Google Scholar] [CrossRef]
  42. Dubovik, O.; Holben, B.N.; Eck, T.F.; Smirnov, A.; Slutsker, I. Variability of Absorption and Optical Properties of Key Aerosol Types Observed in Worldwide Locations. J. Atmos. Sci. 2002, 59, 590–608. [Google Scholar] [CrossRef]
  43. Ali, A.; Nichol, J.E.; Bilal, M.; Qiu, Z.; Mazhar, U.; Wahiduzzaman, M.; Almazroui, M.; Islam, M.N. Classification of aerosols over Saudi Arabia from 2004–2016. Atmos. Environ. 2020, 241, 117785. [Google Scholar] [CrossRef]
  44. Huang, C.; Li, J.; Sun, W.; Chen, Q.; Mao, Q.-J.; Yuan, Y. Long-Term Variation Assessment of Aerosol Load and Dominant Types over Asia for Air Quality Studies Using Multi-Sources Aerosol Datasets. Remote Sens. 2021, 13, 3116. [Google Scholar] [CrossRef]
  45. Zhu, J.; Xia, X.; Che, H.; Wang, J.; Zhang, J.; Duan, Y. Study of aerosol optical properties at Kunming in southwest China and long-range transport of biomass burning aerosols from North Burma. Atmos. Res. 2016, 169, 237–247. [Google Scholar] [CrossRef]
  46. Zhang, Y.; Li, Z.; Zhang, Y.; Chen, Y.; Cuesta, J.; Ma, Y. Multi-peak accumulation and coarse modes observed from AERONET retrieved aerosol volume size distribution in Beijing. Meteorol. Atmos. Phys. 2016, 128, 537–544. [Google Scholar] [CrossRef]
  47. Wang, X.; Shen, X.J.; Sun, J.Y.; Zhang, X.Y.; Wang, Y.Q.; Zhang, Y.M.; Wang, P.; Xia, C.; Qi, X.F.; Zhong, J.T. Size-resolved hygroscopic behavior of atmospheric aerosols during heavy aerosol pollution episodes in Beijing in December 2016. Atmos. Environ. 2018, 194, 188–197. [Google Scholar] [CrossRef]
  48. Wu, T.; Li, Z.; Chen, J.; Wang, Y.; Wu, H.; Jin, X.; Liang, C.; Li, S.; Wang, W.; Cribb, M. Hygroscopicity of Different Types of Aerosol Particles: Case Studies Using Multi-Instrument Data in Megacity Beijing, China. Remote Sens. 2020, 12, 785. [Google Scholar] [CrossRef] [Green Version]
  49. O’Neill, N.; Eck, T.F.; Smirnov, A.; Holben, B.N.; Thulasiraman, S. Spectral discrimination of coarse and fine mode optical depth. J. Geophys. Res. Atmos. 2003, 108, 4559. [Google Scholar] [CrossRef]
  50. Jing, F.; Singh, R.P. Optical properties of dust and crop burning emissions over India using ground and satellite data. Sci. Total Environ. 2020, 718, 134476. [Google Scholar] [CrossRef]
  51. Cesari, D.; de Benedetto, G.E.; Bonasoni, P.; Busetto, M.; Dinoi, A.; Merico, E.; Chirizzi, D.; Cristofanelli, P.; Donateo, A.; Grasso, F.M.; et al. Seasonal variability of PM2.5 and PM10 composition and sources in an urban background site in Southern Italy. Sci. Total Environ. 2018, 612, 202–213. [Google Scholar] [CrossRef]
  52. Madhavan, B.L.; Krishnaveni, A.S.; Ratnam, M.V.; Ravi Kiran, V. Climatological aspects of size-resolved column aerosol optical properties over a rural site in the southern peninsular India. Atmos. Res. 2021, 249, 105345. [Google Scholar] [CrossRef]
  53. Song, S.-K.; Shon, Z.-H.; Park, Y.-H. Diurnal and seasonal characteristics of the optical properties and direct radiative forcing of different aerosol components in Seoul megacity. Sci. Total Environ. 2017, 599–600, 400–412. [Google Scholar] [CrossRef]
  54. Kuang, Y.; Zhao, C.S.; Tao, J.C.; Ma, N. Diurnal variations of aerosol optical properties in the North China Plain and their influences on the estimates of direct aerosol radiative effect. Atmos. Chem. Phys. 2015, 15, 5761–5772. [Google Scholar] [CrossRef] [Green Version]
  55. Xun, L.; Lu, H.; Qian, C.; Zhang, Y.; Lyu, S.; Li, X. Analysis of Aerosol Optical Depth from Sun Photometer at Shouxian, China. Atmosphere 2021, 12, 1226. [Google Scholar] [CrossRef]
  56. Jin, X.; Bergin, M.H.; Yu, X.; Liu, G.; Zhao, J.; Carrico, C.M.; Baumann, K. Measurement of aerosol chemical, physical and radiative properties in the Yangtze delta region of China. Atmos. Environ. 2002, 36, 161–173. [Google Scholar] [CrossRef]
  57. Xu, J.; Tao, J.; Zhang, R.; Cheng, T.; Leng, C.; Chen, J.; Huang, G.; Li, X.; Zhu, Z. Measurements of surface aerosol optical properties in winter of Shanghai. Atmos. Res. 2012, 109–110, 25–35. [Google Scholar] [CrossRef]
  58. Gong, W.; Zhang, M.; Han, G.; Ma, X.; Zhu, Z. An Investigation of Aerosol Scattering and Absorption Properties in Wuhan, Central China. Atmosphere 2015, 6, 503–520. [Google Scholar] [CrossRef] [Green Version]
  59. Gadhavi, H.; Jayaraman, A. Absorbing aerosols: Contribution of biomass burning and implications for radiative forcing. Ann. Geophys. 2010, 28, 103–111. [Google Scholar] [CrossRef] [Green Version]
  60. Yu, X.; Zhu, B.; Yin, Y.; Yang, J.; Li, Y.; Bu, X. A comparative analysis of aerosol properties in dust and haze-fog days in a Chinese urban region. Atmos. Res. 2011, 99, 241–247. [Google Scholar] [CrossRef]
  61. Kandler, K.; Schütz, L. Climatology of the average water-soluble volume fraction of atmospheric aerosol. Atmos. Res. 2007, 83, 77–92. [Google Scholar] [CrossRef]
  62. Che, H.; Xia, X.; Zhu, J.; Wang, H.; Wang, Y.; Sun, J.; Zhang, X.; Shi, G. Aerosol optical properties under the condition of heavy haze over an urban site of Beijing, China. Environ. Sci. Pollut. Res. Int. 2015, 22, 1043–1053. [Google Scholar] [CrossRef] [PubMed]
  63. Dumka, U.C.; Tripathi, N.S.; Misra, A.; Giles, D.M.; Eck, T.F.; Sagar, R.; Holben, B.N. Latitudinal variation of aerosol properties from Indo-Gangetic Plain to central Himalayan foothills during TIGERZ campaign. J. Geophys. Res. Atmos. 2014, 119, 4750–4769. [Google Scholar] [CrossRef]
  64. Charlson, R.J.; Schwartz, S.E.; Hales, J.M.; Cess, R.D.; Coakley, J.A.; Hansen, J.E.; Hofmann, D.J. Climate forcing by anthropogenic aerosols. Science 1992, 255, 423–430. [Google Scholar] [CrossRef] [PubMed]
  65. Zheng, Y.; Che, H.; Xia, X.; Wang, Y.; Yang, L.; Chen, J.; Wang, H.; Zhao, H.; Li, L.; Zhang, L.; et al. Aerosol optical properties and its type classification based on multiyear joint observation campaign in north China plain megalopolis. Chemosphere 2021, 273, 128560. [Google Scholar] [CrossRef]
  66. Li, J.; Han, Z.; Zhang, R. Influence of aerosol hygroscopic growth parameterization on aerosol optical depth and direct radiative forcing over East Asia. Atmos. Res. 2014, 140–141, 14–27. [Google Scholar] [CrossRef]
  67. Sokolik, I.N.; Toon, O.B. Incorporation of mineralogical composition into models of the radiative properties of mineral aerosol from UV to IR wavelengths. J. Geophys. Res. Atmos. 1999, 104, 9423–9444. [Google Scholar] [CrossRef]
  68. Wang, W.; Wang, Y.; Shi, G. Experimental investigation on the infrared refraction and extinction properties of rock dust in tunneling face of coal mine. Appl. Opt. 2015, 54, 10532–10540. [Google Scholar] [CrossRef]
  69. Russell, P.B.; Bergstrom, R.W.; Shinozuka, Y.; Clarke, A.D.; Decarlo, P.F.; Jimenez, J.L.; Livingston, J.M.; Redemann, J.; Dubovik, O.; Strawa, A. Absorption Angstrom Exponent in AERONET and related data as an indicator of aerosol composition. Atmos. Chem. Phys. 2010, 10, 1155–1169. [Google Scholar] [CrossRef] [Green Version]
  70. Giles, D.M.; Holben, B.N.; Eck, T.F.; Sinyuk, A.; Smirnov, A.; Slutsker, I.; Dickerson, R.R.; Thompson, A.M.; Schafer, J.S. An analysis of AERONET aerosol absorption properties and classifications representative of aerosol source regions. J. Geophys. Res. Atmos. 2012, 117. [Google Scholar] [CrossRef] [Green Version]
  71. Zhang, S.; Wu, Y.; Zhao, B.; Wu, X.; Shu, J.; Hao, J. City-specific vehicle emission control strategies to achieve stringent emission reduction targets in China’s Yangtze River Delta region. J. Environ. Sci. 2017, 51, 75–87. [Google Scholar] [CrossRef] [PubMed]
  72. Kumar, K.R.; Kang, N.; Yin, Y. Classification of key aerosol types and their frequency distributions based on satellite remote sensing data at an industrially polluted city in the Yangtze River Delta, China. Int. J. Climatol. 2018, 38, 320–336. [Google Scholar] [CrossRef]
  73. Shen, H.; Hou, W.; Zhu, Y.; Zheng, S.; Tao, S. Temporal and spatial variation of PM2.5 in indoor air monitored by low-cost sensors. Sci. Total Environ. 2021, 770, 145304. [Google Scholar] [CrossRef] [PubMed]
  74. Massling, A.; Stock, M.; Wehner, B.; Wu, Z.J.; Hu, M.; Brüggemann, E.; Gnauk, T.; Herrmann, H.; Wiedensohler, A. Size segregated water uptake of the urban submicrometer aerosol in Beijing. Atmos. Environ. 2009, 43, 1578–1589. [Google Scholar] [CrossRef]
  75. Day, D.E.; Malm, W.C. Aerosol light scattering measurements as a function of relative humidity: A comparison between measurements made at three different sites. Atmos. Environ. 2001, 35, 5169–5176. [Google Scholar] [CrossRef]
  76. Hersbach, H.; Bell, B.; Berrisford, P.; Biavati, G.; Horányi, A.; Muñoz Sabater, J.; Nicolas, J.; Peubey, C.; Radu, R.; Rozum, I.; et al. ERA5 Hourly Data on Pressure Levels from 1979 to Present. Copernic. Clim. Chang. Serv. (C3S) Clim. Data Store (CDS) 2018. Available online: https://cds.climate.copernicus.eu/cdsapp#!/dataset/10.24381/cds.bd0915c6?tab=overview (accessed on 14 October 2021). [CrossRef]
  77. Hersbach, H.; Bell, B.; Berrisford, P.; Biavati, G.; Horányi, A.; Muñoz Sabater, J.; Nicolas, J.; Peubey, C.; Radu, R.; Rozum, I.; et al. ERA5 hourly data on single levels from 1979 to present. Copernic. Clim. Chang. Serv. (C3S) Clim. Data Store (CDS) 2018. [Google Scholar] [CrossRef]
  78. READY-(noaa.gov). Available online: https://www.ready.noaa.gov/HYSPLIT_traj.php (accessed on 14 October 2021).
  79. Export Map (ChinaOnlineCommunityENG) (geoq.cn). Available online: http://map.geoq.cn/arcgis/rest/services/ChinaOnlineCommunityENG/MapServer/export?bbox=-5.212883029802394E7,-2.1642074440545984E7,5.682512131586398E7,2.5242564220889986E7 (accessed on 14 October 2021).
  80. Barnaba, F.; Gobbi, G.P. Aerosol seasonal variability over the Mediterranean region and relative impact of maritime, continental and Saharan dust particles over the basin from MODIS data in the year 2001. Atmos. Chem. Phys. 2004, 4, 2367–2391. [Google Scholar] [CrossRef] [Green Version]
Figure 1. Daily variation in meteorological parameters, including relative humidity (RH) and temperature at 850 hPa (a), atmospheric boundary layer height (ABL) (b), and columnar volume size distribution (VSD) (c). The gray are in (c) denotes days without AOP inversions due to unfavorable observation conditions (e.g., cloudy, rainy). The daily parameters used here are the daily average composites of raw observations. AOD variation is also shown in (c). Note that double y-axes are employed in (a,c).
Remotesensing 14 00406 g001
Figure 2. Monthly (a) and diurnal (b) variation in columnar fine/coarse AOD, fine-mode fraction (FMF, 440 nm), throughout the whole study period. The translucent bands in green and orange represent the standard deviation ranges for the fine and coarse modes, respectively. The boxplots in blue denote monthly/hourly variation in FMF at 440 nm. “BJT” denotes Beijing standard time (UTC + 08).
Remotesensing 14 00406 g002
Figure 3. Monthly variation in columnar aerosol volume size distribution over the study period. The average and standard deviation of effective radius of fine- and coarse-mode aerosols are marked in green and orange, respectively, in each panel.
Remotesensing 14 00406 g003
Figure 4. Monthly variation in spectral dependence of SSA of total (a), fine-mode (b), and coarse-mode aerosols (c), AOD (d), and AAOD (e). The AOP at wavelengths of 440, 675, 870, and 1020 nm is shown in blue, red, cyan, and pink, respectively. The horizontal line within each box represents the median, while the black dot within each box represents the mean value.
Remotesensing 14 00406 g004
Figure 5. Aerosol typing results based on aerosol optical depth (AOD)–AROT (a) and fine-mode fraction (FMF)–SSA (b). The occurrence frequency of each type is presented according to the AOD range bins. Note that AOP observations with AOD (440 nm) less than 0.4 are screened in FMF–SSA aerosol typing results (b) for quality assurance.
Remotesensing 14 00406 g005
Figure 6. Aerosol type occurrence frequency (a) and VSD (b), under varying RH levels. The observations are divided into six groups according to RH at 850 hPa: D (dry; RH < 15%), MD (moderately dry; 15% ≤ RH ≤ 25%), SD (slightly dry; 25% ≤ RH < 35%), SH (slightly humid; 35% ≤ RH < 50%), MH (moderately humid; 50% ≤ RH < 60%), and H (humid; RH > 60%).
Remotesensing 14 00406 g006
Figure 7. Daily average variation in critical aerosol optical properties of VSD (a,f), AOD (b,g), SSA (c,h), effective radius (d,i), and RH (e,j) during the two episodes. Note that the y-axes of relative humidity (i.e., (e,j)) for the two episodes are different in scale.
Remotesensing 14 00406 g007
Figure 8. Clustering analysis of backward trajectories of episode 1 (a,c) and episode 2 (b,d). The first and second rows represent trajectories arriving at the Nanjing site at the levels of 50 and 1500 m above sea level, respectively. The number beside each trajectory cluster denotes the contribution of the air mass alongside the corresponding trajectory. The red, orange and green lines in each figure denote different contribution levels with red line representing the highest, green the lowest, and orange and olive green the intermediate. The base map is supported by GISUNI.
Remotesensing 14 00406 g008
Publisher’s Note: MDPI stays neutral with regard to jurisdictional claims in published maps and institutional affiliations.

