Technical Note

An Operational Analysis Ready Radar Backscatter Dataset for the African Continent

1
Geoscience Australia, GPO Box 378, Canberra 2601, Australia
2
Sinergise, Cvetkova Ulica 29, SI-1000 Ljubljana, Slovenia
3
solo Earth Observation (soloEO), Tokyo 104-0054, Japan
*
Author to whom correspondence should be addressed.
Remote Sens. 2022, 14(2), 351; https://doi.org/10.3390/rs14020351
Submission received: 26 November 2021 / Revised: 7 January 2022 / Accepted: 7 January 2022 / Published: 13 January 2022
(This article belongs to the Special Issue Sentinel Analysis Ready Data (Sentinel ARD))

Abstract

:
Digital Earth Africa is now providing an operational Sentinel-1 normalized radar backscatter dataset for Africa. This is the first free and open continental scale analysis ready data of this kind that has been developed to be compliant with the CEOS Analysis Ready Data for Land (CARD4L) specification for normalized radar backscatter (NRB) products. Partnership with Sinergise, a European geospatial company and Earth observation data provider, has ensured this dataset is produced efficiently in the cloud infrastructure and can be sustained in the long term. The workflow applies radiometric terrain correction (RTC) to the Sentinel-1 ground range detected (GRD) product, using the Copernicus 30 m digital elevation model (DEM). The method is used to generate data for a range of sites around the world and has been validated as producing good results. This dataset over Africa is made available publicly as a AWS public dataset and can be accessed through the Digital Earth Africa platform and its Open Data Cube API. We expect this dataset to support a wide range of applications, including natural resource monitoring, agriculture, and land cover mapping across Africa.

1. Introduction

Digital Earth Africa (DE Africa) is a program and a digital infrastructure that aims to use Earth observation (EO) data to help address sustainable development challenges in Africa. Through the program, continental-wide data are provided free and open to all users, including researchers, policy makers and industry. Operational services based on EO data are being developed to support decision making in resource management and improving food security.
DE Africa operates a cloud-based Open Data Cube (ODC)-powered platform in the Amazon Web Services (AWS). Its EO capability is underpinned by interoperable analysis ready data (ARD) that have been processed to a minimum set of requirements and organized into a form that allows immediate time series analysis with a minimum additional effort from users [1]. The ARD definition is adopted from the Committee on Earth Observation Satellites (CEOS) ARD for Land (CARD4L) initiative (https://ceos.org/ard/, accessed on 6 January 2022). Since 2016, CEOS has been developing technical specifications for ARD with expert users and data providers. These specifications are not exclusive but define minimum attributes that are foreseen, required by a majority of land imaging applications. Compliance to CARD4L specification is assessed through a formal process coordinated by the CEOS Land Surface Imaging Virtual Constellation (LSI-VC), including peer review by the CEOS Working Group on Calibration and Validation (WGCV). We identify CARD4L-compliant ARD or those developed with expectation to meet the CEOS specifications as suitable datasets to host.
Data from three key EO missions are recognized to be critical for DE Africa, namely Landsat, Sentinel-2, and Sentinel-1. They offer open data with frequent and systematic coverage of the continent and complementary measurements at moderate to high spatial resolution. In early 2021, the Landsat Collection 2 (https://www.usgs.gov/core-science-systems/nli/landsat/landsat-collection-2, accessed on 6 January 2022) surface reflectance and surface temperature products from the United States Geological Survey (USGS) became the first set of CEOS endorsed CARD4L-compliant ARD. The Sentinel-2 Level 2A product from European Space Agency (ESA) is under CEOS peer review for compliance at the time of writing (January 2022).
While no Sentinel-1 ARD was yet available, the community has been actively progressing the development of Synthetic Aperture Radar (SAR) ARD (e.g., [2]). Two CARD4L product family specifications (PFS) were released in 2020 for Normalised Radar Backscatter (NRB) and Polarimetric Radar (POL) data. The ARD product described in this paper is based on CARD4L NRB specification version 5.5, released in October 2021 [3]. Key features of the CARD4L NRB specification are that the products are provided in the γ 0 backscatter convention and are subject to radiometric terrain correction (RTC). RTC minimizes backscatter variation from changing observation geometries due to terrain and allows the “flattened” data from different locations and observing times to be compared. We believe the methods are mature and demand exists for Sentinel-1 NRB to be provided operationally at a continental scale so more users can benefit from this data.
Sentinel-1 backscatter data can be used in many applications. Its all weather observation capability will be critical to monitor the tropics making up a significant portion of the African continent. Its sensitivity to viewing geometry, surface roughness, and moisture content will support land cover classification and the mapping and monitoring of forests, wetlands and agriculture. The twin Sentinel-1A and 1B satellites currently observe most land surface on Earth with a 12 day revisit, or less. Thanks to the Copernicus program’s free and open data policy, this global SAR time-series has already achieved unrivaled impact. Reliable and timely access to CARD4L NRB products will further reduce the barrier for use by eliminating the needs for pre-processing with specialized software and expert knowledge. The openly accessible data will also support development of regularly updated continental scale services and drive innovative use with other complementary datasets across sectors.
DE Africa has chosen to partner with Sinergise, a European geospatial company and EO data provider, to produce the Sentinel-1 ARD. Sinergise manages the Sentinel-1 GRD data in cloud optimized format in AWS; therefore, it is well placed to implement an efficient processing workflow that is applicable for the global archive and can be sustained into the future. Through the CEOS Systems Engineering Office (SEO) (https://ceos.org/ourwork/systems-engineering-office/, accessed on 6 January 2022), we also work closely with the CEOS LSI-VC CARD4L SAR working group to ensure the CARD4L specifications can be realistically achieved and to support the development of new CARD4L product specifications.
The Sentinel-1 CARD4L NRB data for Africa is now available free and open to all users (https://registry.opendata.aws/deafrica-sentinel-1/, accessed on 6 January 2022) and is updated every few minutes as new acquisitions become available. The dataset has been self-assessed to be CARD4L compliant and the assessment was submitted for CEOS peer review in December 2021.
The DE Africa Sentinel-1 ARD has several notable differences and advantages compared to other publicly available Sentinel-1 backscatter products. Google Earth Engine (GEE) provides radiometrically calibrated σ 0 globally (https://developers.google.com/earth-engine/datasets/catalog/COPERNICUS_S1_GRD, accessed on 6 January 2022). It is shown that it has similar radiometric performance within the main (0 to −30 dB) dynamic range to our product (see [4], for more details on the comparison). However, RTC is not applied by default in GEE. Although additional RTC processing tools have been developed for GEE [5], the usability of the data by non-expert users remains limited over areas that are not flat. Another public Sentinel-1 RTC product is provided by Indigo Ag, Inc. (Boston, MA, USA; https://registry.opendata.aws/sentinel-1-rtc-indigo/, accessed on 6 January 2022), for the contiguous United States only. This data are provided at a pixel spacing (20 m) similar to ours but speckle filtering with fixed parameters has been applied, reducing its effective resolution and flexibility for users to choose a different filtering method. Neither the GEE product nor the Indigo Ag product is CARD4L-compliant and, thus, also lacks the comprehensive metadata required by the CARD4L standards.
We will detail the specification, the methods used to produce the CARD4L NRB data, and quality assessment results in the sections below and discuss our research and potential applications.

2. Methods

2.1. DE Africa’s Sentinel-1 Dataset

DE Africa provides radiometric terrain corrected Sentinel-1 backscatter with the specifications listed in Table 1. The WGS 84 coordinate reference system is chosen as it’s widely used for global datasets, including digital elevation models (DEMs), and gives low distortion over the African continent centered around the Equator. Output is generated in 1 × 1 tiles for optimal file sizes, easy scheduling of batch processing and spatially organized output. In interferometric wide swath (IW) mode, the Sentinel-1 instrument has a 5 × 20 m spatial resolution, we therefore choose to provide the product at an approximately 20 m pixel spacing to balance resolution and storage requirements. The pixel spacing of 0.0002 degree is defined so each tile can be divided into integer number of pixels. All analyses presented in this paper are done at a 0.0002 degree resolution unless otherwise specified.
This dataset is hosted in AWS Simple Storage Service (S3) in Cape Town, South Africa, sponsored by the AWS Open Data program. All images are provided as cloud-optimized GeoTIFF (COG) and metadata are available following the SpatioTemporal Asset Catalog (STAC) (https://stacspec.org/, accessed on 6 January 2022) standard. Users can access the free and open dataset directly from the S3 bucket named deafrica-sentinel-1, through the DE Africa platform powered by ODC, or through the DE Africa STAC API available at https://explorer.digitalearth.africa/stac (accessed on 6 January 2022). A number of tools and resources are provided by DE Africa to help users from different levels of technical background to access, visualize, and analyze the data. They will be explained in more detail in Section 3.

2.2. Input and Ancillary Data

The Sentinel-1 ARD is generated from the GRD data managed by Sinergise’s Sentinel Hub, in COG format, and stored in the AWS Frankfurt region. This dataset can be downloaded or visualized in Sentinel Hub EO Browser (https://apps.sentinel-hub.com/eo-browser/, accessed on 6 January 2022). One main feature of COG is the pyramid overviews which enable efficient access at a range of resolutions. Overviews for the 10 m pixel spaced GRD data from ESA have been generated with average resampling method. This means every pixel value in the first level overview of 20 m resolution is the average of a 2 by 2 pixel block in the original image, thus with reduced noise. The 20 m overview is used to generate normalized backscatter for DE Africa.
An accurate and up-to-date DEM is required to estimate the terrain correction. The Copernicus 30 m DEM (GLO-30) [6] has been used for the DE Africa Sentinel-1 ARD. This DEM is derived from WorldDEM™ which is based on radar satellite data acquired by the TanDEM-X Mission between December 2010 and January 2015. Hydrological features, implausible terrain, and paved surfaces of airports have been edited to ensure continuity and accuracy. GLO-30 provides global coverage with 1 arc second grid spacing. Where a higher resolution Copernicus DEM is available, namely at 10 m (EEA-10) over Europe, it can also be used in the workflow described in this paper.

2.3. Radiometric Terrain Correction

The Sentinel-1 processor is implemented as part of Sentinel Hub software which is optimized for processing speed and efficiency in the cloud. Radiometric terrain correction is calculated and applied following the method described in [7]. For each pixel in the GRD image, the local scattering (or illuminated) area relative to β 0 reference area ( A ^ γ ) is calculated using the DEM. As recommended by [7], the DEM is oversampled to 0.0001 degree resolution to enable area integration with finer facet segments. The unitless relative scattering area image, in the GRD image geometry, is then used to normalize β 0 to γ r t c 0 (where γ r t c 0 = β 0 / A ^ γ ) [7]. Finally, a range Doppler terrain correction is applied to map each output pixel in ground coordinates to the GRD pixel grid and a bi-linear interpolation is used to calculate the output γ r t c 0 . Bi-linear interpolation is chosen because it is fast to calculate, produces smooth results and doesn’t introduce significant artifacts (see also [8]). The same DEM is used for both the scattering area calculation and the range Doppler correction, together with the Earth Gravitational Model 2008 (EGM2008).

2.4. Metadata Generation

Metadata are provided to meet all threshold (minimum) requirements, and wherever possible and reasonable, the target (desired) requirements, in the CARD4L NRB specification version 5.5. CARD4L-NRB requires radiometric terrain correction and normalization to γ 0 . It specifies metadata needed to properly interpret the data, including information on satellite and sensor, source input (in our case the GRD products used), key processing parameters, and data quality measures. Processing parameters not required by CARD4L, but deemed relevant for this dataset, are also provided.
In addition to one γ r t c 0 image for each polarization, three per-pixel metadata images are produced according to CARD4L-NRB in the same ground coordinate system:
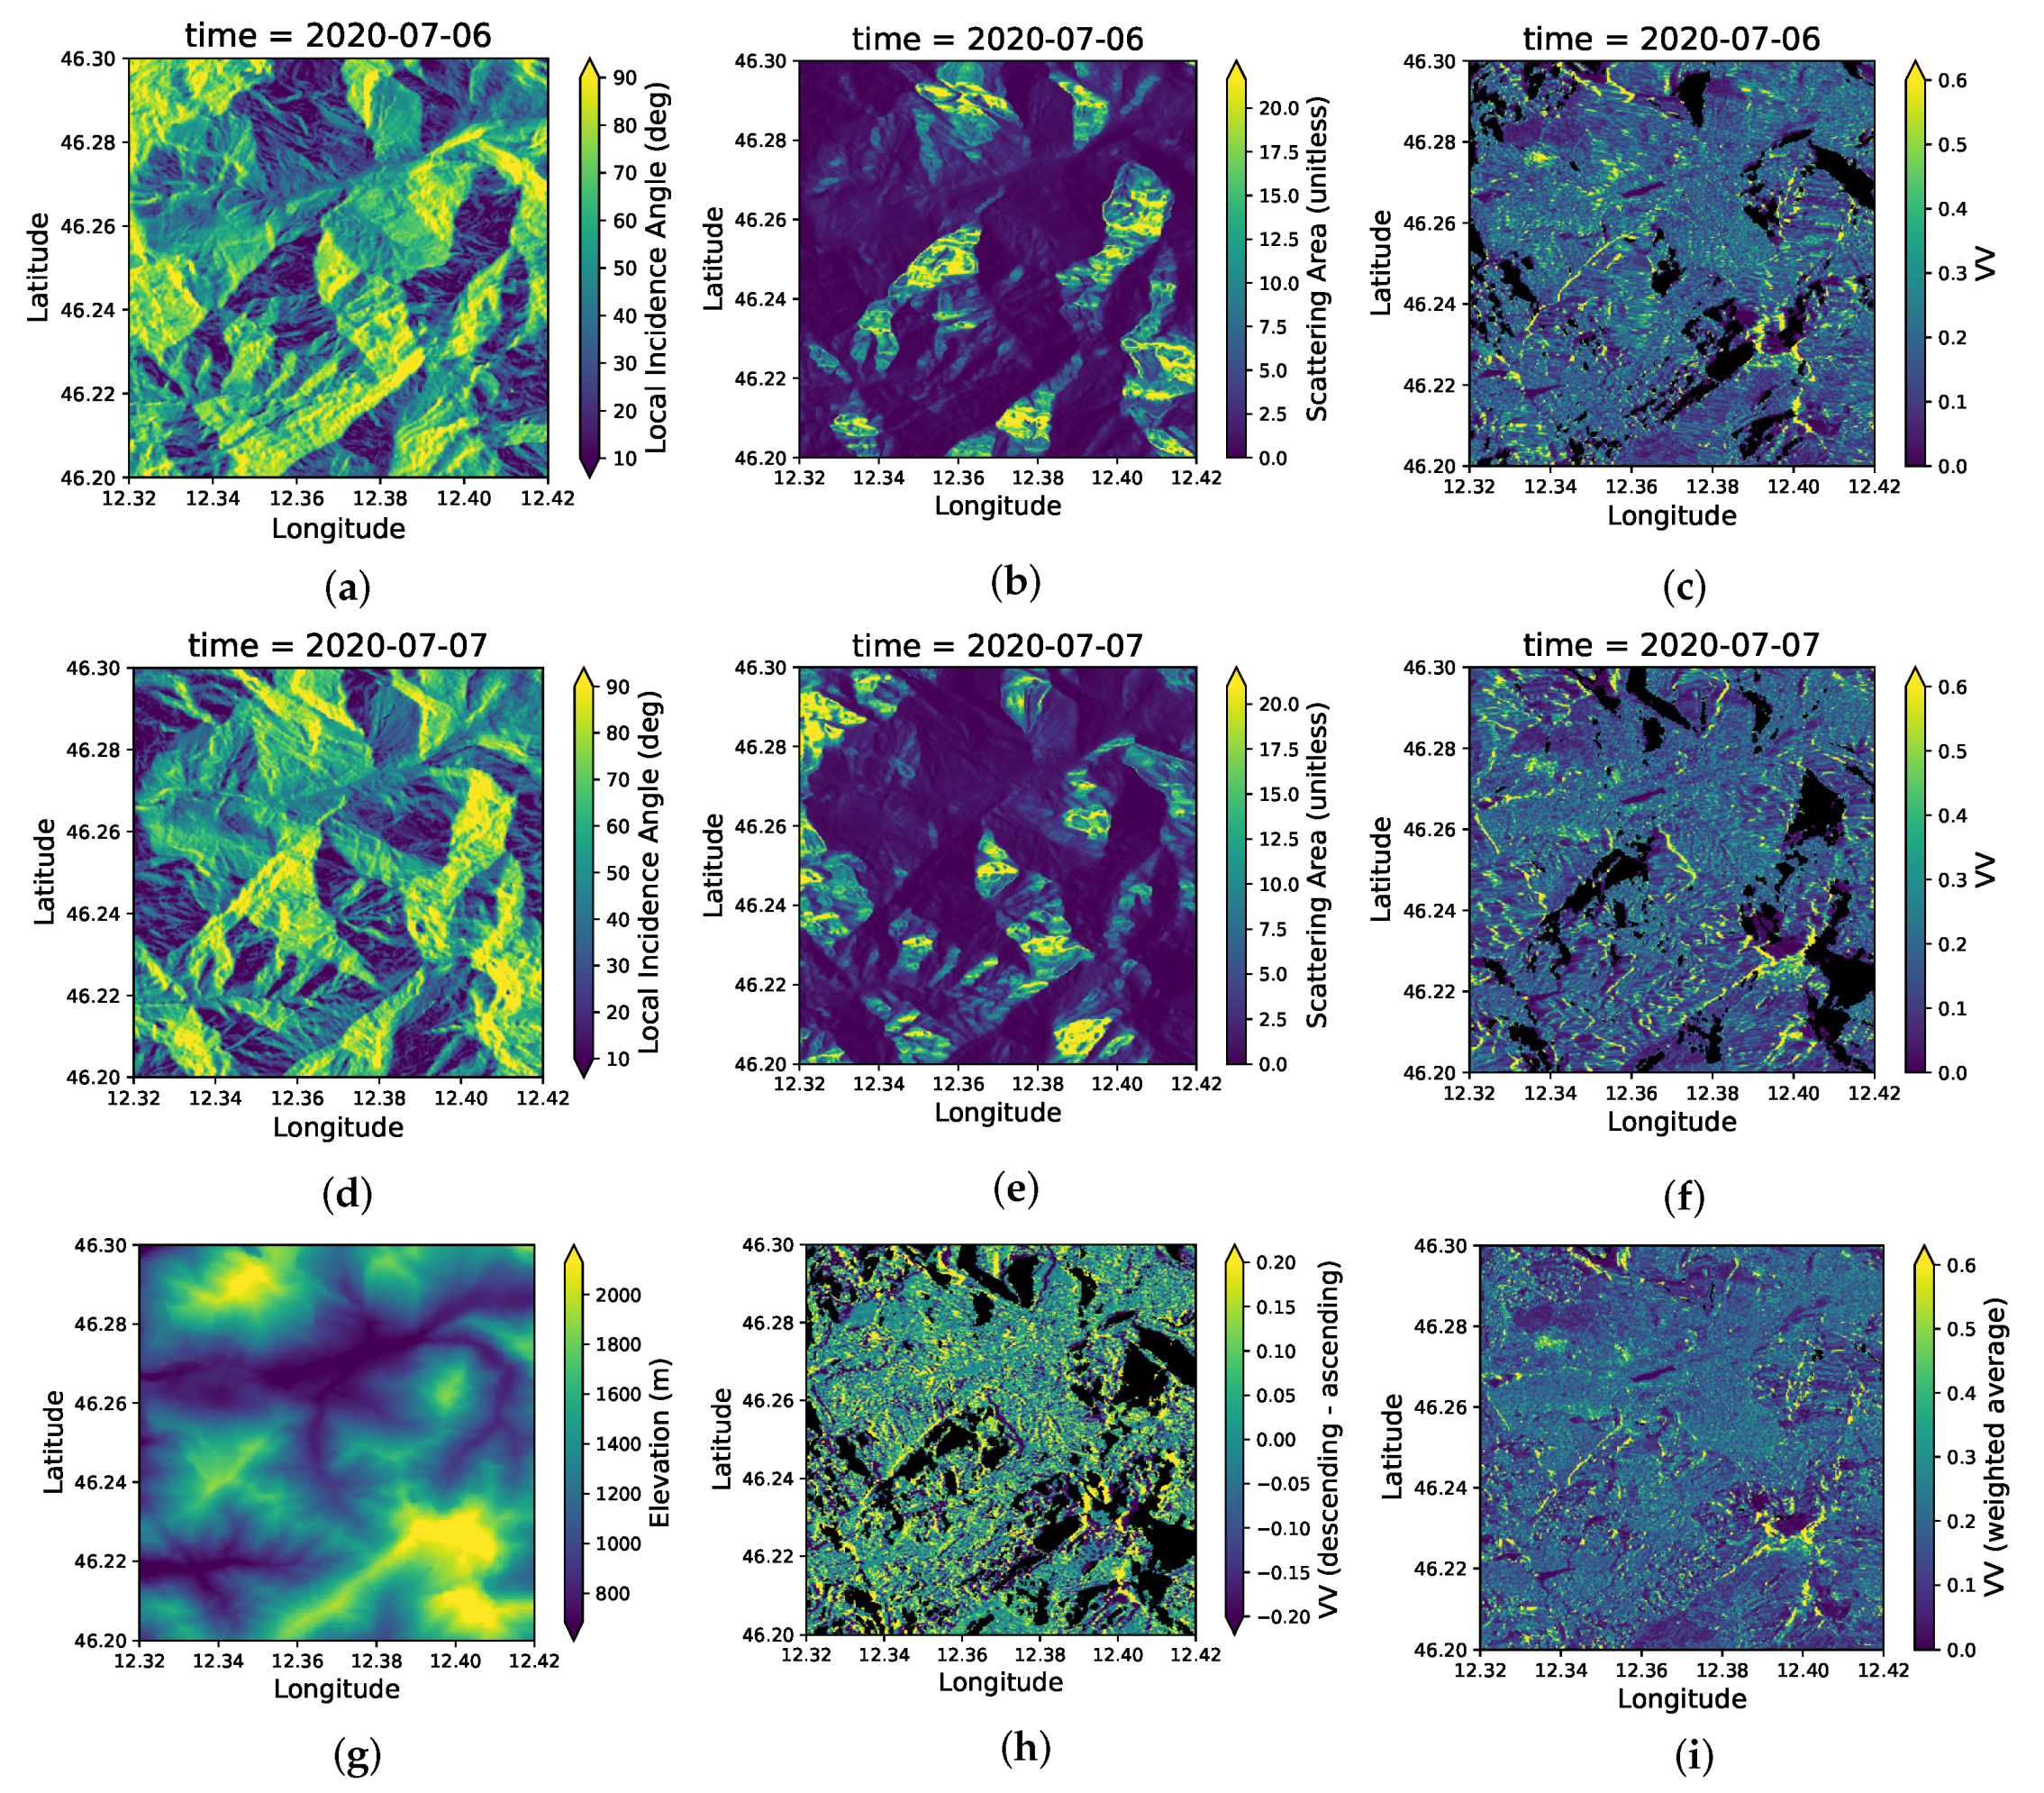
  • A data mask identifying no-data, valid and radar shadow (invalid) pixels. No-data pixels are those outside the scene boundary. The radar shadow mask maps pixels inside and near radar shadow where the backscatter coefficient normalization is not reliable. The radar shadow is first defined in the GRD pixel grid as where normalized scattering area is smaller than 0.05. This binary shadow mask is dilated by 1 pixel using a maximum filter and then nearest neighbor resampled into the range Doppler projected output grid coordinate. This ensures all output pixels potentially affected by radar shadow are masked.
  • A local incidence angle image. This is the angle between the radar antenna and the normal of the local ground surface calculated for each pixel. For each output pixel, an angle is computed against the ground topography defined by the DEM.
  • A scattering area image. The output area values are bi-linear interpolated into output pixel grid from the unitless normalization factors ( A ^ γ ) that have been used to convert β 0 to γ r t c 0 in the GRD pixel grid. This area image provides information on the terrain relative to the radar illumination geometry. On the fore-slope (slope facing the sensor), scattering area is large and foreshortening occurs hence effective ground resolution is lower than the nominal resolution. On the back-slope, scattering area is small (or close to zero in the shadow) and a larger number of pixels in radar geometry are mapped to a smaller number of pixels in the ground geometry resulting in a higher effective resolution on the ground. The scattering areas are therefore inversely correlated with effective resolutions and can be used as weight when combining images from different viewing geometries [9]. This scattering area can also be used to derive equivalent incidence angle. As shown in Equation (3) in [7], for an ellipsoidal Earth model, the ratio of β 0 reference area to γ 0 reference area is equal to tangent of the incidence angle. For RTC, each illuminated area does not correspond to a single incidence angle, hence arctan ( 1 / A ^ γ ) may serve as a proxy when an angle estimate is needed.
For DE Africa, we have chosen to only provide data in dual VV and VH polarization. Therefore each output product package include five images, one XML metadata file formatted according to the CARD4L-NRB recommendation and one GeoJSON STAC metadata file.
A configurable CARD4L tool (https://apps.sentinel-hub.com/s1-card4l/, accessed on 6 January 2022) was developed in Sentinel Hub that can be used to manage RTC processing and metadata generation described in this section. This tool allows registered users to select and process Sentinel-1 data for anywhere in the world, in different acquisition modes and polarization, and to different output resolutions.

3. Results

3.1. Radiometric Terrain Correction

Radiometric terrain correction is applied to minimize the impact of terrain. We have evaluated the effectiveness of this correction and the quality of the output data and associated metadata for a number of locations across Africa, Asia, South America, and Europe with known challenging terrains. Figure 1 shows the results of RTC for two selected locations in Africa, the Ngambe mountain region in Cameroon (Figure 1a,b) and Arsi, Ethiopia (Figure 1c,d). Backscatter images with and without RTC are compared and most terrain related features are not visible in the RTC images.
In Figure 2, we show a detailed analysis for an area in eastern Alps, northern Italy, close to the border of Austria. This site has very steep terrain, is mostly covered by forest, is located at a moderate latitude, and is in Europe where the Copernicus DEM has validated good quality.
Two images from 2020 are selected, one from the descending pass acquired on 6 July and one from the ascending pass acquired on 7 July. Images from the summer are chosen to minimize the impact from snow cover. No significant land cover change is expected between the two images acquired one day apart. The γ r t c 0 product is analyzed to confirm that it has:
  • Minimal artifacts near radar shadow. Inside and near the radar shadow, the scattering area is either zero or a small value, so a small uncertainty in the scattering area leads to large uncertainty in γ r t c 0 . Pixels that are potentially affected by this uncertainty are masked out and we do not see obvious artifacts on the edge of the shadow masks (Figure 2c,f).
  • Minimal dependence on look angle. For this mountainous area, local incidence angle changes significantly within a scene and between descending and ascending orbits (Figure 2a,d). The normalized backscatter measurements (Figure 2c,f) and the difference between measurements from descending and ascending orbits (Figure 2h) do not show variation correlated with the terrain facets.
Following [9], we combined the backscatter measurements from the descending and ascending passes using the inverse of the scattering area as weight. The resulting image (Figure 2i) shows decreased noise and reduced patchiness (due to varying effective resolution) across the scene.

3.2. Geometric Accuracy

To measure the absolute geometric accuracy of the product, we used the corner reflector (CR) array permanently installed in Queensland, Australia [10], as reference. The CR locations have been surveyed and updated in 2018 [11]. This site, at approximate latitude range of 28 to 26 and longitude range of 150 and 152, has 40 CRs with sizes of 1.5, 2, and 2.5 m. The CRs are oriented so they are visible by Sentinel-1 in ascending orbit and with co-polarization.
Data from 30 IW mode dual-polarization (VV and VH) data takes in ascending orbit were processed. These data cover locations of 12 CRs and were acquired every 12 days from all seasons in 2020. To reduce uncertainty due to interpolation, CR locations are measured from γ r t c 0 images with 0.0001 degree (approximately 10 m) ground resolution. For each date and around each known and visible CR location, VV backscatter coefficients are extracted within a small spatial window and the peak backscatter location (or the “center of mass”) is estimated. Offsets in the latitude and longitude dimensions between the known location of a CR and its measured location are calculated and combined as square root of the summed squared error. Using the total of 360 sets of offset measurements, mean and standard deviation of the absolute location error (ALE) and root mean squared error (RMSE) are derived and reported in Table 2.
We also tried to measure CR locations from 0.0002 degree ground resolution γ r t c 0 images and obtained compatible mean ALEs, but increased standard deviations, from half to around three meters in all directions. This investigation confirms that the mean ALE is dominated by intrinsic bias (e.g., due to position and timing correction at scene level) and the standard deviation is affected more by output resolution, the interpolation method used during re-sampling, and the algorithm used to determine the CR location in the SAR images. The main cause for the bias is the atmospheric path delay, which is not corrected for without auxiliary information on the troposphere and ionosphere [12].
It is to be noted that we measured the geometric accuracy in projected ground coordinates for data taken in ascending orbit direction only, since all reflectors in the CR array are oriented in the same direction. The alignment between ground and radar native axes is different for data taken in a descending orbit, hence the mean ALE vector is likely to be different. We expect, however, that the combined measurements are representative and the overall RMSE is around four meters. This is similar in magnitude to values reported in the literature [12]. More importantly, the geolocation uncertainty of around 20% of a 0.0002 degree output pixel means images are spatially aligned with DEM to achieve effective radiometric terrain correction. The γ r t c 0 products are also interoperable with data from other sensors for land cover mapping and monitoring applications relevant to DE Africa.

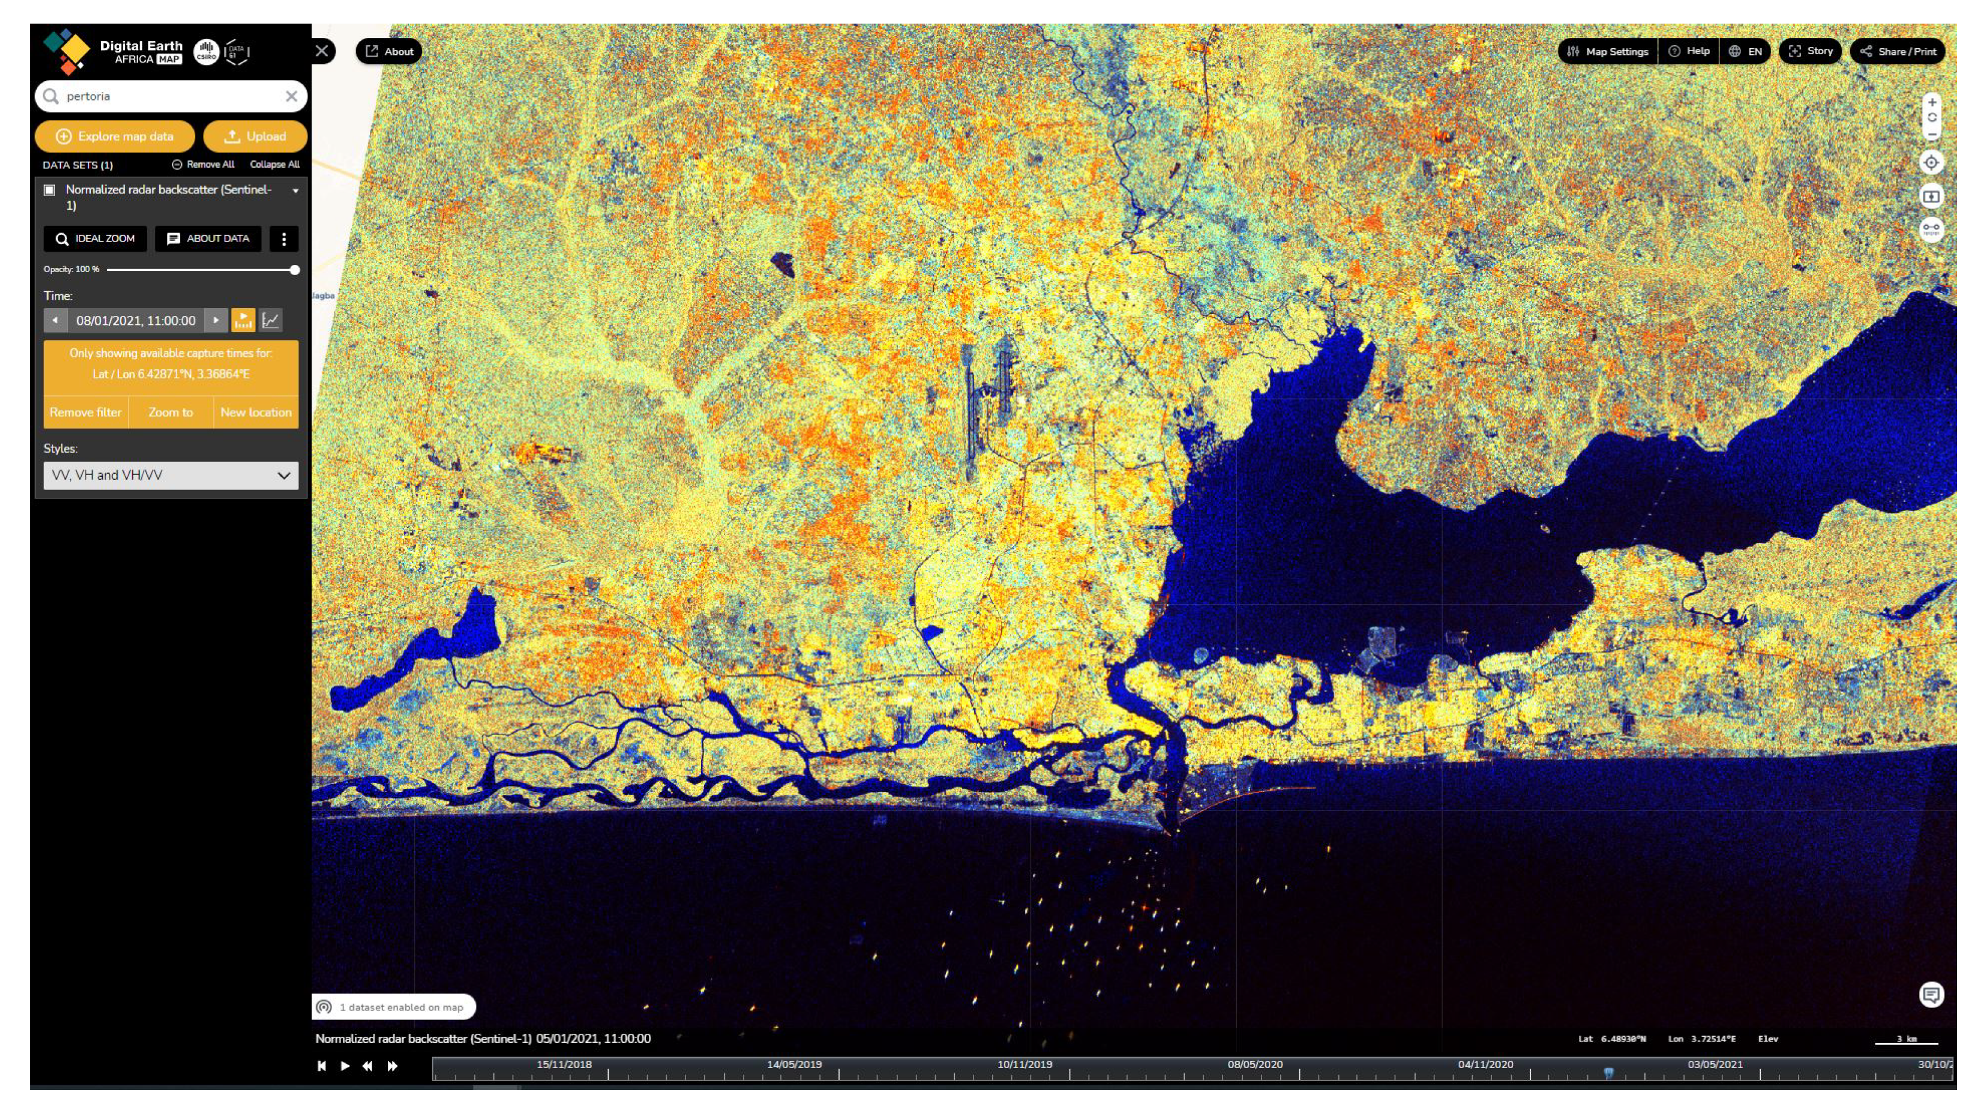
3.3. Data Access through DE Africa Platform

DE Africa provides a number of interfaces, supported by open source software, for users to interact with the analysis ready datasets. Sentinel-1 data are made available through all these interfaces. Individual images can be located and downloaded from AWS S3 storage through the DE Africa Explorer site (https://explorer.digitalearth.africa/products/s1_rtc, accessed on 6 January 2022). Data availability and metadata can be inspected from the browser.
Sentinel-1 backscatter images can be visualized in the DE Africa Map portal (https://maps.digitalearth.africa/, accessed on 6 January 2022) or accessed through Open Geospatial Consortium (OGC)-compliant Web Services (OWS) (https://ows.digitalearth.africa/, accessed on 6 January 2022). The web service provides a powerful tool for on-the-fly generation of false color composites and calculation of band indices. For Sentinel-1, false color composites are generated using VV, VH, and ratio of VH to VV as Red, Green and Blue respectively. To achieve good visual contrast for most locations in Africa, backscatter values were sampled from across the continent to inspect the distributions and define optimal normalization ranges. A minimum value of 0 and maximum of 0.28, 0.06 and 0.49 are used to normalize VV, VH, and ratio of VH to VV images, respectively, for the RGB composites. This styling leads to typical open water showing in black and dark blue, vegetation in light yellow and green, and dense urban areas in bright yellow and orange colors (Figure 3).
Through the map portal and OWS, dual-pol radar vegetation index (RVI) (Equation (7) in [13]) can be requested and visualized. This allows for quick visual assessments of change such as deforestation from the browser before accessing data for further analysis.
Finally, the Sentinel-1 data can be accessed through the ODC API in the DE Africa Sandbox (https://sandbox.digitalearth.africa/, accessed on 6 January 2022). The Sandbox is a cloud-hosted JupyterLab Python environment where users are provided free compute resource for interactive data analysis. The Sandbox can be used to carry out or develop simple to highly sophisticated analysis using DE Africa data. Most of the potential applications discussed in the following section can be readily explored in the Sandbox.

4. Discussion and Example Applications

The Sentinel-1 ARD will support DE Africa to address key challenges faced by Africa, in all of the following priority themes: water resources and flood risks, agriculture and food security, land degradation and coastal erosion, and urbanization and climate action in Africa. In this section, we show a few example analyses using Sentinel-1 ARD and other datasets and tools available in the DE Africa platform. These examples implement proven methods from the literature and demonstrate a range of possible applications that are enabled by this dataset. Python notebooks, including a step-by-step guide to conduct these analyses can be found in the DE Africa Sandbox notebook repository (https://github.com/digitalearthafrica/deafrica-sandbox-notebooks, accessed on 6 January 2022), and additional examples will be added over time. DE Africa Sandbox users can run these analyses over most locations in Africa with modifications of a few parameters and can adjust and expand the analyses for in-depth studies.

4.1. Water, Coast, and Wetland
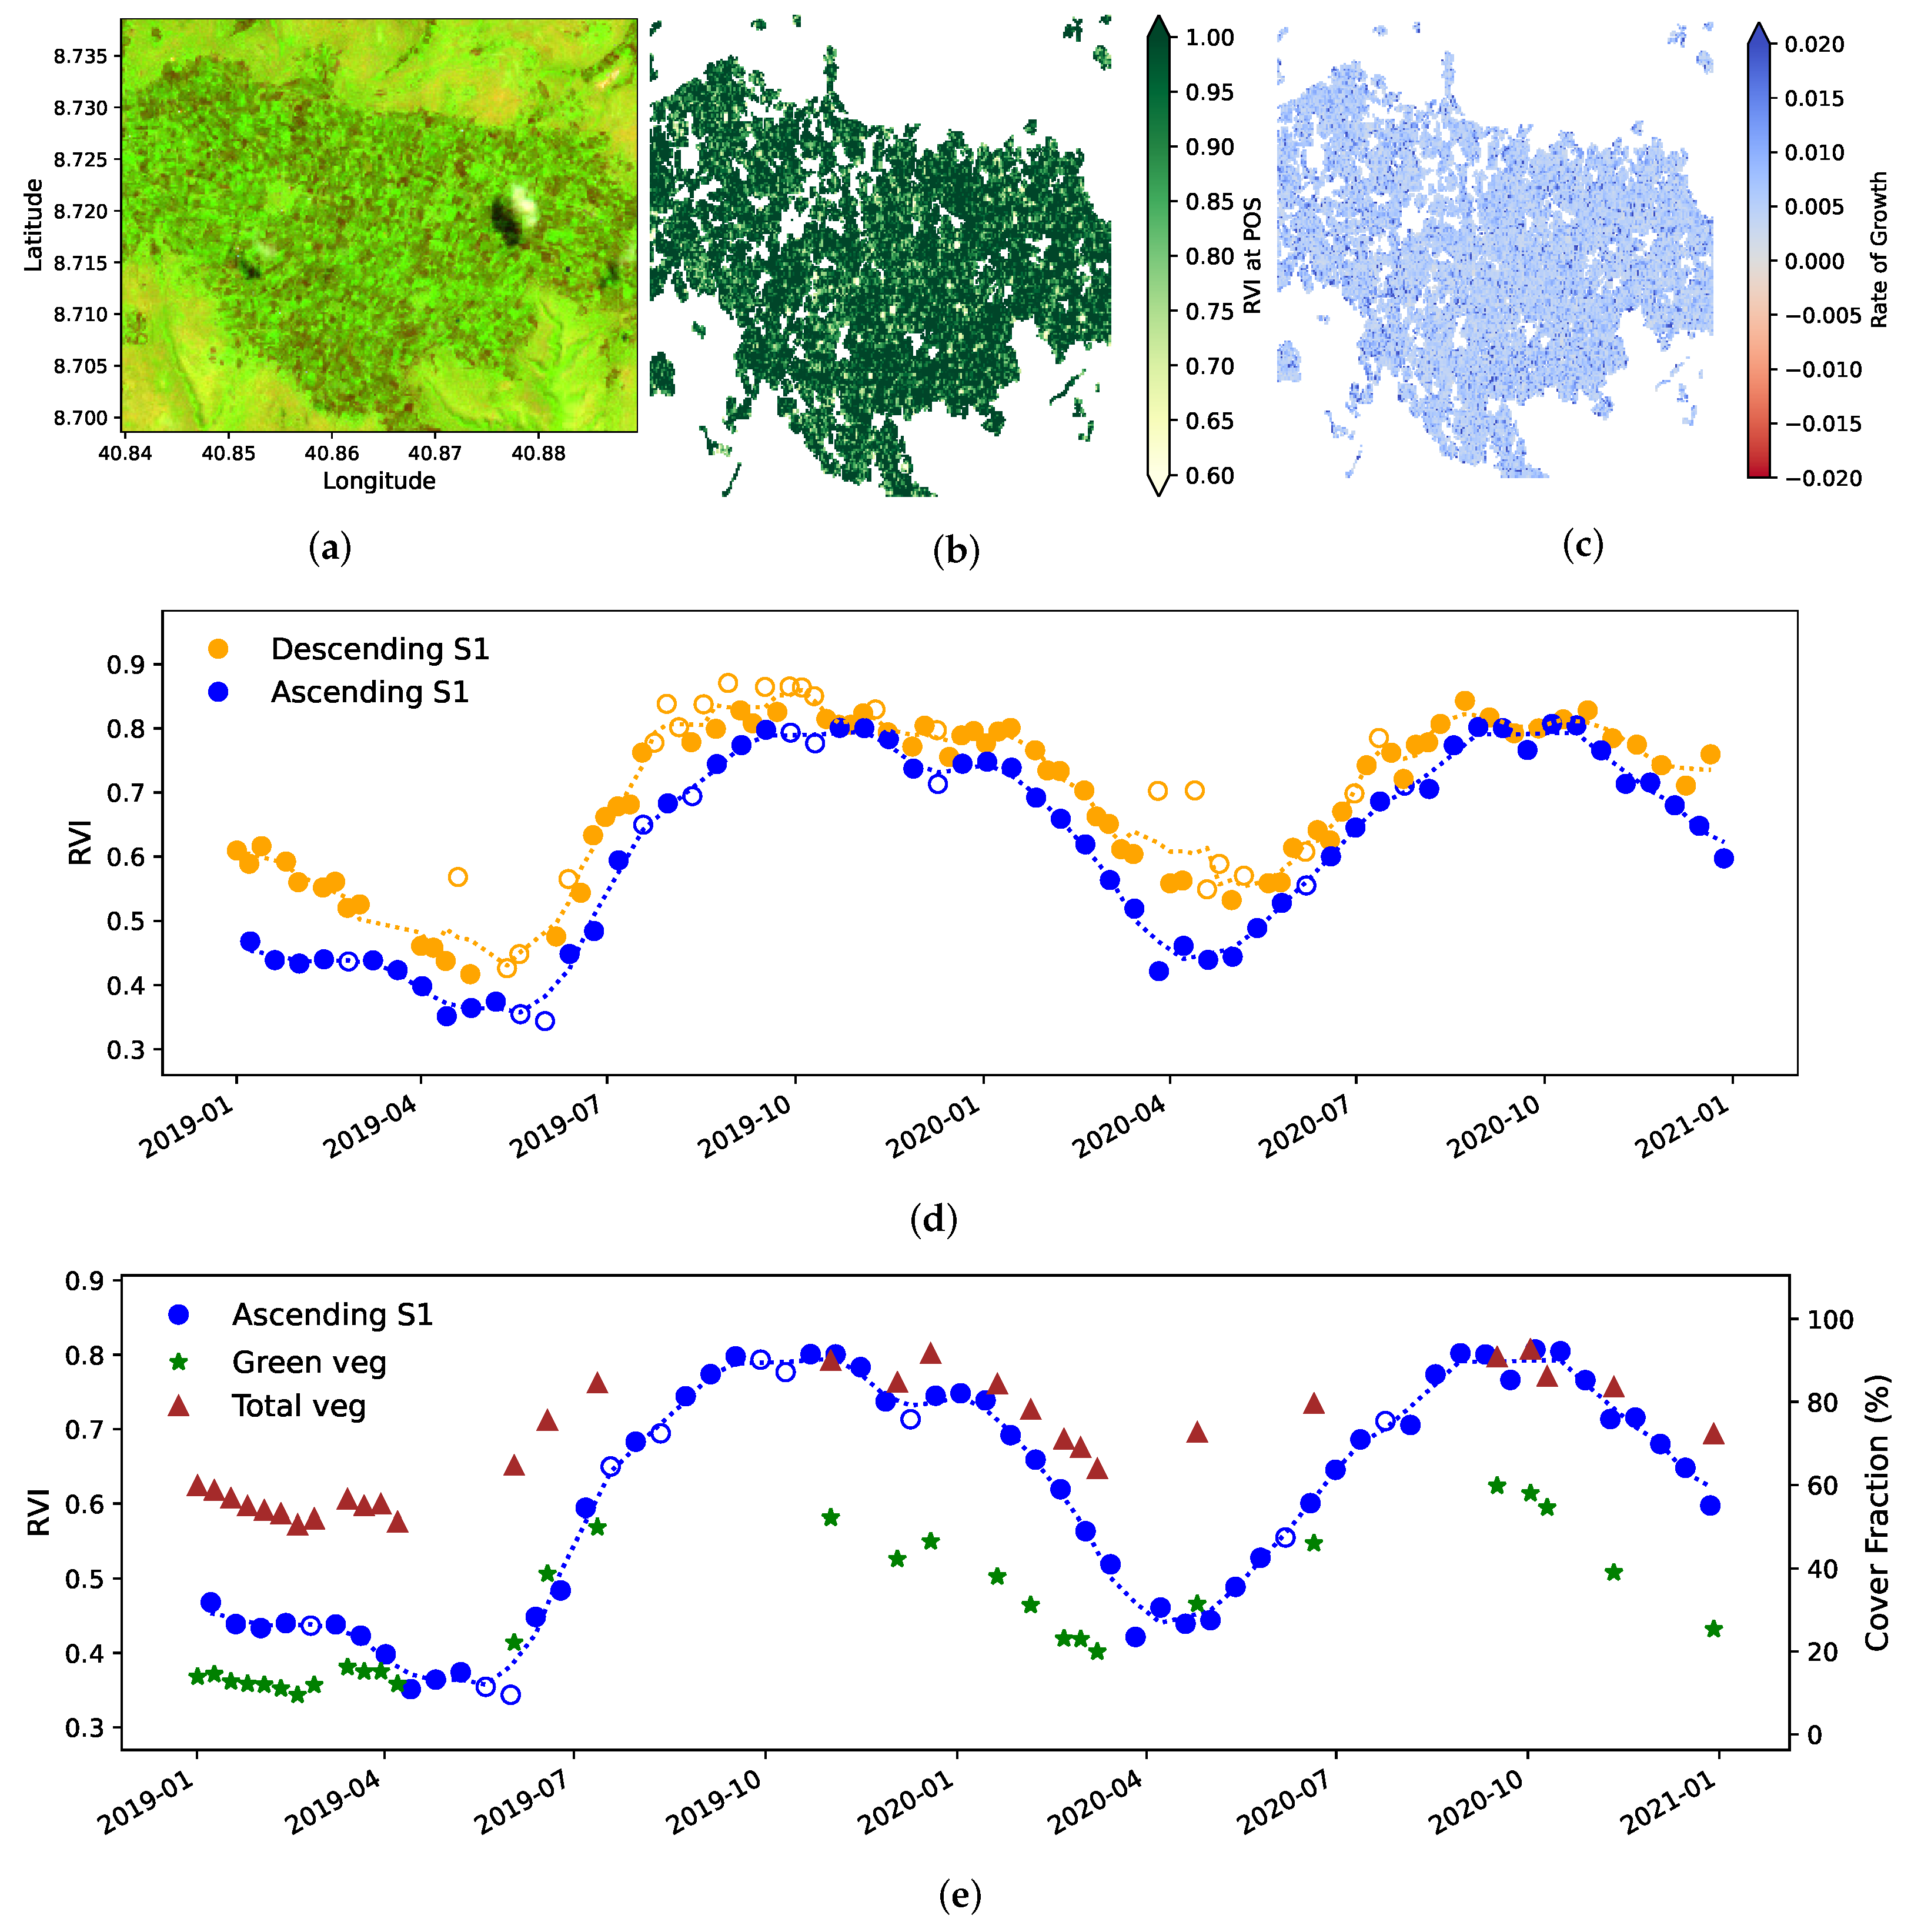
Understanding and monitoring water resources is of critical interest to Africa and mapping water features is one of the most popular applications of SAR. A flat water surface reflects radar signals away from the sensor and results in low backscatter that can be relatively easily identified. SAR’s ability to detect water through clouds makes it critical for flood mapping and is useful for monitoring water through seasons.
Figure 4 shows how Sentinel-1 is used to map open water along the Buba river in the southern part of the Lagoas de Cufada Natural Park in coastal Guinea-Bissau. A total of 30 Sentinel-1 images from 2020 cover this entire area. Thresholding is applied on VH backscatter images that are Lee filtered with a window size of 7 and converted to decibel. Threshold value of 24.05 dB is determined using the threshold_minumum function implemented in skimage Python package. This method computes the histogram for all backscatter values, smooths it until there are only two maxima, and then defines the threshold by finding the minimum value between these two.
The water extent is observed to fluctuate and the pattern matches well with that of the tide height calculated for the river mouth using OTPS TPXO8 tidal model [14]. These SAR observations are acquired at different times and tide heights compared to optical observations by Landsat and Sentinel-2, therefore may provide complementary measurements to map the coastline and its changes [15]. For the tropical region, SAR may be the only reliable data to consistently monitor the coastline.
When the images are compared at a different water height and extent, distinct features can be identified along the river. Specifically, high VV backscatter is observed along the river during low tide (shown as red in Figure 4c), indicating possible double bounce due to standing vegetation above water surface. These features and the temporal changes can potentially be used to map mangrove and understand dynamic inland wetland systems.

4.2. Crop Phenology

Food insecurity is another important issue DE Africa aims to address. SAR backscatter is useful for monitoring crops as the plant structure and leaf geometry change through different growth stages. For regions with frequent cloud cover, Sentinel-1 is the only sensor that can provide free and regular observations that are required for early identification of crop failure and allow farmers to respond quickly. For other regions where optical multi-spectral time series are available, Sentinel-1 measures different properties related to crop structure, therefore providing extra information on the crop status.
In Figure 5, Sentinel-1 is used to map crop phenology in an area in Western Hararghe, Ethiopia. We have used the DE Africa provisional cropland extent map [16] for 2019 to limit the analysis to within the cropped area. No speckle filter is applied because for most part of the analysis, backscatter values are averaged over the cropped area. A total of 61 ascending and 95 descending Sentinel-1 observations from 2019 to 2020 are used. RVI is calculated following [13]. The median local incidence angles for the ascending and descending passes are 33 and 42 degree respectively, resulting in an offset between RVI measured from different orbit directions. Nevertheless, the growth seasons are well-mapped in either direction (Figure 5d). To understand potential impact of rain interception or increased surface wetness [17], ERA5 reanalysis hourly precipitation data are retrieved from public AWS S3 storage (https://registry.opendata.aws/ecmwf-era5/, accessed on 6 January 2022) and used to mark observations with more than 2 mm of rainfall in the preceding 12 h. While individual backscatter measurements are affected, the RVI values appear to be robust especially during peak growth when scattering by plant canopy dominates.
We further compare the Sentinel-1 RVI to the fractional cover [18] service provided by DE Africa. This service provides estimates of the proportions of green vegetation, non-green vegetation (including deciduous trees during autumn, dry grass, etc.), and bare soils for every Landsat pixel. During the two-year period, 30 out of the 91 Landsat 7 and 8 observations have less than 10% cloud cover. Figure 5e shows that the trend observed by Sentinel-1 RVI matches well with the trend of total vegetation cover estimated from Landsat while the green vegetation fraction enters senescence quickly following the first peak.

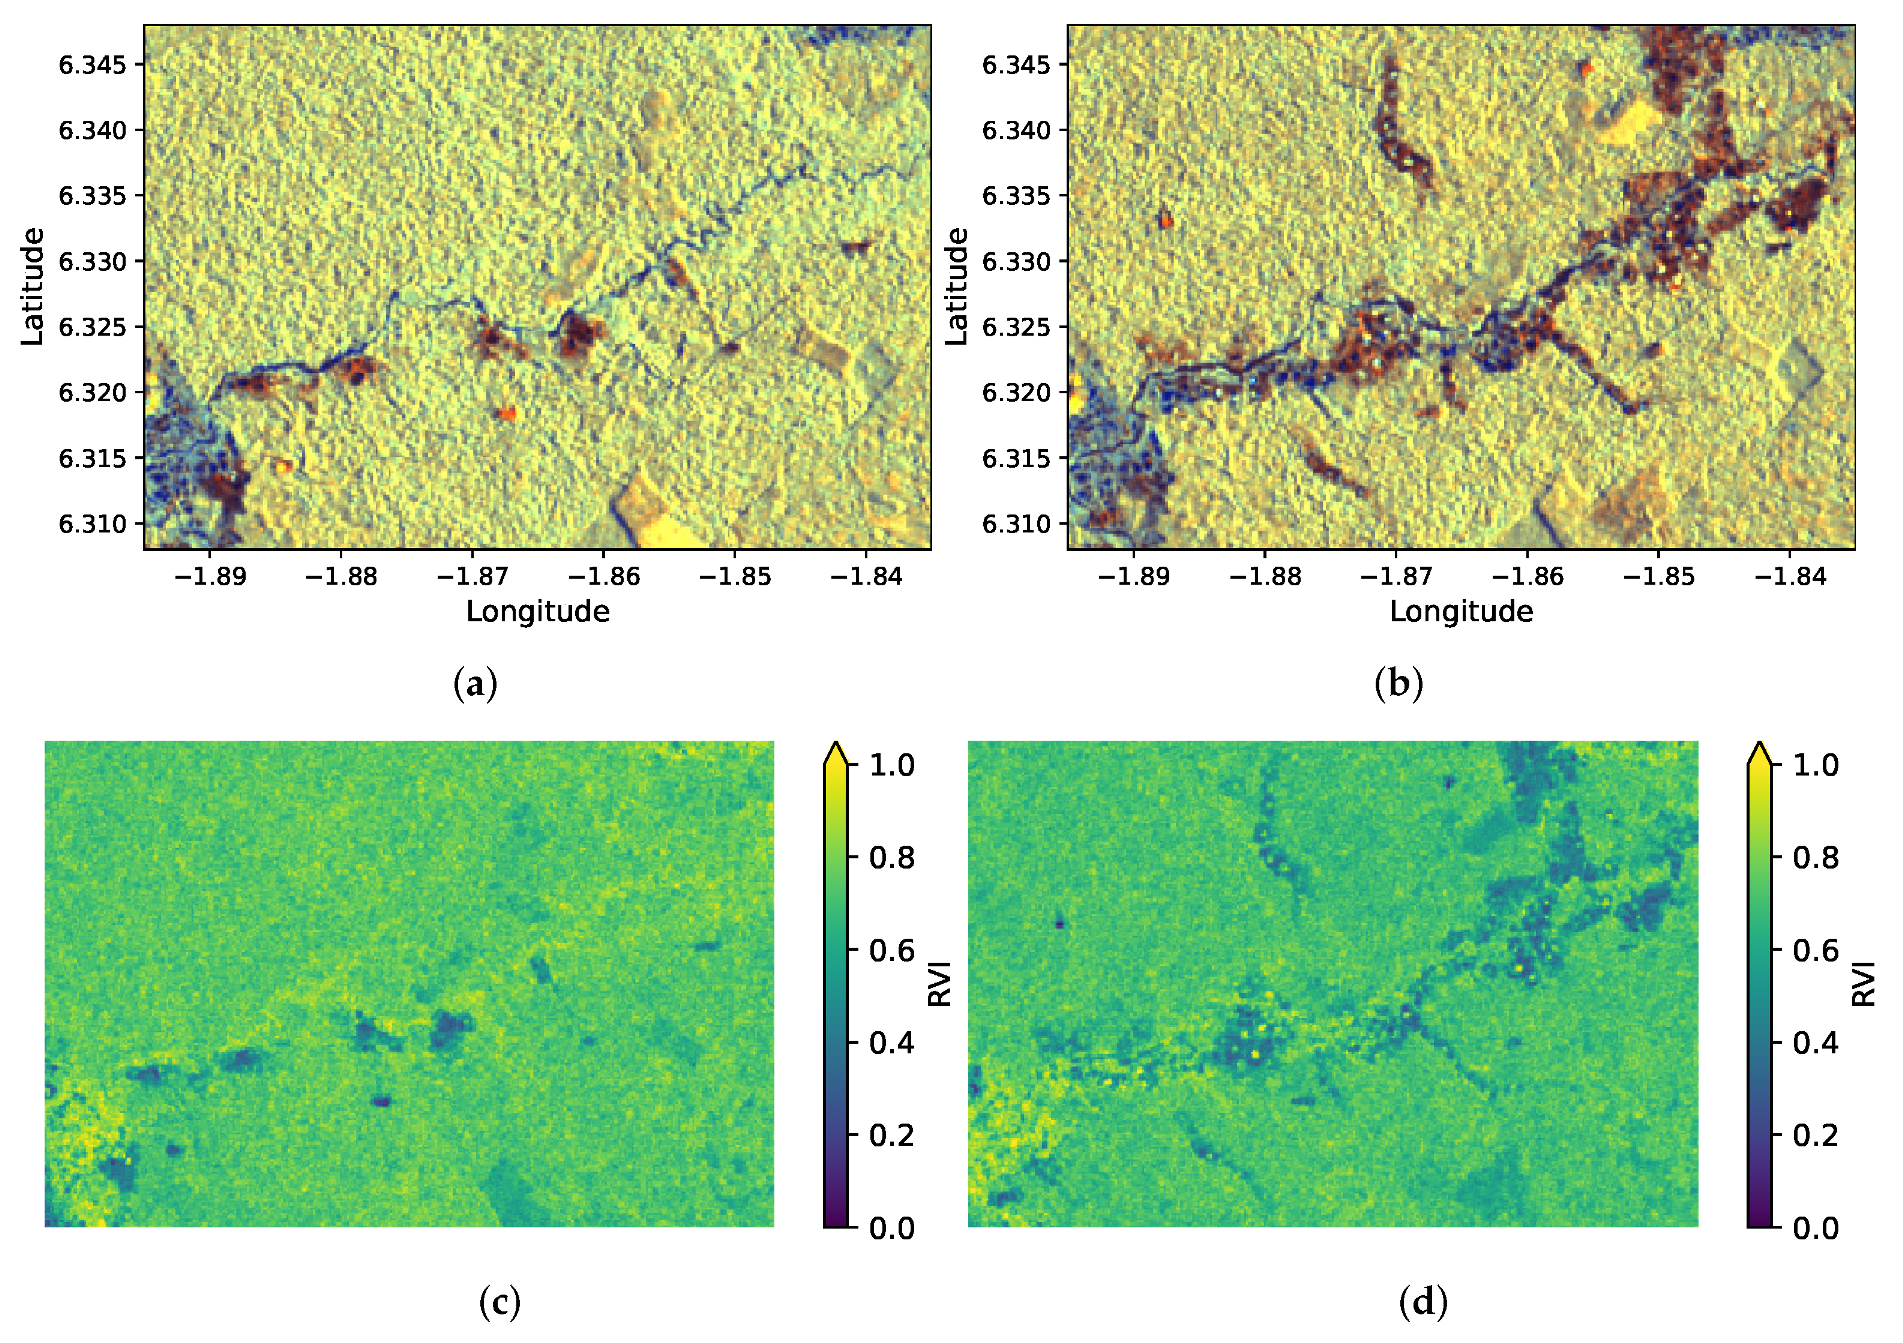
4.3. Forest Monitoring

In Figure 6, Sentinel-1 backscatter from 2018 and 2020 are compared to map deforestation in the Apamprama forest reserve in Ghana. The changes are clearly visible in the median composites (Figure 6a,b) and median RVI images (Figure 6c,d). Most of this deforestation is due to unregulated mining activities. Further analysis incorporating surface water detection can be used to locate potential mining sites and it is estimated that significant economic benefits can be realized if DE Africa can help to prevent a fraction of the unregulated mining activities [19].
In addition, limiting deforestation and promoting afforestation and reforestation are two of the most important carbon emission mitigation activities. Sentinel-1 ARD has the potential to play a key role in monitoring forest cover in Africa.

5. Conclusions

The DE Africa Sentinel-1 NRB dataset is the first open and free SAR time series ARD covering all of Africa. Together with other complementary datasets, this SAR ARD allows DE Africa to offer comprehensive monitoring capability for a range of climate zones and, therefore, deliver on its mission across the continent.
Collaboration between DE Africa, Sinergise, and the CEOS SEO has brought different expertise together to ensure a clear outcome is defined, data are processed and delivered efficiently, and development is aligned with the CEOS CARD4L initiative. We believe access to this new ARD is a critical step towards further adoption of SAR and will help unlock the potential of SAR data for Africa and the world.
Visualization through the DE Africa map has been essential for promoting this new dataset to a wide range of users. No prior knowledge of SAR is needed to access the images. Even though images are not de-speckled and can appear noisy when zoomed in, the value of SAR can be appreciated from the clearly distinguishable land cover features in the false color composites. Access to additional information, such as side-by-side comparisons with optical and other data sets in DE Africa, also help non-expert users interpret SAR data. We are already seeing a growing interest for this dataset, although significant effort is still required due to scarcity of SAR expertise.
The DE Africa Sandbox offers further education opportunities for SAR. To assist beginner DE Africa users, example open source scripts and Python notebooks are developed and made available in the Sandbox. Tutorials and training materials are made available for self-paced and guided learning. A number of analysis examples using SAR data are already available in the notebook repository and more scripts are being actively developed.
Further capacity building through the DE Africa program and its partners across Africa will help increase the number of SAR users with growing expertise in the continent. When more SAR ARD and other interoperable datasets become available worldwide, a broader community will benefit and the development and implementation of new algorithms and methods will be accelerated.

Author Contributions

Writing—original draft preparation, F.Y.; writing—review and editing, M.R., A.L. (Alex Leith), A.R., N.F.M., C.B. and A.L. (Adam Lewis); conceptualization, A.L. (Adam Lewis), F.Y. and G.M.; methodology, M.R., A.R., F.Y., A.L. (Alex Leith) and G.M.; software, M.R., A.L. (Alex Leith) and T.D.; validation, M.R., F.Y. and A.R.; formal analysis, F.Y., N.F.M. and C.B.; supervision, A.L. (Adam Lewis); project administration, L.H., F.Y., A.L. (Alex Leith) and C.J. All authors have read and agreed to the published version of the manuscript.

Funding

Digital Earth Africa is funded by the Leona M. and Harry B. Helmsley Charitable Trust and the Australian Government.

Data Availability Statement

The Sentinel-1 ARD presented is publicly available from AWS (https://registry.opendata.aws/deafrica-sentinel-1/, accessed on 6 January 2022) and can be accessed through the Digital Earth Africa platform.

Acknowledgments

The authors would like to thank David Small for the discussion on the RTC method. We would like to thank the two anonymous reviewers for providing constructive feedback on the paper.

Conflicts of Interest

The authors declare no conflict of interest.

References

  1. Yuan, F.; Lewis, A.; Leith, A.; Dhar, T.; Gavin, D. Analysis Ready Data for Africa. In Proceedings of the 2021 IEEE International Geoscience and Remote Sensing Symposium IGARSS, Brussels, Belgium, 11–16 July 2021; pp. 1789–1791. [Google Scholar] [CrossRef]
  2. Ticehurst, C.; Zhou, Z.S.; Lehmann, E.; Yuan, F.; Thankappan, M.; Rosenqvist, A.; Lewis, B.; Paget, M. Building a SAR-Enabled Data Cube Capability in Australia Using SAR Analysis Ready Data. Data 2019, 4, 100. [Google Scholar] [CrossRef] [Green Version]
  3. Committee on Earth Observation Satellites, Analysis Ready Data for Land, Product Family Specification: Normalised Radar Backscatter (NRB) v5.5, CEOS, October 2021. Available online: https://ceos.org/ard/files/PFS/NRB/v5.5/CARD4L-PFS_NRB_v5.5.pdf (accessed on 6 January 2022).
  4. Dyke, G.; Rosenqvist, A.; Killough, B.; Yuan, F. Intercomparison of Sentinel-1 Datasets from Google Earth Engine and the Sinergise Sentinel Hub Card4L Tool. In Proceedings of the 2021 IEEE International Geoscience and Remote Sensing Symposium IGARSS, Brussels, Belgium, 11–16 July 2021; pp. 1796–1799. [Google Scholar] [CrossRef]
  5. Mullissa, A.; Vollrath, A.; Odongo-Braun, C.; Slagter, B.; Balling, J.; Gou, Y.; Gorelick, N.; Reiche, J. Sentinel-1 SAR Backscatter Analysis Ready Data Preparation in Google Earth Engine. Remote Sens. 2021, 13, 1954. [Google Scholar] [CrossRef]
  6. Copernicus DEM-Global and European Digital Elevation Model (COP-DEM). Available online: https://spacedata.copernicus.eu/web/cscda/dataset-details?articleId=394198 (accessed on 6 January 2022).
  7. Small, D. Flattening Gamma: Radiometric Terrain Correction for SAR Imagery. IEEE Trans. Geosci. Remote Sens. 2011, 49, 3081–3093. [Google Scholar] [CrossRef]
  8. Truckenbrodt, J.; Freemantle, T.; Williams, C.; Jones, T.; Small, D.; Dubois, C.; Thiel, C.; Rossi, C.; Syriou, A.; Giuliani, G. Towards Sentinel-1 SAR Analysis-Ready Data: A Best Practices Assessment on Preparing Backscatter Data for the Cube. Data 2019, 4, 93. [Google Scholar] [CrossRef] [Green Version]
  9. Small, D. SAR backscatter multitemporal compositing via local resolution weighting. In Proceedings of the 2012 IEEE International Geoscience and Remote Sensing Symposium, Munich, Germany, 22–27 July 2012; pp. 4521–4524. [Google Scholar] [CrossRef] [Green Version]
  10. Garthwaite, M.C.; Hazelwood, M.; Nancarrow, S.; Hislop, A.; Dawson, J.H. A regional geodetic network to monitor ground surface response to resource extraction in the northern Surat Basin, Queensland. Aust. J. Earth Sci. 2015, 62, 469–477. [Google Scholar] [CrossRef]
  11. Fuhrmann, T.; Batchelor, J.; McCall, T.; Garthwaite, M. Positions and Orientations for the Queensland Corner Reflector Array, Australia: Report on Geodetic Surveys Conducted in May and June 2018; RECORD 2020/034; Geoscience Australia: Canberra, Australia, 2020. [Google Scholar] [CrossRef]
  12. Schmidt, K.; Reimann, J.; Tous Ramon, N.; Schwerdt, M. Geometric Accuracy of Sentinel-1A and 1B Derived from SAR Raw Data with GPS Surveyed Corner Reflector Positions. Remote Sens. 2018, 10, 523. [Google Scholar] [CrossRef] [Green Version]
  13. Nasirzadehdizaji, R.; Balik Sanli, F.; Abdikan, S.; Cakir, Z.; Sekertekin, A.; Ustuner, M. Sensitivity Analysis of Multi-Temporal Sentinel-1 SAR Parameters to Crop Height and Canopy Coverage. Appl. Sci. 2019, 9, 655. [Google Scholar] [CrossRef] [Green Version]
  14. Egbert, G.D.; Erofeeva, S.Y. Efficient Inverse Modeling of Barotropic Ocean Tides. J. Atmos. Ocean. Technol. 2002, 19, 183–204. [Google Scholar] [CrossRef] [Green Version]
  15. Bishop-Taylor, R.; Nanson, R.; Sagar, S.; Lymburner, L. Mapping Australia’s dynamic coastline at mean sea level using three decades of Landsat imagery. Remote Sens. Environ. 2021, 267, 112734. [Google Scholar] [CrossRef]
  16. Burton, C.; Yuan, F.; Chong, E.; Halabisky, M.; Ongo, D.; Mar, F.; Addabor, V.; Mamane, B.; Adimou, S. Co-Production of a 10m Cropland Extent Map for Continental Africa using Sentinel-2, Cloud Computing, and the Open Data Cube. In Proceedings of the American Geophysical Union Fall Meeting 2021, New Orleans, LA, USA, 13–17 December 2021. [Google Scholar] [CrossRef]
  17. Benninga, H.J.; van der Velde, R.; Su, Z. Impacts of Radiometric Uncertainty and Weather-Related Surface Conditions on Soil Moisture Retrievals with Sentinel-1. Remote Sens. 2019, 11, 2025. [Google Scholar] [CrossRef] [Green Version]
  18. Scarth, P.; Röder, A.; Schmidt, M.; Denham, R. Tracking grazing pressure and climate interaction-the role of Landsat fractional cover in time series analysis. In Proceedings of the 15th Australasian Remote Sensing and Photogrammetry Conference, Alice Springs, Australia, 13–17 September 2010; Volume 13. [Google Scholar]
  19. Unlocking the Potential of Earth Observation to Address Africa’s Critical Challenges. 2021. Available online: https://www.weforum.org/reports/unlocking-the-potential-of-earth-observation-to-address-africa-s-critical-challenges (accessed on 6 January 2022).
Figure 1. Results of radiometric terrain correction for selected locations in Africa, using the workflow described in this paper implemented in Sentinel Hub and visualized in EO Browser. (a) Sentinel-1 VV backscatter for the Ngambe mountain region in Cameroon, orthorectified but without RTC. (b) Corresponding Sentinel-1 VV backscatter with RTC. (c) Sentinel-1 VV backscatter over Arsi, Ethiopia, orthorectified, but without RTC. (d) Corresponding Sentinel-1 VV backscatter, with RTC.
Remotesensing 14 00351 g001
Figure 2. Example output data, metadata and ancillary information for an area with steep terrain (Monte Toc, Italy): (a) local incidence angle for descending pass. (b) Scattering area for descending pass. (c) γ r t c 0 in VV for descending pass, where pixels affected by radar shadow are masked out. (d) Local incidence angle for ascending pass. (e) Scattering area for ascending pass. (f) γ r t c 0 in VV for ascending pass, where pixels affected by radar shadow are masked out. (g) Elevation from Copernicus DEM. (h) Difference between VV backscatter measured in descending and ascending passes. (i) Local resolution weighted average of VV backscatter from the descending and ascending passes. These scenes have dual-polarization, so backscatter images in VH are also available, but not shown here.
Remotesensing 14 00351 g002
Figure 3. Screen capture of DE Africa map showing Sentinel-1 false color composite (as detailed in Section 3.3) for an area around Lagos, Nigeria, as observed in January 2021. In addition to the black and dark blue water, light yellow and green vegetation and bright yellow and orange urban areas, boats, and ships are clearly identifiable against the dark ocean near the busy port.
Remotesensing 14 00351 g003
Figure 4. Using Sentinel-1 to map water along Buba river in the southern part of the Lagoas de Cufada Natural Park in coastal Guinea-Bissau. (a) Sentinel-2 true color image of the area in March 2020. (b) Sentinel-1 false color composite (using scaling described in Section 3.3) when the largest water extent is observed on 4 February, 2020. (c) Sentinel-1 false color composite when the smallest water extent is observed on 11 March, 2020. Buba city is visible on the eastern end of the river in the optical image in light brown and in the SAR images in bright yellow and orange. (d) The extent of the water area mapped by Sentinel-1 over the year 2020. (e) Frequency of water observations for this area over the year 2020.
Remotesensing 14 00351 g004
Figure 5. Using Sentinel-1 to map crop phenology in Western Hararghe, Ethiopia. (a) Sentinel-2 false color image, with B11 (SWIR), B08 (NIR), and B03 (Green) as RGB, for the area in July 2020. This is the least cloudy image available from May to September 2020. (b) Sentinel-1 RVI within the cropped area at the peak of the growth season in 2020. (c) Sentinel-1 measured rate of growth within the cropped area in 2020. (d) Average Sentinel-1 RVI within the cropped area during 2019 and 2020. Sentinel-1 observations where the total rainfall in the preceding 12 h exceeds 2 mm are plotted as open circles. The dotted line is obtained by taking a three-point rolling average over all Sentinel-1 measurements. (e) Average Sentinel-1 RVI within the cropped area measured in an ascending pass compared to green and total vegetation fractions estimated from Landsat images with less than 10% cloud cover.
Remotesensing 14 00351 g005
Figure 6. Mapping deforestation using Sentinel-1 in the Apamprama forest reserve in Ghana. (a) Median composite (false color using scaling described in Section 3.3) generated using 61 Sentinel-1 acquisitions from July to December 2018. (b) Median composite generated using 62 Sentinel-1 acquisitions from July to December 2020. (c) Median Sentinel-1 RVI from July to December 2018, where low RVI values are shown in purple and blue and high RVI values are shown in green and yellow. (d) Median Sentinel-1 RVI from July to December 2020, presented in the same color map as used in (c).
Remotesensing 14 00351 g006
Table 1. DE Africa Sentinel-1 backscatter product specifications.
Centre frequency5.405 GHz (C-band)
Acquisition modeInterferometric Wide swath (IW)
PolarizationVV + VH
Coordinate reference systemWGS 84 (EPSG:4326)
Tile size 1 × 1
Pixel spacing 0 . 0002 (≈22.2 m at the Equator)
Pixel grid origin 0 l a t i t u d e , 0 l o n g i t u d e
Table 2. Geometric accuracy estimated using the Queensland corner reflector array, Australia.
DimensionALE (m)RMSE (m)
Latitude 0.21 ± 0.53 0.57
Longitude 4.37 ± 0.50 4.39
Combined 4.40 ± 0.49 4.43
Publisher’s Note: MDPI stays neutral with regard to jurisdictional claims in published maps and institutional affiliations.

