Article

Analysis-Ready Data from Hyperspectral Sensors—The Design of the EnMAP CARD4L-SR Data Product

1
German Aerospace Center (DLR), Earth Observation Center, Remote Sensing Data Center, Oberpfaffenhofen, 82234 Wessling, Germany
2
German Aerospace Center (DLR), Earth Observation Center, Remote Sensing Technology Institute, Oberpfaffenhofen, 82234 Wessling, Germany
*
Author to whom correspondence should be addressed.
Remote Sens. 2021, 13(22), 4536; https://doi.org/10.3390/rs13224536
Submission received: 29 September 2021 / Revised: 5 November 2021 / Accepted: 8 November 2021 / Published: 11 November 2021
(This article belongs to the Special Issue Sentinel Analysis Ready Data (Sentinel ARD))

Abstract

:
Today, the ground segments of the Landsat and Sentinel missions provide a wealth of well-calibrated, characterized datasets which are already orthorectified and corrected for atmospheric effects. Initiatives such as the CEOS Analysis Ready Data (ARD) propose and ensure guidelines and requirements so that such datasets can readily be used, and interoperability within and between missions is a given. With the increasing availability of data from operational and research-oriented spaceborne hyperspectral sensors such as EnMAP, DESIS and PRISMA, and in preparation for the upcoming global mapping missions CHIME and SBG, the provision of analysis ready hyperspectral data will also be of increasing interest. Within this article, the design of the EnMAP Level 2A Land product is illustrated, highlighting the necessary processing steps for CEOS Analysis Ready Data for Land (CARD4L) compliant data products. This includes an overview of the design of the metadata, quality layers and archiving workflows, the necessary processing chain (system correction, orthorectification and atmospheric correction), as well as the resulting challenges of this procedure. Thanks to this operational approach, the end user will be provided with ARD products including rich metadata and quality information, which can readily be integrated in analysis workflows, and combined with data from other sensors.

Graphical Abstract

1. Introduction

With the wide availability of massive optical Earth Observation (EO) data from the ESA Sentinels, the Landsat sensor series, and the increasing availability of spaceborne hyperspectral missions such as DESIS [1], PRISMA [2] and the upcoming EnMAP [3], CHIME [4] and SBG [5] missions, a challenging task is to make this wealth of EO data ready for analysis. For this purpose, the burden of data pre-processing including orthorectification as well as the compensation of atmospheric influences is now handled within the ground segments of the missions, ensuring a high-quality and consistent data processing over the sensor lifetime and beyond. To further support the interoperability of data between missions, initiatives such as the CEOS Analysis Ready Data for Land (CARD4L [6]), the FP7 EUFAR HYQUAPRO [7], IEEE P4001 and others have set up multiple requirements and guidelines.
In this paper, the design of the EnMAP Level 2A Land (L2A) data product is illustrated, describing the required pre-processing steps for the provision of CARD4L compliant data and metadata. In the following, first the mentioned initiatives towards standardized analysis ready data are presented, where particular focus is set on data from imaging spectrometers for land applications. Next, the methods and the design of the EnMAP processing chain are described, and finally the resulting L2A data product is specified. During all steps, the particular requirements for generating Analysis Ready Data (ARD) are highlighted as well as the links to other optical missions such as Sentinel-2 are discussed.

1.1. CEOS CARD4L

A high-level approach to achieve interoperability of data products over time and with data products from other missions is the CEOS Analysis Ready Data for Land (CARD4L) initiative. To quote the CARD4L Description Document [6], “CEOS Analysis Ready Data for Land (CARD4L) are satellite data that have been processed to a minimum set of requirements and organized into a form that allows immediate analysis with a minimum of additional user effort and interoperability both through time and with other datasets.” Currently, CEOS CARD4L provides product family specifications (PFS) for optical data (surface reflectance and surface temperature products) as well as radar data (normalized radar backscatter and polarimetric radar products). Additionally, a data cube architecture is under development which allows the immediate integration of any CARD4L datasets. In order to achieve this goal, requirements exist in the categories of general metadata, quality metadata, radiometric calibration and geometric calibration which are listed in the various product family specifications published at www.ceos.org/ard, accessed on 10 November 2021. For optical sensors, requirements also exist on solar and view angle correction and atmospheric correction, so that ARD Level 2A products (geo-referenced bottom of atmosphere reflectance (BOA_ref)) can be generated [8]. Hence, for EnMAP data products the Surface Reflectance (CARD4L-SR, [9]) is the relevant product family specification, which includes items on the general metadata (e.g., traceability, algorithms and auxiliary data, overall data quality), items on per-pixel metadata (e.g., masks for clouds, land, water and saturated pixels), items on the radiometric and atmospheric corrections (e.g., on water vapor and ozone corrections), and items on the geometric correction and the resulting geolocation accuracy. The self-assessment for the EnMAP L2A product was submitted to CEOS and is currently (10 November 2021) still in peer review (see www.ceos.org/ard, accessed on 10 November 2021). The full list of CARD4L requirements as well as the details of the self-assessment are provided as Supplemental Material.

1.2. EUFAR HYQUAPRO

An earlier initiative towards ARD was developed within the FP7 Project EUFAR (EUropean Facility for Airborne Research, www.eufar.net, accessed on 10 November 2021, see [7]). Dedicated to hyperspectral data from airborne sensors, this joint research was conducted by 9 European data providers. The research objective was to develop quality indicators and quality layers for airborne hyperspectral imagery and data products, which also included a joint and harmonized data format and metadata standards [10,11]. The outcomes of the uncertainty estimation approach resulted in a number of publication such as [12] addressing the expected uncertainty of EnMAP L2A data, in [13] for the uncertainty in Aerosol Optical Density retrieval using APEX as well as the APEX instrument calibration uncertainty in [14]. Other approaches for the estimation of uncertainty in hyperspectral datasets can be found in [15].
As per-pixel information, a minimum set of nine quality layers was identified by the HYQUAPRO data providers, see Table 1. In addition to the quality layers, a common set of 28 parameters for data description has been agreed. The metadata regulations published by the INSPIRE Directive (COMMISSION REGULATION (EC) No 1205/2008, PART B) served as a starting point (see Table 2) and were expanded by additional metadata (see Table 3). Another aspect to provide ARD is that the file formats are also harmonized. Within EUFAR, airborne hyperspectral data cubes and metadata are provided as an HDF5 container format.

1.3. IEEE P4001

Additionally of interest for the interoperability of imaging spectrometers is the IEEE P4001 initiative [16], working on a “Standard for Characterization and Calibration of Ultraviolet through Shortwave Infrared (250 nm to 2500 nm) Hyperspectral Imaging Devices”. While this initiative is mainly aimed at parameters characterizing the hyperspectral camera systems, the outcome of this standardization initiative is also relevant for data products from spaceborne hyperspectral missions. For example, the standard includes identifiers for the proper documentation of spectral (e.g., band center wavelengths, widths of the band spectral response function), spatial (e.g., the geometric sensor model and spatial binning factor), temporal (e.g., frame period) and radiometric properties (e.g., dynamic range, noise equivalent spectral radiance) within the data product metadata. Furthermore, the proper specification of the data format (e.g., encoding type) as well as parameters of data quality (e.g., saturation handling, bad pixel maps) are covered.

2. The EnMAP Approach for Generating Conforming CEOS CARD4L Products

Building on the outcomes of HYQUAPRO which were implemented in DLR’s processing chain for airborne sensors (e.g., [17]), the EnMAP metadata and product model are designed to achieve ARD, as defined by [6,18]. Within this chapter, the methods and design issues are described which are necessary to achieve this goal. This includes the procedures for:
  • systematic correction and calibration to SI units;
  • clipping and tiling of datatakes into smaller subsets;
  • orthorectification, including co-registration to a Sentinel-2 global master image;
  • atmospheric correction resulting in BOA reflectance;
  • provision of per-pixel masks for all data defects as well as clouds;
  • provision of rich metadata describing the processing and the resulting data quality.
to generate a complete Level 2A product which is ready for analysis.

2.1. Overview of the EnMAP Mission

The Environmental Mapping and Analysis Program (EnMAP, www.enmap.org, accessed on 10 November 2021) is a spaceborne imaging spectroscopy mission under development and planned for launch in the first half-year of 2022 with an operational lifetime of 5 years [3,19]. The Space Agency of the German Aerospace Center (DLR) covers the mission management, and DLR’S Earth Observation Center (EOC) together with the German Space Operations Center (GSOC) are responsible for establishing and operating the ground segment [20].
As the Science PI, the German Research Center for Geosciences (GFZ) is responsible for the science segment including an independent product validation [21]. The OHB System AG is in charge of realising the space segment.
The spectral range of EnMAP covers 420 nm to 2450 nm and comprises of 262 spectral bands in total, but not all are provided to the user. The EnMAP system design is based on a prism-based dual-spectrometer; the VNIR (Visible and Near Infrared) spectrometer covers the spectral range from 420 nm to 1000 nm with a spectral sampling distance between 4.8 nm and 8.2 nm. The SWIR (Shortwave Infrared) spectrometer covers the spectral range from 900 nm to 2450 nm with a spectral sampling distance between 7.4 nm and 12.0 nm. For both cameras, the spectral resolution is about a factor of 1.2 larger than the spectral sampling distance [22]. The target signal-to-noise ratio (SNR) is 500:1 at 495 nm and 150:1 at 2200 nm (at reference radiance level representing 30% surface albedo, 30 Sun zenith angle, ground at sea level, and 40 km visibility with rural atmosphere). In order to have a large dynamic range, the signal is fed to two parallel amplifiers with different gains for each of the two detectors. For the VNIR, an automatic gain switching is applied, and a fixed gain setting for the SWIR. The resulting radiometric resolution is 14 bits. The absolute radiometric calibration is based on Sun calibration measurements with a full-aperture diffuser. The relative calibration is based on an on-board integrating sphere coated with Spectralon and illuminated with a white LED (light emitting diode) and a Tungsten halogen lamp. A second doped Spectralon sphere enables a spectral accuracy of better than 0.5 nm in VNIR and 1.0 nm in SWIR. Additional measurements looking into deep space for monitoring shutter thermal emission and closed shutter measurements before and after each observation for subtraction of dark signal complement the calibration. Using these procedures, the target radiometric accuracy is better than 5% [23].
Regarding the geometrical aspects of EnMAP data, each detector array has 1000 valid pixels in spatial direction with an instantaneous field-of-view (IFOV) of 9.5 arcsec. Thereby, a geometric resolution of 30 m × 30 m and a swath width (across-track) of 30 km is realized. A swath length (along-track) of 5000 km can be acquired per day and an across-track tilt capability of 30 enables a target revisit time of less than 4 days. It is important to note that the VNIR and SWIR detector arrays are not spatially aligned, consequently there is a shift of approximately 190 arcsec along track which corresponds to approximately 600 m on ground. As detailed in Section 2.4, the data products have a geolocation accuracy of 30 m with respect to a reference image based on selected Sentinel-2 Level 1C products having an absolute geolocation accuracy of 12.5 m [24].
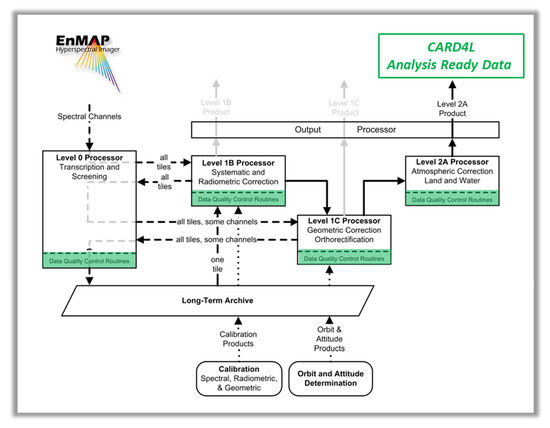
The fully-automatic processing chain generates image products at three levels and to a user selected format (image data in BSQ, BIL, BIP, JPEG2000, or GeoTIFF and metadata in XML) which are disseminated through web-based interfaces [25], see Section 2.6. Level 1B (L1B) products (Section 2.2 and Section 2.3) are corrected to Top-of-Atmosphere (TOA) radiances including defective pixel flagging, non-linearity correction, dark signal (and digital offset) correction, gain matching, straylight correction, radiometric/spectral referencing, radiometric calibration, and spectral defective pixel interpolation. Level 1C (L1C) products (Section 2.4) are orthorectified to a user selected map projection (UTM, geographic, or European projection LAEA) and user selected resampling model (nearest neighbor, bi-linear interpolation, or cubic convolution). The physical sensor model is applied by the method of direct georeferencing with a correction of sensor interior orientation, satellite motion, light aberration and refraction, and terrain related distortions from raw imagery. Level 2A (L2A) (Section 2.5) products are compensated for atmospheric effects to Bottom-of-Atmosphere (BOA) reflectances with separate algorithms for land and water applications. Therefore, a classification (e.g., land-water-background, cloud), aerosol optical thickness and also columnar water vapor estimation is performed to obtain surface reflectances including adjacency correction. For the land case the units are expressed as remote sensing reflectance. For water bodies, as specified by the user, reflectances can be output either as normalized water leaving remote sensing reflectance or subsurface irradiance reflectance. For all processing levels the inclusion of procedures for generating per-pixel quality information and rich metadata is an integral part and was detailed during the evolution of the mission [26].
The expected image product quality is analyzed pre-launch using a simulation chain [27,28,29] to emulate input instrument data and the processing chain [25]. Both chains are independent of each other, and were continuously updated using the latest results of the instrument laboratory characterization. The calibration activities are complemented by data quality control [26] and by independent validation activities [21]. These activities are based on already established calibration/validation procedures, sites and networks such as AERONET [30], CEOS RadCalNet [31], pseudo invariant calibration sites (PICS) and products of other missions [32]. In addition, before launch, simulated EnMAP test data products are available at www.enmap.org, accessed on 10 November 2021.

2.2. Level 0 Processing and Related Metadata

The Level 0 processor is responsible for treating the downlinked data received by the ground stations and thereby putting together the raw image data of the cameras. In addition, the processor compiles an extensive set of both low- and high-level information, including instrument status, quality indicators as well as geometric, radiometric and atmospheric characteristics. The collection of high-level information is made possible by running the full processor chain (up to Level 2A) during Level 0 processing. Level 0 products therefore contain a rich body of metadata and quality layers. Note that only internal users have access to Level 0 products.
An Earth datatake in EnMAP consists of an Earth-looking phase of variable length encompassed by dark phases at the beginning and end of imaging. The Level 0 processor combines the dark phases into one single product called DC and splits the Earth-looking phase into tiles of 1024 frames with each tile corresponding to a so-called L0 product.
The components of an L0 product are depicted in Figure 1. The component L0-SPECTRAL-IMAGE provides the decompressed raw spectral image data for the Earth tile separately for VNIR and SWIR. Both spectral images are provided in digital numbers (DN) in BIL format with dimensions 1024 frames × 95 channels × 1024 pixels for VNIR and 1024 frames × 135 channels × 1024 pixels for SWIR, covering an area of approximately 30 km by 30 km on the ground. The spectral characterisation for each channel (namely, centre wavelength and full width half maximum) can be found in the accompanying L0 metadata. The virtual channels containing housekeeping data collected during the imaging of the Earth tile are saved in component L0-VC-DATA.
In addition, the extensive set of quality information collected during the temporary processing up to Level 2A is given in the dedicated L0-QL component. This component includes RGB quicklooks of the VNIR and SWIR spectral images in the product, quality layers (classes, clouds, cloud shadows, haze, cirrus, snow, quality test flags) and defective pixel masks for VNIR and SWIR. A detector map containing frame-averaged at-sensor radiances for each detector element is provided in component L0-DM for each camera. These files are a heritage from the quality control of airborne hyperspectral sensors [33] and are used for online and interactive quality checks for EnMAP and DESIS [26]. All files in L0-QL and L0-DM are provided in GeoTIFF format. Finally, the comprehensive array of Level 0 metadata is given in a dedicated XML file, while detailed history and log information regarding the processing up to L2A are also provided in XML format for documentation and troubleshooting of eventual problems. The full description of metadata and per-pixel quality information is provided in Section 3.1.

2.3. Level 1B Processing and Related Metadata

The aim of the Level 1B processor is to convert the Level 0 raw image data into at-sensor radiances by using the available calibration data of the instrument and in the process collect important quality indicators. The processor is divided in to two sub-processors: L1B_rad, responsible for radiometric calibration and quality control, and L1B_int, responsible for the interpolation of the defective pixels identified during L1B_rad as well as the correction of a pixel-wise spectral shift in the possible case of an occurring smile effect. As in Level 0, higher-level processing (up to Level 2A) is done during Level 1B in order to retrieve quality layers. The resulting L1B product is a fully calibrated and spectrally referenced radiometric product providing at-sensor radiances accompanied by comprehensive per-pixel quality indicators and high-level information. Unlike L0 products, L1B products are accessible to all users.
L1B_rad accepts as input the raw L0 product image data corresponding to an Earth tile and a set of calibration tables characterizing the EnMAP instrument at the time of imaging. The raw image pixels are then corrected for non-linearity, dark signal, digital offset, electronic offset, gain, response non-uniformity and straylight before applying channel-wise calibration coefficients to derive at-sensor radiances. Both raw and calibrated image data are controlled for quality and extensive quality layers and metadata are compiled. In particular, quality control identifies a mask of defective pixels which are marked for interpolation.
L1B_int then proceeds to the interpolation of the identified defective pixels. An accurate spectral interpolation in TOA radiance space is challenging due to many narrow spectral features caused by the non-blackbody nature of the solar irradiance (including Fraunhofer lines), as well as absorption in the Earth atmosphere. Therefore, the TOA radiances are converted to the spectrally smoother BOA reflectance by applying a simplified atmospheric correction, followed by a linear interpolation.
The interpolation process conditionally adapts to the image data condition, taking potential data losses into account. For the nominal case of non-consecutive band appearance of defective pixels, linear interpolation is performed in the spectral domain of the smooth BOA spectra. For occurrences of defective pixels in several consecutive bands or a local abundance of data loss, interpolation automatically switches to the spatial dimension.
Further, should the application of a spectral smile correction be identified as necessary during the mission, this process is also applied during L1B_int run time. Smile correction for EnMAP data is implemented in a two-fold approach: As a first step, during the simplified atmospheric correction applied in L1B_int, the pixel-wise spectral shifts are considered individually, estimating the according BOA reflectance for the particular shifted wavelength. This procedure is termed smile-aware atmospheric correction. In a second step, the non-nominal BOA reflectance values of each band are linearly interpolated to the mutual center wavelength value as defined by the nominal spectral calibration tables of the sensor.
Finally, an inversion of the atmospheric correction is applied to the defective pixel and smile corrected reflectances back to TOA radiances for L1B user output and subsequent L1C processing.
Figure 2 shows the components of an L1B product. The L1B at-sensor radiance data in units of W/m 2 /sr/nm are saved separately for VNIR and SWIR in the L1B-SPECTRAL-IMAGE component. The spectral images are provided in a format specified by the user (GeoTIFF, Envi binary BIL/BSQ/BIP or JPEG2000) with dimensions 1024 frames × 91 channels × 1000 pixels for VNIR and 1024 frames × 131 channels × 1000 pixels for SWIR (exact dimensions may change during the commissioning phase). The number of channels and pixels in the L1B products is smaller than in the L0 product (cf. Section 2.2), because the extremities of the detectors are not illuminated. These dark channels and pixels are removed during L1B processing. The spectral characterisation for each channel (namely, centre wavelength and full width half maximum) can be found in the accompanying L1B metadata. Note that the two spectral images are in sensor geometry and do not correspond to the same footprint on the ground. The merging and geometric correction of the image cubes is performed during Level 1C processing. The component L1B-QL contains all the quality information gathered during Level 1B processing, including RGB quicklooks for VNIR and SWIR, quality layers (classes, clouds, cloud shadows, haze, cirrus, snow, quality test flags for VNIR and SWIR) and defective pixel masks for VNIR and SWIR. All files in this component are provided in GeoTIFF format. The full Level 1B metadata is documented in XML format. Lastly, history and log information regarding the processing are given in XML format in dedicated components, but these are not delivered to the user.

2.4. Level 1C Processing and Related Metadata

In the L1C processing, direct georeferencing is used to orthorectify the L1B image data of both VNIR and SWIR sensors, resulting in a single spectral cube (see Figure 3). For this purpose, the physical sensor model and the measured AOCS data (orbit and attitude) are applied [34]. The user can choose between the map projections UTM, Geographic and LAEA (European projection) and the resampling methods nearest neighbor, bilinear and cubic convolution. The geolocation accuracy—when using only the AOCS data—is better than 100 m. To improve the geolocation accuracy to better than 30 m with respect to the reference image, ground control points (GCP) are used. For this purpose, a reference image database has been generated, consisting of Sentinel-2 images with low cloud coverage. By using Sentinel-2 data as a reference and the Copernicus DEM (GLO-30), this ensures a high relative geometric consistency between EnMAP and Sentinel-2 data and allows for an easy integration in multi-sensoral time-series. Using an intensity based image matching technique, matching points are found and split into GCP and independent control points (ICP). The GCP are used to improve the accuracy of the direct georeferencing, while the ICP are used to calculate and provide the root mean square error (RMSE) to the user in the metadata file [35]. The results of the matching, i.e., number of matching points, number of GCP, number of ICP, number of GCP discarded by blunder detection, and number of tiles are written to the metadata file as well as the accuracy measurements, i.e., RMSE at ICP (x, y, xy), residuals at GCP (x, y, xy) and mean at GCP (x, y, xy). During the orthorectification, the VNIR and SWIR data are also coregistered and merged to one image cube. Rational polynomial coefficients (RPC) are generated and provided to the user in the metadata.

2.5. Level 2A Processing and Related Metadata

Within the overall EnMAP design, the option for generating a “land” (BOA reflectance) as well as two “water” products (BOA water leaving reflectance as well as BOA subsurface reflectance) are provided. The L2A water algorithm is based on the Module Inversion Program (MIP) [36], and is not further described within this paper. The EnMAP Level 2A land processor is based on PACO [37] (Python-Based Atmospheric Correction, see also [1] for its implementation as DESIS L2A processor). PACO is a descendant of the well-known ATCOR [38,39]. Because of this heritage, the advantages and shortcomings are well understood, and the good overall performance is shown in the results of many comparison studies [40].
The L2A processor corrects the effects of the Earth’s atmosphere and, optionally, the surface terrain elevation, to retrieve the reflectance of each sensor pixel. The land processor derives the same surface reflectance product for land and water pixels. The algorithms are based on inversion algorithms taking into account radiative transfer simulations of the Earth’s atmosphere (based on MODTRAN 5.4.0 [41]), which are provided together with the software as LUTs (Look-Up-Tables). If required by the user, the algorithms also correct for single elevation and the contribution of diffuse signal originating from adjacent pixels. The result is a Lambertian surface reflectance irradiance (multiplied by pi) per pixel, together with other processor by-products (e.g., pixel classification or Quality Layers) calculated during the atmospheric correction. Also of importance are the calculated per-pixel aerosol optical thickness and water vapor values, which are used internally to determine the radiative transfer functions per pixel. As mentioned before, the user product for the Level 2A data contains the full processing information from Level 0 onward, including metadata and quality layers (see Figure 4).
Using external MODIS databases [42,43], the land processor makes a very preliminary selection of the radiative transfer function to be used based on season and corrects for the atmosphere ozone column. Within the atmospheric correction process, there is the need to specify the solar irradiance (E0) model. While in theory the EnMAP L2A processor can incorporate various E0 models, the decision was made to use the high resolution solar spectral irradiance of Fontenla 2011 [44] model, because during Sun calibration (solar diffuser measurements) assumptions on the solar irradiance are also incorporated. Using the identical E0 model within the mission, the mandatory consistency between the E0 model used within the calibration procedures and the atmospheric correction is ensured. As required within the CEOS guidelines, the solar irradiance model is properly referenced within the processor documentation and will be made publicly available on the mission website.

2.6. Archiving and Access to Data and Metadata

There are two major scenarios for the users to obtain standardized products. Users can either apply for new image acquisitions on the basis of requests, or products are generated based on archival data. Proposals, acquisitions, and associated research are presented by an interactive map supporting the establishment of a world-wide user network. In case of tasking conflicts, issued acquisitions are prioritized primarily based on historical and current cloud cover information taking satellite constraints such as power and storage into account. All observations will be long-term archived together with quality parameters.
The catalogue search and order service (EOWEB®GeoPortal) allows all registered users to search and browse data sets and products, that are described by corresponding ISO (International Organization for Standardization) metadata sets, and to visualize these products based on the CSW (Catalog Service for the Web) and WMS (Web Mapping Service) protocols standardized by the OGC (Open Geospatial Consortium) (see Figure 5). It is realized using GDAS (Geospatial Data Access Services) and goes beyond the INSPIRE regulation requirements to provide full range and large scale services including help-desk functionalities [45]. This also enables interoperable data access by external partners or OGC-compliant client software. Due to required multiple processing options, each product is generated specifically for the order and delivered using SFTP (secure file transfer protocol) provided by multi-mission facilities [25,46]. An inherent challenge in providing the described metadata related to the orthorectification and atmospheric correction quality is the required provision of information from L1B, L1C and L2A processing for L0 data. In case all higher-level products are already generated and archived, any improvements in the processing software and calibration would cause problems: either the data are static and thus any progress is discarded, or re-processing of the entire archive is required. One prominent example of the latter approach are the Landsat collections [47].
For EnMAP, the design is such that all incoming raw L0 data are processed up to L2A, and then archived as uncalibrated L0 products including extensive metadata. This means that all the information from geocoding (incl. geometric accuracy of this particular dataset) and from atmospheric correction (incl. scene AOT and WV contents) are generated and made available within the archived data, and are also searchable in the catalogue (see also Section 2.5). In addition, all data sets can easily be re-processed on demand with the latest processor versions and calibration information.

3. Results

In the following, example results for the EnMAP L2A products are given, demonstrating the achieved level for this analysis ready data. These datasets are based on simulated EnMAP scenes using the EnMAP simulator EeteS [28,29] developed by GFZ. EeteS consists of an atmospheric module to simulate TOA radiance data from the BOA reflectance input image, allowing for the simulation of different atmospheric and illumination conditions. Next, a spatial module accounts for the EnMAP-specific image geometry, while the spectral module is resampling the data according to the per-pixel spectral response functions. Finally, the radiometric module converts the radiance data into raw DN, simulating the sensor-specific noise amongst other parameter. The simulated Level 0 datasets were then processed by the operational processors of the EnMAP ground segment. In addition, the challenges of the product design and the compliance results regarding CEOS CARD4L and EUFAR HYQUAPRO are described.

3.1. Overview of the L2A Product, the Metadata and the Quality Layers

With each dataset at each processing level a set of quality layers and rich metadata are provided in a series of components, as depicted in Figure 1, Figure 2, Figure 3 and Figure 4. In the following an example for the Level 2A Land product is used, which is relevant for CEOS CARD4L.

3.1.1. Per-Pixel Quality Layers

The various spatial quality layers are listed in Table 4, and include the quicklooks for the VNIR and SWIR sensors, masks for clouds, cloud shadows, haze and cirrus, a basic land cover classification (land, water and snow), as well as information on saturation, interpolated sensor defects and an overall quality rating.
An example for these masks is shown in Figure 6. Based on a Sentinel-2 scene of the San Francisco bay, EnMAP data were simulated. As in this case cirrus clouds are present, the relevant layers “Quality Classes” (land-water-background mask), “Quality Cloud” and “Quality Cirrus” are shown. Overall the masks correspond well to the image properties, but for some pixels confusion in the classification is visible in the simulations (e.g., bright surfaces and clouds). The related masking thresholds will be optimized during the EnMAP commissioning phase using real data and using the final radiometric and spectral calibration tables for the operational phase.
In Figure 7, a simulated EnMAP scene of the Bavarian Alps is shown where many defects are artificially introduced, representing dead, decalibrated and unstable (“flickering”) detector elements. Theses defects are already visible in the Quicklook (top-left in Figure 7) as stripes, and are detected and flagged in the L0/L1B processing. Within the Quality Testflags, the aggregated information on all data defects (saturation, artefact, interpolated pixel) is provided, giving also an overall quality flag (nominal-reduced-low) for each spatial element. The defective pixel mask provides the spectrally resolved information regarding which spatial and spectral element of the data cube was interpolated. Note that for clarity, the Defective Pixel Mask and the Quality Testflags are shown in Figure 7 in the original sensor geometry, while in the L2A user product both files are orthorectified so that they match the geometry of the image cube.
Regarding the fulfilment of the requirements of the EUFAR HYQUAPRO, it is clear that the L1C masks regarding orbit and attitude problems are not provided as these are only relevant in case of airborne sensor data having an unstable platform motion. Second, the masks regarding a critical viewing and illumination geometry recommended by HYQUAPRO are not provided in EnMAP as per-pixel layers, but as part of the metadata which contributes to the overall quality rating of the datatake. The compliance to CARD4L will be discussed in Section 3.2.

3.1.2. Metadata

For each product at each processing level, the complete set of metadata is provided as a machine readable XML file in accordance with the INSPIRE, ISO 19115-2 Geographic Information-Metadata, Part 2: Extension for imagery and gridded data) and ISO 19119 (Geographic information-Services) standards. The metadata set is designed to be fully compliant with the CEOS CARD4L-SR, V5.0 product family at Threshold Level. This includes the provision of the data collection time (as UTC start and end time of the datatake and of each tile), the spatial coverage (bounding polygon coordinates) as well as the RPCs for each scanline, and naturally also the information on the coordinate reference system and map projection (including the EPSG codes). The reference documents describing the processing algorithms (ATBDs) and the data products (Product Specifications) are embedded as DOIs and URLs referring to the EnMAP webpage. Being a hyperspectral instrument, the center wavelengths and spectral bandwidths (as FWHM) information is provided for each band, as well as the basic band statistics. In addition, for each frame the time information and the satellite position are provided, as well as the geolocation for each band using RPCs.
Regarding the quality of the dataset, an extensive list of parameters is also included in the metadata. This comprises the general data quality (Table 5) including an overall quality rating, the fraction of various defects as well as log messages issued by instrument monitoring and processing. In addition, the atmospheric conditions of the scene (incl. water vapor, solar zenith angle, cloud and cirrus coverage) are documented in the metadata (see Table 6), including an overall rating for the quality of the atmospheric correction. Regarding the geometric quality (Table 7), the geolocation accuracy expressed as the RMSE of the ICPs and further processing details are made available.
When comparing the EnMAP metadata with the EUFAR HYQUAPRO recommendations, the INSPIRE conformity is fully realised, as well as the inclusion of all relevant metadata (again with the exception of all information only relevant for airborne sensors). In addition, the EnMAP metadata contains additional parameters regarding the quality of the dataset, e.g., the geolocation RMSE and the percentage of saturated and defective pixels.

3.2. Challenges Regarding CARD4L Compliance of the EnMAP L2A Data Product

As can be seen by the outcome of the CEOS CARD4L self-assessment (Table 8, and Supplementary Materials), full compliance for the 21 items at Threshold level is achieved. Of the 37 metadata items required for the Target Level, only 12 could not be achieved, and an additional 3 items were only partially achieved. While the full conformity at Threshold level is accomplished, there are serious obstacles regarding a full conformity at Target level. First, parts of the auxiliary information used in the processing are commercial and cannot be provided for free online download, in particular the DEM and its derivatives (terrain shadow mask) as well as the reference image used during orthorectification. Next, the full and open SI traceability of the instrument laboratory calibration would be related to contractual changes, involving intellectual property of the industrial prime. In addition, within EnMAP, while large parts of the spectral, geometric and radiometric calibration information is provided within the metadata (including the geometric RPCs, band center wavelengths, spectral bandwidths expressed as FWHM and spectral smile polynomials), other parameters (esp. the straylight tensor data) are too exhaustive to be provided.
Regarding the essential issue of the spectral and radiometric calibration, extensive laboratory calibration activities as well as the availability of on-board calibration facilities (solar diffuser, two integrating spheres) provide the baseline for traceable and reliably calibrated data [24]. Additional activities like lunar datatakes are foreseen during the commissioning phase which can later be used to track important issues such as the aging of the solar diffusor. Finally, the actual in-orbit performance will be operationally assessed by DLR’s ground segment and independently validated by GFZ [21], with regular publications and reports foreseen. In addition, the current knowledge on the uncertainty budget of L2A datasets, so far based on simulations (e.g., [12]), will be updated when real EnMAP data are available, and re-assessed after updates in the processing chain and calibration.

4. Conclusions

In order to facilitate the interoperability of atmospherically corrected Level 2A data products over missions, especially in the context of the ESA Sentinels, initiatives such as the CEOS work towards agreed standards for analysis ready data. Currently, multispectral missions such as Sentinel-2 and Landsat already provide CEOS CARD4L conform data products. When generating ARD for datasets acquired by imaging spectrometers, new challenges exist which are not only attributable to the large number of spectral bands. Within this paper, the approach for generating analysis ready data for the hyperspectral EnMAP mission was presented, which partially builds upon the outcomes of the EUFAR HYQUAPRO project regarding hyperspectral data from airborne sensors. To fulfil the CEOS CARD4L requirements, the EnMAP pre-processing chain includes the necessary procedures for system correction and calibration to SI units, for the tiling and orthorectification, and for the atmospheric correction. Furthermore, during all these processing steps, quality layers providing per-pixel information as well as rich metadata characterizing the dataset are generated and provided to the user in a well-specified INSPIRE/ISO 19115-2/ISO 19119 conform format for easy and automated usage. Following this approach, data products generated by the EnMAP mission can be readily used for advanced analysis, and combined with ARD products from other sensors.

Supplementary Materials

The following are available online at https://www.mdpi.com/article/10.3390/rs13224536/s1, Table S1: CEOS CARD4L-SR V5.0 specifications and results from the EnMAP self-assessment.

Author Contributions

Conceptualization, M.B. and T.S.; methodology, M.B., K.A., E.C., B.G., M.H., S.H., H.K., M.L., D.M., M.P., N.P., R.d.l.R., M.S. and P.S.; formal analysis, M.B., E.C., N.P. and P.S.; writing—original draft preparation, M.B., E.C., S.H., M.L., M.P., N.P., R.d.l.R., M.S., P.S. and T.S.; writing—review and editing, K.A., B.G., M.H., H.K. and D.M. All authors have read and agreed to the published version of the manuscript.

Funding

This research was supported by the DLR Space Agency with funds of the German Federal Ministry of Economic Affairs and Energy on the basis of a decision by the German Bundestag (50 EE 0850). Parts of this work were funded by the European Community’s 7th Framework Programme (FP7/2008-2012) under EUFAR contract n° 227159.

Data Availability Statement

Publicly available EnMAP test products used in this study can be found at: www.enmap.org, accessed on 10 November 2021.

Acknowledgments

The authors would like to thank Karl Segl from GFZ for the EeteS EnMAP simulations, and all FP7 EUFAR project partners, in particular VITO (Belgium), NERC/PML (UK), INTA (Spain), RSL (Switzerland), USBE (Czech Republic), TAU (Israel), GFZ (Germany), FU Berlin (Germany) and ONERA (France) for the fruitful project cooperation.

Conflicts of Interest

The authors declare no conflict of interest.

References

  1. Alonso, K.; Bachmann, M.; Burch, K.; Carmona, E.; Cerra, D.; de los Reyes, R.; Dietrich, D.; Heiden, U.; Hölderlin, A.; Ickes, J.; et al. Data Products, Quality and Validation of the DLR Earth Sensing Imaging Spectrometer (DESIS). Sensors 2019, 19, 4471. [Google Scholar] [CrossRef] [PubMed] [Green Version]
  2. Cogliati, S.; Sarti, F.; Chiarantini, L.; Cosi, M.; Lorusso, R.; Lopinto, E.; Miglietta, F.; Genesio, L.; Guanter, L.; Damm, A.; et al. The PRISMA imaging spectroscopy mission: Overview and first performance analysis. Remote Sens. Environ. 2021, 262, 112499. [Google Scholar] [CrossRef]
  3. Guanter, L.; Kaufmann, H.; Segl, K.; Foerster, S.; Rogass, C.; Chabrillat, S.; Kuester, T.; Hollstein, A.; Rossner, G.; Chlebek, C.; et al. The EnMAP Spaceborne Imaging Spectroscopy Mission for Earth Observation. Remote Sens. 2015, 7, 8830–8857. [Google Scholar] [CrossRef] [Green Version]
  4. Rast, M.; Ananasso, C.; Bach, H.; Ben-Dor, E.; Chabrillat, S.; Colombo, R.; Del Bello, U.; Feret, J.; Giardino, C.; Green, R.; et al. Copernicus Hyperspectral Imaging Mission for the Environment: Mission Requirements Document, 2.1st ed.; Number ESA-EOPSM-CHIM-MRD-3216 in Mission Requirements Document (MRD); European Space Agency (ESA): Paris, France, 2019. [Google Scholar]
  5. Cawse-Nicholson, K.; Townsend, P.A.; Schimel, D.; Assiri, A.M.; Blake, P.L.; Buongiorno, M.F.; Campbell, P.; Carmon, N.; Casey, K.A.; Correa-Pabón, R.E.; et al. NASA’s surface biology and geology designated observable: A perspective on surface imaging algorithms. Remote Sens. Environ. 2021, 257, 112349. [Google Scholar] [CrossRef]
  6. CEOS. Available online: http://ceos.org/document_management/Meetings/Plenary/30/Documents/5.5_CEOS-CARD4L-Description_v.22.docx (accessed on 26 July 2021).
  7. Holzwarth, S.; Hanuš, J.; Reusen, I.; Gerard, E.; Brown, P.R.A. 10 Years of Airborne Imaging Spectroscopy within EUFAR. In Proceedings of the 11th EARSeL Imaging Spectroscopy Workshop, Brno, Czech Republic, 6–8 February 2019. [Google Scholar]
  8. Li, F.; Jupp, D.L.; Thankappan, M.; Lymburner, L.; Mueller, N.; Lewis, A.; Held, A. A physics-based atmospheric and BRDF correction for Landsat data over mountainous terrain. Remote Sens. Environ. 2012, 124, 756–770. [Google Scholar] [CrossRef]
  9. CEOS. Product FamilySpecificationSurface Reflectance (CARD4L-SR), V.5.0. Available online: https://ceos.org/ard/files/PFS/SR/v5.0/CARD4L_Product_Family_Specification_Surface_Reflectance-v5.0.pdf (accessed on 26 July 2021).
  10. Bachmann, M.; Adar, S.; Ben-Dor, E.; Biesemans, J.; Briottet, X.; Grant, M.; Hanus, J.; Holzwarth, S.; Hueni, A.; Kneubuehler, M.; et al. Towards agreed data quality layers for airborne hyperspectral imagery. In Proceedings of the EARSeL 7th SIG-Imaging Spectroscopy, Edinburgh, UK, 11–13 April 2011; pp. 1–22. [Google Scholar]
  11. Holzwarth, S.; Bachmann, M.; Freer, M. Standards for airborne hyperspectral image data. In Proceedings of the EARSeL 7th SIG-Imaging Spectroscopy, Edinburgh, UK, 11–13 April 2011; pp. 1–7. [Google Scholar]
  12. Bachmann, M.; Makarau, A.; Segl, K.; Richter, R. Estimating the Influence of Spectral and Radiometric Calibration Uncertainties on EnMAP Data Products—Examples for Ground Reflectance Retrieval and Vegetation Indices. Remote Sens. 2015, 7, 10689–10714. [Google Scholar] [CrossRef] [Green Version]
  13. Bhatia, N.; Tolpekin, V.A.; Stein, A.; Reusen, I. Estimation of AOD Under Uncertainty: An Approach for Hyperspectral Airborne Data. Remote Sens. 2018, 10, 947. [Google Scholar] [CrossRef] [Green Version]
  14. Woolliams, E.; Hueni, A.; Gorrono, J. Intermediate Uncertainty Analysis for Earth Observation (Instrument Calibration Module); National Physical Laboratory (NPL): Teddington, UK, 2014; Available online: https://www.zora.uzh.ch/98386/ (accessed on 26 July 2021).
  15. Thompson, D.R.; Braverman, A.; Brodrick, P.G.; Candela, A.; Carmon, N.; Clark, R.N.; Connelly, D.; Green, R.O.; Kokaly, R.F.; Li, L.; et al. Quantifying uncertainty for remote spectroscopy of surface composition. Remote Sens. Environ. 2020, 247, 111898. [Google Scholar] [CrossRef]
  16. Durell, C. IEEE P4001 Hyperspectral Standard in 2019-2020: Progress and Cooperation-3627. In Proceedings of the IGARSS 2020–2020 IEEE International Geoscience and Remote Sensing Symposium, Waikoloa, HI, USA, 26 September–2 October 2020; pp. 6032–6034. [Google Scholar] [CrossRef]
  17. Holzwarth, S.; Pinnel, N.; Bachmann, M.; Schneider, M.; Köhler, C.H.; Baumgartner, A.; Schläpfer, D. Optimized Processing of Airborne Hyperspectral Data for Forest Studies. In Proceedings of the WHISPERS 2018, 9th Workshop on Hyperspectral and Signal Processing: Evolution in Remote Sensing, Amsterdam, The Netherlands, 23–26 September 2018. [Google Scholar]
  18. Holmes, C. Analysis Ready Data Defined. 2018. Available online: https://medium.com/planet-stories/analysis-ready-data-defined-5694f6f48815 (accessed on 26 July 2021).
  19. Chabrillat, S.; Guanter, L.; Segl, K.; Foerster, S.; Fischer, S.; Rossner, G.; Schickling, A.; Porta, L.L.; Honold, H.P.; Storch, T. The EnMAP German Spaceborne Imaging Spectroscopy Mission: Update and Highlights of Recent Preparatory Activities. In Proceedings of the IGARSS 2020, Waikoloa, HI, USA, 26 September–2 October 2020; pp. 1–4. [Google Scholar]
  20. Storch, T.; Habermeyer, M.; Eberle, S.; Mühle, H.; Müller, R. Towards a Critical Design of an Operational Ground Segment for an Earth Observation Mission. J. Appl. Remote Sens. 2013, 7, 073581. [Google Scholar] [CrossRef] [Green Version]
  21. Brell, M.; Guanter, L.; Segl, K.; Scheffler, D.; Bohn, N.; Bracher, A.; Soppa, M.A.; Foerster, S.; Storch, T.; Bachmann, M.; et al. The EnMAP Satellite—Data Product Validation Activities. In Proceedings of the WHISPERS 2021, Online, 24–26 March 2021; pp. 1–5. [Google Scholar]
  22. Storch, T.; Honold, H.P.; Krawczyk, H.; Wachter, R.; de los Reyes, R.; Langheinrich, M.; Mücke, M.; Fischer, S. Spectral characterization and smile correction for the Imaging Spectroscopy Mission EnMAP. In Proceedings of the IGARSS 2018, Valencia, Spain, 22–27 July 2018; pp. 1–3. [Google Scholar]
  23. Storch, T.; Honold, H.P.; Alonso, K.; Pato, M.; Mücke, M.; Basili, P.; Chabrillat, S.; Fischer, S. Status of the Imaging Spectroscopy Mission EnMAP with Radiometric Calibration and Correction. In Proceedings of the ISPRS 2020 Annals of the Photogrammetry, Remote Sensing and Spatial Information Sciences, Nice, France, 15 December 2020; Volume V-1, pp. 41–47. [Google Scholar]
  24. Storch, T.; Lenfert, K.; Schneider, M.; Mogulski, V.; Bachmann, M.; Sang, B.; Müller, R.; Hofer, S.; Chlebek, C. Pre- and In-Flight Geometric Characterization and Calibration Concepts for the EnMAP Mission. In Proceedings of the IGARSS2012, Munich, Germany, 22–27 July 2012; IEEE Press: New York, NY, USA, 2012; pp. 5021–5024. [Google Scholar]
  25. Storch, T.; Bachmann, M.; Eberle, S.; Habermeyer, M.; Makasy, C.; de Miguel, A.; Mühle, H.; Müller, R. EnMAP Ground Segment Design: An Overview and its Hyperspectral Image Processing Chain. In Earth Observation of Global Changes 2011 (EOGC 2011); Krisp, J.M., Meng, L., Pail, R., Stilla, U., Eds.; Lecture Notes in Geoinformation and Cartography; Springer: Berlin, Germany, 2013; pp. 49–62. [Google Scholar]
  26. Bachmann, M.; Müller, R.; Schneider, M.; Walzel, T.; Habermeyer, M.; Storch, T.; Kaufmann, H.; Segl, K.; Rogass, C. Data Quality Assurance for hyperspectral L1 and L2 products—Cal/Val/Mon procedures within the EnMAP Ground Segment. In Proceedings of the ESA LPVE-Land Product Validation and Evolution Workshop, Frascati, Italy, 28–30 January 2014; pp. 1–35. [Google Scholar]
  27. Schwind, P.; Müller, R.; Palubinskas, G.; Storch, T. An in-depth simulation of EnMAP acquisition geometry. ISPRS J. Photogramm. Remote Sens. 2012, 70, 99–106. [Google Scholar] [CrossRef]
  28. Segl, K.; Guanter, L.; Rogass, C.; Kuester, T.; Roessner, S.; Kaufmann, H.; Sang, B.; Mogulsky, V.; Hofer, S. EeteS—The EnMAP End-to-End Simulation Tool. IEEE J. Sel. Top. Appl. Earth Obs. Remote Sens. 2012, 5, 522–530. [Google Scholar] [CrossRef]
  29. Guanter, L.; Segl, K.; Kaufmann, H. Simulation of Optical Remote-Sensing Scenes With Application to the EnMAP Hyperspectral Mission. IEEE Trans. Geosci. Remote Sens. 2009, 47, 2340–2351. [Google Scholar] [CrossRef]
  30. Holben, B.; Eck, T.; Slutsker, I.; Tanré, D.; Buis, J.; Setzer, A.; Vermote, E.; Reagan, J.; Kaufman, Y.; Nakajima, T.; et al. AERONET—A Federated Instrument Network and Data Archive for Aerosol Characterization. Remote Sens. Environ. 1998, 66, 1–16. [Google Scholar] [CrossRef]
  31. Bouvet, M.; Thome, K.; Berthelot, B.; Bialek, A.; Czapla-Myers, J.; Fox, N.P.; Goryl, P.; Henry, P.; Ma, L.; Marcq, S.; et al. RadCalNet: A Radiometric Calibration Network for Earth Observing Imagers Operating in the Visible to Shortwave Infrared Spectral Range. Remote Sens. 2019, 11, 2401. [Google Scholar] [CrossRef] [Green Version]
  32. Clerc, S.; Bourg, L.; Pflug, B.; Alhammoud, B.; Ligi, M.; Holzwarth, S.; Meygret, A.; Neveu-VanMalle, M. A Holistic Perspective on the Calibration and Validation of Sentinel-2: Contribution From the CCVS Project. In Proceedings of the 4th Sentinel-2 Validation Team Meeting, Brussels, Belgium, 11–16 July 2021. [Google Scholar]
  33. Bachmann, M.; Rogge, D.; Habermeyer, M.; Pinnel, N.; Holzwarth, S. Extending DLR’s operational data quality control (DataQC) to a new sensor-Results from the HySpex 2012 campaign. In Proceedings of the 8the EARSeL SIG-IS, Nantes, France, 8–10 April 2013. [Google Scholar]
  34. Müller, R.; Lehner, M.; Müller, R.; Reinartz, P.; Schroeder, M.; Vollmer, B. A program for direct georeferencing of airborne and spaceborne line scanner images. Int. Arch. Photogramm. Remote Sens. Spat. Inf. Sci. 2002, 34, 148–153. [Google Scholar]
  35. Müller, R.; Krauß, T.; Schneider, M.; Reinartz, P. Automated Georeferencing of Optical Satellite Data with Integrated Sensor Model Improvement. Photogramm. Eng. Remote Sens. (PEERS) 2012, 78, 61–74. [Google Scholar] [CrossRef]
  36. Heege, T.; Kiselev, V.; Odermatt, D.; Heblinski, J.; Schmieder, K.; Khac, T.V.; Long, T.T. Retrieval of water constituents from multiple earth observation sensors in lakes, rivers and coastal zones. In Proceedings of the 2009 IEEE International Geoscience and Remote Sensing Symposium, Cape Town, South Africa, 12–17 July 2009; Volume 2, pp. II–833–II–836. [Google Scholar] [CrossRef]
  37. de los Reyes, R.; Langheinrich, M.; Schwind, P.; Richter, R.; Pflug, B.; Bachmann, M.; Müller, R.; Carmona, E.; Zekoll, V.; Reinartz, P. PACO: Python-Based Atmospheric Correction. Sensors 2020, 20, 1428. [Google Scholar] [CrossRef] [Green Version]
  38. Richter, R. Correction of satellite imagery over mountainous terrain. Appl. Opt. 1998, 37, 4004–4015. [Google Scholar] [CrossRef]
  39. Richter, R.; Schlapfer, D. Considerations on Water Vapor and Surface Reflectance Retrievals for a Spaceborne Imaging Spectrometer. IEEE Trans. Geosci. Remote Sens. 2008, 46, 1958–1966. [Google Scholar] [CrossRef]
  40. Doxani, G.; Vermote, E.; Roger, J.C.; Gascon, F.; Adriaensen, S.; Frantz, D.; Hagolle, O.; Hollstein, A.; Kirches, G.; Li, F.; et al. Atmospheric Correction Inter-Comparison Exercise. Remote Sens. 2018, 10, 352. [Google Scholar] [CrossRef] [Green Version]
  41. Berk, A.; Anderson, G.P.; Acharya, P.K.; Shettle, E.P. MODTRAN 5.2.0 User’s Manual; Spectral Sciences, Inc. and Air Force Research Laboratory: Burlington, VT, USA, 2008. [Google Scholar]
  42. Wan, Z.; Hook, S.; Hulley, G. MYD11A2 MODIS/Aqua Land Surface Temperature/Emissivity 8-Day L3 Global 1km SIN Grid V006. NASA EOSDIS Land Process. DAAC 2015. [Google Scholar] [CrossRef]
  43. Platnick, S.E.A. MODIS Atmosphere L3 Eight-Day Product; NASA: Washington, DC, USA, 2017. [Google Scholar] [CrossRef]
  44. Fontenla, J.M.; Harder, J.; Livingston, W.; Snow, M.; Woods, T. High-resolution solar spectral irradiance from extreme ultraviolet to far infrared. J. Geophys. Res. Atmos. 2011, 116. [Google Scholar] [CrossRef]
  45. Pinnel, N.; Heiden, U.; Asamer, H.; Dietrich, D.; Mühle, H.; Habermeyer, M.; Storch, T. EnMAP User Interface—An Overview of EnMAP ground segment services. In Proceedings of the 11th Earsel SIG IS Workshop, Brno, Czech Republic, 6–8 February 2019. [Google Scholar]
  46. Habermeyer, M.; Pinnel, N.; Storch, T.; Honold, H.P.; Tucker, P.; Guanter, L.; Segl, K.; Fischer, S. The EnMAP Mission: From Observation Request to Data Delivery. In Proceedings of the IGARSS 2019, Yokohama, Japan, 28 July–2 August 2019; pp. 4507–4510. [Google Scholar]
  47. Wulder, M.A.; Loveland, T.R.; Roy, D.P.; Crawford, C.J.; Masek, J.G.; Woodcock, C.E.; Allen, R.G.; Anderson, M.C.; Belward, A.S.; Cohen, W.B.; et al. Current status of Landsat program, science, and applications. Remote Sens. Environ. 2019, 225, 127–147. [Google Scholar] [CrossRef]
Figure 1. Components of the EnMAP L0 product (Earth tile).
Remotesensing 13 04536 g001
Figure 2. Components of the EnMAP L1B product.
Remotesensing 13 04536 g002
Figure 3. Components of the EnMAP L1C product.
Remotesensing 13 04536 g003
Figure 4. Components of the EnMAP L2A product.
Remotesensing 13 04536 g004
Figure 5. (EOWEB®GeoPortal) provides catalogue search and retrieval functions for future orders and archived data. Nr 1 is the product search and map overview, where orders can be searched based on temporal and geographical selections. Nr 2 shows the product order, where several processing options can be chosen. Nr 3 displays the order details and processing criteria before final ordering. Nr 4 provides an extensive list of data quality information, which is available for each order individually.
Remotesensing 13 04536 g005
Figure 6. EnMAP scene with simulated clouds and cirrus (San Francisco bay). (Top-left): True-color quicklook. (Top-right): Quality Classes (black: background, brown: land, blue: water, white: other). (Bottom-left): Quality Cirrus (black: thin cirrus, green: medium cirrus, yellow: thick cirrus). (Bottom-right): Quality Clouds (black: clouds).
Remotesensing 13 04536 g006
Figure 7. EnMAP scene with simulated defects (Bavarian Alps). (Top-left): True-color quicklook. (Top-right): Defective Pixel Mask (band 18 of VNIR, in sensor geometry; white indicating interpolated pixel). (Bottom): Quality Testflag (visualization of VNIR subset, in sensor geometry; yellow: saturation flag; green: artefact flag; red: flag for overall reduced quality; black: nominal quality).
Remotesensing 13 04536 g007
Table 1. Minimum set of quality layers identified within EUFAR HYQUAPRO.
Quality LayerGenerated byComment
Saturated pixel maskL1BCan include blooming
and crosstalk
Interpolated pixel maskL1BCan be aggregated
over all bands
Bad pixel maskL1BAll not corrected defects,
can be aggregated
Frames with position and/orL1C
attitude problems
Frames with interpolatedL1C
position and/or attitude
Mask with critical local viewingL1C, L2A
and illumination geometry
Cloud maskL2A
Cloud shadow maskL2A
Haze maskL2A
Table 2. Relevant INSPIRE conform metadata.
Metadata ElementDescription
Resource titleProject/survey acronym
Resource abstractProject/survey abstract
Resource typeDataset or series
Resource locatorWeb link to data/DB
Unique resource identifierFile name (unique)
Resource languageLanguage used (usually English)
Topic categoryMain scientific field (coarse description)
Keyword valueSubject (more detailed description)
Originating controlled vocabularyIf the keyword value originates from a
controlled vocabulary
Geographic bounding boxGeographic extent
Temporal extentDate/interval of data acquisition
Date of publicationDate of data publication (e.g., entry into DB)
Date of last revisionOnly valid if data has been revised
Date of creationDate of data processing
LineageStatement on process history and/or
overall quality
Spatial resolutionGround sampling distance
Conformity—specificationCitation of specification to which
resource conforms
Conformity—degreeDegree of conformity
Conditions applying to access and useConditions for access and use of spatial data set
Limitations on public accessInformation on access limitations and
the reasons for them
Responsible partyContact information of the organisation
responsible for data
Responsible party roleRole of the responsible organisation
(e.g., data provider)
Metadata point of contactContact information of the organisation
responsible for metadata
Metadata dateDate of metadata creation
Metadata languageMetadata language (usually English)
Table 3. Additional metadata agreed within EUFAR HYQUAPRO.
Metadata ElementDescription
Scan principlee.g., pushbroom
Spectral rangee.g., 400–2450 nm
Spectral bandwidth (as Full Widthe.g., VNIR:  6.5 nm, SWIR:  10 nm
      at Half Maximum, FWHM)
No. of bands/binning (if applicable)e.g., 218
Total Field of View (FOV)e.g., 2.63°
Inst. Field of View (IFOV)e.g., 29.5 arcsec
Pixels per scanlinee.g., 1000
Radiometric resolution/quantizatione.g., 14 bit
File name—raw dataRaw data name (might be different from
unique resource identifier)
File name—quality layersFile names of quality layers
Calibration laboratorye.g., CHB, DLR Oberpfaffenhofen, Germany
Date of radiometric calibrationDD.MM.YYYY
Date of spectral calibrationDD.MM.YYYY
Radiometric calibration file usedFilename of radiometric calibration file
Radiance unit + scalinge.g., W m 2 sr 1 nm 1
PlatformSatellite or Aircraft call sign
Sensore.g., APEX
GPS/IMUe.g., Applanix POS AV 410,
DLR Oberpfaffenhofen, Germany
Spectral modee.g., mode 1
Frame rate/integration timeStatement in Hz
Overall headingStatement in degree (range 0–360, west = 270°)
Overall altitude ASLFlying altitude above sea level in meter
Solar zenith during acquisitionSolar Zenith: range 0°–90°, sunrise = 90°
Solar azimuth during acquisitionSolar azimuth: range 0°–360°,
North = 0°, East = 90°,…
Report on anomalies in data acquisitione.g., cloud cover
Processor ID, SW nameDDs & versionse.g., dims_ares Version 1.2, DLR PAF
Synchronization problemProblems during synchronization of image
data with navigation data
Method of interpolationMethod of interpolation used for geometric
correction, e.g., bilinear
Atmospheric modelConfidence in atm. corr. from model itself
Comparison with ground measurementsConfidence in atm. corr. due to comparison
with ground measurements
Information on DEMInformation on DEM (e.g., resolution,
accuracy,…) used for processing
Critical BRDF geometryComment on critical BRDF geometry within
the scene
Pixels affected by saturationPixels affected by saturation in
spatial/spectral neighbourhood
Table 4. EnMAP Quality Layers provided with each dataset (L1B, L1C and L2A).
Quality LayerRemark
Quicklook Image VNIRBands: R: 850 nm, G: 670 nm, B: 550 nm, orthorectified to
WGS84, geographic coordinates, GeoTIFF format
Quicklook Image SWIRBands: R: 2200 nm, G: 1650 nm, B: 1050 nm, orthorectified to
WGS84, geographic coordinates, GeoTIFF format
Quality ClassesFlags for “Land”, “Water”, “Background” and “Other”
Quality CloudBinary cloud mask
Quality CloudshadowBinary cloud shadow mask
Quality HazeBinary haze mask
Quality CirrusFlags for thin, medium and thick cirrus
Quality SnowBinary snow mask
Quality TestflagsAggregated 8 Bit flags for saturation, artefacts, interpolation and
overall quality rating per pixel for VNIR and SWIR
Defective Pixel MaskBinary cube of pixel defects for VNIR and SWIR
Table 5. EnMAP Metadata regarding general data quality.
ParameterRemark
overallQuality{0}: nominal quality; {1}: reduced quality, {2}: low quality;
{−999}: not produced
overallQualityVNIR/SWIR{0}: nominal quality; {1}: reduced quality, {2}: low quality;
{−999}: not produced
qualityRadiometryVNIR/SWIR{0}: nominal quality; {1}: reduced quality, {2}: low quality;
{−999}: not produced
stripingBandingVNIR/SWIR{0–1000} value in per mille of affected pixels in dataset;
{−999}: not produced
saturationCrosstalkVNIR/SWIR{0–1000} value in per mille of affected pixels in dataset;
{−999}: not produced
generalArtifactsVNIR/SWIR{0–1000} value in per mille of affected pixels in dataset;
{−999}: not produced
deadPixelsVNIR/SWIR{0–999999} absolute number of dead pixels on chip;
{−999}: not produced
defectivePixelsVNIR/SWIR{0–1000} value in per mille of affected pixels in dataset;
{−999}: not produced
smileIndicationVNIR/SWIR{0}: no indication for spectral smile; {1}: indication for
spectral smile, {-999}: not produced
sensorLogVNIR/SWIR{0}: no critical log message; {1}: minor issues documented in log;
{2}: major issues documented in log; {−999}: not produced
processorLogVNIR/SWIR{0}: no critical log message; {1}: minor issues documented in log;
{2}: major issues documented in log; {−999}: not produced
Table 6. EnMAP Metadata regarding atmospheric parameters and quality (SZA: Solar Zenith Angle; WV: Water Vapour; AOT: Aerosol Optical Thickness; DDV: Dense Dark Vegetation pixel; DEM: Digital Elevation Model).
ParameterRemark
qualityAtmosphere{0}: nominal quality; {1}: reduced quality, {2}: low quality;
{−999}: not produced
sceneSZAScene-average SZA Value in degree; {-999}: not produced
sceneSunglint{0–100} value in percent of affected pixels in dataset;
{−999}: not produced
cloudCover{0–100} value in percent of affected pixels in dataset;
{−999}: not produced
hazeCover{0–100} value in percent of affected pixels in dataset;
{−999}: not produced
cirrusCover{0–100} value in percent of affected pixels in dataset;
{−999}: not produced
snowCover{0–100} value in percent of affected pixels in dataset;
{−999}: not produced
waterCover{0–100} value in percent of affected pixels in dataset;
{−999}: not produced
cloudShadow{0–100} value in percent of affected pixels in dataset;
{−999}: not produced
noncloudShadow{0–100} value in percent of affected pixels in dataset;
{−999}: not produced
sceneWVScene-average WV value [in cm * 10]; {−999}: not produced
sceneAOTScene-average AOT value [units * 1000]; {−999}: not produced
sceneAtmParam{0}: nominal quality; {1}: DDV/Water warnings,
{2}: negative values warning; {3} other log warnings;
{4}: DDV/Water and negative values warning;
{5}: DDV/Water and other log warnings; {6}: negative values warning
and other log warnings; {7}: DDV/Water warnings and negative
values warnings and other log warnings; {−999}: not produced
sceneTerrain{0}: nominal; {1}: DEM not used by L2A due to quality;
{−999}: not produced
Table 7. EnMAP Metadata regarding geometric quality (GCP: Ground Control Point; ICP: Independent Control Point).
ParameterRemark
orthoTerrain{0}: nominal; {1} DEM not used by ORTHO due to quality;
{-999}: not produced
orthoRMSERMSE (xy) of orthorectification based on ICPs
[units: pixels * 10] ; {−999}: not produced
orthoRMSE_xRMSE (x) of orthorectification based on ICPs
[units: pixels * 10] ; {−999}: not produced
orthoRMSE_yRMSE (y) of orthorectification based on ICPs
[units: pixels * 10] ; {−999}: not produced
orthoResidualRMSE (xy) of orthorectification based on GCPs
[units: pixels * 10] ; {−999}: not produced
orthoResidual_xRMSE (x) of orthorectification based on GCPs
[units: pixels * 10] ; {−999}: not produced
orthoResidual_yRMSE (y) of orthorectification based on GCPs
[units: pixels * 10] ; {−999}: not produced
orthoMeanMean (xy) of orthorectification based on GCPs
[units: pixels * 10] ; {−999}: not produced
orthoMean_xMean (x) of orthorectification based on GCPs
[units: pixels * 10] ; {−999}: not produced
orthoMean_yMean (y) of orthorectification based on GCPs
[units: pixels * 10] ; {−999}: not produced
numPointsAllTotal Number of matched points
numPointsGCPNumber of GCPs
numPointsICPNumber of ICPs
numPointsDiscardedGCPNumber of discarded GCPs
numTilesUsedNumber of tiles (datatake) used for image matching
and GCP/ICP generation
levelOfRejectionThreshold parameter in estimate
Table 8. Outcome of the CARD4L self-assessment of the EnMAP L2A product.
ThresholdTarget
1. General Metadata
1.1 Traceabilityn.a.
1.2 Metadata Machine Readability
1.3 Data Collection Time
1.4 Geographical Area
1.5 Coordinate Reference System
1.6 Map Projection
1.7 Geometric Correction Methodsn.a.
1.8 Geometric Accuracy of the Datan.a.
1.9 Instrument
1.10 Spectral Bands
1.11 Sensor Calibrationn.a.
1.12 Radiometric Accuracyn.a.
1.13 Algorithmspartially
1.14 Auxiliary Data
1.15 Processing Chain Provenancen.a.
1.16 Data Access
1.17 Overall Data Qualityn.a.
2. Per-Pixel Metadata
2.1 Metadata Machine Readability
2.2 No Data
2.3 Incomplete Testing
2.4 Saturationpartially
2.5 Cloud
2.6 Cloud Shadow
2.7 Land/Water Maskn.a.
2.8 Snow/Ice Maskn.a.
2.9 Terrain Shadow Maskn.a.
2.10 Terrain Occlusionn.a.
2.11 Solar and Viewing Geometry
2.12 Terrain Illumination Correctionn.a.
2.13 Aerosol Optical Depth Parametersn.a.n.a.
3. Radiometric and Atmospheric Corrections
3.1 Measurement
3.2 Measurement Uncertaintyn.a.partially
3.3 Measurement Normalisationn.a.
3.4 Directional Atmospheric Scattering
3.5 Water Vapour Corrections
3.6 Ozone Correctionsn.a.
4. Geometric Corrections
4.1 Geometric Correction
Publisher’s Note: MDPI stays neutral with regard to jurisdictional claims in published maps and institutional affiliations.

