Next Issue
Volume 13, December-1
Previous Issue
Volume 13, November-1
 
 
remotesensing-logo

Journal Browser

Journal Browser

Remote Sens., Volume 13, Issue 22 (November-2 2021) – 237 articles

Cover Story (view full-size image): 
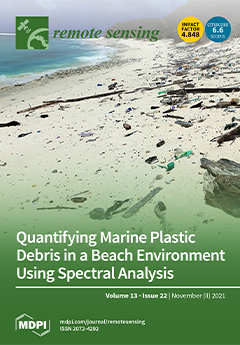
Plastic entering marine and coastal ecosystems is posing a globally significant environmental challenge; this plastic debris can now be found in remote locations around the world. Optical remote sensing is one of the promising emerging tools that can be used for tracking marine plastic debris . It is possible to separate plastics from sub-pixel surface covers using unique SWIR absorption features; however, the magnitude and shape of these features vary between plastic polymers. In this study, we investigate both weathered and virgin plastic groups to better understand the impact of polymer type on the ability to detect plastics on beaches with sub-pixel surface covers. We use the Cocos (Keeling) Islands as an example of how different beach areas can accumulate different types of plastics, leading to potential variation in plastic detection. View this paper
  • Issues are regarded as officially published after their release is announced to the table of contents alert mailing list.
  • You may sign up for e-mail alerts to receive table of contents of newly released issues.
  • PDF is the official format for papers published in both, html and pdf forms. To view the papers in pdf format, click on the "PDF Full-text" link, and use the free Adobe Reader to open them.
Order results
Result details
Section
Select all
Export citation of selected articles as:
18 pages, 27306 KiB  
Article
GAN-GL: Generative Adversarial Networks for Glacial Lake Mapping
by Hang Zhao, Meimei Zhang and Fang Chen
Remote Sens. 2021, 13(22), 4728; https://doi.org/10.3390/rs13224728 - 22 Nov 2021
Cited by 6 | Viewed by 2555
Abstract
Remote sensing is a powerful tool that provides flexibility and scalability for monitoring and investigating glacial lakes in High Mountain Asia (HMA). However, existing methods for mapping glacial lakes are designed based on a combination of several spectral features and ancillary data (such [...] Read more.
Remote sensing is a powerful tool that provides flexibility and scalability for monitoring and investigating glacial lakes in High Mountain Asia (HMA). However, existing methods for mapping glacial lakes are designed based on a combination of several spectral features and ancillary data (such as the digital elevation model, DEM) to highlight the lake extent and suppress background information. These methods, however, suffer from either the inevitable requirement of post-processing work or the high costs of additional data acquisition. Signifying a key advancement in the deep learning models, a generative adversarial network (GAN) can capture multi-level features and learn the mapping rules in source and target domains using a minimax game between a generator and discriminator. This provides a new and feasible way to conduct large-scale glacial lake mapping. In this work, a complete glacial lake dataset was first created, containing approximately 4600 patches of Landsat-8 OLI images edited in three ways—random cropping, density cropping, and uniform cropping. Then, a GAN model for glacial lake mapping (GAN-GL) was constructed. The GAN-GL consists of two parts—a generator that incorporates a water attention module and an image segmentation module to produce the glacial lake masks, and a discriminator which employs the ResNet-152 backbone to ascertain whether a given pixel belonged to a glacial lake. The model was evaluated using the created glacial lake dataset, delivering a good performance, with an F1 score of 92.17% and IoU of 86.34%. Moreover, compared to the mapping results derived from the global–local iterative segmentation algorithm and random forest for the entire Eastern Himalayas, our proposed model was superior regarding the segmentation of glacial lakes under complex and diverse environmental conditions, in terms of accuracy (precision = 93.19%) and segmentation efficiency. Our model was also very good at detecting small glacial lakes without assistance from ancillary data or human intervention. Full article
(This article belongs to the Topic Water Management in the Era of Climatic Change)
Show Figures

Graphical abstract

28 pages, 32731 KiB  
Article
A Semantics-Based Approach for Simplifying IFC Building Models to Facilitate the Use of BIM Models in GIS
by Junxiang Zhu, Peng Wu and Chimay Anumba
Remote Sens. 2021, 13(22), 4727; https://doi.org/10.3390/rs13224727 - 22 Nov 2021
Cited by 6 | Viewed by 3264
Abstract
Using solid building models, instead of the surface models in City Geography Markup Language (CityGML), can facilitate data integration between Building Information Modeling (BIM) and Geographic Information System (GIS). The use of solid models, however, introduces a problem of model simplification on the [...] Read more.
Using solid building models, instead of the surface models in City Geography Markup Language (CityGML), can facilitate data integration between Building Information Modeling (BIM) and Geographic Information System (GIS). The use of solid models, however, introduces a problem of model simplification on the GIS side. The aim of this study is to solve this problem by developing a framework for generating simplified solid building models from BIM. In this framework, a set of Level of Details (LoDs) were first defined to suit solid building models—referred to as s-LoD, ranging from s-LoD1 to s-LoD4—and three unique problems in implementing s-LoDs were identified and solved by using a semantics-based approach, including identifying external objects for s-LoD2 and s-LoD3, distinguishing various slabs, and generating valid external walls for s-LoD2 and s-LoD3. The feasibility of the framework was validated by using BIM models, and the result shows that using semantics from BIM can make it easier to convert and simplify building models, which in turn makes BIM information more practical in GIS. Full article
(This article belongs to the Section Engineering Remote Sensing)
Show Figures

Graphical abstract

18 pages, 4581 KiB  
Article
Extraction and Discrimination of MBT Anomalies Possibly Associated with the Mw 7.3 Maduo (Qinghai, China) Earthquake on 21 May 2021
by Yuan Qi, Lixin Wu, Yifan Ding, Yingjia Liu, Shuai Chen, Xiao Wang and Wenfei Mao
Remote Sens. 2021, 13(22), 4726; https://doi.org/10.3390/rs13224726 - 22 Nov 2021
Cited by 17 | Viewed by 2076
Abstract
Earthquakes are one of the most threatening natural disasters to human beings, and pre- and post-earthquake microwave brightness temperature (MBT) anomalies have attracted increasing attention from geosciences as well as remote sensing communities. However, there is still a lack of systematic description about [...] Read more.
Earthquakes are one of the most threatening natural disasters to human beings, and pre- and post-earthquake microwave brightness temperature (MBT) anomalies have attracted increasing attention from geosciences as well as remote sensing communities. However, there is still a lack of systematic description about how to extract and then discriminate the authenticity of seismic MBT anomalies. In this research, the first strong earthquake occurring near the northern edge of eastern Bayan Har block in nearly 20 years, the recent Mw 7.3 Maduo earthquake in Qinghai province, China on 21 May 2021, was selected as a case study. Based on the monthly mean background of MBT, the spatiotemporal features of MBT residuals with 10.65 GHz before and after the earthquake was firstly revealed. Referring to the spatial patterns and abnormal amplitudes of the results, four typical types of evident MBT positive residuals were obtained, and the time series of intensity features of each category was also quantitatively analyzed. Then, as the most influential factor on surface microwave radiation, air temperature, soil moisture and precipitation were analyzed to discriminate their contributions to these residuals. The fourth one, which occurred north to the epicenter after the earthquake, was finally confirmed to be caused by soil moisture reduction and thus ruled out as being related to seismicity. Therefore, the three retained typical MBT residuals with 10.65 GHz could be identified as possible anomalies associated with the Maduo earthquake, and were further analyzed collaboratively with some other reported abnormal phenomena related to the seismogenic process. Furthermore, through time series analysis, the MBT positive residuals inside the Bayan Har block were found to be more significant than that outside, and the abnormal behaviors of MBT residuals in the elevation range of 4000–5000 m reflected the shielding effect on microwave radiation from thawing permafrost on the plateau in March and April, 2021. This research provides a detailed technique to extract and discriminate the seismic MBT anomaly, and the revealed results reflect well the joint effect of seismic activity and regional coversphere environment on satellite-observed MBT. Full article
(This article belongs to the Special Issue Remote Sensing for Seismology)
Show Figures

Graphical abstract

21 pages, 9055 KiB  
Article
Factors Driving Changes in Vegetation in Mt. Qomolangma (Everest): Implications for the Management of Protected Areas
by Binghua Zhang, Yili Zhang, Zhaofeng Wang, Mingjun Ding, Linshan Liu, Lanhui Li, Shicheng Li, Qionghuan Liu, Basanta Paudel and Huamin Zhang
Remote Sens. 2021, 13(22), 4725; https://doi.org/10.3390/rs13224725 - 22 Nov 2021
Cited by 6 | Viewed by 2143
Abstract
The Mt. Qomolangma (Everest) National Nature Preserve (QNNP) is among the highest natural reserves in the world. Monitoring the spatiotemporal changes in the vegetation in this complex vertical ecosystem can provide references for decision makers to formulate and adapt strategies. Vegetation growth in [...] Read more.
The Mt. Qomolangma (Everest) National Nature Preserve (QNNP) is among the highest natural reserves in the world. Monitoring the spatiotemporal changes in the vegetation in this complex vertical ecosystem can provide references for decision makers to formulate and adapt strategies. Vegetation growth in the reserve and the factors driving it remains unclear, especially in the last decade. This study uses the normalized difference vegetation index (NDVI) in a linear regression model and the Breaks for Additive Seasonal and Trend (BFAST) algorithm to detect the spatiotemporal patterns of the variations in vegetation in the reserve since 2000. To identify the factors driving the variations in the NDVI, the partial correlation coefficient and multiple linear regression were used to quantify the impact of climatic factors, and the effects of time lag and time accumulation were also considered. We then calculated the NDVI variations in different zones of the reserve to examine the impact of conservation on the vegetation. The results show that in the past 19 years, the NDVI in the QNNP has exhibited a greening trend (slope = 0.0008/yr, p < 0.05), where the points reflecting the transition from browning to greening (17.61%) had a much higher ratio than those reflecting the transition from greening to browning (1.72%). Shift points were detected in 2010, following which the NDVI tendencies of all the vegetation types and the entire preserve increased. Considering the effects of time lag and time accumulation, climatic factors can explain 44.04% of the variation in vegetation. No climatic variable recorded a change around 2010. Considering the human impact, we found that vegetation in the core zone and the buffer zone had generally grown better than the vegetation in the test zone in terms of the tendency of growth, the rate of change, and the proportions of different types of variations and shifts. A policy-induced reduction in livestock after 2010 might explain the changes in vegetation in the QNNP. Full article
Show Figures

Figure 1

28 pages, 9421 KiB  
Article
Knowledge-Aided Ground Moving Target Relocation for Airborne Dual-Channel Wide-Area Radar by Exploiting the Antenna Pattern Information
by Hongmeng Chen, Zeyu Wang, Wenquan Gao, Hanwei Sun, Yaobing Lu and Yachao Li
Remote Sens. 2021, 13(22), 4724; https://doi.org/10.3390/rs13224724 - 22 Nov 2021
Cited by 2 | Viewed by 1571
Abstract
This paper addresses the problem of ground moving target relocation (GMTR) for airborne dual-channel wide-area radar systems. The monopulse technique can be utilized to perform GMTR. However, in real conditions, the GMTR performance degrades greatly due to the effect of channel mismatch. To [...] Read more.
This paper addresses the problem of ground moving target relocation (GMTR) for airborne dual-channel wide-area radar systems. The monopulse technique can be utilized to perform GMTR. However, in real conditions, the GMTR performance degrades greatly due to the effect of channel mismatch. To tackle this problem, prior knowledge of the antenna pattern information is fully utilized to improve the GMTR performance, and a knowledge-aided GMTR algorithm (KA-GMTR) for airborne dual-channel wide-area radar is proposed in this paper. First, the GMTR model for the two receiving channels is analyzed. The channel mismatch model is constructed, and its expression is derived. Then, the channel mismatch phase error is well estimated by exploiting the prior antenna pattern information based on the least squares (LS) method. Meanwhile, the knowledge-aided monopulse curve (KA-MPC) is derived to perform the direction of arrival (DOA) estimation for potential targets. Finally, KA-GMTR, based on the KA-MPC, is performed to estimate the azimuth offsets and relocate the geometry positions of the potential targets when channel mismatch occurs. Moreover, the target relocation performance is analyzed, and the intrinsic reason that degrades the target relocation accuracy is figured out. The performance assessment based on airborne real-data, also in comparison to the conventional GMTR method, has demonstrated that our proposed KA-GMTR algorithm offers preferable target relocation results under channel mismatch scenarios. Full article
Show Figures

Figure 1

27 pages, 23056 KiB  
Article
Reconstruction of All-Weather Daytime and Nighttime MODIS Aqua-Terra Land Surface Temperature Products Using an XGBoost Approach
by Weiwei Tan, Chunzhu Wei, Yang Lu and Desheng Xue
Remote Sens. 2021, 13(22), 4723; https://doi.org/10.3390/rs13224723 - 22 Nov 2021
Cited by 23 | Viewed by 2615
Abstract
Generating spatiotemporally continuous land surface temperature (LST) data is in great demand for hydrology, meteorology, ecology, environmental studies, etc. However, the thermal infrared (TIR)-based LST measurements are prone to cloud contamination with missing pixels. To repair the missing pixels, a new XGBoost-based linking [...] Read more.
Generating spatiotemporally continuous land surface temperature (LST) data is in great demand for hydrology, meteorology, ecology, environmental studies, etc. However, the thermal infrared (TIR)-based LST measurements are prone to cloud contamination with missing pixels. To repair the missing pixels, a new XGBoost-based linking approach for reconstructing daytime and nighttime Moderate Resolution Imaging Spectroradiometer (MODIS) LST measurements was introduced. The instantaneous solar radiation and two soil-related predictors from China Data Assimilation System (CLDAS) 0.0625°/1-h data were selected as the linking variables to depict the relationship with instantaneous MODIS LST data. Other land surface properties, including two vegetation indices, the water index, the surface albedo, and topographic parameters, were also used as the predictor variables. The XGBoost method was used to fit an LST linking model by the training datasets from clear-sky pixels and was then applied to the MODIS Aqua-Terra LSTs during summer time (June to August) in 2017 and 2018 across China. The recovered LST data was further rectified with the Savitzky–Golay (SG) filtering method. The results showed the distribution of the reconstructed LSTs present a reasonable pattern for different land-cover types and topography. The evaluation results using in situ longwave radiation measurements showed the RMSE varies from 3.91 K to 5.53 K for the cloud-free pixels and from 4.42 K to 4.97 K for the cloud-covered pixels. In addition, the reconstructed LST products correlated well with CLDAS LST data with similar LST spatial patterns. The variable importance analysis revealed that the two soil-related predictors and the elevation variable are key parameters due to their great contribution to the XGBoost model performance. Full article
Show Figures

Graphical abstract

20 pages, 6433 KiB  
Article
Influence of Storm Tidal Current Field and Sea Bottom Slope on Coastal Ocean Waves during Typhoon Malakas
by Meng Sun, Yongzeng Yang, Yutao Chi, Tianqi Sun, Yongfang Shi and Zengrui Rong
Remote Sens. 2021, 13(22), 4722; https://doi.org/10.3390/rs13224722 - 22 Nov 2021
Viewed by 2670
Abstract
Wave–current interaction in coastal regions is significant and complicated. Most wave models consider the influence of ocean current and water depth on waves, while the influence of the gradient of the sea bottom slope is not taken into account in most research. This [...] Read more.
Wave–current interaction in coastal regions is significant and complicated. Most wave models consider the influence of ocean current and water depth on waves, while the influence of the gradient of the sea bottom slope is not taken into account in most research. This study aimed to analyze and quantify the contribution of storm tidal currents to coastal ocean waves in a case where sea bottom slope was not ignored. Fourier analysis was applied to solve the governing equation and boundary conditions, and an analytic model for the calculation of the variation of amplitude of wave orbital motion was proposed. Ocean currents affect ocean waves through resonance. In this paper, an implemented instance of this analytic model was given, using the Shengsi area during Typhoon Malakas as an example. The results suggest that vertical variation in the amplitude of wave orbital motion is remarkable. The impact of wave–current interaction is noticeable where the gradient of the sea bottom slope is relatively large. Full article
(This article belongs to the Special Issue Coastal Environments and Coastal Hazards)
Show Figures

Figure 1

14 pages, 5967 KiB  
Article
Transforming Access to and Use of Climate Information Products Derived from Remote Sensing and In Situ Observations
by Gloriose Nsengiyumva, Tufa Dinku, Remi Cousin, Igor Khomyakov, Audrey Vadillo, Rija Faniriantsoa and Amanda Grossi
Remote Sens. 2021, 13(22), 4721; https://doi.org/10.3390/rs13224721 - 22 Nov 2021
Cited by 8 | Viewed by 2737
Abstract
Making climate-sensitive economic sectors resilient to climate trends and shocks, through adaptation to climate change and managing uncertainties associated with climate extremes, will require effective use of climate information to help practitioners make climate-informed decisions. The provision of weather and climate information will [...] Read more.
Making climate-sensitive economic sectors resilient to climate trends and shocks, through adaptation to climate change and managing uncertainties associated with climate extremes, will require effective use of climate information to help practitioners make climate-informed decisions. The provision of weather and climate information will depend on the availability of climate data and its presentation in formats that are useful for decision making at different levels. However, in many places around the world, including most African countries, the collection of climate data has been seriously inadequate, and even when available, poorly accessible. On the other hand, the availability of climate data by itself may not lead to the uptake and use of such data. These data must be presented in user-friendly formats addressing specific climate information needs in order to be used for decision-making by governments, as well as the public and private sectors. The generated information should also be easily accessible. The Enhancing National Climate Services (ENACTS) initiative, led by Columbia University’s International Research Institute for Climate and Society (IRI), has been making efforts to overcome these challenges by supporting countries to improve the available climate data, as well as access to and use of climate information products at relevant spatial and temporal scales. Challenges to the availability of climate data are alleviated by combining data from the national weather observation network with remote sensing and other global proxies to generate spatially and temporally complete climate datasets. Access to climate information products is enhanced by developing an online mapping service that provides a user-friendly interface for analyzing and visualizing climate information products such as maps and graphs. Full article
(This article belongs to the Special Issue Estimating Meteorological Variables by Remote Sensing Data)
Show Figures

Graphical abstract

25 pages, 7521 KiB  
Article
Seamless Mosaicking of UAV-Based Push-Broom Hyperspectral Images for Environment Monitoring
by Lina Yi, Jing M. Chen, Guifeng Zhang, Xiao Xu, Xing Ming and Wenji Guo
Remote Sens. 2021, 13(22), 4720; https://doi.org/10.3390/rs13224720 - 22 Nov 2021
Cited by 16 | Viewed by 2341
Abstract
This paper proposes a systematic image mosaicking methodology to produce hyperspectral image for environment monitoring using an emerging UAV-based push-broom hyperspectral imager. The suitability of alternative methods in each step is assessed by experiments of an urban scape, a river course and a [...] Read more.
This paper proposes a systematic image mosaicking methodology to produce hyperspectral image for environment monitoring using an emerging UAV-based push-broom hyperspectral imager. The suitability of alternative methods in each step is assessed by experiments of an urban scape, a river course and a forest study area. First, the hyperspectral image strips were acquired by sequentially stitching the UAV images acquired by push-broom scanning along each flight line. Next, direct geo-referencing was applied to each image strip to get initial geo-rectified result. Then, with ground control points, the curved surface spline function was used to transform the initial geo-rectified image strips to improve their geometrical accuracy. To further remove the displacement between pairs of image strips, an improved phase correlation (IPC) and a SIFT and RANSAC-based method (SR) were used in image registration. Finally, the weighted average and the best stitching image fusion method were used to remove the spectral differences between image strips and get the seamless mosaic. Experiment results showed that as the GCPs‘ number increases, the mosaicked image‘s geometrical accuracy increases. In image registration, there exists obvious edge information that can be accurately extracted from the urban scape and river course area; comparative results can be achieved by the IPC method with less time cost. However, for the ground objects with complex texture like forest, the edges extracted from the image is prone to be inaccurate and result in the failure of the IPC method, and only the SR method can get a good result. In image fusion, the best stitching fusion method can get seamless results for all three study areas. Whereas, the weighted average fusion method was only useful in eliminating the stitching line for the river course and forest areas but failed for the urban scape area due to the spectral heterogeneity of different ground objects. For different environment monitoring applications, the proposed methodology provides a practical solution to seamlessly mosaic UAV-based push-broom hyperspectral images with high geometrical accuracy and spectral fidelity. Full article
Show Figures

Figure 1

13 pages, 1861 KiB  
Article
Monitoring Rainfed Alfalfa Growth in Semiarid Agrosystems Using Sentinel-2 Imagery
by Andrés Echeverría, Alejandro Urmeneta, María González-Audícana and Esther M González
Remote Sens. 2021, 13(22), 4719; https://doi.org/10.3390/rs13224719 - 22 Nov 2021
Cited by 4 | Viewed by 1860
Abstract
The aim of this study was to assess the utility of Sentinel-2 images in the monitoring of the fractional vegetation cover (FVC) of rainfed alfalfa in semiarid areas such as that of Bardenas Reales in Spain. FVC was sampled in situ using 1 [...] Read more.
The aim of this study was to assess the utility of Sentinel-2 images in the monitoring of the fractional vegetation cover (FVC) of rainfed alfalfa in semiarid areas such as that of Bardenas Reales in Spain. FVC was sampled in situ using 1 m2 surfaces at 172 points inside 18 alfalfa fields from late spring to early summer in 2017 and 2018. Different vegetation indices derived from a series of Sentinel-2 images were calculated and were then correlated with the FVC measurements at the pixel and parcel levels using different types of equations. The results indicate that the normalized difference vegetation index (NDVI) and FVC were highly correlated at the parcel level (R2 = 0.712), whereas the correlation at the pixel level remained moderate across each of the years studied. Based on the findings, another 29 alfalfa plots (28 rainfed; 1 irrigated) were remotely monitored operationally for 3 years (2017–2019), revealing that location and weather conditions were strong determinants of alfalfa growth in Bardenas Reales. The results of this study indicate that Sentinel-2 imagery is a suitable tool for monitoring rainfed alfalfa pastures in semiarid areas, thus increasing the potential success of pasture management. Full article
(This article belongs to the Special Issue Remote Sensing of Agro-Ecosystems)
Show Figures

Figure 1

15 pages, 5936 KiB  
Article
Retreating Shorelines as an Emerging Threat to Adélie Penguins on Inexpressible Island
by Xintong Chen, Jiquan Chen, Xiao Cheng, Lizhong Zhu, Bing Li and Xianglan Li
Remote Sens. 2021, 13(22), 4718; https://doi.org/10.3390/rs13224718 - 22 Nov 2021
Cited by 2 | Viewed by 1953
Abstract
Long-term observation of penguin abundance and distribution may warn of changes in the Antarctic marine ecosystem and provide support for penguin conservation. We conducted an unmanned aerial vehicle (UAV) survey of the Adélie penguin (Pygoscelis adeliae) colony on Inexpressible Island and [...] Read more.
Long-term observation of penguin abundance and distribution may warn of changes in the Antarctic marine ecosystem and provide support for penguin conservation. We conducted an unmanned aerial vehicle (UAV) survey of the Adélie penguin (Pygoscelis adeliae) colony on Inexpressible Island and obtained aerial images with a resolution of 0.07 m in 2018. We estimated penguin abundance and identified the spatial extent of the penguin colony. A total of 24,497 breeding pairs were found on Inexpressible Island within a colony area of 57,507 m2. Based on historical images, the colony area expanded by 30,613 m2 and abundance increased by 4063 pairs between 1983 and 2012. Between 2012 and 2018 penguin abundance further increased by 3314 pairs, although the colony area decreased by 1903 m2. In general, Adélie penguins bred on Inexpressible Island at an elevation <20 m, and >55% of penguins had territories within 150 m of the shoreline. This suggests that penguins prefer to breed in areas with a low elevation and close to the shoreline. We observed a retreat of the shoreline on Inexpressible Island between 1983 and 2018, especially along the northern coast, which may have played a key role in the expansion of the penguin colony on the northern coast. In sum, it appears that retreating shorelines reshaped penguin distribution on the island and may be an emerging risk factor for penguins. These results highlight the importance of remote sensing techniques for monitoring changes in the Antarctic marine ecosystem and providing reliable data for Antarctic penguin conservation. Full article
Show Figures

Figure 1

15 pages, 2511 KiB  
Technical Note
Variations in Nocturnal Residual Layer Height and Its Effects on Surface PM2.5 over Wuhan, China
by Xin Ma, Weicheng Jiang, Hui Li, Yingying Ma, Shikuan Jin, Boming Liu and Wei Gong
Remote Sens. 2021, 13(22), 4717; https://doi.org/10.3390/rs13224717 - 22 Nov 2021
Cited by 3 | Viewed by 1881
Abstract
Large amounts of aerosols remain in the residual layer (RL) after sunset, which may be the source of the next day’s pollutants. However, the characteristics of the nocturnal residual layer height (RLH) and its effect on urban environment pollution are unknown. In this [...] Read more.
Large amounts of aerosols remain in the residual layer (RL) after sunset, which may be the source of the next day’s pollutants. However, the characteristics of the nocturnal residual layer height (RLH) and its effect on urban environment pollution are unknown. In this study, the characteristics of the RLH and its effect on fine particles with diameters <2.5 μm (PM2.5) were investigated using lidar data from January 2017 to December 2019. The results show that the RLH is highest in summer (1.55 ± 0.55 km), followed by spring (1.40 ± 0.58 km) and autumn (1.26 ± 0.47 km), and is lowest in winter (1.11 ± 0.44 km). The effect of surface meteorological factors on the RLH were also studied. The correlation coefficients (R) between the RLH and the temperature, relative humidity, wind speed, and pressure were 0.38, −0.18, 0.15, and −0.36, respectively. The results indicate that the surface meteorological parameters exhibit a slight correlation with the RLH, but the high relative humidity was accompanied by a low RLH and high PM2.5 concentrations. Finally, the influence of the RLH on PM2.5 was discussed under different aerosol-loading periods. The aerosol optical depth (AOD) was employed to represent the total amount of pollutants. The results show that the RLH has an effect on PM2.5 when the AOD is small but has almost no effect on PM2.5 when the AOD is high. In addition, the R between the nighttime mean RLH and the following daytime PM2.5 at low AOD is −0.49, suggesting that the RLH may affect the following daytime surface PM2.5. The results of this study have a guiding significance for understanding the interaction between aerosols and the boundary layer. Full article
Show Figures

Figure 1

19 pages, 2726 KiB  
Article
Quick Detection of Field-Scale Soil Comprehensive Attributes via the Integration of UAV and Sentinel-2B Remote Sensing Data
by Wanxue Zhu, Ehsan Eyshi Rezaei, Hamideh Nouri, Ting Yang, Binbin Li, Huarui Gong, Yun Lyu, Jinbang Peng and Zhigang Sun
Remote Sens. 2021, 13(22), 4716; https://doi.org/10.3390/rs13224716 - 22 Nov 2021
Cited by 15 | Viewed by 3479
Abstract
Satellite and unmanned aerial vehicle (UAV) remote sensing can be used to estimate soil properties; however, little is known regarding the effects of UAV and satellite remote sensing data integration on the estimation of soil comprehensive attributes, or how to estimate quickly and [...] Read more.
Satellite and unmanned aerial vehicle (UAV) remote sensing can be used to estimate soil properties; however, little is known regarding the effects of UAV and satellite remote sensing data integration on the estimation of soil comprehensive attributes, or how to estimate quickly and robustly. In this study, we tackled those gaps by employing UAV multispectral and Sentinel-2B data to estimate soil salinity and chemical properties over a large agricultural farm (400 ha) covered by different crops and harvest areas at the coastal saline-alkali land of the Yellow River Delta of China in 2019. Spatial information of soil salinity, organic matter, available/total nitrogen content, and pH at 0–10 cm and 10–20 cm layers were obtained via ground sampling (n = 195) and two-dimensional spatial interpolation, aiming to overlap the soil information with remote sensing information. The exploratory factor analysis was conducted to generate latent variables, which represented the salinity and chemical characteristics of the soil. A machine learning algorithm (random forest) was applied to estimate soil attributes. Our results indicated that the integration of UAV texture and Sentinel-2B spectral data as random forest model inputs improved the accuracy of latent soil variable estimation. The remote sensing-based information from cropland (crop-based) had a higher accuracy compared to estimations performed on bare soil (soil-based). Therefore, the crop-based approach, along with the integration of UAV texture and Sentinel-2B data, is recommended for the quick assessment of soil comprehensive attributes. Full article
(This article belongs to the Special Issue UAVs in Sustainable Agriculture)
Show Figures

Figure 1

18 pages, 3710 KiB  
Article
Improving the iGNSS-R Ocean Altimetric Precision Based on the Coherent Integration Time Optimization Model
by Xuezhi Sun, Wei Zheng, Fan Wu and Zongqiang Liu
Remote Sens. 2021, 13(22), 4715; https://doi.org/10.3390/rs13224715 - 22 Nov 2021
Cited by 3 | Viewed by 1438
Abstract
Improving the altimetric precision under the requirement of ensuring the along-track resolution is of great significance to the application of iGNSS-R satellite ocean altimetry. The results obtained by using the empirical integration time need to be improved. Optimizing the integration time can suppress [...] Read more.
Improving the altimetric precision under the requirement of ensuring the along-track resolution is of great significance to the application of iGNSS-R satellite ocean altimetry. The results obtained by using the empirical integration time need to be improved. Optimizing the integration time can suppress the noise interference from different sources to the greatest extent, thereby improving the altimetric precision. The inverse relationship between along-track resolution and signal integration time leads to the latter not being infinite. To obtain the optimal combination of integral parameters, this study first constructs an analytical model whose precision varies with coherent integration time. Second, the model is verified using airborne experimental data. The result shows that the average deviation between the model and the measured precision is about 0.16 m. The two are consistent. Third, we apply the model to obtain the optimal coherent integration time of the airborne experimental scenario. Compared with the empirical coherent integration parameters, the measured precision is improved by about 0.1 m. Fourth, the verified model is extrapolated to different spaceborne scenarios. Then, the optimal coherent integration time and the improvement of measured precision under various conditions are estimated. It was found that the optimal coherent integration time of the spaceborne scene is shorter than that of the airborne scene. Depending on the orbital altitude and the roughness of the sea surface, its value may also vary. Moreover, the model can significantly improve the precision for low signal-to-noise ratios. The coherent integration time optimization model proposed in this paper can enhance the altimetric precision. It would provide theoretical support for the signal optimization processing and sea surface height retrieval of iGNSS-R altimetry satellites with high precision and high along-track resolution in the future. Full article
(This article belongs to the Special Issue BDS/GNSS for Earth Observation)
Show Figures

Graphical abstract

14 pages, 7563 KiB  
Article
Longitudinal Structure in the Altitude of the Sporadic E Observed by COSMIC in Low-Latitudes
by Zhendi Liu, Qingfeng Li, Hanxian Fang and Ze Gao
Remote Sens. 2021, 13(22), 4714; https://doi.org/10.3390/rs13224714 - 21 Nov 2021
Cited by 2 | Viewed by 1785
Abstract
The longitudinal structure in the altitude of the Sporadic E (Es) was investigated for the first time based on the S4 index provided by the Constellation Observing System for Meteorology, Ionosphere, and Climate (COSMIC) in low latitudes. The longitudinal structure is identified as [...] Read more.
The longitudinal structure in the altitude of the Sporadic E (Es) was investigated for the first time based on the S4 index provided by the Constellation Observing System for Meteorology, Ionosphere, and Climate (COSMIC) in low latitudes. The longitudinal structure is identified as a symmetrically located wavenumber-4 (WN4) pattern within 30°S–30°N. The WN4 occurs primarily during the daytime at the June solstice and equinoxes, with the largest amplitude at the September equinox and the smallest one at the March equinox. It moves eastward with a speed of ~90°/day. The strongest WN4 appears within 10–20°N and 5–15°S in the Northern and Southern hemispheres, respectively. At the June solstice and the September equinox, the WN4 is stronger in the Northern hemisphere than in the Southern hemisphere, while the situation is reversed at the March equinox. The altitude distribution of the convergence null in the diurnal eastward non-migrating tide with zonal wavenumber-3 (DE3) for the zonal wind is similar to that of the WN4. This and other similar features, such as the seasonal variation, eastward speed, and the symmetrical locations, support the dominant role of the DE3 tide for the formation of the WN4 structure. Full article
(This article belongs to the Section Atmospheric Remote Sensing)
Show Figures

Figure 1

24 pages, 82153 KiB  
Article
Paris-CARLA-3D: A Real and Synthetic Outdoor Point Cloud Dataset for Challenging Tasks in 3D Mapping
by Jean-Emmanuel Deschaud, David Duque, Jean Pierre Richa, Santiago Velasco-Forero, Beatriz Marcotegui and François Goulette
Remote Sens. 2021, 13(22), 4713; https://doi.org/10.3390/rs13224713 - 21 Nov 2021
Cited by 31 | Viewed by 7095
Abstract
Paris-CARLA-3D is a dataset of several dense colored point clouds of outdoor environments built by a mobile LiDAR and camera system. The data are composed of two sets with synthetic data from the open source CARLA simulator (700 million points) and real data [...] Read more.
Paris-CARLA-3D is a dataset of several dense colored point clouds of outdoor environments built by a mobile LiDAR and camera system. The data are composed of two sets with synthetic data from the open source CARLA simulator (700 million points) and real data acquired in the city of Paris (60 million points), hence the name Paris-CARLA-3D. One of the advantages of this dataset is to have simulated the same LiDAR and camera platform in the open source CARLA simulator as the one used to produce the real data. In addition, manual annotation of the classes using the semantic tags of CARLA was performed on the real data, allowing the testing of transfer methods from the synthetic to the real data. The objective of this dataset is to provide a challenging dataset to evaluate and improve methods on difficult vision tasks for the 3D mapping of outdoor environments: semantic segmentation, instance segmentation, and scene completion. For each task, we describe the evaluation protocol as well as the experiments carried out to establish a baseline. Full article
(This article belongs to the Special Issue Advances in Mobile Mapping Technologies)
Show Figures

Figure 1

51 pages, 51599 KiB  
Review
Review of Image Classification Algorithms Based on Convolutional Neural Networks
by Leiyu Chen, Shaobo Li, Qiang Bai, Jing Yang, Sanlong Jiang and Yanming Miao
Remote Sens. 2021, 13(22), 4712; https://doi.org/10.3390/rs13224712 - 21 Nov 2021
Cited by 162 | Viewed by 39250
Abstract
Image classification has always been a hot research direction in the world, and the emergence of deep learning has promoted the development of this field. Convolutional neural networks (CNNs) have gradually become the mainstream algorithm for image classification since 2012, and the CNN [...] Read more.
Image classification has always been a hot research direction in the world, and the emergence of deep learning has promoted the development of this field. Convolutional neural networks (CNNs) have gradually become the mainstream algorithm for image classification since 2012, and the CNN architecture applied to other visual recognition tasks (such as object detection, object localization, and semantic segmentation) is generally derived from the network architecture in image classification. In the wake of these successes, CNN-based methods have emerged in remote sensing image scene classification and achieved advanced classification accuracy. In this review, which focuses on the application of CNNs to image classification tasks, we cover their development, from their predecessors up to recent state-of-the-art (SOAT) network architectures. Along the way, we analyze (1) the basic structure of artificial neural networks (ANNs) and the basic network layers of CNNs, (2) the classic predecessor network models, (3) the recent SOAT network algorithms, (4) comprehensive comparison of various image classification methods mentioned in this article. Finally, we have also summarized the main analysis and discussion in this article, as well as introduce some of the current trends. Full article
(This article belongs to the Special Issue Deep Learning for Remote Sensing Image Classification)
Show Figures

Graphical abstract

20 pages, 25179 KiB  
Article
Assessing Non-Photosynthetic Cropland Biomass from Spaceborne Hyperspectral Imagery
by Katja Berger, Tobias Hank, Andrej Halabuk, Juan Pablo Rivera-Caicedo, Matthias Wocher, Matej Mojses, Katarina Gerhátová, Giulia Tagliabue, Miguel Morata Dolz, Ana Belen Pascual Venteo and Jochem Verrelst
Remote Sens. 2021, 13(22), 4711; https://doi.org/10.3390/rs13224711 - 21 Nov 2021
Cited by 16 | Viewed by 3264
Abstract
Non-photosynthetic vegetation (NPV) biomass has been identified as a priority variable for upcoming spaceborne imaging spectroscopy missions, calling for a quantitative estimation of lignocellulosic plant material as opposed to the sole indication of surface coverage. Therefore, we propose a hybrid model for the [...] Read more.
Non-photosynthetic vegetation (NPV) biomass has been identified as a priority variable for upcoming spaceborne imaging spectroscopy missions, calling for a quantitative estimation of lignocellulosic plant material as opposed to the sole indication of surface coverage. Therefore, we propose a hybrid model for the retrieval of non-photosynthetic cropland biomass. The workflow included coupling the leaf optical model PROSPECT-PRO with the canopy reflectance model 4SAIL, which allowed us to simulate NPV biomass from carbon-based constituents (CBC) and leaf area index (LAI). PROSAIL-PRO provided a training database for a Gaussian process regression (GPR) algorithm, simulating a wide range of non-photosynthetic vegetation states. Active learning was employed to reduce and optimize the training data set. In addition, we applied spectral dimensionality reduction to condense essential information of non-photosynthetic signals. The resulting NPV-GPR model was successfully validated against soybean field data with normalized root mean square error (nRMSE) of 13.4% and a coefficient of determination (R2) of 0.85. To demonstrate mapping capability, the NPV-GPR model was tested on a PRISMA hyperspectral image acquired over agricultural areas in the North of Munich, Germany. Reliable estimates were mainly achieved over senescent vegetation areas as suggested by model uncertainties. The proposed workflow is the first step towards the quantification of non-photosynthetic cropland biomass as a next-generation product from near-term operational missions, such as CHIME. Full article
(This article belongs to the Special Issue Global Vegetation Monitoring by Hyperspectral Imaging)
Show Figures

Graphical abstract

18 pages, 2205 KiB  
Article
Crop Water Stress Index as a Proxy of Phenotyping Maize Performance under Combined Water and Salt Stress
by Shujie Gu, Qi Liao, Shaoyu Gao, Shaozhong Kang, Taisheng Du and Risheng Ding
Remote Sens. 2021, 13(22), 4710; https://doi.org/10.3390/rs13224710 - 21 Nov 2021
Cited by 13 | Viewed by 3957
Abstract
The crop water stress index (CWSI), based on canopy temperature (Tc), has been widely used in evaluating plant water status and planning irrigation scheduling, but whether CWSI can diagnose the stress status of crops and predict the physiological traits and growth [...] Read more.
The crop water stress index (CWSI), based on canopy temperature (Tc), has been widely used in evaluating plant water status and planning irrigation scheduling, but whether CWSI can diagnose the stress status of crops and predict the physiological traits and growth under combined water and salt stress remains to be further studied. Here, a model of CWSI was established based on the continuous measurements of Tc for two maize genotypes (ZD958 and XY335) under two water and salt conditions, combined with growth stage-specific non-water-stressed baselines (NWSB). The relationships between physiology, growth, and yield of maize with CWSI were analyzed. There were significant differences in NWSB between the two maize genotypes at the same and different growth stages; thus, growth stage-specific NWSBs were used. The difference in NWSB was due to the difference and change in effective leaf width. CWSI was closely related to leaf water potential, stomatal conductance, and net photosynthetic rate under different water and salt stress, and also explained the variations in leaf area index, biomass, water use, and yield. Collectively, CWSI can be used as a proxy indicator of high-throughput phenotyping maize performance under combined water and salt stress, which will be valuable for predicting yield and improving water use efficiency. Full article
(This article belongs to the Special Issue Remote Sensing in Irrigated Crop Water Stress Assessment)
Show Figures

Figure 1

17 pages, 3932 KiB  
Article
Analysis of the Impacts of Environmental Factors on Rat Hole Density in the Northern Slope of the Tienshan Mountains with Satellite Remote Sensing Data
by Haiyang Shi, Qun Pan, Geping Luo, Olaf Hellwich, Chunbo Chen, Tim Van de Voorde, Alishir Kurban, Philippe De Maeyer and Shixin Wu
Remote Sens. 2021, 13(22), 4709; https://doi.org/10.3390/rs13224709 - 21 Nov 2021
Cited by 5 | Viewed by 2218
Abstract
Understanding the impacts of environmental factors on spatial–temporal and large-scale rodent distribution is important for rodent damage prevention. Investigating rat hole density (RHD) is one of the most effective methods to obtain the intensity of rodent damage. However, most of the previous field [...] Read more.
Understanding the impacts of environmental factors on spatial–temporal and large-scale rodent distribution is important for rodent damage prevention. Investigating rat hole density (RHD) is one of the most effective methods to obtain the intensity of rodent damage. However, most of the previous field surveys or UAV-based remote sensing methods can only evaluate small-scale RHD and its influencing factors. However, these studies did not consider large-scale temporal and spatial heterogeneity. Therefore, we collected small-scale and in situ measurement records of RHD on the northern slope of the Tien Shan Mountains in Xinjiang (NTXJ), China, from 1982 to 2015, and then used correlation analysis and Bayesian network (BN) to analyze the environmental impacts on large-scale RHD with satellite remote sensing data such as the GIMMS NDVI product. The results show that the built BN can better quantify causality in the environmental mechanism modeling of RHD. The NDVI and LAI data from satellite remote sensing are important to the spatial–temporal RHD distribution and the mapping in the future. In regions with an elevation higher than 600 m (UPR) and lower than 600 m (LWR) of NTXJ, there are significant differences in the driving mechanism patterns of RHD, which are dependent on the elevation variation. In LWR, vegetation conditions have a weaker impact on RHD than UPR. It is possibly due to the Artemisia eaten by the dominant species Lagurus luteus (LL) in UPR being more sensitive to precipitation and temperature if compared with the Haloxylon ammodendron eaten by the Rhombomys opimus (RO) in LWR. In LWR, grazing intensity is more strongly and positively correlated to RHD than UPR, possibly due to both winter grazing and RO dependency on vegetation distribution; moreover, in UPR, sheep do not feed Artemisia as the main food, and the total vegetation is sufficient for sheep and LL to coexist. Under the different conditions of water availability of LWR and UPR, grazing may affect the ratio of aboveground and underground biomass by photosynthate allocation, thereby affecting the distribution of RHD. In extremely dry years, the RHD of LWR and UPR may have an indirect interactive relation due to changes in grazing systems. Full article
Show Figures

Graphical abstract

19 pages, 4734 KiB  
Article
Improving Urban Land Cover Classification in Cloud-Prone Areas with Polarimetric SAR Images
by Jing Ling, Hongsheng Zhang and Yinyi Lin
Remote Sens. 2021, 13(22), 4708; https://doi.org/10.3390/rs13224708 - 21 Nov 2021
Cited by 16 | Viewed by 2458
Abstract
Urban land cover (ULC) serves as fundamental environmental information for urban studies, while accurate and timely ULC mapping remains challenging due to cloud contamination in tropical and subtropical areas. Synthetic aperture radar (SAR) has excellent all-weather working capability to overcome the challenge, while [...] Read more.
Urban land cover (ULC) serves as fundamental environmental information for urban studies, while accurate and timely ULC mapping remains challenging due to cloud contamination in tropical and subtropical areas. Synthetic aperture radar (SAR) has excellent all-weather working capability to overcome the challenge, while optical SAR data fusion is often required due to the limited land surface information provided by SAR. However, the mechanism by which SAR can compensate optical images, given the occurrence of clouds, in order to improve the ULC mapping, remains unexplored. To address the issue, this study proposes a framework, through various sampling strategies and three typical supervised classification methods, to quantify the ULC classification accuracy using optical and SAR data with various cloud levels. The land cover confusions were investigated in detail to understand the role of SAR in distinguishing land cover under different types of cloud coverage. Several interesting experimental results were found. First, 50% cloud coverage over the optical images decreased the overall accuracy by 10–20%, while the incorporation of SAR images was able to improve the overall accuracy by approximately 4%, by increasing the recognition of cloud-covered ULC information, particularly the water bodies. Second, if all the training samples were not contaminated by clouds, the cloud coverage had a higher impact with a reduction of 35% in the overall accuracy, whereas the incorporation of SAR data contributed to an increase of approximately 5%. Third, the thickness of clouds also brought about different impacts on the results, with an approximately 10% higher reduction from thick clouds compared with that from thin clouds, indicating that certain spectral information might still be available in the areas covered by thin clouds. These findings provide useful references for the accurate monitoring of ULC over cloud-prone areas, such as tropical and subtropical cities, where cloud contamination is often unavoidable. Full article
(This article belongs to the Special Issue Applications of Remote Sensing Imagery for Urban Areas)
Show Figures

Figure 1

29 pages, 8691 KiB  
Article
Vertical Differences in the Long-Term Trends and Breakpoints of NDVI and Climate Factors in Taiwan
by Hui Ping Tsai, Geng-Gui Wang and Zhong-Han Zhuang
Remote Sens. 2021, 13(22), 4707; https://doi.org/10.3390/rs13224707 - 21 Nov 2021
Viewed by 2264
Abstract
This study explored the long-term trends and breakpoints of vegetation, rainfall, and temperature in Taiwan from overall and regional perspectives in terms of vertical differences from 1982 to 2012. With time-series Advanced Very-High-Resolution Radiometer (AVHRR) normalized difference vegetation index (NDVI) data and Taiwan [...] Read more.
This study explored the long-term trends and breakpoints of vegetation, rainfall, and temperature in Taiwan from overall and regional perspectives in terms of vertical differences from 1982 to 2012. With time-series Advanced Very-High-Resolution Radiometer (AVHRR) normalized difference vegetation index (NDVI) data and Taiwan Climate Change Estimate and Information Platform (TCCIP) gridded monthly climatic data, their vertical dynamics were investigated by employing the Breaks for Additive Seasonal and Trend (BFAST) algorithm, Pearson’s correlation analysis, and the Durbin–Watson test. The vertical differences in NDVI values presented three breakpoints and a consistent trend from positive (1982 to 1989) to negative at varied rates, and then gradually increased after 2000. In addition, a positive rainfall trend was discovered. Average and maximum temperature had similar increasing trends, while minimum temperature showed variations, especially at higher altitudes. In terms of regional variations, the vegetation growth was stable in the north but worse in the central region. Higher elevations revealed larger variations in the NDVI and temperature datasets. NDVI, along with average and minimum temperature, showed their largest changes earlier in higher altitude areas. Specifically, the increasing minimum temperature direction was more prominent in the mid-to-high-altitude areas in the eastern and central regions. Seasonal variations were observed for each region. The difference between the dry and wet seasons is becoming larger, with the smallest difference in the northern region and the largest difference in the southern region. Taiwan’s NDVI and climatic factors have a significant negative correlation (p < 0.05), but the maximum and minimum temperatures have significant positive effects at low altitudes below 500 m. The northern and central regions reveal similar responses, while the south and east display different feedbacks. The results illuminate climate change evidence from assessment of the long-term dynamics of vegetation and climatic factors, providing valuable references for establishing correspondent climate-adaptive strategies in Taiwan. Full article
(This article belongs to the Special Issue Remote Sensing of Tropical Montane Ecosystems and Elevation Gradients)
Show Figures

Graphical abstract

22 pages, 6871 KiB  
Article
Lightweight Underwater Object Detection Based on YOLO v4 and Multi-Scale Attentional Feature Fusion
by Minghua Zhang, Shubo Xu, Wei Song, Qi He and Quanmiao Wei
Remote Sens. 2021, 13(22), 4706; https://doi.org/10.3390/rs13224706 - 21 Nov 2021
Cited by 76 | Viewed by 7707
Abstract
A challenging and attractive task in computer vision is underwater object detection. Although object detection techniques have achieved good performance in general datasets, problems of low visibility and color bias in the complex underwater environment have led to generally poor image quality; besides [...] Read more.
A challenging and attractive task in computer vision is underwater object detection. Although object detection techniques have achieved good performance in general datasets, problems of low visibility and color bias in the complex underwater environment have led to generally poor image quality; besides this, problems with small targets and target aggregation have led to less extractable information, which makes it difficult to achieve satisfactory results. In past research of underwater object detection based on deep learning, most studies have mainly focused on improving detection accuracy by using large networks; the problem of marine underwater lightweight object detection has rarely gotten attention, which has resulted in a large model size and slow detection speed; as such the application of object detection technologies under marine environments needs better real-time and lightweight performance. In view of this, a lightweight underwater object detection method based on the MobileNet v2, You Only Look Once (YOLO) v4 algorithm and attentional feature fusion has been proposed to address this problem, to produce a harmonious balance between accuracy and speediness for target detection in marine environments. In our work, a combination of MobileNet v2 and depth-wise separable convolution is proposed to reduce the number of model parameters and the size of the model. The Modified Attentional Feature Fusion (AFFM) module aims to better fuse semantic and scale-inconsistent features and to improve accuracy. Experiments indicate that the proposed method obtained a mean average precision (mAP) of 81.67% and 92.65% on the PASCAL VOC dataset and the brackish dataset, respectively, and reached a processing speed of 44.22 frame per second (FPS) on the brackish dataset. Moreover, the number of model parameters and the model size were compressed to 16.76% and 19.53% of YOLO v4, respectively, which achieved a good tradeoff between time and accuracy for underwater object detection. Full article
(This article belongs to the Special Issue Convolutional Neural Networks for Object Detection)
Show Figures

Graphical abstract

22 pages, 9666 KiB  
Article
Azimuth Multichannel Reconstruction Based on Advanced Hyperbolic Range Equation
by Wei Xu, Ruibo Li, Chonghua Fang, Pingping Huang, Weixian Tan and Yaolong Qi
Remote Sens. 2021, 13(22), 4705; https://doi.org/10.3390/rs13224705 - 21 Nov 2021
Cited by 4 | Viewed by 1763
Abstract
To acquire high-resolution wide-swath (HRWS) imaging capacity, the displaced phase center multichannel azimuth beam (DPCMAB) technology is usually adopted in spaceborne synthetic aperture radar (SAR), while multichannel reconstruction must be carried out before imaging process due to azimuth nonuniform sampling. Up to now, [...] Read more.
To acquire high-resolution wide-swath (HRWS) imaging capacity, the displaced phase center multichannel azimuth beam (DPCMAB) technology is usually adopted in spaceborne synthetic aperture radar (SAR), while multichannel reconstruction must be carried out before imaging process due to azimuth nonuniform sampling. Up to now, almost all azimuth multichannel reconstruction algorithms have been mainly based on conventional hyperbolic range equation (CHRE), but the accuracy of the CHRE model is usually not suitable for the HRWS mode, especially for high resolution and large squint observation cases. In this study, the azimuth multichannel signal model based on the advanced hyperbolic range equation (AHRE) is established and analyzed. The major difference between multichannel signal models based on CHRE and AHRE is the additional time-varying phase error between azimuth channels. The time-varying phase error is small and can be ignored in the monostatic DPCMAB SAR system, but it must be considered and compensated in the distributed DPCMAB SAR system. In addition to the time-varying phase error, additional Doppler spectrum shift and extended Doppler bandwidth should be considered in the squint case during azimuth multichannel reconstruction. The azimuth multichannel reconstruction algorithm based on AHRE is proposed in this paper. Before multichannel reconstruction and combination, time-varying phase errors between azimuth channels were first compensated, and the range-frequency-dependent de-skewing function was derived to remove the two-dimension (2D) spectrum tilt to avoid azimuth under-sampling. Then, azimuth multichannel data were reconstructed according to the azimuth multichannel impulse response based on AHRE. Finally, the range-frequency dependent re-skewing function was introduced to recover the tilted 2D spectrum. Simulation results on both point and distributed targets validated the proposed azimuth multichannel reconstruction approach. Full article
Show Figures

Figure 1

24 pages, 5917 KiB  
Article
Classifying Crop Types Using Two Generations of Hyperspectral Sensors (Hyperion and DESIS) with Machine Learning on the Cloud
by Itiya Aneece and Prasad S. Thenkabail
Remote Sens. 2021, 13(22), 4704; https://doi.org/10.3390/rs13224704 - 21 Nov 2021
Cited by 16 | Viewed by 3350
Abstract
Advances in spaceborne hyperspectral (HS) remote sensing, cloud-computing, and machine learning can help measure, model, map and monitor agricultural crops to address global food and water security issues, such as by providing accurate estimates of crop area and yield to model agricultural productivity. [...] Read more.
Advances in spaceborne hyperspectral (HS) remote sensing, cloud-computing, and machine learning can help measure, model, map and monitor agricultural crops to address global food and water security issues, such as by providing accurate estimates of crop area and yield to model agricultural productivity. Leveraging these advances, we used the Earth Observing-1 (EO-1) Hyperion historical archive and the new generation DLR Earth Sensing Imaging Spectrometer (DESIS) data to evaluate the performance of hyperspectral narrowbands in classifying major agricultural crops of the U.S. with machine learning (ML) on Google Earth Engine (GEE). EO-1 Hyperion images from the 2010–2013 growing seasons and DESIS images from the 2019 growing season were used to classify three world crops (corn, soybean, and winter wheat) along with other crops and non-crops near Ponca City, Oklahoma, USA. The supervised classification algorithms: Random Forest (RF), Support Vector Machine (SVM), and Naive Bayes (NB), and the unsupervised clustering algorithm WekaXMeans (WXM) were run using selected optimal Hyperion and DESIS HS narrowbands (HNBs). RF and SVM returned the highest overall producer’s, and user’s accuracies, with the performances of NB and WXM being substantially lower. The best accuracies were achieved with two or three images throughout the growing season, especially a combination of an earlier month (June or July) and a later month (August or September). The narrow 2.55 nm bandwidth of DESIS provided numerous spectral features along the 400–1000 nm spectral range relative to smoother Hyperion spectral signatures with 10 nm bandwidth in the 400–2500 nm spectral range. Out of 235 DESIS HNBs, 29 were deemed optimal for agricultural study. Advances in ML and cloud-computing can greatly facilitate HS data analysis, especially as more HS datasets, tools, and algorithms become available on the Cloud. Full article
Show Figures

Figure 1

19 pages, 12404 KiB  
Article
Impacts of the Microclimate of a Large Urban Park on Its Surrounding Built Environment in the Summertime
by Majid Amani-Beni, Biao Zhang, Gao-Di Xie and A. Jacob Odgaard
Remote Sens. 2021, 13(22), 4703; https://doi.org/10.3390/rs13224703 - 21 Nov 2021
Cited by 22 | Viewed by 3418
Abstract
The cooling effect of green spaces as an ecological solution to mitigate urban climate change is well documented. However, the factors influencing the microclimate in the built environment around forest parks, diurnal variations of their impact and their degree of importance have not [...] Read more.
The cooling effect of green spaces as an ecological solution to mitigate urban climate change is well documented. However, the factors influencing the microclimate in the built environment around forest parks, diurnal variations of their impact and their degree of importance have not been explicitly addressed. We attempted to quantify how much various landscape parameters, including land cover and spatial location, impact the ambient air and surface temperature in the area around Beijing’s Olympic Forest Park. Data were taken along strategically located traverses inside and outside the park. We found: (1) The air temperature during the day was 1.0–3.5 °C lower in the park than in the surrounding area; the surface temperature was 1.7–4.8 °C lower; air humidity in the park increased by 8.7–15.1%; and the human comfort index reduced to 1.8–6.9, all generating a more comfortable thermal environment in the park than in the surrounding area. (2) The distance to the park and the green space ratio of the park’s surrounding area are significant factors for regulating its microclimate. A 1 km increase in distance to the park caused the temperature to increase by 0.83 °C; when the green space ratio increased by 10%, the temperature dropped by 0.16 °C on average. The impact of these two parameters was more obvious in the afternoon than in the middle of the day or in the morning. The green space ratio could be used for designing a more stable thermal environment. (3) Land cover affects surface temperature more than it does air temperature. Our data suggest that an urban plan with an even distribution of green space would provide the greatest thermal comfort. Full article
(This article belongs to the Special Issue Urban Vegetation and Ecology Monitoring Using Remote Sensing)
Show Figures

Graphical abstract

50 pages, 912 KiB  
Article
Uncertainty Introduced by Darkening Agents in the Lunar Regolith: An Unmixing Perspective
by Marcel Hess, Thorsten Wilhelm, Christian Wöhler and Kay Wohlfarth
Remote Sens. 2021, 13(22), 4702; https://doi.org/10.3390/rs13224702 - 21 Nov 2021
Cited by 1 | Viewed by 1696
Abstract
On the Moon, in the near infrared wavelength range, spectral diagnostic features such as the 1-μm and 2-μm absorption bands can be used to estimate abundances of the constituent minerals. However, there are several factors that can darken the [...] Read more.
On the Moon, in the near infrared wavelength range, spectral diagnostic features such as the 1-μm and 2-μm absorption bands can be used to estimate abundances of the constituent minerals. However, there are several factors that can darken the overall spectrum and dampen the absorption bands. Namely, (1) space weathering, (2) grain size, (3) porosity, and (4) mineral darkening agents such as ilmenite have similar effects on the measured spectrum. This makes spectral unmixing on the Moon a particularly challenging task. Here, we try to model the influence of space weathering and mineral darkening agents and infer the uncertainties introduced by these factors using a Markov Chain Monte Carlo method. Laboratory and synthetic mixtures can successfully be characterized by this approach. We find that the abundance of ilmenite, plagioclase, clino-pyroxenes and olivine cannot be inferred accurately without additional knowledge for very mature spectra. The Bayesian approach to spectral unmixing enables us to include prior knowledge in the problem without imposing hard constraints. Other data sources, such as gamma-ray spectroscopy, can contribute valuable information about the elemental abundances. We here find that setting a prior on TiO2 and Al2O3 can mitigate many of the uncertainties, but large uncertainties still remain for dark mature lunar spectra. This illustrates that spectral unmixing on the Moon is an ill posed problem and that probabilistic methods are important tools that provide information about the uncertainties, that, in turn, help to interpret the results and their reliability. Full article
(This article belongs to the Special Issue Cartography of the Solar System: Remote Sensing beyond Earth)
Show Figures

Graphical abstract

20 pages, 5908 KiB  
Article
Phase Shift Migration with Modified Coherent Factor Algorithm for MIMO-SAR 3D Imaging in THz Band
by Guan Yang, Chao Li, Shiyou Wu, Shen Zheng, Xiaojun Liu and Guangyou Fang
Remote Sens. 2021, 13(22), 4701; https://doi.org/10.3390/rs13224701 - 20 Nov 2021
Cited by 8 | Viewed by 2774
Abstract
In multiple-input-multiple-output synthetic aperture radar (MIMO-SAR) systems, sparse arrays are usually applied, resulting in increased sidelobes of the point spread function. In this paper, a phase shift migration (PSM) imaging algorithm based on the explosion reflection model with modified coherent factor was proposed [...] Read more.
In multiple-input-multiple-output synthetic aperture radar (MIMO-SAR) systems, sparse arrays are usually applied, resulting in increased sidelobes of the point spread function. In this paper, a phase shift migration (PSM) imaging algorithm based on the explosion reflection model with modified coherent factor was proposed for sidelobe suppression in MIMO-SAR three-dimensional (3D) imaging application. By defining the virtual difference wavenumber, reconstructing the raw echo by data rearrangement in wavenumber domain, the original coherent factor algorithm operating in spatial domain can be achieved by the PSM algorithm frame in the wavenumber domain, which means two orders of magnitude increase in computational efficiency. The correctness of the theory is verified by simulation. Finally, a bistatic prototype imaging system in the 0.3 THz band was designed for the proof-of-principle experiments. The experimental results show that the proposed algorithm has a 0.948 structural similarity value to the original coherent factor back-projection algorithm (CF-BPA) which means comparable image quality with much superior efficiency. Full article
Show Figures

Figure 1

21 pages, 14112 KiB  
Article
Building Polygon Extraction from Aerial Images and Digital Surface Models with a Frame Field Learning Framework
by Xiaoyu Sun, Wufan Zhao, Raian V. Maretto and Claudio Persello
Remote Sens. 2021, 13(22), 4700; https://doi.org/10.3390/rs13224700 - 20 Nov 2021
Cited by 6 | Viewed by 3753
Abstract
Deep learning-based models for building delineation from remotely sensed images face the challenge of producing precise and regular building outlines. This study investigates the combination of normalized digital surface models (nDSMs) with aerial images to optimize the extraction of building polygons using the [...] Read more.
Deep learning-based models for building delineation from remotely sensed images face the challenge of producing precise and regular building outlines. This study investigates the combination of normalized digital surface models (nDSMs) with aerial images to optimize the extraction of building polygons using the frame field learning method. Results are evaluated at pixel, object, and polygon levels. In addition, an analysis is performed to assess the statistical deviations in the number of vertices of building polygons compared with the reference. The comparison of the number of vertices focuses on finding the output polygons that are the easiest to edit by human analysts in operational applications. It can serve as guidance to reduce the post-processing workload for obtaining high-accuracy building footprints. Experiments conducted in Enschede, the Netherlands, demonstrate that by introducing nDSM, the method could reduce the number of false positives and prevent missing the real buildings on the ground. The positional accuracy and shape similarity was improved, resulting in better-aligned building polygons. The method achieved a mean intersection over union (IoU) of 0.80 with the fused data (RGB + nDSM) against an IoU of 0.57 with the baseline (using RGB only) in the same area. A qualitative analysis of the results shows that the investigated model predicts more precise and regular polygons for large and complex structures. Full article
(This article belongs to the Special Issue Deep Learning for Very-High Resolution Land-Cover Mapping)
Show Figures

Graphical abstract

26 pages, 7227 KiB  
Article
Proximal-Sensing-Powered Modelling of Energy-Water Fluxes in a Vineyard: A Spatial Resolution Analysis
by Nicola Paciolla, Chiara Corbari, Antonino Maltese, Giuseppe Ciraolo and Marco Mancini
Remote Sens. 2021, 13(22), 4699; https://doi.org/10.3390/rs13224699 - 20 Nov 2021
Cited by 2 | Viewed by 1899
Abstract
Spatial resolution is a key parameter in energy–water surface flux modelling. In this research, scale effects are analyzed on fluxes modelled with the FEST-EWB model, by upscaling both its inputs and outputs separately. The main questions are: (a) if high-resolution remote sensing images [...] Read more.
Spatial resolution is a key parameter in energy–water surface flux modelling. In this research, scale effects are analyzed on fluxes modelled with the FEST-EWB model, by upscaling both its inputs and outputs separately. The main questions are: (a) if high-resolution remote sensing images are necessary to accurately model a heterogeneous area; and (b) whether and to what extent low-resolution modelling provides worse/better results than the upscaled results of high-resolution modelling. The study area is an experimental vineyard field where proximal sensing images were obtained by an airborne platform and verification fluxes were measured via a flux tower. Modelled fluxes are in line with those from alternative energy-balance models, and quite accurate (NSE = 0.78) with respect to those measured in situ. Field-scale evapotranspiration has resulted in both the tested upscaling approaches (with relative error within ±30%), although fewer pixels available for low-resolution calibration may produce some differences. When working at low resolutions, the model has produced higher relative errors (20% on average), but is still within acceptable bounds. This means that the model can produce high-quality results, partially compensating for the loss in spatial heterogeneity associated with low-resolution images. Full article
Show Figures

Graphical abstract

Previous Issue
Back to TopTop