
Timely and Low-Cost Remote Sensing Practices for the Assessment of Landslide Activity in the Service of Hazard Management


Abstract
:1. Introduction
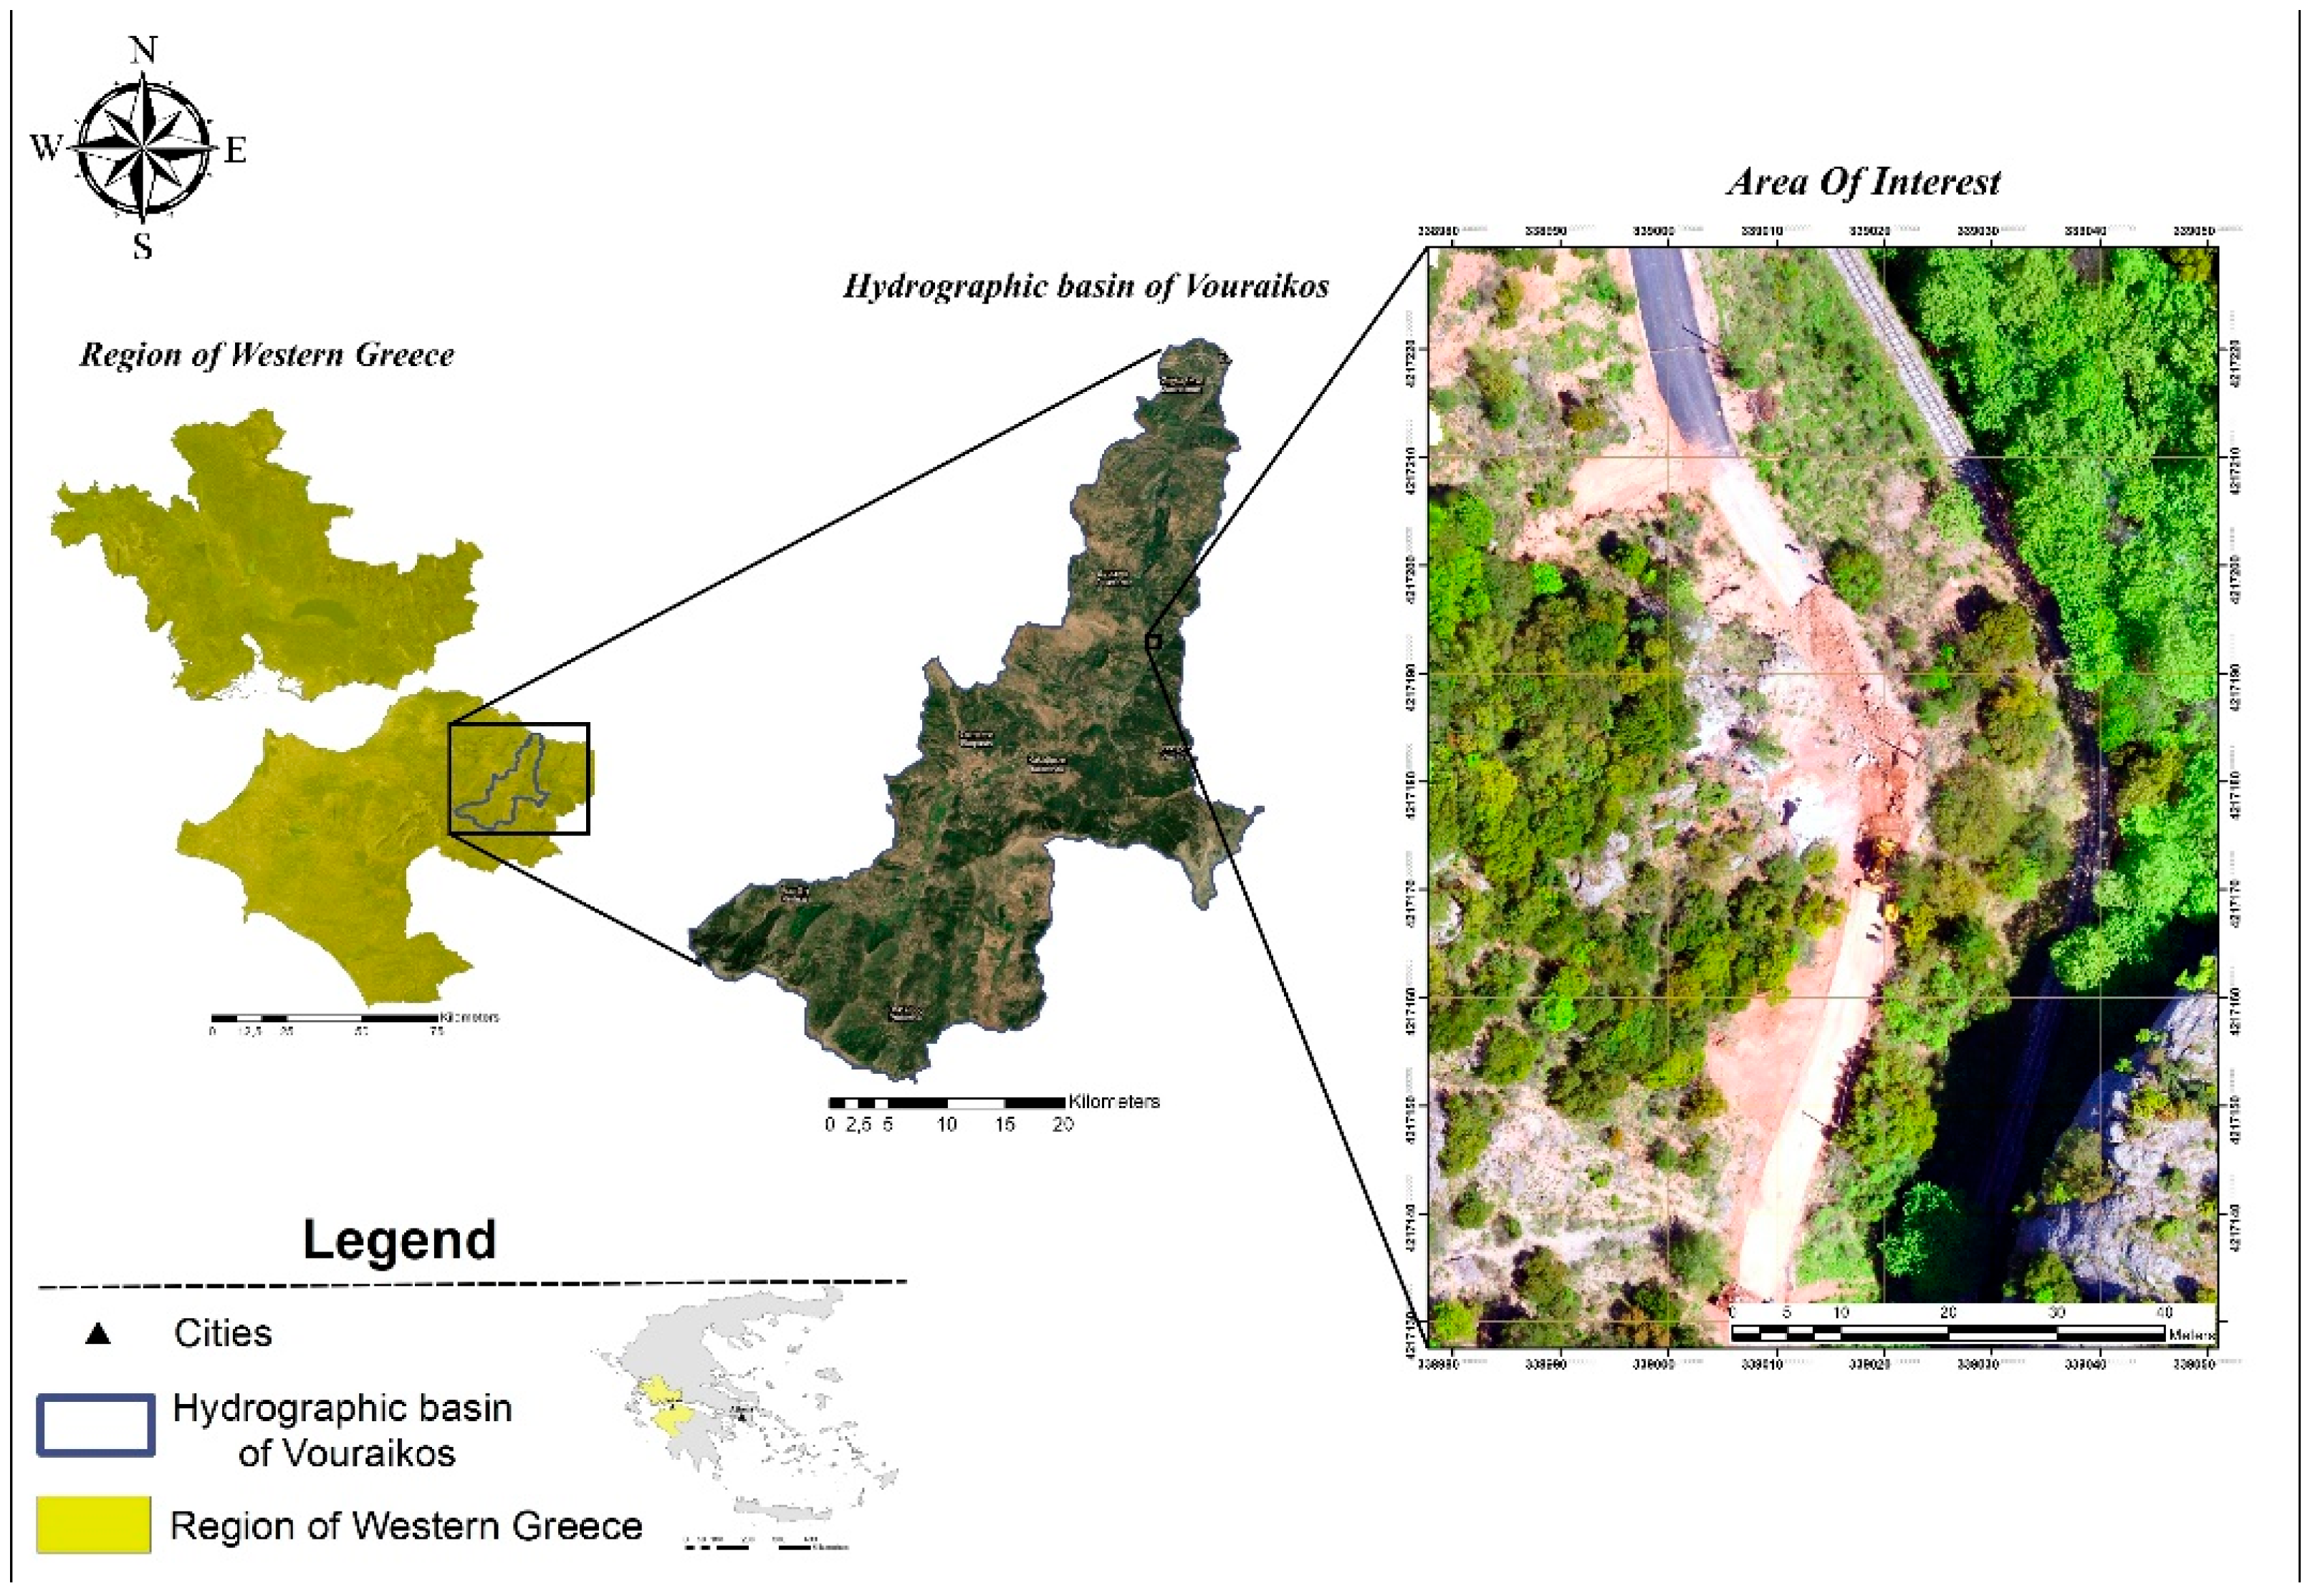
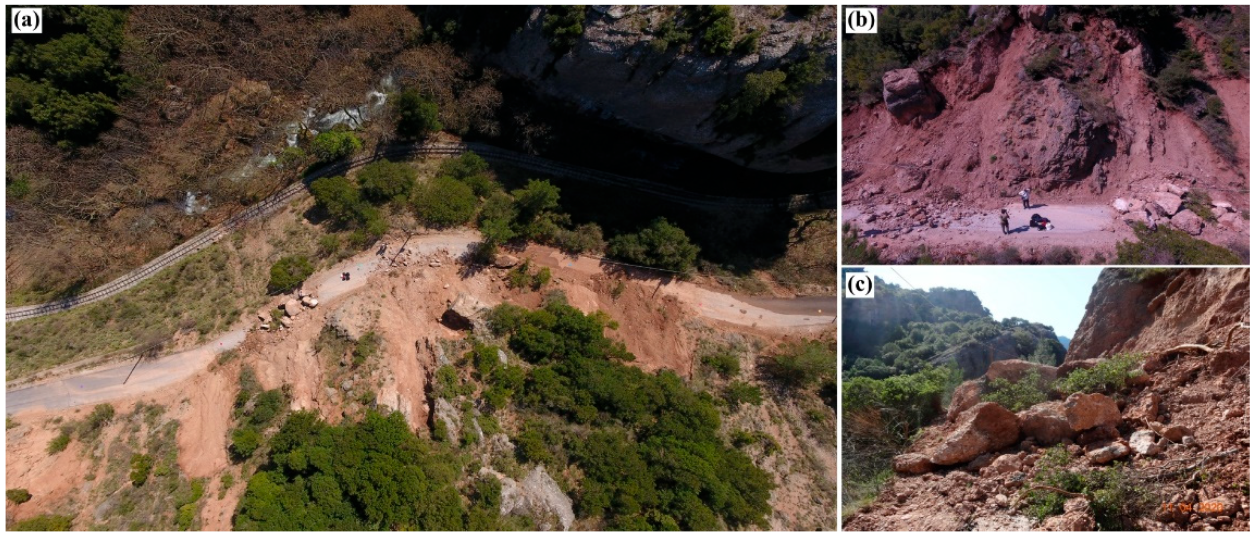
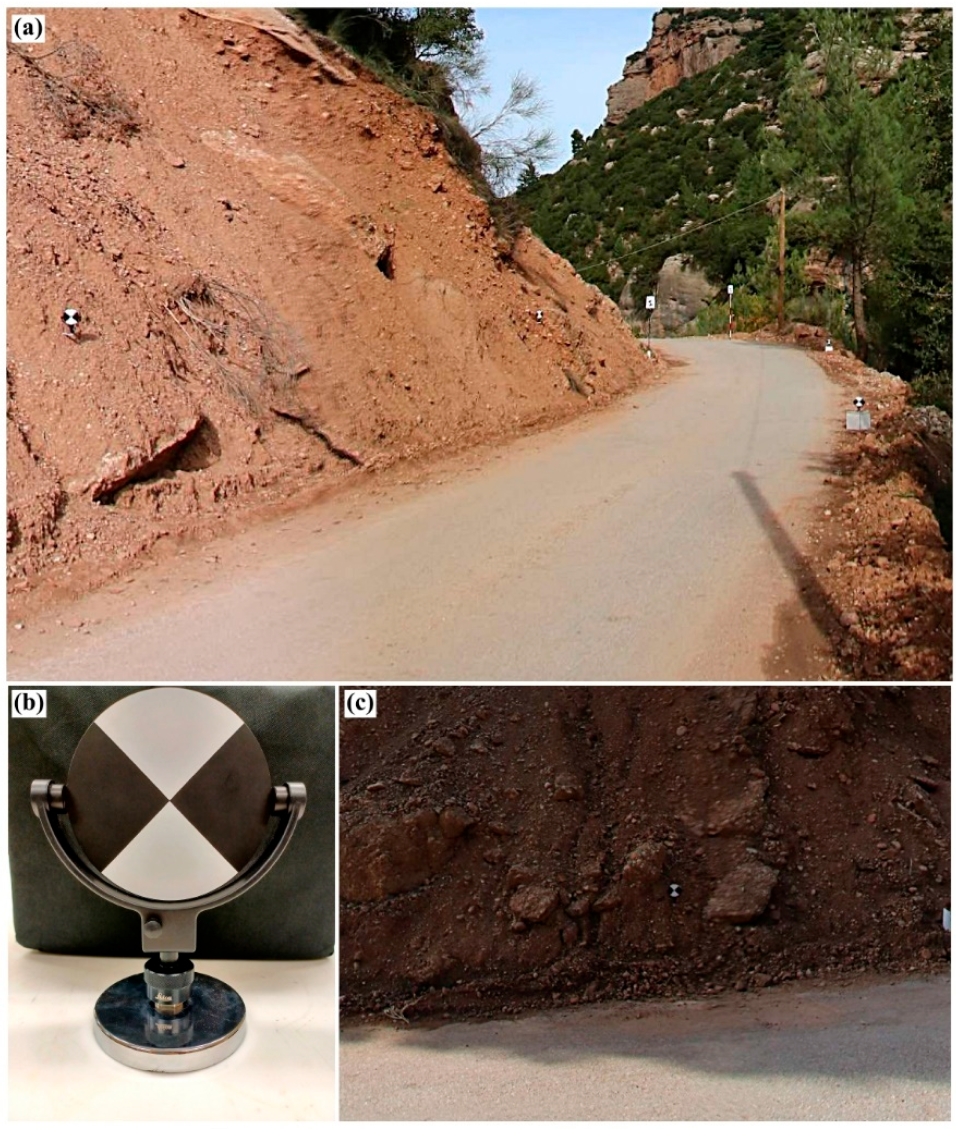
2. Landslide Area
3. Materials and Methods
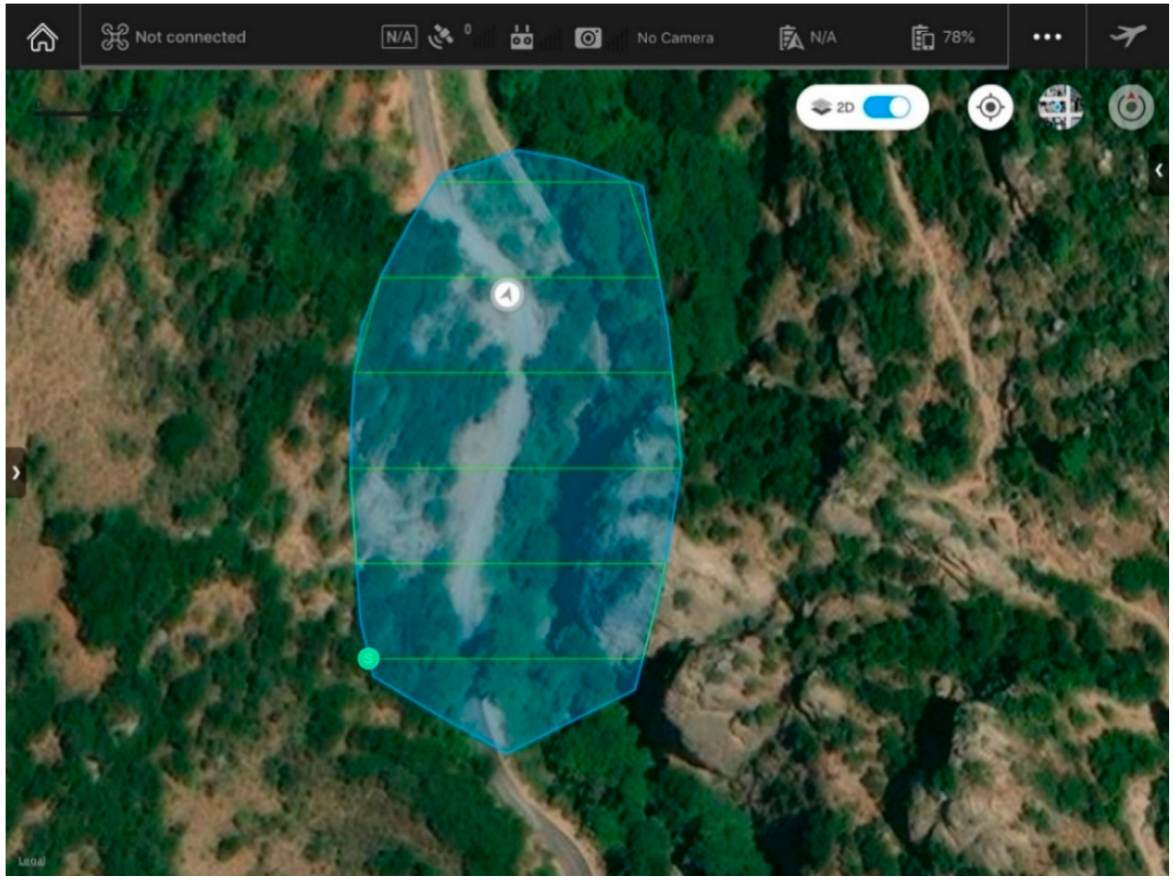
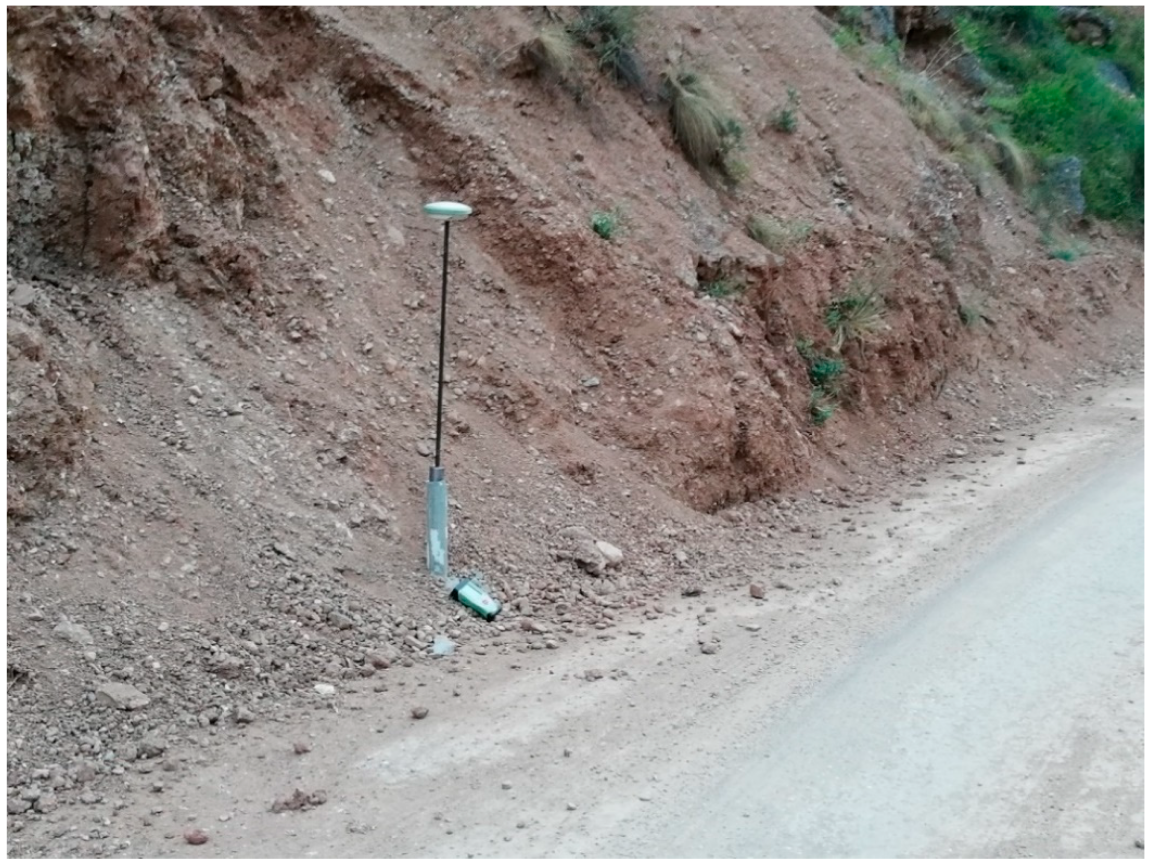
3.1. Data Acquizition
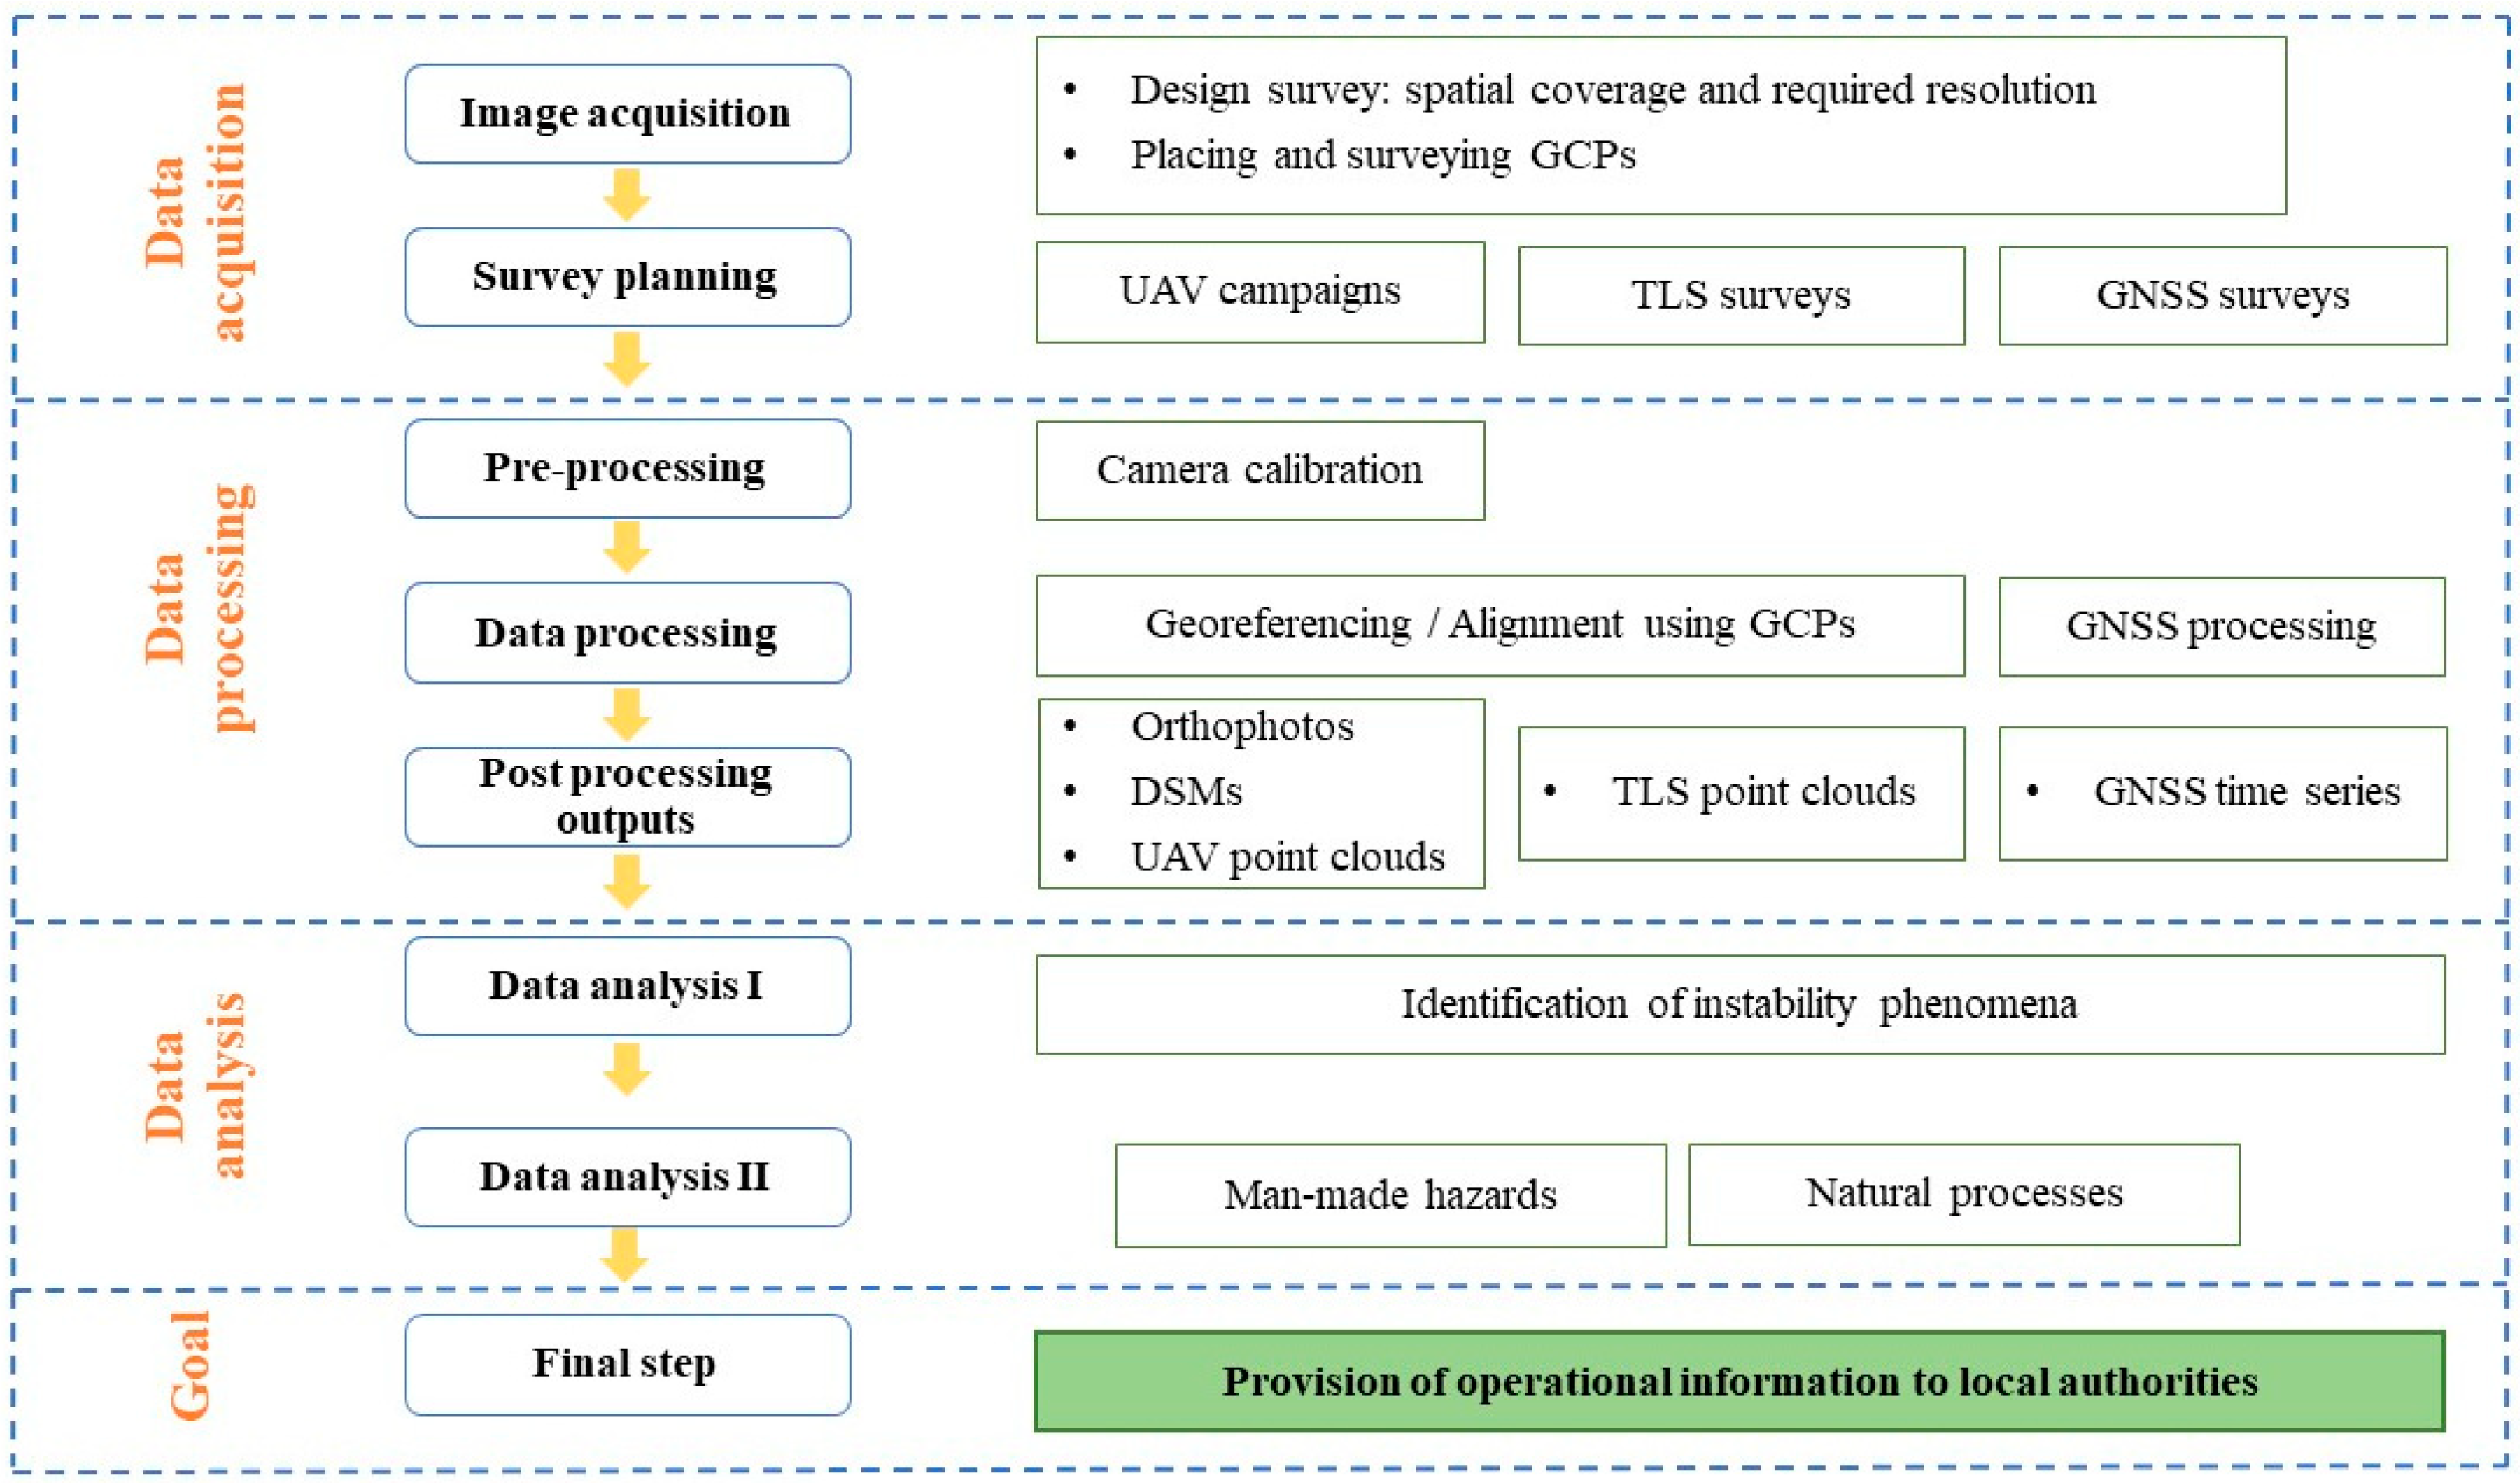
3.2. Methodology
4. Results
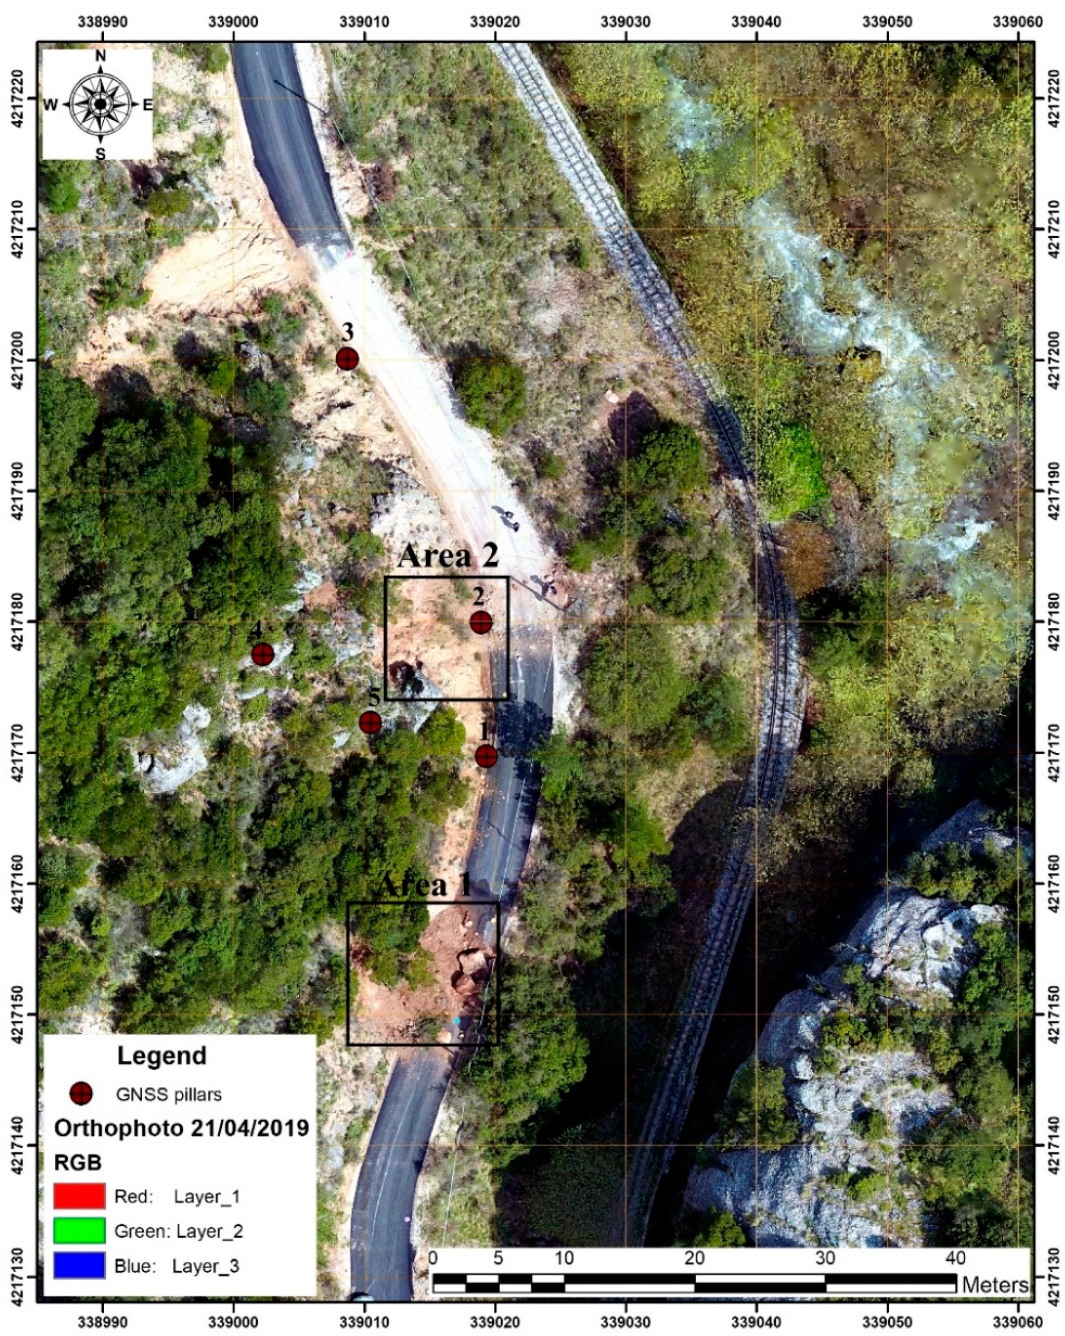
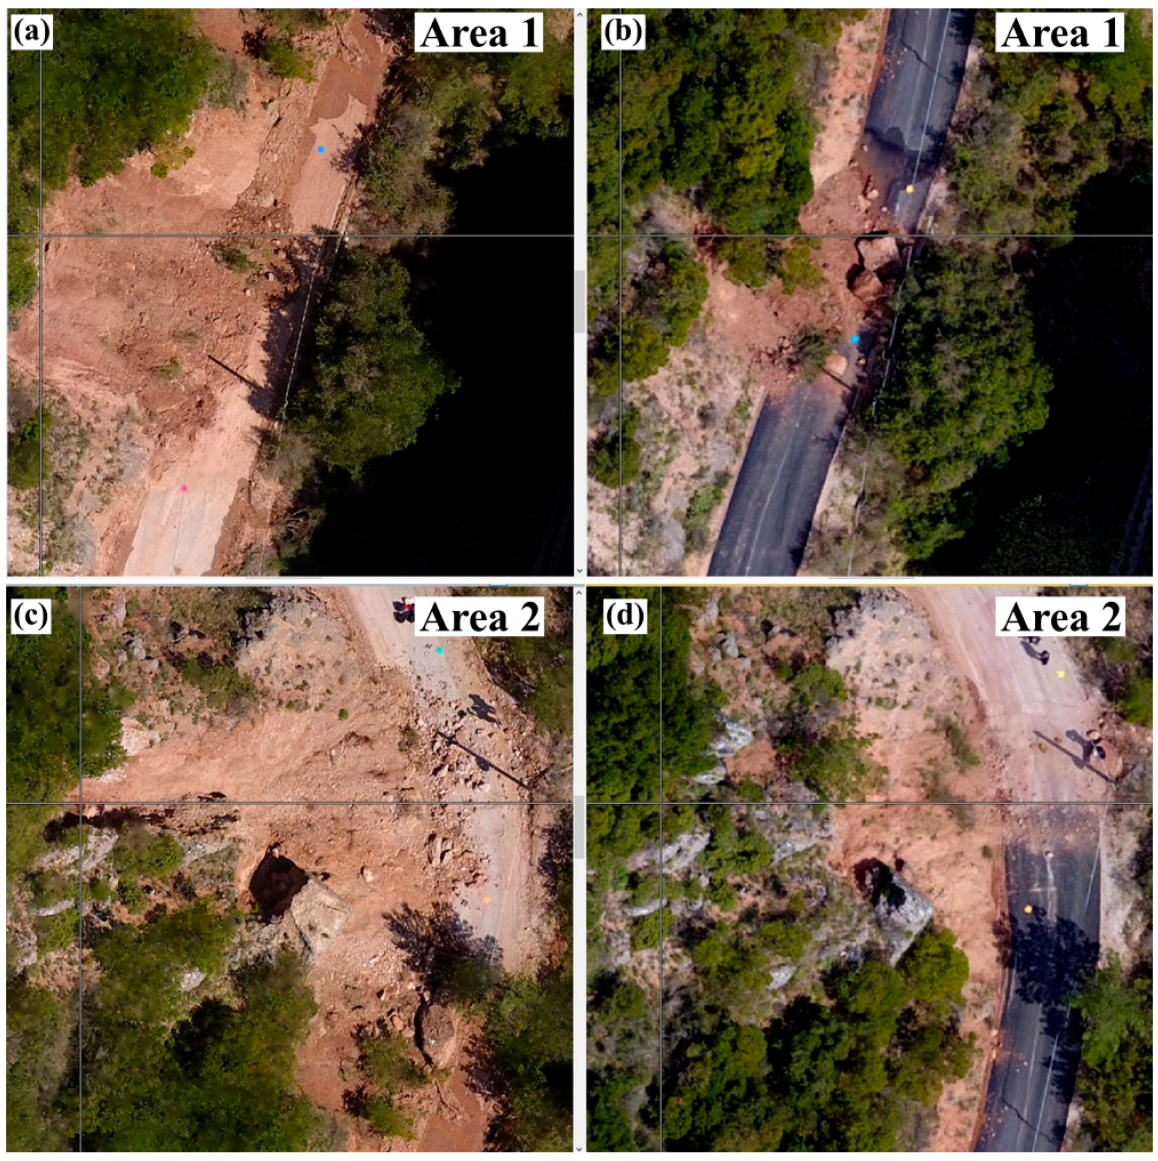
4.1. UAV Surveys
4.2. TLS Surveys
4.3. Monitoring Overview and Computational Effort
5. Discussion
- Monitoring of instabilities in environmentally sensitive areas can be implemented through repeated UAV and TLS surveys.
- Repeatability is determined by the activity of the instabilities.
- The installation of a permanent GNSS network is recommended. In particular, five permanent GNSS positions, installed in critical places, are sufficient for an area of approximately 1700 m2. Generally, the number of permanent positions should be adjusted to the characteristics of the area under investigation.
- UAV surveys are able to detect topographic variation on the order of centimeters. On the other hand, TLS surveys can identify micro-displacements (millimetric-scale).
- The synergistic use of UAV and TLS data contributes to the enhancement of the spatial coverage and point density of UAV-based point clouds. This could be considered an ideal monitoring method for areas with complex topography.
- The presence of dense vegetation is an important challenge in the monitoring procedure. In the current research, we tried to reduce the influence of vegetation through the manual segmentation of UAV/TLS point clouds to contain as much topographical information as possible. Further research on the specific issue is needed.
6. Conclusions
Author Contributions
Funding
Data Availability Statement
Acknowledgments
Conflicts of Interest
References
- Gariano, S.L.; Guzzetti, F. Landslides in a changing climate. Earth-Sci. Rev. 2016, 162, 227–252. [Google Scholar] [CrossRef]
- Huggel, C.; Khabarov, N.; Korup, O.; Obersteiner, M. Physical impacts of climate change on landslide occurrence and related adaptation. In Landslides: Types, Mechanisms and Modeling; Clague, J.J., Stead, D., Eds.; Cambridge University Press: Cambridge, UKI, 2012; pp. 121–133. [Google Scholar] [CrossRef]
- Picarelli, L.; Lacasse, S.; Ho, K.K.S. The Impact of Climate Change on Landslide Hazard and Risk. In Understanding and Reducing Landslide Disaster Risk; Sassa, K., Mikoš, M., Sassa, S., Bobrowsky, P.T., Takara, K., Dang, K., Eds.; WLF 2020. ICL Contribution to Landslide Disaster Risk Reduction; Springer: Cham, Switzerland, 2021. [Google Scholar] [CrossRef]
- Guzzetti, F.; Carrara, A.; Cardinali, M.; Reichenbach, P. Landslide hazard evaluation: A review of current techniques and their application in a multi-scale study, Central Italy. Geomorphology 1999, 31, 181–216. [Google Scholar] [CrossRef]
- Mantovani, F.; Soeters, R.; Van Westen, C.J. Remote sensing techniques for landslide studies and hazard zonation in Europe. Geomorphology 1996, 15, 213–225. [Google Scholar] [CrossRef]
- Lissak, C.; Bartsch, A.; De Michele, M.; Gomez, C.; Maquaire, O.; Raucoules, D.; Roulland, T. Remote Sensing for Assessing Landslides and Associated Hazards. Surv. Geophys. 2020, 41, 1391–1435. [Google Scholar] [CrossRef]
- Zhong, C.; Liu, Y.; Gao, P.; Chen, W.; Li, H.; Hou, Y.; Nuremanguli, T.; Ma, H. Landslide mapping with remote sensing: Challenges and opportunities. Int. J. Remote Sens. 2020, 41, 1555–1581. [Google Scholar] [CrossRef]
- Garnica-Peña, R.J.; Alcántara-Ayala, I. The use of UAVs for landslide disaster risk research and disaster risk management: A literature review. J. Mt. Sci. 2021, 18, 482–498. [Google Scholar] [CrossRef]
- Gomez, C.; Purdie, H. UAV- based Photogrammetry and Geocomputing for Hazards and Disaster Risk Monitoring—A Review. Geoenviron Disasters 2016, 3, 23. [Google Scholar] [CrossRef]
- Niethammer, U.; James, M.; Rothmund, S.; Travelletti, J.; Joswig, M. UAV-based remote sensing of the Super-Sauze landslide: Evaluation and results. Eng. Geol. 2012, 128, 2–11. [Google Scholar] [CrossRef]
- Lindner, G.; Schraml, K.; Mansberger, R.; Hübl, J. UAV monitoring and documentation of a large landslide. Appl. Geomat. 2016, 8, 1–11. [Google Scholar] [CrossRef]
- Rossi, G.; Tanteri, L.; Tofani, V.; Vannocci, P.; Moretti, S.; Casagli, N. Multitemporal UAV surveys for landslide mapping and characterization. Landslides 2018, 15, 1045–1052. [Google Scholar] [CrossRef]
- Peppa, M.V.; Mills, J.P.; Moore, P.; Miller, P.E.; Chambers, J.E. Brief communication: Landslide motion from cross correlation of UAV-derived morphological attributes. Nat. Hazards Earth Syst. Sci. 2017, 17, 2143–2150. [Google Scholar] [CrossRef]
- Turner, D.; Lucieer, A.; De Jong, S.M. Time Series Analysis of Landslide Dynamics Using an Unmanned Aerial Vehicle (UAV). Remote Sens. 2015, 7, 1736–1757. [Google Scholar] [CrossRef]
- Godone, D.; Allasia, P.; Borrelli, L.; Gullà, G. UAV and Structure from Motion Approach to Monitor the Maierato Landslide Evolution. Remote Sens. 2020, 12, 1039. [Google Scholar] [CrossRef]
- Rodriguez, J.; Macciotta, R.; Hendry, M.T.; Roustaei, M.; Gräpel, C.; Skirrow, R. UAVs for monitoring, investigation, and mitigation design of a rock slope with multiple failure mechanisms—A case study. Landslides 2020, 17, 2027–2040. [Google Scholar] [CrossRef]
- Bernardo, E.; Palamara, R.; Boima, R. UAV and Soft Computing Methodology for Monitoring Landslide Areas (Susceptibility to Landslides and Early Warning). Wseas Trans. Environ. Dev. 2021, 17, 490–501. [Google Scholar] [CrossRef]
- Jaboyedoff, M.; Oppikofer, T.; Abellán, A.; Derron, M.H.; Loye, A.; Metzger, R.; Pedrazzini, A. Use of LIDAR in landslide investigations: A review. Nat. Hazards 2012, 61, 5–28. [Google Scholar] [CrossRef]
- Guo, C.; Xu, Q.; Dong, X.; Li, W.; Zhao, K.; Lu, H.; Ju, Y. Geohazard Recognition and Inventory Mapping Using Airborne LiDAR Data in Complex Mountainous Areas. J. Earth Sci. 2021, 32, 1079–1091. [Google Scholar] [CrossRef]
- Mackey, B.H.; Roering, J.J.; McKean, J.A. Long-term kinematics and sediment flux of an active earthflow, Eel River, California. Geology 2009, 37, 803–806. [Google Scholar] [CrossRef] [Green Version]
- Van Den Eeckhaut, M.; Kerle, N.; Poesen, J.; Hervás, J. Object-oriented identification of forested landslides with derivatives of single pulse LiDAR data. Geomorphology 2012, 173–174, 30–42. [Google Scholar] [CrossRef]
- Ventura, G.; Vilardo, G.; Terranova, C.; Sessa, E.B. Tracking and evolution of complex active landslides by multi-temporal airborne LiDAR data: The Montaguto landslide (Southern Italy). Remote Sens. Environ. 2011, 115, 3237–3248. [Google Scholar] [CrossRef]
- Fanos, A.M.; Pradhan, B. Laser Scanning Systems and Techniques in Rockfall Source Identification and Risk Assessment: A Critical Review. Earth Syst Environ. 2018, 2, 163–182. [Google Scholar] [CrossRef]
- Guinau, M.; Tapia, M.; Pérez-Guillén, C.; Suriñach, E.; Roig, P.; Khazaradze, G.; Torné, M.; Royán, M.J.; Echeverria, A. Remote sensing and seismic data integration for the characterization of a rock slide and an artificially triggered rock fall. Eng. Geol. 2019, 257, 105113. [Google Scholar] [CrossRef]
- Abellán, A.; Oppikofer, T.; Jaboyedoff, M.; Rosser, N.J.; Lim, M.; Lato, M.J. Terrestrial laser scanning of rock slope instabilities. Earth Surf. Process. Landf. 2014, 39, 80–97. [Google Scholar] [CrossRef]
- Guerin, A.; Stock, G.; Radue, M.; Jaboyedoff, M.; Collins, B.; Matasci, B.; Avdievitch, N.; Derron, M.H. Quantifying 40 years of rockfall activity in Yosemite Valley with historical Structure-from-Motion photogrammetry and terrestrial laser scanning. Geomorphology 2020, 356, 107069. [Google Scholar] [CrossRef]
- Casagli, N.; Frodella, W.; Morelli, S.; Tofani, V.; Ciampalini, A.; Intrieri, E.; Raspini, F.; Rossi, G.; Tanteri, L.; Lu, P. Spaceborne, UAV and ground-based remote sensing techniques for landslide mapping, monitoring and early warning. Geoenviron. Disasters 2017, 4, 9. [Google Scholar] [CrossRef]
- Kyriou, A.; Nikolakopoulos, K.; Koukouvelas, I.; Lampropoulou, P. Repeated UAV Campaigns, GNSS Measurements, GIS, and Petrographic Analyses for Landslide Mapping and Monitoring. Minerals 2021, 11, 300. [Google Scholar] [CrossRef]
- Pellicani, R.; Argentiero, I.; Manzari, P.; Spilotro, G.; Marzo, C.; Ermini, R.; Apollonio, C. UAV and Airborne LiDAR Data for Interpreting Kinematic Evolution of Landslide Movements: The Case Study of the Montescaglioso Landslide (Southern Italy). Geosciences 2019, 9, 248. [Google Scholar] [CrossRef]
- Brook, M.S.; Merkle, J. Monitoring active landslides in the Auckland region utilising UAV/structure-from-motion photogrammetry. Jpn. Geotech. Soc. Spec. Publ. 2019, 6, 1–6. [Google Scholar] [CrossRef] [Green Version]
- Avallone, A.; Briole, P.; Agatza-Balodimou, A.M.; Billiris, H.; Charade, O.; Mitsakaki, C.; Nercessian, A.; Papazissi, K.; Paradissis, D.; Veis, G. Analysis of eleven years of deformation measured by GPS in the Corinth Rift Laboratory area. Comptes Rendus Geosci. 2004, 336, 301–311. [Google Scholar] [CrossRef]
- Fernández-Blanco, D.; de Gelder, G.; Lacassin, R.; Armijo, R. A new crustal fault formed the modern Corinth Rift. Earth-Sci. Rev. 2019, 199, 102919. [Google Scholar] [CrossRef]
- Jolivet, L.; Labrousse, L.; Agard, P.; Lacombe, O.; Bailly, V.; Lecomte, E.; Mouthereau, F.; Mehl, C. Rifting and shallow-dipping detachments, clues from the Corinth Rift and the Aegean. Tectonophysics 2010, 483, 287–304. [Google Scholar] [CrossRef]
- McKenzie, D. Active tectonics of the Alpine—Himalayan belt: The Aegean Sea and surrounding regions. Geophys. J. Int. 1978, 55, 217–254. [Google Scholar] [CrossRef]
- Taylor, B.; Weiss, J.; Goodliffe, A.M.; Sachpazi, M.; Laigle, M.; Hirn, A. The structures, stratigraphy and evolution of the Gulf of Corinth rift, Greece. Geophys. J. Int. 2011, 185, 1189–1219. [Google Scholar] [CrossRef]
- Micheletti, N.; Chandler, J.; Lane, S.N. Chapter 2—Structure from motion (SFM) photogrammetry. In Geomorphological Techniques; Section 2.2; British Society for Geomorphology: London, UK, 2015. [Google Scholar]
- Smith, M.W.; Carrivick, J.L.; Quincey, D.J. Structure from motion photogrammetry in physical geography. Prog. Phys. Geogr. Earth Environ. 2016, 40, 247–275. [Google Scholar] [CrossRef]
- Westoby, M.; Brasington, J.; Glasser, N.; Hambrey, M.; Reynolds, J. ‘Structure-from-Motion’ photogrammetry: A low-cost, effective tool for geoscience applications. Geomorphology 2012, 179, 300–314. [Google Scholar] [CrossRef]
- Agisoft Metashape Professional Edition. Available online: https://www.agisoft.com/pdf/metashape-pro_1_7_en.pdf (accessed on 30 January 2022).
- Nikolakopoulos, K.G.; Koukouvelas, I.K. Rockfalls systematic monitoring using UAVs: The case of Zachlorou village. In Proceedings of the Eighth International Conference on Remote Sensing and Geoinformation of the Environment (RSCy2020), Paphos, Cyprus, 16–18 March 2020. [Google Scholar] [CrossRef]
- Brach, M.; Chan, J.C.-W.; Szymanski, P. Accuracy assessment of different photogrammetric software for processing data from low-cost UAV platforms in forest conditions. iForest 2019, 12, 435–441. [Google Scholar] [CrossRef]
- Gindraux, S.; Boesch, R.; Farinotti, D. Accuracy Assessment of Digital Surface Models from Unmanned Aerial Vehicles’ Imagery on Glaciers. Remote Sens. 2017, 9, 186. [Google Scholar] [CrossRef] [Green Version]
- Nikolakopoulos, K.G.; Soura, K.; Koukouvelas, I.K.; Argyropoulos, N.G. UAV vs. classical aerial photogrammetry for archaeological studies. J. Archaeol. Sci. Rep. 2017, 14, 758–773. [Google Scholar] [CrossRef]
- Agüera-Vega, F.; Carvajal-Ramírez, F.; Martínez-Carricondo, P. Assessment of photogrammetric mapping accuracy based on variation ground control points number using unmanned aerial vehicle. Measurement 2017, 98, 221–227. [Google Scholar] [CrossRef]
- Akturk, E.; Altunel, A.O. Accuracy assessment of a low-cost UAV derived digital elevation model (DEM) in a highly broken and vegetated terrain. Measurement 2019, 136, 382–386. [Google Scholar] [CrossRef]
- Ferrer-González, E.; Agüera-Vega, F.; Carvajal-Ramírez, F.; Martínez-Carricondo, P. UAV Photogrammetry Accuracy Assessment for Corridor Mapping Based on the Number and Distribution of Ground Control Points. Remote Sens. 2020, 12, 2447. [Google Scholar] [CrossRef]
- Maurizio, B.; Fiani, M.; Lugli, A. Landslide monitoring using multitemporal terrestrial laser scanning for ground displacement analysis. Geomat. Nat. Hazards Risk 2015, 6, 398–418. [Google Scholar] [CrossRef]
- Oppikofer, T.; Jaboyedoff, M.; Blikra, L.; Derron, M.-H.; Metzger, R. Characterization and monitoring of the Åknes rockslide using terrestrial laser scanning. Nat. Hazards Earth Syst. Sci. 2009, 9, 1003–1019. [Google Scholar] [CrossRef]
- Rashidi, M.; Mohammadi, M.; Sadeghlou Kivi, S.; Abdolvand, M.M.; Truong-Hong, L.; Samali, B. A Decade of Modern Bridge Monitoring Using Terrestrial Laser Scanning: Review and Future Directions. Remote Sens. 2020, 12, 3796. [Google Scholar] [CrossRef]
- Eker, R.; Aydın, A.; Hübl, J. Unmanned aerial vehicle (UAV)-based monitoring of a landslide: Gallenzerkogel landslide (Ybbs-Lower Austria) case study. Env. Monit Assess 2018, 190, 28. [Google Scholar] [CrossRef]
- Fuad, N.A.; Yusoff, A.R.; Ismail, Z.; Majid, Z. Comparing the Performance of Point Cloud Registration Methods for Landslide Monitoring Using Mobile Laser Scanning Data. ISPRS Int. Arch. Photogramm. Remote Sens. Spat. Inf. Sci. 2018, 4249, 11–21. [Google Scholar] [CrossRef]
- Martínez-Espejo Zaragoza, I.; Caroti, G.; Piemonte, A.; Riedel, B.; Tengen, D.; Niemeier, W. Structure from motion (SfM) processing of UAV images and combination with terrestrial laser scanning, applied for a 3D-documentation in a hazardous situation. Geomatics. Nat. Hazards Risk 2017, 8, 1492–1504. [Google Scholar] [CrossRef] [Green Version]
- Wang GPhilips DJoyce, J.; Rivera, F. The Integration of TLS and Continuous GPS to Study Landslide Deformation: A Case Study in Puerto Rico. J. Geod. Sci. 2011, 1, 25–34. [Google Scholar] [CrossRef]
- Zuliani, D.; Tunini, L.; Di Traglia, F.; Chersich, M.; Curone, D. Cost-Effective, Single-Frequency GPS Network as a Tool for Landslide Monitoring. Sensors 2022, 22, 3526. [Google Scholar] [CrossRef]
- Šegina, E.; Peternel, T.; Urbančič, T.; Realini, E.; Zupan, M.; Jež, J.; Caldera, S.; Gatti, A.; Tagliaferro, G.; Consoli, A.; et al. Monitoring Surface Displacement of a Deep-Seated Landslide by a Low-Cost and near Real-Time GNSS System. Remote Sens. 2020, 12, 3375. [Google Scholar] [CrossRef]
- Medjkane, M.; Maquaire, O.; Costa, S.; Roulland, T.; Letortu, P.; Fauchard, C.; Antoine, R.; Davidson, R. High-resolution monitoring of complex coastal morphology changes: Cross-efficiency of SfM and TLS-based survey (Vaches-Noires cliffs, Normandy, France). Landslides 2018, 15, 1097–1108. [Google Scholar] [CrossRef]
- Cawood, A.J.; Bond, C.E.; Howell, J.A.; Butler, R.W.H.; Totake, Y. LiDAR, UAV or compassclinometer? Accuracy, coverage and the effects on structural models. J. Struct. Geol. 2017, 98, 67–82. [Google Scholar] [CrossRef]
- Hugenholtz, C.H.; Whitehead, K.; Brown, O.W.; Barchyn, T.E.; Moorman, B.J.; LeClaire, A.; Riddell, K.; Hamilton, T. Geomorphological mapping with a small unmanned aircraft system (sUAS): Feature detection and accuracy assessment of a photogrammetrically-derived digital terrain model. Geomorphology 2013, 194, 16–24. [Google Scholar] [CrossRef]
- Tonkin, T.N.; Midgley, N.G.; Graham, D.J.; Labadz, J.C. The potential of small unmanned aircraft systems and structure-from-motion for topographic surveys: A test of emerging integrated approaches at cwm Idwal, North Wales. Geomorphology 2014, 226, 35–43. [Google Scholar] [CrossRef] [Green Version]
- Garcia, G.P.; Gomes, E.B.; Viana, C.D.; Grohmann, C.H. Comparing terrestrial laser scanner and UAV-based photogrammetry to generate a landslide dem. In Anais do Xix Simpósio Brasileiro de Sensoriamento Remoto; Santos. Anais eletrônicos. São José dos Campos, INPE, 2019. Proceedings of XIX Brazilian Symposium on Remote Sensing; ISBN 978-85-17-00097-3. Available online: https://proceedings.science/sbsr-2019/papers/comparing-terrestrial-laser-scanner-and-uav-based-photogrammetry-to-generate-a-landslide-dem?lang=en> (accessed on 31 July 2022).


| Survey | Date | UAV | TLS | GNSS | Main Events |
|---|---|---|---|---|---|
| 19 April 2019 | Rock falls | ||||
| 1 | 21 April 2019 | X | |||
| 2 | 19 May 2019 | X | |||
| 14 November 2019 | Rock falls and earth slides | ||||
| 4 April 2020 | Extensive rock falls and earth slides | ||||
| 3 | 11 April 2020 | X | |||
| 4 | 7 May 2020 | X | |||
| 5 | 10 June 2020 | X | X | ||
| 22 July 2020 | Slope remediation | ||||
| 6 | 23 July 2020 | X | |||
| 24 July 2020 | Construction of GNSS pillars | ||||
| 7 | 10 August 2020 | X | X | ||
| 8 | 14 August 2020 | X | X | ||
| 9 | 25 August 2020 | X | X | ||
| 10 | 25 September 2020 | X | X | X | |
| 11 | 3 October 2020 | X | X | ||
| 12 | 16 December 2020 | X | X | ||
| 13 | 26 April 2021 | X | X | ||
| 14 | 28 May 2021 | X | X | ||
| 15 | 3 July 2021 | X | X | ||
| 16 | 7 November 2021 | X | X | X |
| Data Type | Surface Deformation (m) |
|---|---|
| GNSS measurements | 0.334 |
| UAV-based point clouds | 0.203 |
| TLS-based point clouds | 0.312 |
| Sensor | Date | Point Cloud Density | Survey Time | Processing Time |
|---|---|---|---|---|
| UAV | 10 June 2020 | 708.567 points | ~60 min | ~24 h |
| 25 September 2020 | ~60 min | ~24 h | ||
| 7 November 2021 | ~60 min | ~24 h | ||
| TLS | 10 June 2020 | 6.000.000 points | ~4 h | ~12 h |
| 25 September 2020 | ~4 h | ~12 h | ||
| 7 November 2021 | ~4 h | ~12 h |
| Processor | RAM | Disk | GPU |
|---|---|---|---|
| Intel Core i9 3.6 GHz | 128 GB | SSD 1TB/HDD 2TB | NVIDIA GeForce RTX 3080 |
| Data Type | Volume of the Hanging Rocks (m3) |
|---|---|
| GIS methods | 24.00 |
| UAV-based point clouds | 17.12 |
| TLS-based point clouds | 18.42 |
Publisher’s Note: MDPI stays neutral with regard to jurisdictional claims in published maps and institutional affiliations. |
© 2022 by the authors. Licensee MDPI, Basel, Switzerland. This article is an open access article distributed under the terms and conditions of the Creative Commons Attribution (CC BY) license (https://creativecommons.org/licenses/by/4.0/).
Share and Cite
Kyriou, A.; Nikolakopoulos, K.G.; Koukouvelas, I.K. Timely and Low-Cost Remote Sensing Practices for the Assessment of Landslide Activity in the Service of Hazard Management. Remote Sens. 2022, 14, 4745. https://doi.org/10.3390/rs14194745
Kyriou A, Nikolakopoulos KG, Koukouvelas IK. Timely and Low-Cost Remote Sensing Practices for the Assessment of Landslide Activity in the Service of Hazard Management. Remote Sensing. 2022; 14(19):4745. https://doi.org/10.3390/rs14194745
Chicago/Turabian StyleKyriou, Aggeliki, Konstantinos G. Nikolakopoulos, and Ioannis K. Koukouvelas. 2022. "Timely and Low-Cost Remote Sensing Practices for the Assessment of Landslide Activity in the Service of Hazard Management" Remote Sensing 14, no. 19: 4745. https://doi.org/10.3390/rs14194745