Article

Effects of Anthropogenic Emission Control and Meteorology Changes on the Inter-Annual Variations of PM2.5–AOD Relationship in China

1
School of Energy and Environmental Engineering, University of Science and Technology Beijing, Beijing 100083, China
2
State Key Joint Laboratory of Environment Simulation and Pollution Control, School of Environment, Tsinghua University, Beijing 100084, China
3
Institute for Atmospheric and Earth System Research (INAR)/Physics, Faculty of Science, University of Helsinki, 00014 Helsinki, Finland
4
State Environmental Protection Key Laboratory of Sources and Control of Air Pollution Complex, Beijing 100084, China
*
Author to whom correspondence should be addressed.
Remote Sens. 2022, 14(18), 4683; https://doi.org/10.3390/rs14184683
Submission received: 10 August 2022 / Revised: 31 August 2022 / Accepted: 15 September 2022 / Published: 19 September 2022
(This article belongs to the Section Atmospheric Remote Sensing)

Abstract

:
We identified controlling factors of the inter-annual variations of surface PM2.5–aerosol optical depth (AOD) relationship in China from 2006 to 2017 using a nested 3D chemical transport model—GEOS-Chem. We separated the contributions from anthropogenic emission control and meteorological changes by fixing meteorology at the 2009 level and fixing anthropogenic emissions at the 2006 level, respectively. Both observations and model show significant downward trends of PM2.5/AOD ratio (η, p < 0.01) in the North China Plain (NCP), the Yangtze River Delta (YRD) and the Pearl River Delta (PRD) in 2006–2017. The model suggests that the downward trends are mainly attributed to anthropogenic emission control. PM2.5 concentration reduces faster at the surface than aloft due to the closeness of surface PM2.5 to emission sources. The Pearson correlation coefficient of surface PM2.5 and AOD (rPM-AOD) shows strong inter-annual variations (±27%) but no statistically significant trends in the three regions. The inter-annual variations of rPM-AOD are mainly determined by meteorology changes. Except for the well-known effects from relative humidity, planetary boundary layer height and wind speed, we find that temperature, tropopause pressure, surface pressure and atmospheric instability are also important meteorological elements that have a strong correlation with inter-annual variations of rPM-AOD in different seasons. This study suggests that as the PM2.5–AOD relationship weakens with reduction of anthropogenic emissions, validity of future retrieval of surface PM2.5 using satellite AOD should be carefully evaluated.

1. Introduction

Long-term exposure to ambient fine particles (PM2.5) in China causes more than 1 million early deaths every year [1,2]. To protect human health, it is critical to evaluate human exposure using high-resolution surface PM2.5 data. However, nationwide surface in situ measurements of PM2.5 were sparse and unavailable until 2013. Thus, studies usually retrieve surface PM2.5 with horizontal resolution of 1–10 km using satellite aerosol optical depth (AOD) with large spatial and temporal coverage [3,4,5,6].
Accurate retrieval of surface PM2.5 from satellite AOD requires a strong PM2.5–AOD relationship [7]. Studies use PM2.5/AOD ratio (η) and linear correlation coefficient of PM2.5 and AOD (rPM-AOD) to quantify the PM2.5–AOD relationship. Wang [8] explored the correlation between AOD from Moderate Resolution Imaging Spectroradiometer (MODIS) and hourly surface PM2.5 measurements in Jefferson county, Alabama, and showed a strong correlation (rPM-AOD = 0.7) for daily average and even stronger correlation for a monthly mean (rPM-AOD > 0.9). Strong correlations were also observed in Beijing (rPM-AOD = 0.79) [9] and at background sites in the North China Plain (NCP) [10] and in Nanjing in the Yangtze River Delta (YRD) [11] in China. However, nationwide studies [7,12] showed large spatial variations of rPM-AOD in 368 cities across China (0.01 < rPM-AOD < 0.88) in 2013–2017. Specifically, the rPM-AOD value is high in central China and relatively lower in eastern coastal regions and western arid regions [12,13]. Similar results were found using AOD products with a finer spatiotemporal resolution, such as advanced Himawari-8 imager AOD with hourly resolution and 5 km horizontal resolution [14] and multi-angle implementation of atmospheric correction (MAIAC) with 1 km horizontal resolution [15].
Aerosol type, meteorology and topography are important elements that affect the PM2.5–AOD relationship. Observations in Beijing showed that η is smaller for scattering-dominant coarse-mode aerosols than for absorbing-dominant fine-mode aerosols [9]. A stronger correlation for the scattering-dominated aerosols was also found based on observations across 368 cities in China [14]. Observations in Nanjing showed that rPM-AOD is larger for aerosols with larger Angstrom exponent [11]. Meteorological elements, such as relative humidity (RH), planetary boundary layer height (PBLH) and wind speed, are critical factors that affect the PM2.5–AOD relationship. The higher the RH, wind speed and PBLH, the smaller the η [9]. Using RH corrections improves surface PM10 estimates from satellite AOD in Beijing [16]. Including vertical correction via PBLH increases rPM-AOD in northwestern China [17]. However, nationwide studies [9,15] suggest that correction by RH and PBLH does not necessarily increase rPM-AOD. rPM-AOD decreases in a few regions in different seasons. For topography, the PM2.5–AOD relationship is stronger in basin areas and is weaker over plateaus [12,14,15].
Most current studies focus on spatiotemporal variations of the PM2.5–AOD relationship in recent years, but studies on decadal trends are rare. In addition, most studies are observation-based, and thus it is difficult to separate contributions from different factors. Due to the tough clean air policies, anthropogenic emissions of SO2 in China have declined markedly since 2006, and NOx emissions have reduced strongly after 2011, particularly after 2013 [18]. However, in 2006–2017, biomass burning emissions showed no statistically significant trends [19]. In addition, annual total biomass burning emissions of NMVOCs, NOx, NH3, SO2, BC, OC and primary PM2.5 only account for 1–8% of the total emissions [18,19]. The objective of this work is to systematically quantify the relative contributions of anthropogenic emission control and meteorology changes to trends and the inter-annual variations of the PM2.5–AOD relationship in China in 2006–2017. We use a nested global 3D chemical transport model—GEOS-Chem—to simulate the PM2.5–AOD relationship in China. We separate the contribution from anthropogenic emissions and meteorology changes by fixing meteorology at the 2009 level and fixing anthropogenic emissions at the 2006 level, respectively. We investigate responses of the PM2.5–AOD relationship to anthropogenic emission changes and identify major meteorological elements that influence the inter-annual variations of the PM2.5–AOD link.

2. Materials and Methods
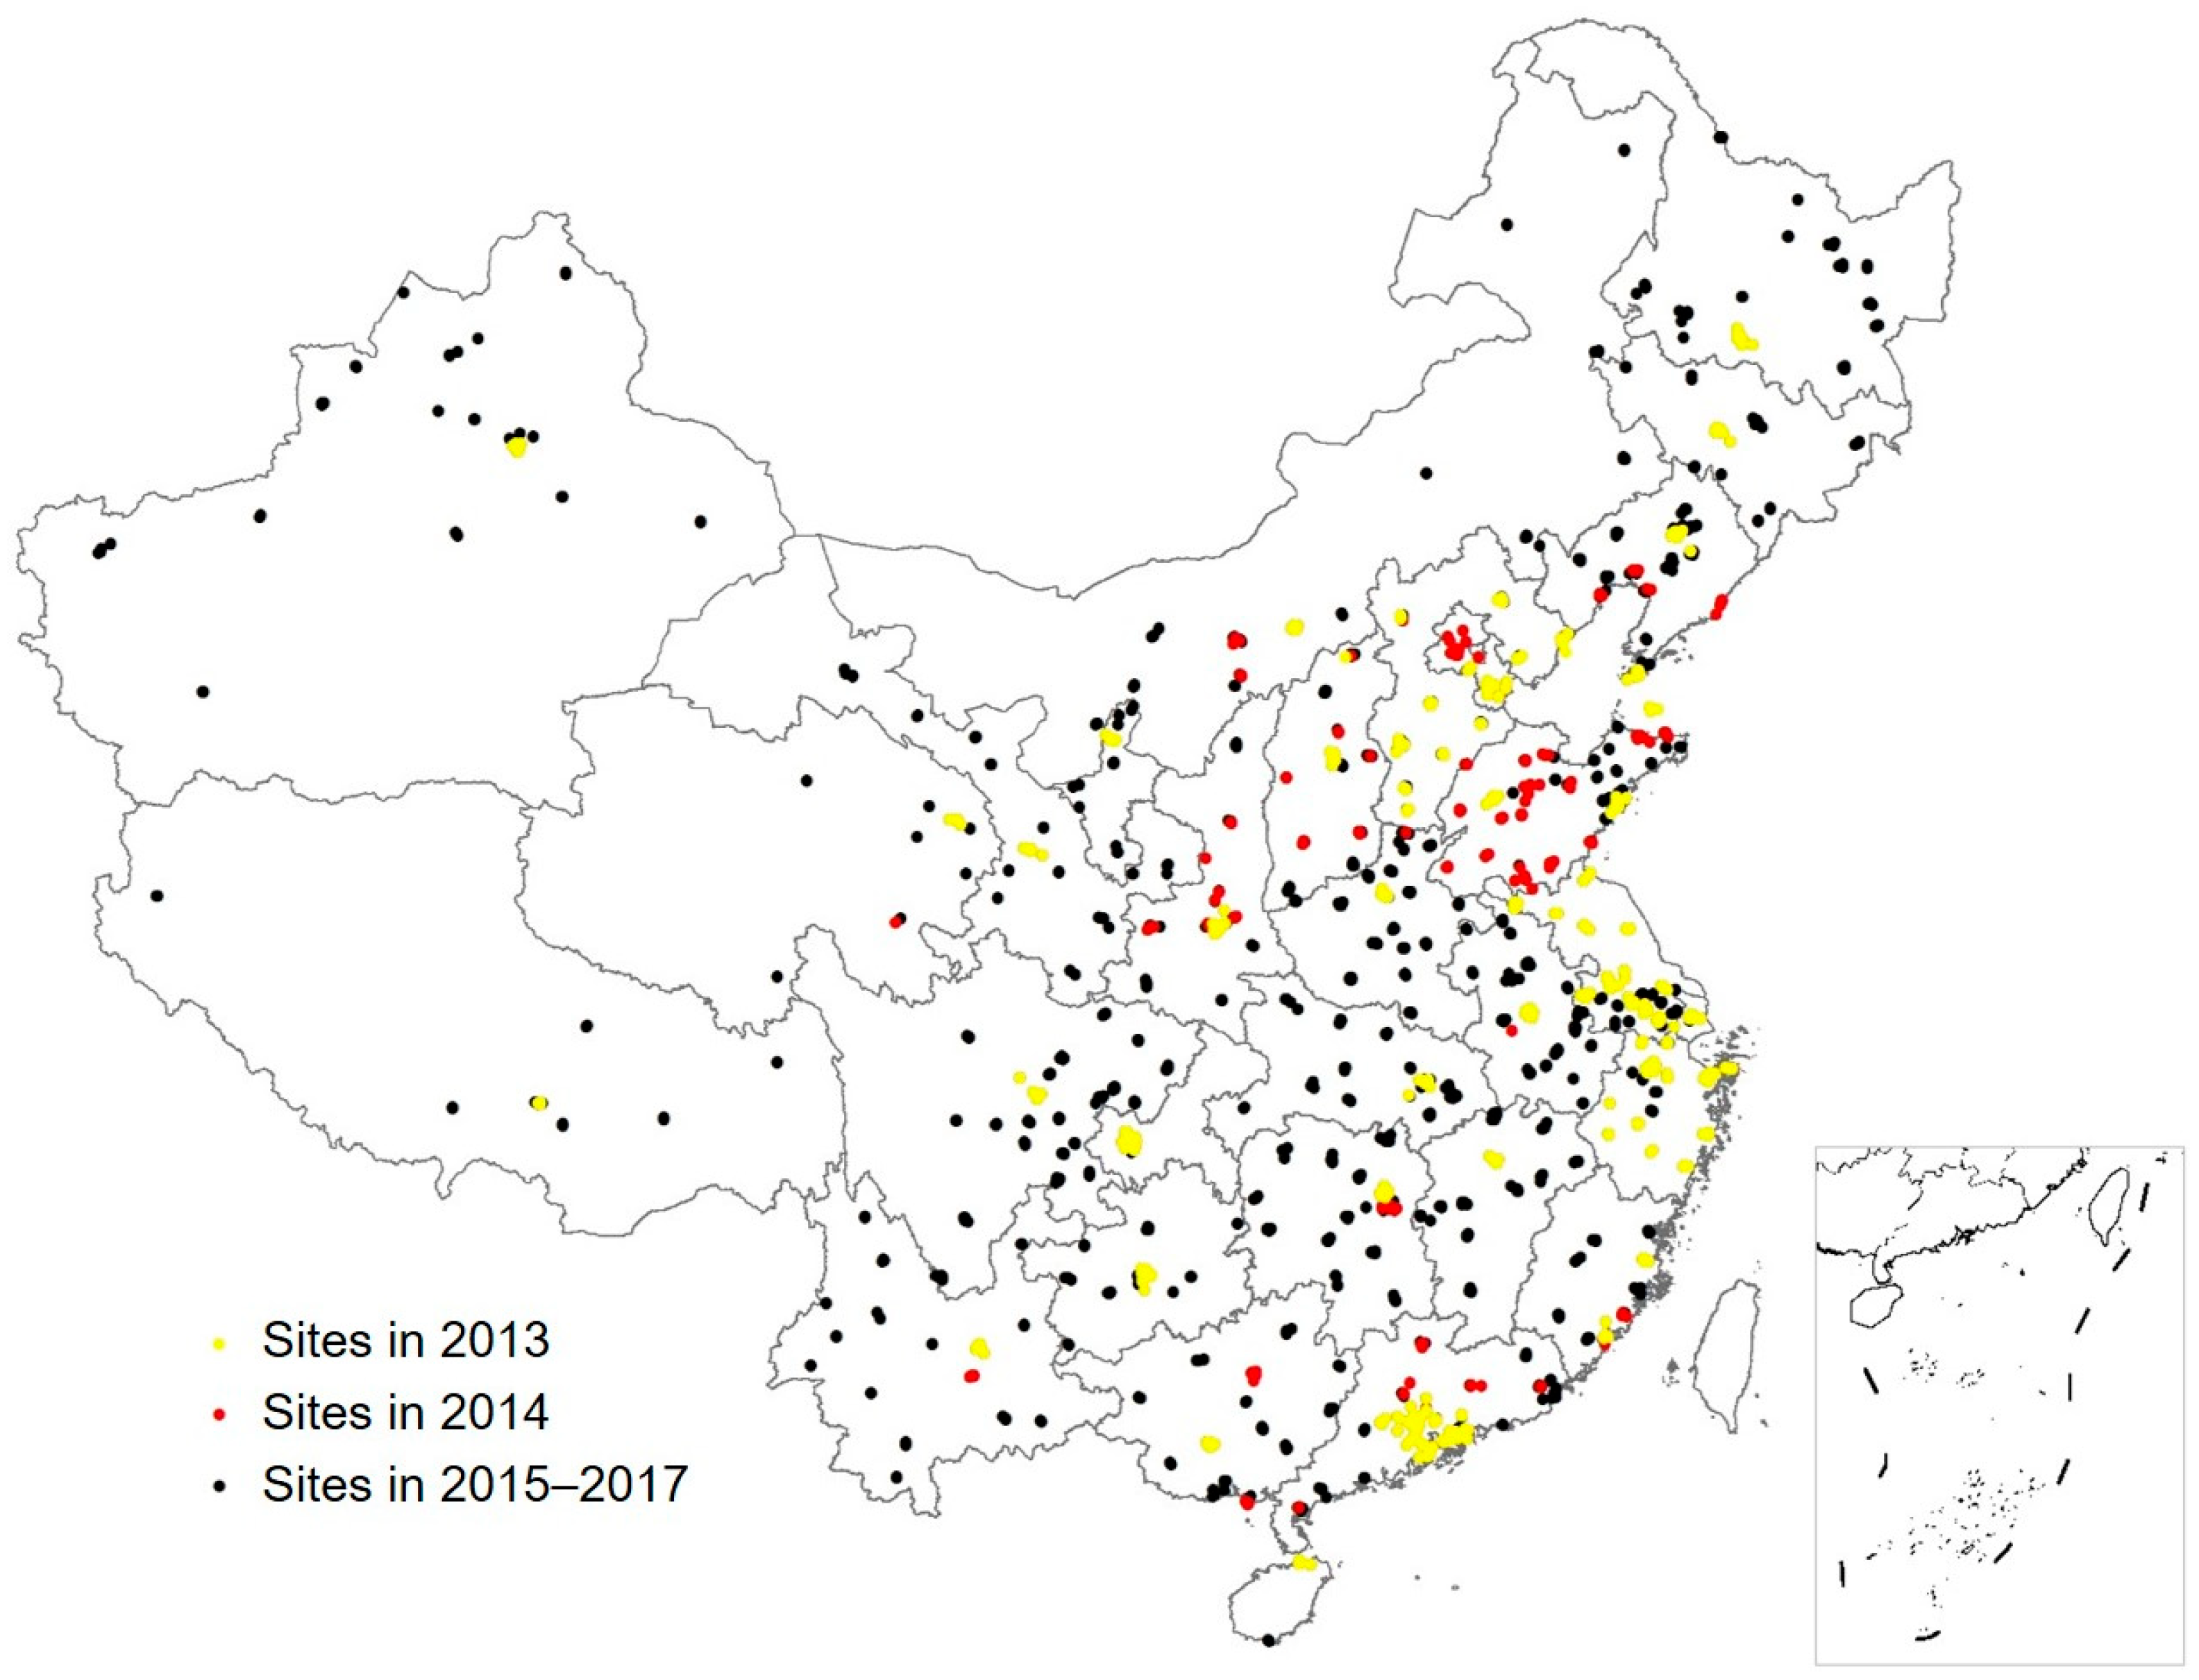
2.1. Observations

We used MODIS Collection 6.1 Level-3 daily mean Dark Target and Deep Blue combined AOD data at 550 nm (https://modis-atmos.gsfc.nasa.gov/MOD08_M3/index.html, accessed on 16 June 2021). Collection 6.1 modified aerosol retrieval over the land surface when urban percentage is larger than 20% using a revised surface characterization and improved surface modeling in elevated terrain (Collection 6.1 Change Document). On a global scale, the expected errors are ± (0.05 + 15%) over land for Dark Target retrievals at the 10-km spatial resolution, ± (0.03 + 21%) for arid path retrievals and ± (0.03 + 18%) for vegetated path retrievals for Deep Blue retrievals. On regional scale, 60–83% of MODIS C6.1 AOD data are within range of ± (0.05 + 15%) in NCP [20] and 90% of MODIS C5 data fall in the range of ± (0.05 + 20%) in YRD [21]. See details in reference [22].
We used surface in situ measurements of PM2.5 from the China Ministry of Ecology and Environment network (https://www.mee.gov.cn, accessed on 16 June 2021) with 484 sites in 2013, 670 sites in 2014 and 1498 sites in 2015–2017 (Figure 1). PM2.5 concentrations were determined by two methods: Thermo Scientific Continuous Ambient Particle Monitor TEOM-FDMS (Waltham, MA, USA) (about 60% of the sites) and β-gauge (the remaining 40% of the sites) with quality control (National Ambient Air Quality Standards, GB3095-2012; available at: http://english.mee.gov.cn/Resources/standards/Air_Environment/quality_standard1/201605/t20160511_337502.shtml, accessed on 16 June 2021). PM2.5 concentrations determined by the two methods are highly correlated (r2 = 0.95), but the concentrations measured by TEOM equipment are 15–23% lower than those measured by β-gauge [23]. Since the measurement method used at each site was unavailable, we used available data from all sites by the two methods, bringing uncertainties to the analysis.

2.2. Model Description

We use the 3D chemical transport model, GEOS-Chem version 11.01, to simulate surface PM2.5 and AOD in China. We use a nested model with a horizontal resolution of 0.5° latitude × 0.667° longitude over Asia and the boundary conditions were archived from global simulations at 2° latitude × 2.5° longitude (see model grids at http://wiki.seas.harvard.edu/geos-chem/index.php/GEOS-Chem_horizontal_grids, accessed on 29 August 2022). Meteorological fields are from Modern-Era Retrospective analysis for Research and Application, Version 2 (MERRA-2). We ran the model with full gaseous chemistry and online aerosol calculations. GEOS-Chem simulates the thermodynamics of aerosols using the ISORROPIA II package [24]. The model couples aerosol and gas-phase chemistry through nitrate and ammonium partitioning [25], sulfur chemistry in clouds and aerosols [26], secondary organic aerosol formation [27,28] and uptake of acidic gases by sea salt and dust [29]. Monthly anthropogenic emissions of SO2, NOx, BC, OC, NMVOCs and NH3 in Asia are from the multi-resolution emission inventory developed by Tsinghua University (Available at: http://meicmodel.org/, accessed on 29 August 2022) [18]. We updated anthropogenic emission inventories of these species in China in 2006–2017 [30]. Daily open biomass burning emissions are from the Global Fire Emissions Database, Version 4 (Available at: https://daac.ornl.gov/VEGETATION/guides/fire_emissions_v4_R1.html, accessed on 29 August 2022) [31] with horizontal resolution of 0.25° latitude × 0.25° longitude. Dry and wet removal of aerosols follow [32] and [33], respectively. The model simulation of AOD, surface PM2.5 and its components are extensively validated against in situ station radiometer AOD measurements, MODIS AOD, surface in situ measurements of PM2.5 and its components in previous studies [22,34].

2.3. Experimental Setup

We performed three experiments to quantify the contributions of anthropogenic emission control and meteorology changes to the PM2.5–AOD relationship in China. In the BASE experiment, PM2.5 and AOD were simulated with varying anthropogenic emissions and meteorological fields in each year from 2006 to 2017. In the FIXEMISS experiment, anthropogenic emissions were fixed at the 2006 level, when China started to control SO2 emissions [35]. The variations in this experiment reflect the effects of meteorology changes in 2006–2017. In the FIXMET experiment, the meteorological field was fixed at the 2009 level in each year in 2006–2017. We selected 2009 because the annual mean PM2.5 concentration in 2009 was the closest to the 12-year average. The variations in this experiment reflect the effects of anthropogenic emission control.
We analyze results in three key regions in China: the NCP (35–41°N, 110–120°E), the YRD (27–35°N, 116–122°E) and the Pearl River Delta (PRD, 22–25°N, 110–117°E). See details of the regions in reference [22]. PM2.5/AOD ratio η and Pearson correlation coefficient rPM-AOD were proved to be good parameters to quantify the PM2.5–AOD relationship [6,12,13,36]. The former is a conversion factor [37] and indicates the dry mass PM2.5 concentration per unit aerosol optical thickness. The latter indicates the strength and direction of the linear relationship between surface dry mass PM2.5 and AOD. A previous study showed that stronger PM2.5–AOD relationship produces better surface PM2.5 retrieval [12]. We archived daily mean PM2.5 concentration and AOD data from GEOS-Chem runs in the three experiments. We estimated the daily η (η = PM2.5_daily/AOD_daily) in each model grid first and then estimated the monthly, seasonal and annual mean in each region. We estimated rPM-AOD using daily mean PM2.5 and AOD in each model grid in each month, season and year and then estimated the mean value in each region.

3. Results

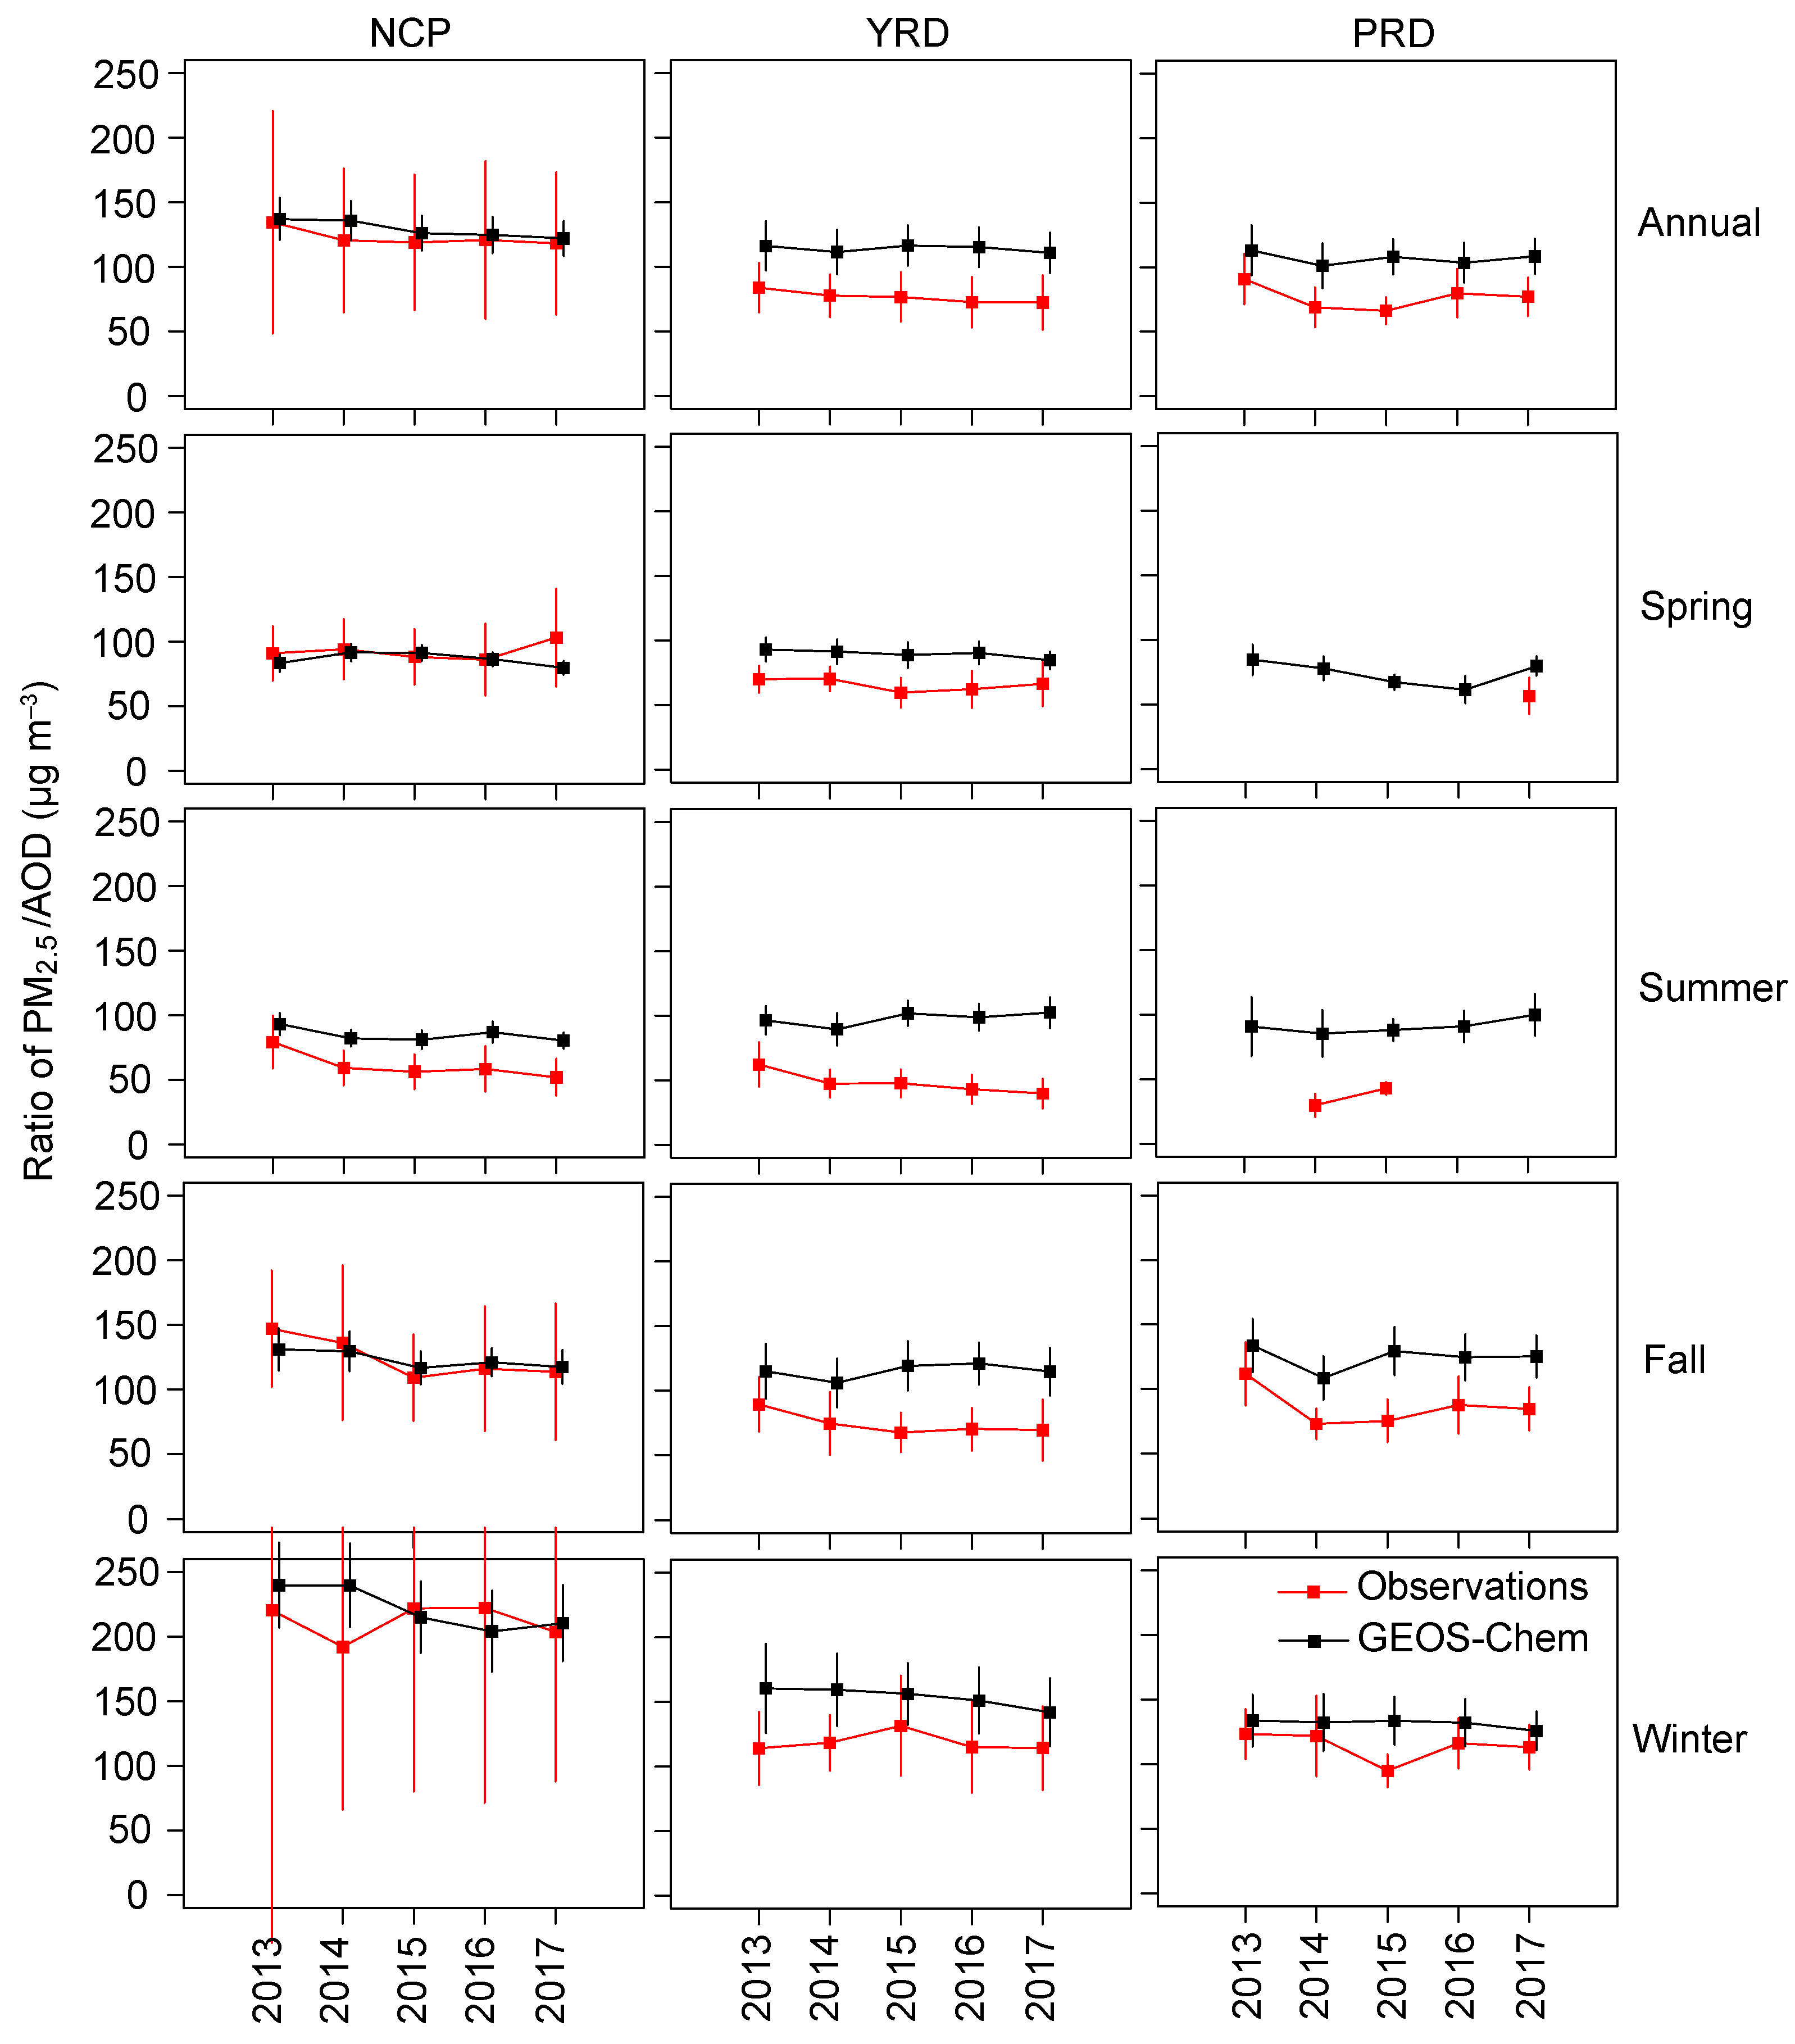
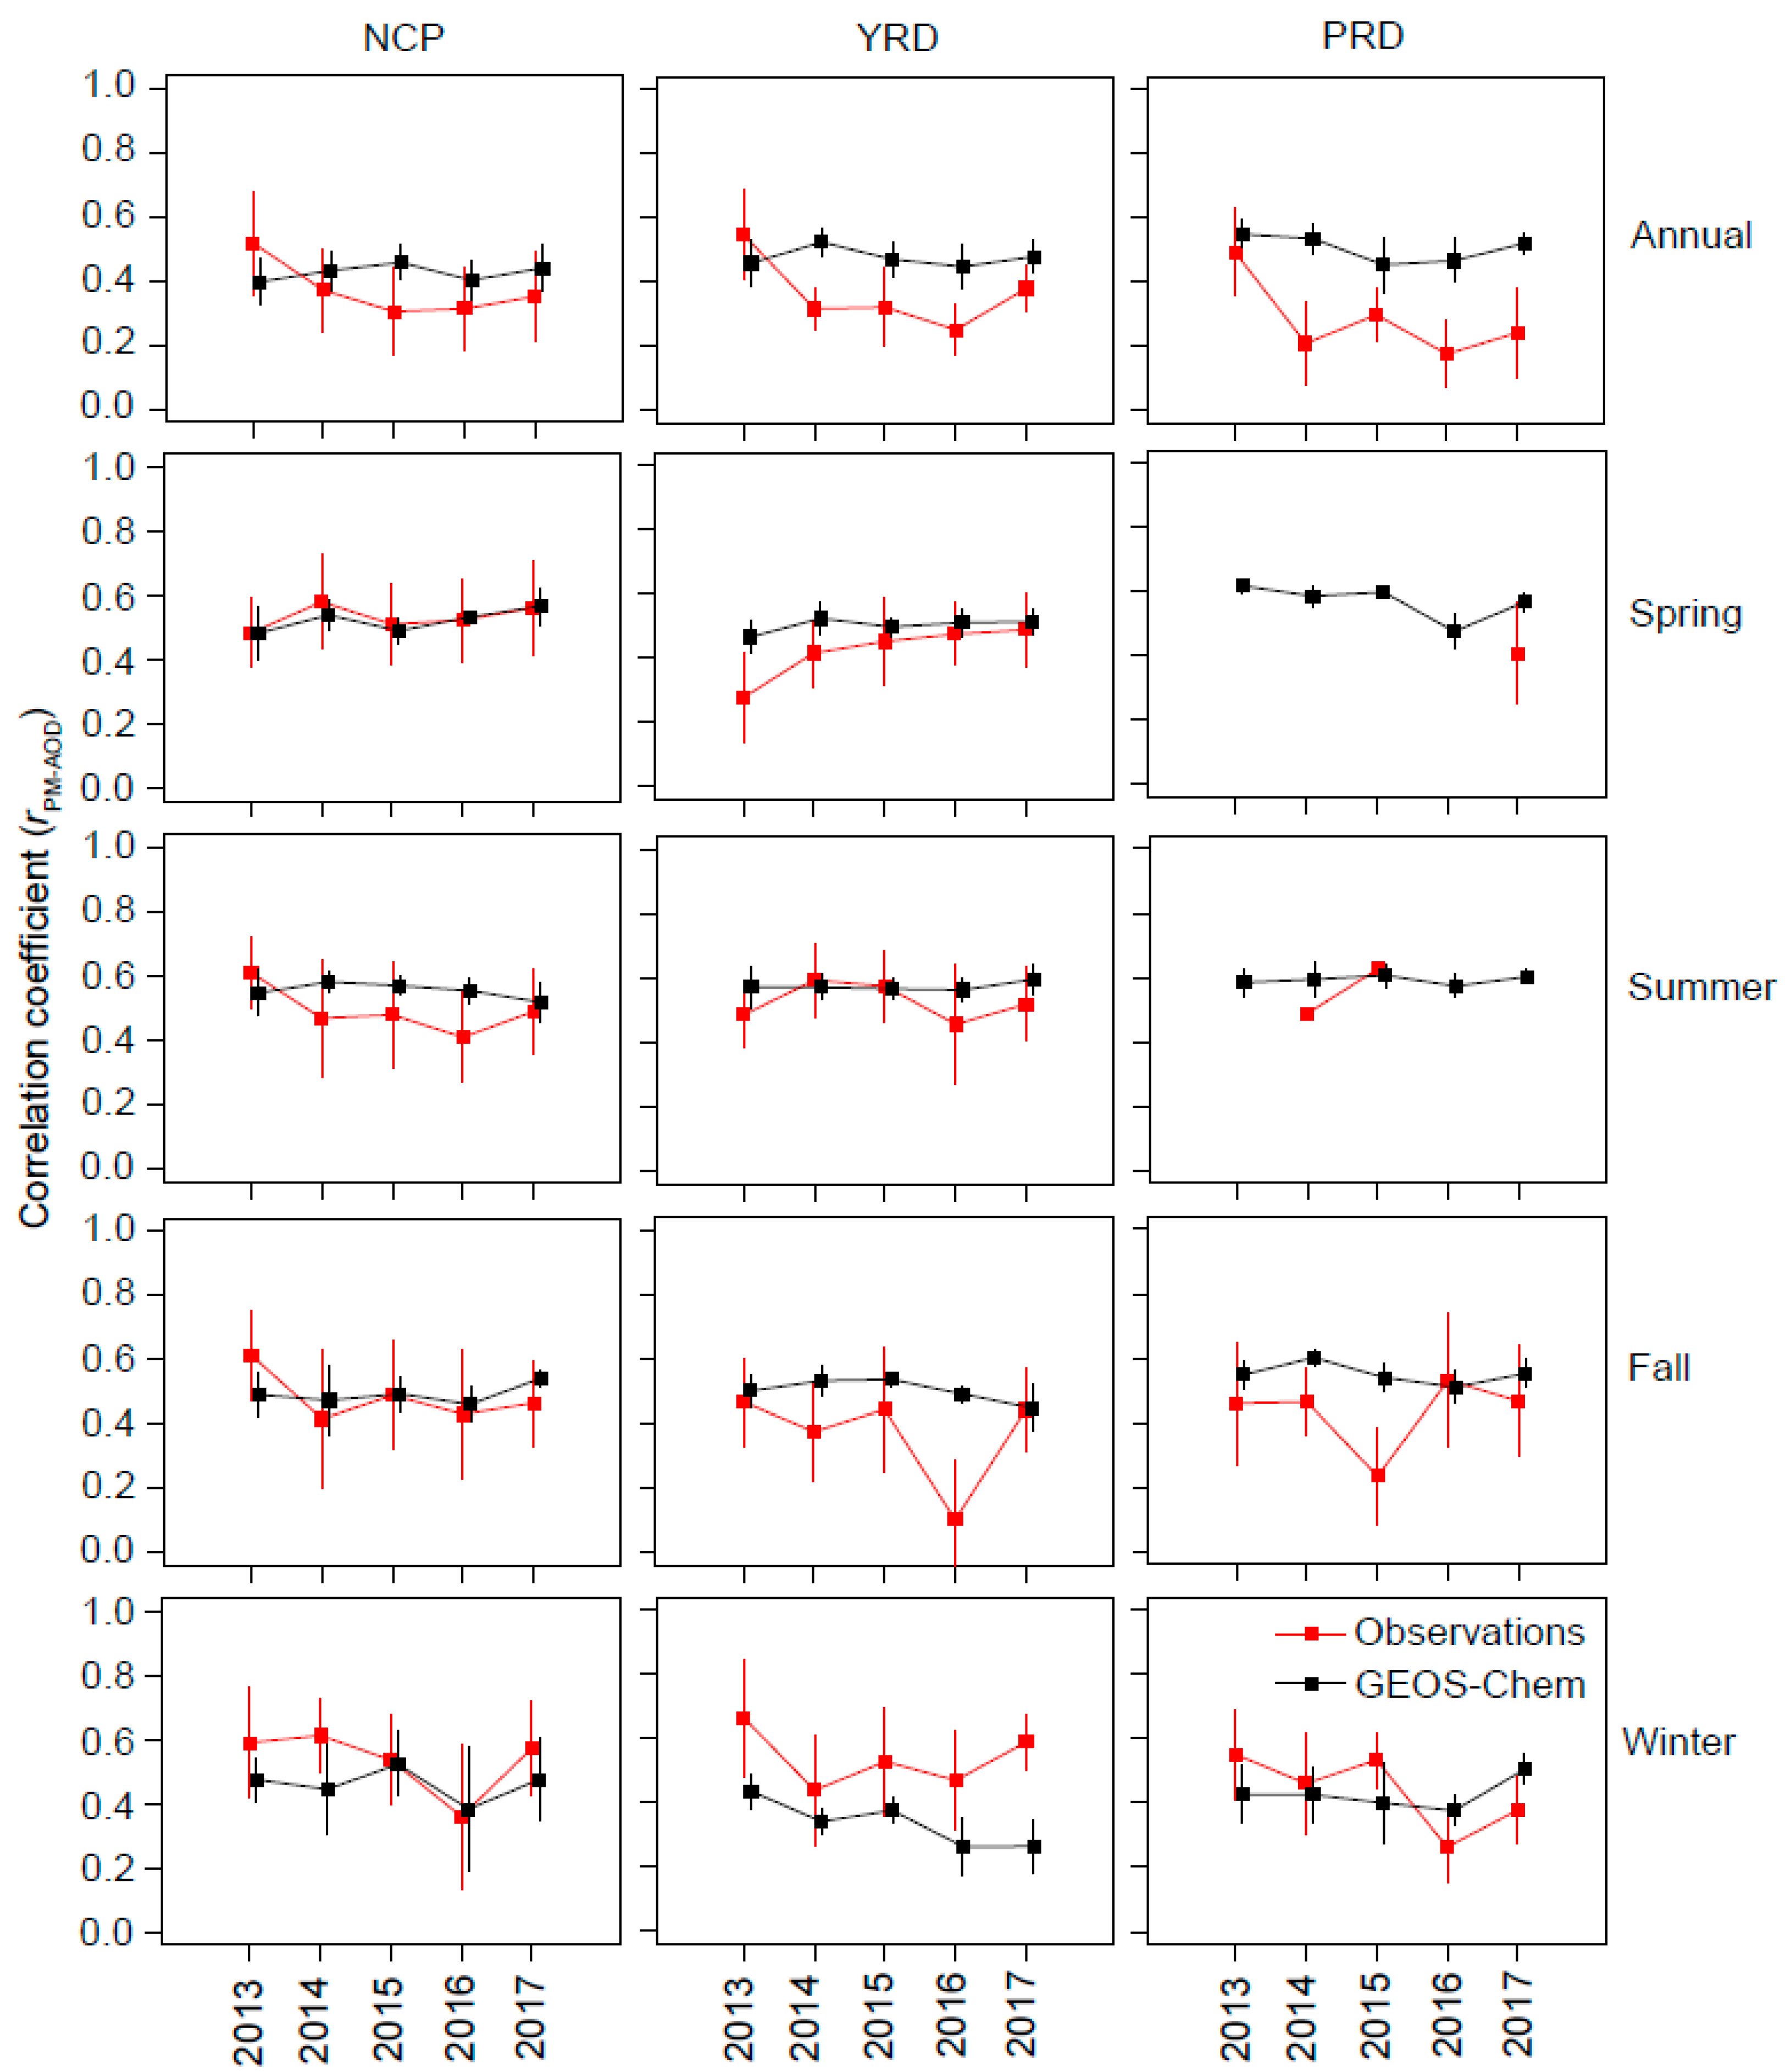
3.1. Observed and Simulated Long-Term Trends of PM2.5–AOD Relationship

Observations show that the ratios of η observed at the in situ sites in 2013–2017 vary with seasons. The largest η is in winter (114–212 μg m−3) and the smallest in summer (44–61 μg m3, Figure 2). This is possibly explained by several reasons. First, anthropogenic emissions in winter are 30% larger than those in summer in NCP, while the differences in YRD and PRD are within 8%. Thus, the ratio in NCP in winter is higher than those in other seasons and regions. Second, stable stratification in winter confined surface emissions to the boundary layer and enhances surface PM2.5 concentration. Simulated surface PM2.5 concentration in winter is consistently 16–54% larger than those in summer in the three regions. Third, aerosol loading in NCP in summer is 25–43% larger than that in winter. In YRD and PRD, aerosol loading in summer is also smaller than that in winter, but the difference is smaller than those of surface PM2.5 concentrations. Fourth, the simulated hygroscopic factors of different species in summer are 1–45% larger than those in winter, enhancing AOD in summer.
GEOS-Chem overestimates η by 24–63% in NCP, YRD and PRD due to the overestimate of surface PM2.5 and underestimate of AOD [22]. Observations show that annual mean ratios of η are decreasing at rates of −2.6, −3.6 and −2.1% year−1 in NCP (p-value = 0.13), YRD (p-value = 0.02) and PRD (p-value = 0.67) in 2013–2017, with the fastest decline in summer (−9.1, −10.3 and −2.6% year−1) and followed by those in fall (−7.0, −5.9 and −4.6% year−1). In 2006–2017, the simulated η show significant decreasing rates of −1.2, −0.7 and −1.4% year−1 in NCP, YRD and PRD (p-value < 0.01), respectively. Different from trends of AOD and surface PM2.5 [22], the difference of reduction rates of η before and after 2013 are much smaller (Figure 3). Specifically, the simulated reduction rates of η in 2013–2017 are smaller than those in 2006–2013 by 16% in NCP, but the rates in YRD and PRD in 2013–2017 are 11% and 100% larger than those in 2006–2013.
Observations show that rPM-AOD in 2013–2017 is decreasing in the three key regions, but the trends are statistically insignificant (p-value > 0.76). These trends are in general agreement with recent studies [12]. GEOS-Chem reproduces the inter-annual variations of rPM-AOD with a bias of −33–222% (Figure 4). The model overestimates rPM-AOD for the annual mean and in spring-fall. The overestimate is possibly because the model does not resolve AOD from coarse particles. In contrast, the model underestimates rPM-AOD in winter, possibly due to the overestimated isolation of the boundary layer by the model [22]. rPM-AOD shows no significant trends in the three key regions in 2006–2017, but the inter-annual variations are substantial (Figure 5). The rPM-AOD values vary by ±27% in the 12 years in spring–fall. In winter, rPM-AOD varies between −0.47 and 0.38.

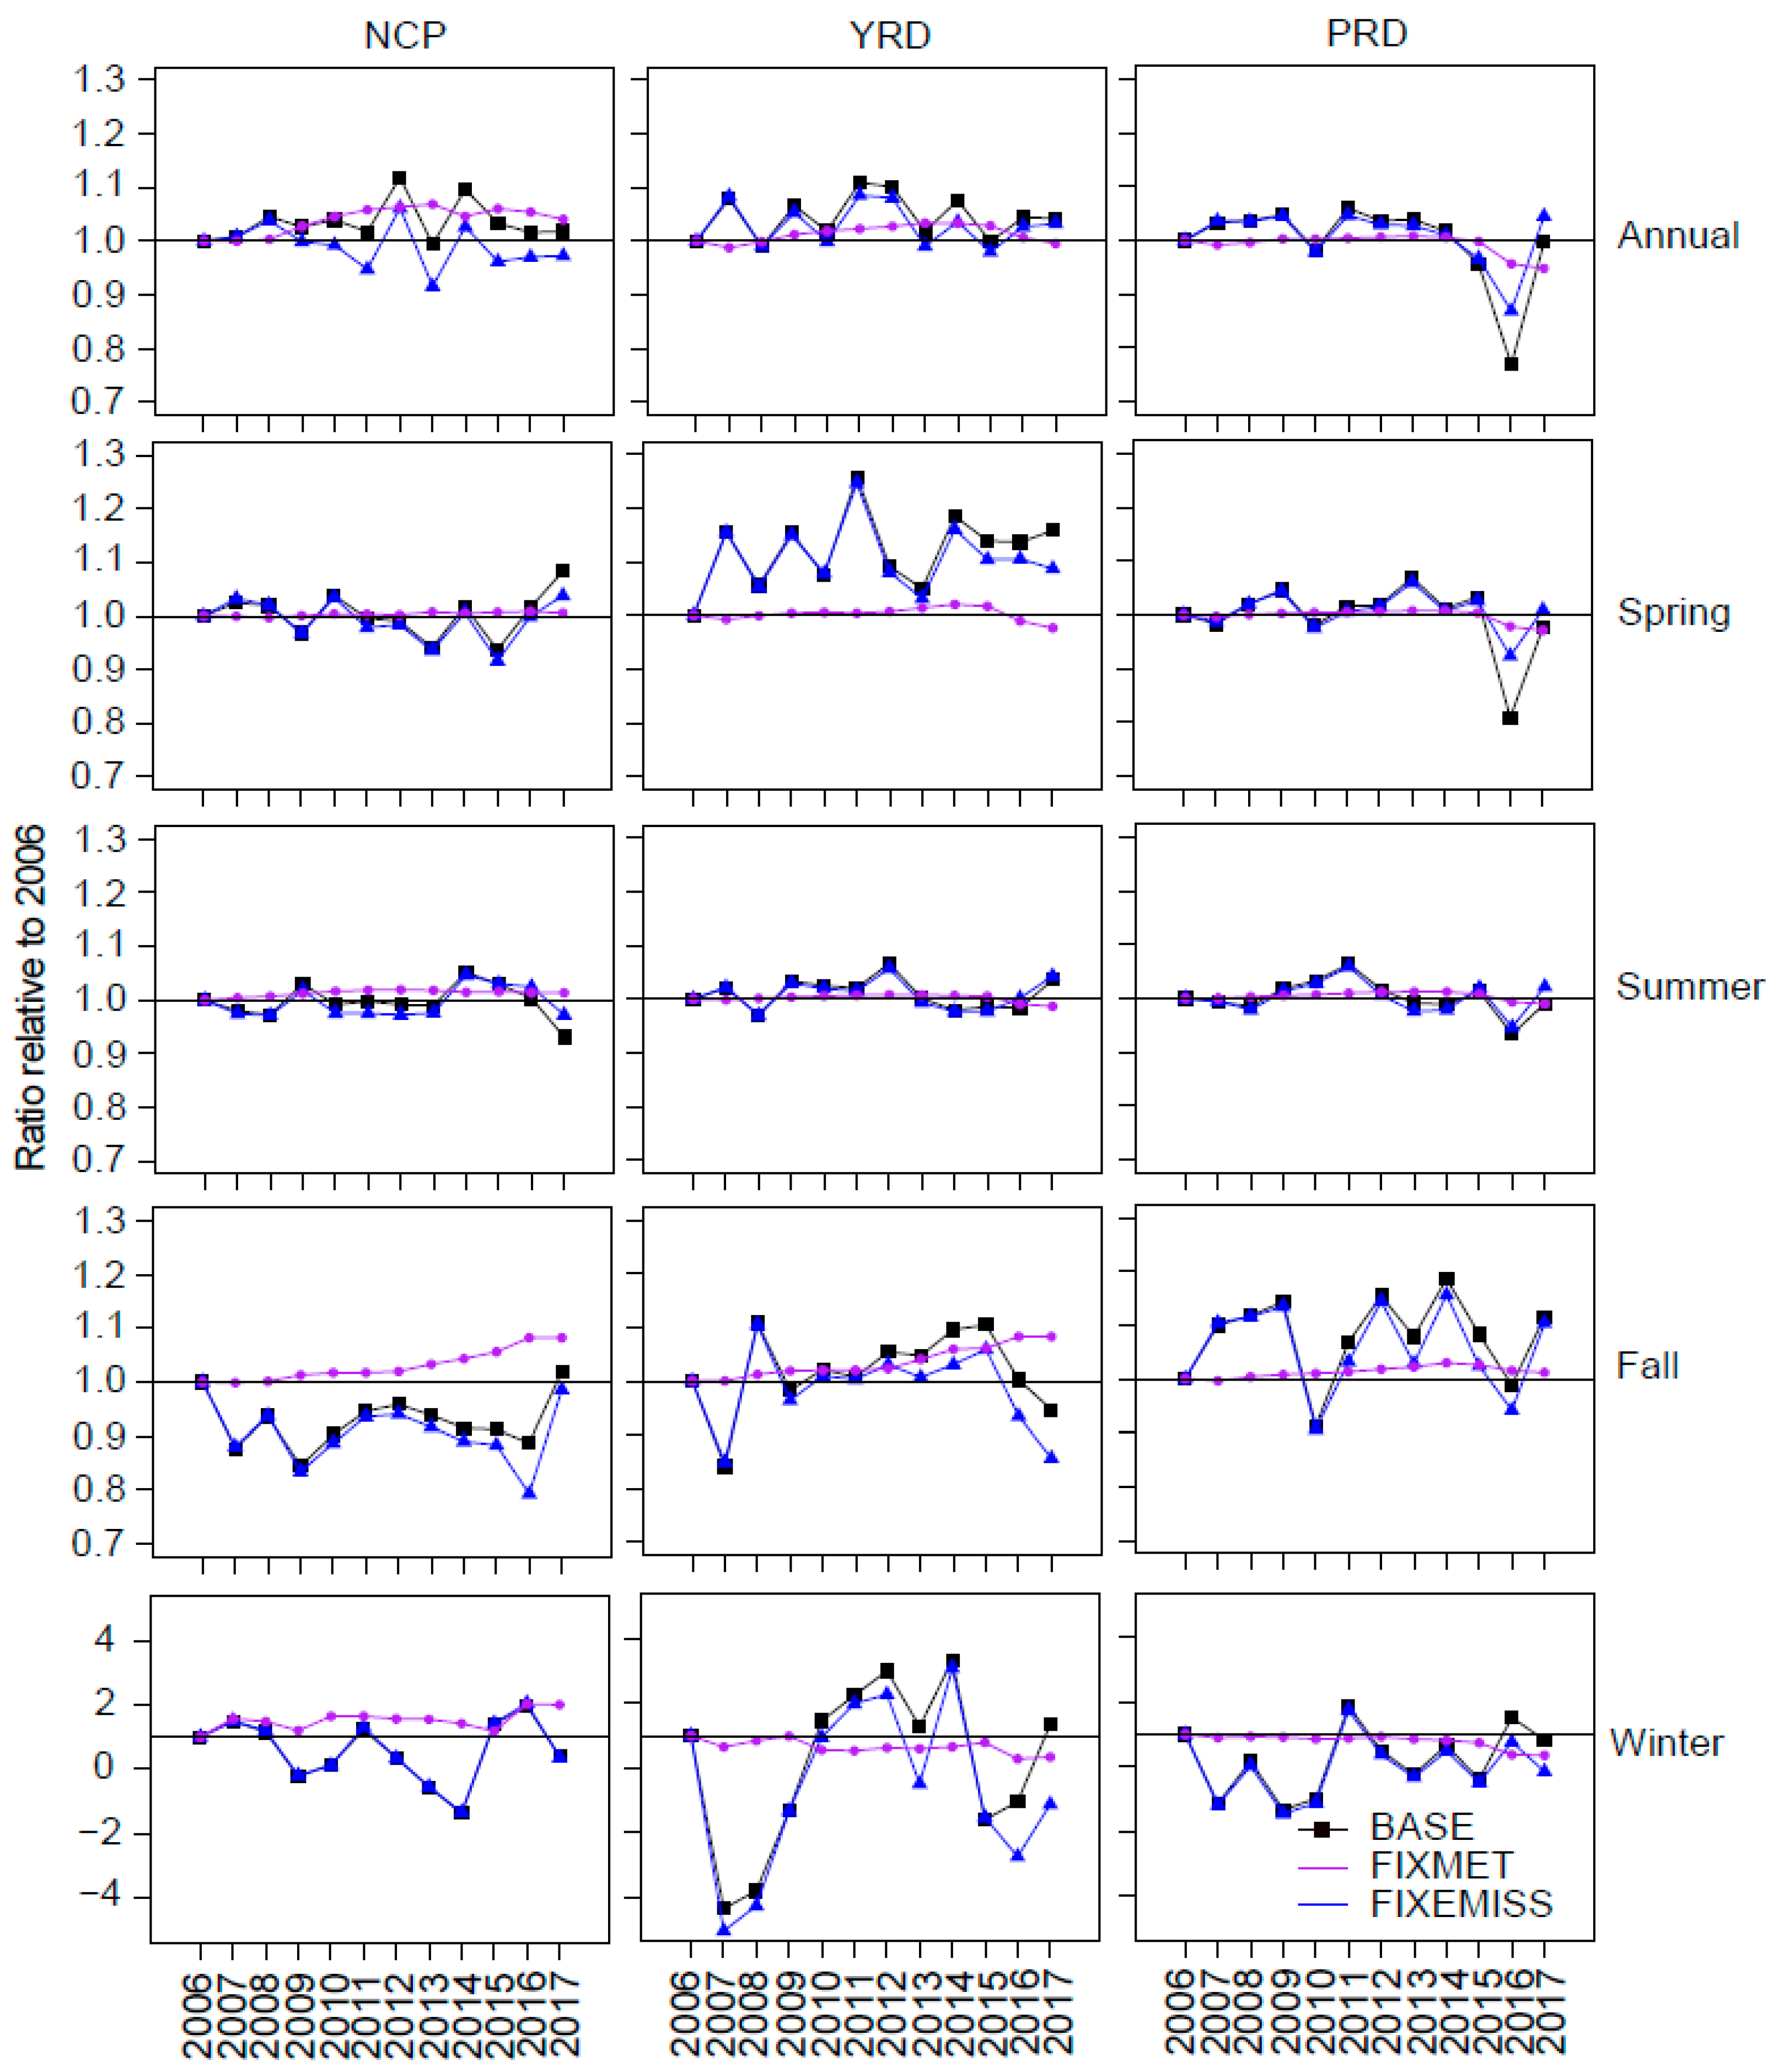
3.2. Contributions of Anthropogenic Emission Control and Meteorology Changes to PM2.5–AOD Relationship

The decrease of η in 2006–2017 is mainly attributed to anthropogenic emission changes (Table 1). Specifically, meteorology changes tend to increase η in NCP and YRD, but contribute 10% to the reduction of η in PRD in FIXMET. In addition, η in BASE correlate stronger with η in FIXMET (0.70 < r < 0.87) than those in FIXEMISS (0.26 < r < 0.64). The downward trends of surface PM2.5 and AOD in recent years are also attributed to anthropogenic emission changes [38,39]. GEOS-Chem suggests that the annual mean surface PM2.5 decreases faster than AOD by 68% in NCP, 59% in YRD and 72% in PRD in 2006–2017 in FIXMET.
On a seasonal scale, the downward trends of η (BASE) are also attributed to anthropogenic emission reductions (Table 1). The downward trends of η in FIXMET are statistically significant in the four seasons. Meteorology changes increase η in spring and winter, but decrease η in summer and fall in NCP, and show limited effects on trends of η in other regions. In FIXMET in NCP, AOD decreases at the rate of 0.8% year−1 in spring, but surface PM2.5 shows no trends; thus, η increases. The inter-annual variations of AOD in this region are controlled by temperature and vertical air movement at 850 hPa and surface RH [22]. However, none of these meteorological elements showed statistically significant trends over the 12 years. The weakening of the East Asian summer monsoon enhances aerosol concentrations but AOD increase (0.9% year−1) faster than surface PM2.5 (0.1% year−1), producing a negative trend of η. Similar upward trends are observed for fall (AOD: 1.4% year−1 (p-value < 0.1); surface PM2.5: 0.3% year−1). The strong enhancement of AOD is related to the decreased potential vorticity (−0.02 PVU year−1, p-value < 0.05) and the increased RH at 850 hPa (0.002 year−1). In winter, AOD decreases significantly over the 12 years (−1.2% year−1, p-value < 0.01), but surface PM2.5 increases; thus, η increases. The strong decrease of AOD is attributed to the significant increase of northerly wind speed at 850 hPa (0.15 m s−1 year−1, p-value < 0.1). The inter-annual variations of η are also strongly affected by meteorology changes on the seasonal scale. H in BASE correlate stronger with η in FIXEMISS than those in FIXMET in fall and winter in the three regions (Table 2).
Meteorology changes show larger effects on inter-annual variations of rPM-AOD than anthropogenic emission control in 2006–2017 (Figure 5). In the FIXMET experiment, rPM-AOD increase significantly in 2006–2013 (p-value < 0.01) and decrease in 2013–2017 (p-value = 0.20 in NCP, 0.02 in YRD and PRD). In contrast, no significant trends are seen in FIXEMISS. Combining the effects of anthropogenic emission changes and meteorology changes in the BASE experiment, the trends of rPM-AOD are statistically insignificant, indicating that meteorology changes have larger influences on rPM-AOD than anthropogenic emission changes in 2006–2017. In addition, rPM-AOD in BASE correlates stronger to rPM-AOD in FIXEMISS (0.73 < r < 0.95) than those in FIXMET (0.17 < r < 0.63, Table 3). Moreover, the inter-annual variations of annual rPM-AOD caused by meteorology changes (−14%–+7%) are much larger than those caused by anthropogenic emission changes (−5%–+3%). On the seasonal scale, rPM-AOD in BASE also correlate stronger to rPM-AOD in FIXEMISS than those in FIXMET, similar to the comparison on the annual scale (Table 3).

3.3. Responses of PM2.5 /AOD Ratios to Anthropogenic Emission Changes (FIXMET)

AOD is determined by both aerosol loading and the hygroscopic growth factor from the surface to the top of the atmosphere ([22], Section 2.1). GEOS-Chem shows that in FIXMET the hygroscopic growth factors do not change over the years, and the decrease of η in 2006–2017 is mainly due to faster decrease of PM2.5 at the surface than aloft (Figure 6). We estimate the reduction rates of PM2.5 in 2006–2017 ((PM2.5_2017–PM2.5_2006)/PM2.5_2006) at various heights from the surface to 500 hPa. The reduction rates of PM2.5 at 800 hPa (500 hPa) are 7% (48%), 5% (47%) and 20% (55%) smaller than those at the surface in NCP, YRD and PRD, respectively. The largest difference in reduction rates between the surface and aloft is from OA and the ratio decreases with increasing altitude monotonically. In contrast, the reduction rate of sulfate-nitrate-ammonium (SNA) increases slightly below 800 hPa in NCP and YRD (Figure 6, see model validation of PM2.5 components in [22,34]).
GEOS-Chem shows that reduction rates of OA in surface PM2.5 are slightly larger than those of AODOA in winter (<25%), and are markedly larger (48–81%) than those of AODOA in summer. The reason is that OA reduction rates are decreasing with increasing height both in summer and winter (Figure 6), but at a faster rate in winter due to stable stratification and lower PBLH. In contrast, reduction rates of PM2.5_SNA are slightly larger than AODSNA in summer (by up to 8%), but are 1–38% smaller in winter. We find that reduction rates of SNA are decreasing with increasing altitude in summer, but the trend is the opposite in winter below 850 hPa. The model shows that in winter, concentration of NO3 is increasing at a faster rate at the surface than aloft. In addition, the ratio of NO3/SNA decreases quickly with increasing height (e.g., NCP in winter: surface: 57%; 750 hPa: 18%). Thus, the resulting total reduction rates of SNA increase with increasing height in winter. The unfavorable chemical processes that buffer NO3 reduction in winter have been widely observed and simulated [40,41]. Very few studies have investigated the vertical distribution of PM2.5 components in China. The authors in [42] showed that NO2 is the most important factor that determines the vertical profile of PM2.5 in Shanghai in winter. This, in general, explains the important role of NO3 on the vertical distribution of PM2.5. Observations of vertical profiles of PM2.5 components in China are needed in the future to investigate the response of PM2.5 components at different altitudes to emission changes.

3.4. Meteorological Elements That Influence the Correlation of PM2.5 and AOD (FIXEMISS)

We estimated the correlation coefficient of rPM-AOD (correlation coefficient of daily mean PM2.5 and AOD in each month in 2006–2017) and monthly mean meteorological elements in each season. The meteorological elements are from MERRA-2 reanalysis data and include temperature (T), an east-west wind component (U), a north-south wind component (V), vertical air movement (O), relative humidity (RH), potential vorticity (PV) at the surface, 850 hPa and 500 hPa, and tropopause pressure (TROPPT), pressure at the surface (PS) and sea level pressure (SLP).
Meteorological elements that have strong correlation with rPM-AOD vary with regions and seasons (Table 4). T at the surface, 850 hPa and 500 hPa are strongly correlated with rPM-AOD with correlation coefficients of 0.72–0.88 in NCP and YRD in spring. Tsurface is also positively related to rPM-AOD in YRD and PRD in fall, and to rPM-AOD in PRD in winter. Higher T is usually related to stronger vertical mixing, thus a larger correlation of the surface PM2.5 and column AOD.
Wind in zonal and meridional directions show different correlations with rPM-AOD in the three regions (Table 4). Zonal wind is positively related to rPM-AOD in NCP but negatively related to rPM-AOD in YRD and PRD. Meridional wind is positively related to rPM-AOD in YRD and negatively related to rPM-AOD in NCP. The positive or negative correlation coefficients are attributed to the wind direction. For example, U500hPa is positive (from west to east) in the three regions and is consistently negatively related to rPM-AOD in YRD and PRD. Faster wind at 500 hPa blows aerosols away and decreases the correlation of surface PM2.5 and AOD in the column. In contrast, U850hPa in summer and Usurface in winter in NCP are negative (from east to west) in 1/3 of the 36 months and are positively related to rPM-AOD in NCP. We find that O are positively related to rPM-AOD in NCP and YRD in winter, but negatively related to rPM-AOD in PRD in summer and winter. In the former two regions, the vertical air movement is upward, thus larger O means stronger mixing and larger rPM-AOD. In PRD, the vertical movement is downward, thus larger O means stronger isolation between the surface and aloft and smaller rPM-AOD.
PS and SLP are negatively related to rPM-AOD in the three regions in spring, summer and fall (Table 4). Air flows up and together in a low-pressure system, enhancing vertical mixing. Lower PS means stronger mixing and larger rPM-AOD. dT, dV and dU are indicators of atmospheric stability, thus, they are mostly positively related to rPM-AOD in the three regions.
We investigated the correlation of rPM-AOD and RH and PBLH in every season. In spring, RH500hPa is positively related to rPM-AOD in PRD (r = 0.77), but shows weaker relation in NCP and YRD. RHsurface and RH850hPa have relatively weaker relations with rPM-AOD in the three regions. In summer, RH has relatively weaker correlation with rPM-AOD in NCP and YRD than in PRD. This is in general agreement with observations, which showed that RH correction increased the rPM-AOD in the three regions with the largest percentage increase in PRD [15]. PBLH is positively related to rPM-AOD in NCP (r = 0.61), but is relatively weakly related to rPM-AOD in other seasons and other regions (−0.33 < r < 0.33). This is in general agreement with a recent study, which showed that PBLH-PM correlations are stronger in polluted regions than in clean regions [43]. PBLH correction deteriorates the correlation in YRD and PRD in spring [15].

4. Discussion

We use model experiments to separate contributions from anthropogenic emission control and meteorology changes to the PM2.5–AOD relationship. We find that η decreased significantly in 2006–2017, due mainly to anthropogenic emission control. With further reduction of anthropogenic emissions in the future, the PM2.5–AOD relation is predicted to become weaker. Previous observation-based studies also detected weakening trends of the PM2.5–AOD relationship in the last five years [12]. However, it was difficult to investigate reasons for the trends based only on observations.
GEOS-Chem simulation showed that rPM-AOD showed no statistically significant trends but large inter-annual variations. Meteorological elements are critical in explaining the inter-annual variations of rPM-AOD, such as T, U, V, O, PS, atmospheric instability, RH and PBLH. Among these elements, RH and PBLH were well discussed in previous observation-based studies. Using correction of RH and PBLH improves the correlation of monthly PM2.5 and AOD in Beijing in 2011–2015 from 0.63 to 0.76 [9]. The authors in [17] suggested correcting surface PM2.5 retrieval using PBLH in northwest China. RH tends to weaken the rPM-AOD regardless of geographical location [13]. Corrected by RH and PBLH, rPM-AOD increased in most regions but decreased in a few of the 368 cities in China [15]. rPM-AOD decreases with increasing surface wind speed [15]. Other meteorological elements were rarely discussed. However, this study shows that T, PS and atmospheric instability are also important to the variations of rPM-AOD, and should be considered in future research.
Despite the strong relation between surface PM2.5 and AOD, they show a lot of differences. First, surface PM2.5 and AOD show completely different seasonality [22,36]. Second, surface PM2.5 and AOD respond differently to emission changes. With the anthropogenic emission changes in 2006–2017, fractional reduction rates of surface PM2.5 are larger than AOD. Third, influences of meteorology changes on the inter-annual variation of AOD are larger than that of surface PM2.5 [22]. Fourth, despite steady improvement of data quality, uncertainties of AOD values obtained by space-borne remote sensors are so large that they can hardly be used to detect the long-term variations [44]. Even for a global mean quantity, the discrepancies among different products exceed the signal of inter-annual variability [44]. On regional scales, the uncertainties are much larger and more complex. MODIS Terra and Aqua show opposite trends (Terra: −0.009 yr−1; Aqua: +0.0012 yr−1) in China in 2001–2011, and both are statistically significant at 95% confidence level [45]. Lastly, studies showed that weaker PM-AOD relationship deteriorate PM2.5 retrieval. The authors in [12] showed that adjusted R2 of PM2.5 retrieval decreased from 0.87 in 2013 to 0.69 in 2017 owing to the weakening of the PM-AOD relationship. With the strong reduction of surface PM2.5 in recent years and in the future, the PM2.5–AOD relationship becomes weaker and the retrieval of PM2.5 becomes worse [12]. The predictability of surface PM2.5 using space-borne AOD needs further validation.

5. Conclusions

We studied the PM2.5–AOD relationship in NCP, YRD and PRD in China using a nested 3D chemical transport model—GEOS-Chem. We separated the contributions from anthropogenic emission control and meteorology changes by fixing meteorology at the 2009 level and fixing anthropogenic emissions at the 2006 level, respectively. We found that η was decreasing in 2006–2017, but rPM-AOD showed no statistically significant trends. The decrease of η was determined to be caused by anthropogenic emission changes. The vertical distribution of reduction rates varies with seasons and PM2.5 components. In summer, all components reduce slower with increasing height, while in winter the reduction rate of SNA increases first and then decreases. The overall effect of the different trends of different components is that PM2.5 concentration decreases slower at higher altitude than at the surface. The inter-annual variations of rPM-AOD were mainly determined by meteorology changes. We found that major meteorological elements that have strong correlation with rPM-AOD vary with regions and seasons. T was positively related to rPM-AOD in the three regions and was particularly important in spring and fall. Horizontal wind speed and vertical air movement show a strong correlation with rPM-AOD. PS is mostly negatively related to rPM-AOD, while atmospheric instability is positively related to rPM-AOD. RH is negatively related to rPM-AOD in NCP and YRD in fall and winter, but is positively related to rPM-AOD in PRD in spring and summer. PBLH is positively related to NCP in fall and negatively related to YRD in winter and PRD in spring. This study suggests using other meteorological elements mentioned above when analyzing the PM2.5–AOD relationship or retrieving surface PM2.5 using satellite AOD. In addition, as the PM2.5–AOD relationship weakens with decreasing anthropogenic emissions, validity of remote-sensing surface PM2.5 retrieval should be regularly evaluated.

Author Contributions

Conceptualization, L.Q. and S.W.; methodology, L.Q. and D.D.; software, L.Q.; formal analysis, L.Q.; data curation, H.Z. and D.D.; writing—original draft preparation, L.Q.; writing—review and editing, L.Q. and S.W.; funding acquisition, L.Q. and S.W.; supervision, S.W. All authors have read and agreed to the published version of the manuscript.

Funding

This work was funded by the National Natural Science Foundation of China (No. 21806088), Beijing Natural Science Foundation (No. 8222066) and Fundamental Research Funds for the Central Universities (No. FRF-TP-20-056A1).

Data Availability Statement

Data is contained within the article.

Acknowledgments

We thank the support of Samsung Advanced Institute of Technology and National Environmental and Energy Science and Technology International Cooperation Base. S.W. acknowledges the support from the Tencent Foundation through the XPLORER PRIZE. The simulations were completed on the “Explorer 100” cluster system of Tsinghua National Laboratory for Information Science and Technology.

Conflicts of Interest

The authors declare no conflict of interest.

References

  1. Liu, J.; Yin, H.; Tang, X.; Zhu, T.; Zhang, Q.; Liu, Z.; Tang, X.; Yi, H. Transition in air pollution, disease burden and health cost in China: A comparative study of long-term and short-term exposure. Environ. Pollut. 2021, 277, 116770. [Google Scholar] [CrossRef] [PubMed]
  2. Burnett, R.; Chen, H.; Szyszkowicz, M.; Fann, N.; Hubbell, B.; Pope, C.A., 3rd; Apte, J.S.; Brauer, M.; Cohen, A.; Weichenthal, S.; et al. Global estimates of mortality associated with long-term exposure to outdoor fine particulate matter. Proc. Natl. Acad. Sci. USA 2018, 115, 9592–9597. [Google Scholar] [CrossRef] [PubMed]
  3. Xue, T.; Zheng, Y.; Tong, D.; Zheng, B.; Li, X.; Zhu, T.; Zhang, Q. Spatiotemporal continuous estimates of PM2.5 concentrations in China, 2000–2016: A machine learning method with inputs from satellites, chemical transport model, and ground observations. Environ. Int. 2019, 123, 345–357. [Google Scholar] [CrossRef] [PubMed]
  4. Geng, G.; Zhang, Q.; Martin, R.V.; van Donkelaar, A.; Huo, H.; Che, H.; Lin, J.; He, K. Estimating long-term PM2.5 concentrations in China using satellite-based aerosol optical depth and a chemical transport model. Remote Sens. Environ. 2015, 166, 262–270. [Google Scholar] [CrossRef]
  5. Zheng, Y.; Zhang, Q.; Liu, Y.; Geng, G.; He, K. Estimating ground-level PM2.5 concentrations over three megalopolises in China using satellite-derived aerosol optical depth measurements. Atmos. Environ. 2016, 124, 232–242. [Google Scholar] [CrossRef]
  6. He, Q.; Gu, Y.; Zhang, M. Spatiotemporal trends of PM2.5 concentrations in central China from 2003 to 2018 based on MAIAC-derived high-resolution data. Environ. Int. 2020, 137, 105536. [Google Scholar] [CrossRef]
  7. Xin, J.; Gong, C.; Liu, Z.; Cong, Z.; Gao, W.; Song, T.; Pan, Y.; Sun, Y.; Ji, D.; Wang, L.; et al. The observation-based relationships between PM2.5and AOD over China. J. Geophys. Res. Atmos. 2016, 121, 10701–10716. [Google Scholar] [CrossRef]
  8. Wang, J. Intercomparison between satellite-derived aerosol optical thickness and PM2.5mass: Implications for air quality studies. Geophys. Res. Lett. 2003, 30, 2095. [Google Scholar] [CrossRef]
  9. Zheng, C.; Zhao, C.; Zhu, Y.; Wang, Y.; Shi, X.; Wu, X.; Chen, T.; Wu, F.; Qiu, Y. Analysis of influential factors for the relationship between PM2.5 and AOD in Beijing. Atmos. Chem. Phys. 2017, 17, 13473–13489. [Google Scholar] [CrossRef]
  10. Kong, L.; Xin, J.; Zhang, W.; Wang, Y. The empirical correlations between PM2.5, PM10 and AOD in the Beijing metropolitan region and the PM2.5, PM10 distributions retrieved by MODIS. Environ. Pollut. 2016, 216, 350–360. [Google Scholar] [CrossRef]
  11. Shao, P.; Xin, J.; An, J.; Kong, L.; Wang, B.; Wang, J.; Wang, Y.; Wu, D. The empirical relationship between PM2.5 and AOD in Nanjing of the Yangtze River Delta. Atmos. Pollut. Res. 2017, 8, 233–243. [Google Scholar] [CrossRef]
  12. Yang, Q.; Yuan, Q.; Yue, L.; Li, T.; Shen, H.; Zhang, L. The relationships between PM2.5 and aerosol optical depth (AOD) in mainland China: About and behind the spatio-temporal variations. Environ. Pollut. 2019, 248, 526–535. [Google Scholar] [CrossRef] [PubMed]
  13. Guo, J.; Xia, F.; Zhang, Y.; Liu, H.; Li, J.; Lou, M.; He, J.; Yan, Y.; Wang, F.; Min, M.; et al. Impact of diurnal variability and meteorological factors on the PM2.5—AOD relationship: Implications for PM2.5 remote sensing. Environ. Pollut. 2017, 221, 94–104. [Google Scholar] [CrossRef] [PubMed]
  14. Xu, Q.; Chen, X.; Yang, S.; Tang, L.; Dong, J. Spatiotemporal relationship between Himawari-8 hourly columnar aerosol optical depth (AOD) and ground-level PM2.5 mass concentration in mainland China. Sci. Total Environ. 2021, 765, 144241. [Google Scholar] [CrossRef]
  15. He, Q.; Wang, M.; Yim, S.H.L. The spatiotemporal relationship between PM2.5 and aerosol optical depth in China: Influencing factors and implications for satellite PM2.5 estimations using MAIAC aerosol optical depth. Atmos. Chem. Phys. 2021, 21, 18375–18391. [Google Scholar] [CrossRef]
  16. Wang, Z.; Chen, L.; Tao, J.; Liu, Y.; Hu, X.; Tao, M. An empirical method of RH correction for satellite estimation of ground-level PM concentrations. Atmos. Environ. 2014, 95, 71–81. [Google Scholar] [CrossRef]
  17. Gong, W.; Huang, Y.; Zhang, T.; Zhu, Z.; Ji, Y.; Xiang, H. Impact and Suggestion of Column-to-Surface Vertical Correction Scheme on the Relationship between Satellite AOD and Ground-Level PM2.5 in China. Remote Sens. 2017, 9, 1038. [Google Scholar] [CrossRef]
  18. Li, M.; Liu, H.; Geng, G.; Hong, C.; Liu, F.; Song, Y.; Tong, D.; Zheng, B.; Cui, H.; Man, H.; et al. Anthropogenic emission inventories in China: A review. Natl. Sci. Rev. 2017, 4, 834–866. [Google Scholar] [CrossRef]
  19. Yin, L.; Du, P.; Zhang, M.; Liu, M.; Xu, T.; Song, Y. Estimation of emissions from biomass burning in China (2003–2017) based on MODIS fire radiative energy data. Biogeosciences 2019, 16, 1629–1640. [Google Scholar] [CrossRef]
  20. Bilal, M.; Nazeer, M.; Nichol, J.; Qiu, Z.; Wang, L.; Bleiweiss, M.; Shen, X.; Campbell, J.; Lolli, S. Evaluation of Terra-MODIS C6 and C6.1 Aerosol Products against Beijing, XiangHe, and Xinglong AERONET Sites in China during 2004–2014. Remote Sens. 2019, 11, 486. [Google Scholar] [CrossRef] [Green Version]
  21. He, Q.; Li, C.; Tang, X.; Li, H.; Geng, F.; Wu, Y. Validation of MODIS derived aerosol optical depth over the Yangtze River Delta in China. Remote Sens. Environ. 2010, 114, 1649–1661. [Google Scholar] [CrossRef]
  22. Qi, L.; Zheng, H.; Ding, D.; Ye, D.; Wang, S. Effects of Meteorology Changes on Inter-Annual Variations of Aerosol Optical Depth and Surface PM2.5 in China—Implications for PM2.5 Remote Sensing. Remote Sens. 2022, 14, 2762. [Google Scholar] [CrossRef]
  23. Booker, D.H.R.M.J. UK Equivalence Programme for Monitoring of Particulate Matter; BV/AQ/AD202209/DH/2396; Bureau Veritas: Neuilly-sur-Seine, France, 2006. [Google Scholar]
  24. Song, S.; Gao, M.; Xu, W.; Shao, J.; Shi, G.; Wang, S.; Wang, Y.; Sun, Y.; McElroy, M.B. Fine-particle pH for Beijing winter haze as inferred from different thermodynamic equilibrium models. Atmos. Chem. Phys. 2018, 18, 7423–7438. [Google Scholar] [CrossRef]
  25. Park, R.J.; Jacob, D.J.; Field, B.D.; Yantosca, R.M.; Chin, M. Natural and transboundary pollution influences on sulfate-nitrate-ammonium aerosols in the United States: Implications for policy. J. Geophys. Res. Atmos. 2004, 109, D15204. [Google Scholar] [CrossRef]
  26. Alexander, B.; Park, R.J.; Jacob, D.J.; Gong, S. Transition metal-catalyzed oxidation of atmospheric sulfur: Global implications for the sulfur budget. J. Geophys. Res. 2009, 114, D02309. [Google Scholar] [CrossRef]
  27. Pye, H.O.T.; Chan, A.W.H.; Barkley, M.P.; Seinfeld, J.H. Global modeling of organic aerosol: The importance of reactive nitrogen (NOx and NO3). Atmos. Chem. Phys. 2010, 10, 11261–11276. [Google Scholar] [CrossRef]
  28. Marais, E.A.; Jacob, D.J.; Jimenez, J.L.; Campuzano-Jost, P.; Day, D.A.; Hu, W.; Krechmer, J.; Zhu, L.; Kim, P.S.; Miller, C.C.; et al. Aqueous-phase mechanism for secondary organic aerosol formation from isoprene: Application to the Southeast United States and co-benefit of SO2 emission controls. Atmos. Chem. Phys. 2016, 16, 1603–1618. [Google Scholar] [CrossRef]
  29. Fairlie, T.D.; Jacob, D.J.; Dibb, J.E.; Alexander, B.; Avery, M.A.; van Donkelaar, A.; Zhang, L. Impact of mineral dust on nitrate, sulfate, and ozone in transpacific Asian pollution plumes. Atmos. Chem. Phys. 2010, 10, 3999–4012. [Google Scholar] [CrossRef]
  30. Zheng, H.; Zhao, B.; Wang, S.; Wang, T.; Ding, D.; Chang, X.; Liu, K.; Xing, J.; Dong, Z.; Aunan, K.; et al. Transition in source contributions of PM2.5 exposure and associated premature mortality in China during 2005–2015. Environ. Int. 2019, 132, 105111. [Google Scholar] [CrossRef]
  31. Randerson, J.T.; Van Der Werf, G.R.; Giglio, L.; Collatz, G.J.; Kasibhatla, P.S. Global Fire Emissions Database, Version 4.1 (GFEDv4); ORNL DAAC: Oak Ridge, TN, USA, 2018. [Google Scholar] [CrossRef]
  32. Zhang, L.; Gong, S.; Padro, J.; Barrie, L. A size-segregated particle dry deposition scheme for an atmospheric aerosol module. Atmos. Environ. 2001, 35, 549–560. [Google Scholar] [CrossRef]
  33. Wang, Q.; Jacob, D.J.; Spackman, J.R.; Perring, A.E.; Schwarz, J.P.; Moteki, N.; Marais, E.A.; Ge, C.; Wang, J.; Barrett, S.R.H. Global budget and radiative forcing of black carbon aerosol: Constraints from pole-to-pole (HIPPO) observations across the Pacific. J. Geophys. Res.-Atmos. 2014, 119, 195–206. [Google Scholar] [CrossRef]
  34. Miao, R.; Chen, Q.; Zheng, Y.; Cheng, X.; Sun, Y.; Palmer, P.I.; Shrivastava, M.; Guo, J.; Zhang, Q.; Liu, Y.; et al. Model bias in simulating major chemical components of PM2.5 in China. Atmos. Chem. Phys. 2020, 20, 12265–12284. [Google Scholar] [CrossRef]
  35. Ma, Z.; Liu, R.; Liu, Y.; Bi, J. Effects of air pollution control policies on PM2.5 pollution improvement in China from 2005 to 2017: A satellite-based perspective. Atmos. Chem. Phys. 2019, 19, 6861–6877. [Google Scholar] [CrossRef]
  36. Xu, J.; Han, F.; Li, M.; Zhang, Z.; Xiaohui, D.; Wei, P. On the opposite seasonality of MODIS AOD and surface PM2.5 over the Northern China plain. Atmos. Environ. 2019, 215, 116909. [Google Scholar] [CrossRef]
  37. Van Donkelaar, A.; Martin, R.V.; Brauer, M.; Kahn, R.; Levy, R.; Verduzco, C.; Villeneuve, P.J. Global estimates of ambient fine particulate matter concentrations from satellite-based aerosol optical depth: Development and application. Environ. Health Perspect. 2010, 118, 847–855. [Google Scholar] [CrossRef]
  38. Zhang, Q.; Zheng, Y.; Tong, D.; Shao, M.; Wang, S.; Zhang, Y.; Xu, X.; Wang, J.; He, H.; Liu, W.; et al. Drivers of improved PM2.5 air quality in China from 2013 to 2017. Proc. Natl. Acad. Sci. USA 2019, 116, 24463–24469. [Google Scholar] [CrossRef]
  39. Ma, Q.; Zhang, Q.; Wang, Q.; Yuan, X.; Yuan, R.; Luo, C. A comparative study of EOF and NMF analysis on downward trend of AOD over China from 2011 to 2019. Environ. Pollut. 2021, 288, 117713. [Google Scholar] [CrossRef]
  40. Leung, D.M.; Shi, H.; Zhao, B.; Wang, J.; Ding, E.M.; Gu, Y.; Zheng, H.; Chen, G.; Liou, K.N.; Wang, S. Wintertime particulate matter decrease buffered by unfavorable chemical processes despite emissions reductions in China. Geophys. Res. Lett. 2020, 47, e2020GL087721. [Google Scholar] [CrossRef]
  41. Shah, V.; Jaeglé, L.; Thornton, J.A.; Lopez-Hilfiker, F.D.; Lee, B.H.; Schroder, J.C.; Campuzano-Jost, P.; Jimenez, J.L.; Guo, H.; Sullivan, A.P.; et al. Chemical feedbacks weaken the wintertime response of particulate sulfate and nitrate to emissions reductions over the eastern United States. Proc. Natl. Acad. Sci. USA 2018, 115, 8110–8115. [Google Scholar] [CrossRef] [Green Version]
  42. Zhang, K.; Zhou, L.; Fu, Q.; Yan, L.; Morawska, L.; Jayaratne, R.; Xiu, G. Sources and vertical distribution of PM2. 5 over Shanghai during the winter of 2017. Sci. Total Environ. 2020, 706, 135683. [Google Scholar] [CrossRef]
  43. Su, T.; Li, Z.; Kahn, R. Relationships between the planetary boundary layer height and surface pollutants derived from lidar observations over China: Regional pattern and influencing factors. Atmos. Chem. Phys. 2018, 18, 15921–15935. [Google Scholar] [CrossRef]
  44. Li, Z.; Zhao, X.; Kahn, R.; Mishchenko, M.; Remer, L.; Lee, K.; Wang, M.; Laszlo, I.; Nakajima, T.; Maring, H. Uncertainties in satellite remote sensing of aerosols and impact on monitoring its long-term trend: A review and perspective. Ann. Geophys. 2009, 27, 2755–2770. [Google Scholar] [CrossRef]
  45. Cheng, T.; Chen, H.; Gu, X.; Yu, T.; Guo, J.; Guo, H. The inter-comparison of MODIS, MISR and GOCART aerosol products against AERONET data over China. J. Quant. Spectrosc. Radiat. Transf. 2012, 113, 2135–2145. [Google Scholar] [CrossRef]
Figure 1. In situ surface PM2.5 measurement sites in 2013 (yellow circles), 2014 (red circles) and 2015–2017 (black circles) used in this study.
Remotesensing 14 04683 g001
Figure 2. Observed (red lines) and GEOS-Chem simulated (black lines) ratio of PM2.5/AOD (η) in NCP, YRD and PRD in 2013–2017. The bars are standard deviations.
Remotesensing 14 04683 g002
Figure 3. PM2.5/AOD ratios (η) relative to their values in 2006 in GEOS-Chem simulations in 2006–2017. Three experiments are shown: varying meteorology and varying emissions (BASE, black lines), varying anthropogenic emissions with meteorological fields fixed at the 2009 level (FIXMET, purple lines), varying meteorological fields with fixed anthropogenic emissions at the 2006 level (FIXEMISS, blue lines).
Remotesensing 14 04683 g003
Figure 4. Observed (red lines) and GEOS-Chem simulated (black lines) annual and seasonal mean correlation coefficients of daily PM2.5 and daily AOD (rPM-AOD) in NCP, YRD and PRD in 2013–2017. The bars are standard deviations.
Remotesensing 14 04683 g004
Figure 5. Annual and seasonal mean correlation coefficient of daily PM2.5 and daily AOD (rPM-AOD) relative to their values in 2006 in GEOS-Chem simulations in 2006–2017. Three experiments are shown: varying meteorology and varying emissions (BASE, black lines), varying anthropogenic emissions with meteorological fields fixed at the 2009 level (FIXMET, purple lines), varying meteorological fields with fixed anthropogenic emissions at the 2006 level (FIXEMISS, blue lines).
Remotesensing 14 04683 g005
Figure 6. Reduction ratio of PM2.5 ((PM2.5_2017-PM2.5_2006)/PM2.5_2006, purple) and its components (BC: black lines; OC: brown lines; SNA: blue lines) relative to the surface in 2006–2017 for annual mean (ac) and for summer and winter (df) in NCP, YRD and PRD.
Remotesensing 14 04683 g006
Table 1. GEOS-Chem simulated trends of PM2.5/AOD ratios (η, μg m−3 year−1) in 2006–2017 in NCP, YRD and PRD.
SeasonExperimentsNCPYRDPRD
AnnualBASE−1.25 *−0.76 +−1.40 *
FIXEMISS0.040.41−0.03
FIXMET−1.39 *−1.25 *−1.16 *
SpringBASE−0.87 #−1.48 *−2.41 *
FIXEMISS0.75 #0.06−0.54
FIXMET−1.59 *−1.56 *−1.46 *
SummerBASE−1.42 *−0.38−2.22 *
FIXEMISS−0.70 #0.37−0.49
FIXMET−1.01 *−0.96 *−1.83 *
FallBASE−2.36 *−0.50−0.22
FIXEMISS−1.11 +0.410.18
FIXMET−1.48 *−1.49 *−0.64 *
WinterBASE0.390.23−0.17
FIXEMISS1.45 +0.990.37
FIXMET−1.06 *−0.68 *−0.43 *
# significant at 90% level (0.05 < p < 0.1); + significant at 95% level (0.01 < p < 0.05); * significant at 99% level (p < 0.01).
Table 2. Correlation coefficients of PM2.5/AOD (η) in the BASE experiment with those in FIXEMISS and FIXMET.
SeasonExperimentsNCPYRDPRD
AnnualFIXEMISS0.420.260.64
FIXMET0.870.700.77
SpringFIXEMISS0.300.570.81
FIXMET0.580.680.78
SummerFIXEMISS0.950.830.76
FIXMET0.760.350.79
FallFIXEMISS0.890.770.97
FIXMET0.850.500.28
WinterFIXEMISS0.830.940.92
FIXMET0.000.300.26
Table 3. Correlation coefficients of rPM-AOD in the BASE experiment with those in FIXEMISS and FIXMET.
SeasonExperimentsNCPYRDPRD
AnnualFIXEMISS0.730.950.96
FIXMET0.260.170.63
SpringFIXEMISS0.940.950.94
FIXMET−0.18−0.040.69
SummerFIXEMISS0.820.960.92
FIXMET0.140.060.53
FallFIXEMISS0.900.910.96
FIXMET0.150.210.28
WinterFIXEMISS0.990.950.96
FIXMET−0.180.260.36
Table 4. Meteorological elements that have the strongest correlation with rPM-AOD in NCP, YRD and PRD.
SeasonNCPYRDPRD
PositiveNegativePositiveNegativePositiveNegative
SpringT500hPa (0.88)TROPPT (−0.88)T500hPa (0.80)U500hPa (−0.65)T500hPa (0.80)U500hPa (−0.82)
Tsurface (0.84)PS (−0.77)Tsurface (0.74)PS (−0.62)dU850–500hPa (0.78)PS (−0.76)
T850hPa (0.82)SLP (−0.67)T850hPa (0.72)SLP (−0.61)RH500hPa (0.77)O500hPa (−0.46)
SummerdVsurface–850hPa (0.45)PS (−0.53)V500hPa (0.54) U500hPa (−0.38)RH850hPa (0.53)dT850–500hPa (−0.49)
U850hPa (0.43)SLP (−0.46)V850hPa (0.42)dVsurface–850hPa (−0.33)RH500hPa (0.42)O850hPa (−0.44)
dT850–500hPa (0.41)V500hPa (−0.38)TROPPT (0.38)PV850hPa (−0.31)PV850hPa (0.36)SLP (−0.41)
FalldVsurface–850hPa (0.44)PV850hPa (−0.41)Tsurface (0.46)Usurface (−0.40)Tsurface (0.39)U500hPa (−0.42)
dT850–500hPa (0.37)RH500hPa (−0.25)T850hPa (0.43)U500hPa (−0.38)dU850–500hPa (0.38)PS (−0.34)
PBLH (0.33)SLP (−0.24)T500hPa (0.39)TROPPT (−0.37)dTsurface–850hPa (0.38)SLP (−0.34)
WinterO850hPa (0.67)RH850hPa (−0.54)O850hPa (0.37)RH500hPa (−0.35)Tsurface (0.54)PV850hPa (−0.39)
Usurface (0.60)PREC (−0.51)O500hPa (0.25)PBLH (−0.33)dT850–500hPa (0.46)Osurface (−0.37)
dVsurface–850hPa (0.60)V850hPa (−0.51)PS (0.24)TROPPT (−0.30)T850hPa (0.45)U500hPa (−0.34)
Publisher’s Note: MDPI stays neutral with regard to jurisdictional claims in published maps and institutional affiliations.

