
Multiscale Ground Validation of Satellite and Reanalysis Precipitation Products over Diverse Climatic and Topographic Conditions
 , , , ,
Abstract
:
1. Introduction
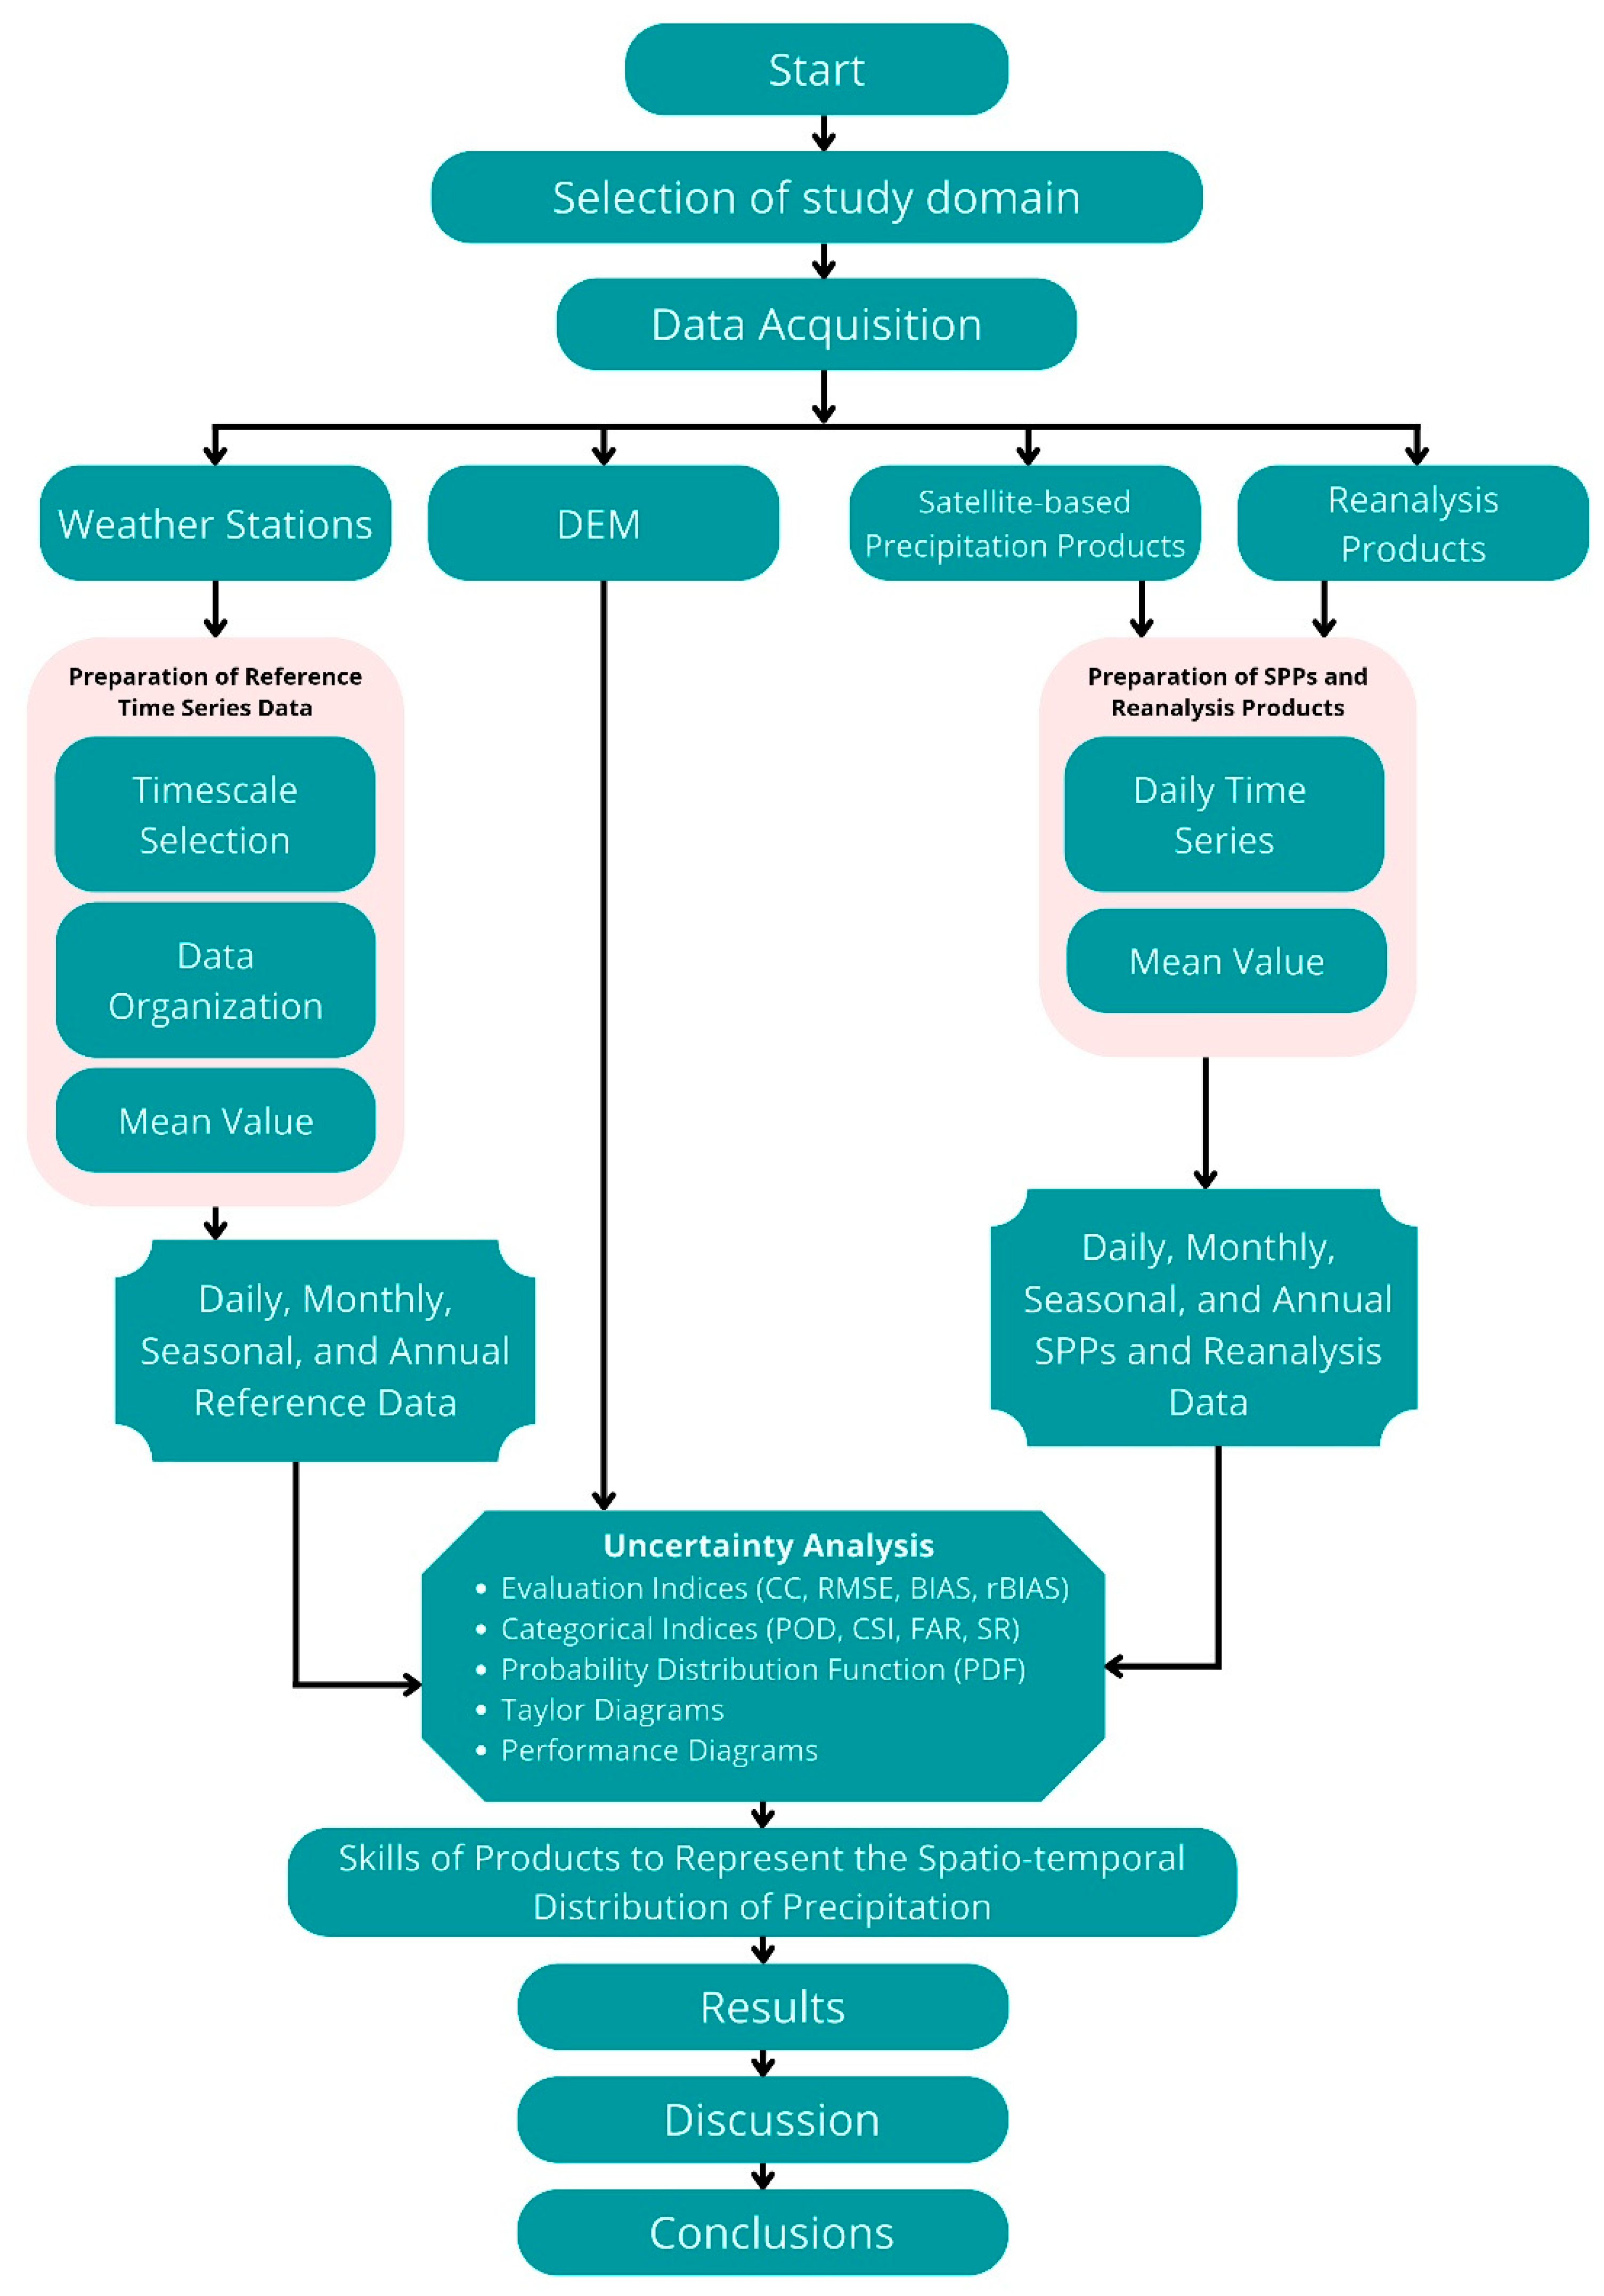
2. Materials and Methods
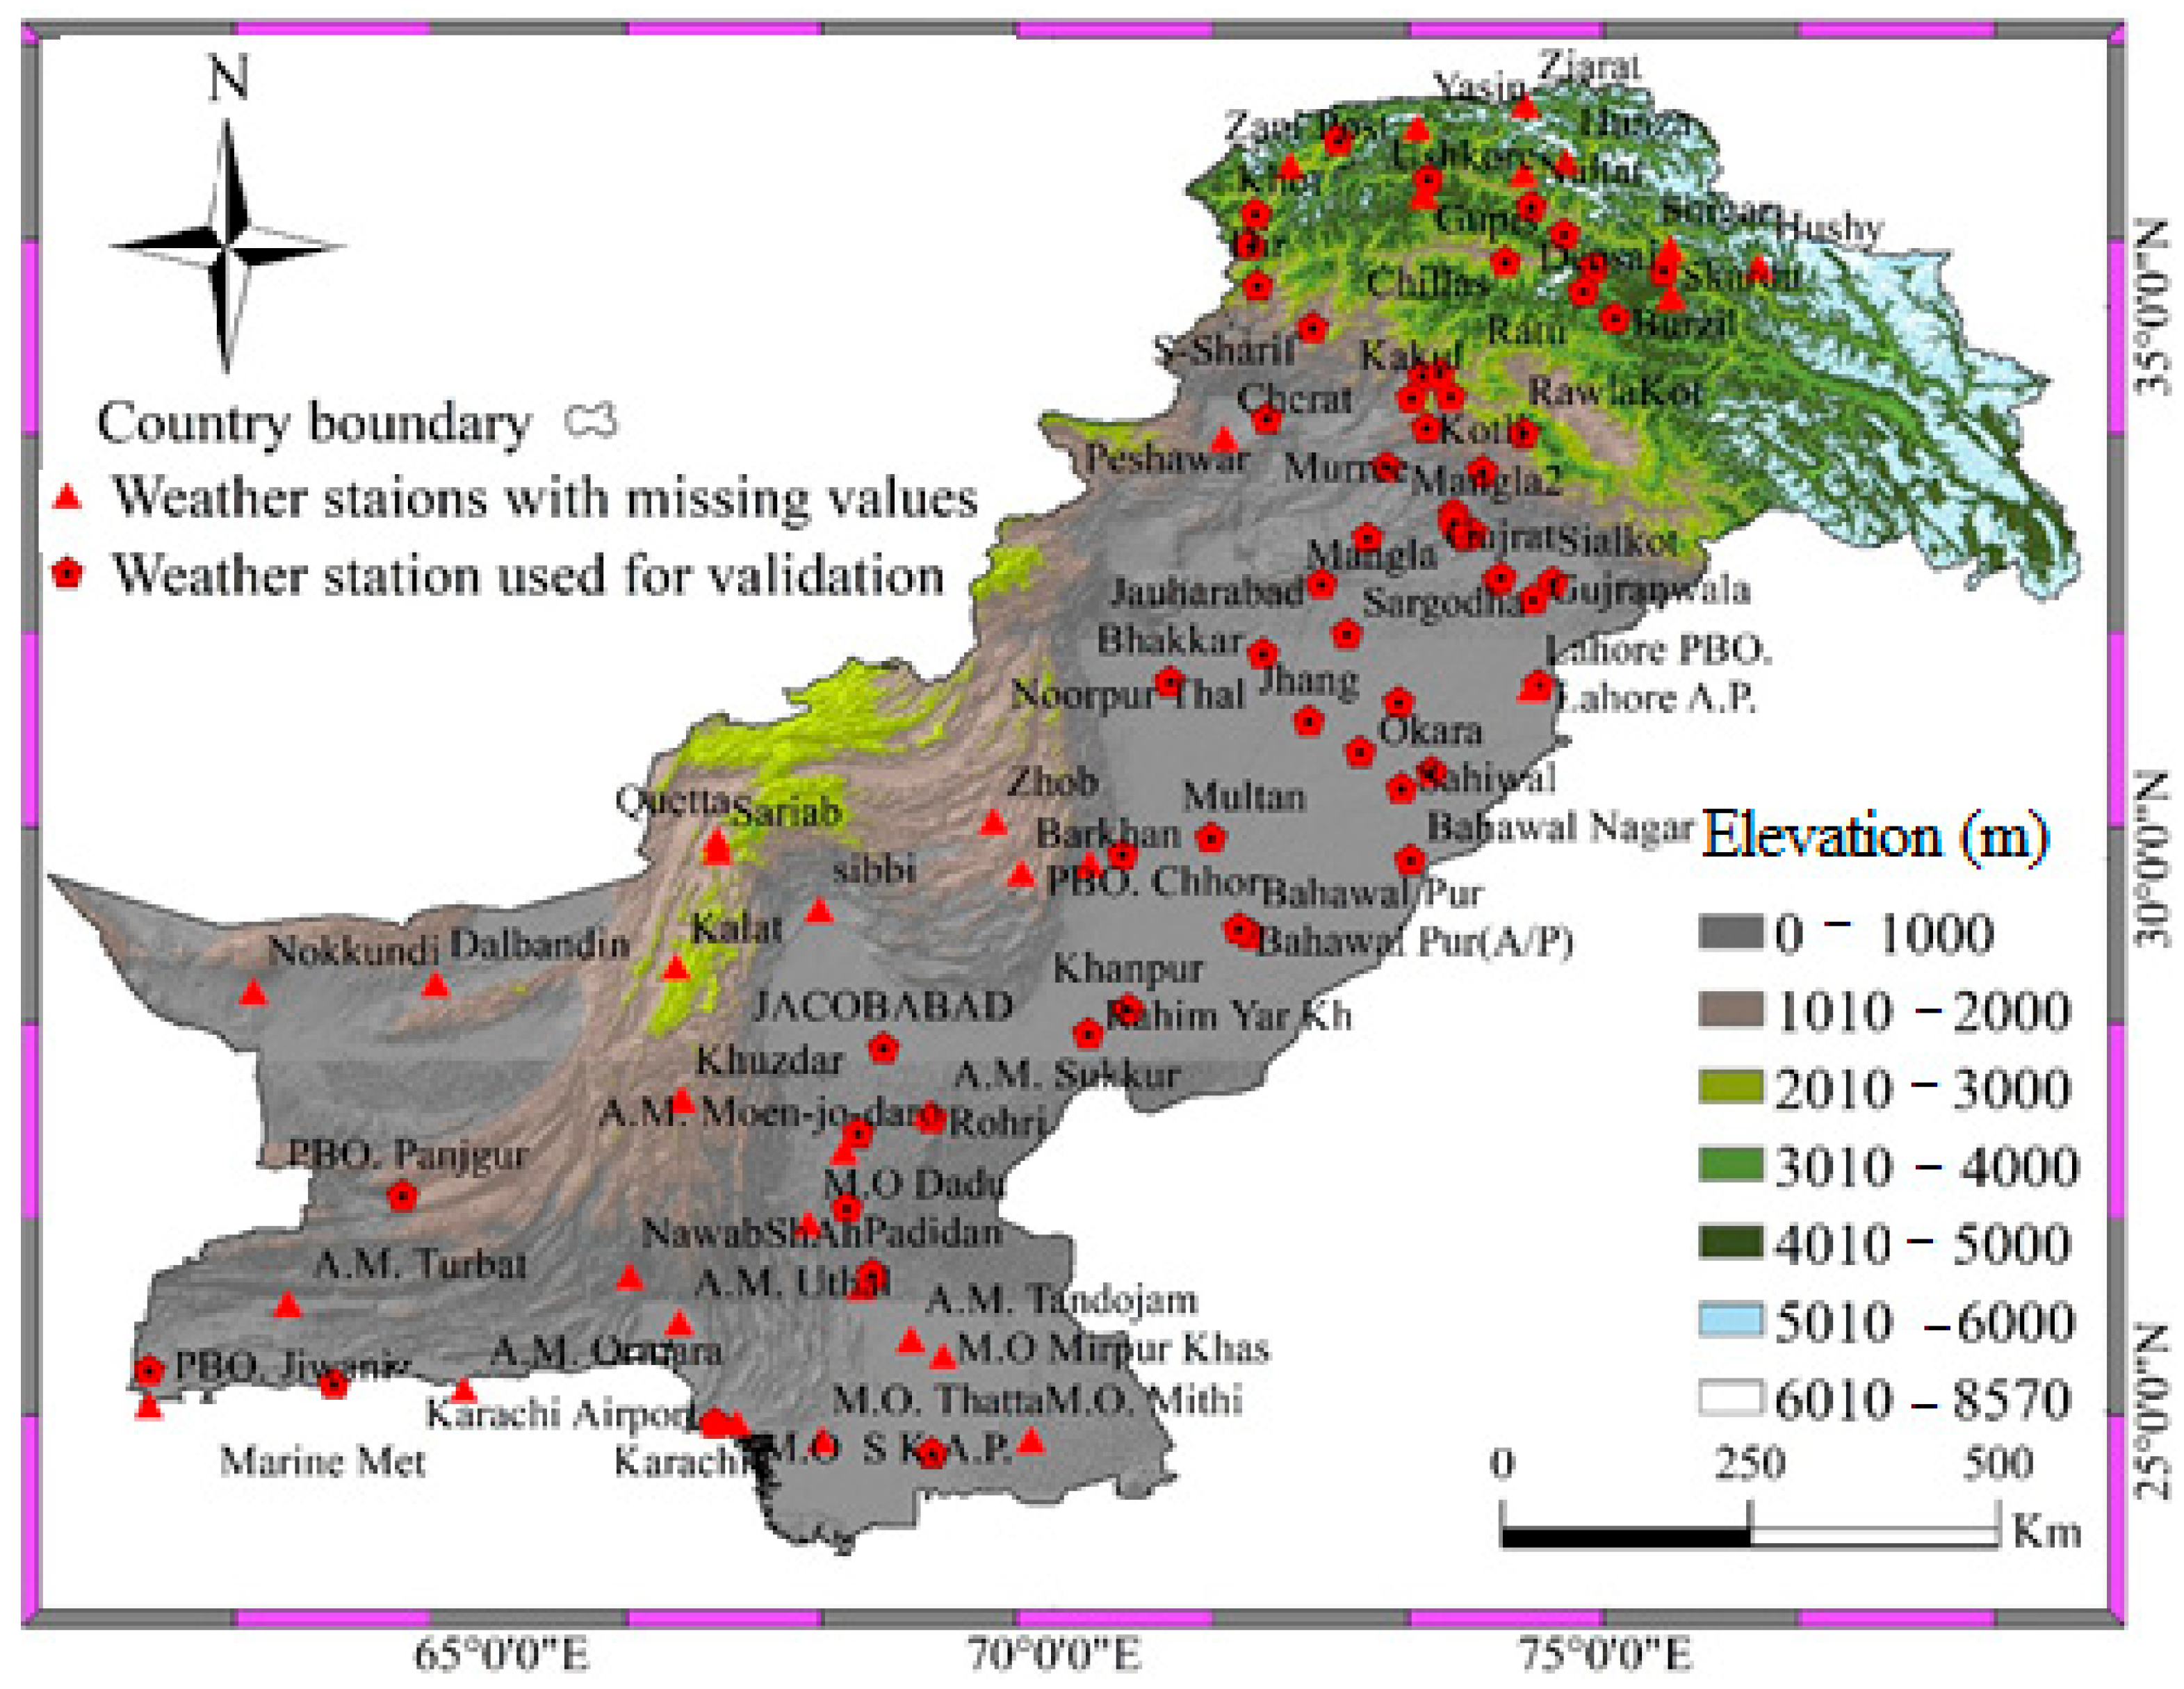
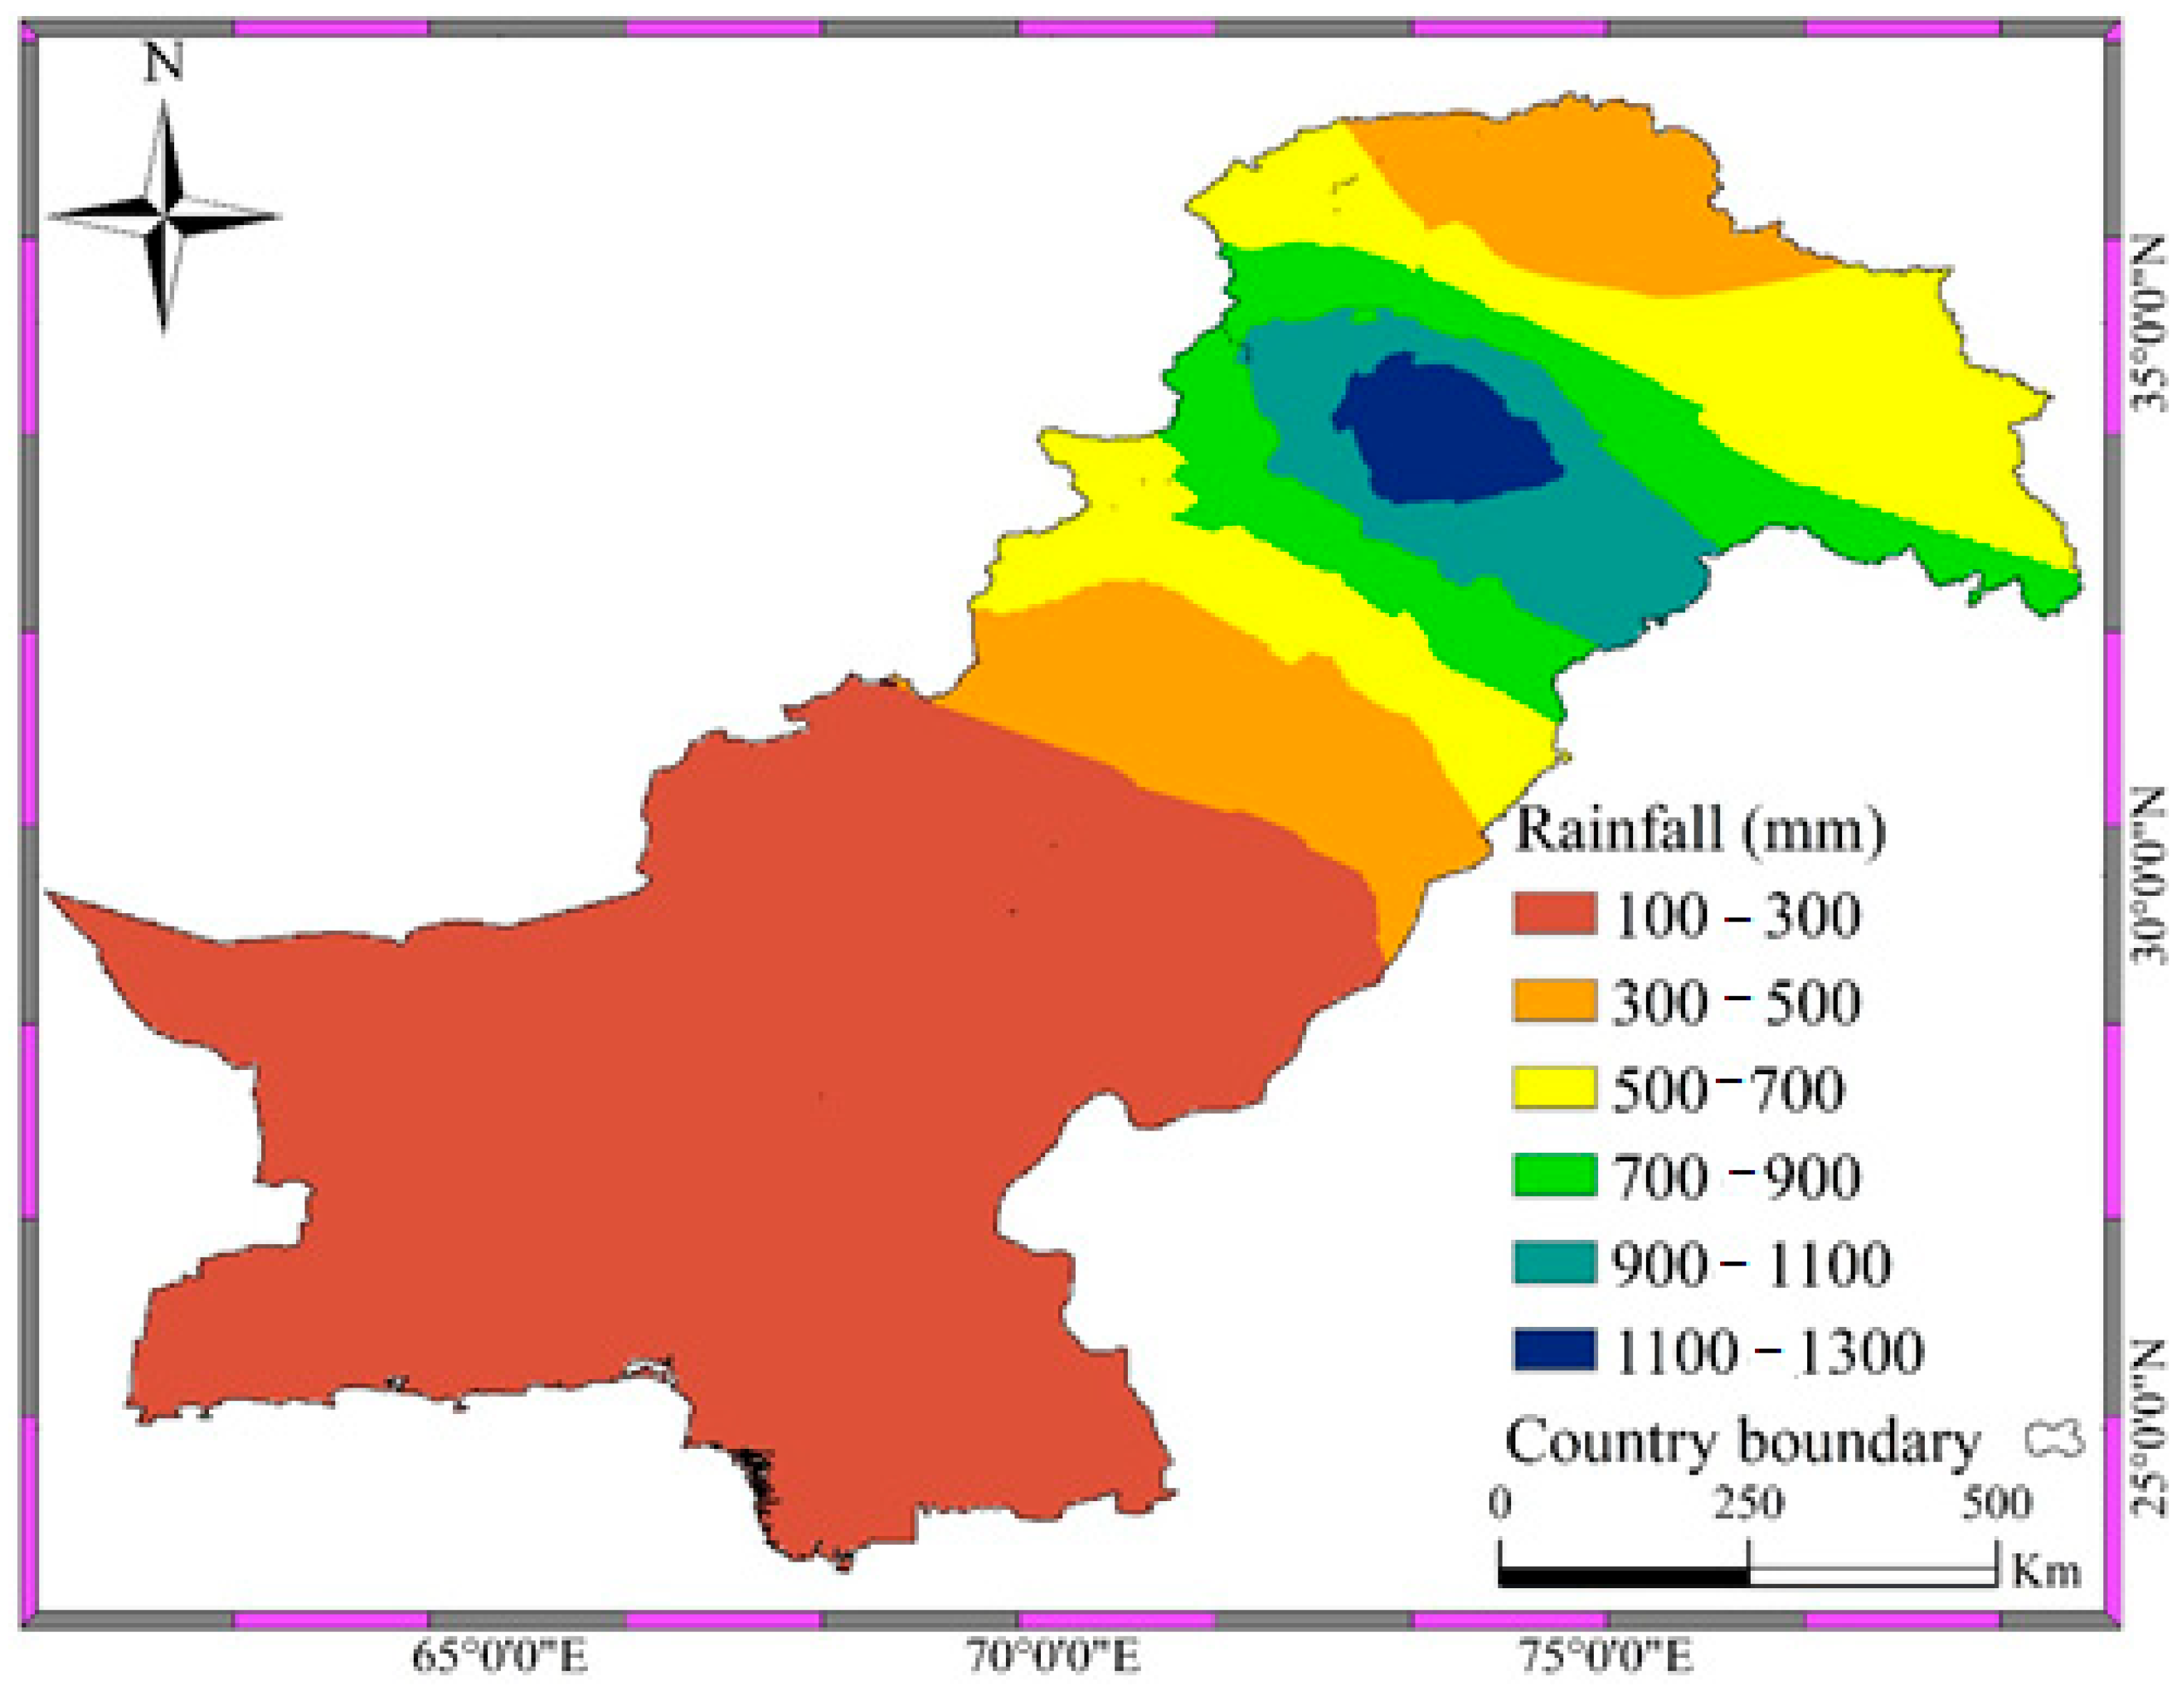
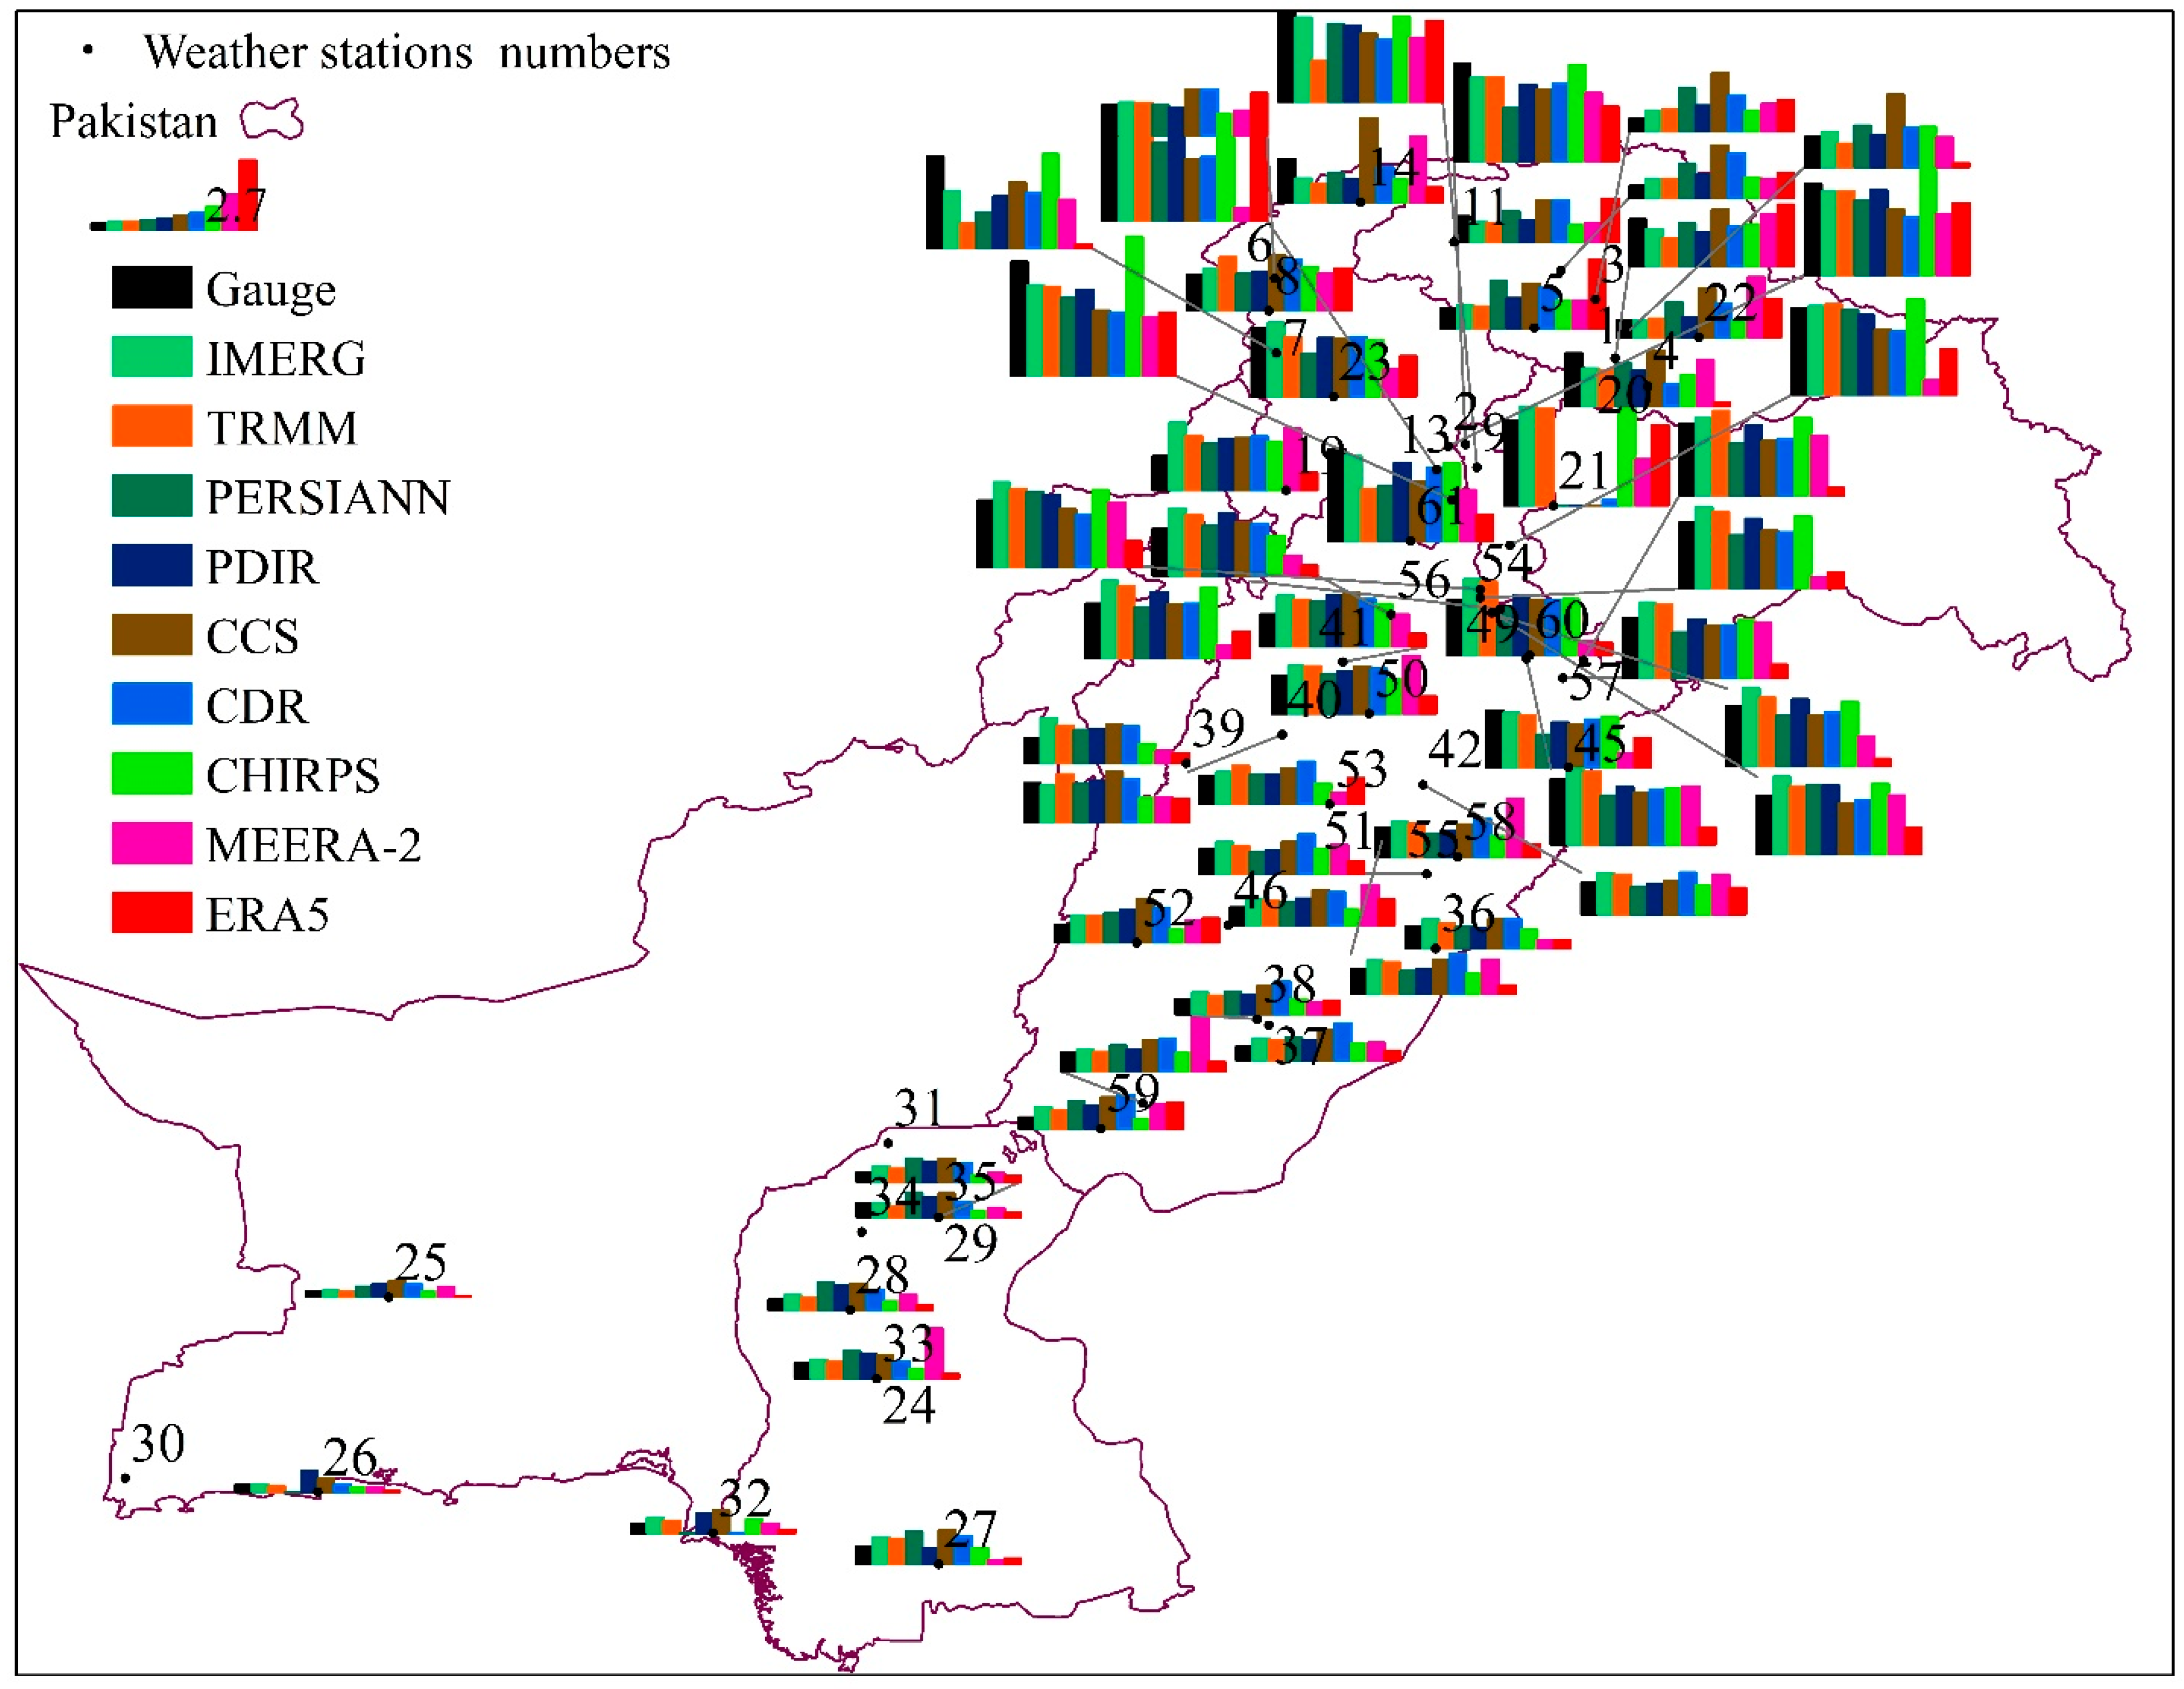
2.1. Study Region
2.2. Datasets
2.3. Methods
3. Results
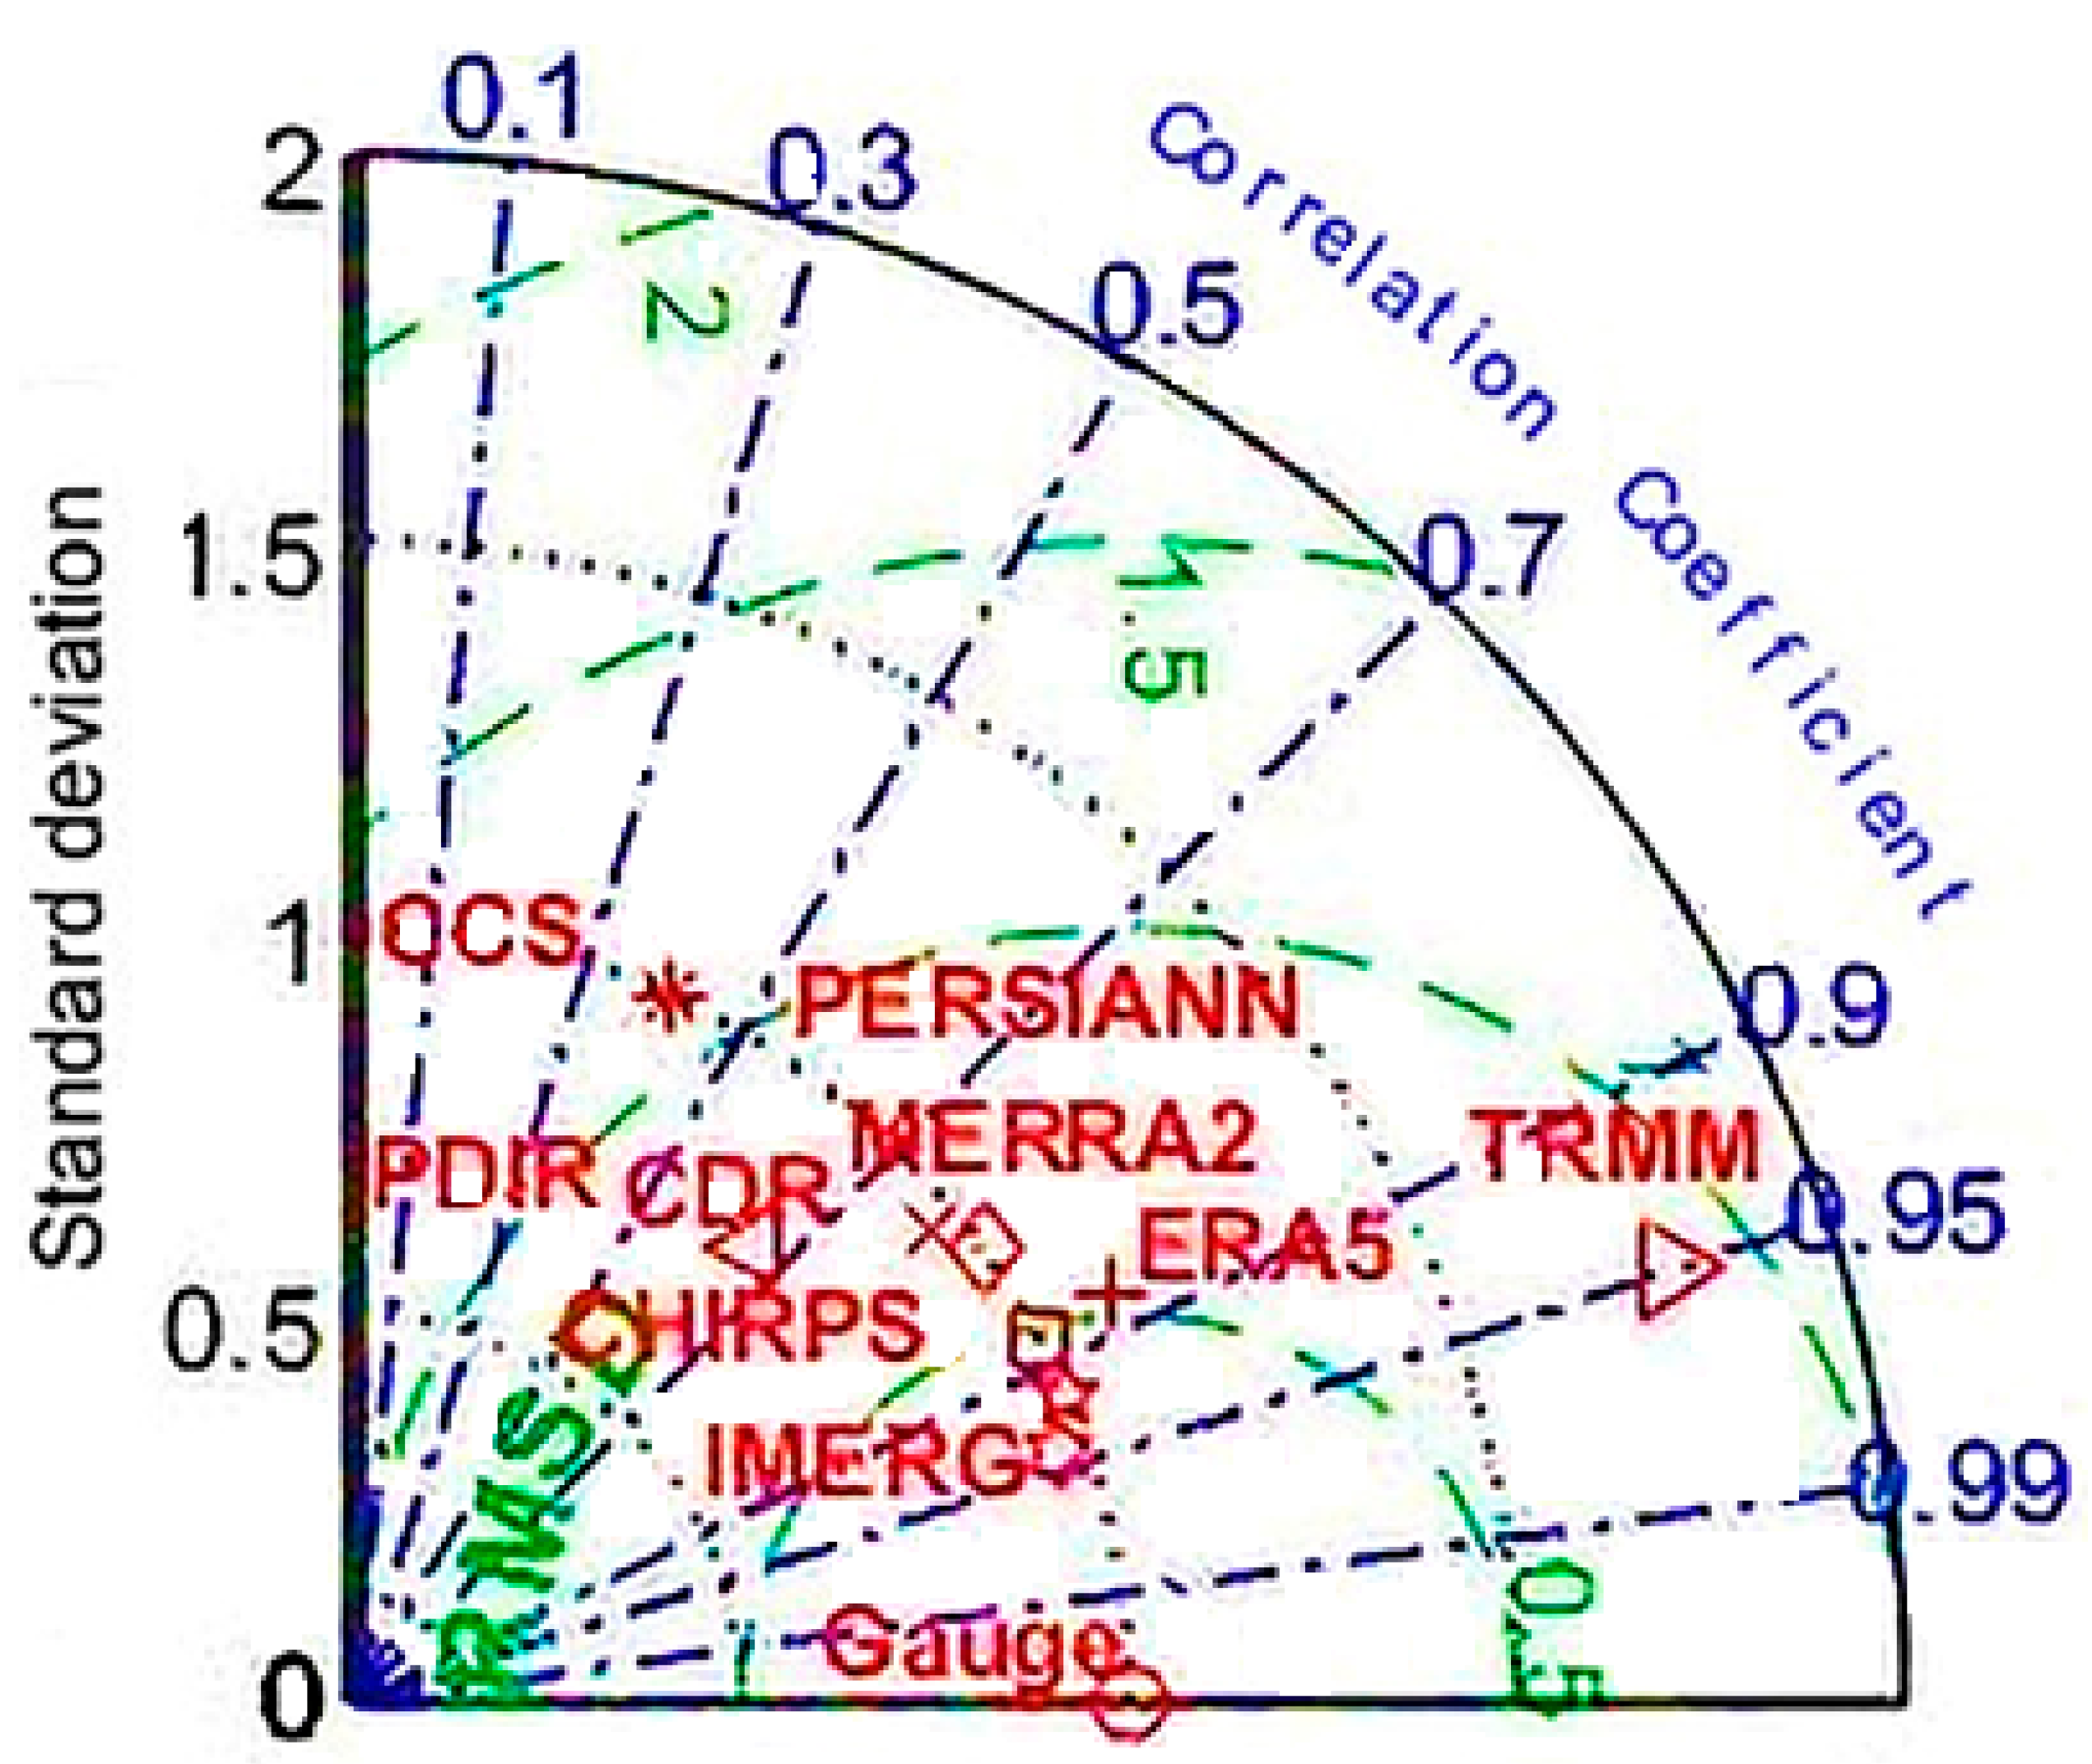
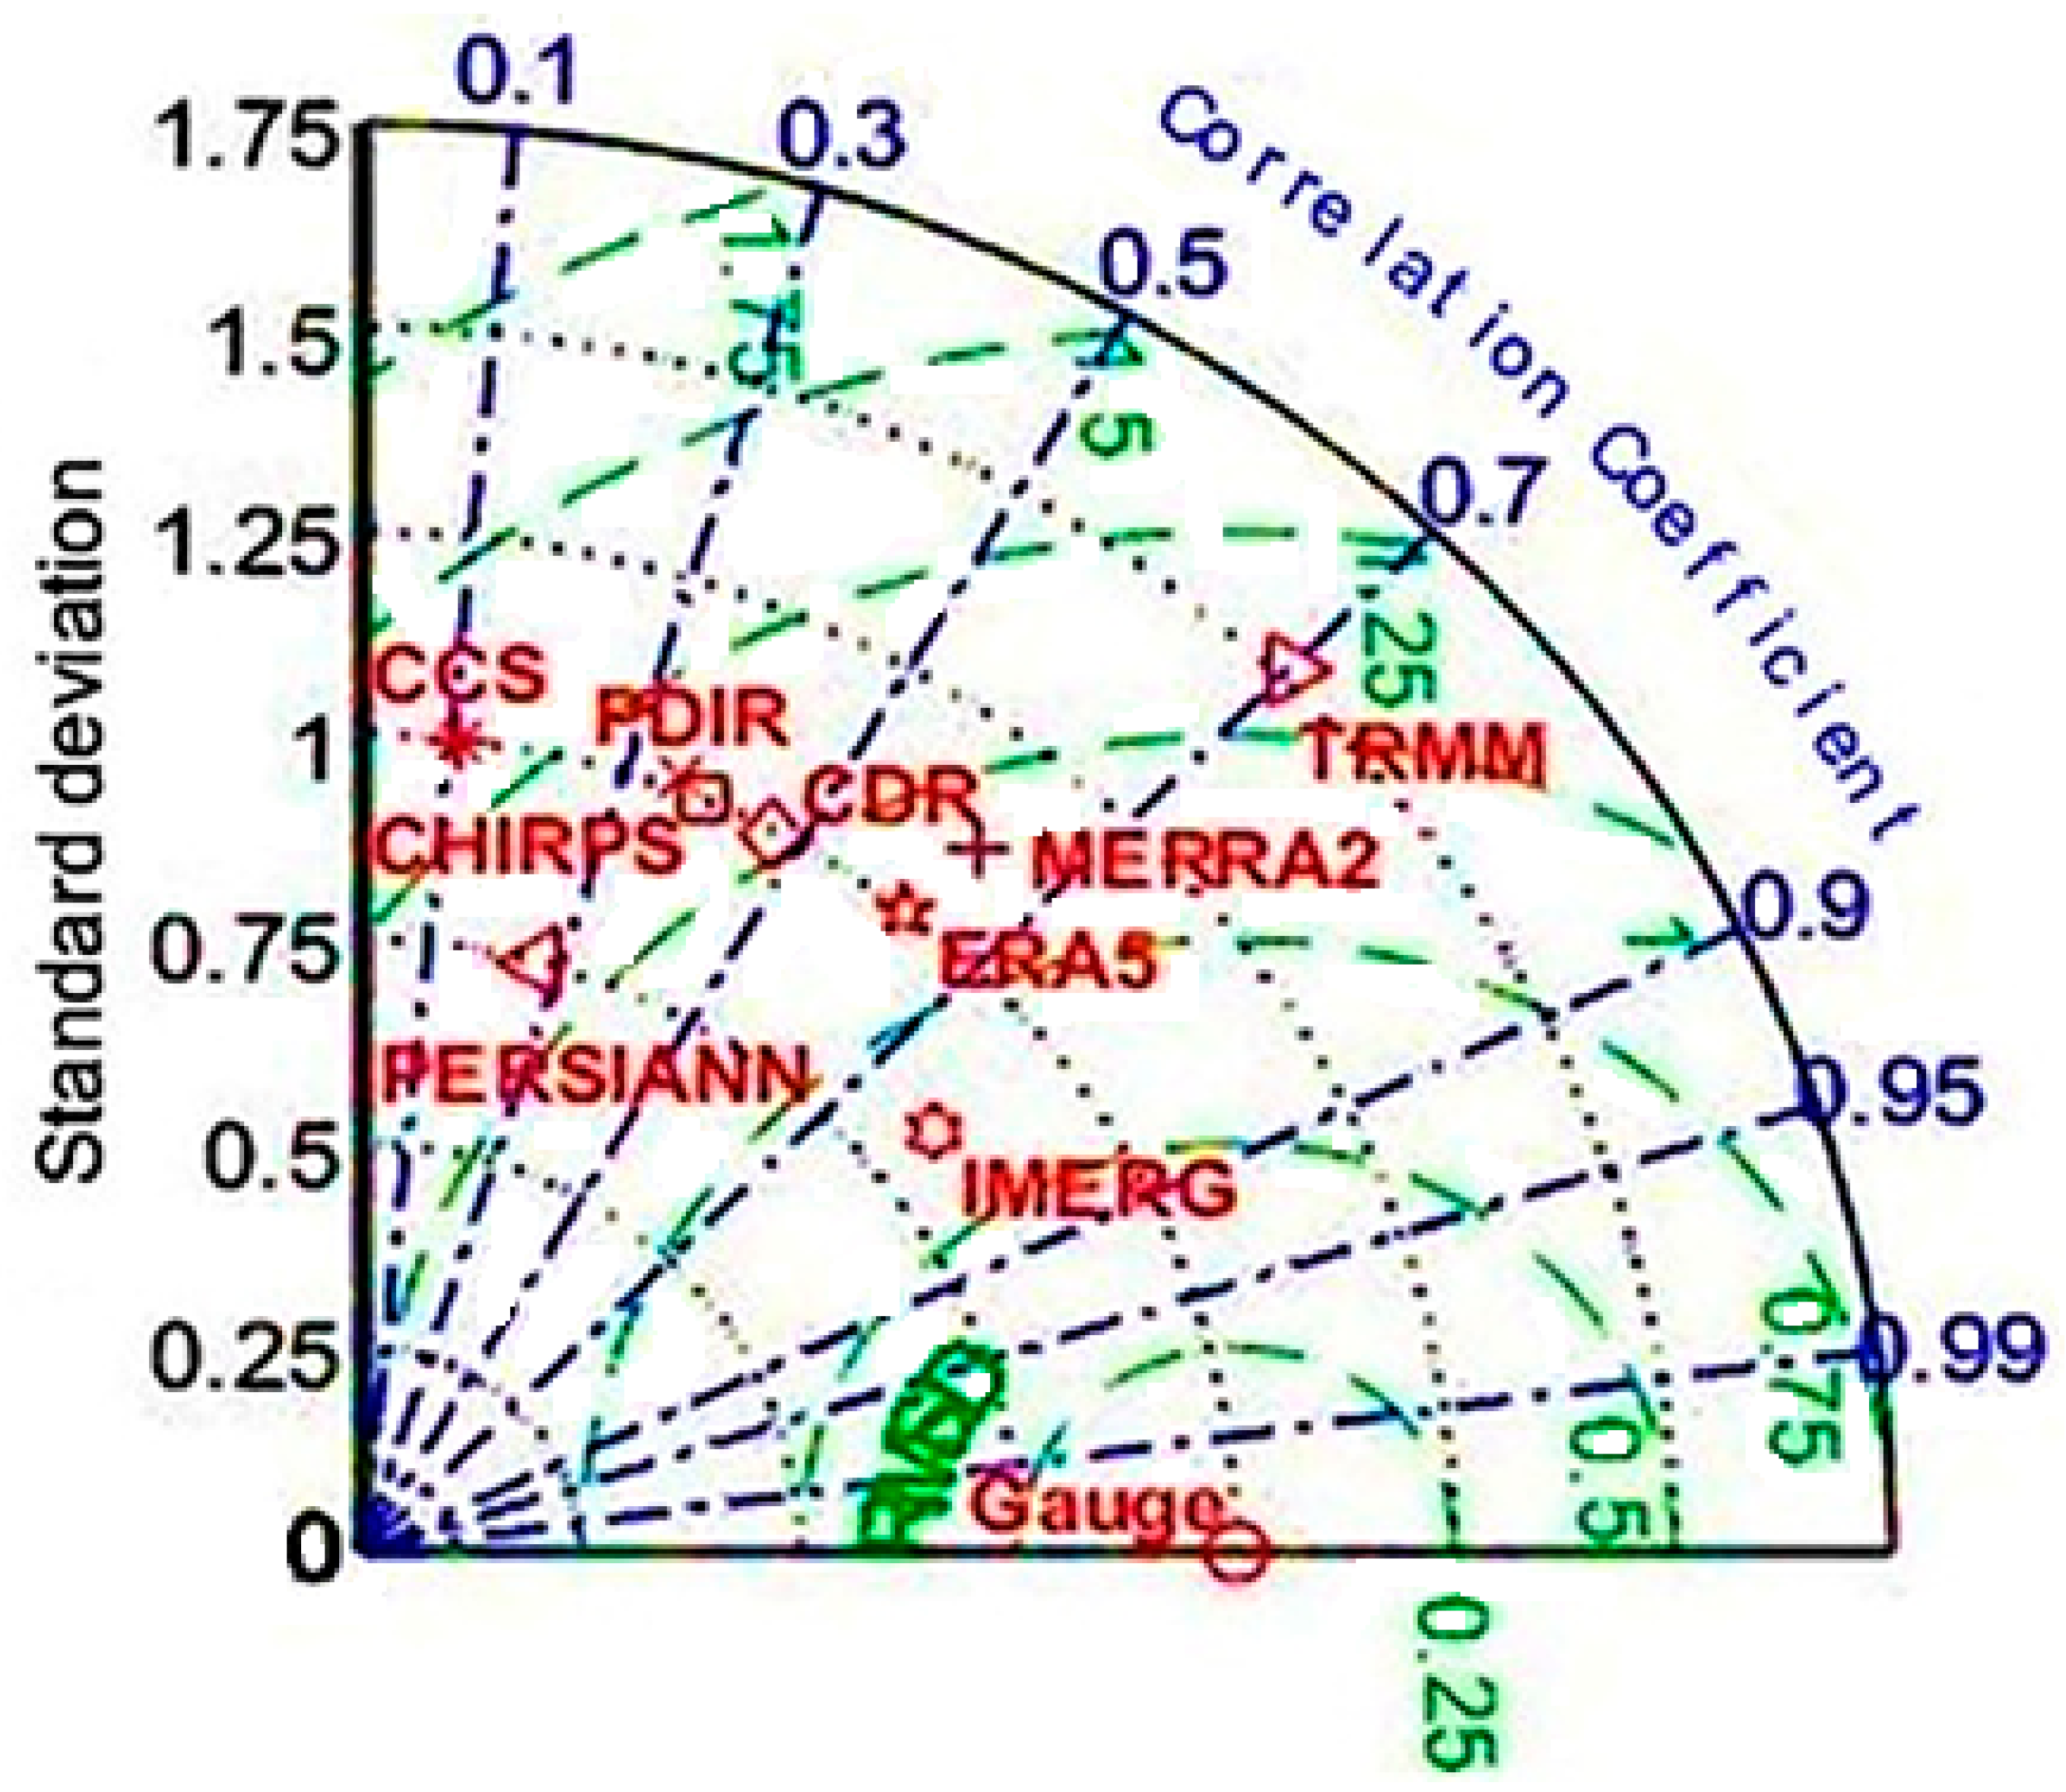
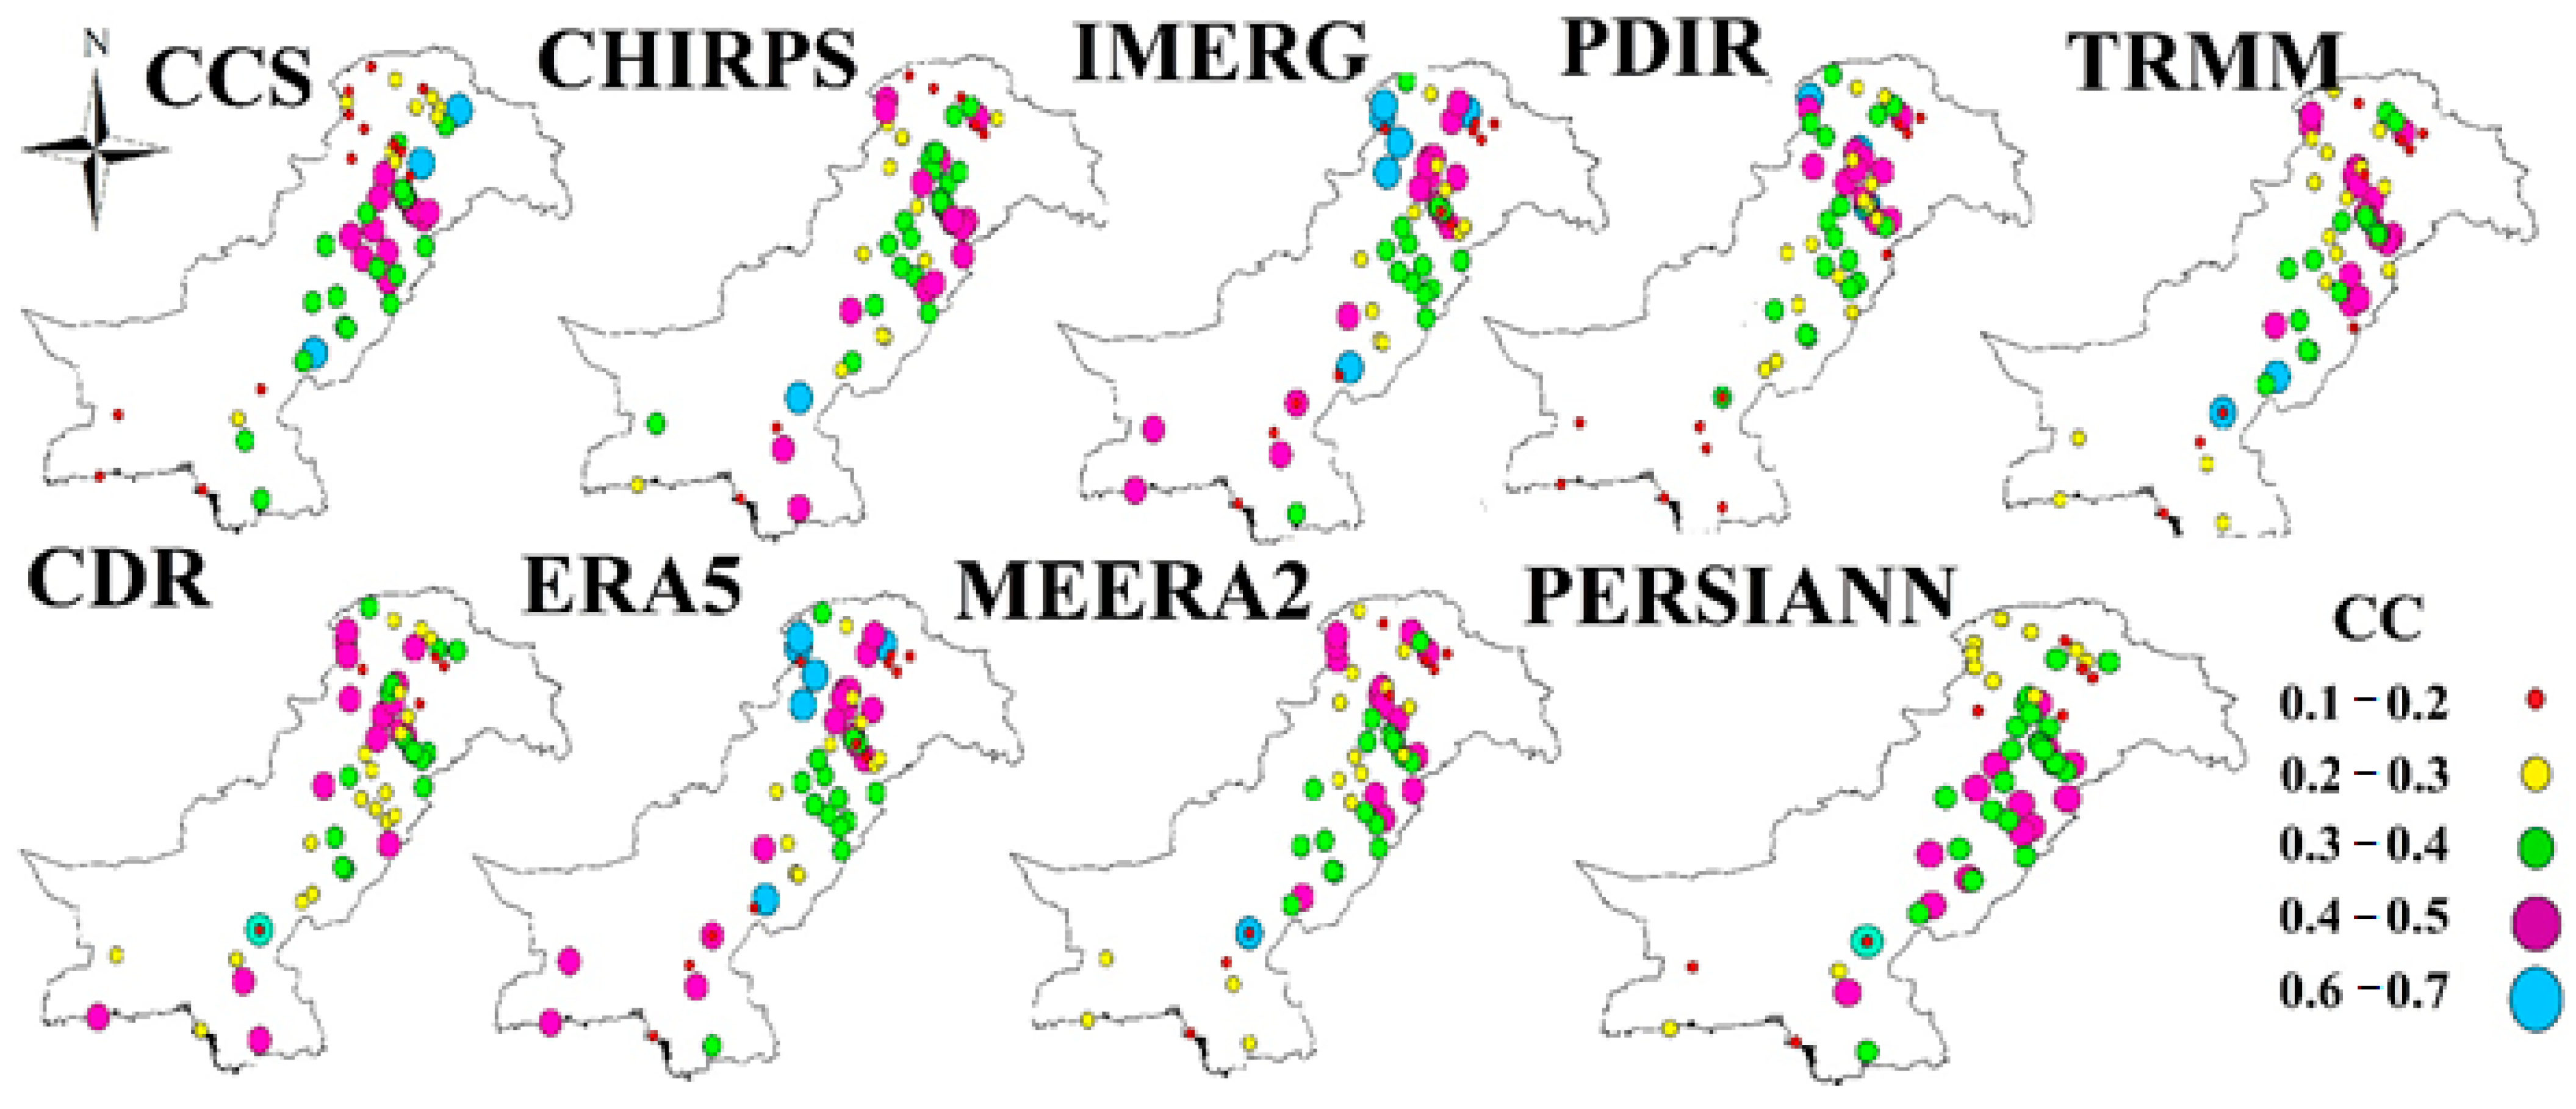
3.1. Potentials of Precipitation Products to Represent the Spatio-Temporal Distribution of Precipitation
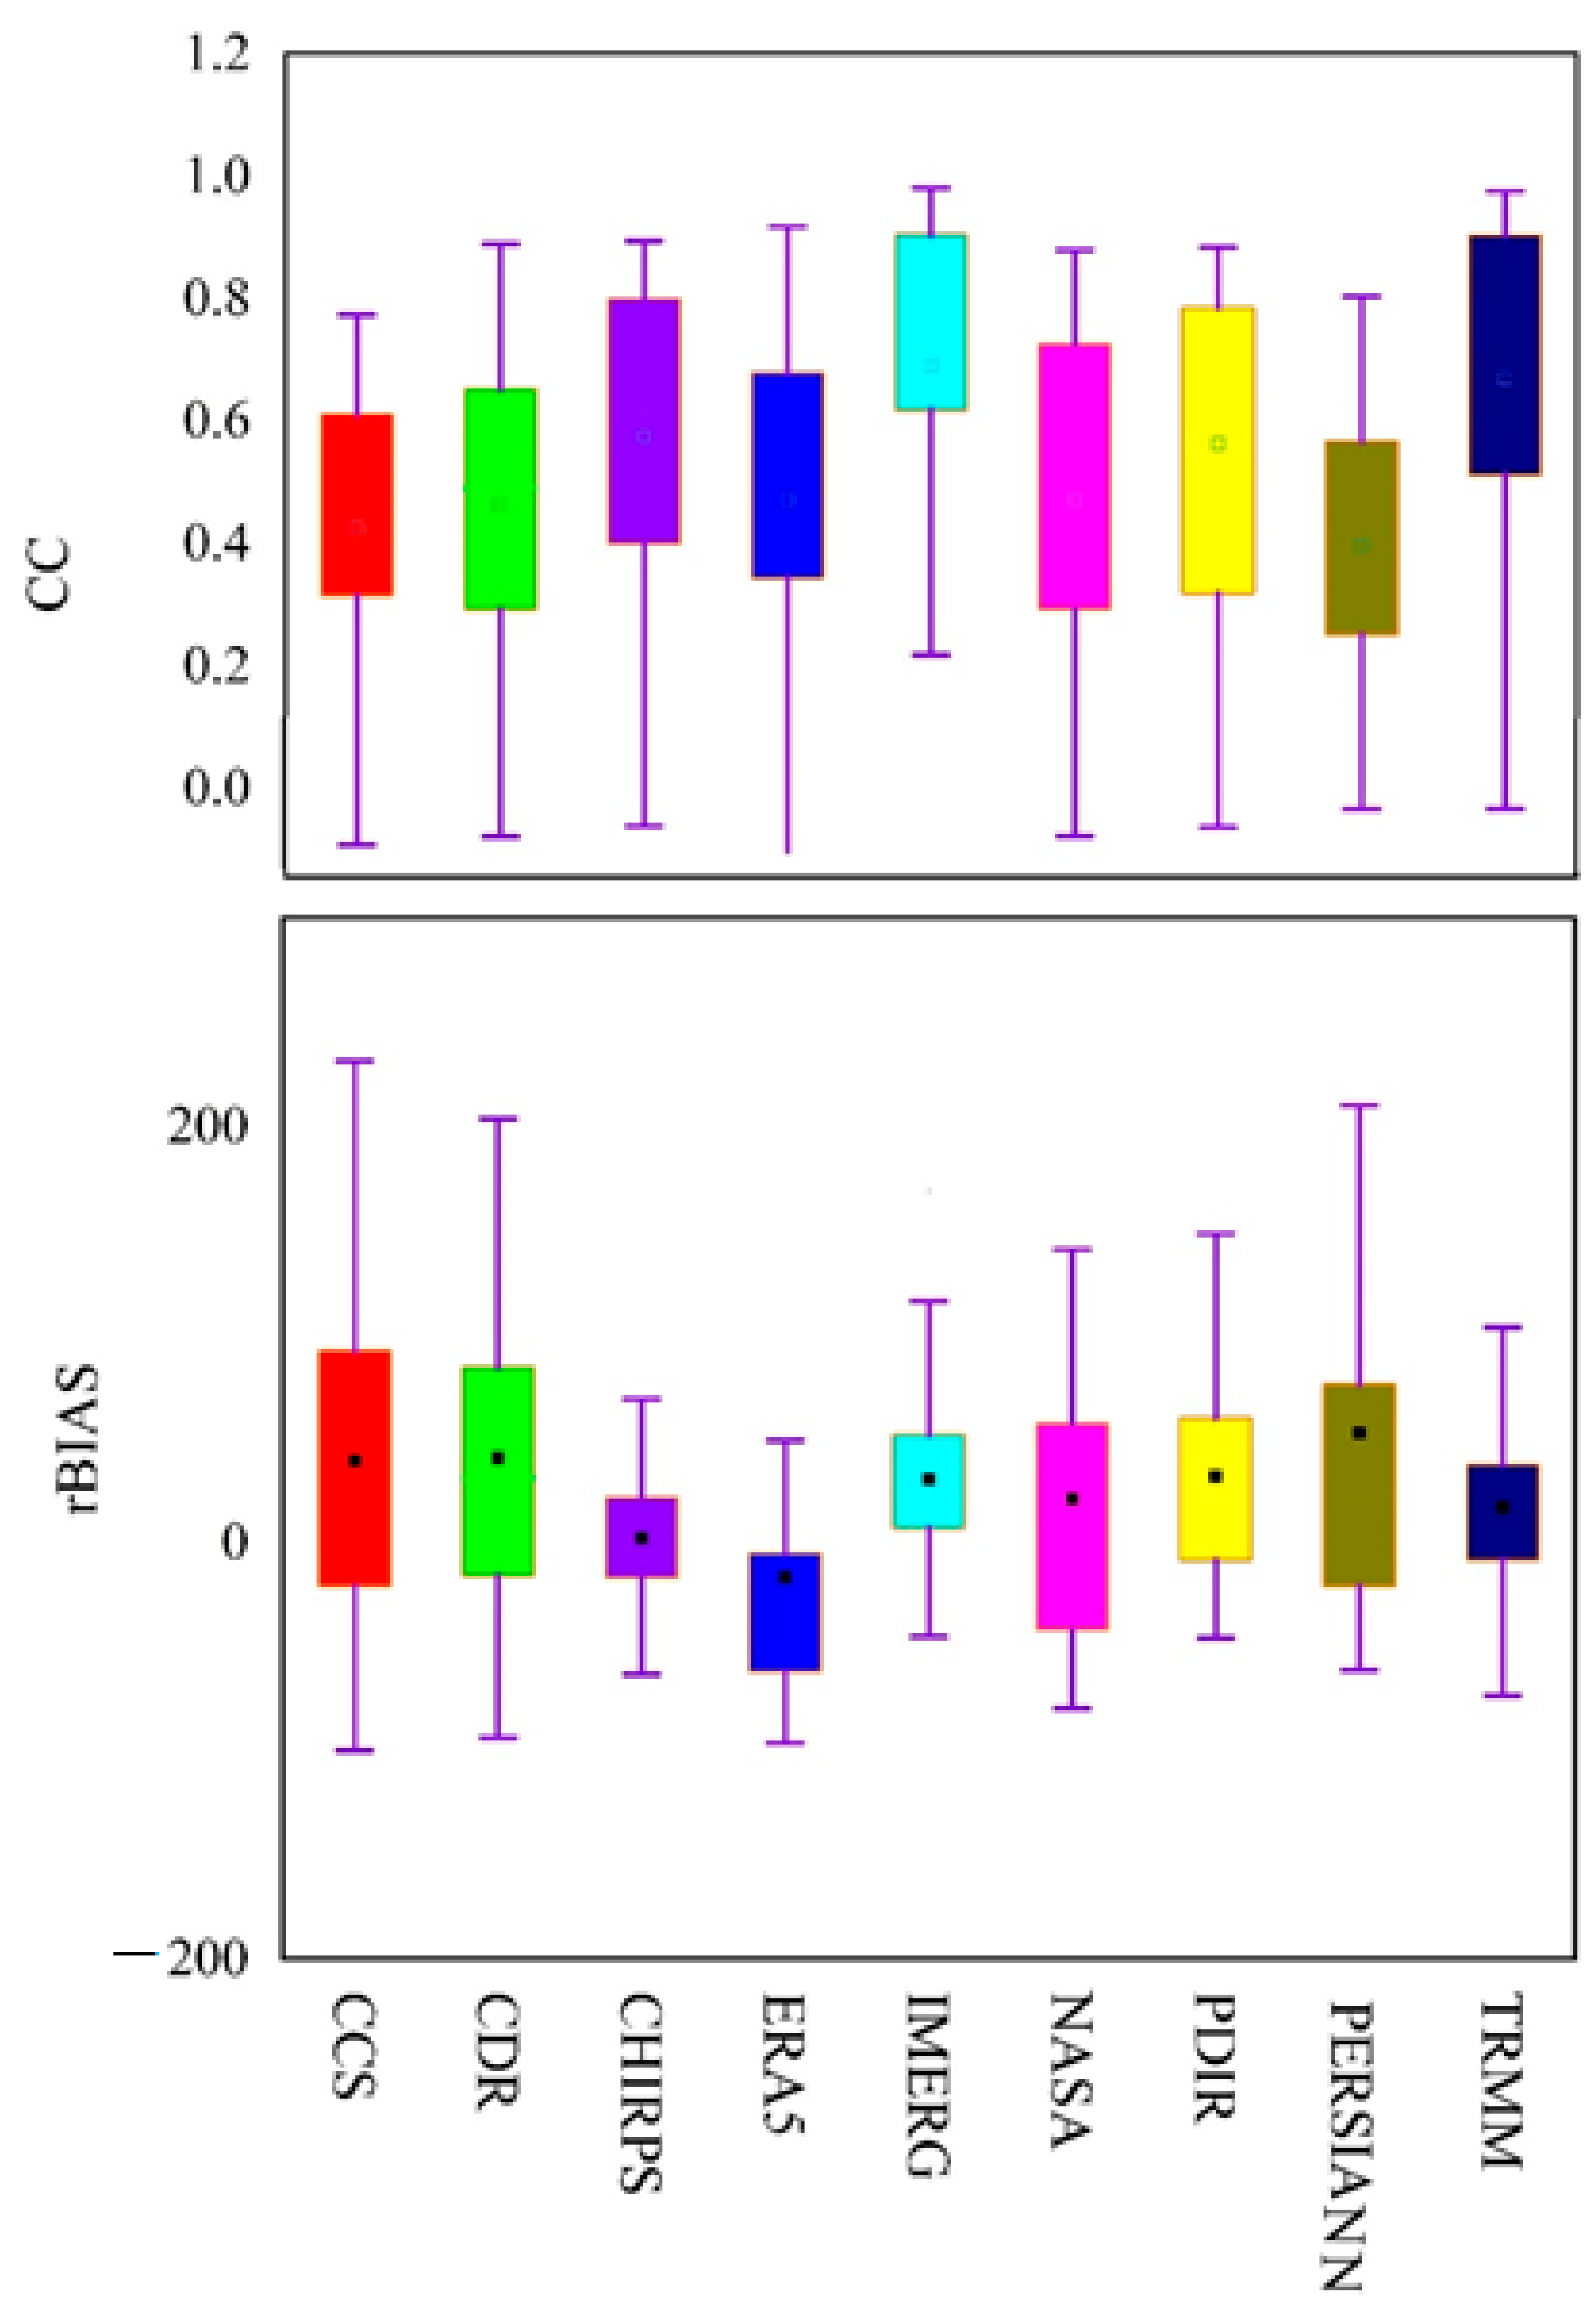
3.2. Performances of SPPs and Reanalysis Products on Monthly Scale
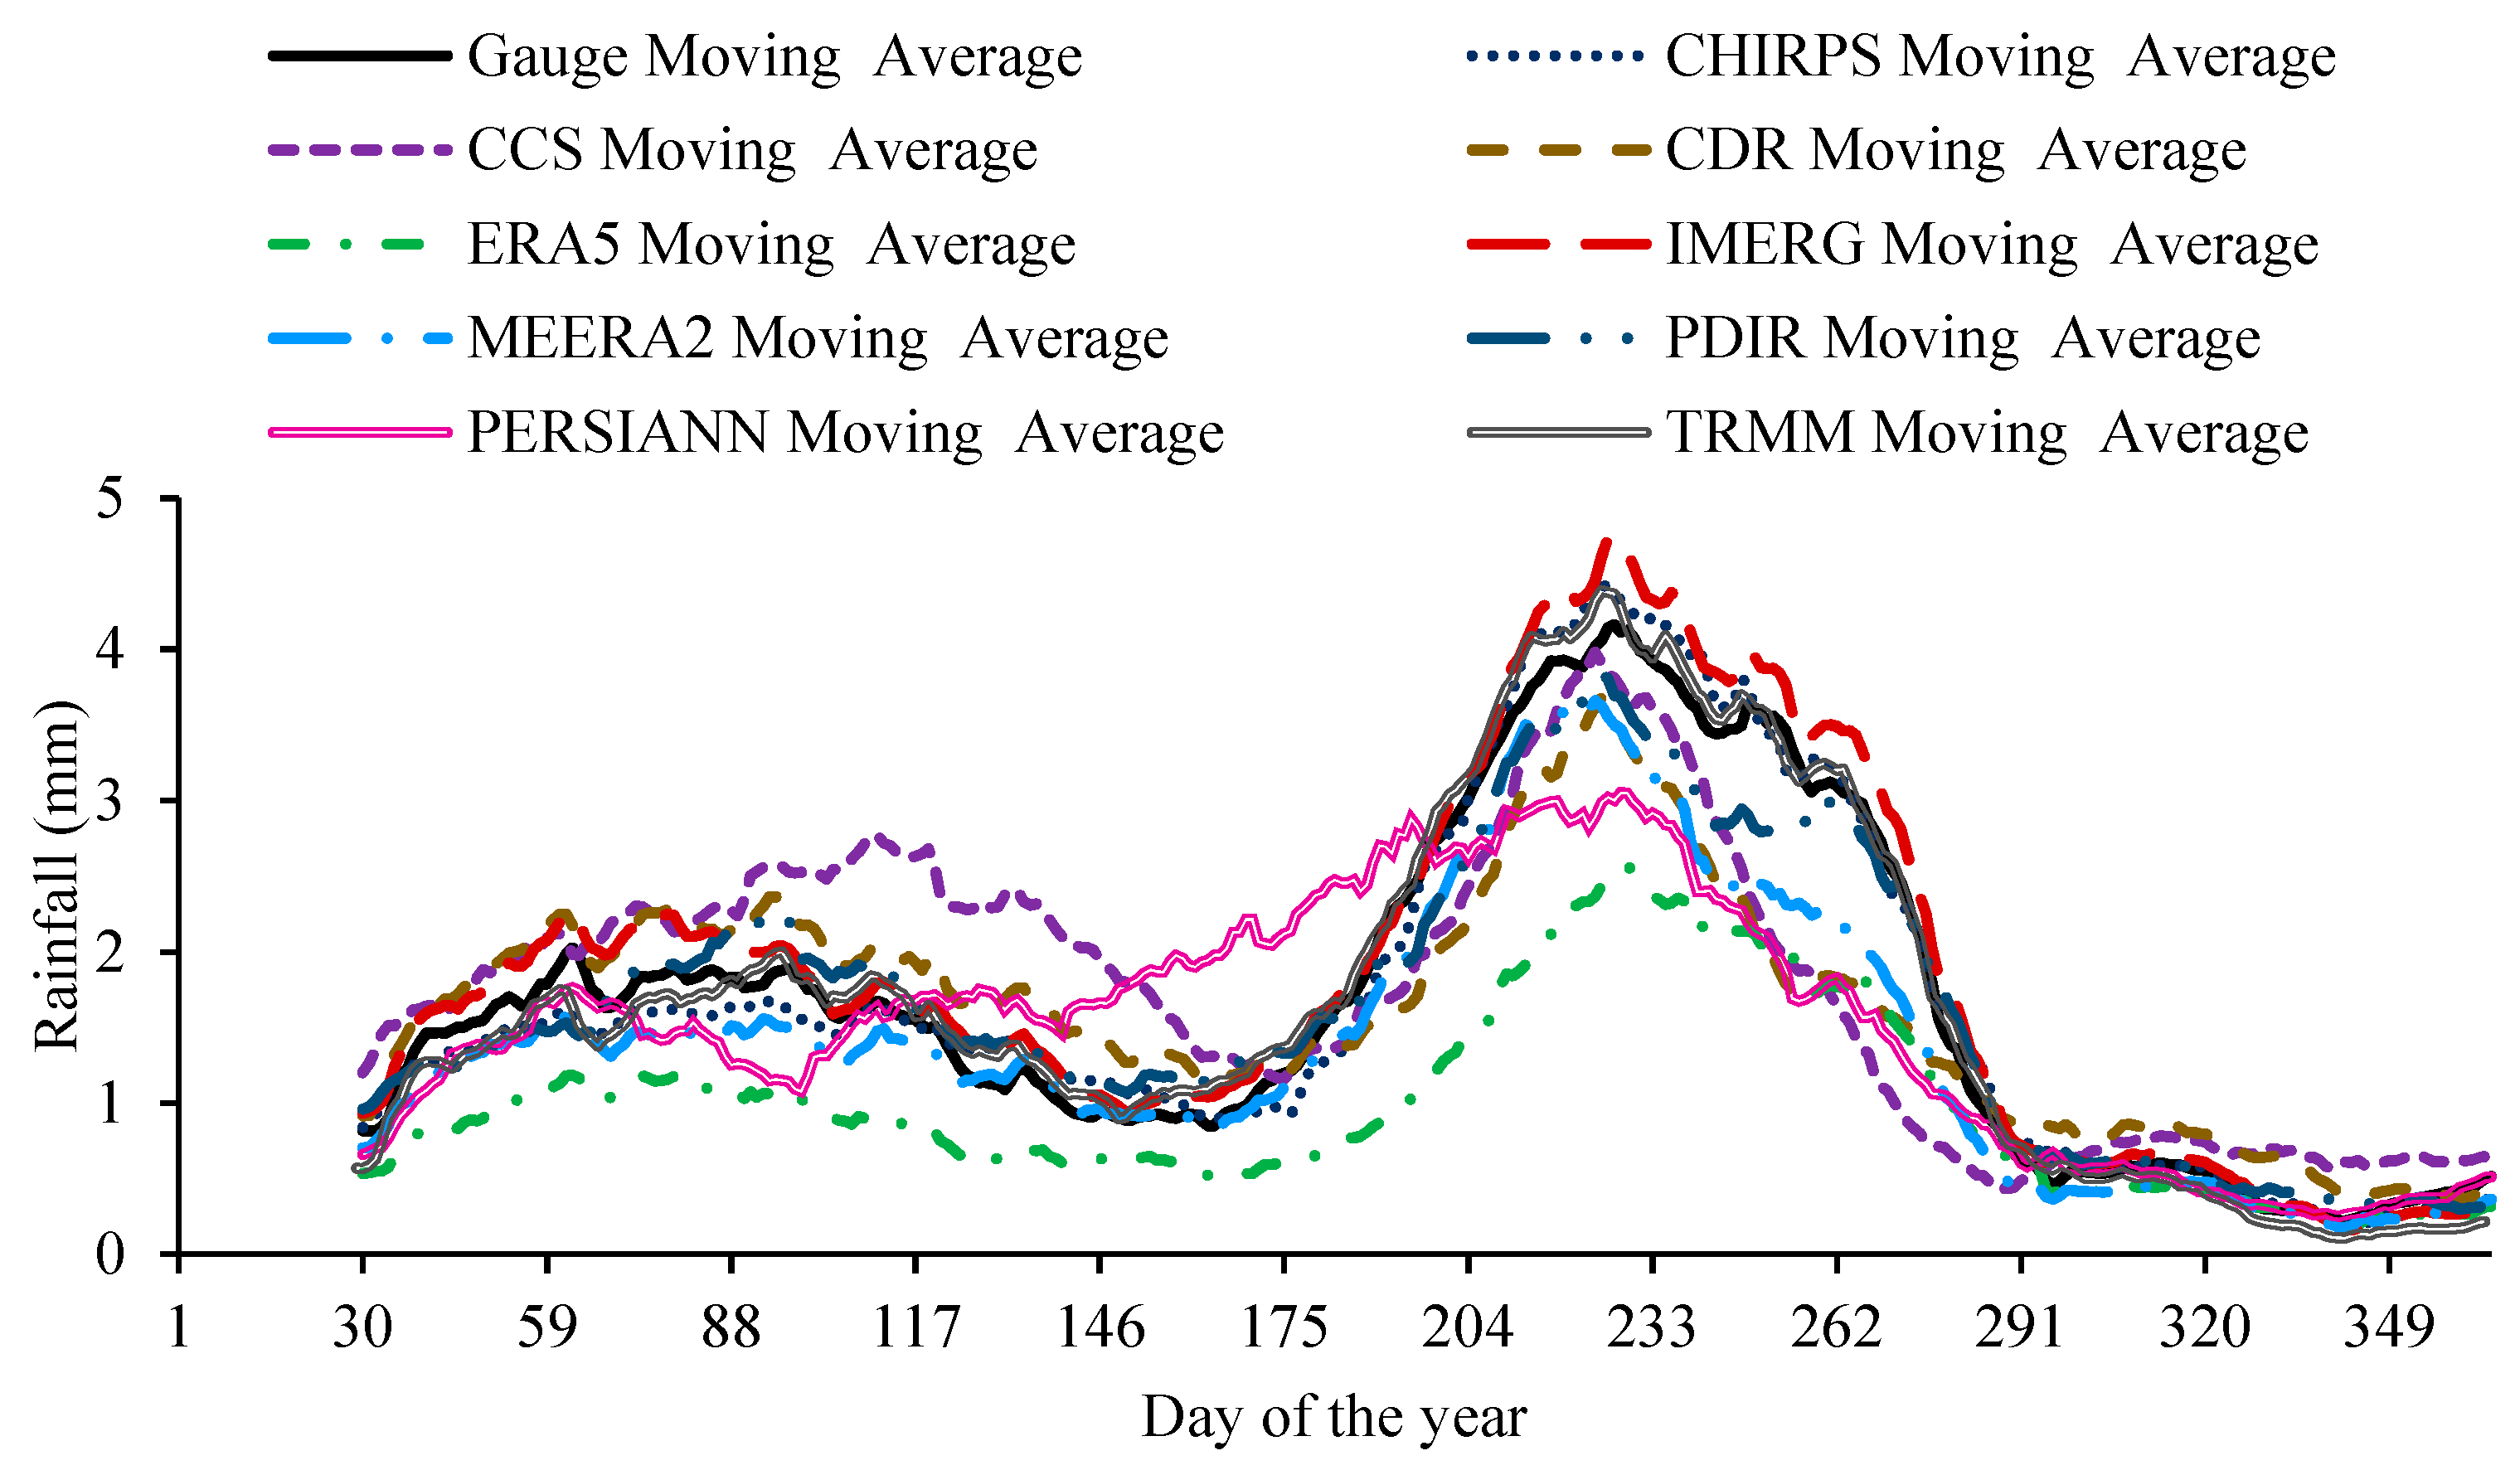
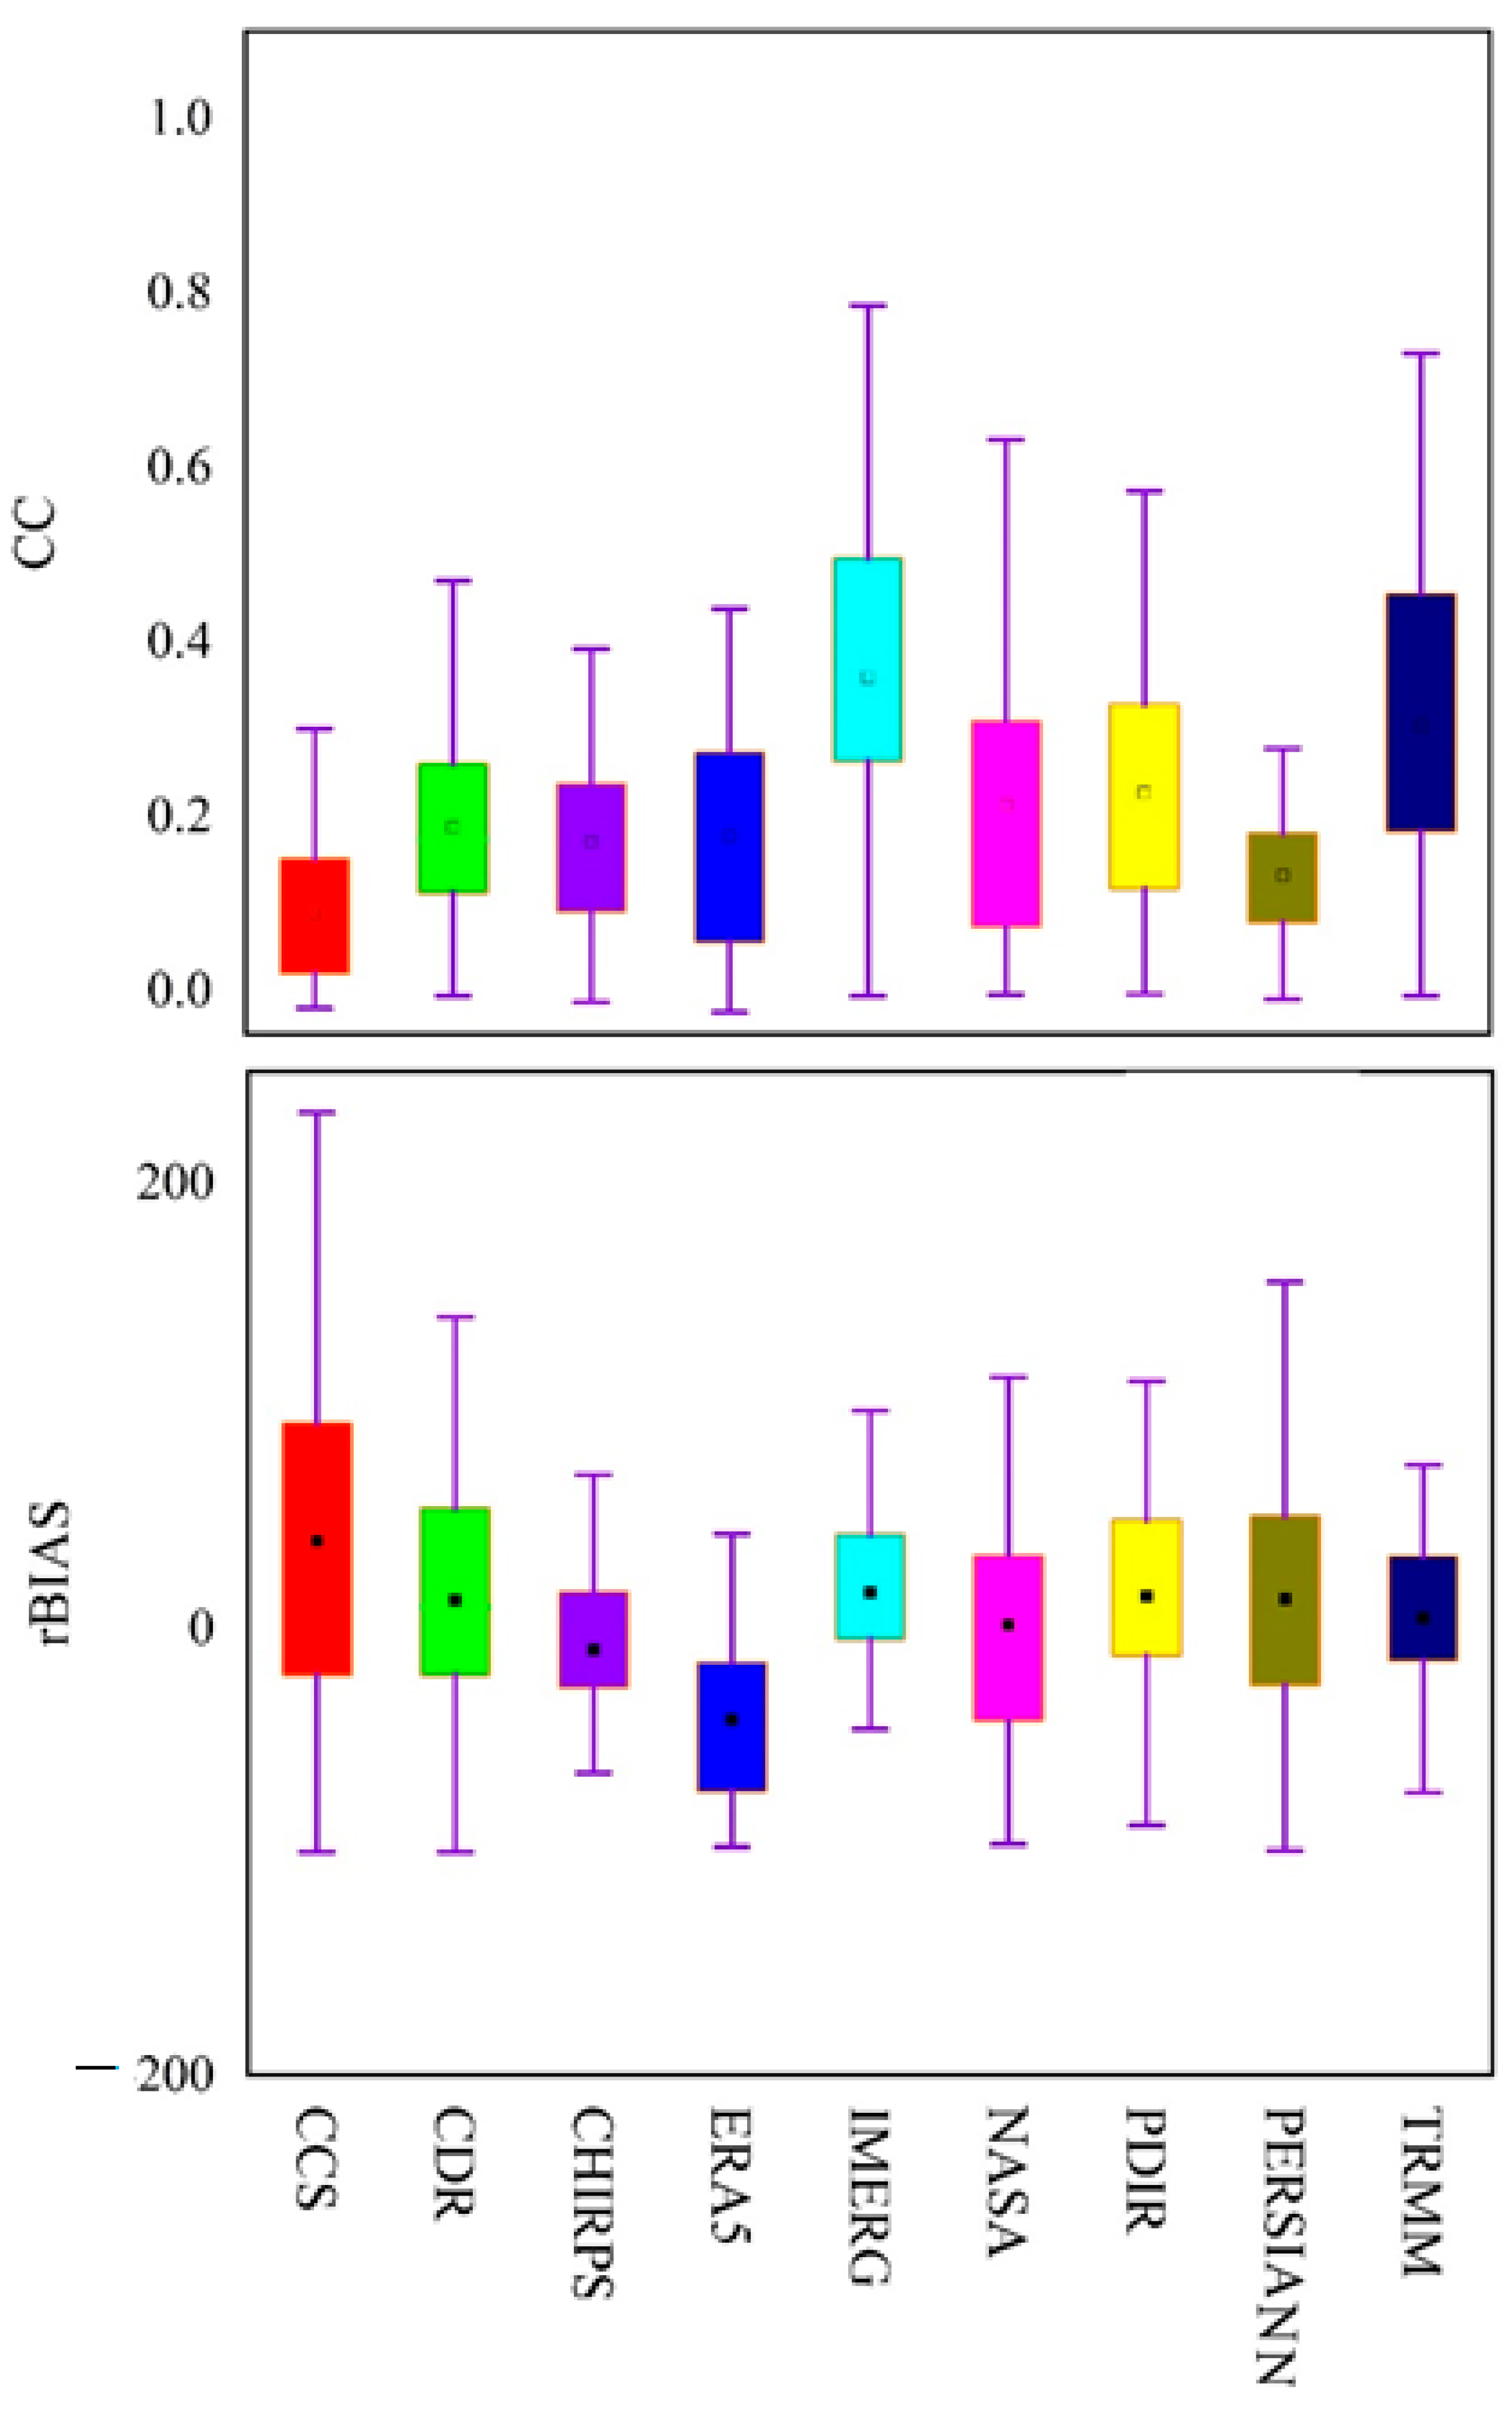
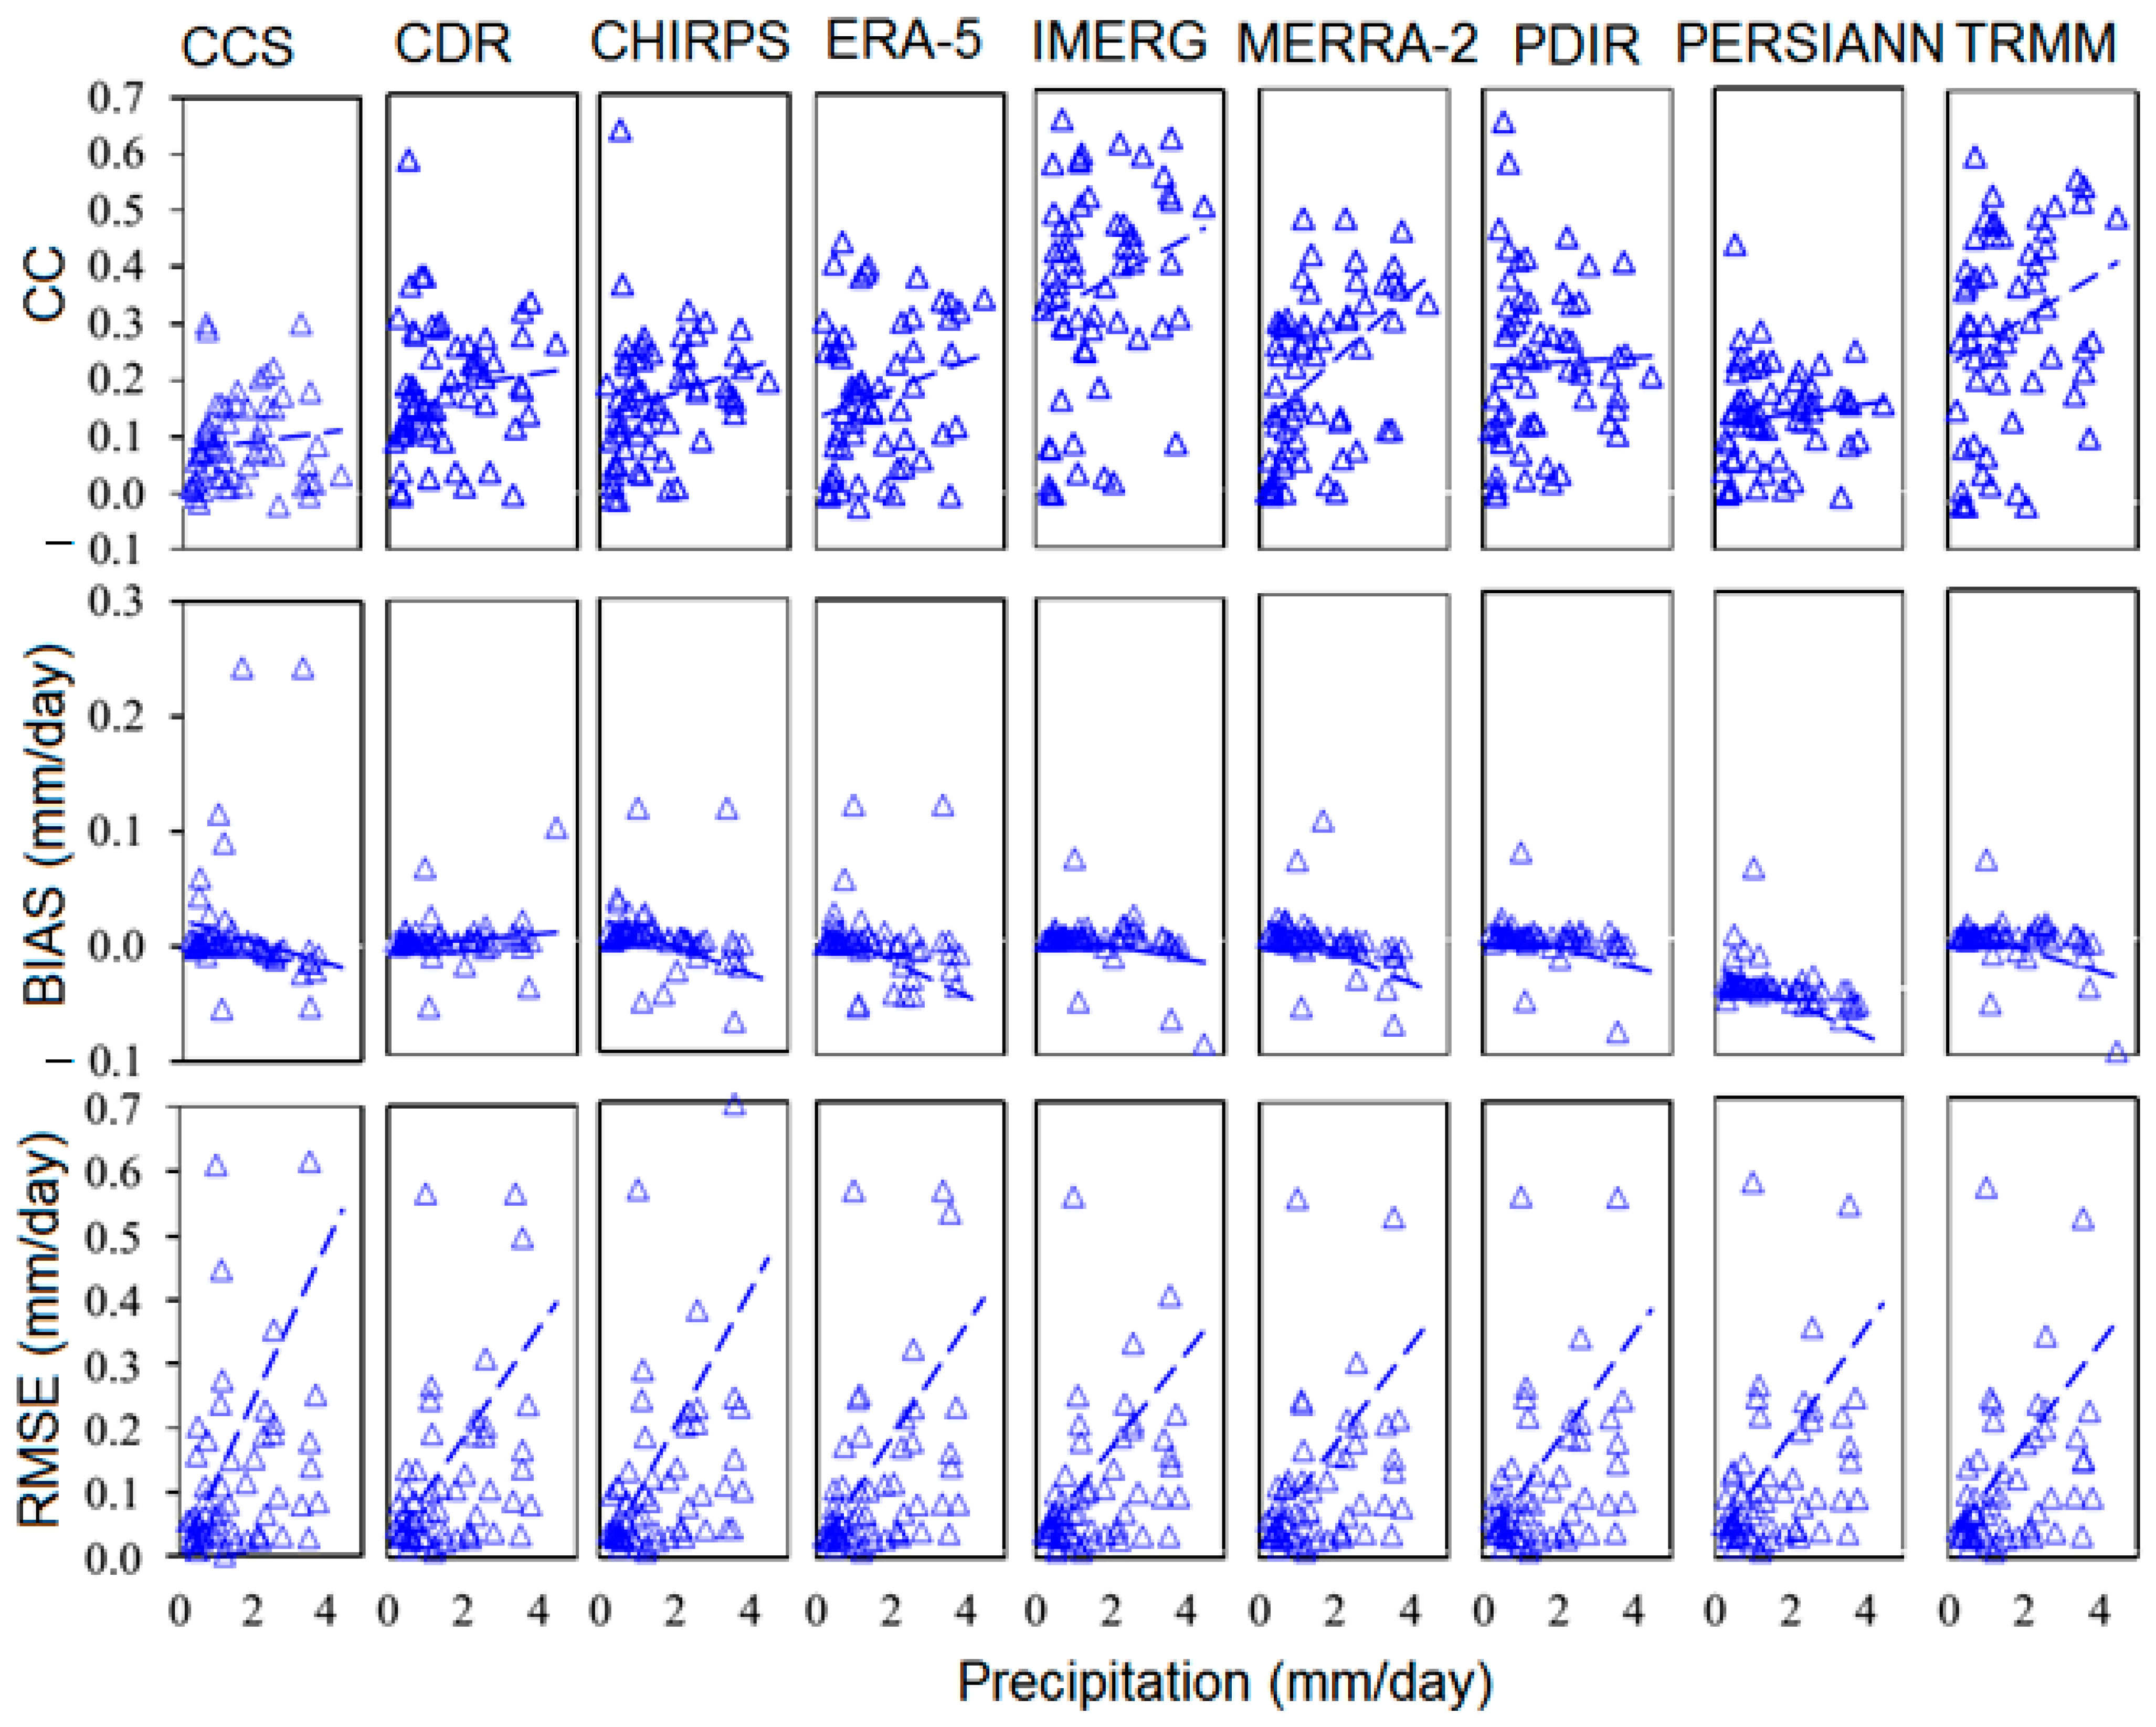
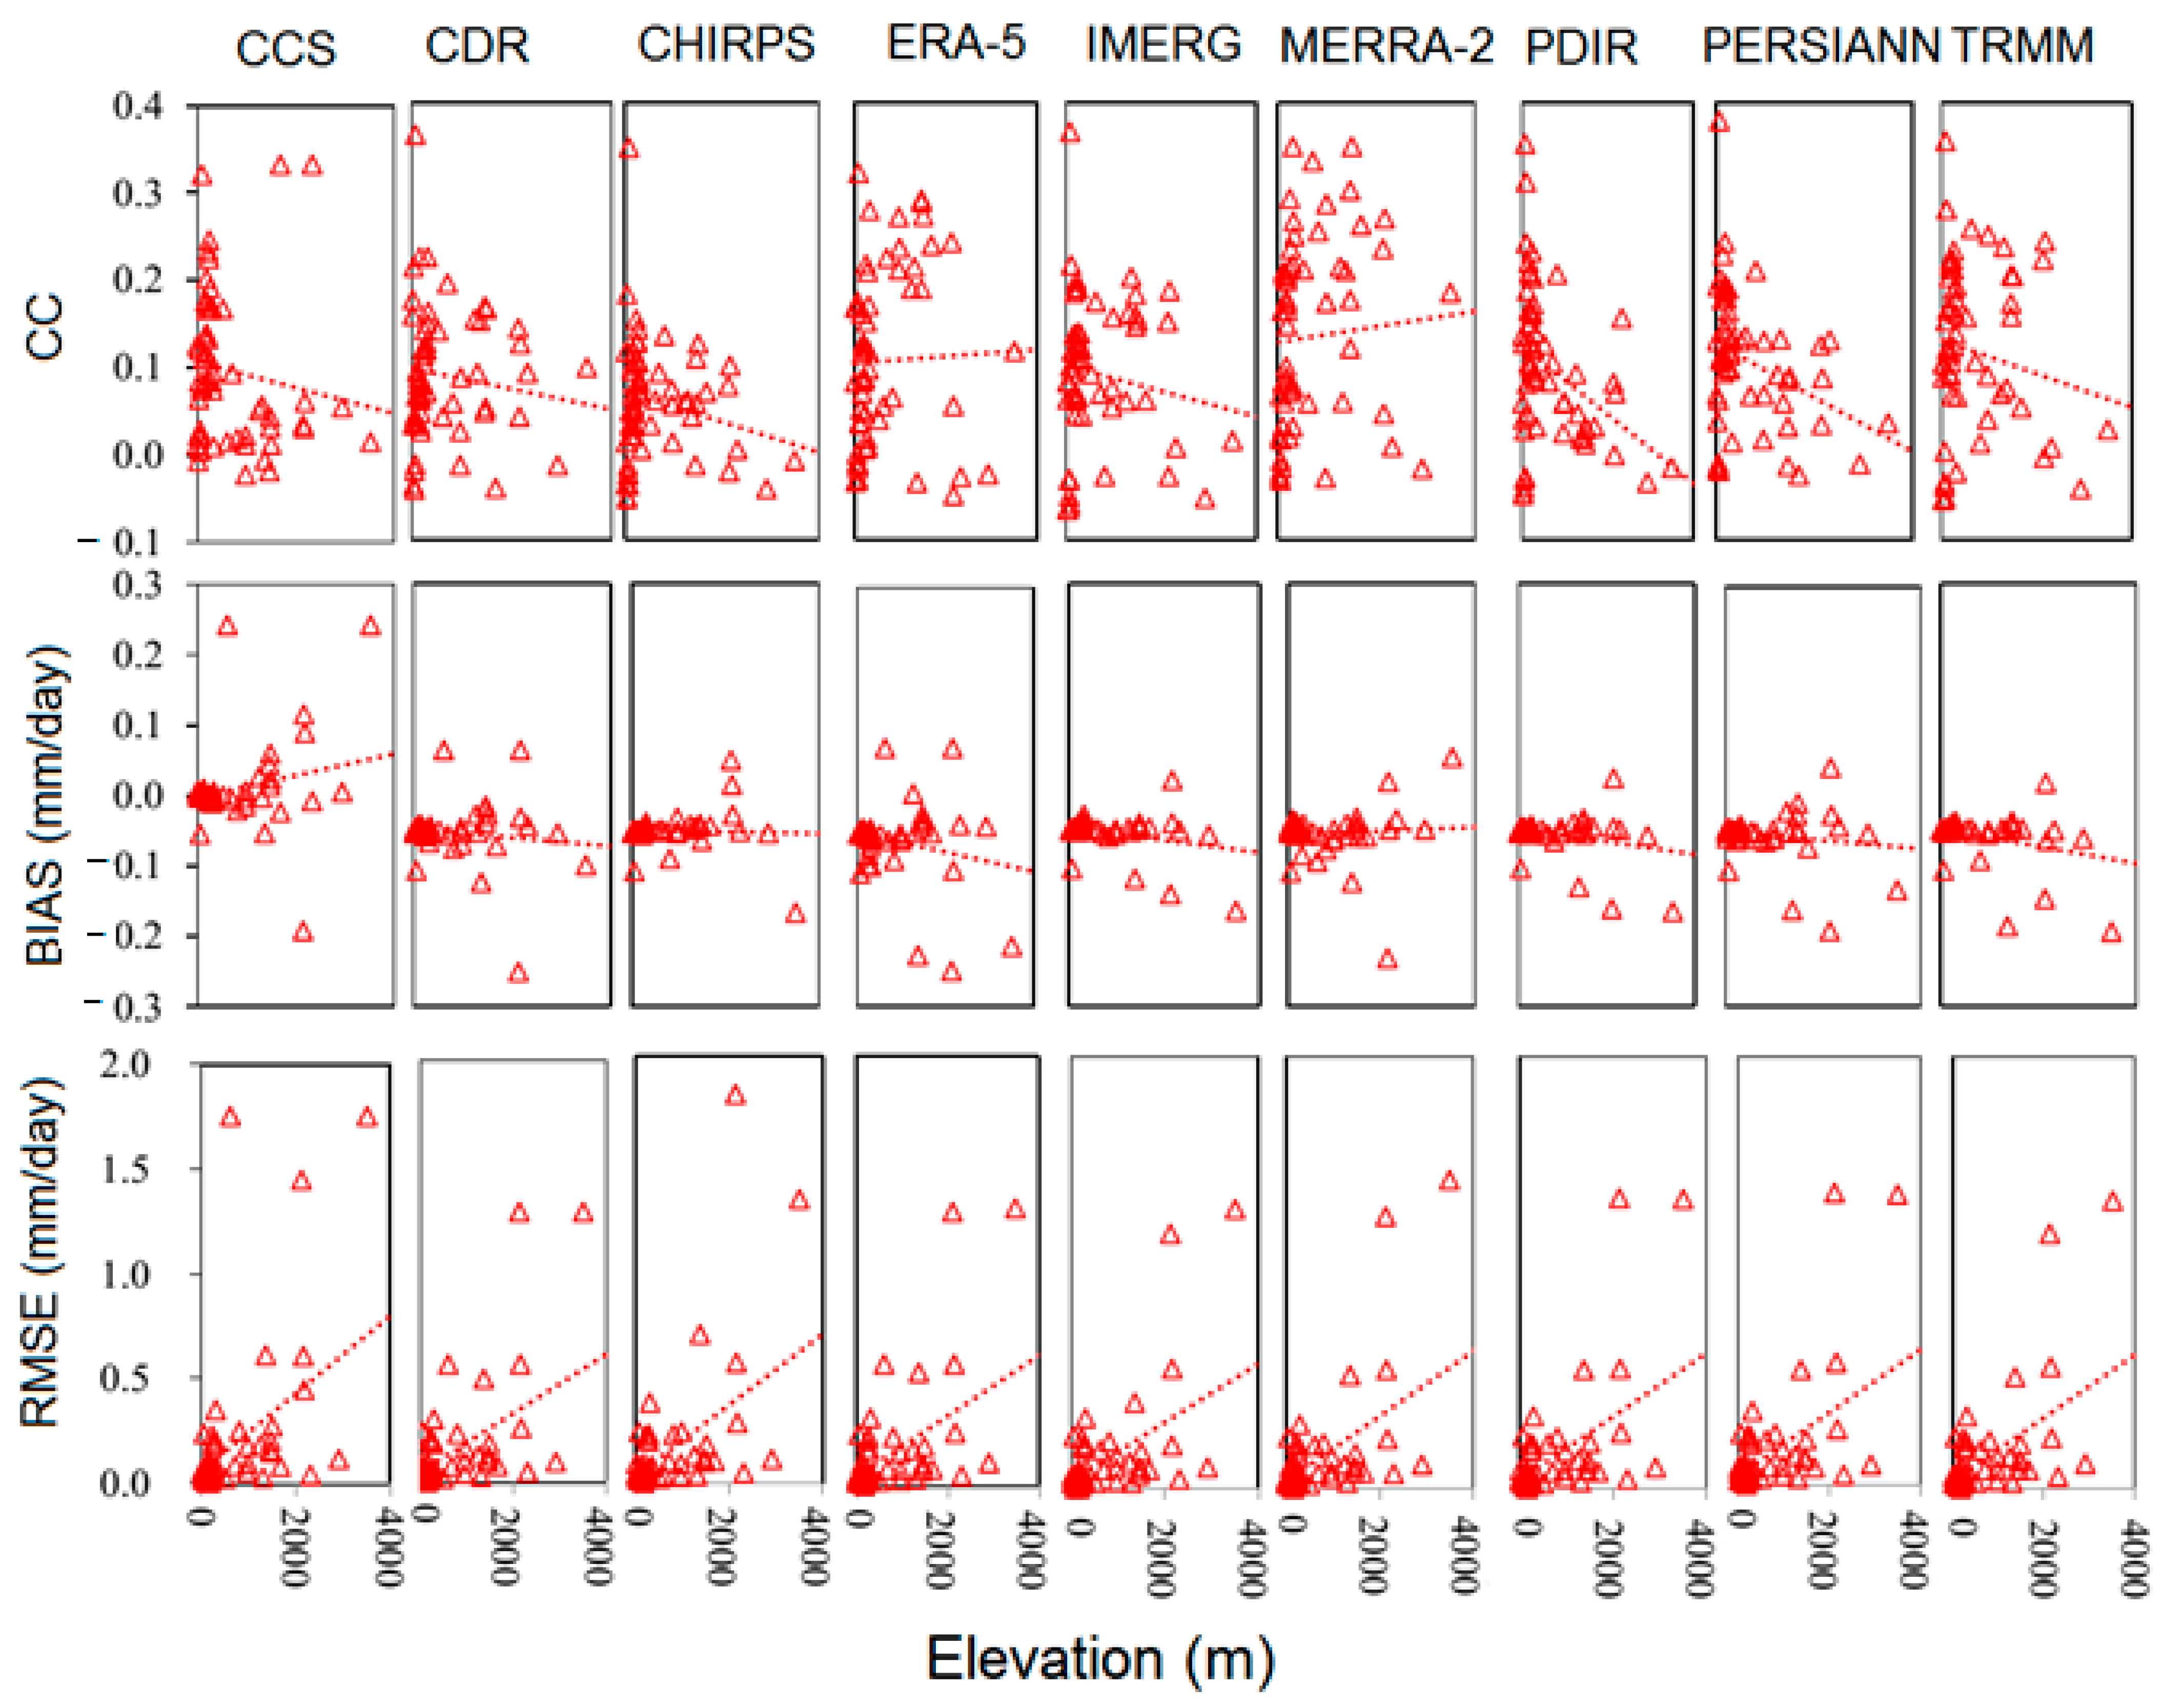
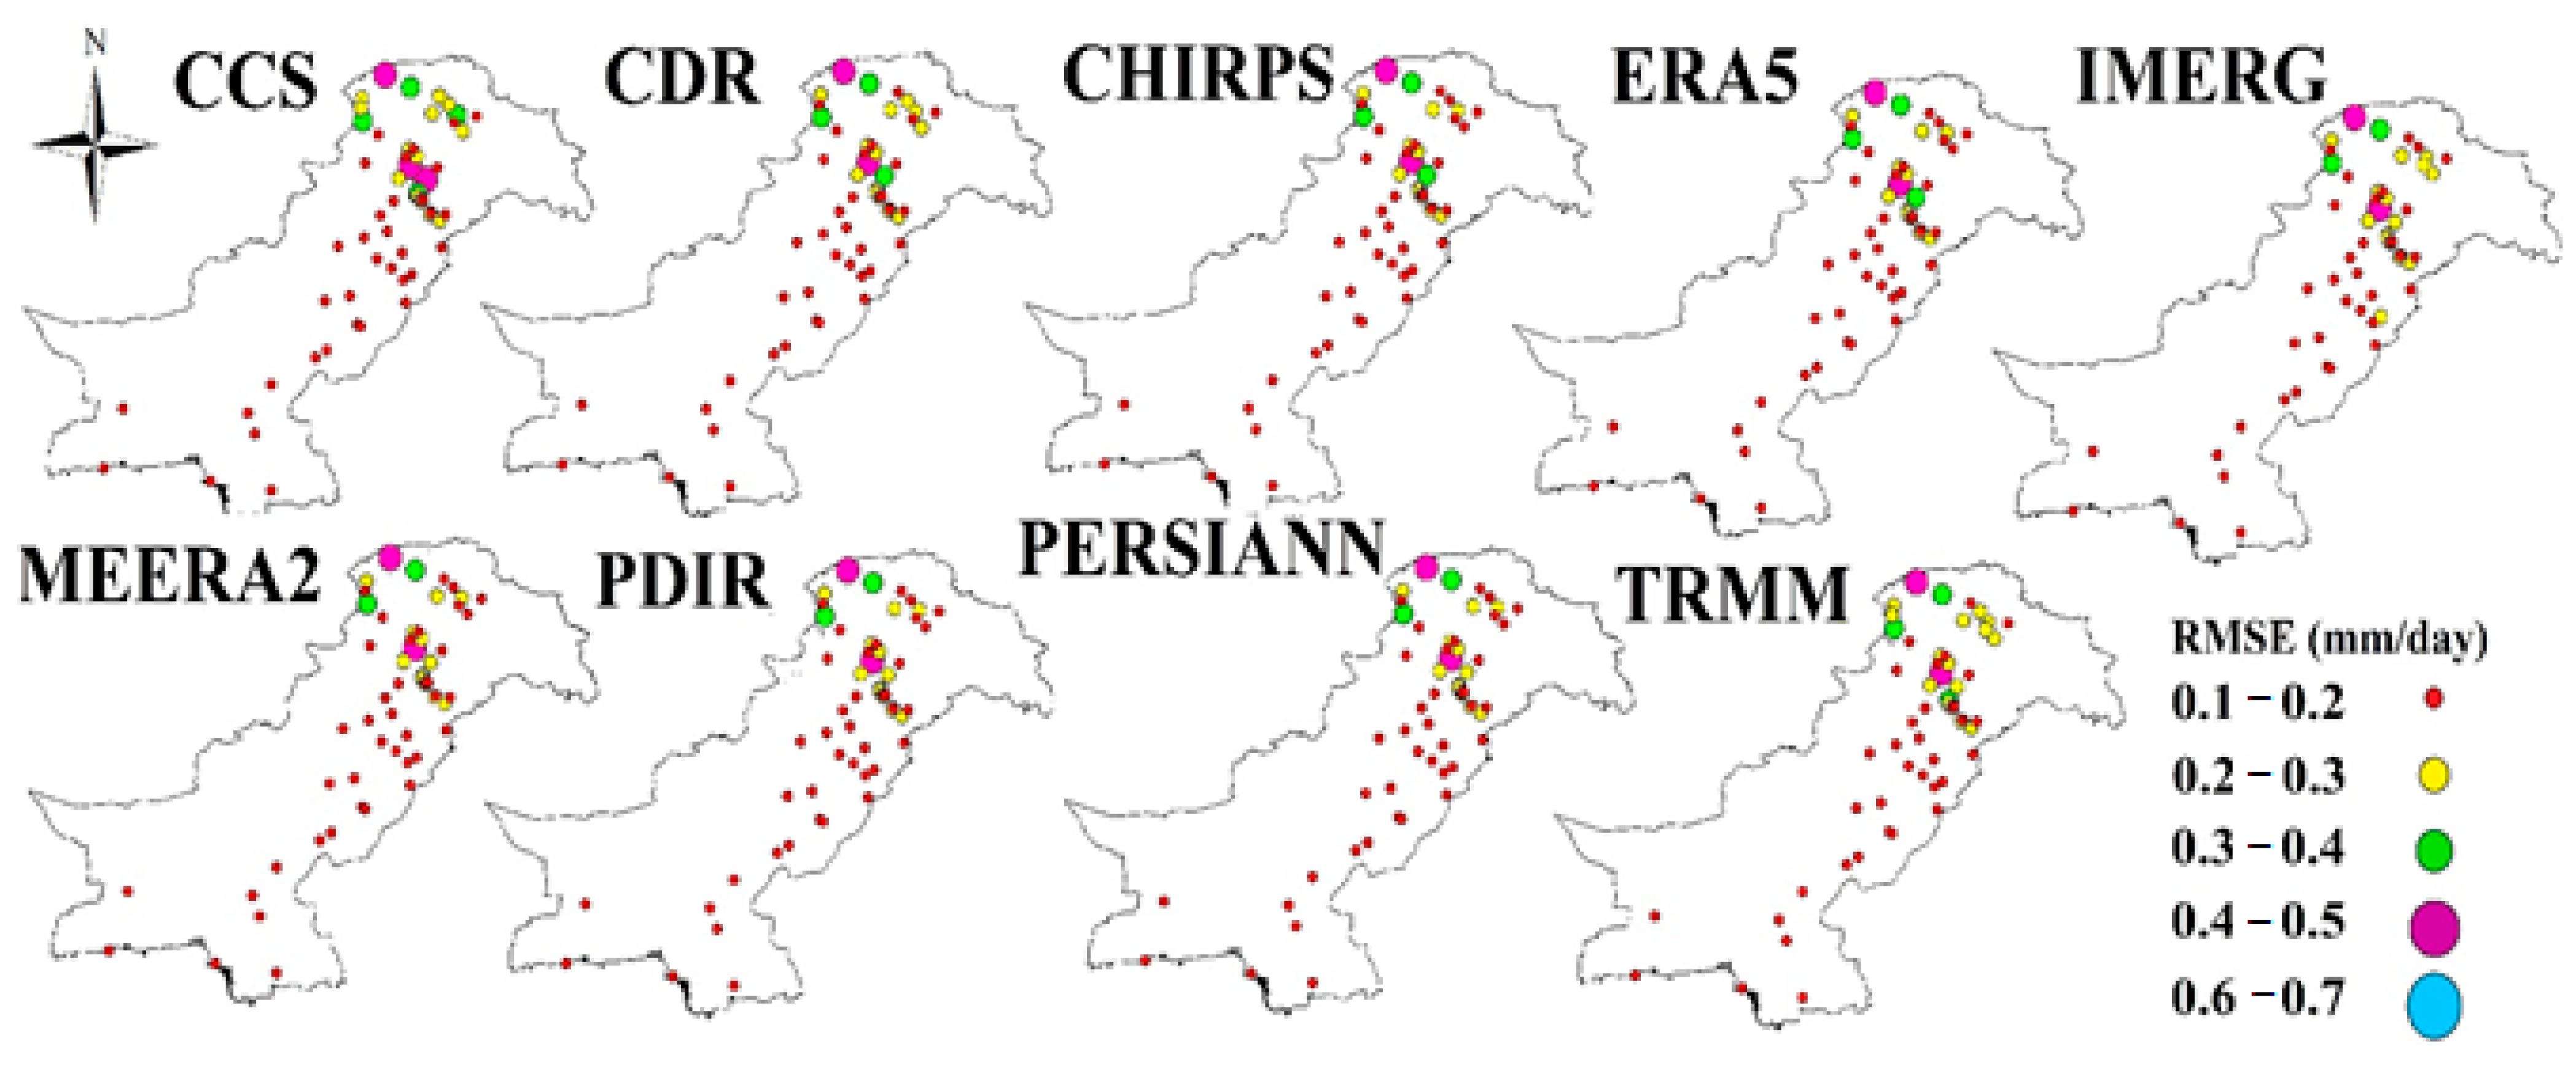
3.3. Assessments of Precipitation Products on Daily Scale
3.4. Ability of SPPs and Reanalysis Products to Detect the of Precipitation Events
4. Discussion
5. Conclusions
- The spatial variability of precipitation in Pakistan was well-depicted by the IMERG and TRMM products. MEERA2, as well as the PERSIANN family of products, were unsuccessful in monitoring the spatial patterns of precipitation.
- The daily variability in precipitation could be tracked using both the IMERG and TRMM products. However, PERSIANN, PERSIANN-CCS, PDIR, PERSIANN-CDR, or MEERA2 could not adequately describe the temporal variability of precipitation.
- As compared to daily scale, the overall performance of all SPPs and reanalysis products was significantly improved when evaluated on a monthly scale.
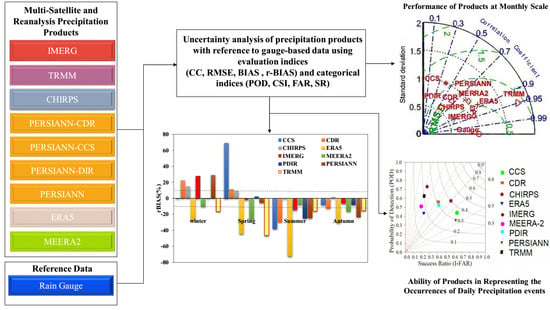
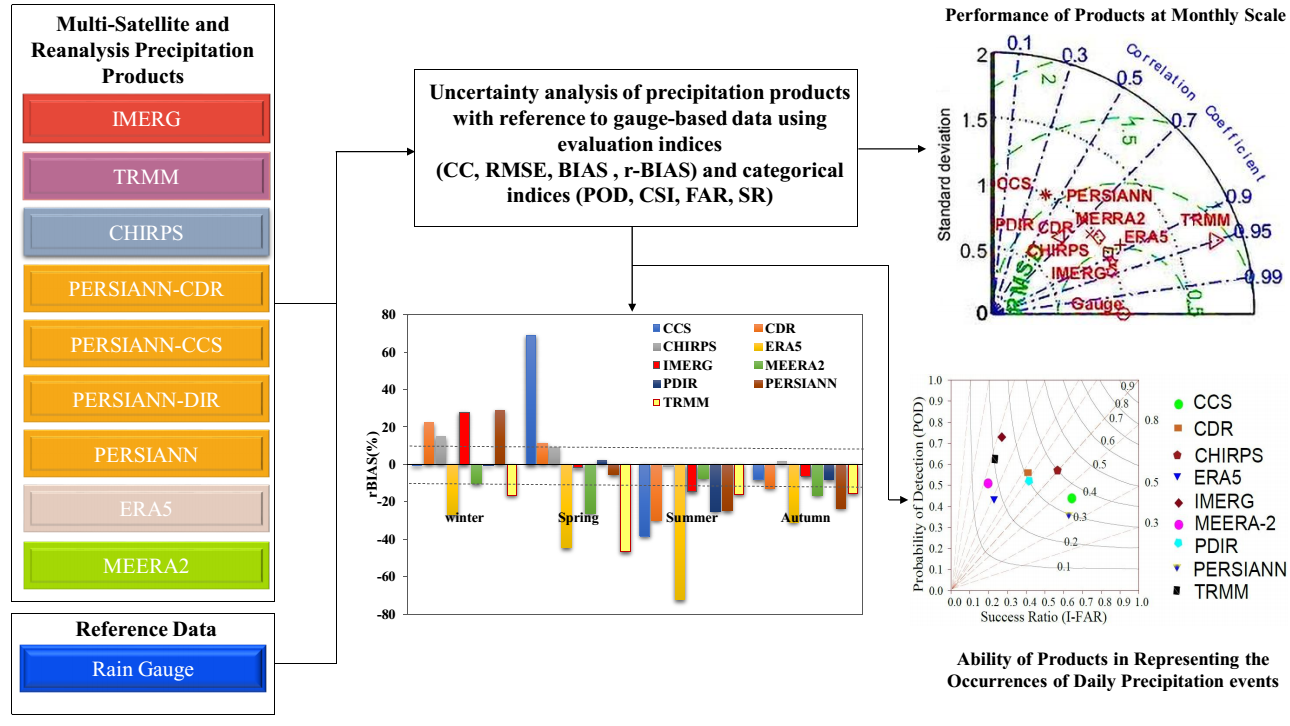
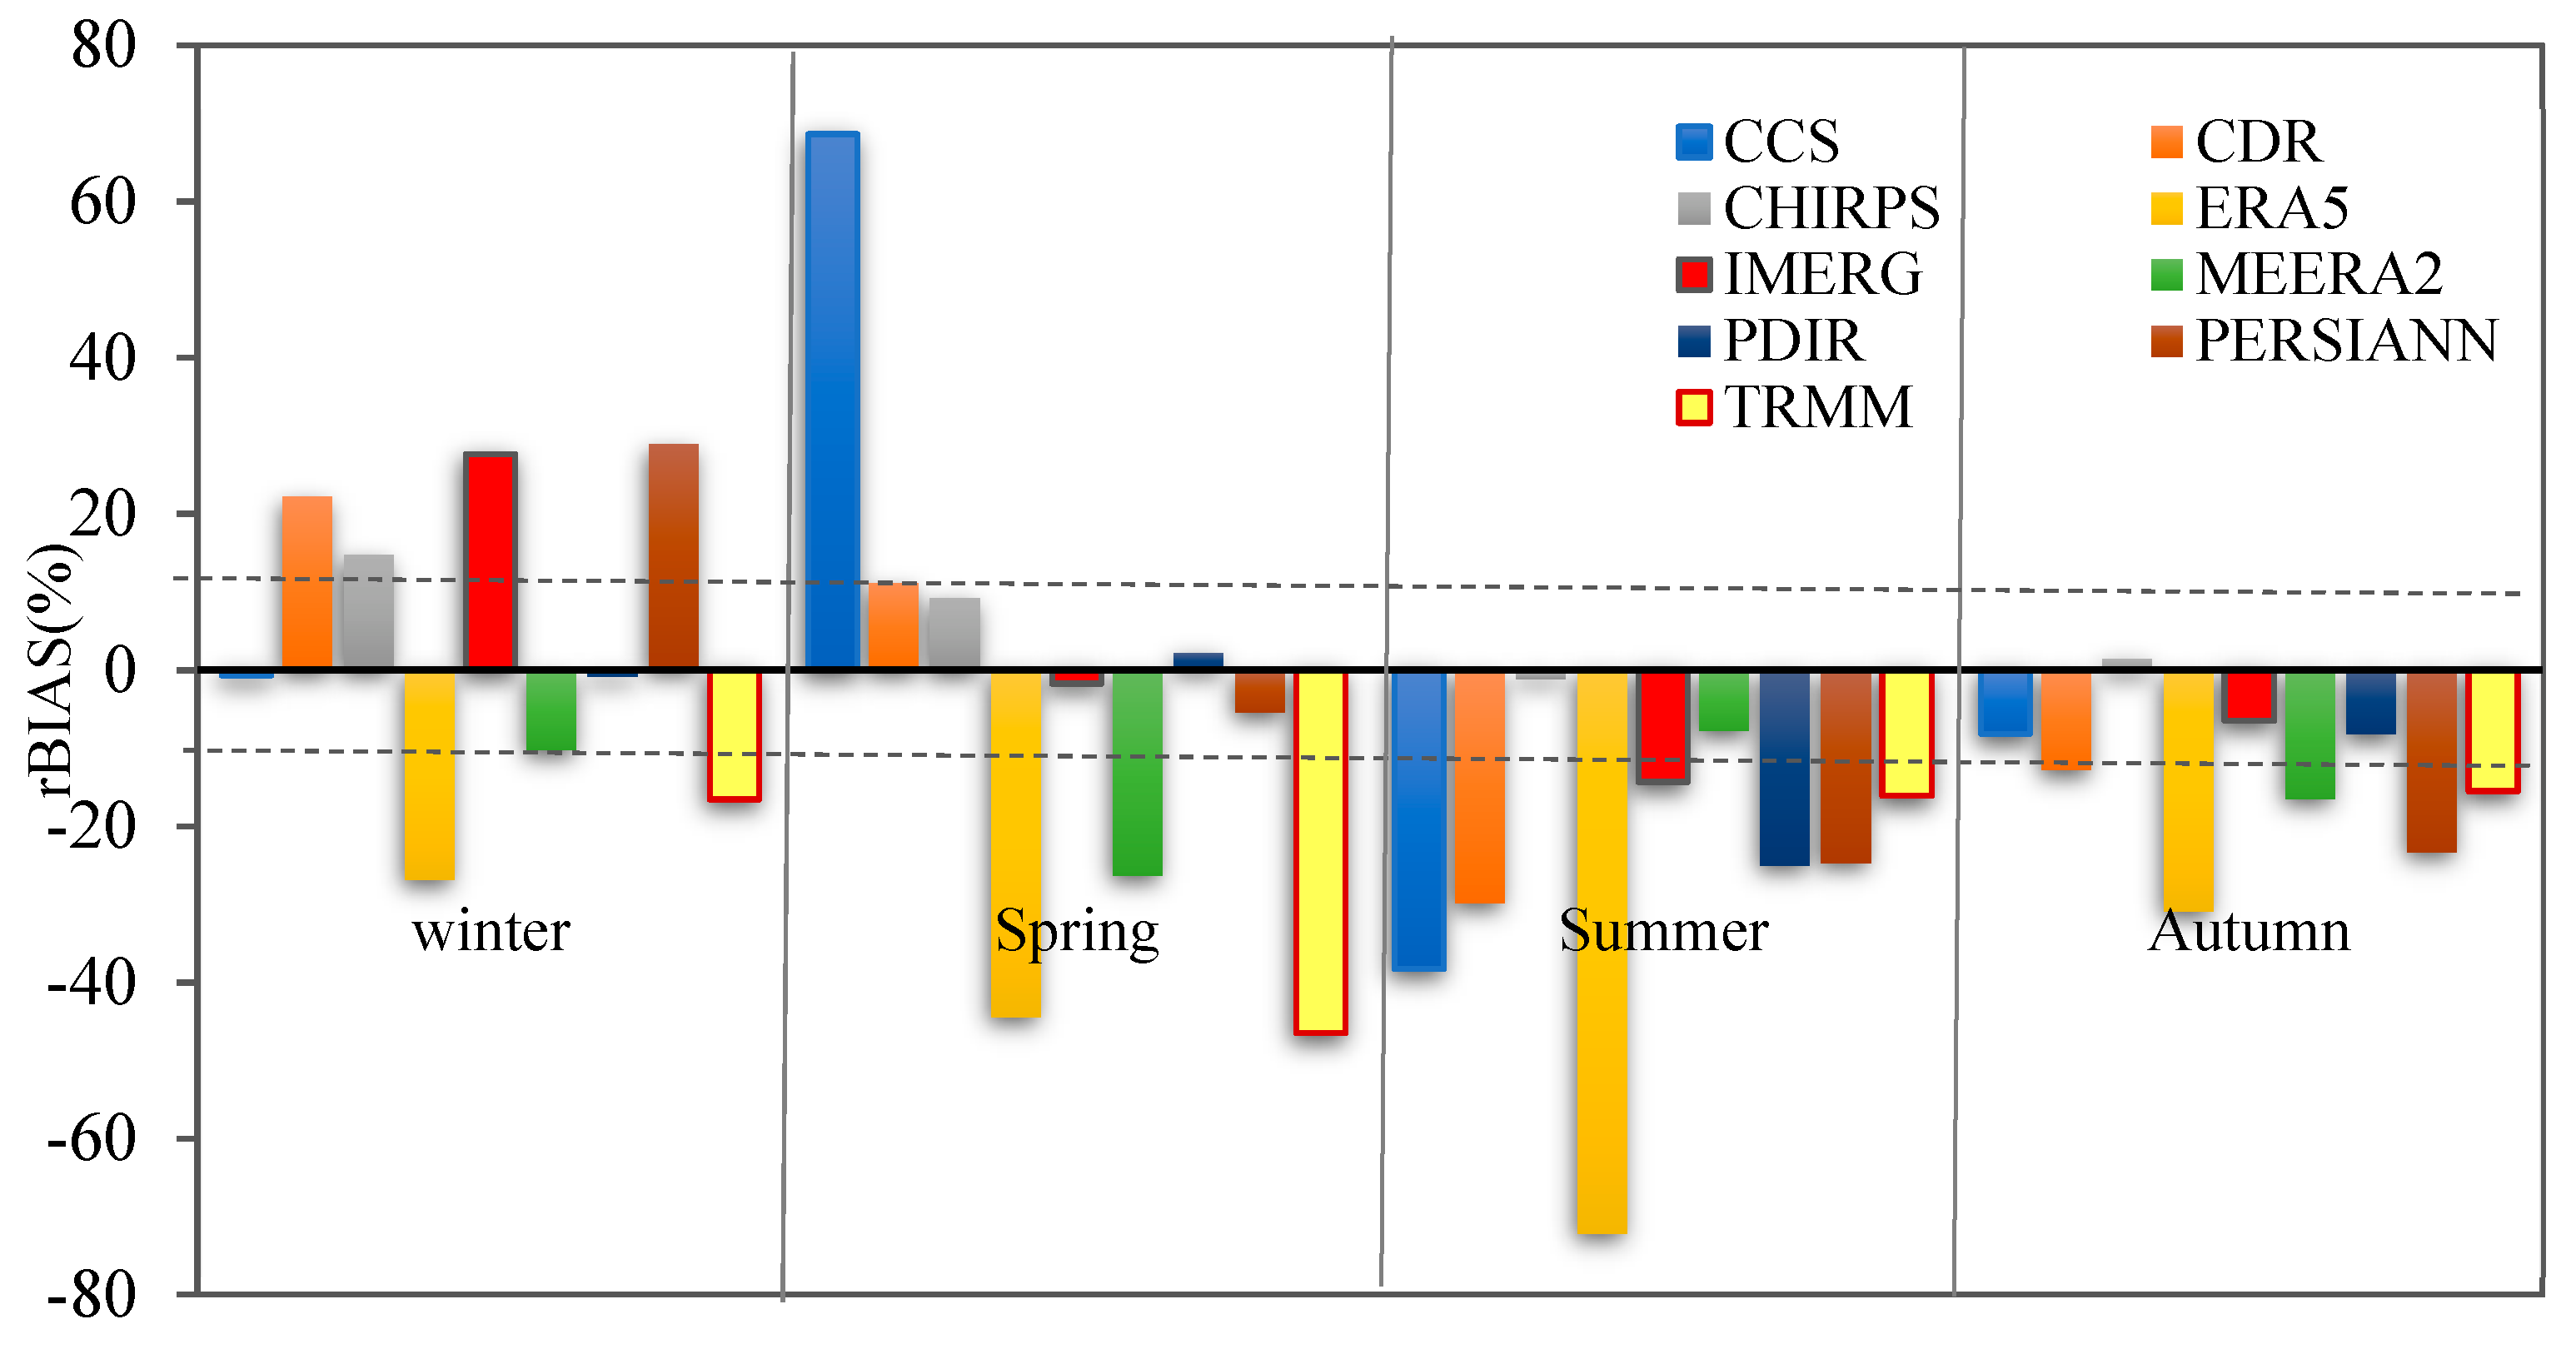
- ERA-5 showed a significant underestimation of the observed precipitation amount in all seasons, and showed worst performance in the summer season (underestimation >70%). Overall, during the summer season, the CHIRPS product showed the best performance in terms of relative bias.
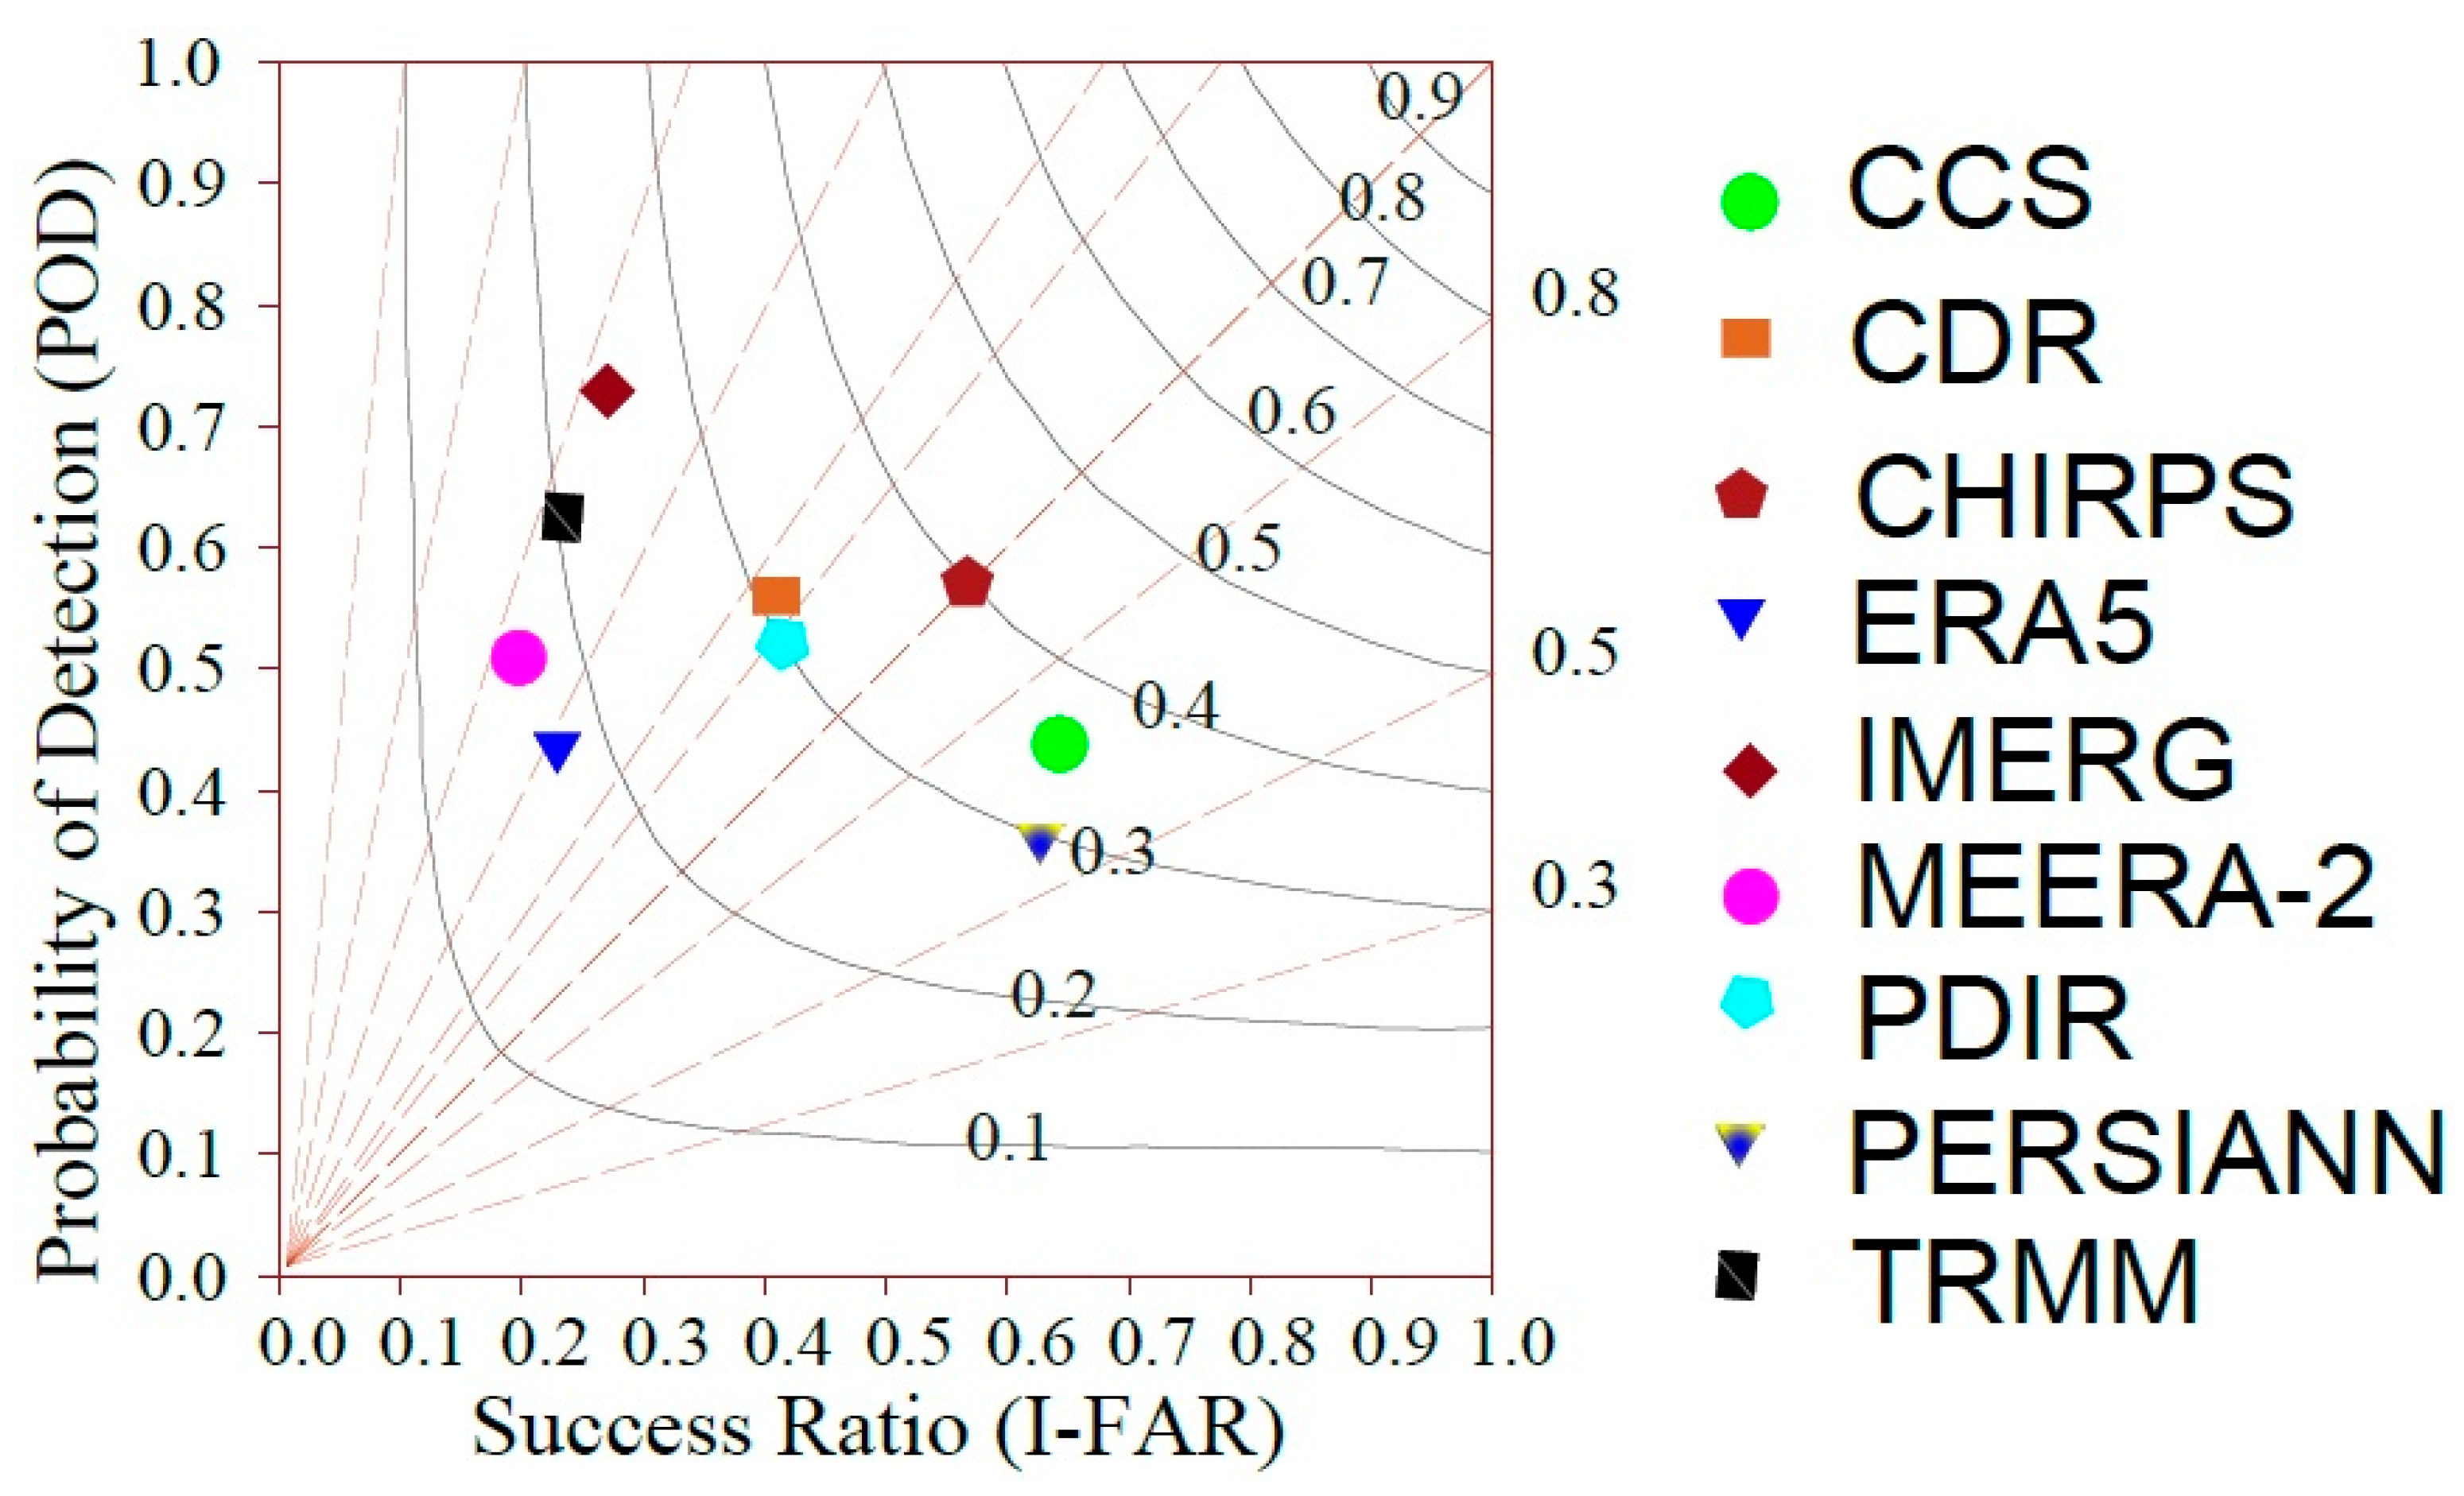
- The POD was maximum for IMERG (0.73), which indicated that the ability of the product to detect the daily occurrence of precipitation was very good as compared to other SPPs and reanalysis products.
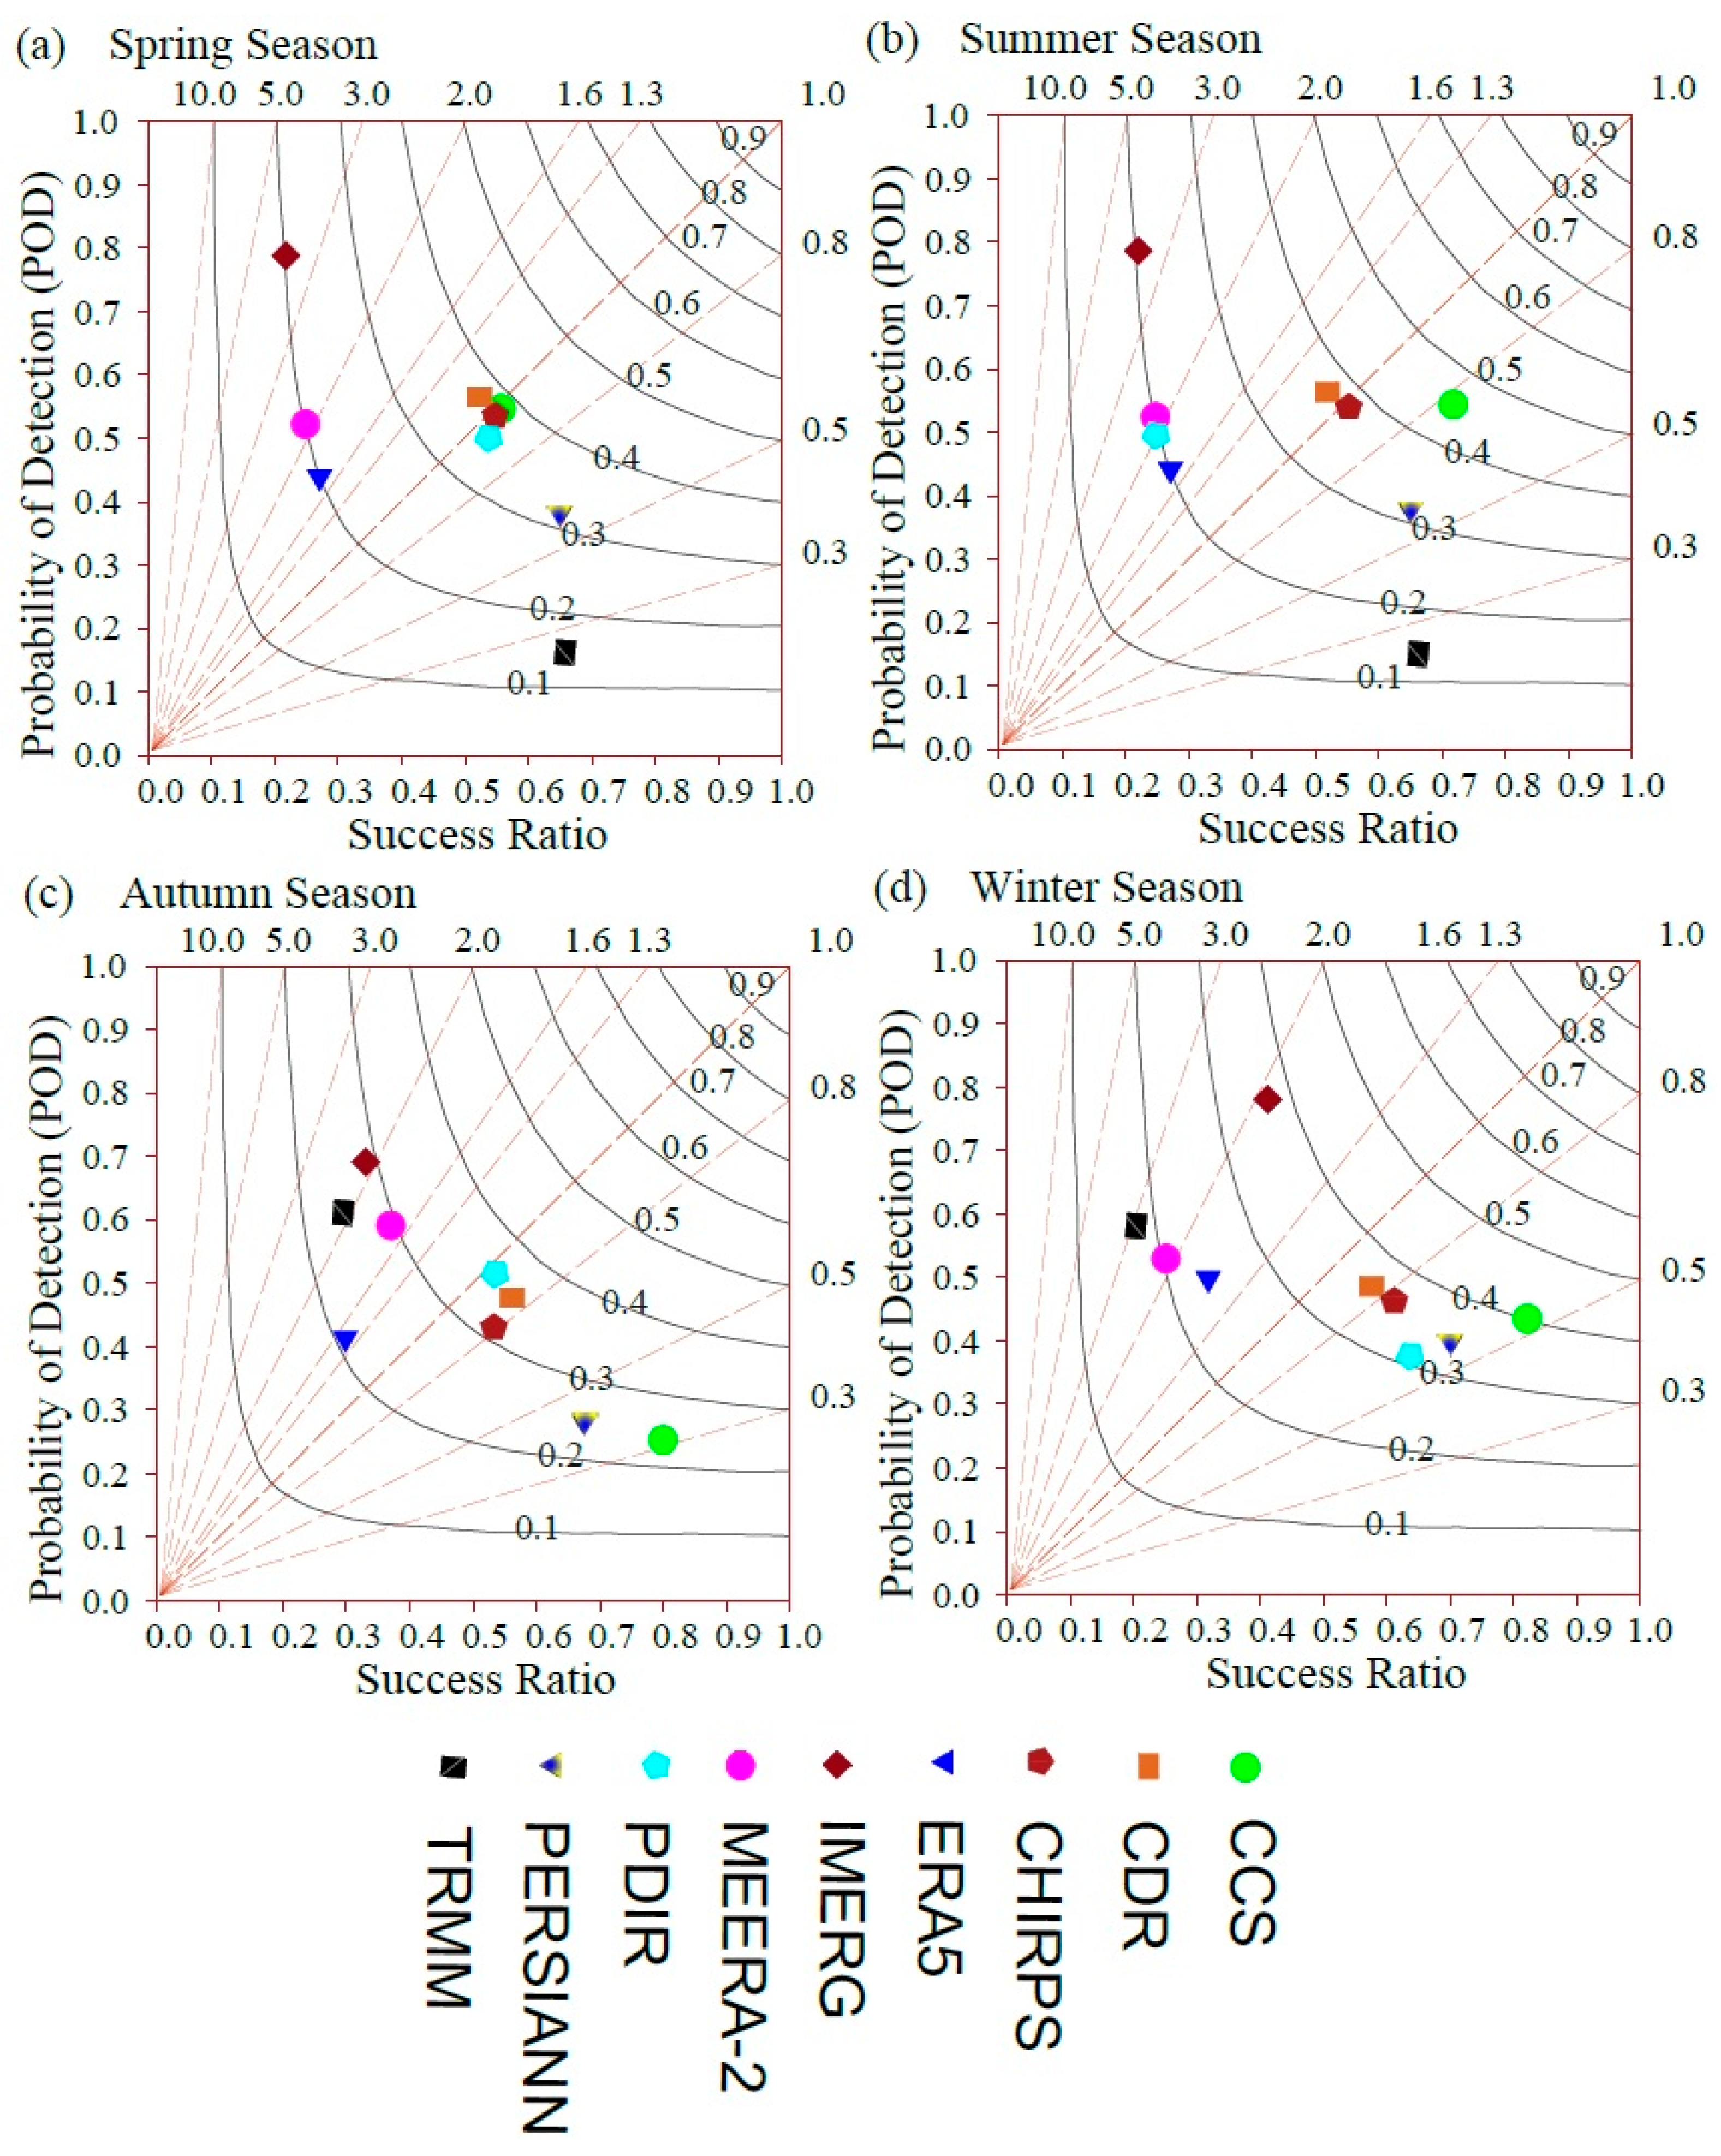
- In all seasons, the overall performance of IMERG was superior to that of the other products in terms of its capacity to identify the occurrence of precipitation (spring (POD = 0.78), winter (POD = 0.78), summer (POD = 0.78), and autumn (POD = 0.69)).
- The performance of the ERA5 product was comparatively good over the plane topography as compared to rugged topographic conditions.
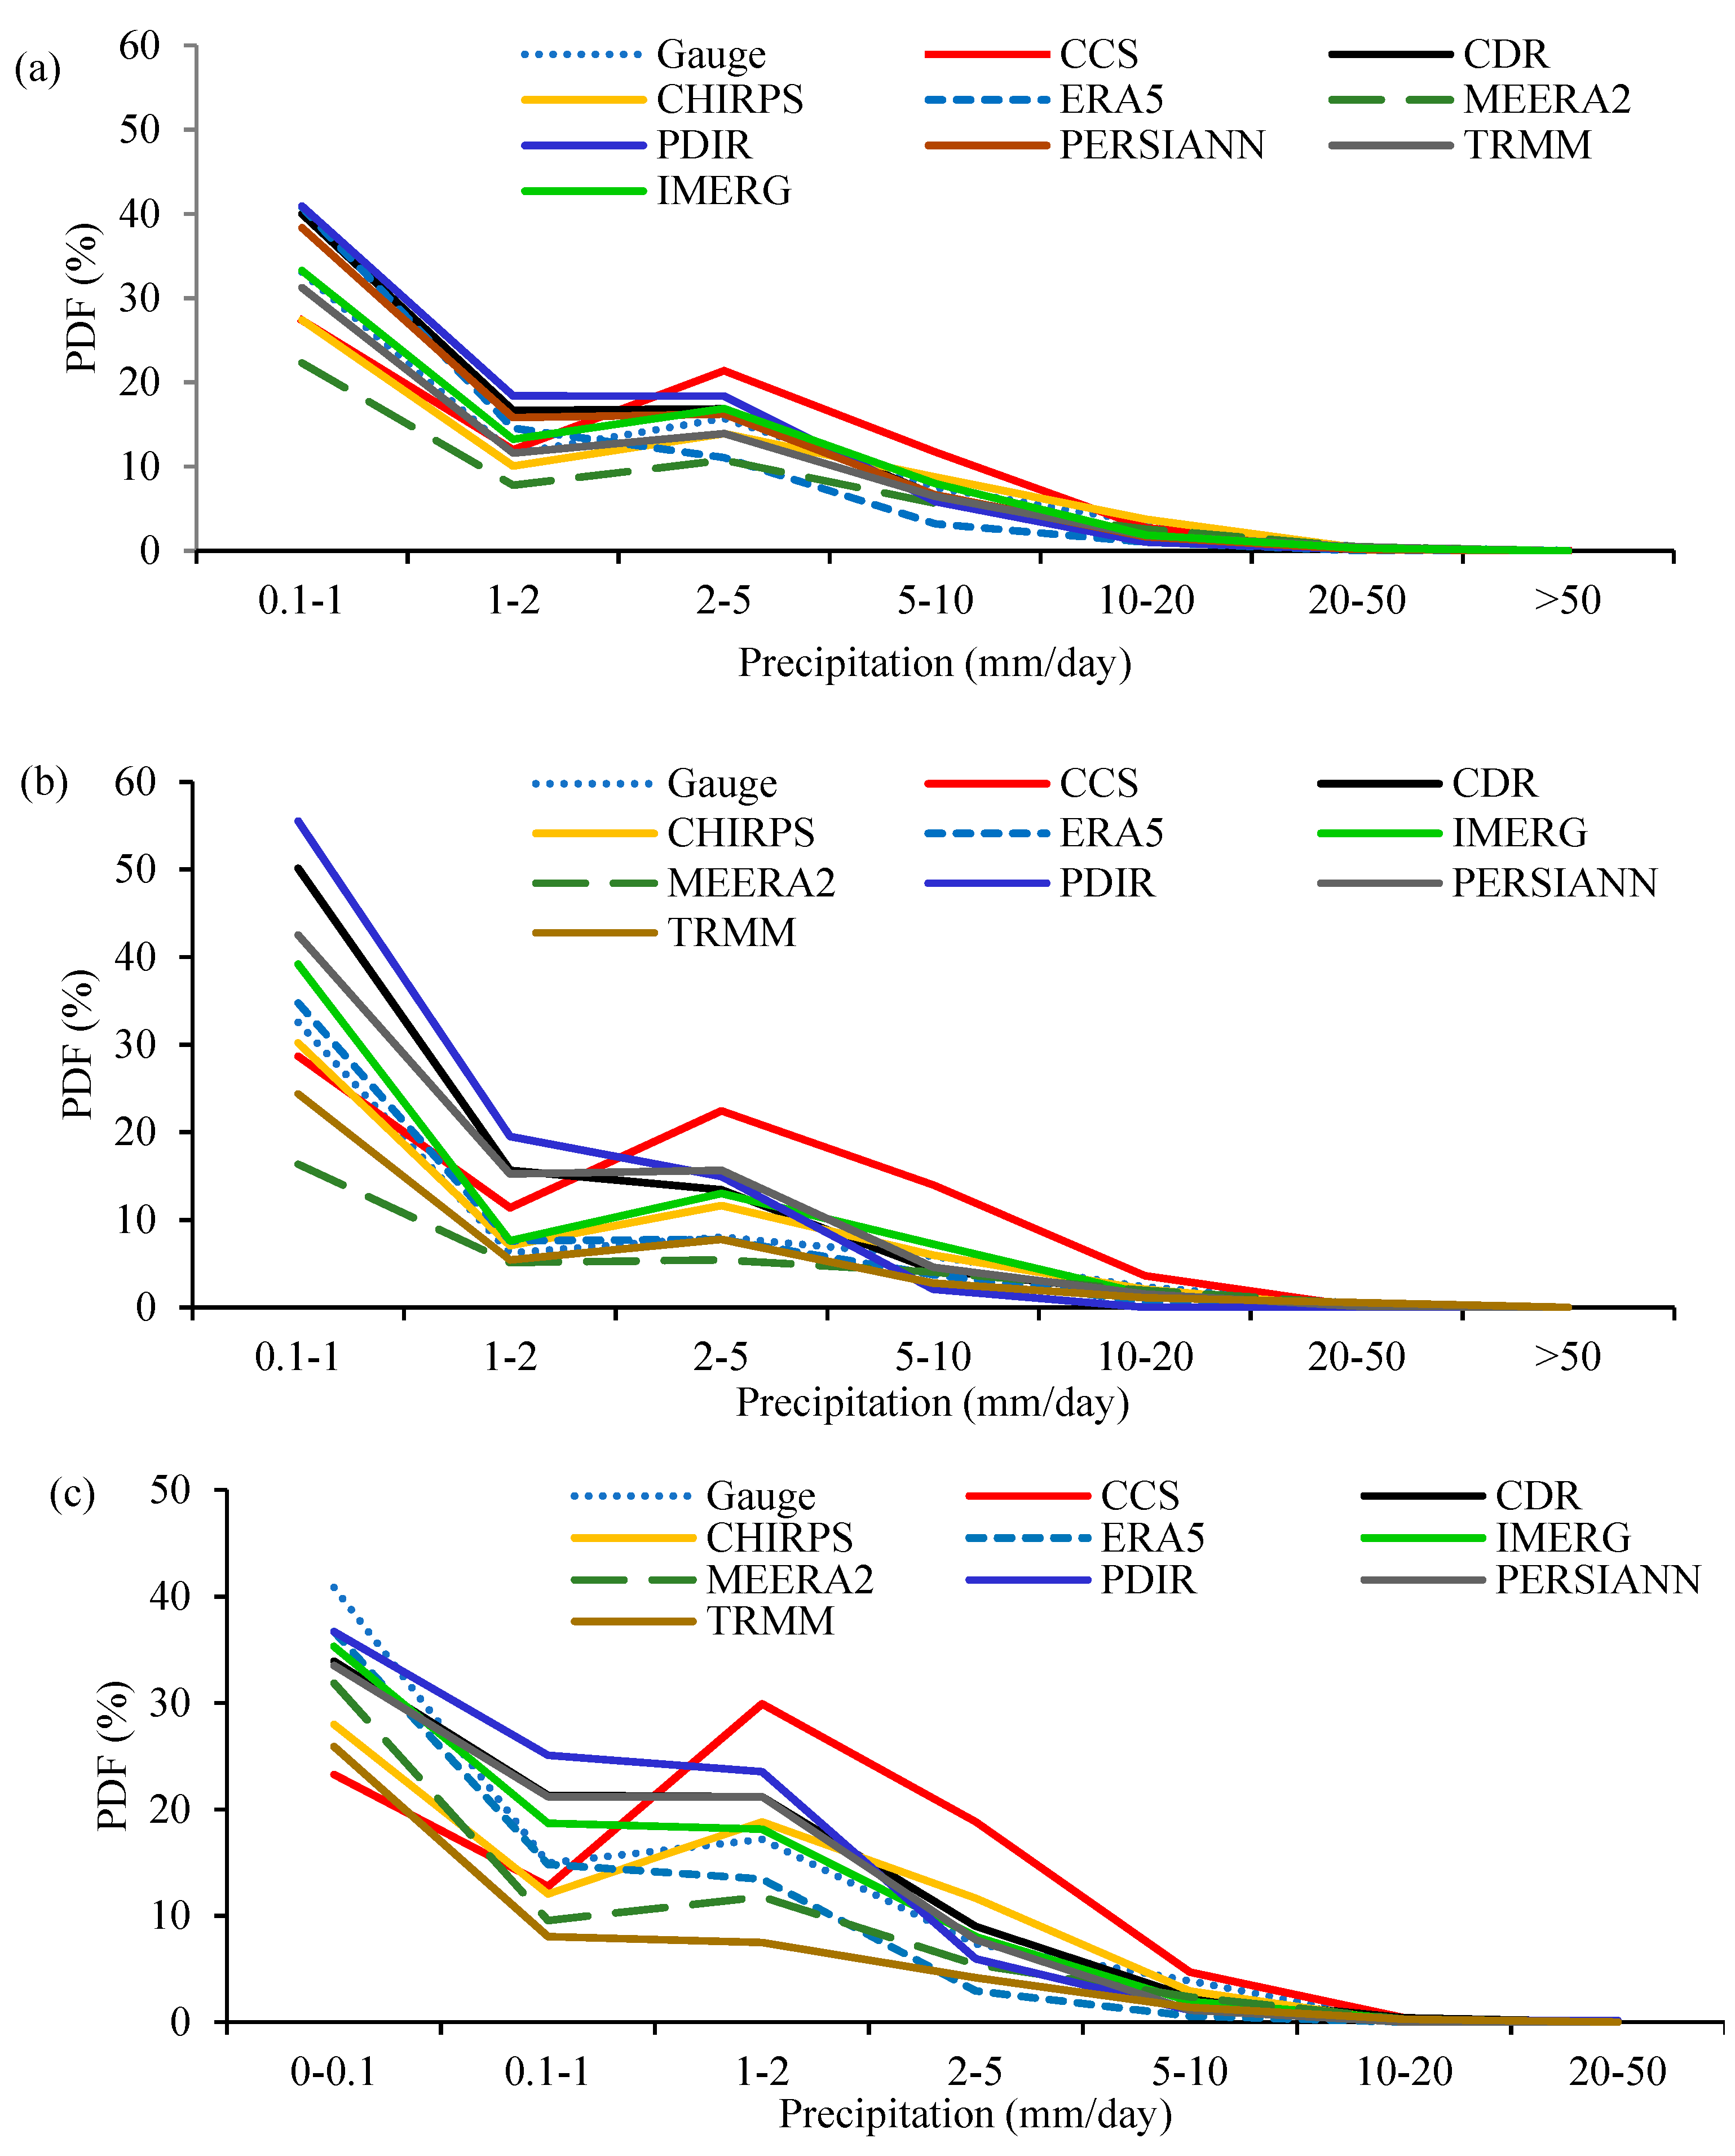
- The light precipitation events (<2 mm/day) events were at their most frequent (approximately 72% of all events) over the entire study duration, as indicated by the datasets of all sources. Generally, the IMERG and TRMM products revealed a better performance in tracking the precipitation events at different thresholds.
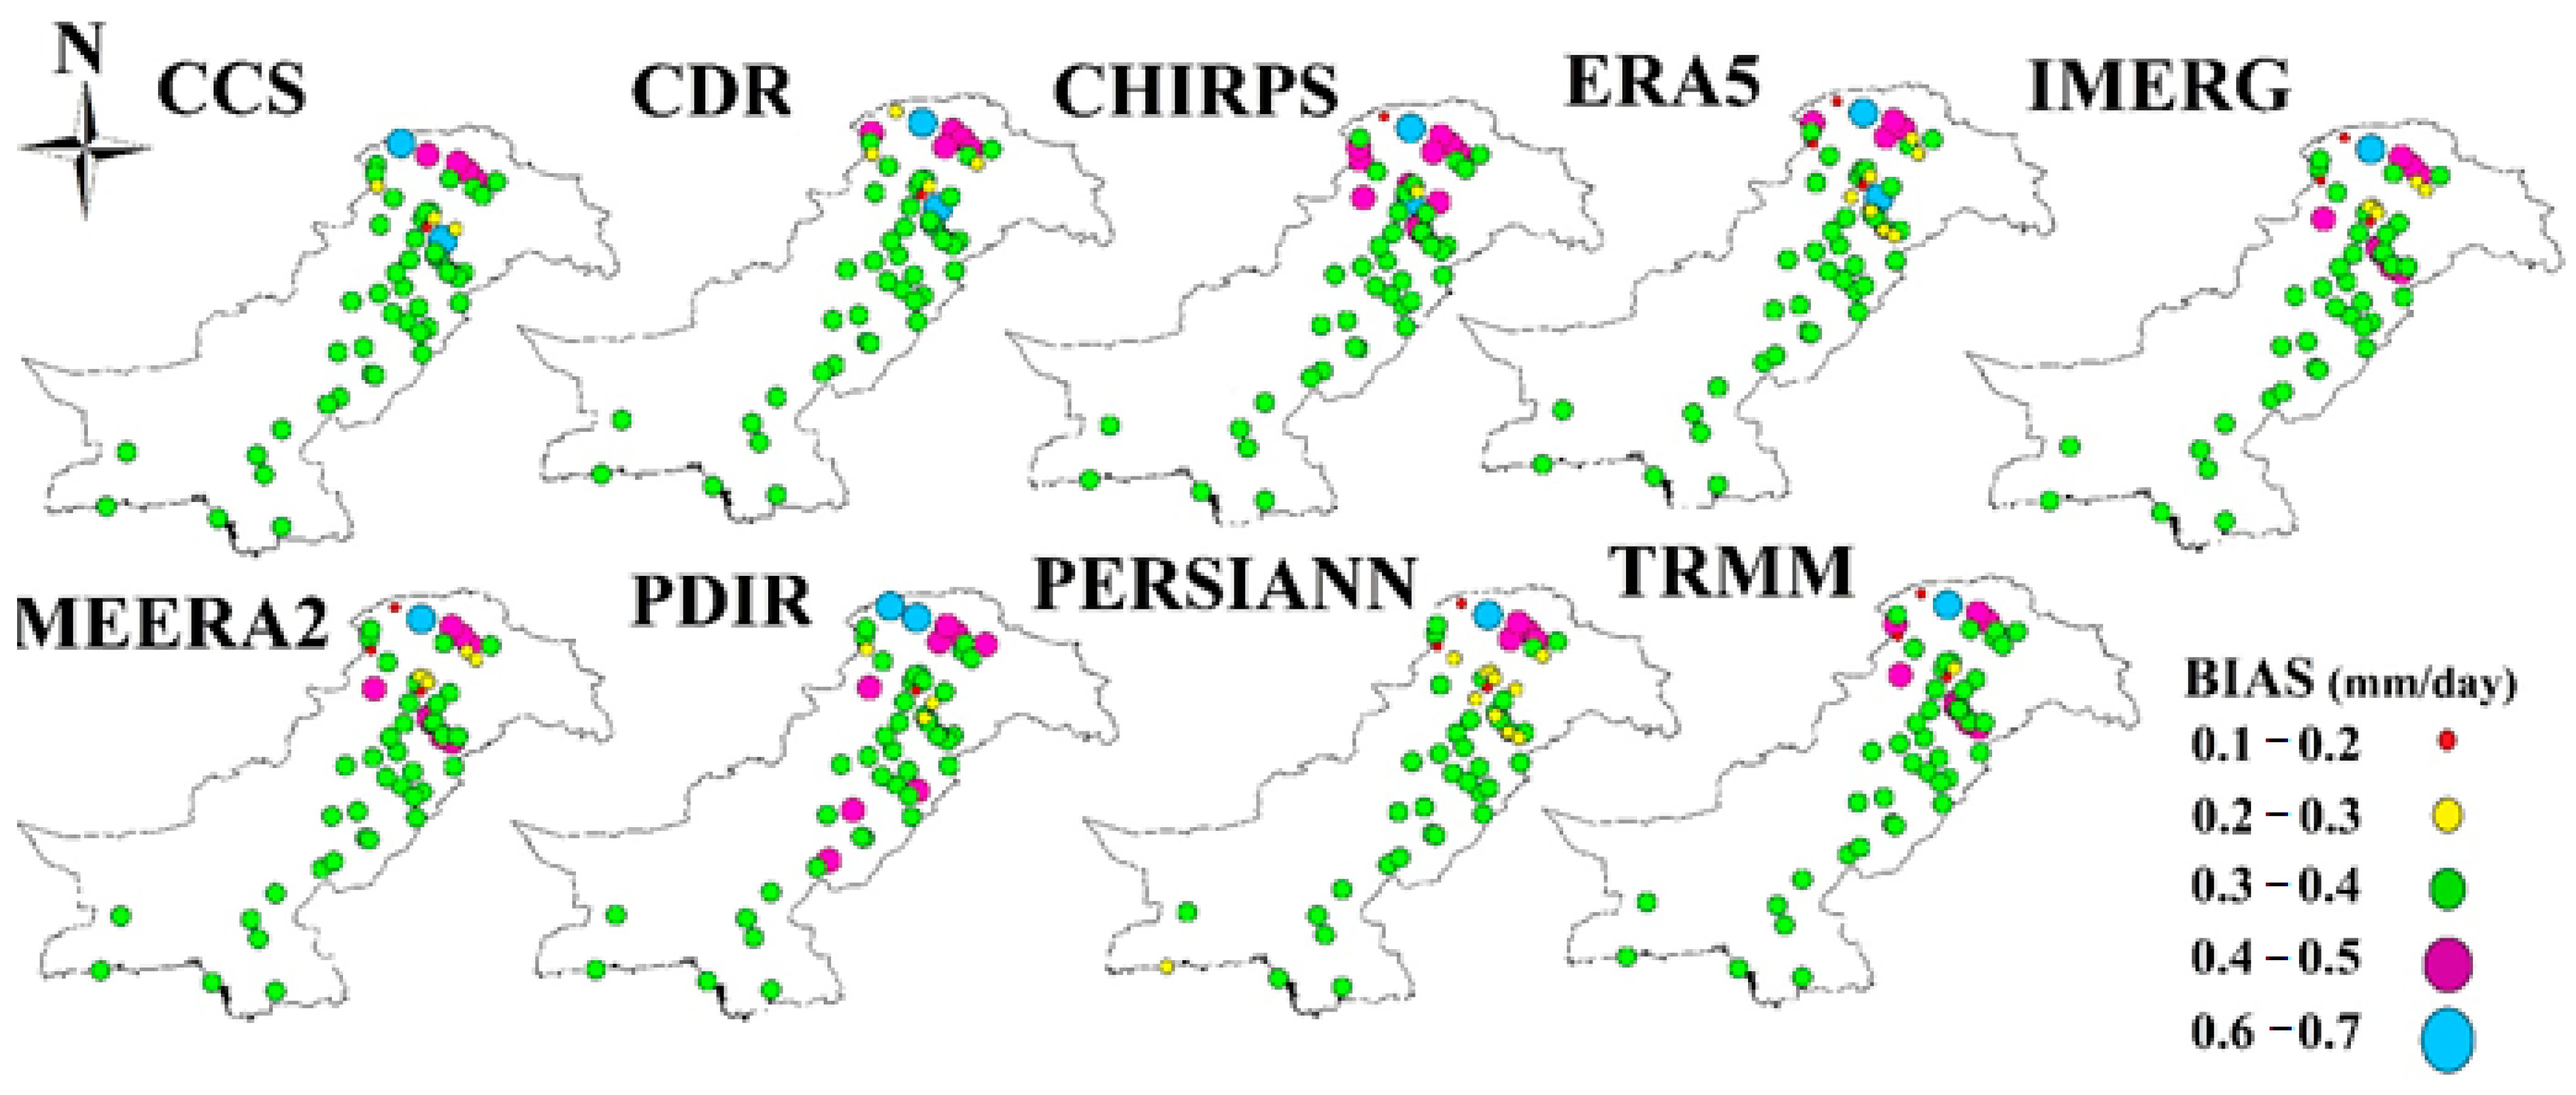
- Only the PERSIANN-CCS product showed significant overestimation ((17.47%) of observed daily precipitation amount—whereas PERSIANN, PDIR, TRMM, ERA5, and MEERA2 showed a significant underestimation of the daily precipitation amount (−11.5%, −12.5%, −15.5%, −40.5%, and −22.15%, respectively). The Bias of IMERG product on daily and monthly scales was with an acceptable range (±10%).
Author Contributions
Funding
Acknowledgments
Conflicts of Interest
References
- Qin, Y.; Chen, Z.; Shen, Y.; Zhang, S.; Shi, R. Evaluation of satellite rainfall estimates over the Chinese Mainland. Remote Sens. 2014, 6, 11649–11672. [Google Scholar] [CrossRef]
- Nadeem, M.U.; Waheed, Z.; Ghaffar, A.M.; Javaid, M.M.; Hamza, A.; Ayub, Z.; Nawaz, M.A.; Waseem, W.; Hameed, M.F.; Zeeshan, A.; et al. Application of HEC-HMS for flood forecasting in hazara catchment Pakistan, south Asia. Int. J. Hydrol. 2022, 6, 7–12. [Google Scholar] [CrossRef]
- Hashim, M.; Reba, N.M.; Nadzri, M.I.; Pour, A.B.; Mahmud, M.R.; Yusoff, A.M.R.M.; Ali, M.I.; Jaw, S.W.; Hossain, M.S. Satellite-based run-offmodel for monitoring drought in Peninsular Malaysia. Remote Sens. 2016, 8, 633. [Google Scholar] [CrossRef]
- Sharifi, E.; Steinacker, R.; Saghafian, B. Assessment of GPM-IMERG and other precipitation products against gauge data under different topographic and climatic conditions in Iran: Preliminary results. Remote Sens. 2016, 8, 135. [Google Scholar] [CrossRef]
- Salmani-Dehaghi, N.; Samani, N. Development of bias-correction PERSIANN-CDR models for the simulation and completion of precipitation time series. Atmos. Environ. 2021, 246, 117981. [Google Scholar] [CrossRef]
- Huffman, G.J.; Adler, R.F.; Bolvin, D.T.; Gu, G.; Nelkin, E.J.; Bowman, K.P.; Hong, Y.; Stocker, E.F.; Wolff, D.B. The TRMM Multisatellite Precipitation Analysis (TMPA): Quasi-global, multiyear, combined-sensor precipitation estimates at fine scales. J. Hydrometeorol. 2007, 8, 38–55. [Google Scholar] [CrossRef]
- Anjum, M.N.; Ahmad, I.; Ding, Y.; Shangguan, D.; Zaman, M.; Ijaz, M.W.; Sarwar, K.; Han, H.; Yang, M. Assessment of IMERG-V06 precipitation product over different hydro-climatic regimes in the Tianshan Mountains, North-Western China. Remote Sens. 2019, 11, 2314. [Google Scholar] [CrossRef]
- Anjum, M.N.; Ding, Y.; Shangguan, D.; Ijaz, M.W.; Zhang, S. Evaluation of High-Resolution Satellite-Based Real-Time and Post-Real-Time Precipitation Estimates during 2010 Extreme Flood Event in Swat River Basin, Hindukush Region. Adv. Meteorol. 2016, 2016, 2604980. [Google Scholar] [CrossRef]
- Paredes-Trejo, F.; Barbosa, H.; dos Santos, C.A.C. Evaluation of the performance of SM2RAIN-derived rainfall products over Brazil. Remote Sens. 2019, 11, 1113. [Google Scholar] [CrossRef]
- Lu, X.; Tang, G.; Liu, X.; Wang, X.; Liu, Y.; Wei, M. The potential and uncertainty of triple collocation in assessing satellite precipitation products in Central Asia. Atmos. Res. 2021, 252, 105452. [Google Scholar] [CrossRef]
- Abebe, S.A.; Qin, T.; Yan, D.; Gelaw, E.B.; Workneh, H.T.; Kun, W.; Shanshan, L.; Biqiong, D. Spatial and temporal evaluation of the latest high-resolution precipitation products over the upper blue nile river basin, ethiopia. Water 2020, 12, 3072. [Google Scholar] [CrossRef]
- Ur Rahman, K.; Shang, S.; Shahid, M.; Wen, Y. Hydrological evaluation of merged satellite precipitation datasets for streamflow simulation using SWAT: A case study of Potohar Plateau, Pakistan. J. Hydrol. 2020, 587, 125040. [Google Scholar] [CrossRef]
- Cattani, E.; Ferguglia, O.; Merino, A.; Levizzani, V. Precipitation Products’ Inter-Comparison over East and Southern Africa 1983–2017. Remote Sens. 2021, 13, 4419. [Google Scholar] [CrossRef]
- Dhanesh, Y.; Bindhu, V.M.; Senent-Aparicio, J.; Brighenti, T.M.; Ayana, E.; Smitha, P.S.; Fei, C.; Srinivasan, R. A comparative evaluation of the performance of CHIRPS and CFSR data for different climate zones using the SWAT model. Remote Sens. 2020, 12, 3088. [Google Scholar] [CrossRef]
- Pellarin, T.; Román-Cascón, C.; Baron, C.; Bindlish, R.; Brocca, L.; Camberlin, P.; Fernández-Prieto, D.; Kerr, Y.H.; Massari, C.; Panthou, G.; et al. The precipitation inferred from soil moisture (PrISM) near real-time rainfall product: Evaluation and comparison. Remote Sens. 2020, 12, 481. [Google Scholar] [CrossRef]
- Zubieta, R.; Getirana, A.; Espinoza, J.C.; Lavado-Casimiro, W.; Aragon, L. Hydrological modeling of the Peruvian-Ecuadorian Amazon basin using GPM-IMERG satellite-based precipitation dataset. Hydrol. Earth Syst. Sci. 2016, 21, 1–21. [Google Scholar] [CrossRef] [PubMed]
- Anjum, M.N.; Irfan, M.; Waseem, M.; Leta, M.K.; Niazi, U.M.; Rahman, S.; Ghanim, A.; Mukhtar, M.A.; Nadeem, M.U. Assessment of PERSIANN-CCS, PERSIANN-CDR, SM2RAIN-ASCAT, and CHIRPS-2.0 Rainfall Products over a Semi-Arid Subtropical Climatic Region. Water 2022, 14, 147. [Google Scholar] [CrossRef]
- Solakian, J.; Maggioni, V.; Godrej, A. Investigating the error propagation from satellite-based input precipitation to output water quality indicators simulated by a hydrologic model. Remote Sens. 2020, 12, 3728. [Google Scholar] [CrossRef]
- Sadeghi, M.; Nguyen, P.; Naeini, M.R.; Hsu, K.; Braithwaite, D.; Sorooshian, S. PERSIANN-CCS-CDR, a 3-hourly 0.04° global precipitation climate data record for heavy precipitation studies. Sci. Data 2021, 8, 1–11. [Google Scholar] [CrossRef]
- Nwachukwu, P.N.; Satge, F.; Yacoubi, S.E.; Pinel, S.; Bonnet, M.P. From trmm to GPM: How reliable are satellite-based precipitation data across Nigeria? Remote Sens. 2020, 12, 3964. [Google Scholar] [CrossRef]
- Mu, Y.; Biggs, T.; Shen, S.S.P. Satellite-based precipitation estimates using a dense rain gauge network over the Southwestern Brazilian Amazon: Implication for identifying trends in dry season rainfall. Atmos. Res. 2021, 261, 105741. [Google Scholar] [CrossRef]
- Amjad, M.; Yilmaz, M.T.; Yucel, I.; Yilmaz, K.K. Performance evaluation of satellite- and model-based precipitation products over varying climate and complex topography. J. Hydrol. 2020, 584, 124707. [Google Scholar] [CrossRef]
- Wild, A.; Chua, Z.W.; Kuleshov, Y. Evaluation of satellite precipitation estimates over the south west pacific region. Remote Sens. 2021, 13, 3929. [Google Scholar] [CrossRef]
- Zhang, L.; Xin, Z.; Zhou, H. Assessment of TMPA 3B42V7 and PERSIANN-CDR in driving hydrological modeling in a semi-humid watershed in northeastern China. Remote Sens. 2020, 12, 3133. [Google Scholar] [CrossRef]
- Raj, N.; Gharineiat, Z.; Ahmed, A.A.M.; Stepanyants, Y. Assessment and Prediction of Sea Level Trend in the South Pacific Region. Remote Sens. 2022, 14, 986. [Google Scholar] [CrossRef]
- Cheema, M.J.M.; Bastiaanssen, W.G.M. Local calibration of remotely sensed rainfall from the TRMM satellite for different periods and spatial scales in the Indus Basin. Int. J. Remote Sens. 2012, 33, 2603–2627. [Google Scholar] [CrossRef]
- Ur Rahman, K.; Shang, S.; Shahid, M.; Li, J. Developing an ensemble precipitation algorithm from satellite products and its topographical and seasonal evaluations over Pakistan. Remote Sens. 2018, 10, 1835. [Google Scholar] [CrossRef]
- Ullah, W.; Wang, G.; Ali, G.; Hagan, D.F.T.; Bhatti, A.S.; Lou, D. Comparing multiple precipitation products against in-situ observations over different climate regions of pakistan. Remote Sens. 2019, 11, 697. [Google Scholar] [CrossRef]
- “Hamza, A.; Anjum, M.N.; Cheema, M.J.M.; Chen, X.; Afzal, A.; Azam, M.; Shafi, M.K.; Gulakhmadov, A. Assessment of IMERG-V06, TRMM-3B42V7, SM2RAIN-ASCAT, and PERSIANN-CDR precipitation products over the hindu kush mountains of Pakistan, South Asia. Remote Sens. 2020, 12, 3871. [Google Scholar] [CrossRef]
- Nadeem, M.U.; Anjum, M.N.; Afzal, A.; Azam, M.; Hussain, F.; Usman, M.; Javaid, M.M.; Mukhtar, M.A.; Majeed, F. Assessment of Multi-Satellite Precipitation Products over the Himalayan Mountains of Pakistan, South Asia. Sustainability 2022, 14, 8490. [Google Scholar] [CrossRef]
- Anjum, M.N.; Ding, Y.; Shangguan, D.; Ahmad, I.; Ijaz, M.W.; Farid, H.U.; Yagoub, Y.E.; Zaman, M.; Adnan, M. Performance evaluation of latest integrated multi-satellite retrievals for Global Precipitation Measurement (IMERG) over the northern highlands of Pakistan. Atmos. Res. 2018, 205, 134–146. [Google Scholar] [CrossRef]
- Hussain, S.; Song, X.; Ren, G.; Hussain, I.; Han, D.; Zaman, M.H. Evaluation of gridded precipitation data in the Hindu Kush–Karakoram–Himalaya mountainous area. Hydrol. Sci. J. 2017, 62, 2393–2405. [Google Scholar] [CrossRef]
- Ali, A.F.; Xiao, C.; Anjum, M.N.; Adnan, M.; Nawaz, Z.; Ijaz, M.W.; Sajid, M.; Farid, H.U. Evaluation and comparison of TRMM multi-satellite precipitation products with reference to rain gauge observations in Hunza River basin, Karakoram Range, northern Pakistan. Sustainability 2017, 9, 1954. [Google Scholar] [CrossRef]
- Zhang, L.; Li, X.; Cao, Y.; Nan, Z.; Wang, W.; Ge, Y.; Wang, P.; Yu, W. Evaluation and integration of the top-down and bottom-up satellite precipitation products over mainland China. J. Hydrol. 2020, 581, 124456. [Google Scholar] [CrossRef]
- Amorim, J.d.S.; Viola, M.R.; Junqueira, R.; de Oliveira, V.A.; de Mello, C.R. Evaluation of satellite precipitation products for hydrological modeling in the brazilian cerrado biome. Water 2020, 12, 2571. [Google Scholar] [CrossRef]
- Tahir, A.A.; Chevallier, P.; Arnaud, Y.; Ahmad, B. Snow cover dynamics and hydrological regime of the Hunza River basin, Karakoram Range, Northern Pakistan. Hydrol. Earth Syst. Sci. 2011, 15, 2275–2290. [Google Scholar] [CrossRef]
- Yang, M.; Li, Z.; Anjum, M.N.; Gao, Y. Performance evaluation of version 5 (V05) of Integrated Multi-satellite Retrievals for Global Precipitation Measurement (IMERG) over the Tianshan Mountains of China. Water 2019, 11, 1139. [Google Scholar] [CrossRef]
- Derin, Y.; Anagnostou, E.; Berne, A.; Borga, M.; Boudevillain, B.; Buytaert, W.; Chang, C.H.; Chen, H.; Delrieu, G.; Hsu, Y.C.; et al. Evaluation of GPM-era Global Satellite Precipitation Products over Multiple Complex Terrain Regions. Remote Sens. 2019, 11, 2936. [Google Scholar] [CrossRef]
- Keikhosravi-Kiany, M.S.; Masoodian, S.A.; Balling, R.C.; Darand, M. Evaluation of Tropical Rainfall Measuring Mission, Integrated Multi-satellite Retrievals for GPM, Climate Hazards Centre InfraRed Precipitation with Station data, and European Centre for Medium-Range Weather Forecasts Reanalysis v5 data in estimating prec. Int. J. Climatol. 2022, 42, 2039–2064. [Google Scholar] [CrossRef]
- Anjum, M.N.; Ding, Y.; Shangguan, D.; Tahir, A.A.; Iqbal, M.; Adnan, M. Comparison of two successive versions 6 and 7 of TMPA satellite precipitation products with rain gauge data over Swat Watershed, Hindukush Mountains, Pakistan. Atmos. Sci. Lett. 2016, 17, 270–279. [Google Scholar] [CrossRef] [Green Version]


| Serial Number | Station | Lat | Long | Altitude (m) | Average Precipitation (mm) |
|---|---|---|---|---|---|
| 1 | Astore | 35.37 | 74.90 | 2168.0 | 420 |
| 2 | Balakot | 34.38 | 73.35 | 981.0 | 1302 |
| 3 | Bunji | 35.67 | 74.63 | 1470.0 | 178 |
| 4 | Burzil | 34.91 | 75.09 | 4030.0 | 749 |
| 5 | Chillas | 35.42 | 74.10 | 1251.0 | 277 |
| 6 | Chitral | 35.85 | 71.83 | 1500.0 | 432 |
| 7 | Dir | 35.20 | 71.85 | 1370.0 | 1303 |
| 8 | Drosh | 35.57 | 71.78 | 1465.0 | 510 |
| 9 | G-Dopata | 34.20 | 73.60 | 813.5 | 1359 |
| 10 | Gilgit | 35.92 | 74.33 | 1457.2 | 168 |
| 11 | Gupis | 36.17 | 73.40 | 2156.0 | 174 |
| 12 | Jhelum | 32.93 | 73.73 | 287.2 | 834 |
| 13 | Kakul | 34.18 | 73.25 | 1309.0 | 1288 |
| 14 | Khot | 36.52 | 72.58 | 3505.0 | 610 |
| 15 | Kotli | 33.52 | 73.89 | 614.0 | 1233 |
| 16 | Mangla | 33.13 | 73.63 | 305.0 | 943 |
| 17 | Murree | 33.92 | 73.38 | 2127.0 | 1627 |
| 18 | Muzaffarabad | 34.40 | 73.50 | 702.0 | 1384 |
| 19 | Peshawar | 34.00 | 71.93 | 327 | 488 |
| 20 | Ratu | 35.15 | 74.81 | 2920.0 | 662 |
| 21 | RawlaKot | 33.87 | 74.27 | 1677.0 | 1219 |
| 22 | Skardu | 35.34 | 75.54 | 2316.5 | 243 |
| 23 | S-Sharif | 34.82 | 72.35 | 970.0 | 986 |
| 24 | PBO. Nawabshah | 26.25 | 68.36 | 37 | 219 |
| 25 | PBO. Panjgur | 26.96 | 64.1 | 968 | 76 |
| 26 | PBO. Pasni | 25.26 | 63.48 | 9 | 223 |
| 27 | M.O. Badin | 24.63 | 68.9 | 9 | 255 |
| 28 | Padidan | 26.85 | 68.13 | 46 | 122 |
| 29 | Rohri | 27.66 | 68.9 | 66 | 110 |
| 30 | Hydrabad | 25.38 | 61.8 | 28 | 90 |
| 31 | JACOBABAD | 28.3 | 68.46 | 55 | 192 |
| 32 | Karachi Airport | 24.9 | 66.93 | 22 | 138 |
| 33 | NawabShAh | 26.25 | 68.36 | 37 | 170 |
| 34 | Larkana | 27.53 | 68.23 | 52.7 | 116 |
| 35 | Rohri2 | 27.66 | 68.9 | 66 | 84 |
| 36 | Bahawal Nagar | 30 | 73.24 | 307 | 321 |
| 37 | Bahawal Pur | 29.33 | 71.783 | 110 | 188 |
| 38 | Bahawal Pur(A/P) | 29.383 | 71.683 | 119 | 213 |
| 39 | Bhakkar | 31.616 | 71.06 | 162 | 366 |
| 40 | Noorpur Thal | 31.866 | 71.9 | 186 | 558 |
| 41 | Jauharabad | 32.5 | 72.43 | 187 | 461 |
| 42 | Faisalabad | 31.43 | 73.13 | 186 | 446 |
| 43 | Jhelum2 | 32.93 | 73.73 | 287 | 855 |
| 44 | Khanpur | 28.65 | 70.683 | 88 | 254 |
| 45 | Lahore A.P. | 31.583 | 74.4 | 216 | 812 |
| 46 | Multan | 30.2 | 71.43 | 122 | 257 |
| 47 | Mandi Bahauddin | 32.96 | 73.8 | 253 | 779 |
| 48 | Sialkot | 32.516 | 74.53 | 255 | 1025 |
| 49 | Sialkot Airport | 32.53 | 74.03 | 240 | 933 |
| 50 | Sargodha | 32.05 | 72.66 | 187 | 545 |
| 51 | Toba Tek Singh | 30.983 | 72.783 | 155 | 363 |
| 52 | D.G. Khan | 30.05 | 70.63 | 148 | 251 |
| 53 | Jhang | 31.26 | 72.316 | 158 | 405 |
| 54 | Mangla2 | 33.06 | 73.63 | 283 | 943 |
| 55 | Sahiwal | 30.65 | 73.16 | 172 | 350 |
| 56 | Chakwal | 32.916 | 72.85 | 519 | 669 |
| 57 | Gujranwala | 32.36 | 74.35 | 227 | 858 |
| 58 | Okara | 30.8 | 73.43 | 180 | 421 |
| 59 | Rahim Yar Khan | 28.43 | 70.316 | 83 | 157 |
| 60 | Gujrat | 32.56 | 74.06 | 240 | 793 |
| 61 | Rawalpindi | 33.56 | 73.02 | 1271 | 1308 |
Publisher’s Note: MDPI stays neutral with regard to jurisdictional claims in published maps and institutional affiliations. |
© 2022 by the authors. Licensee MDPI, Basel, Switzerland. This article is an open access article distributed under the terms and conditions of the Creative Commons Attribution (CC BY) license (https://creativecommons.org/licenses/by/4.0/).
Share and Cite
Nadeem, M.U.; Ghanim, A.A.J.; Anjum, M.N.; Shangguan, D.; Rasool, G.; Irfan, M.; Niazi, U.M.; Hassan, S. Multiscale Ground Validation of Satellite and Reanalysis Precipitation Products over Diverse Climatic and Topographic Conditions. Remote Sens. 2022, 14, 4680. https://doi.org/10.3390/rs14184680
Nadeem MU, Ghanim AAJ, Anjum MN, Shangguan D, Rasool G, Irfan M, Niazi UM, Hassan S. Multiscale Ground Validation of Satellite and Reanalysis Precipitation Products over Diverse Climatic and Topographic Conditions. Remote Sensing. 2022; 14(18):4680. https://doi.org/10.3390/rs14184680
Chicago/Turabian StyleNadeem, Muhammad Umer, Abdulnoor A. J. Ghanim, Muhammad Naveed Anjum, Donghui Shangguan, Ghulam Rasool, Muhammad Irfan, Usama Muhammad Niazi, and Sharjeel Hassan. 2022. "Multiscale Ground Validation of Satellite and Reanalysis Precipitation Products over Diverse Climatic and Topographic Conditions" Remote Sensing 14, no. 18: 4680. https://doi.org/10.3390/rs14184680