
Large-Scale Monitoring of Glacier Surges by Integrating High-Temporal- and -Spatial-Resolution Satellite Observations: A Case Study in the Karakoram

Abstract
:1. Introduction
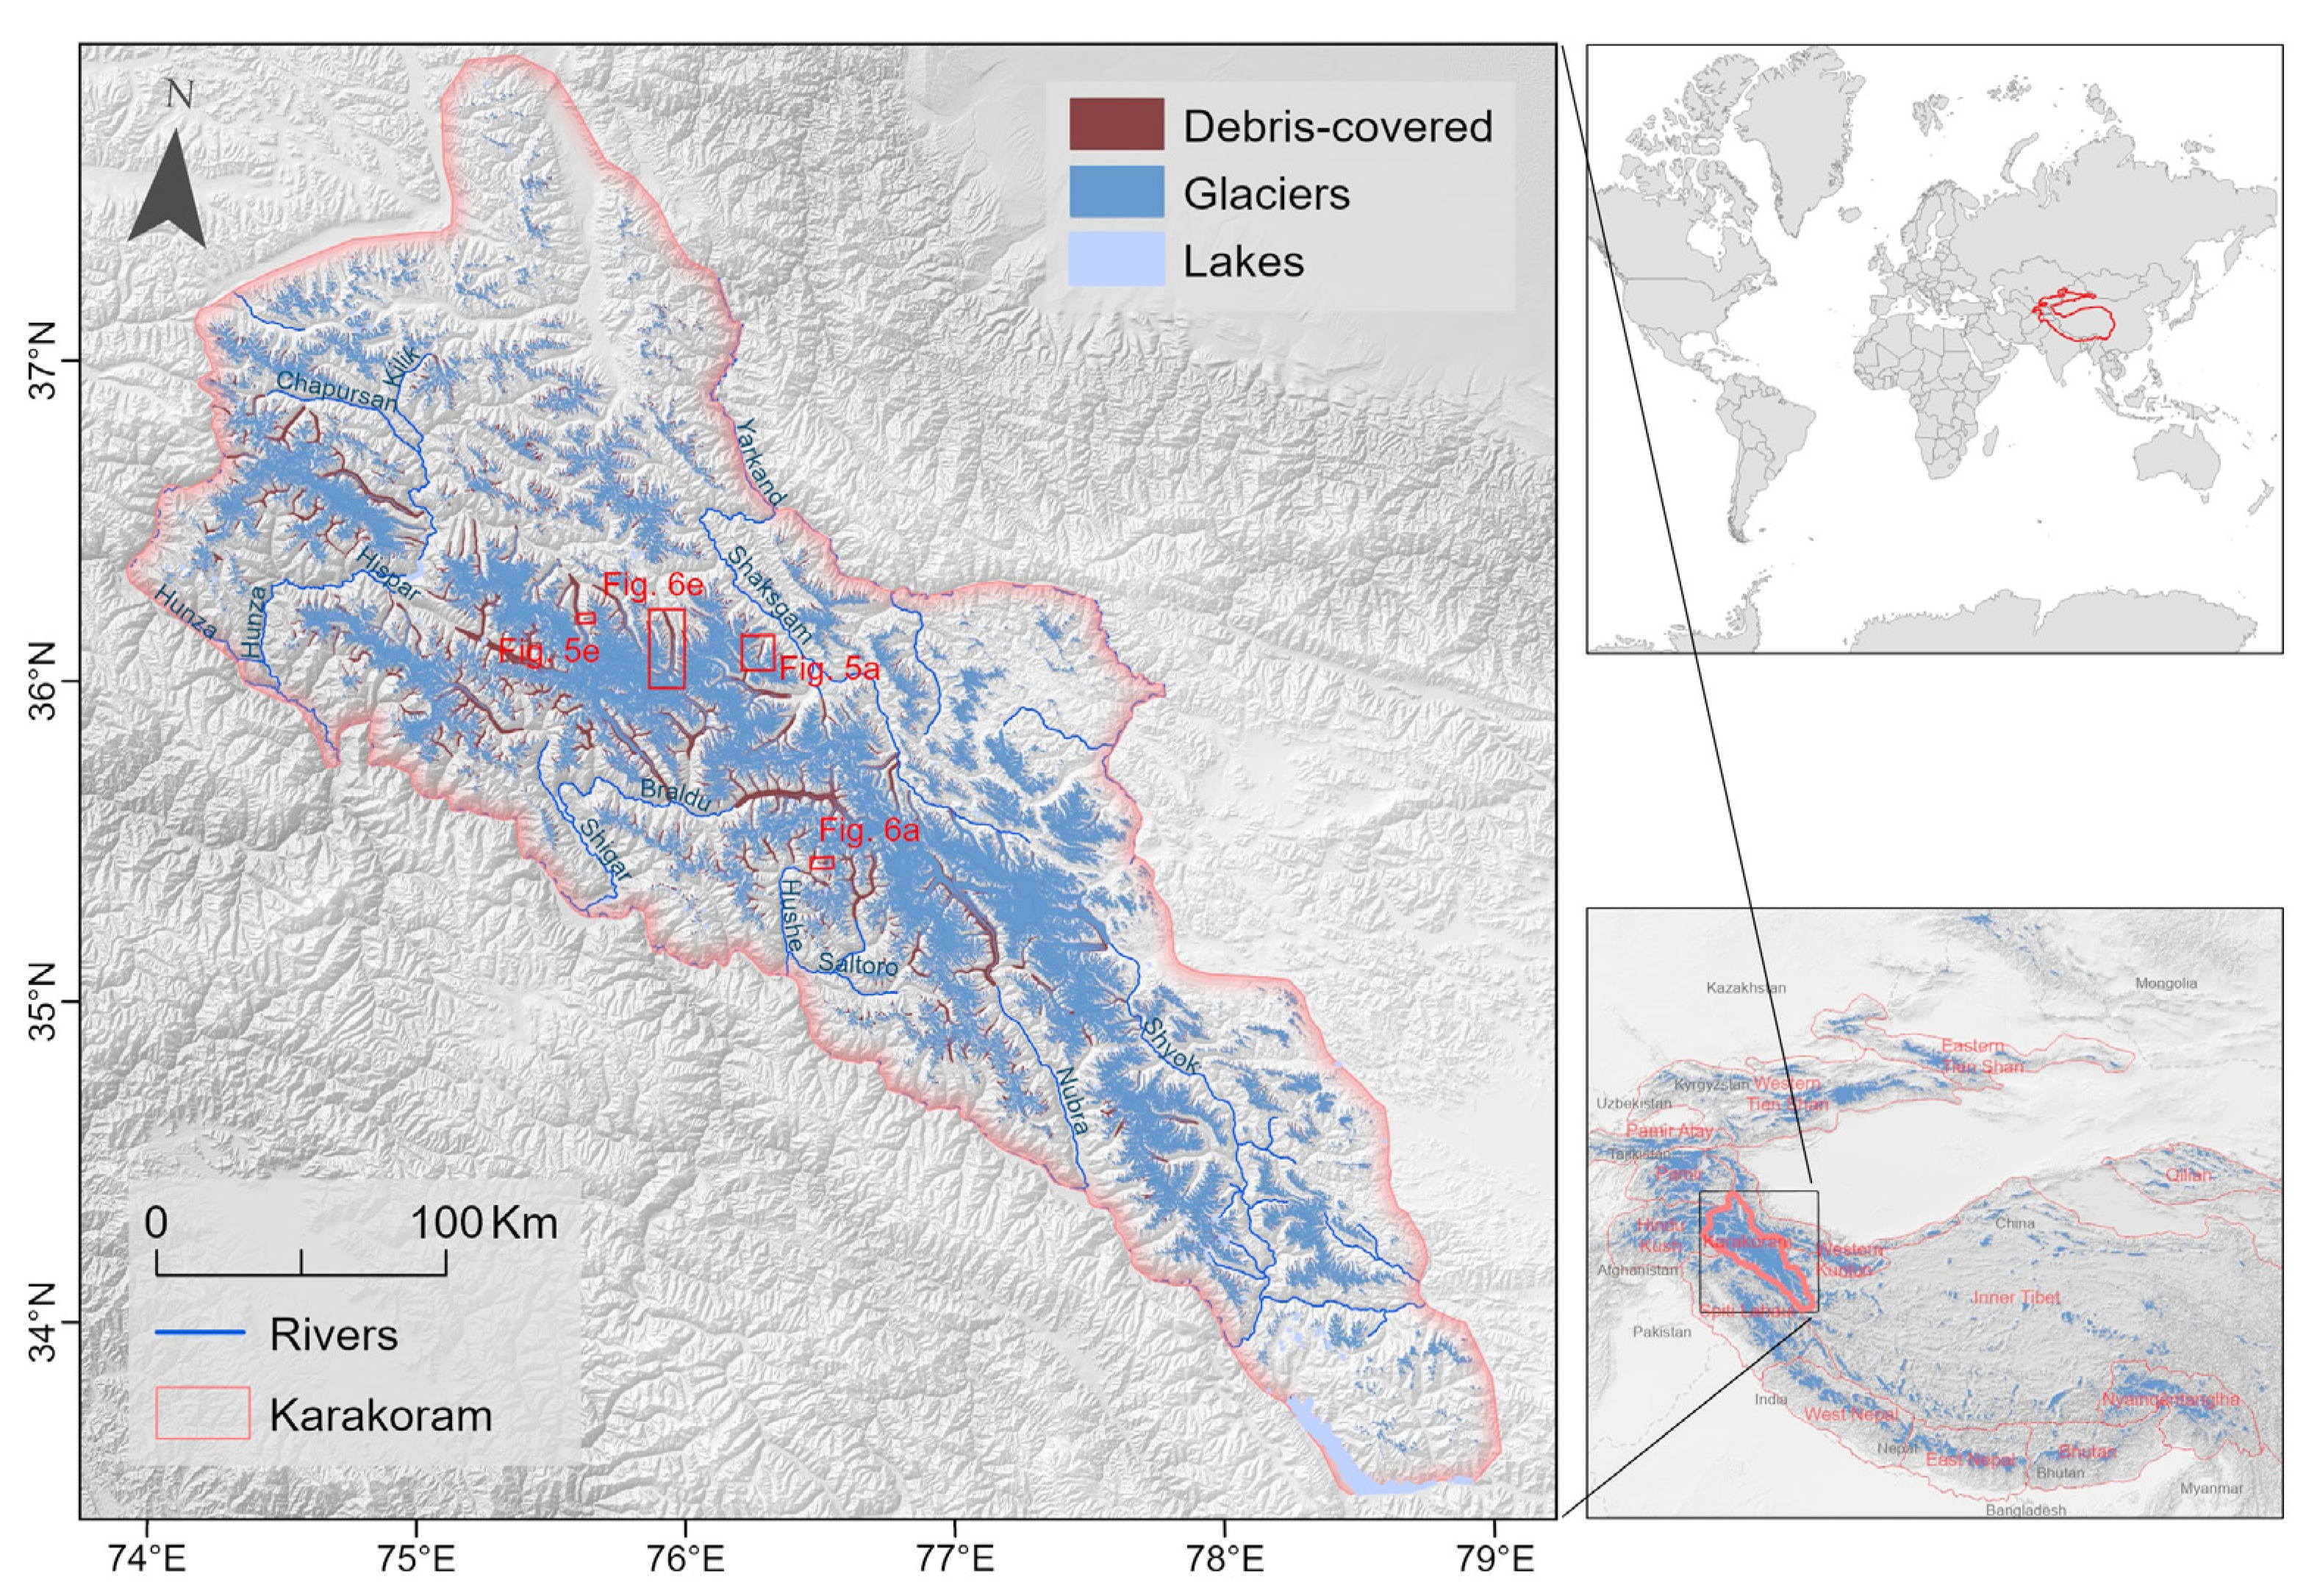
2. Study Area
3. Materials and Methods
3.1. Materials
3.2. Methods
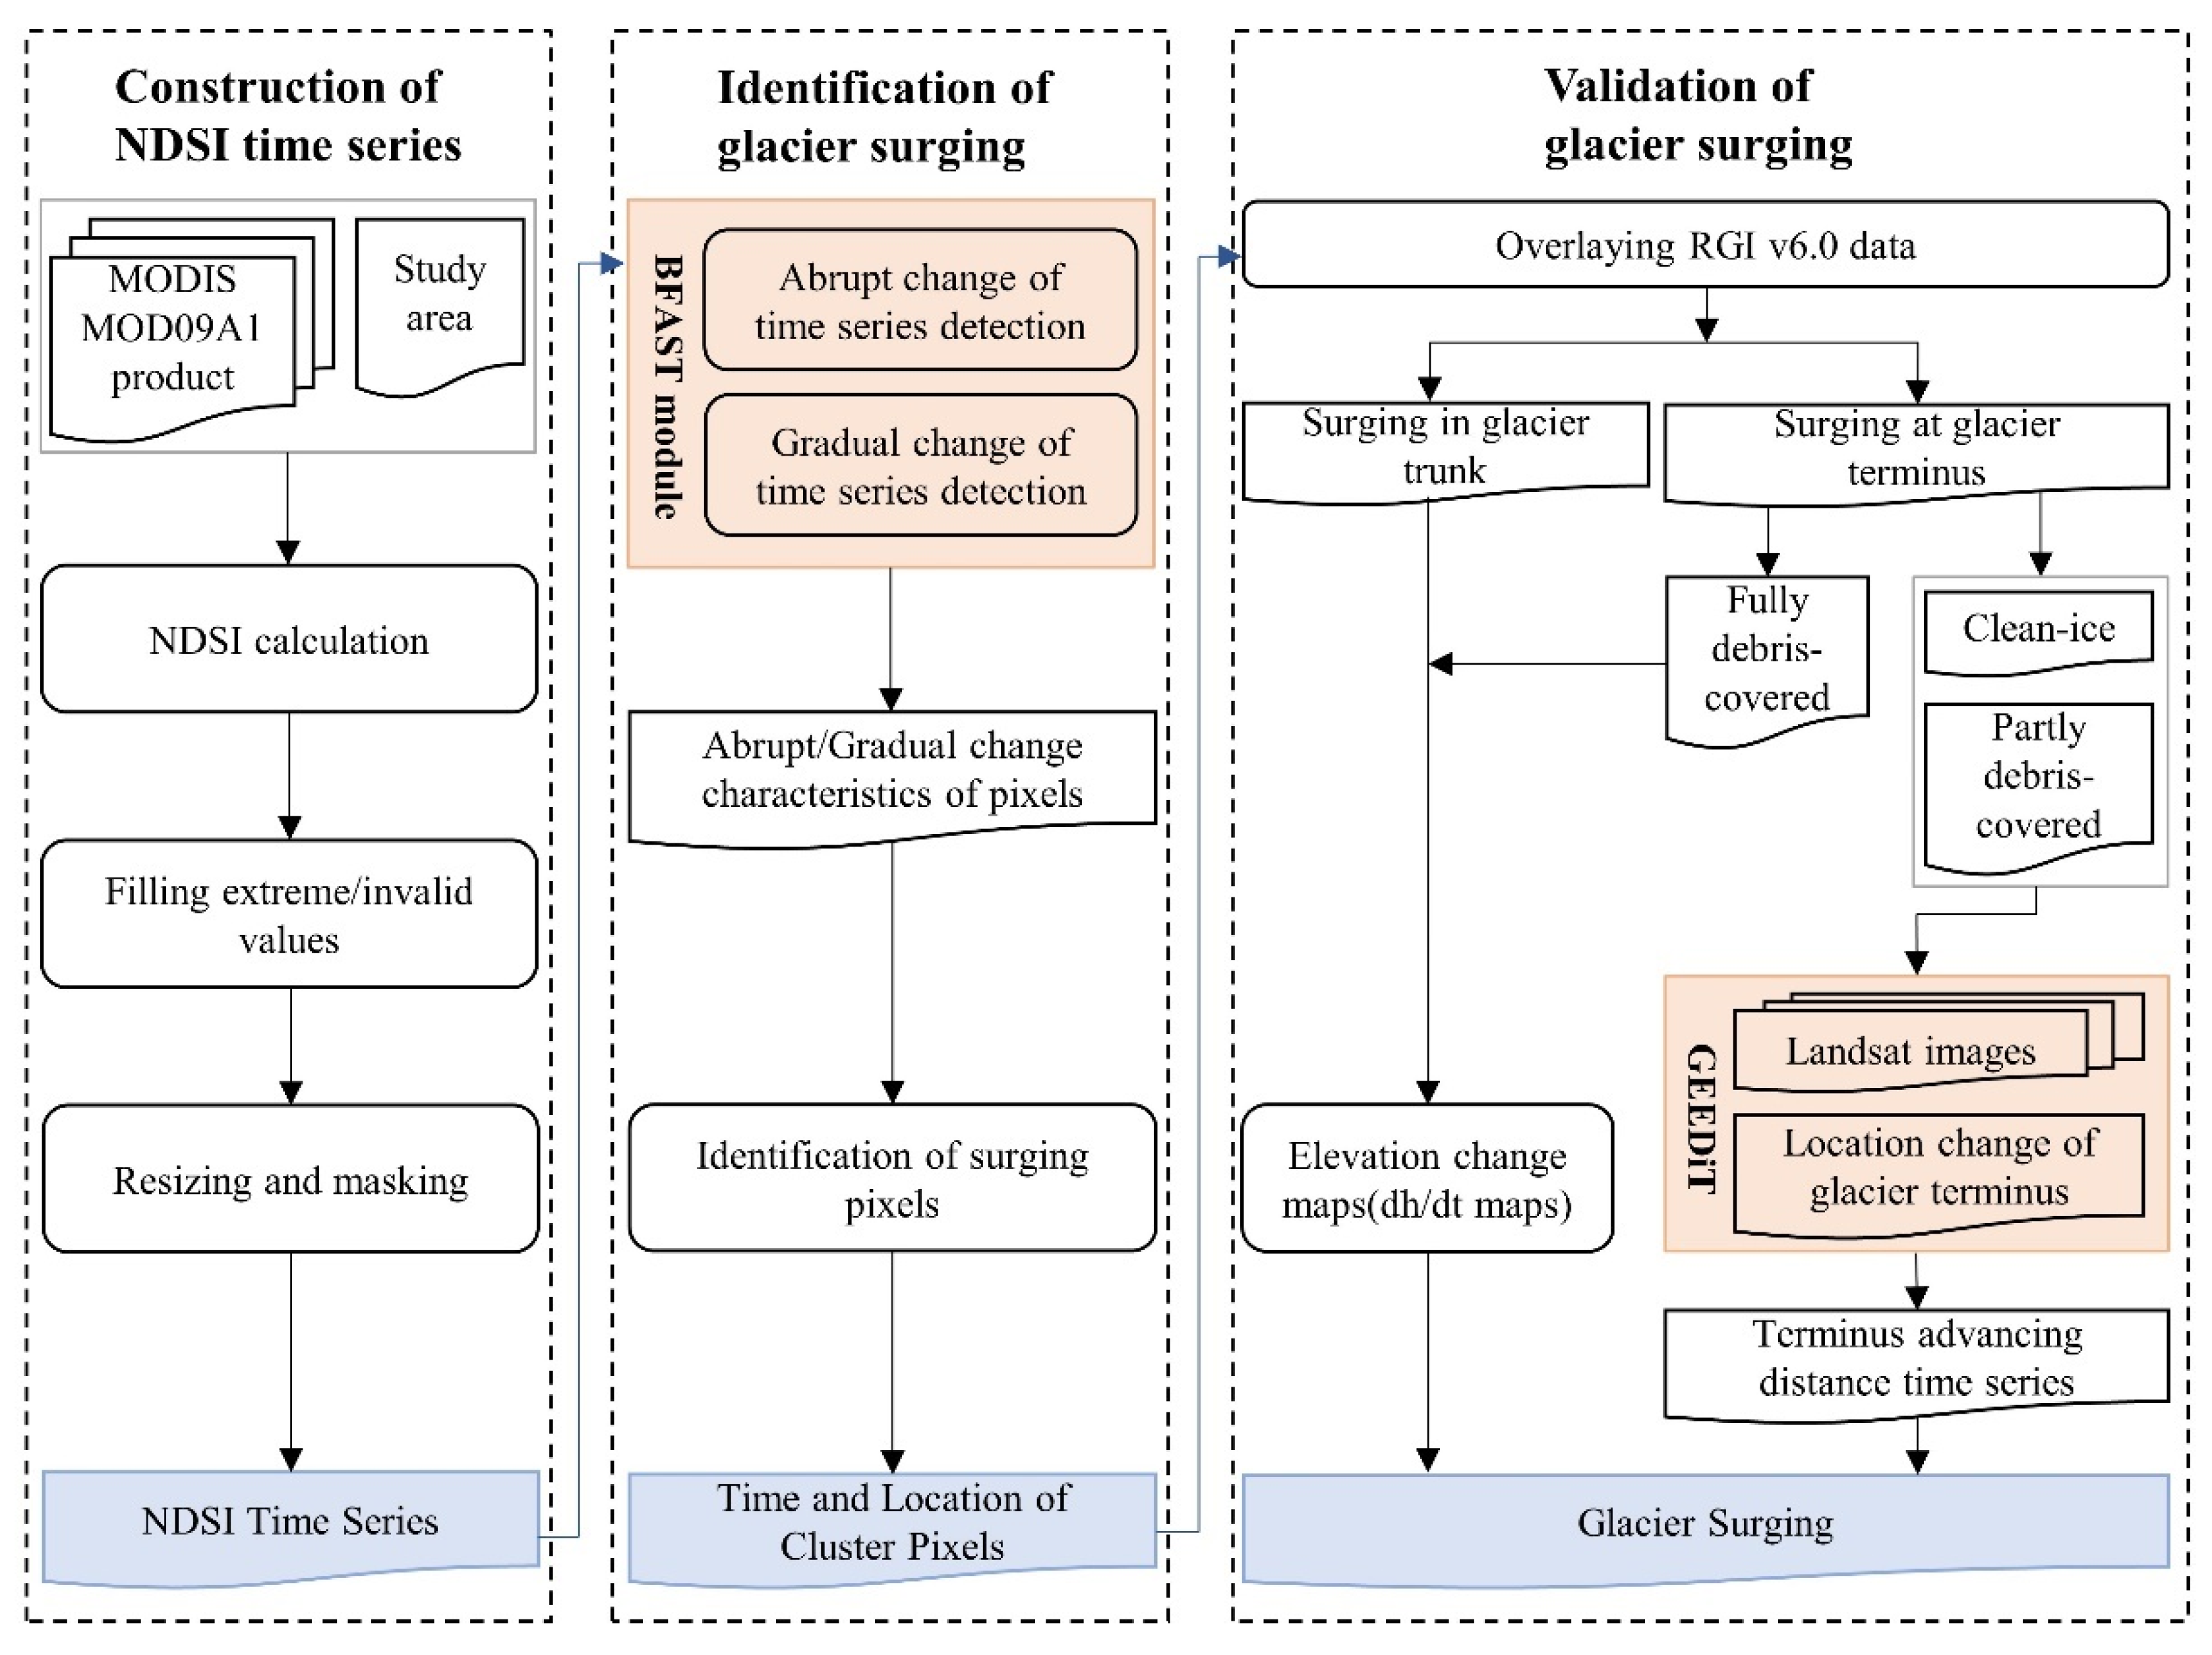
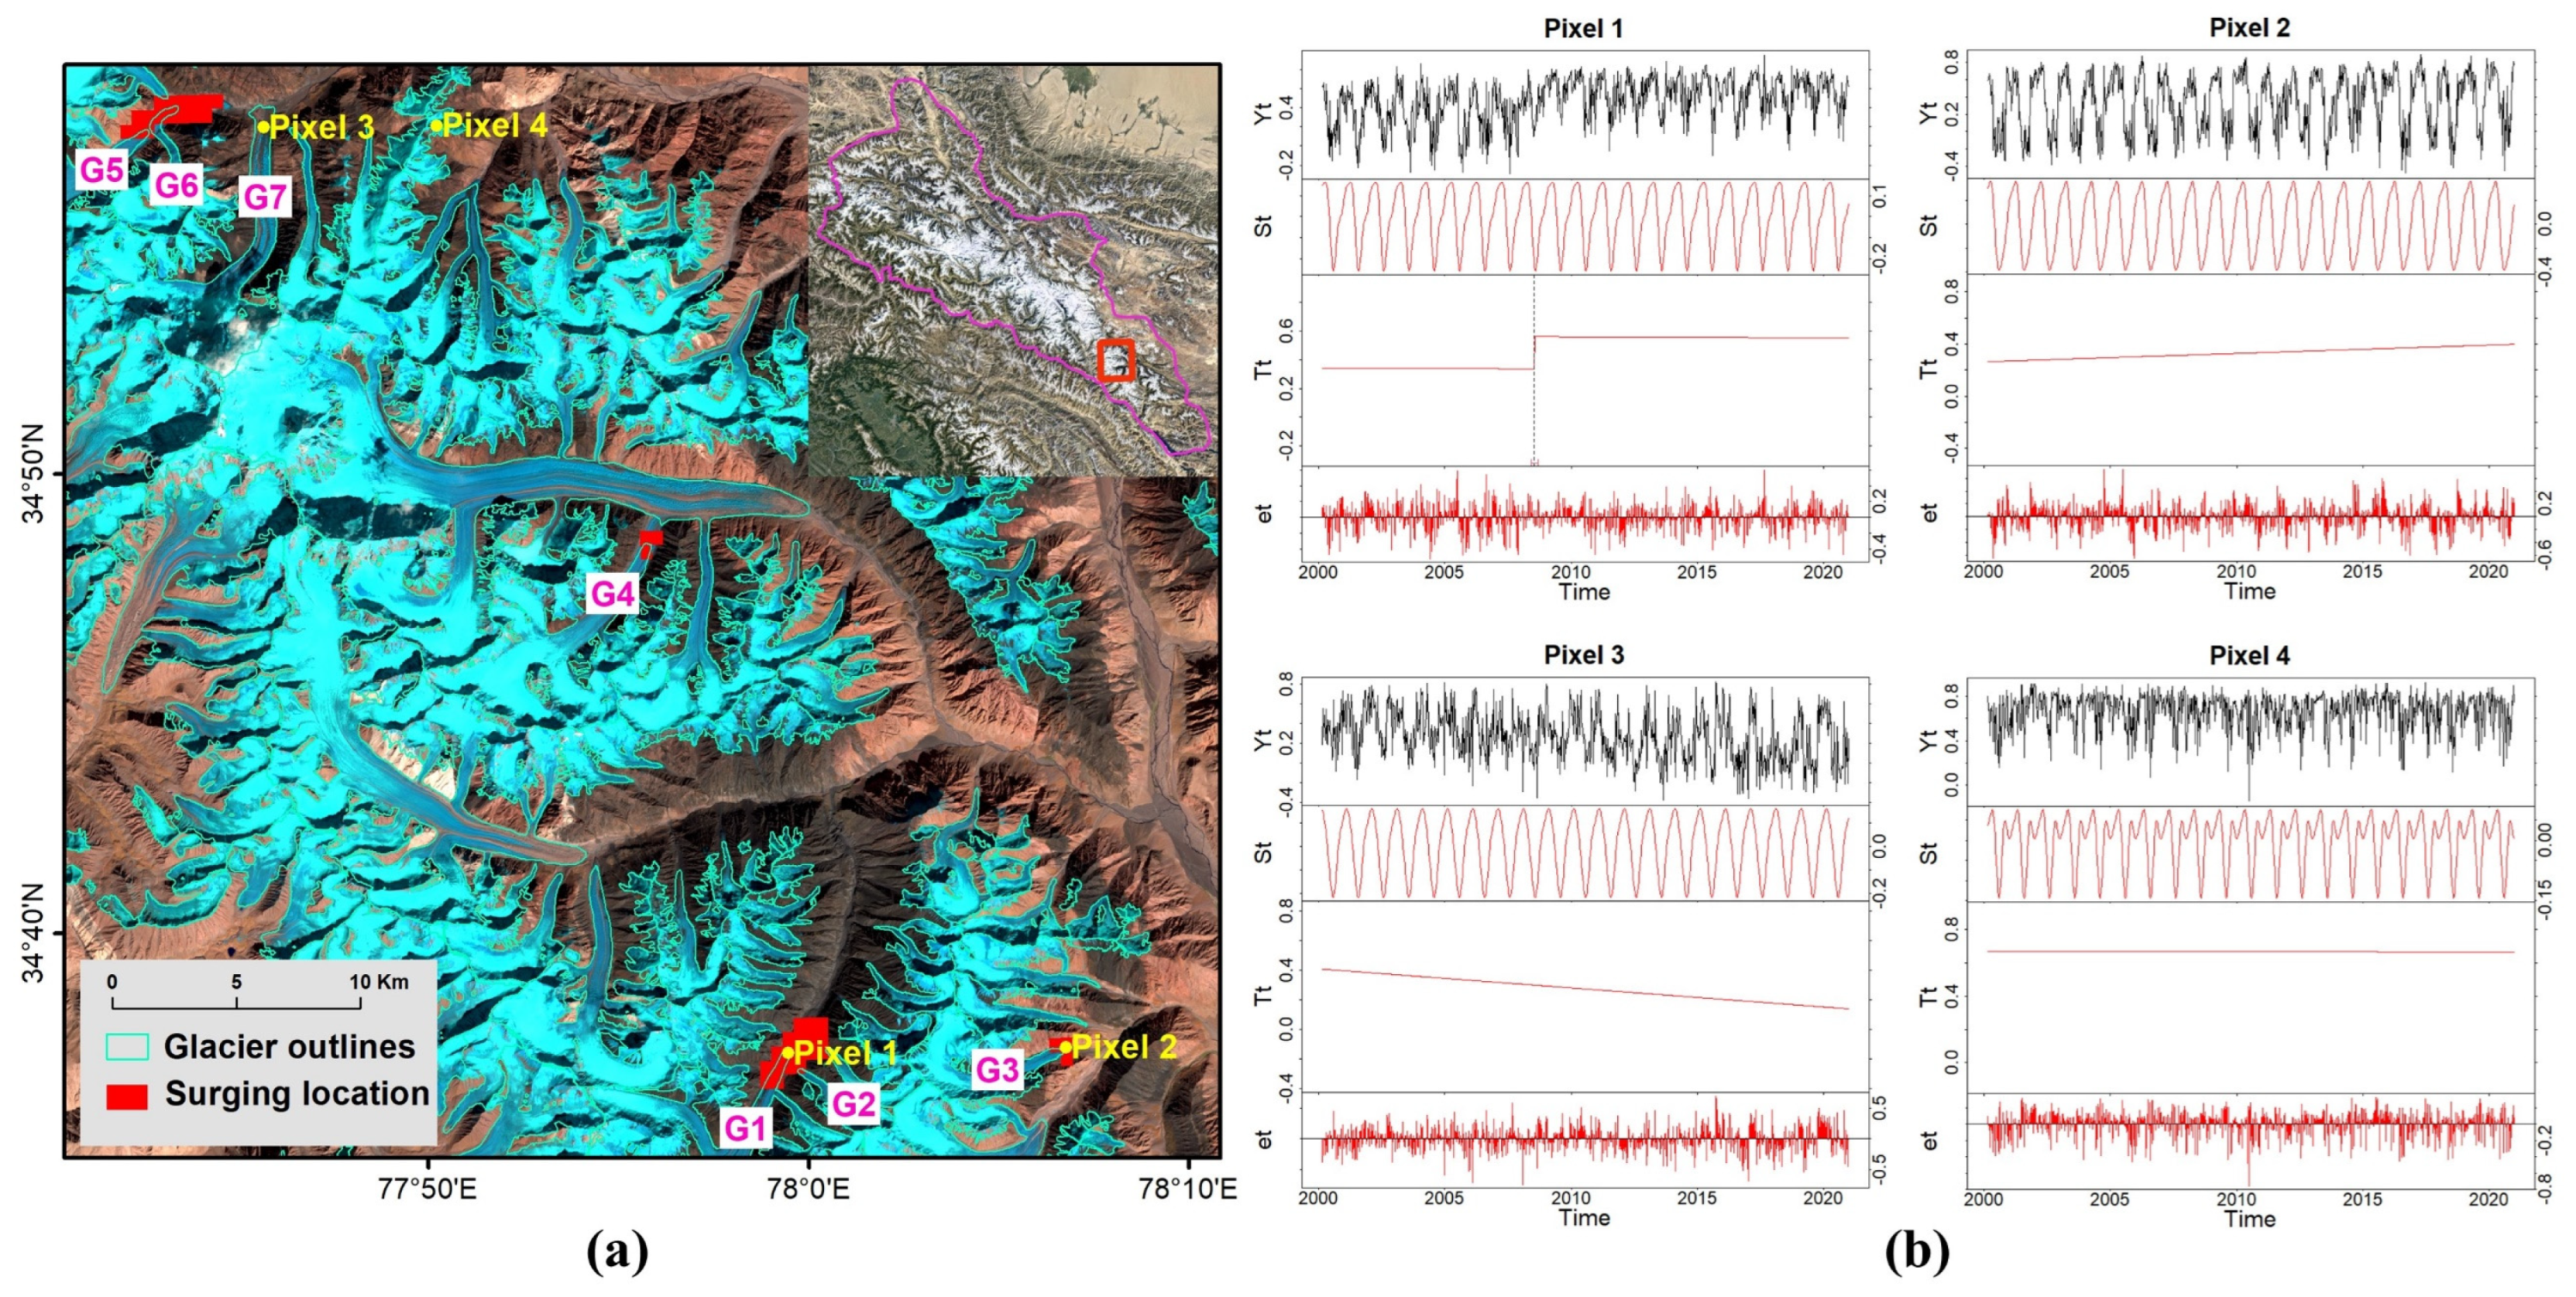
3.2.1. Construction of NDSI Time Series
3.2.2. Identification of Surge-Type Glaciers
3.2.3. Validation of Glacier Surging and Retrieval of Surging Details
4. Results
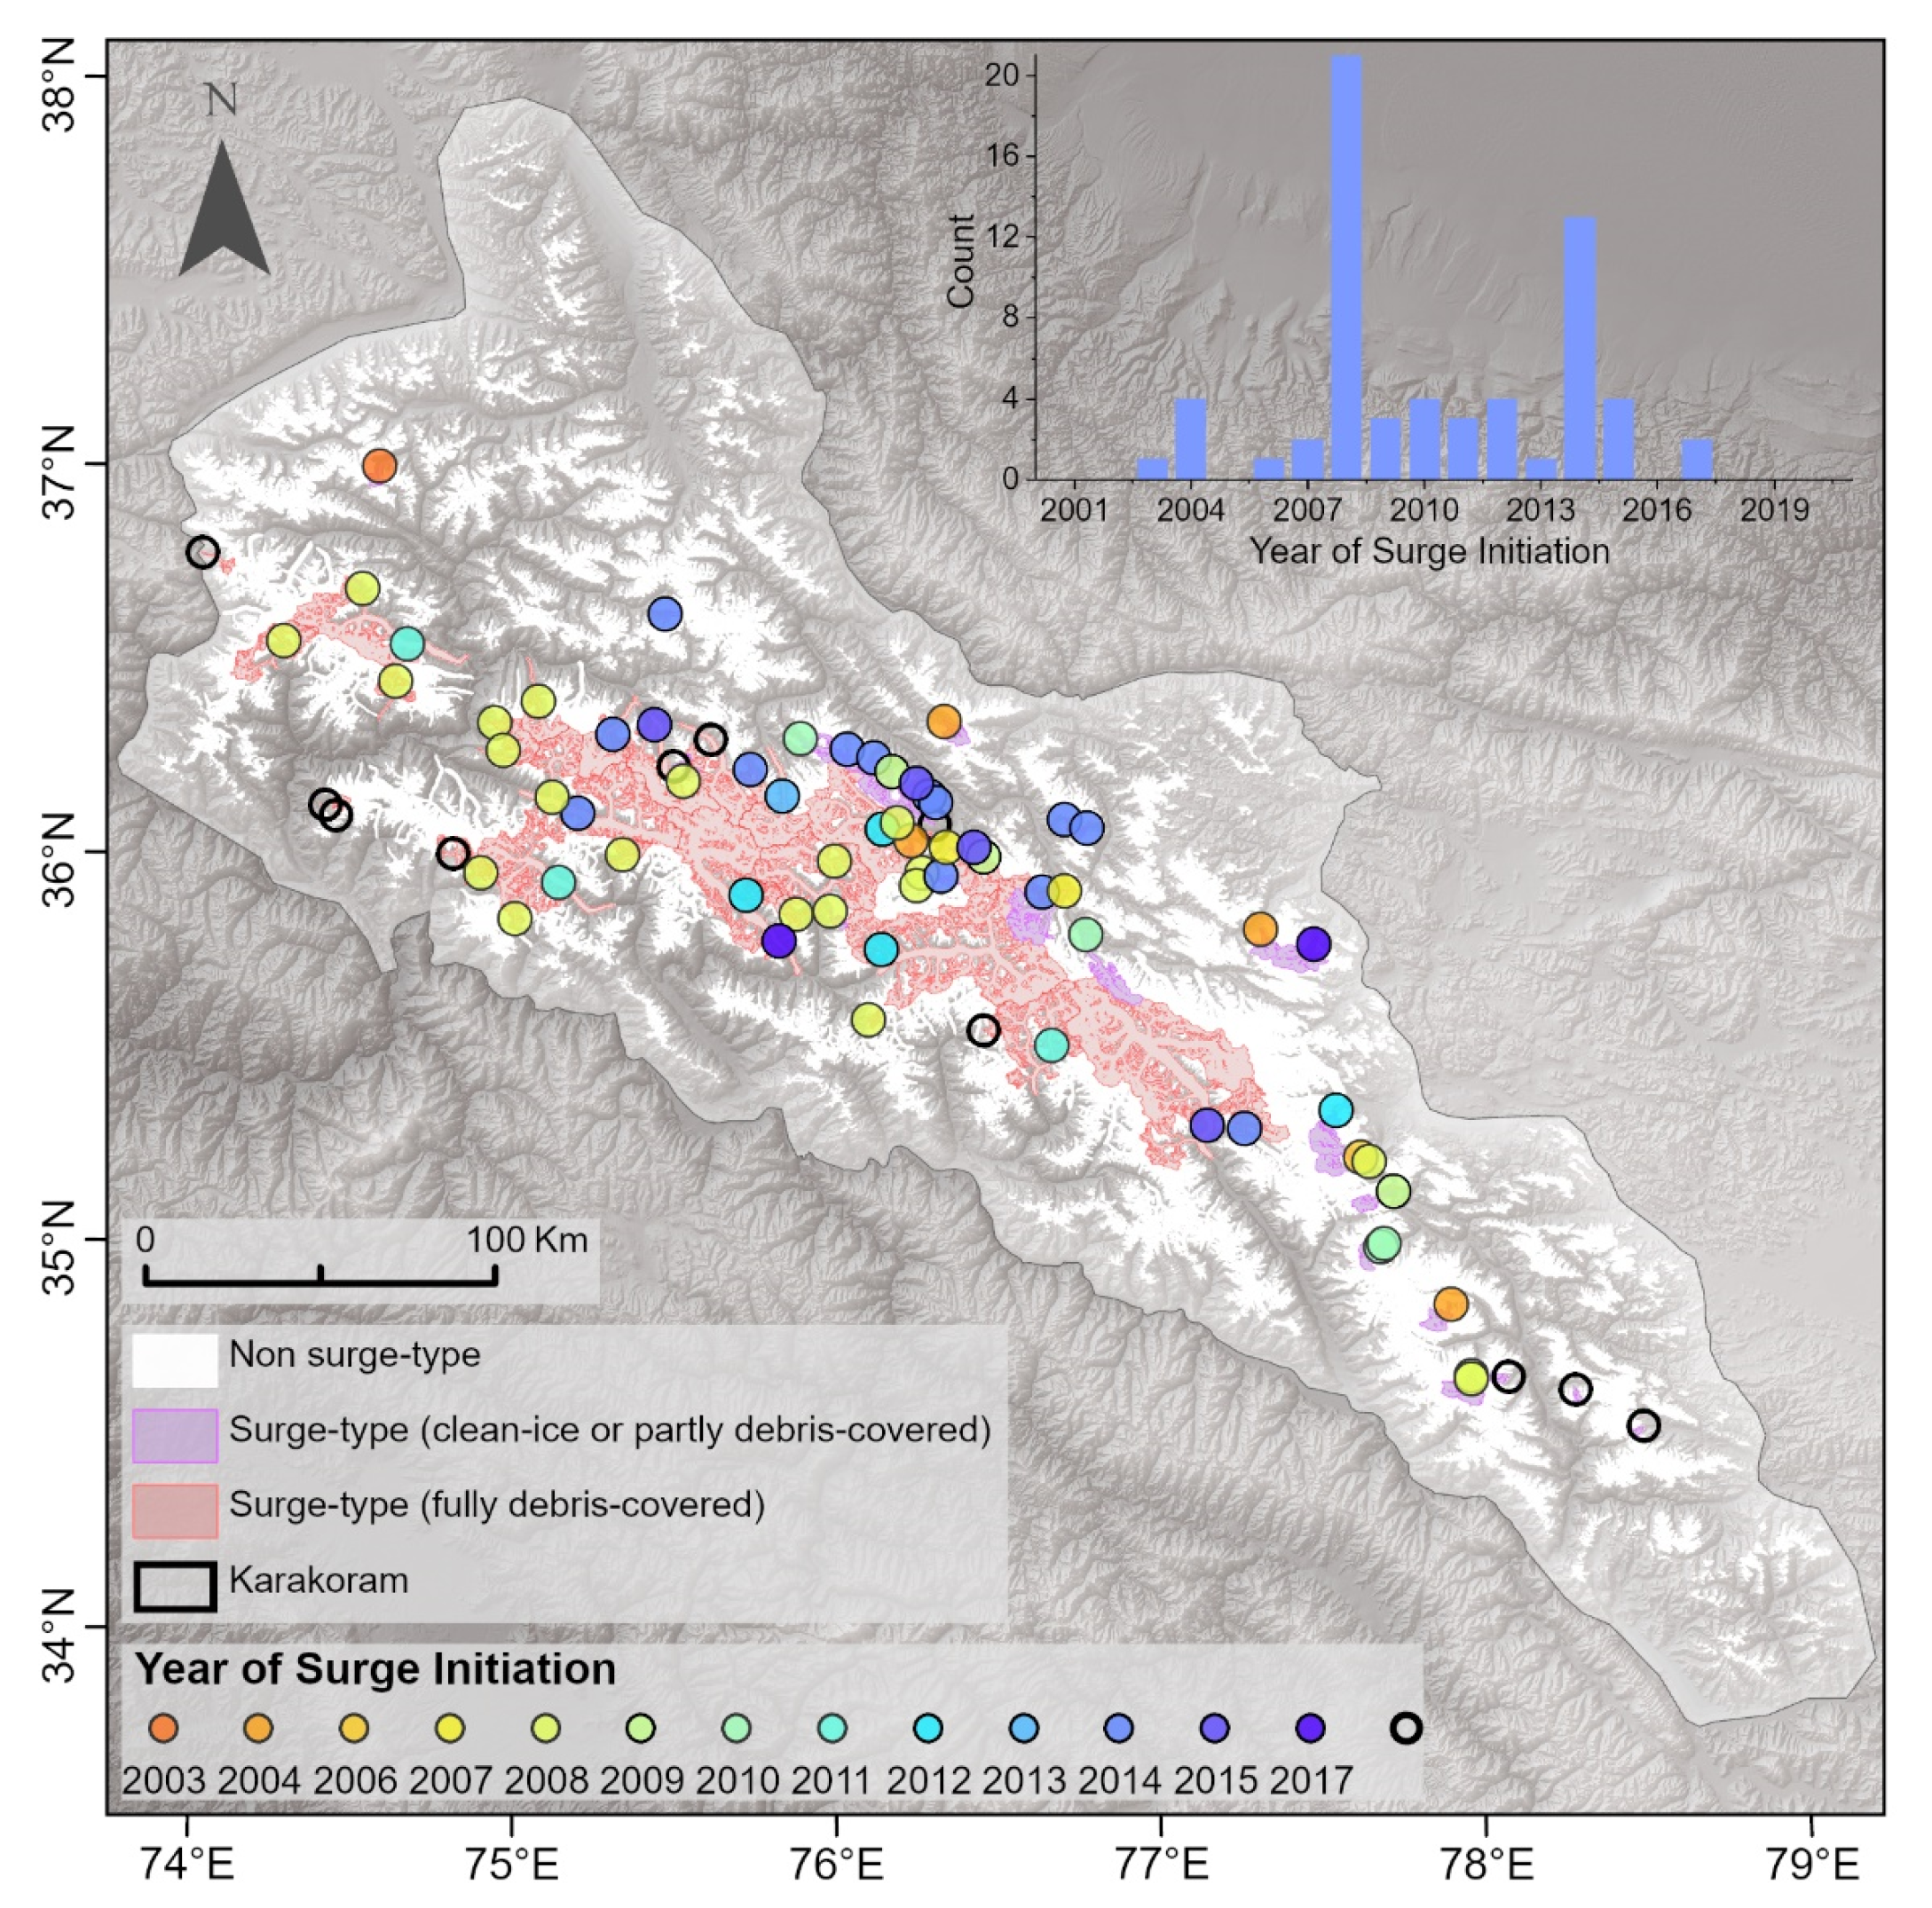
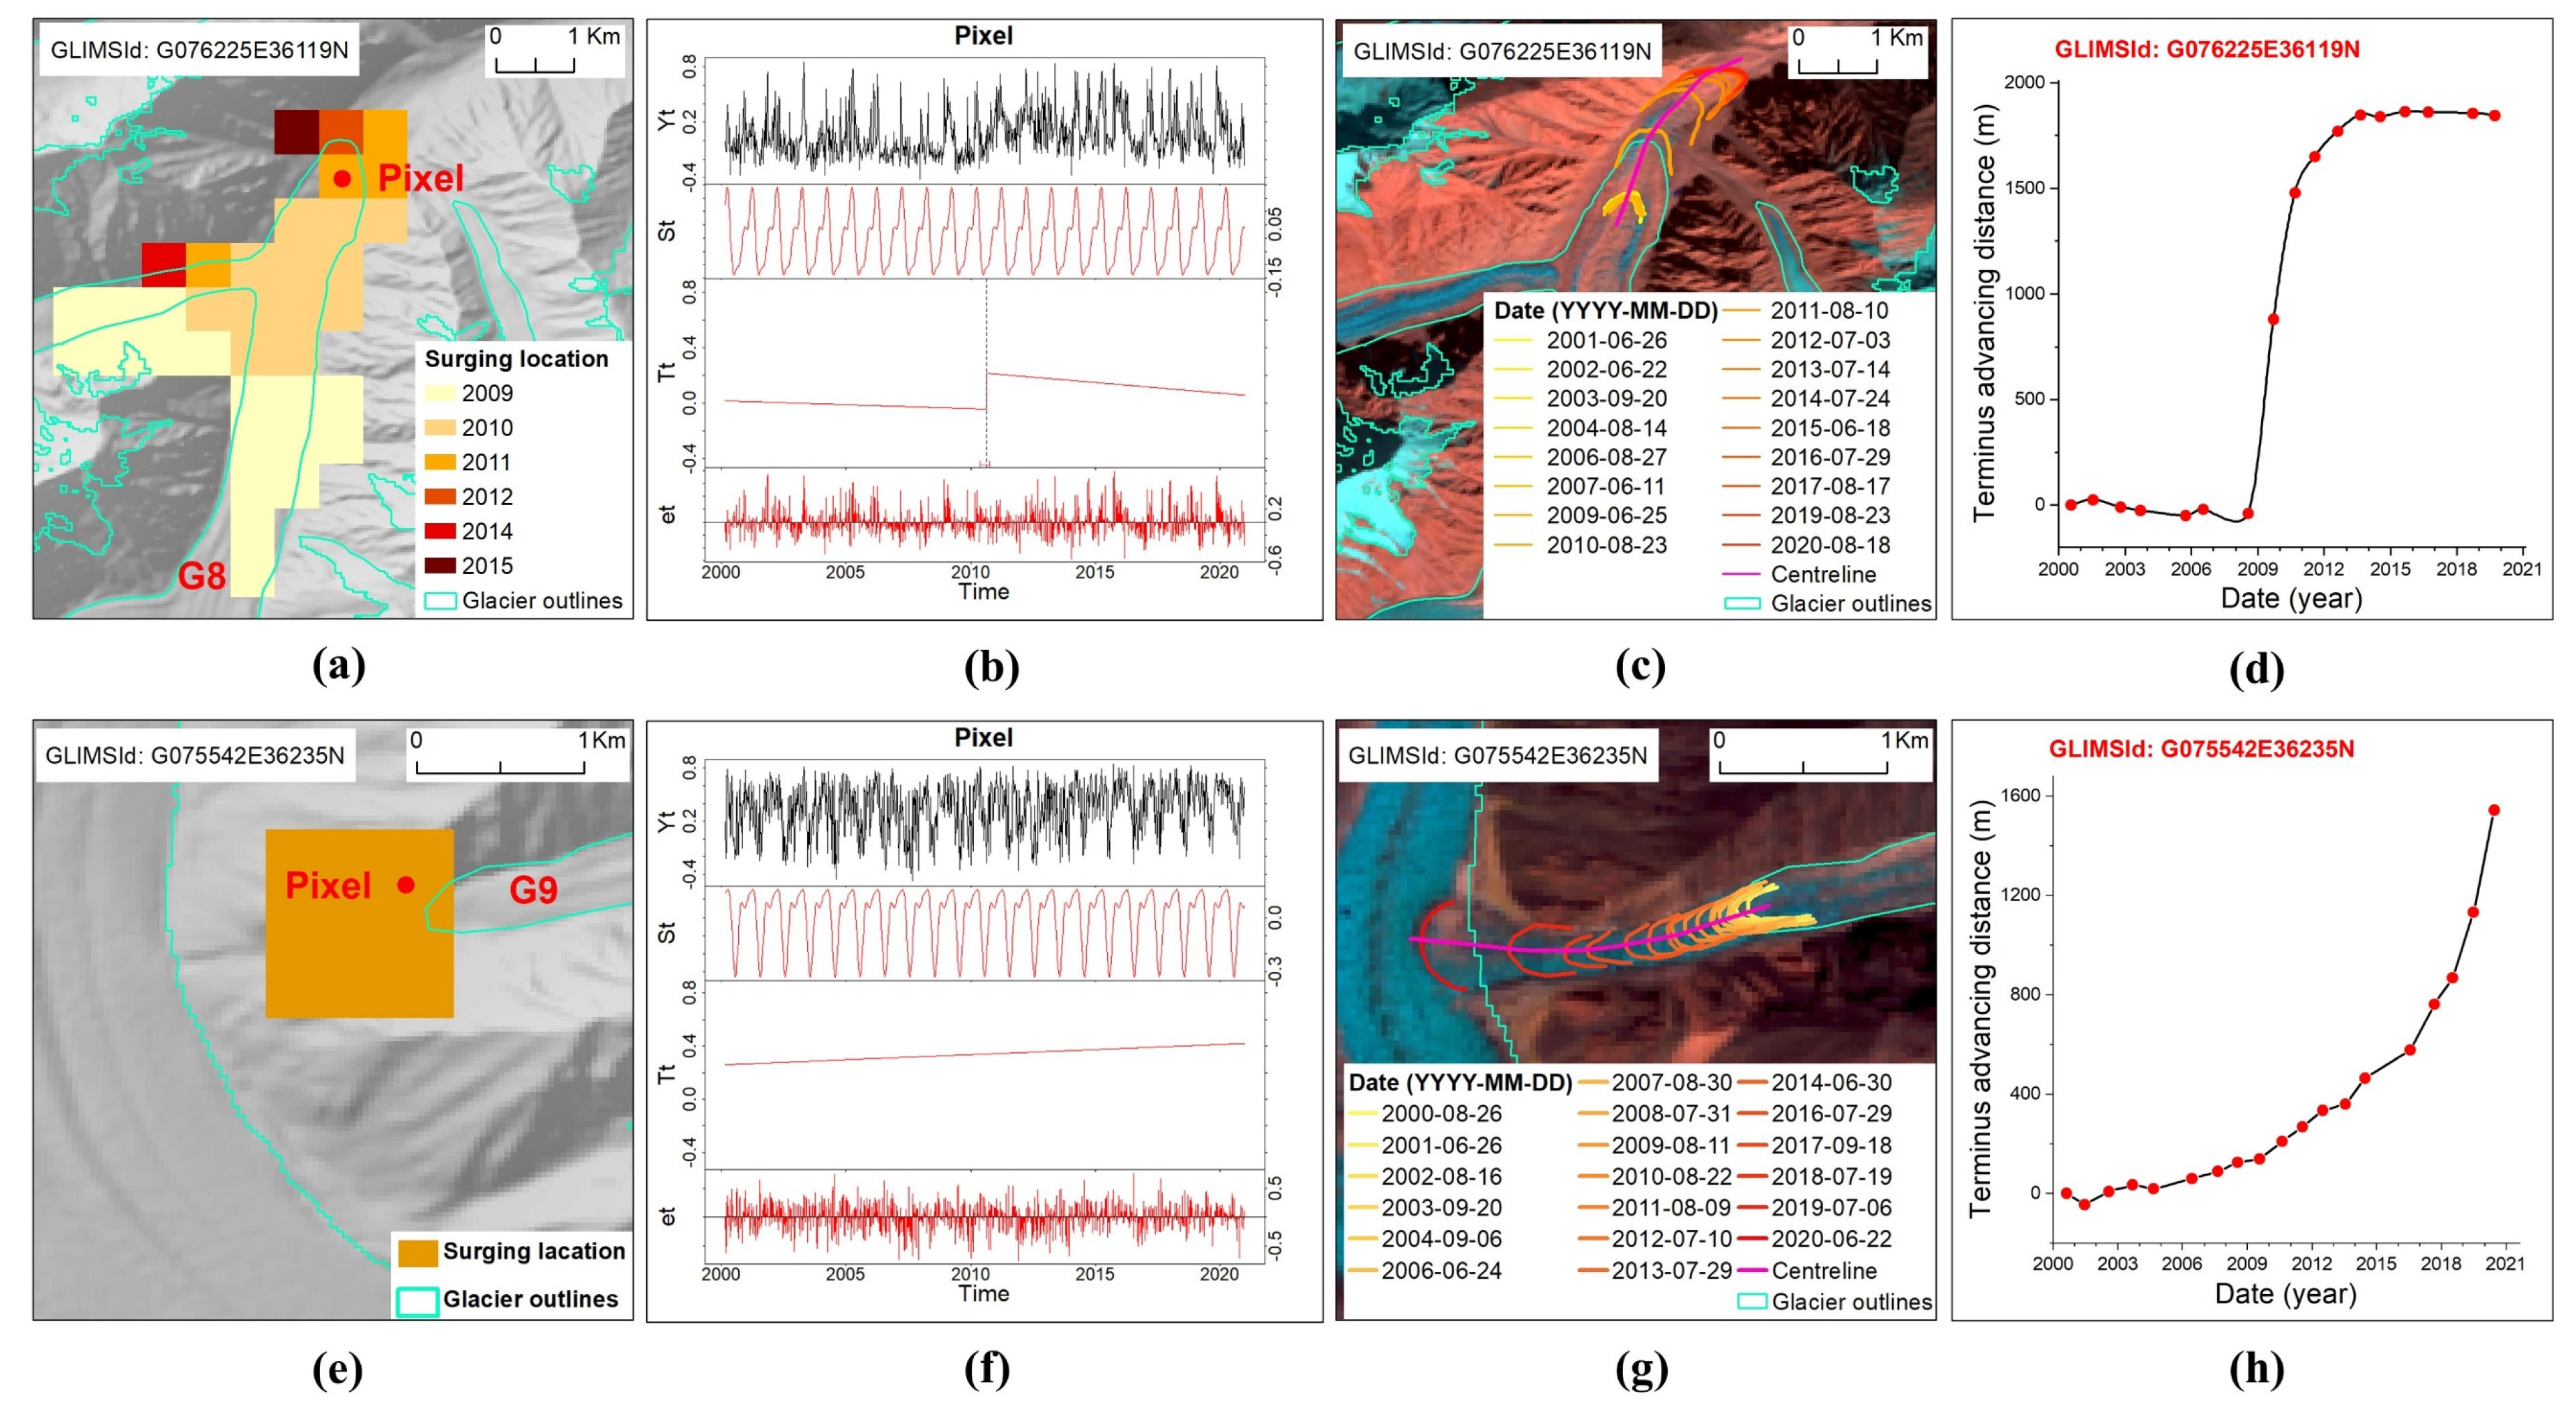
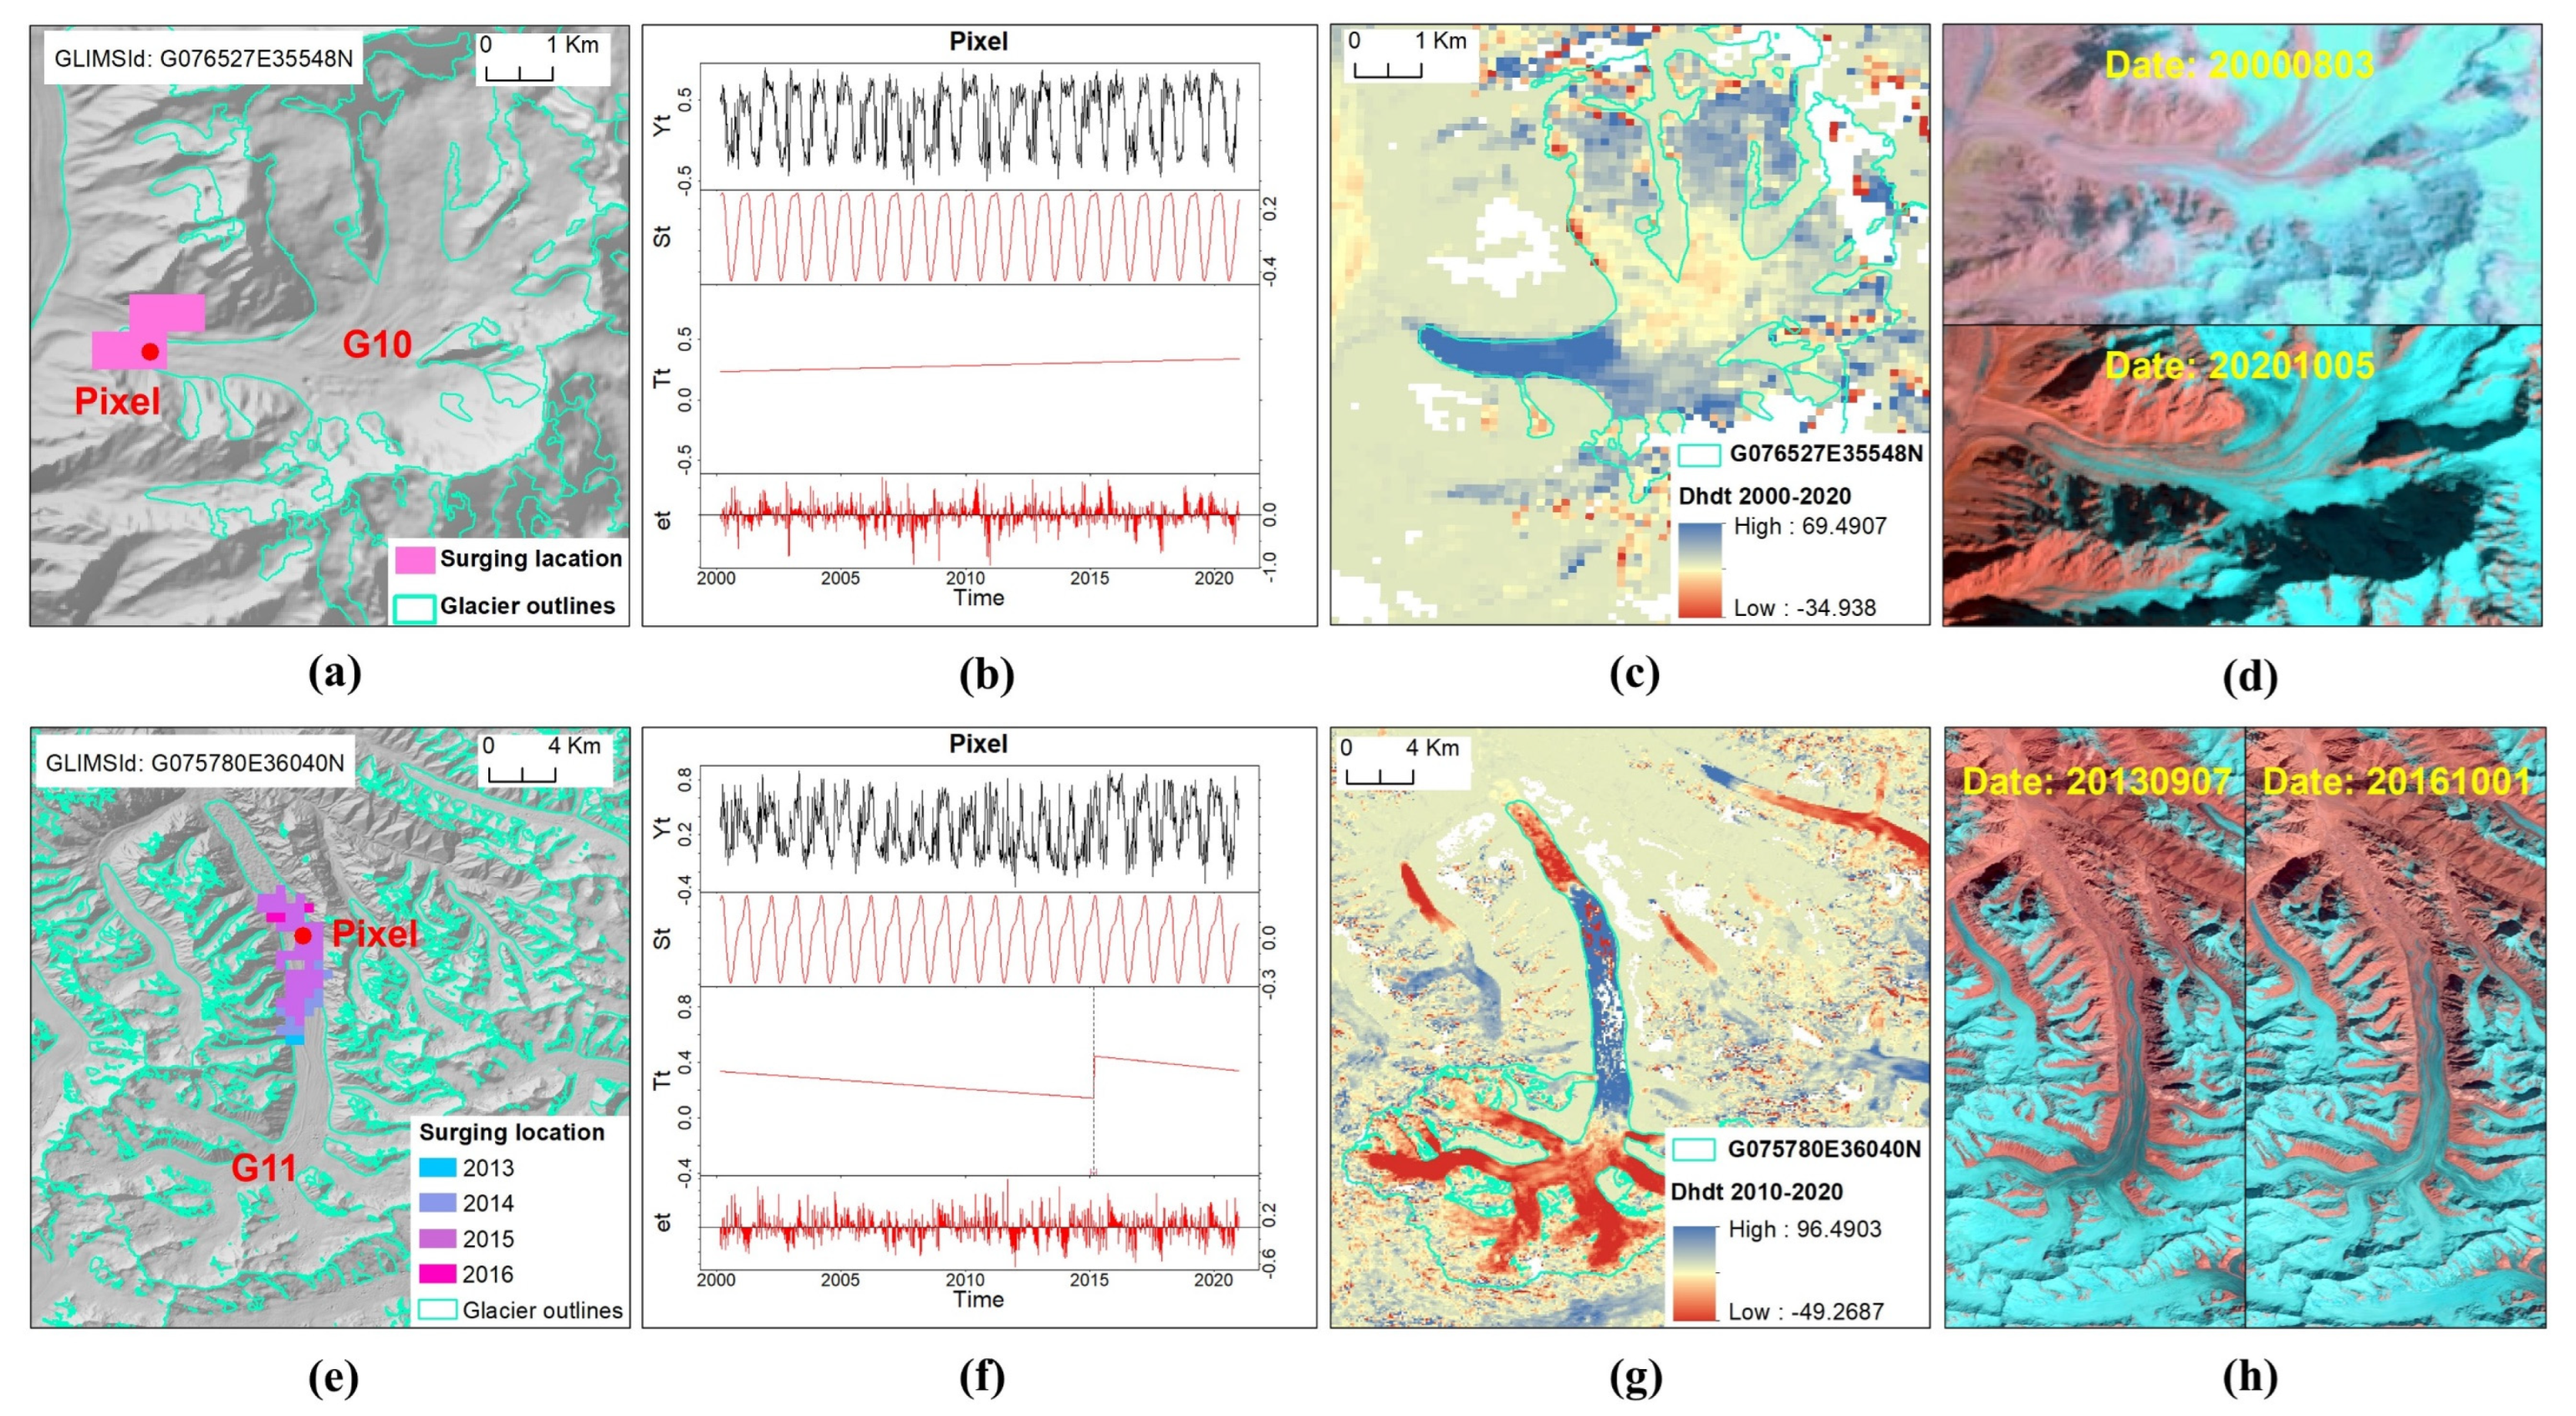
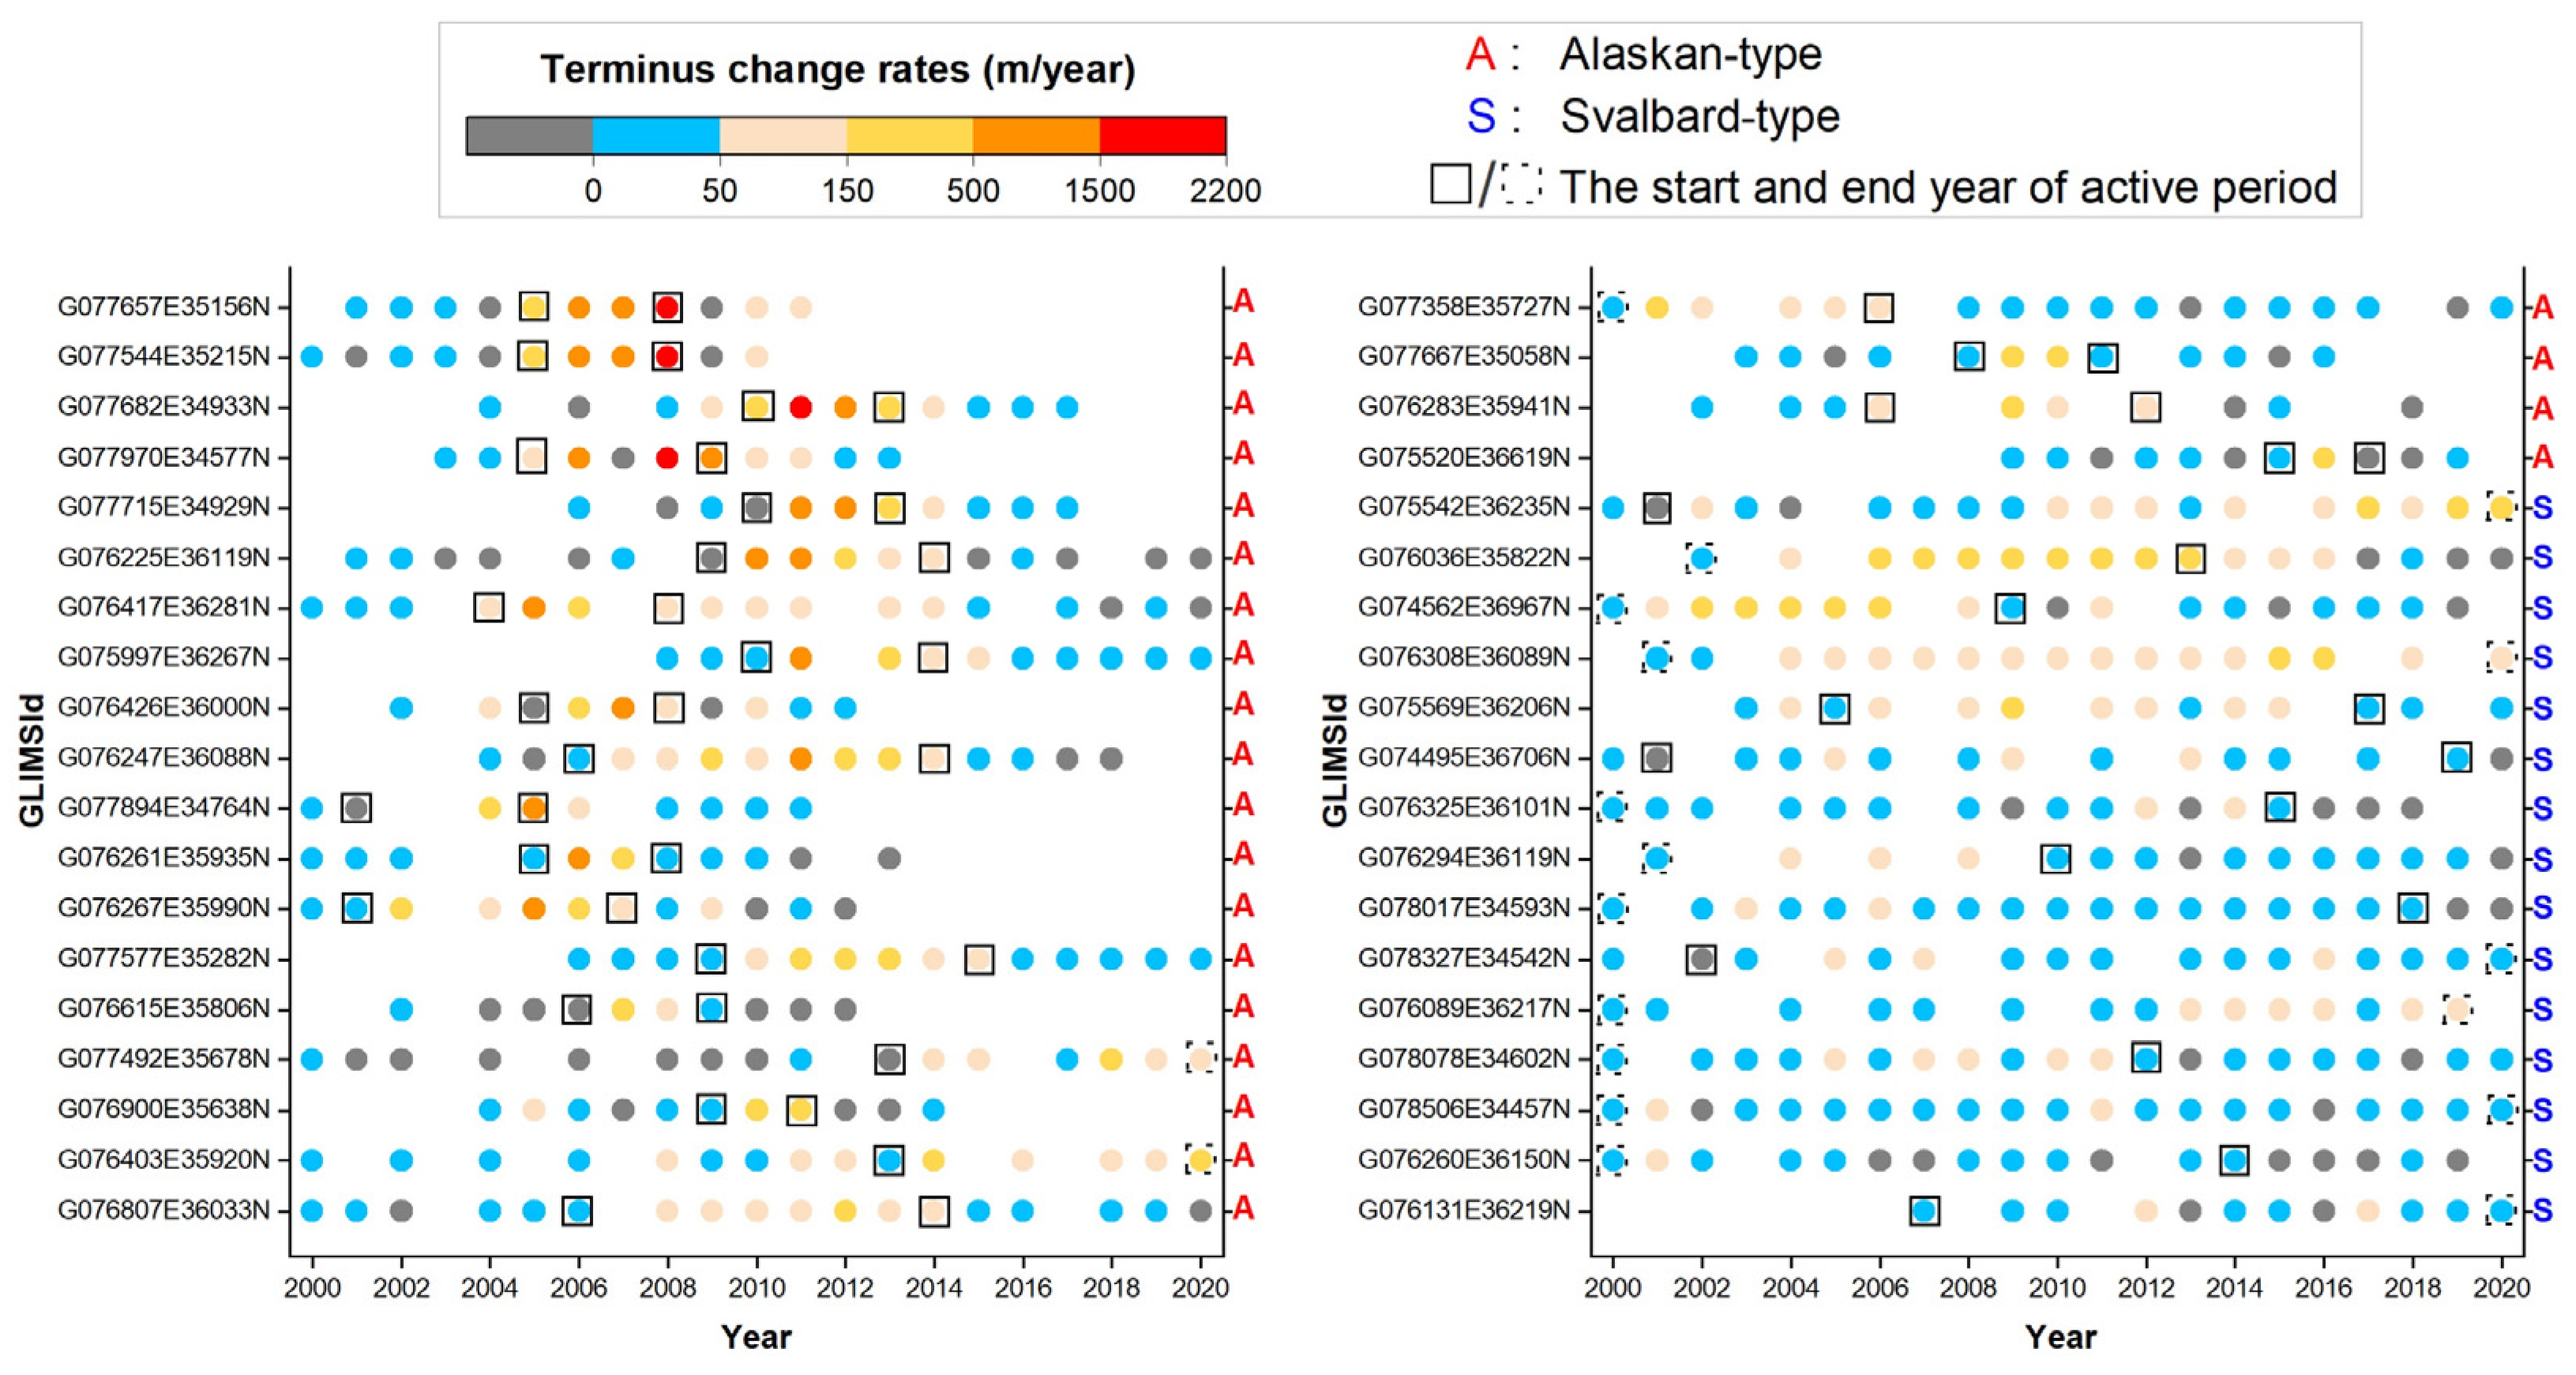
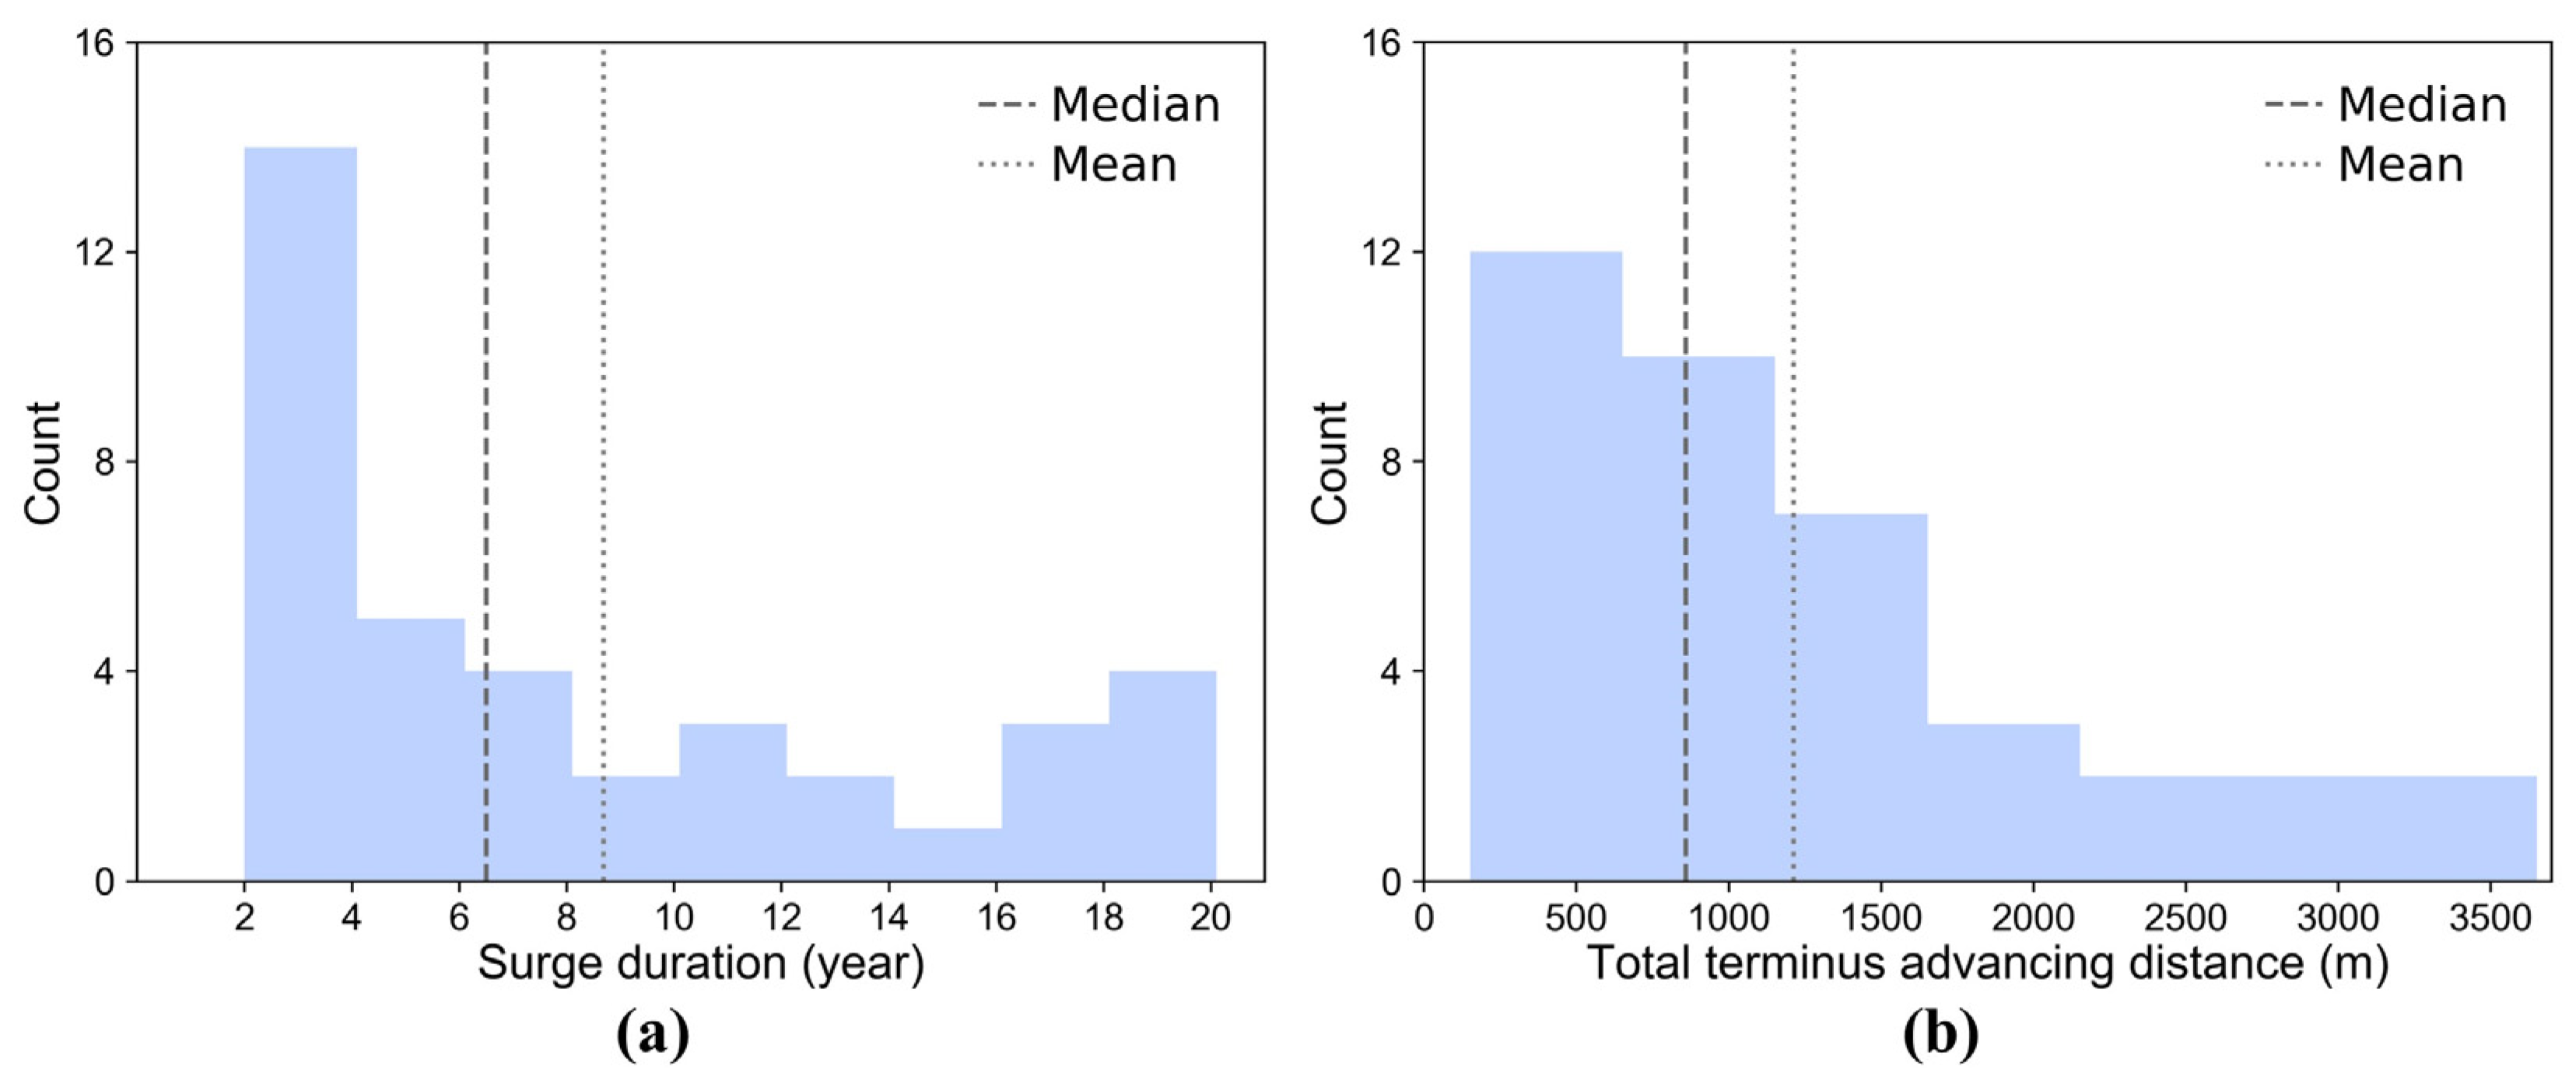
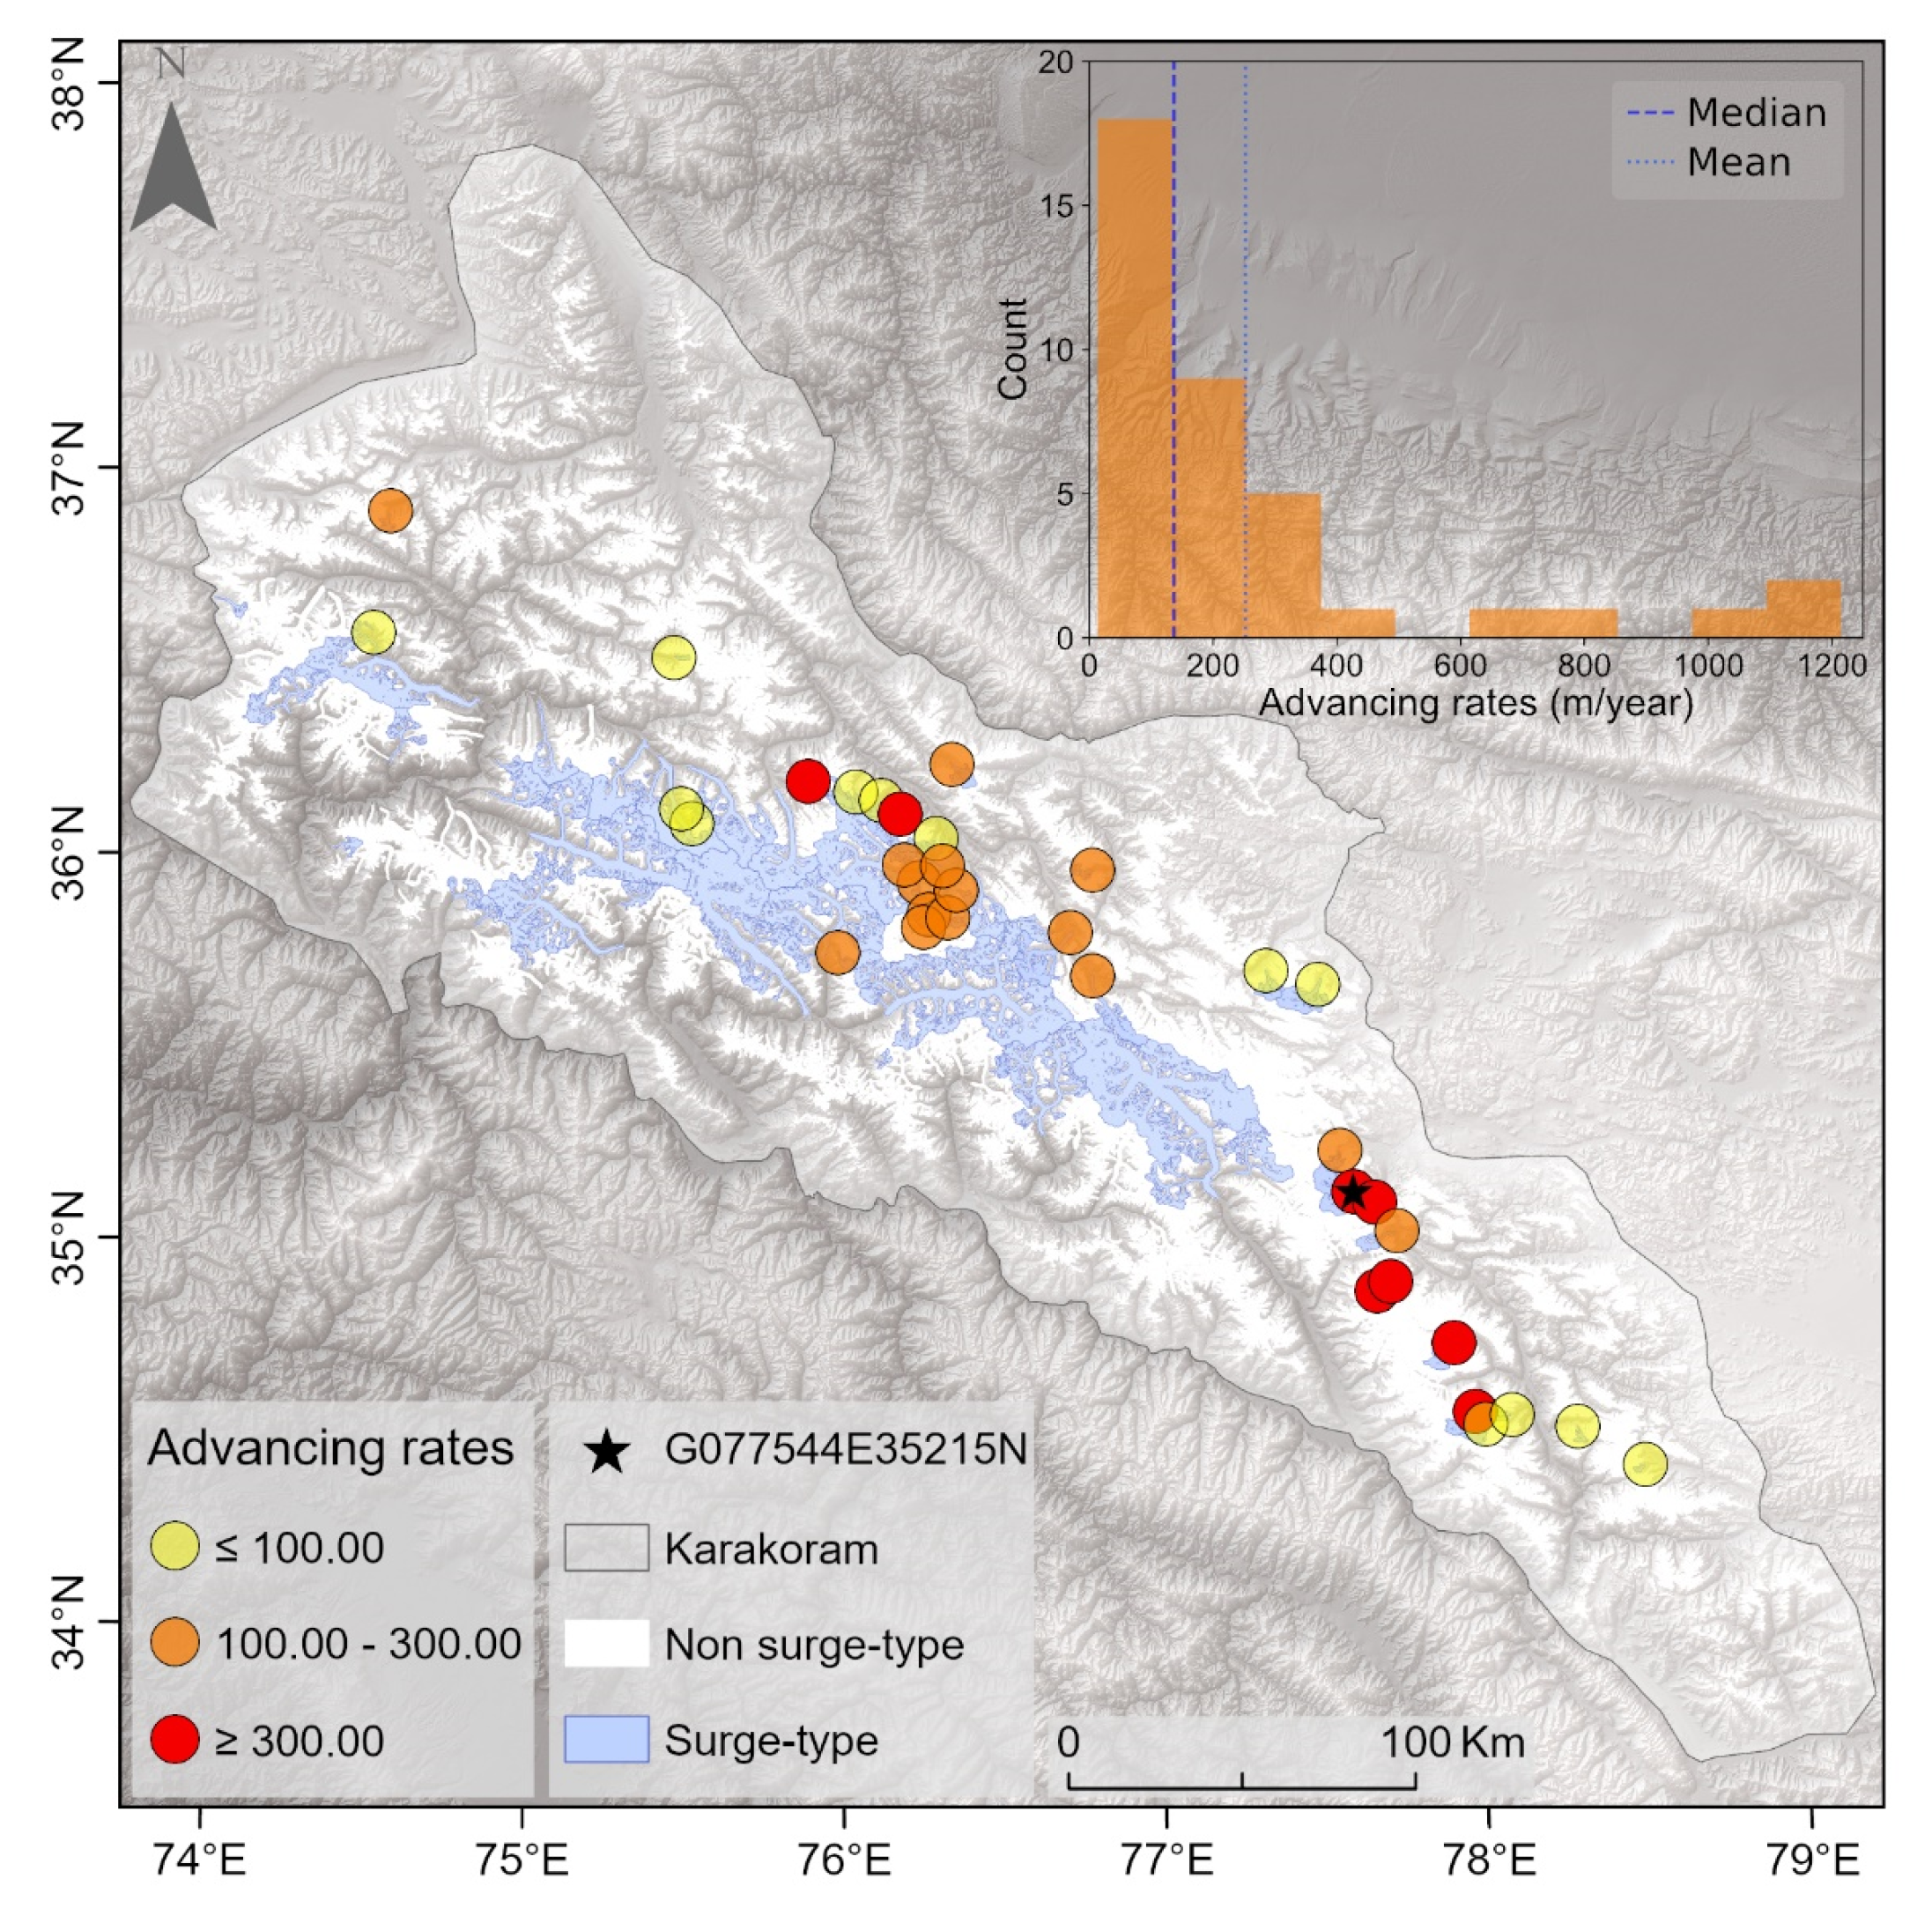
4.1. The Temporal and Spatial Distributions of Surge-Type Glaciers
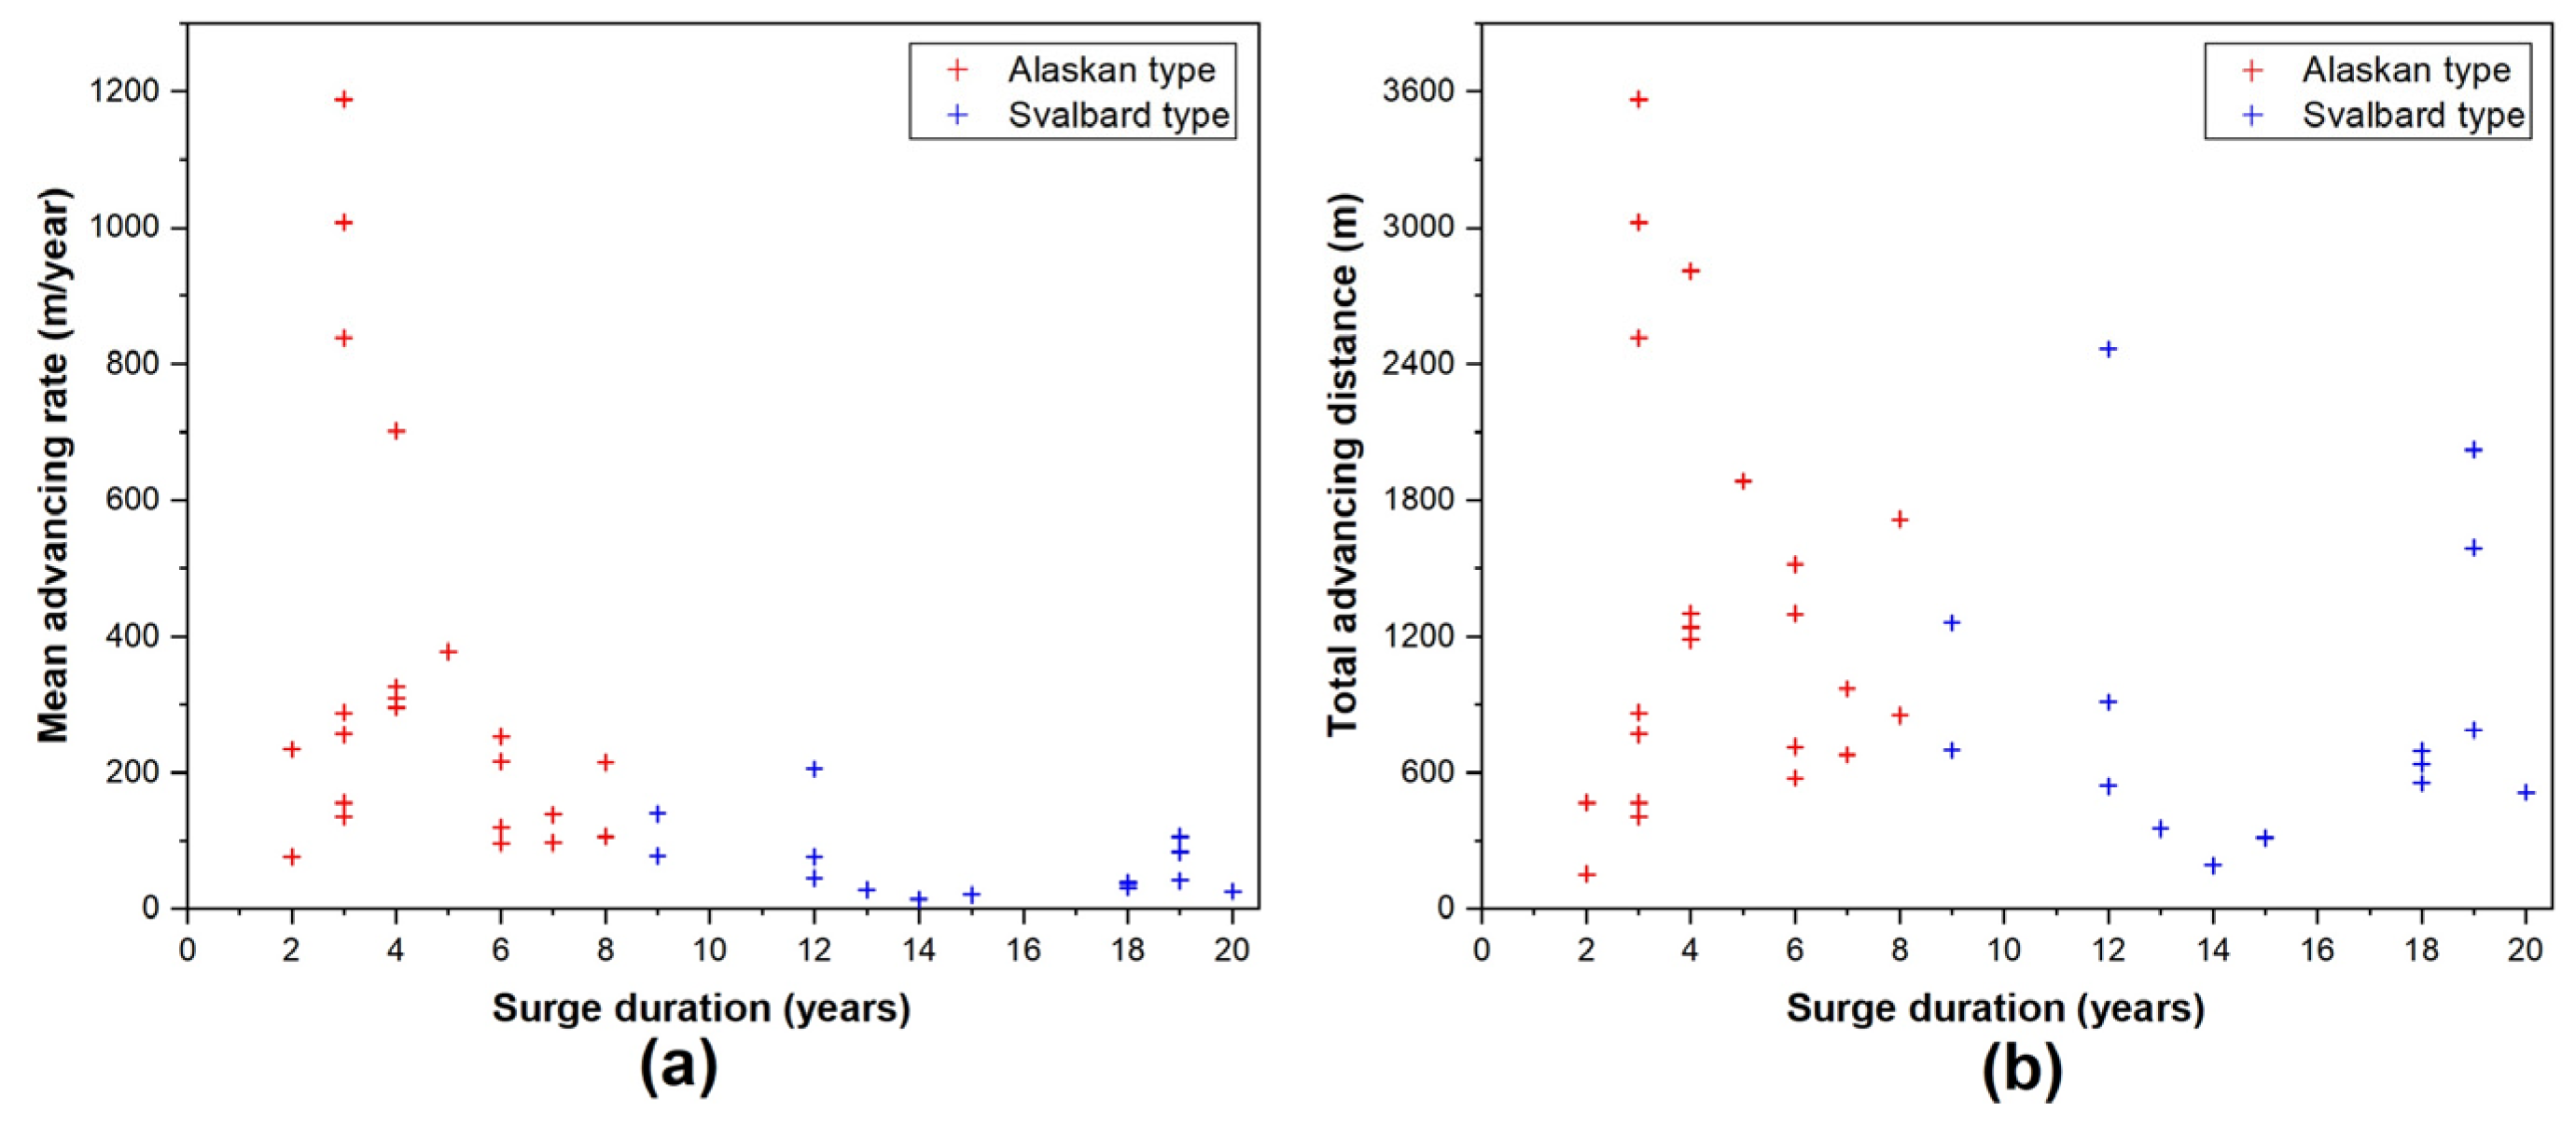
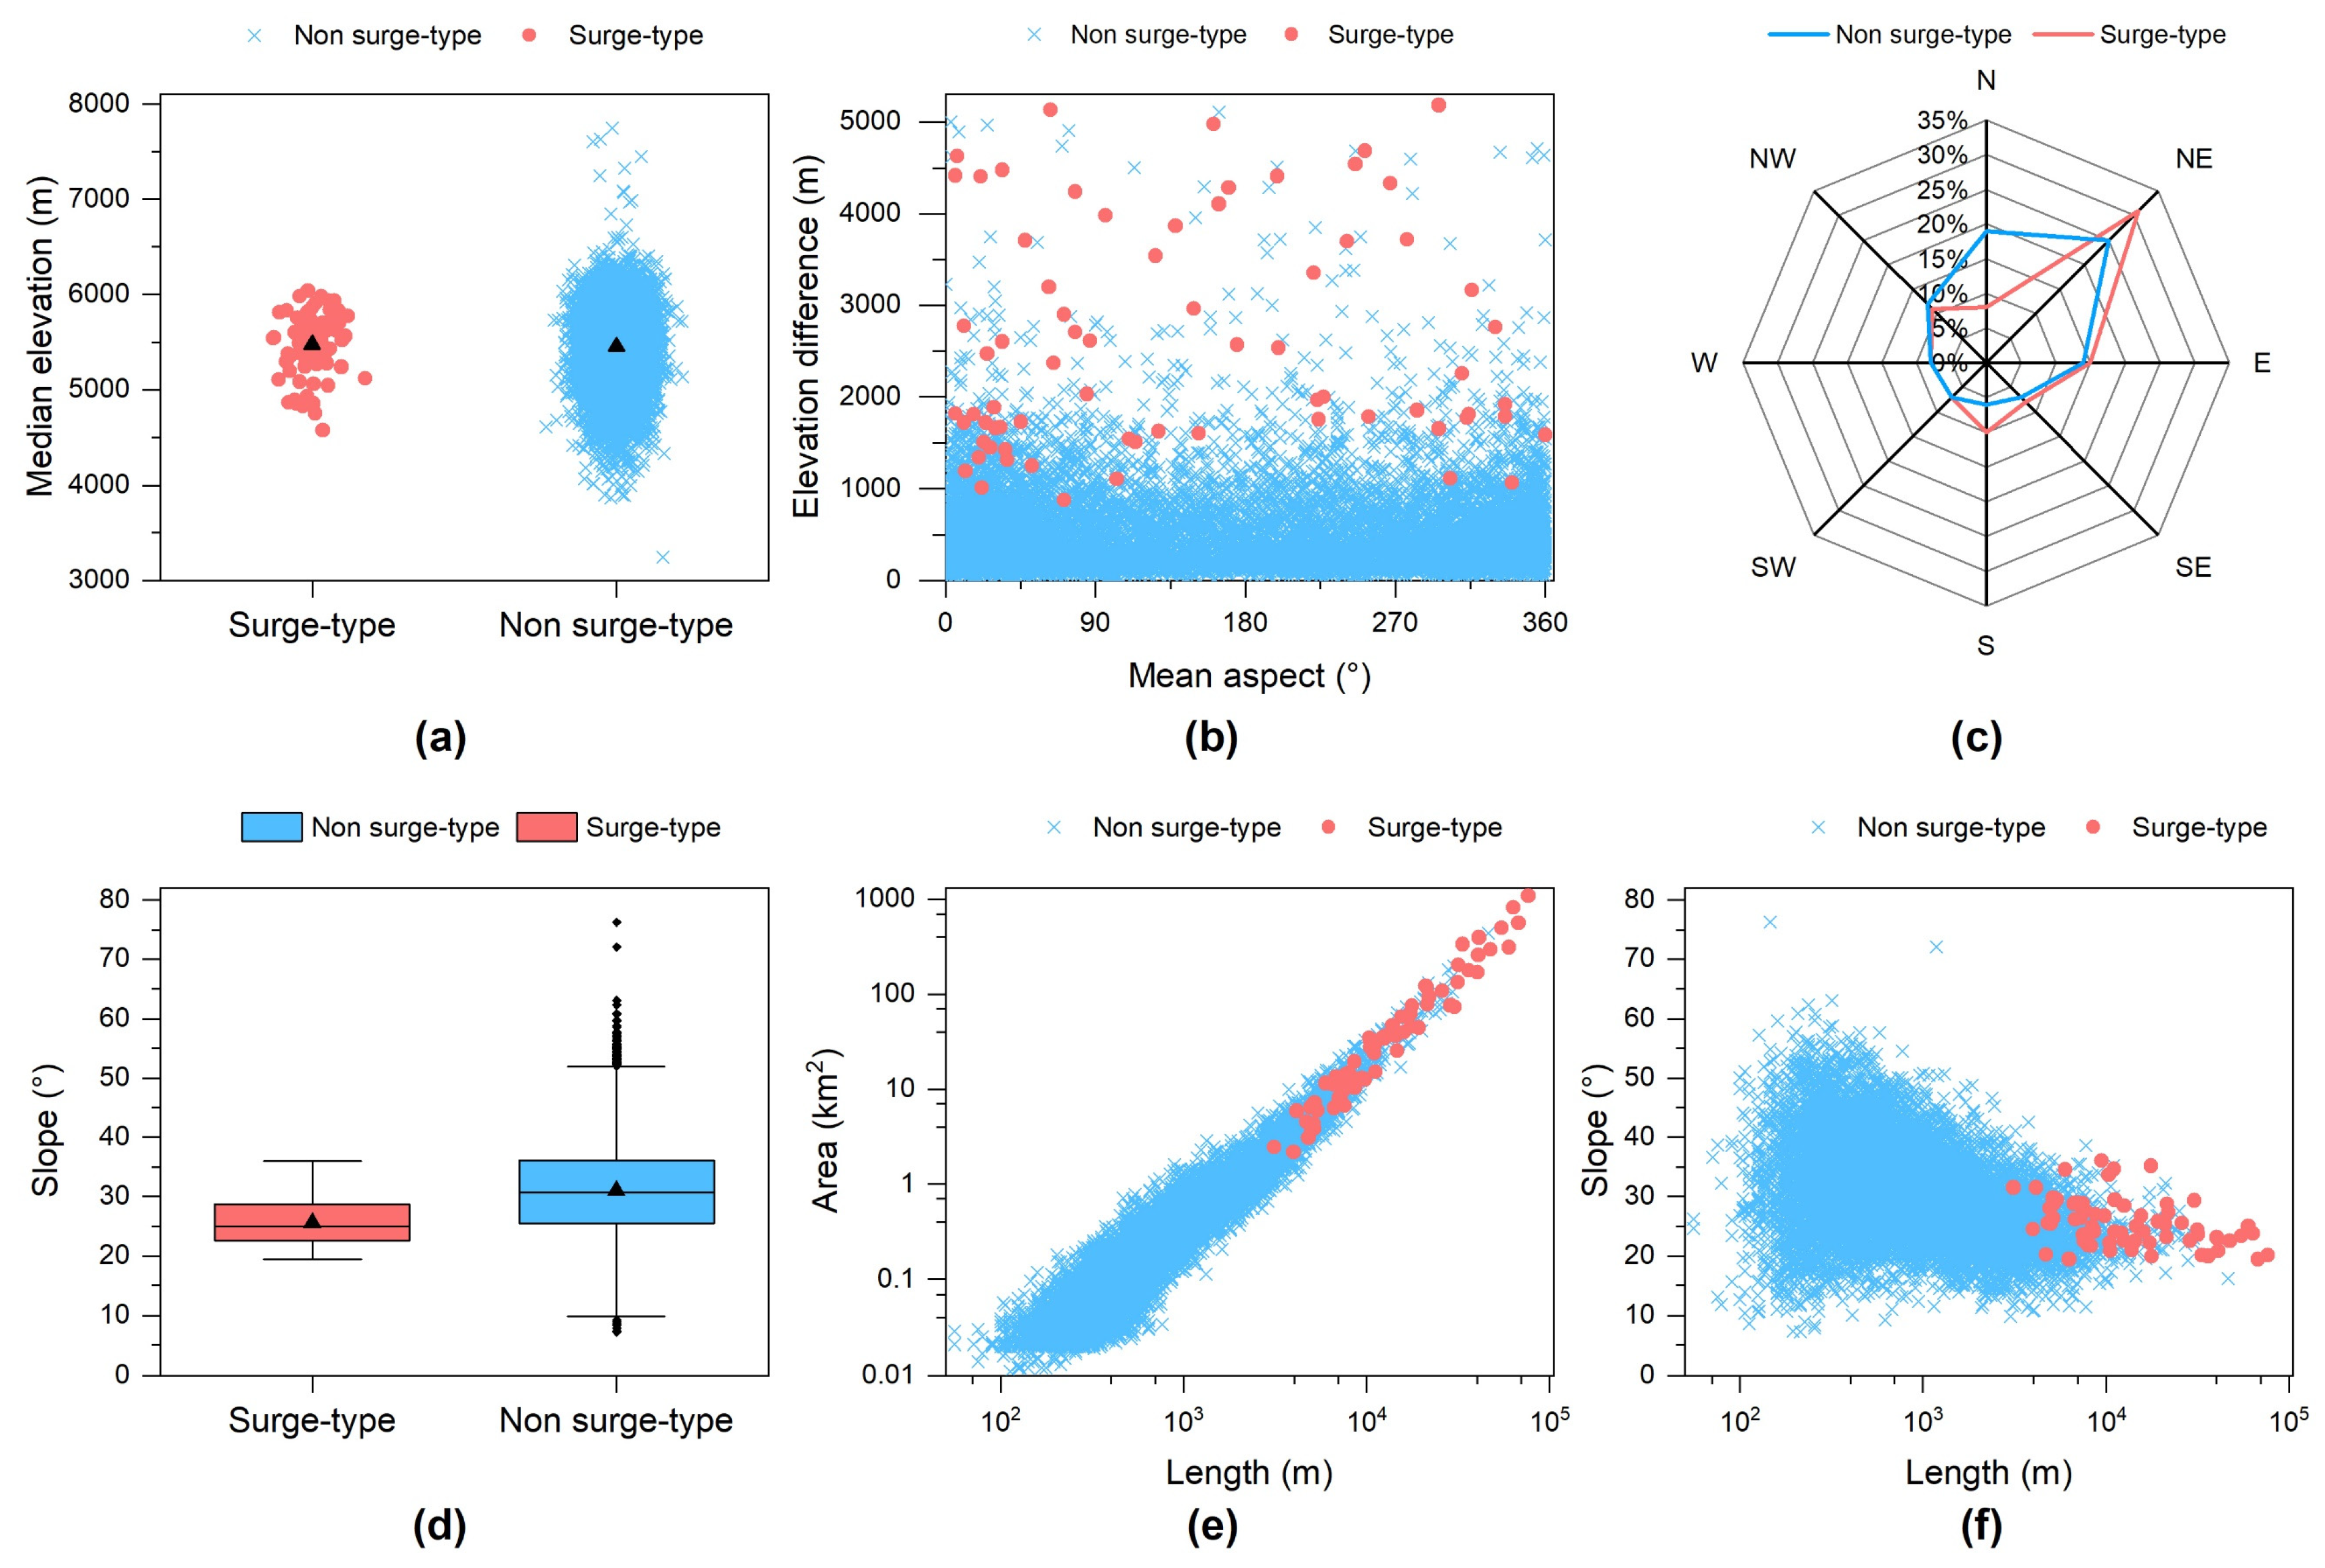
4.2. Geometry Characteristics of Surge-Type Glaciers
5. Discussion
5.1. Comparison and Limitation
5.2. Characteristics of Glacier Surging and Implications
6. Conclusions
Author Contributions
Funding
Acknowledgments
Conflicts of Interest
References
- Shangguan, D.; Liu, S.; Ding, Y.; Guo, W.; Xu, B.; Xu, J.; Jiang, Z. Characterizing the May 2015 Karayaylak Glacier surge in the eastern Pamir Plateau using remote sensing. J. Glaciol. 2016, 62, 944–953. [Google Scholar] [CrossRef]
- Round, V.; Leinss, S.; Huss, M.; Haemmig, C.; Hajnsek, I. Surge dynamics and lake outbursts of Kyagar Glacier, Karakoram. Cryosphere 2017, 11, 723–739. [Google Scholar] [CrossRef]
- Ding, M.; Huai, B.; Sun, W.; Wang, Y.; Zhang, D.; Guo, X.; Zhang, T. Surge-type glaciers in Karakoram Mountain and possible catastrophes alongside a portion of the Karakoram Highway. Nat. Hazards 2018, 90, 1017–1020. [Google Scholar] [CrossRef]
- Kääb, A.; Leinss, S.; Gilbert, A.; Bühler, Y.; Gascoin, S.; Evans, S.G.; Bartelt, P.; Berthier, E.; Brun, F.; Chao, W.A.; et al. Massive collapse of two glaciers in western Tibet in 2016 after surge-like instability. Nat. Geosci. 2018, 11, 114–120. [Google Scholar] [CrossRef]
- Meier, M.F.; Post, A. What are glacier surges? Can. J. Earth Sci. 1969, 6, 807–817. [Google Scholar] [CrossRef]
- Raymond, C.F. How do glaciers surge? A review. J. Geophys. Res. Solid Earth 1987, 92, 9121–9134. [Google Scholar] [CrossRef]
- Hewitt, K. Glacier surges in the Karakoram Himalaya (Central Asia). Can. J. Earth Sci. 1969, 6, 1009–1018. [Google Scholar] [CrossRef]
- Barrand, N.E.; Murray, T. Multivariate controls on the incidence of glacier surging in the Karakoram Himalaya. Arct. Antarct. Alp. Res. 2006, 38, 489–498. [Google Scholar] [CrossRef]
- Rankl, M.; Kienholz, C.; Braun, M. Glacier changes in the Karakoram region mapped by multimission satellite imagery. Cryosphere 2014, 8, 977–989. [Google Scholar] [CrossRef]
- Bazai, N.A.; Cui, P.; Carling, P.A.; Wang, H.; Hassan, J.; Liu, D.; Zhang, G.; Jin, W. Increasing glacial lake outburst flood hazard in response to surge glaciers in the Karakoram. Earth-Sci. Rev. 2021, 212, 103432. [Google Scholar] [CrossRef]
- King, O.; Bhattacharya, A.; Bolch, T. The presence and influence of glacier surging around the Geladandong ice caps, North East Tibetan Plateau. Adv. Clim. Chang. Res. 2021, 12, 299–312. [Google Scholar] [CrossRef]
- Vale, A.B.; Arnold, N.S.; Rees, W.G.; Lea, J.M. Remote detection of surge-related glacier terminus change across High Mountain Asia. Remote Sens. 2021, 13, 1309. [Google Scholar] [CrossRef]
- Quincey, D.J.; Glasser, N.F.; Cook, S.J.; Luckman, A. Heterogeneity in Karakoram glacier surges. J. Geophys. Res. Earth Surf. 2015, 120, 1288–1300. [Google Scholar] [CrossRef]
- Post, A. Distribution of surging glaciers in Western North America. J. Glaciol. 1969, 8, 229–240. [Google Scholar] [CrossRef]
- Murray, T.; Dowdeswell, J.A.; Drewry, D.J.; Frearson, I. Geometric evolution and ice dynamics during a surge of Bakaninbreen, Svalbard. J. Glaciol. 1998, 44, 263–272. [Google Scholar] [CrossRef]
- Jiskoot, H.; Luckman, A.; Murray, T. Controls on surging in East Greenland derived from a new glacier inventory. AGU Fall Meet. Abstr. 2001, IP22B-0691. [Google Scholar]
- Jiskoot, H.; Murray, T.; Luckman, A. Surge potential and drainage-basin characteristics in East Greenland. Ann. Glaciol. 2003, 36, 142–148. [Google Scholar] [CrossRef]
- Jiskoot, H.; Murray, T.; Boyle, P. Controls on the distribution of surge-type glaciers in Svalbard. J. Glaciol. 2000, 46, 412–422. [Google Scholar] [CrossRef]
- Copland, L.; Sylvestre, T.; Bishop, M.P.; Shroder, J.F.; Seong, Y.B.; Owen, L.A.; Bush, A.; Kamp, U. Expanded and recently increased glacier surging in the Karakoram. Arct. Antarct. Alp. Res. 2011, 43, 503–516. [Google Scholar] [CrossRef]
- Bhambri, R.; Hewitt, K.; Kawishwar, P.; Pratap, B. Surge-type and surge-modified glaciers in the Karakoram. Sci. Rep. 2017, 7, 15391. [Google Scholar] [CrossRef]
- Rashid, I.; Abdullah, T.; Glasser, N.F.; Naz, H.; Romshoo, S.A. Surge of hispar glacier, Pakistan, between 2013 and 2017 detected from remote sensing observations. Geomorphology 2018, 303, 410–416. [Google Scholar] [CrossRef] [Green Version]
- Rashid, I.; Majeed, U.; Jan, A.; Glasser, N.F. The January 2018 to September 2019 surge of shisper glacier, Pakistan, detected from remote sensing observations. Geomorphology 2020, 351, 106957. [Google Scholar] [CrossRef]
- Guillet, G.; King, O.; Lv, M.; Ghuffar, S.; Benn, D.; Quincey, D.; Bolch, T. A regionally resolved inventory of High Mountain Asia surge-type glaciers, derived from a multi-factor remote sensing approach. Cryosphere 2022, 16, 603–623. [Google Scholar] [CrossRef]
- Yasuda, T.; Furuya, M. Dynamics of surge-type glaciers in West Kunlun Shan, Northwestern Tibet. J. Geophys. Res. Earth Surf. 2015, 120, 2393–2405. [Google Scholar] [CrossRef]
- Zemp, M.; Frey, H.; Gärtner-Roer, I.; Nussbaumer, S.U.; Hoelzle, M.; Paul, F.; Haeberli, W.; Denzinger, F.; Ahlstrøm, A.P.; Anderson, B.; et al. Historically unprecedented global glacier decline in the early 21st century. J. Glaciol. 2015, 61, 745–762. [Google Scholar] [CrossRef]
- Hugonnet, R.; McNabb, R.; Berthier, E.; Menounos, B.; Nuth, C.; Girod, L.; Farinotti, D.; Huss, M.; Dussaillant, I.; Brun, F.; et al. Accelerated global glacier mass loss in the early twenty-first century. Nature 2021, 592, 726–731. [Google Scholar] [CrossRef] [PubMed]
- Paul, F. Revealing glacier flow and surge dynamics from animated satellite image sequences: Examples from the Karakoram. Cryosphere 2015, 9, 2201–2214. [Google Scholar] [CrossRef]
- Hewitt, K. The Karakoram anomaly? Glacier expansion and the ‘elevation effect,’ Karakoram Himalaya. Mt. Res. Dev. 2005, 25, 332–340. [Google Scholar] [CrossRef]
- Farinotti, D.; Immerzeel, W.W.; de Kok, R.J.; Quincey, D.J.; Dehecq, A. Manifestations and mechanisms of the Karakoram glacier anomaly. Nat. Geosci. 2020, 13, 8–16. [Google Scholar] [CrossRef]
- Kamb, B.; Raymond, C.F.; Harrison, W.D.; Engelhardt, H.; Echelmeyer, K.A.; Humphrey, N.; Brugman, M.M.; Pfeffer, T. Glacier surge mechanism: 1982–1983 surge of variegated glacier, Alaska. Science 1985, 227, 469–479. [Google Scholar] [CrossRef]
- Dowdeswell, J.A.; Hamilton, G.S.; Hagen, J.O. The duration of the active phase on surge-type glaciers: Contrasts between Svalbard and other regions. J. Glaciol. 1991, 37, 388–400. [Google Scholar] [CrossRef] [Green Version]
- Murray, T.; Strozzi, T.; Luckman, A.; Jiskoot, H.; Christakos, P. Is there a single surge mechanism? Contrasts in dynamics between glacier surges in Svalbard and other regions. J. Geophys. Res. Solid Earth 2003, 108. [Google Scholar] [CrossRef]
- Frappé, T.-P.; Clarke, G.K.C. Slow surge of Trapridge Glacier, Yukon Territory, Canada. J. Geophys. Res. Earth Surf. 2007, 112. [Google Scholar] [CrossRef]
- Sevestre, H.; Benn, D.I. Climatic and geometric controls on the global distribution of surge-type glaciers: Implications for a unifying model of surging. J. Glaciol. 2015, 61, 646–662. [Google Scholar] [CrossRef]
- Benn, D.I.; Fowler, A.C.; Hewitt, I.; Sevestre, H. A general theory of glacier surges. J. Glaciol. 2019, 65, 701–716. [Google Scholar] [CrossRef]
- Grant, K.L.; Stokes, C.R.; Evans, I.S. Identification and characteristics of surge-type glaciers on Novaya Zemlya, Russian Arctic. J. Glaciol. 2009, 55, 960–972. [Google Scholar] [CrossRef]
- Quincey, D.J.; Braun, M.; Glasser, N.F.; Bishop, M.P.; Hewitt, K.; Luckman, A. Karakoram glacier surge dynamics. Geophys. Res. Lett. 2011, 38. [Google Scholar] [CrossRef]
- Yasuda, T.; Furuya, M. Short-term glacier velocity changes at West Kunlun Shan, Northwest Tibet, detected by synthetic aperture radar data. Remote Sens. Environ. 2013, 128, 87–106. [Google Scholar] [CrossRef]
- Quincey, D.J.; Luckman, A. Brief communication: On the magnitude and frequency of Khurdopin glacier surge events. Cryosphere 2014, 8, 571–574. [Google Scholar] [CrossRef]
- Gibson, M.J.; Glasser, N.F.; Quincey, D.J.; Rowan, A.V.; Irvine-Fynn, T.D. Changes in glacier surface cover on Baltoro glacier, Karakoram, North Pakistan, 2001–2012. J. Maps 2017, 13, 100–108. [Google Scholar] [CrossRef]
- Paul, F.; Strozzi, T.; Schellenberger, T.; Kääb, A. The 2015 surge of hispar glacier in the Karakoram. Remote Sens. 2017, 9, 888. [Google Scholar] [CrossRef] [Green Version]
- Chudley, T.R.; Willis, I.C. Glacier surges in the North-West West Kunlun Shan inferred from 1972 to 2017 landsat imagery. J. Glaciol. 2019, 65, 1–12. [Google Scholar] [CrossRef]
- Kotlyakov, V.M.; Osipova, G.B.; Tsvetkov, D.G. Monitoring surging glaciers of the Pamirs, Central Asia, from space. Ann. Glaciol. 2008, 48, 125–134. [Google Scholar] [CrossRef]
- Yan, J.; Lv, M.; Ruan, Z.; Yan, S.; Liu, G. Evolution of surge-type glaciers in the Yangtze River headwater using multi-source remote sensing data. Remote Sens. 2019, 11, 2991. [Google Scholar] [CrossRef]
- Zhou, S.; Yao, X.; Zhang, D.; Zhang, Y.; Liu, S.; Min, Y. Remote sensing monitoring of advancing and surging glaciers in the Tien Shan, 1990–2019. Remote Sens. 2021, 13, 1973. [Google Scholar] [CrossRef]
- Bolch, T.; Pieczonka, T.; Mukherjee, K.; Shea, J. Brief communication: Glaciers in the Hunza Catchment (Karakoram) have been nearly in balance since the 1970s. Cryosphere 2017, 11, 531–539. [Google Scholar] [CrossRef]
- Berthier, E.; Brun, F. Karakoram geodetic glacier mass balances between 2008 and 2016: Persistence of the anomaly and influence of a large rock avalanche on Siachen glacier. J. Glaciol. 2019, 65, 494–507. [Google Scholar] [CrossRef]
- Goerlich, F.; Bolch, T.; Paul, F. More dynamic than expected: An updated survey of surging glaciers in the Pamir. Earth Syst. Sci. Data 2020, 12, 3161–3176. [Google Scholar] [CrossRef]
- Guo, L.; Li, J.; Dehecq, A.; Li, Z.; Li, X.; Zhu, J. A new inventory of High Mountain Asia surge-type glaciers derived from multiple elevation datasets since the 1970s. Earth Syst. Sci. Data Discuss. 2022, 2022, 1–21. [Google Scholar] [CrossRef]
- Verbesselt, J.; Hyndman, R.; Newnham, G.; Culvenor, D. Detecting trend and seasonal changes in satellite image time series. Remote Sens. Environ. 2010, 114, 106–115. [Google Scholar] [CrossRef]
- Wu, Q.; Liu, K.; Song, C.; Wang, J.; Ke, L.; Ma, R.; Zhang, W.; Pan, H.; Deng, X. Remote sensing detection of vegetation and landform damages by coal mining on the Tibetan Plateau. Sustainability 2018, 10, 3851. [Google Scholar] [CrossRef] [Green Version]
- Potter, C.; Coppernoll-Houston, D. Controls on land surface temperature in deserts of Southern California Derived from MODIS satellite time series analysis, 2000 to 2018. Climate 2019, 7, 32. [Google Scholar] [CrossRef]
- Friedrich, H.K.; Van Den Hoek, J. Breaking ground: Automated disturbance detection with landsat time series captures rapid refugee settlement establishment and growth in North Uganda. Comput. Environ. Urban Syst. 2020, 82, 101499. [Google Scholar] [CrossRef]
- Brun, F.; Berthier, E.; Wagnon, P.; Kääb, A.; Treichler, D. A spatially resolved estimate of High Mountain Asia glacier mass balances from 2000 to 2016. Nat. Geosci. 2017, 10, 668–673. [Google Scholar] [CrossRef] [PubMed]
- RGI Consortium. Randolph Glacier Inventory (RGI)—A Dataset of Global Glacier Outlines: Version 6.0; Global Land Ice Measurements from Space: Boulder, CO, USA, 2017. [Google Scholar]
- Hewitt, K. Glaciers of the Karakoram Himalaya BT. In Encyclopedia of Snow, Ice and Glaciers; Singh, V.P., Singh, P., Haritashya, U.K., Eds.; Springer: Dordrecht, The Netherlands, 2011; pp. 429–436. ISBN 978-90-481-2642-2. [Google Scholar]
- Kraaijenbrink, P.D.A.; Bierkens, M.F.P.; Lutz, A.F.; Immerzeel, W.W. Impact of a global temperature rise of 1.5 degrees celsius on Asia’s glaciers. Nature 2017, 549, 257–260. [Google Scholar] [CrossRef] [PubMed]
- Bhattacharya, A.; Bolch, T.; Mukherjee, K.; King, O.; Menounos, B.; Kapitsa, V.; Neckel, N.; Yang, W.; Yao, T. High Mountain Asian glacier response to climate revealed by multi-temporal satellite observations since the 1960s. Nat. Commun. 2021, 12, 4133. [Google Scholar] [CrossRef]
- Jakob, L.; Gourmelen, N.; Ewart, M.; Plummer, S. Spatially and temporally resolved ice loss in High Mountain Asia and the gulf of Alaska observed by CryoSat-2 swath altimetry between 2010 and 2019. Cryosphere 2021, 15, 1845–1862. [Google Scholar] [CrossRef]
- Mölg, N.; Bolch, T.; Rastner, P.; Strozzi, T.; Paul, F. A consistent glacier inventory for Karakoram and Pamir derived from landsat data: Distribution of debris cover and mapping challenges. Earth Syst. Sci. Data 2018, 10, 1807–1827. [Google Scholar] [CrossRef]
- Dehecq, A.; Gourmelen, N.; Gardner, A.S.; Brun, F.; Goldberg, D.; Nienow, P.W.; Berthier, E.; Vincent, C.; Wagnon, P.; Trouvé, E. Twenty-first century glacier slowdown driven by mass loss in High Mountain Asia. Nat. Geosci. 2019, 12, 22–27. [Google Scholar] [CrossRef]
- Burns, P.; Nolin, A. Using atmospherically-corrected landsat imagery to measure glacier area change in the Cordillera Blanca, Peru from 1987 to 2010. Remote Sens. Environ. 2014, 140, 165–178. [Google Scholar] [CrossRef]
- Durán-Alarcón, C.; Gevaert, C.M.; Mattar, C.; Jiménez-Muñoz, J.C.; Pasapera-Gonzales, J.J.; Sobrino, J.A.; Silvia-Vidal, Y.; Fashé-Raymundo, O.; Chavez-Espiritu, T.W.; Santillan-Portilla, N. Recent trends on glacier area retreat over the group of Nevados Caullaraju-Pastoruri (Cordillera Blanca, Peru) using landsat imagery. J. S. Am. Earth Sci. 2015, 59, 19–26. [Google Scholar] [CrossRef]
- Seehaus, T.; Malz, P.; Sommer, C.; Lippl, S.; Cochachin, A.; Braun, M. Changes of the tropical glaciers throughout Peru between 2000 and 2016—Mass balance and area fluctuations. Cryosphere 2019, 13, 2537–2556. [Google Scholar] [CrossRef]
- Morrison, J.; Higginbottom, T.P.; Symeonakis, E.; Jones, M.J.; Omengo, F.; Walker, S.L.; Cain, B. Detecting vegetation change in response to confining elephants in forests using MODIS time-series and BFAST. Remote Sens. 2018, 10, 1075. [Google Scholar] [CrossRef]
- Zhang, W.; Pan, H.; Song, C.; Ke, L.; Wang, J.; Ma, R.; Deng, X.; Liu, K.; Zhu, J.; Wu, Q. Identifying emerging reservoirs along regulated rivers using multi-source remote sensing observations. Remote Sens. 2019, 11, 25. [Google Scholar] [CrossRef]
- Hall, D.K.; Riggs, G.A.; Salomonson, V.V. Development of methods for mapping global snow cover using moderate resolution imaging spectroradiometer data. Remote Sens. Environ. 1995, 54, 127–140. [Google Scholar] [CrossRef]
- Lea, J.M. The Google Earth Engine Digitisation Tool (GEEDiT) and the Margin Change Quantification Tool (MaQiT)—Simple tools for the rapid mapping and quantification of changing earth surface margins. Earth Surf. Dynam. 2018, 6, 551–561. [Google Scholar] [CrossRef]
- Lea, J.M.; Mair, D.W.F.; Rea, B.R. Evaluation of existing and new methods of tracking glacier terminus change. J. Glaciol. 2014, 60, 323–332. [Google Scholar] [CrossRef]
- Hewitt, K. Tributary glacier surges: An exceptional concentration at Panmah Glacier, Karakoram Himalaya. J. Glaciol. 2007, 53, 181–188. [Google Scholar] [CrossRef]
- Paul, F. A 60-year chronology of glacier surges in the Central Karakoram from the analysis of satellite image time-series. Geomorphology 2020, 352, 106993. [Google Scholar] [CrossRef]


Publisher’s Note: MDPI stays neutral with regard to jurisdictional claims in published maps and institutional affiliations. |
© 2022 by the authors. Licensee MDPI, Basel, Switzerland. This article is an open access article distributed under the terms and conditions of the Creative Commons Attribution (CC BY) license (https://creativecommons.org/licenses/by/4.0/).
Share and Cite
Ke, L.; Zhang, J.; Fan, C.; Zhou, J.; Song, C. Large-Scale Monitoring of Glacier Surges by Integrating High-Temporal- and -Spatial-Resolution Satellite Observations: A Case Study in the Karakoram. Remote Sens. 2022, 14, 4668. https://doi.org/10.3390/rs14184668
Ke L, Zhang J, Fan C, Zhou J, Song C. Large-Scale Monitoring of Glacier Surges by Integrating High-Temporal- and -Spatial-Resolution Satellite Observations: A Case Study in the Karakoram. Remote Sensing. 2022; 14(18):4668. https://doi.org/10.3390/rs14184668
Chicago/Turabian StyleKe, Linghong, Jinshan Zhang, Chenyu Fan, Jingjing Zhou, and Chunqiao Song. 2022. "Large-Scale Monitoring of Glacier Surges by Integrating High-Temporal- and -Spatial-Resolution Satellite Observations: A Case Study in the Karakoram" Remote Sensing 14, no. 18: 4668. https://doi.org/10.3390/rs14184668