Article

Link Ecological and Social Composite Systems to Construct Sustainable Landscape Patterns: A New Framework Based on Ecosystem Service Flows

1
Key Research Base of Humanities and Social Sciences of the Ministry Education, Center for Studies of Marine Economy and Sustainable Development, Liaoning Normal University, Dalian 116029, China
2
University Collaborative Innovation Center of Marine Economy High-Quality Development of Liaoning Province, Dalian 116029, China
3
State Key Laboratory of Estuarine and Coastal Research, East China Normal University, Shanghai 200241, China
*
Author to whom correspondence should be addressed.
Remote Sens. 2022, 14(18), 4663; https://doi.org/10.3390/rs14184663
Submission received: 4 July 2022 / Revised: 14 August 2022 / Accepted: 16 September 2022 / Published: 19 September 2022

Abstract

:
Integrating the flow of supply and demand of ecosystem services (ESs) into the ecological security pattern (ESP) of coastal ecosystems with extremely fragile ecological backgrounds and contradictory human–land relationships is beneficial to the coordinated development of human–land systems. However, existing studies ignore the issue of scales of supply–demand linkages, making the ESP not properly guide sustainable development. Based on ESs delivery chain theory and landscape ecology approaches, we developed a sustainable development framework consisting of coupled microscopic natural–social systems. The method was tested using data from the Liao River Delta. In this study area, the natural supply potential and demand mapping distribution of key ESs were assessed to identify ecological sources in the Liao River Delta, a typical coastal zone in northern China. The resistance surface based on land use type assignment was modified using hydrological connectivity frequency and nighttime light intensity. Ecological corridors were extracted and optimized using a minimum cumulative resistance model and connectivity evaluation. The study found that the high supply area and the high demand reflection area are not consistent in location and supply level. Ecological source areas are evenly distributed, accounting for 12% of the total area. The ecological corridors are mainly concentrated in the west and southeast and do not cross the built-up areas in the east. This ESP framework safeguards the local demand for natural products and the natural potential to maintain services over the longer term and to a larger scale while informing the development of environmental management measures.

Graphical Abstract

1. Introduction

Intensive human activities have sharply compressed urban ecological space, threatening the sustainable development of human society. For coastal cities, the intensive use of coastal wetlands and other ecological resources by reclamation activities is typical [1]. At the same time, human society has to rely on natural ecosystems for survival and development. They provide essential services to people, including a fresh water supply, carbon sequestration, and the provision of fish and wildlife habitat [2,3]. Under the combined pressures of urban sprawl and declining natural services, intervention strategies that prioritize natural spaces, considering the potential for natural services and human needs, are vital [4,5]. There is a critical need for methods that reflect supply and demand dynamics in natural and social systems to ensure that ecosystem services (ESs) flow efficiently. Sustainable landscape patterns that meet these new requirements have thus become a hot research topic at the intersection of landscape ecology and landscape sustainability science [6].
In contrast to ecological networks that focus on biodiversity [7], ecological security patterns (ESP) are among multiple sustainable landscape patterns that focus more on protecting and enhancing regional ecosystem structures, functions, and services through an integrated focus on multiple ecological elements [8]. Ecological sources are the most important and the first ecological elements to be extracted. Early researchers used important natural and human landscapes and water sources as core patches [9]. Nowadays, graphical analysis and connectivity evaluation, as well as evaluation systems consisting of the importance and sensitivity of ecological functions as the leading indicators, are often used in the extraction of ecological sources [10,11,12]. ESs, which characterize the importance of ecological functions, are the most commonly used quantitative indicators in extracting ecological sources. Sustainable landscape patterns require ecological sources with a high supply of ESs and meet the human needs of the area. In urban spaces with clear functional zoning, these two requirements are often not met in the same space, meaning that a mismatch between supply and demand in the same space may be justified [13,14]. However, existing ESP studies lack consideration of the linkages or flows between supply and demand for ESs. Therefore, the extracted ecological sources are challenging to secure for the region’s sustainable development.
The objective processes and functions of ecosystems are considered to be the supply potential of their services, of which the part that meets the requirements of human well-being is considered ecological demand [15]. These two areas correspond to the service beneficiary areas (SBA), which are predominantly urban areas, and the service provisioning areas (SPA), which are predominantly natural spaces [16,17]. The ecological service flow theory considers the complete ES delivery process to include the SPA, the SBA, and the service flow that connects these two areas. This means that the service flows can identify natural supply areas that meet human needs, and the ecological sources obtained in this way can help solve the problem of effective supply of ESs [18]. In order to apply service flows to ecological security patterns and form an adjustment strategy for ecological source areas from the perspective of ecosystem supply and demand coupling, we need a clear and specific understanding of the characteristics, mechanisms, and processes of multiple service flow that are closely related to regions. However, many articles focus only on flow studies of single services, such as freshwater supply studies based on the SPAN model [19], wind and sand control based on the HYSPLIT model, and recreational services based on the linear programming model [20,21]. The directional analysis is often based on administrative units and uses size differences to represent gradient flows, making it difficult to guide prioritized conservation or restoration policies for smaller-scale study areas [22].
Since the 1990s, intensive reclamation activities have contributed significantly to the socioeconomic development of coastal areas. However, at the same time, the material cycle and energy flow of coastal wetland ecosystems in the coastal zone have been severely disturbed, and the original ecosystem components and organic structure have been damaged, preventing the overall ecological services and ecological connectivity from functioning correctly [23]. This paper hopes to provide a new methodological framework that can protect the overall ecological function and connectivity while meeting the development needs of human society. A coordinated ecological security pattern of coastal wetland ecosystems and social systems is constructed by considering ecosystems’ composite supply potential, service flow, and network connectivity. The ecological components of the pattern can provide a reliable spatial reference for conservation and restoration actions [24], safeguard the demand for natural products within the region, and maintain the natural potential to provide services in the longer term and to a larger scale.
The Liao River Delta is a crucial area for ecological monitoring and control of the coastal zone. It has the most significant coastal reed swamp wetland globally, listed in the Ramsar Convention and national nature reserve [25]. It is also home to the third-largest oil field in the country. Under the background of severe ecological and environmental problems in the study area, existing small-scale restoration activities ignore ecosystem supply and demand and large-scale spatial integration. In contrast, ecosystem security pattern construction can compensate for the lack of research objects and study scales [26]. Therefore, the objectives of this study are to (1) deconstruct and quantify the process of spatial flow transport and delivery of ES so that ES demand is reflected in the natural spaces that provide local services at a clear spatial extent and size; (2) propose a new method for identifying ecological source sites by combining ES demand allocation mapping and natural supply potential; (3) use a minimum cumulative resistance (MCR) model, combined with hydrological connectivity assessment and nighttime light intensity (NLI) to extract ecological corridors and further optimize them; and (4) propose relevant recommendations for regional ecological management.

2. Materials and Methods

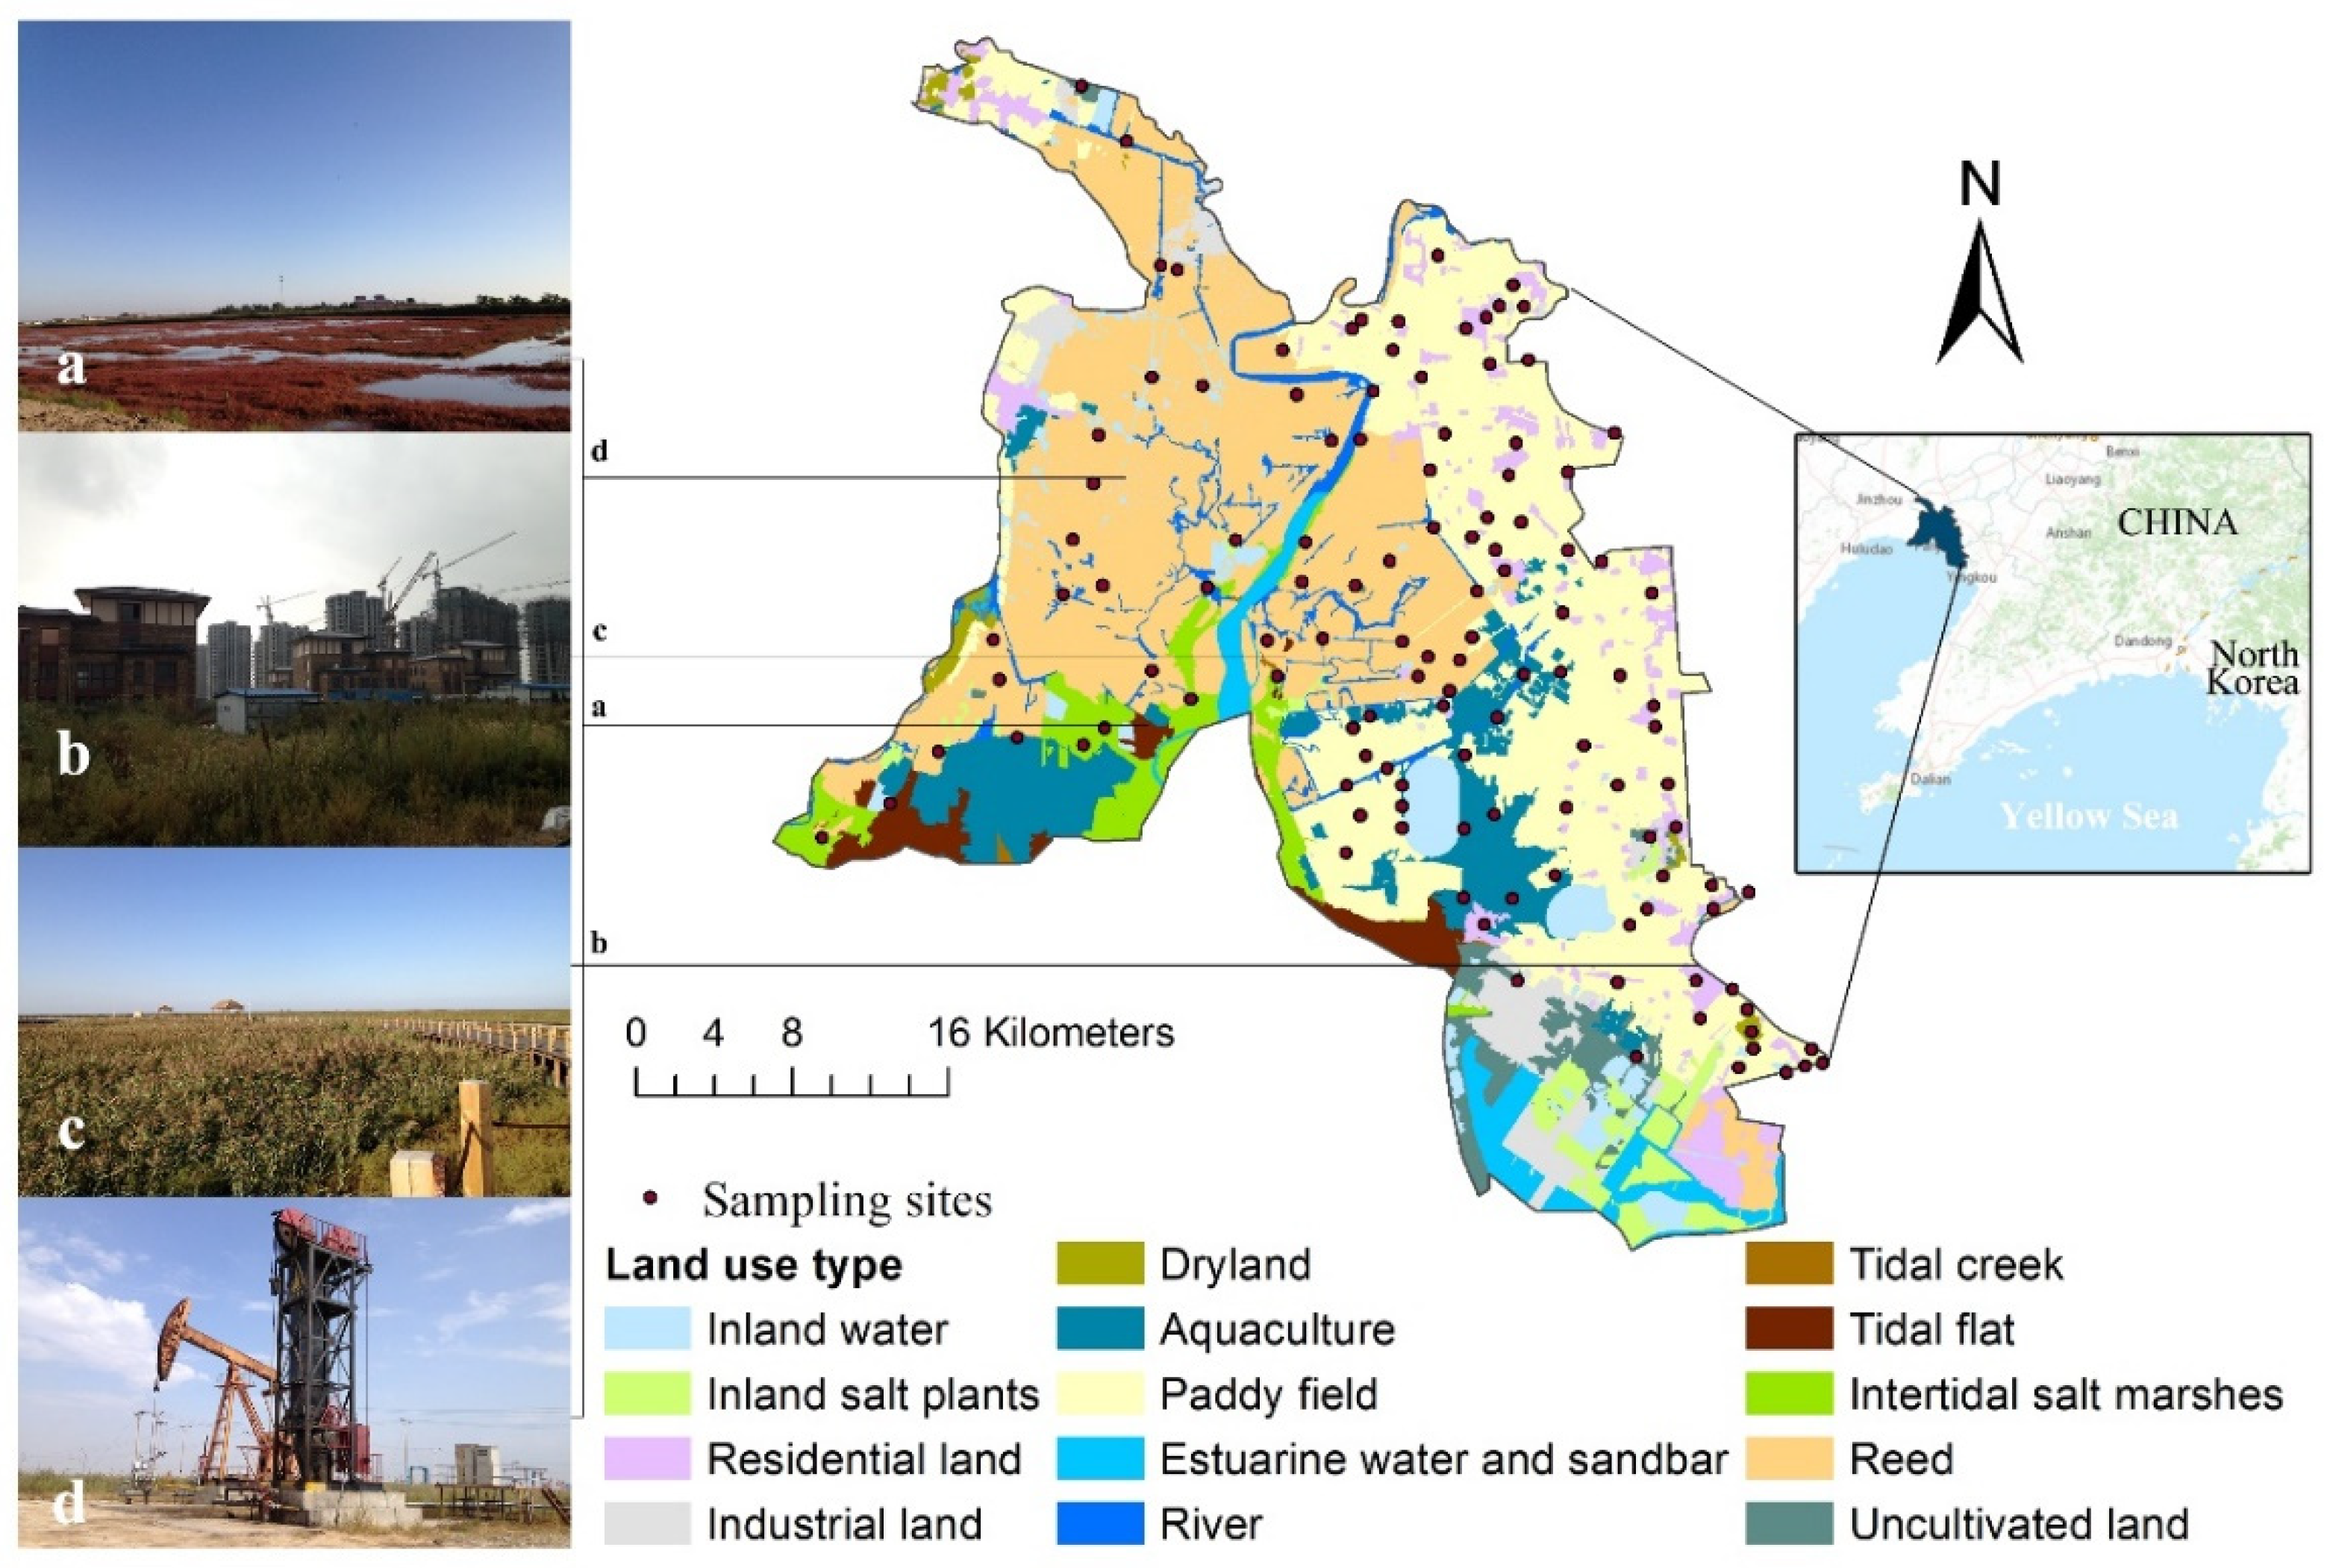
2.1. Study Area and Data Sources

Located in Northeast China, the Liao River Delta has one of the best-preserved wetlands globally (Figure 1). We have delineated the study boundary based on the principle of wetland and administrative integrity. The total area is 1388.28 km2, of which wetlands account for 51.44%. The total population is about 480,000, mainly in the east and northwest. Several rivers, including the Liao River, flow into the sea here. The whole region has a temperate semi-humid monsoon climate with an average annual rainfall of 650 mm. Considering the study area’s characteristics and the core ecological risks, we selected the following four key ESs: (1) habitat quality, where 446 species of various wildlife, mainly birds, are distributed; (2) carbon sequestration, where coastal wetlands are an important carbon sink in the Earth’s surface system [27]; (3) water purification, related to surface water quality management at the national level; and (4) landscape aesthetic services, in the knowledge economy era, one of the urban dwellers’ urgent needs and development priorities [21].
Ten data types, including the following for 2020, were collected for this study. (1) Land use data and Normalized difference vegetation index (NDVI) data were interpreted and computationally synthesized using Landsat 8 OLI_TIRS remote-sensing imagery (Landsat 8 OLI_TIRS) with a spatial resolution of 30 m from the United States Geological
Survey website (https://earthexplorer.usgs.gov/, accessed on 30 December 2021). Land use types are divided into 14 categories: tidal flat, tidal creek, intertidal salt marsh, reed, inland salt plant, river, inland water, paddy field, dryland, residential land, industrial land, estuarine water and sandbar, uncultivated land and aquaculture. Based on a comparison with data from high-resolution remote-sensing imagery and field validation sites, the Kappa index was 0.91, and the classification results were reliable. The accuracy of each category and the sample size are detailed in Supplementary Figure S1. (2) Soil data, including aboveground biomass and soil organic carbon content, were obtained from data from 121 sampling sites measured by the team. (3) Elevation data were from the National Aeronautics and Space Administration (NASA; http://reverb.echo.nasa.gov/ (accessed on 2 March 2022)) and had a spatial resolution of 30 m; the data were processed by cropping and filling depressions. (4) Population data with a spatial resolution of 100 m were from WorldPop (https://www.worldpop.org/ (accessed on 5 March 2022)). (5) Precipitation data were monthly surface climate data from the China Meteorological Data Service Center (http://data.cma.cn/ (accessed on 5 March 2022)). The data of seven meteorological stations in the study area and adjacent areas were selected and spatially interpolated by an ArcGIS inverse distance weighting method to obtain a meteorological raster. (6) Suomi NPP VIIRS nighttime light data were from NOAA (https://ngdc.noaa.gov/ (accessed on 5 March 2022)). (7) A total of 6467 migratory bird observation records from 2013 to the present were obtained from the open-source eBird website (www.ebird.org (accessed on 5 March 2022)). (8) The inundation probability was derived from a surface water remote-sensing dataset (http://global-surface-water.appspot.com/ (accessed on 5 March 2022)). (9) Traffic points of interest came from map data service providers (http://www.rivermap.cn/ (accessed on 5 March 2022)). (10) Socioeconomic statistics: average grain production, average market price of grain, national per capita tourism income; per capita tourism income of the study area, etc., were from the Panjin City Statistical Yearbook (http://www.panjin.gov.cn/ (accessed on 5 March 2022)) and the China Statistical Yearbook (http://www.stats.gov.cn/ (accessed on 5 March 2022)). All spatial data were interpolated and refined to a 30 m resolution raster using ArcGIS.

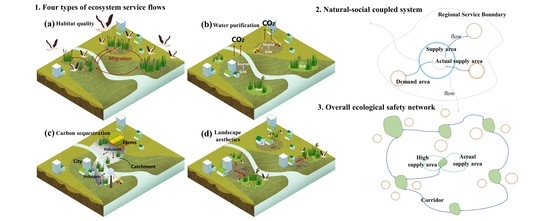
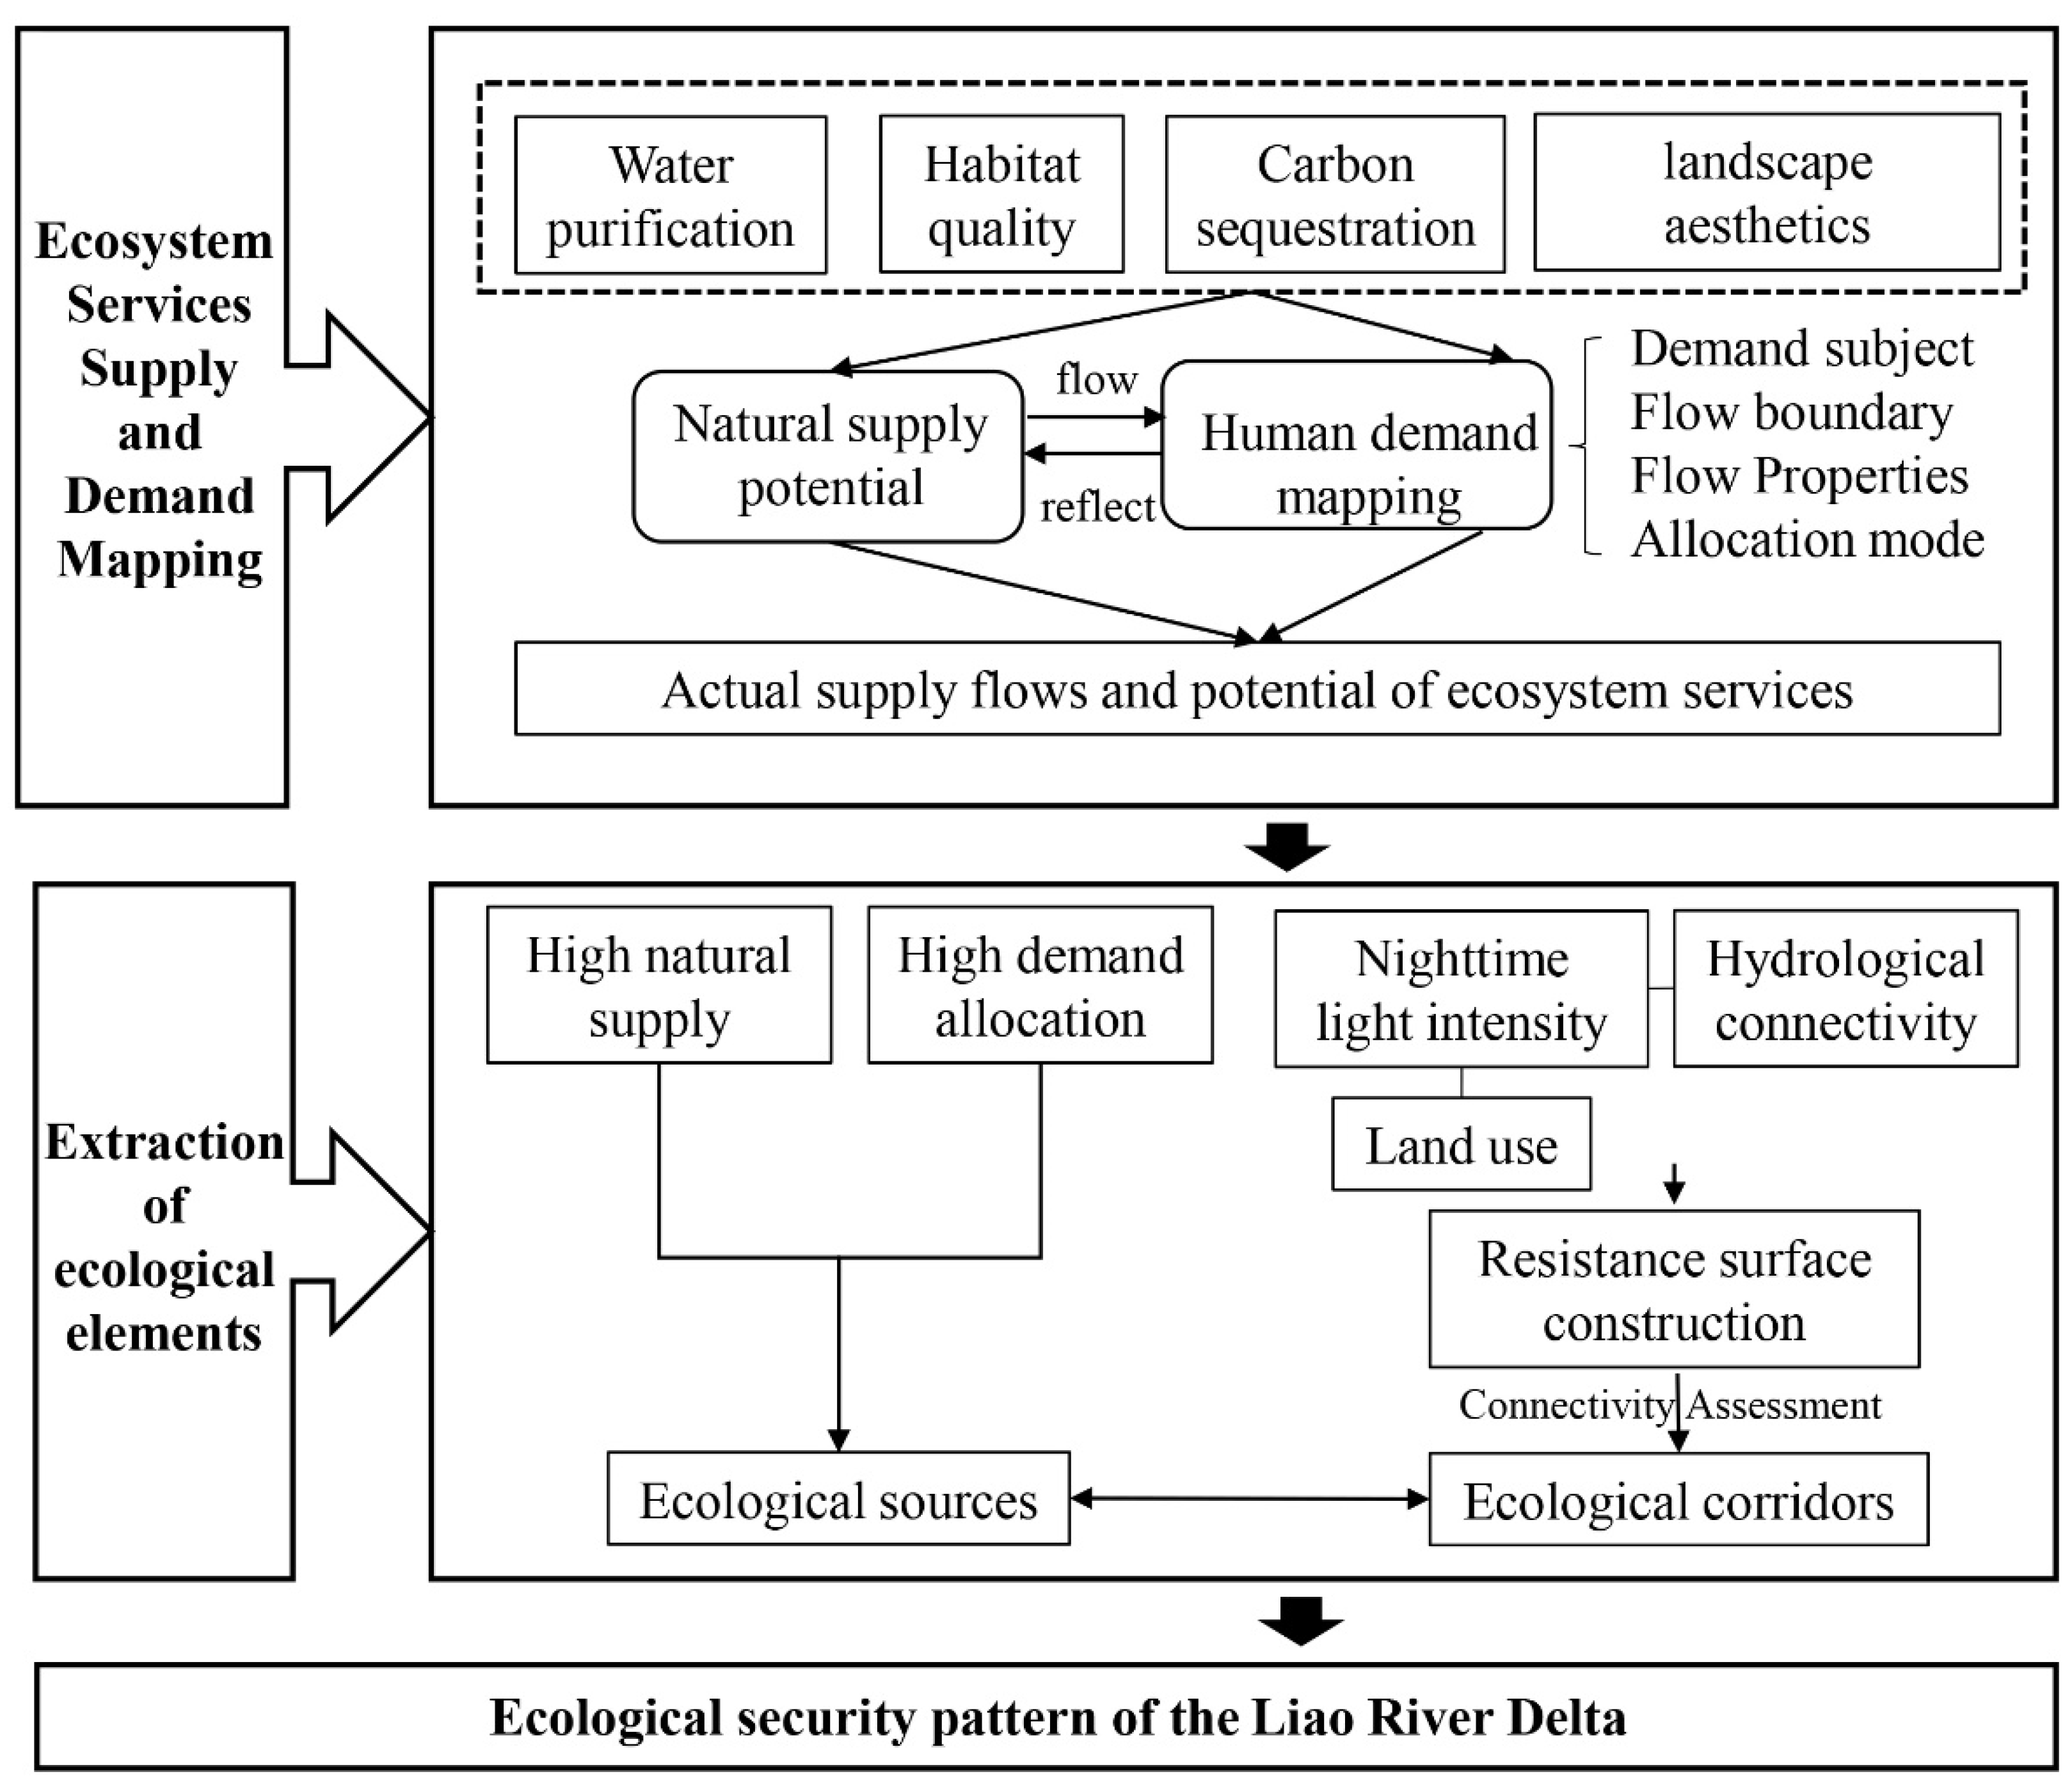
2.2. ESP Identification Framework

In this paper, a sustainable landscape pattern of coastal wetland ecosystem is proposed. This ESP is an ecological network based on the theory of landscape pattern optimization and ES delivery chain consisting of core patches that provide actual ESs, high-value ecological functional areas, and ecological corridors. Through the protection and management of important ecological elements, it has the following benefits. Firstly, it safeguards the demand of the socioeconomic system for natural patches to provide indirect or direct ESs; secondly, it enhances network connectivity and reduces ecological problems of habitat fragmentation and patch isolation; thirdly, it regulates green infrastructure configuration according to the matching relationship between supply and demand of natural patch services. This ESP construction process mainly includes the following two parts.
Mapping the supply and demand of ESs: Human well-being and economic activities depend heavily on ecosystem functions and processes. We constructed a multi-source database based on data availability and regional characteristics and mapped the spatial distribution and magnitude of supply capacity for habitat quality, water purification, carbon sequestration, and landscape aesthetics services. Considering the spatial separation of supply and benefit areas, we hypothesized that ES demand could also be allocated and projected to the corresponding natural spaces based on the movement of spatial flows from the sources that produce the services to the sinks that generate the demand. In this study area, ES demand originates not only from built-up settlements but also from people’s pressure for surface water management and the requirement to protect migratory birds [28]. After identifying the demand subjects, we used an abstract spatial flow quantification method based on traffic flows. ES demands are reflected in natural space according to the flow direction, flow rate, boundaries, and distribution patterns along with distances of ecological flows [14,29]. Figure 2 illustrates the conceptual framework of this study.
Ecological element identification: The supply and demand mapping of ESs was used to quantify the ecosystem background and the ecological pressure given by humans. Ecological sources are further identified by combining the mapping results of both. The resistance surface represents how different landscape units or habitat patches impede species migration [30]. It is mainly determined based on land use types and the influence of human facilities such as transportation and oil wells. Due to the influence of the regional hydrological environment on biological migration, this study incorporates hydrological connectivity to correct the resistance surface. As a feature of human activity intensity, NLI was also used to modify patch resistance [31]. Based on the resistance surface and connectivity evaluation, ecological corridors were extracted and optimized, facilitating more efficient ecological management [32]. Ecological sources and corridors form a complete ecological security pattern.

2.3. Assessment of Ecosystem Services

These four key ESs encompass the many types of ESs specified in the CICES classification v4.3 (https://cices.eu (accessed on 10 March 2022)), such as regulating and supporting and cultural services, comprehensively reflecting the regional ecological security. Some of the services assessed represent relative rather than absolute sizes within the region, and we have standardized their classification to guide the identification of ecological elements. The detailed calculation process is shown in Table 1 and Table 2.

2.3.1. Habitat Quality

Natural supply potential: Habitat quality is the ability of an ecosystem to provide the conditions necessary for survival and reproduction [39]. Habitat quality depends on the relative impact of each threat, the relative sensitivity of each habitat type to each threat, the distance between the habitat and the source of the threat, and the degree to which the land is legally protected. A decline in habitat quality is seen due to the increased intensity of nearby land use. The habitat quality module of the InVEST model generates a habitat quality index map by combining information on land cover and biodiversity threat factors [38]. The relevant parameters were set using an expert scoring method and adjusted concerning literature from similar study areas, with the participation of 10 experts, including ecologists, geographers, and planners (please see Supplementary Tables S1 and S2 in the Supplementary Materials).
Demand reflection: The study area is an important migration route for migratory birds in eastern China, the southernmost part of the natural breeding area and the northernmost part of the wintering area of the Grus japonensis, and one of only a few critical breeding sites for Larus saundersi in the world. In addition, compared to other waterbirds, the Grus japonensis and the Larus saundersi are more sensitive to changes in the external environment; hence, the Larus saundersi and the Grus japonensis were used as sensitive species and conservation targets in this study [40,41]. From the perspective of human needs, conservation actions maintain or increase the abundance and diversity of other species used or enjoyed by people.
The main ranges of indicator species are reed and saltmarsh patches, and they may move arbitrarily through these patches. Kernel density estimation, a non-parametric method for estimating an unknown probability density function, was used to determine indicator species’ spatial distribution [42]. The intersection of the estimated spatial distribution with the main habitat patches reflects conservation needs in natural space.

2.3.2. Carbon Sequestration

Natural supply potential: The study area has large areas of mature natural wetlands and artificial coastal wetlands, which play an essential role in absorbing greenhouse gases from the atmosphere and mitigating global warming. Normally, organic matter is released back into the atmosphere in the form of carbon dioxide when plants wither. Due to the particular environment of wetland soils, the decomposition process will be slowed down or terminated by the lack of oxygen and low pH so that carbon is sequestered in the peat soil. In the long term, wetlands are global carbon sinks [43]. This study modeled carbon stocks based on aboveground biomass, belowground biomass, soil carbon pools, and dead organic matter [35]. The carbon pool table and carbon sink accounting instructions for the region is detailed in Supplementary Table S3.
Demand reflection: Carbon flow has the characteristics of in situ, directional, and omnidirectional flow, and its range is global [44]. In large-scale studies, the proportion of natural cover to the area of the administrative district is often used to represent carbon sink capacity, and all natural patches within the administrative district are also considered SPAs for the absorption of human carbon emissions [45]. This approach does not apply to this study area due to the relatively small size and concentration of natural patches.
Mature natural wetland systems are enormous carbon reservoirs, with 50 times more peatland carbon storage than terrestrial ecosystems globally [43]. Coastal wetlands and their ESs in large river deltas show sensitive responses to anthropogenic disturbances such as hydrological engineering, seawall construction, and land reclamation [46,47]. When wetlands are disturbed, peatlands cease to be a carbon reservoir and act as a source of carbon [48]. Therefore, wetland patches that are subject to high levels of human disturbance should be identified and protected, both for large-scale climate protection and for the prioritization of ecological elements for management at the local scale. Two indicators, therefore, influence the mapping of demand for this service: human disturbance and natural capacity to sequester carbon.

2.3.3. Water Purification

Natural supply potential: water purification means improving water quality, including the deposition, filtration, adsorption, biological absorption, and biochemical transformation of pollutants in sewage. Pollutants in the upper reaches of estuaries and near shore mainly come from agricultural fertilizers, pesticides, and industrial effluents. Coastal wetlands can partially decompose and eliminate the nutrients of these pollutants and serve the function of water purification. The actual capacity of the ecosystem to remove nitrogen or pollutants cannot be measured [49]. Because the removal rate of nitrogen and phosphorus by wetland vegetation was significantly correlated with vegetation nitrogen and phosphorus accumulation [50], this study used the relative amount of nitrogen and phosphorus accumulation in each land use to measure the water purification capacity and used NDVI to correct the vegetation purification capacity index.
Demand reflection: Several rivers in the study area are downstream sections into the sea, and the pressure on surface water quality assessment is high. Total P was chosen as the pollution indicator for this study in combination with the main pollution indicators for surface water communicated by the Chinese Ministry of Ecology and Environment and the availability of nitrogen- and phosphorus-related data. Many studies have used the catchment area as a physiographic unit for statistics and analysis of water-related ecosystems [14,44,51]. Like carbon sequestration, water purification service flows are in situ, directional, and all-encompassing but are relatively limited in extent. The spatial flow area for water purification services in this study was identified as the catchment area where the river network outlet is located. This service flow allocation mechanism is a complex exponential function related to topographic indices and filtration efficiency [52,53], and the Nutrient Delivery Ratio (NDR) module of the Invest model can help to assess the nutrient retention by natural vegetation as it moves from nutrient sources to streams.

2.3.4. Landscape Aesthetics

Natural supply potential: Landscape aesthetics is mainly reflected in the recreational, cultural, and artistic aspects of landscape evaluation. This study used the ESs value equivalent scale method to assess the capacity of this service [36,54]. Its capacity values are related to land use type, food production, and value. In addition, a correction is needed considering that there is some error in characterizing regional features with a national parameter scale. As tourism can indirectly reflect the aesthetic value of the landscape, the aesthetic value was corrected for tourism income.
Demand reflection: According to Maslow’s needs theory, people need access to natural spaces to satisfy their physical, cognitive, and aesthetic needs [55]. We used the population size of the settlement and the distance to the nearest natural space to express the outdoor recreation demand index. Based on the travel patterns of residents, 5 km is considered the furthest range that people are willing to travel for daily recreation and short trips. As demand is proportional to the likelihood of people’s activities and the proximity of surrounding natural spaces [56], this study linearly assigned demand to natural spaces based on population size and distance from natural spaces within 5 km.

2.4. Identification of Ecological Elements

2.4.1. Ecological Sources

Ecological sources are one of the core ecological elements of an ESP and need to have high quality ecological functions and provide sustainable ESs for human well-being [57]. The former is expressed as the natural supply potential of ESs, and the latter is reflected in the mapping of demand. Due to conservation costs and efficiency, the top 20% of patches for each of the two indicators were extracted, and the ensemble of the two was defined as the ecological source (Equation (1)) [58]. In particular, the intersection of the two indicators was chosen for the ecological source of this service, as the natural potential of habitat quality cannot be distinguished in the calculation method from the extent to which reed habitats are adapted to biodiversity. Patches less than 20 ha in size were excluded, taking into account the natural condition of the study area and the cost of conservation.
E c o l o g i c a l   s o u r c e = i = 1 n ( S u p p l y i > 1 5 ) o r ( D e m a n d i > 1 5 ) , A r e a > A r e a m i n
where Supplyi > 1/5 refers to the patches with the first 1/5 score of the layer of the i-th ES supply potential; Demandi > 1/5 refers to the natural spaces with the first 1/5 score reflected by the i-th ES demand; and Area means the ecological source area, with Areamin for the minimum of the source area.

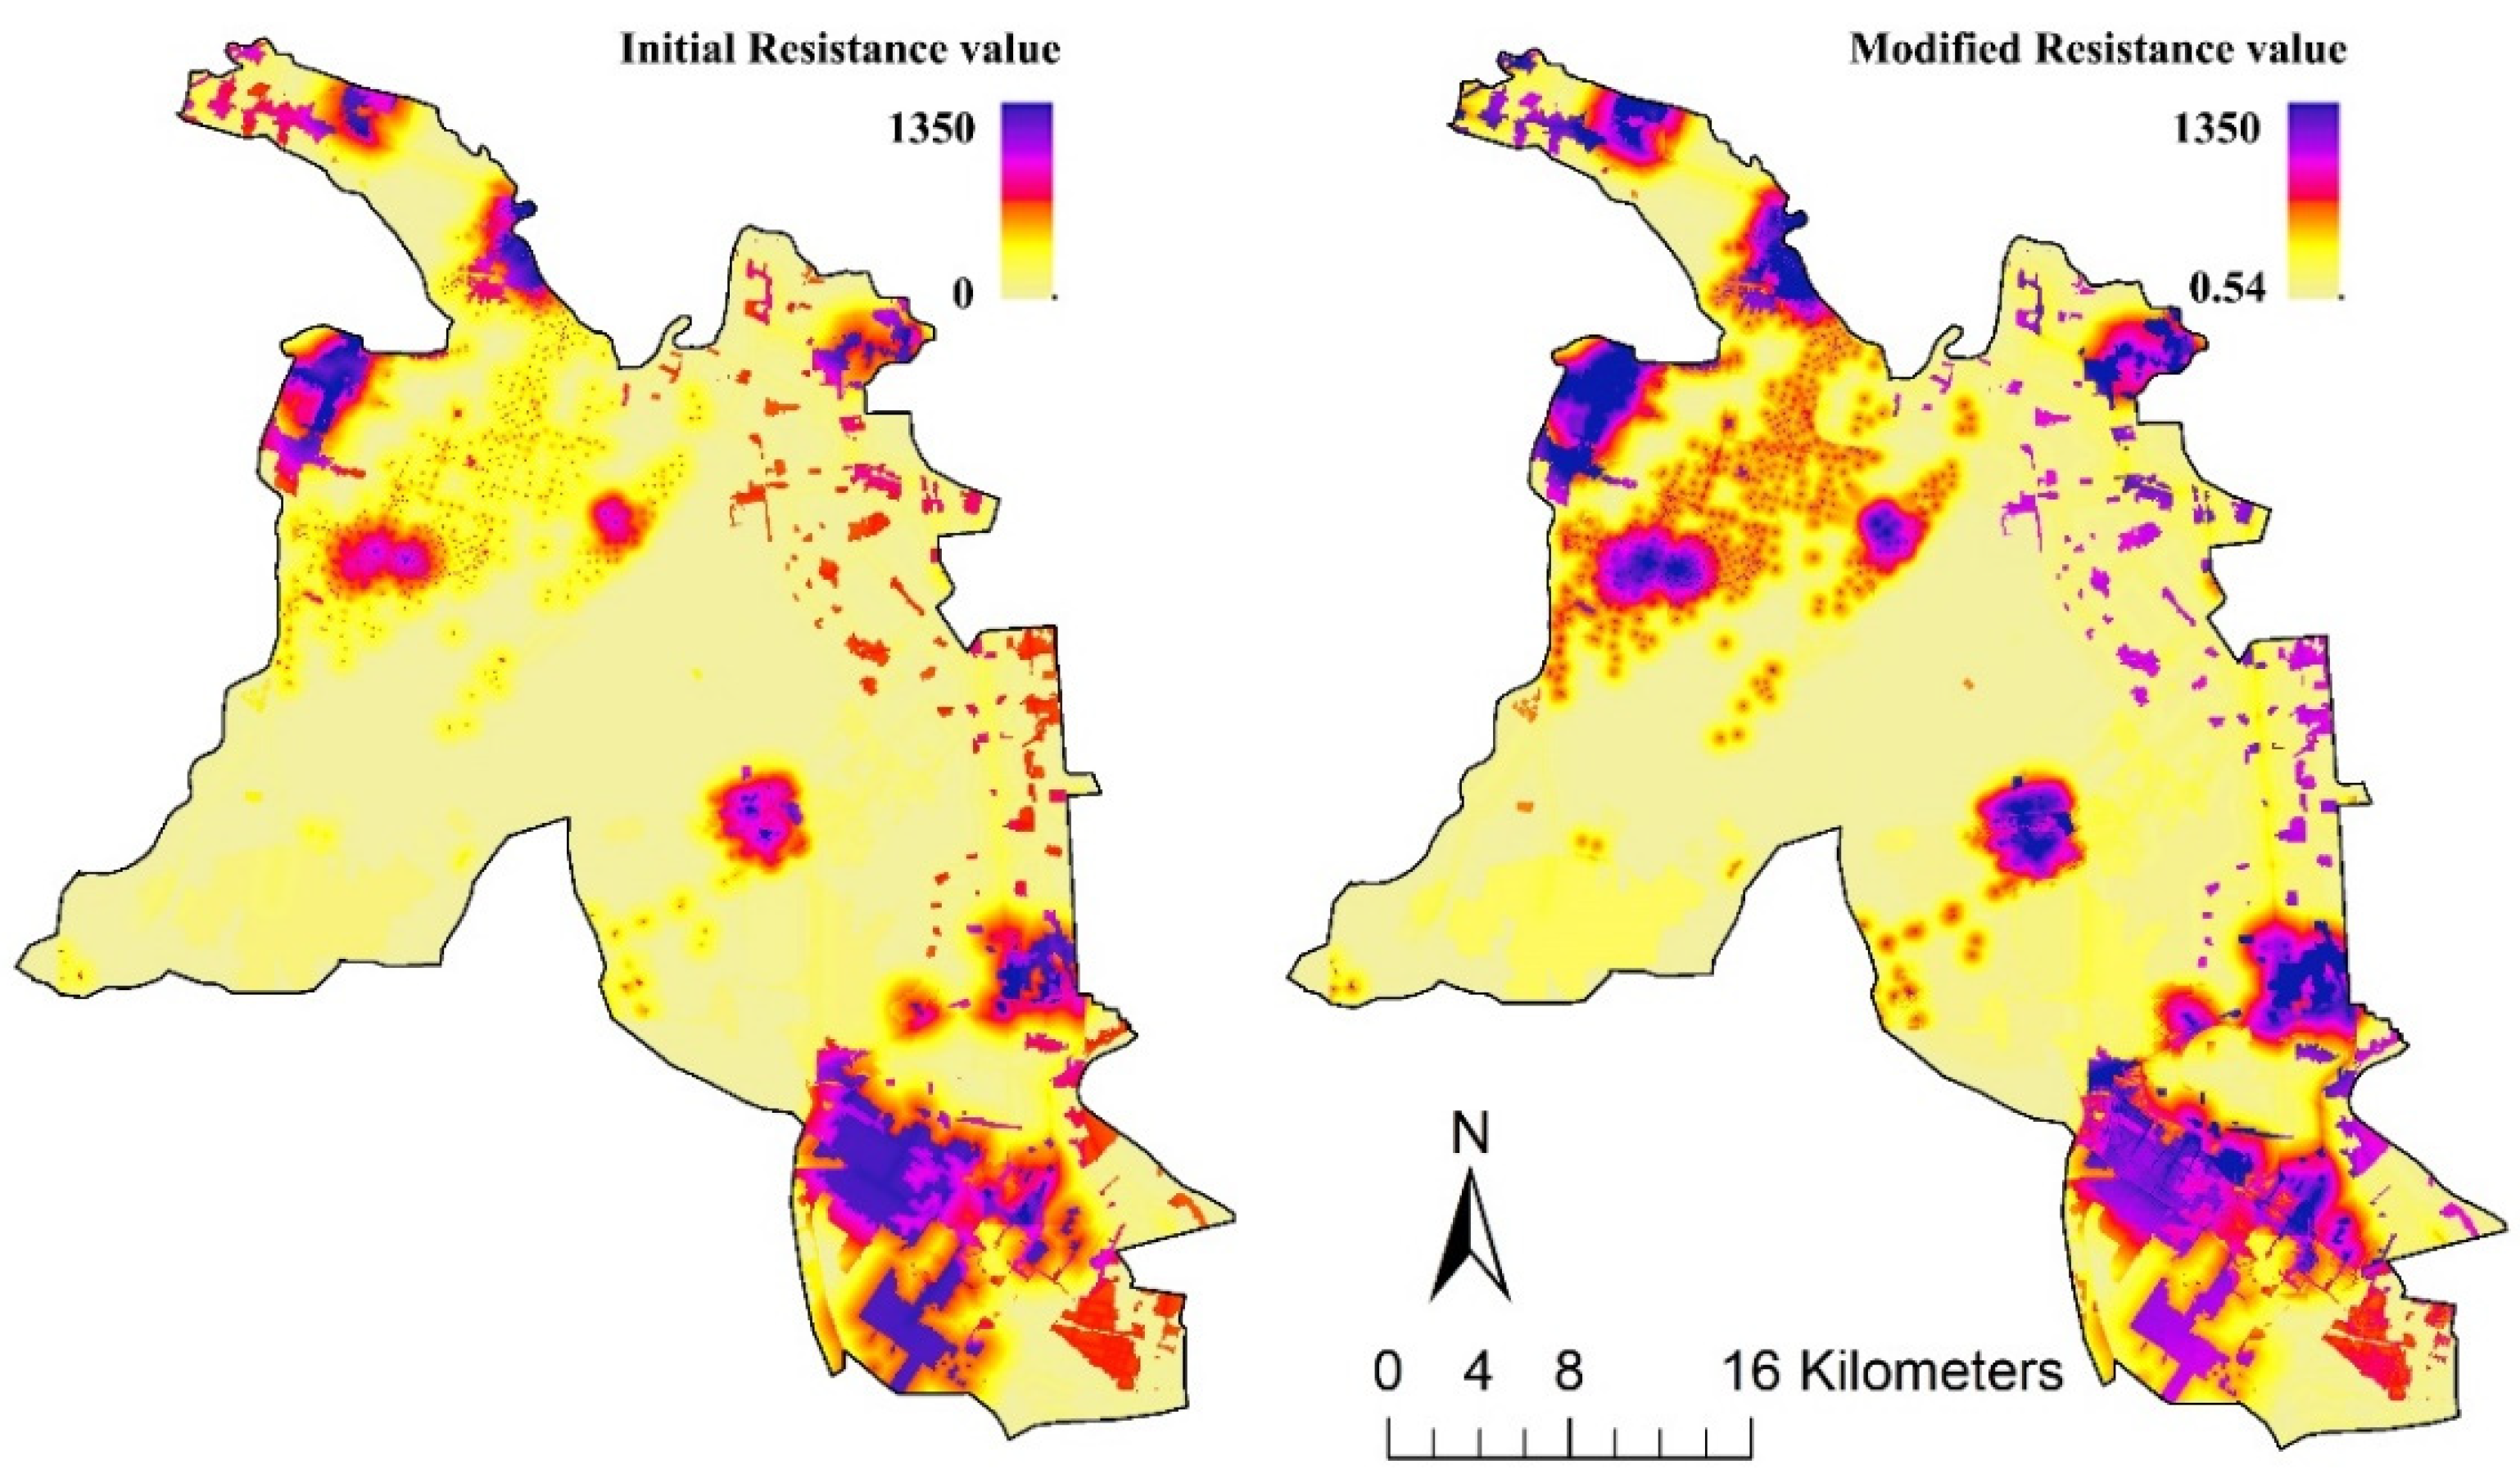
2.4.2. Ecological Corridors

Ecological corridors are located between different ecological sources and enhance the combined supply of biodiversity and ES, providing social and economic benefits to humans [59]. The resistance surface is based on a combination of the assignment of ecological resistance to land use types and artificial facilities and the extent of their influence (Table 3) [60,61]. It reflects the state and trends of physical movement, indicating the resistance that species need to overcome in their flow from source to other spaces [62]. Referring to [10], we further corrected the resistance values for land type using hydrological connectivity, which represents a natural attribute, and NLI, which is a social attribute (Equation (2)) [60]. The relationship between biodiversity and hydrological connectivity has been demonstrated in macrobenthos and aquatic organisms [63,64]. In this paper, hydrological connectivity is expressed as an index of inundation probability [65]. As a common practice for extracting corridors, we used the MCR model to identify least-cost pathways as potential ecological corridors based on a new resistance surface (Equation (3)). Next, potential corridors were optimized to determine how much they contribute to network connectivity by evaluating the overall connectivity change caused by removing them [66]. This is defined by the following expressions:
R = ( 1 H C ) + N L I ( 1 N L I ) + H C + ( H C × N L I ) × R
MCR = f m i n j = n i = m ( D i j × R i )
P C = i = 1 n j = 1 n a i a j p i j A L 2
d P C i = 100 × P C P C i r e m o v e P C
where R is the original resistance surface layer; R’ is the modified resistance surface; HC is the hydrological connectivity; NLI is the nighttime light intensity; n is the total number of core patches; MCR is the minimum cumulative resistance value; Dij is the spatial travel distance from the geometric centroid of source i to target j; Ri denotes the degree of impediment to species migration to destination i or landscape dispersal; f denotes the positive correlation function between MCR and ecological processes; ai and aj are the areas of patches i and j, respectively; AL is the total area of the landscape; pij is the maximum product probability of all paths between patches i and j; dPCi is the individual importance of a certain corridor; and PCi-remove is the PC index after its removal.

3. Results

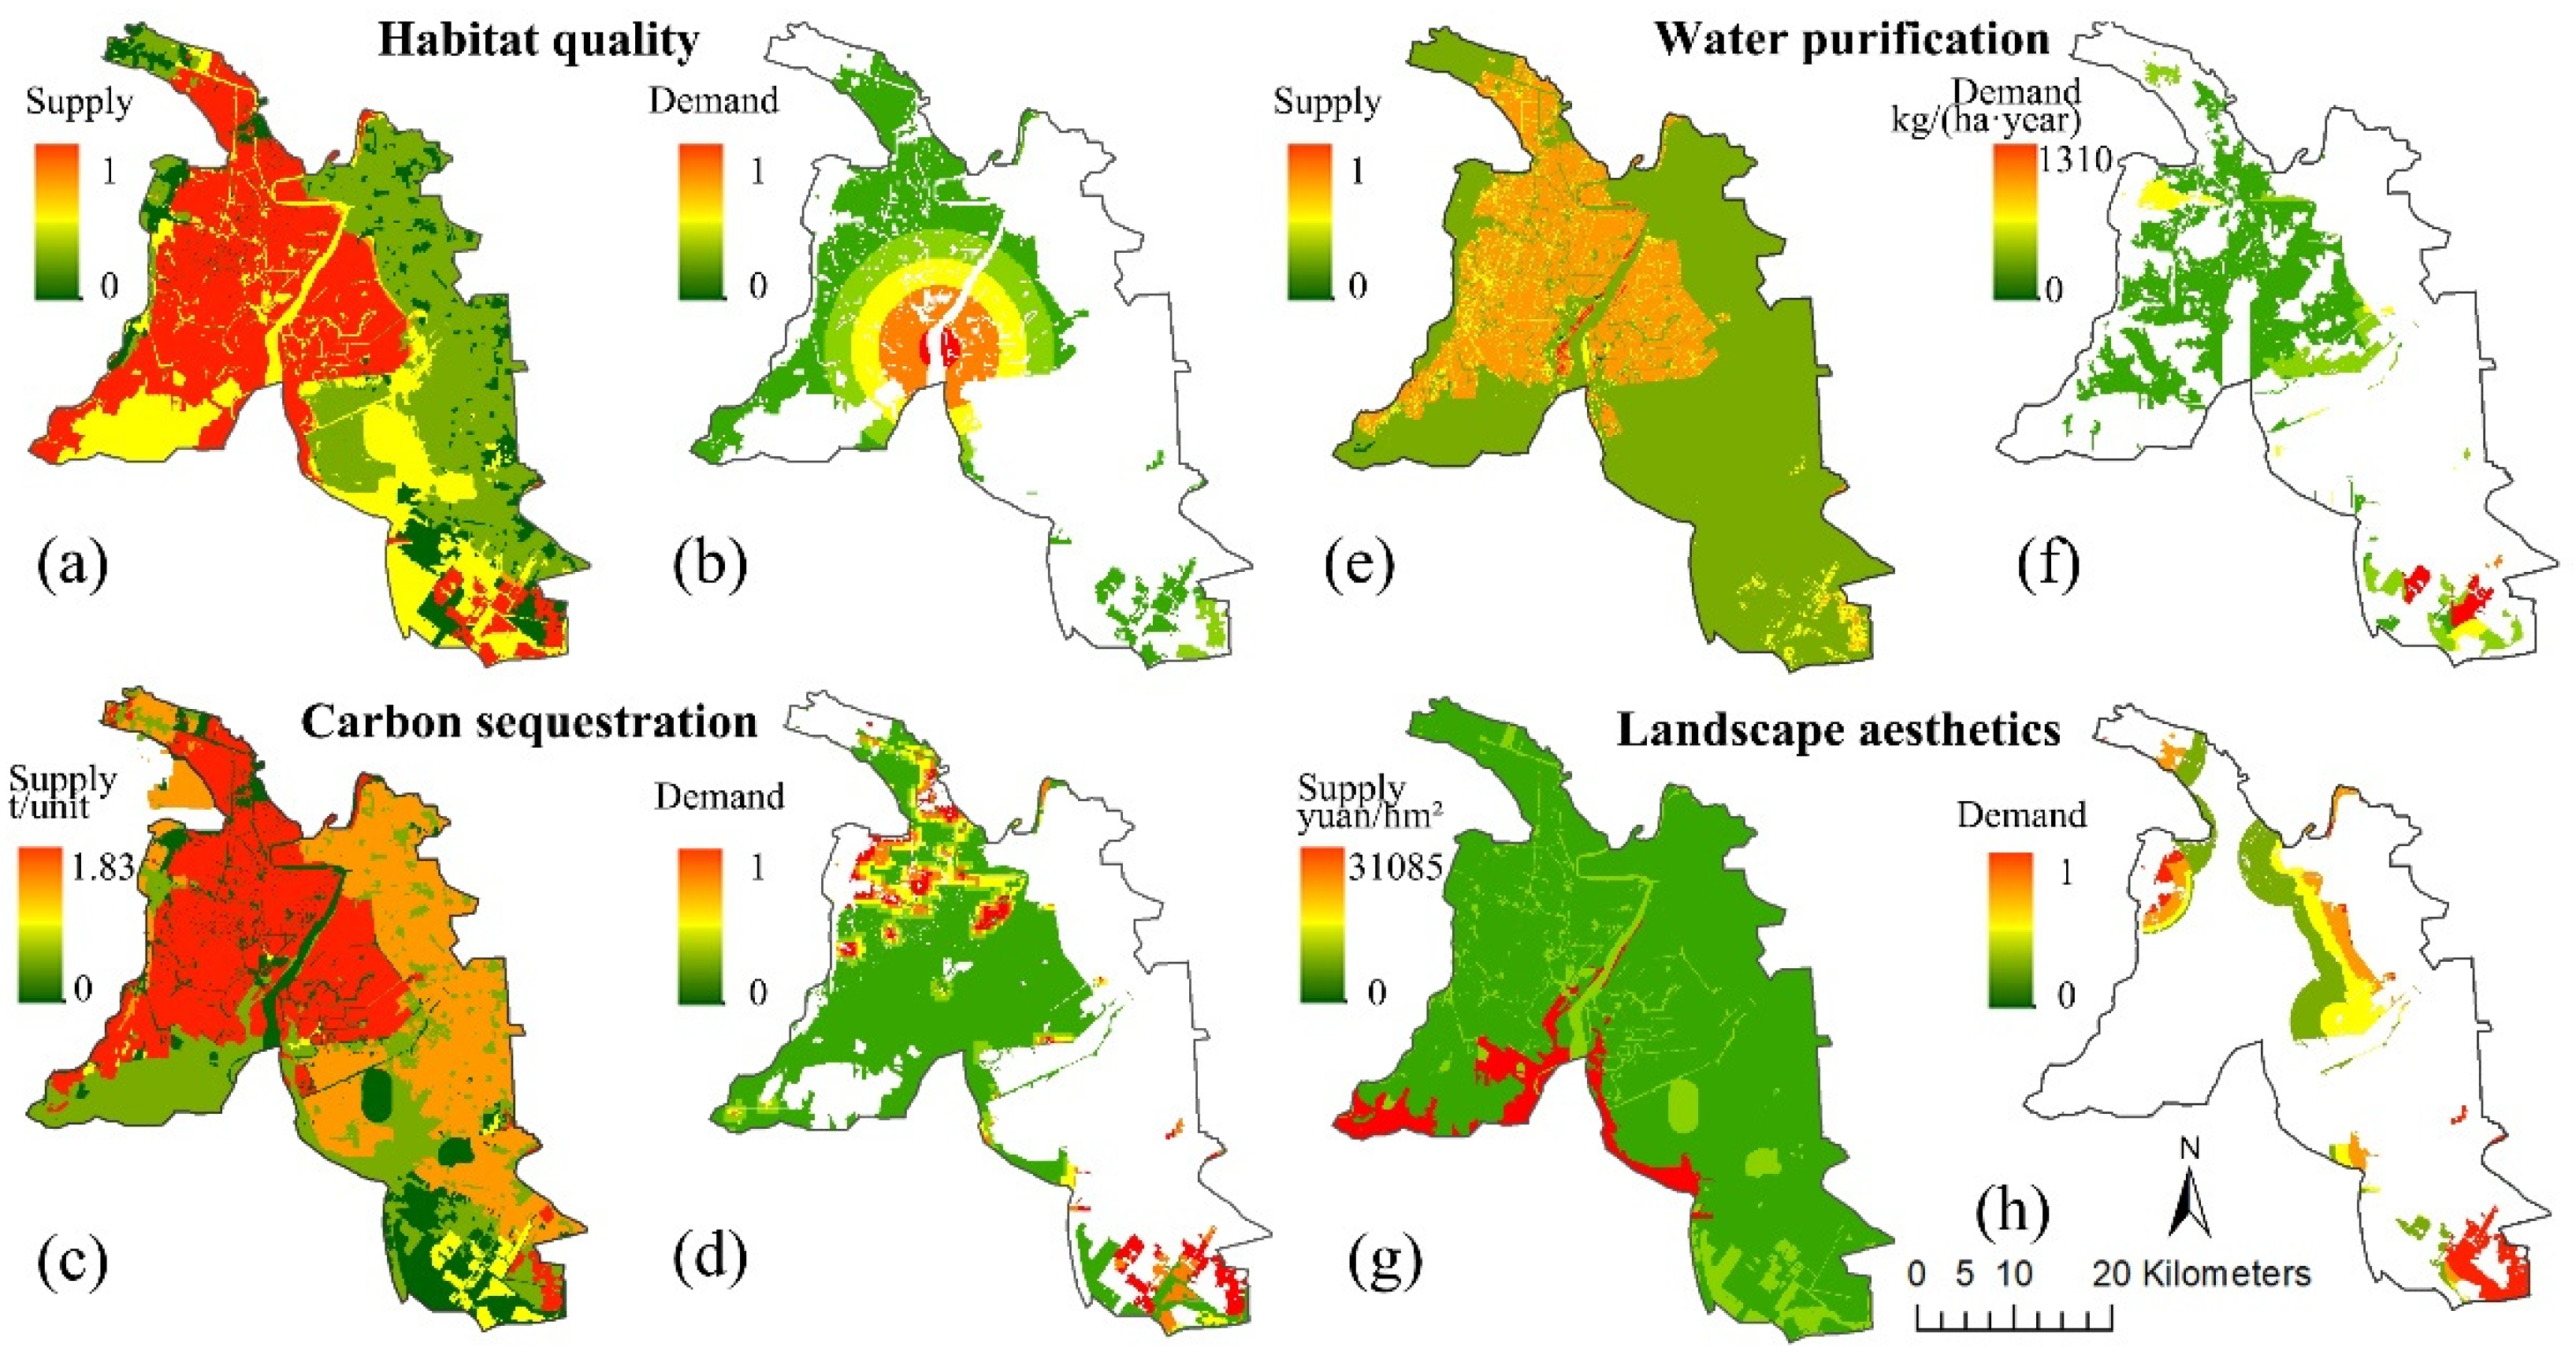
3.1. Supply Potential and Demand Distribution of Ecosystem Services

The spatial distribution of habitat quality services in the Liao River Delta is shown in Figure 3a. Overall, the regional habitat quality is good, with a mean value of 0.62. The high and low values are distinguished, with the high values concentrated in the natural patches in the central and southwestern parts of the study area, mainly in coastal wetlands, marshy wetlands, and water bodies. The low values are primarily located in the western part of the study area, mainly in residential, industrial, and agricultural land use. The current distribution of indicator species is estimated in Figure 3b. A higher probability of occurrence indicates a more substantial conservation need. Demand mapping was concentrated in the central part of the natural cover, mainly sandbars and reed wetlands near the estuary. In addition, bird record data indicated more indicator species sightings in the northeastern paddy fields, which may be caused by birds flying from their roosts to the fields to feed.
The total supply of carbon storage service was 1.93 × 10⁶ t, with a mean value of 1.24 t/unit. Overall, it shows the characteristics of high in the west and low in the east and high in the north and low in the south. The high values are concentrated in the reed wetland in the west of the study area, where the realization of carbon storage service depends on the accumulation of plant organic matter, and the high carbon density in the marsh wetland is more favorable to the accumulation of organic matter. The low values are mainly located in the southern part of the study area, where the vegetation cover is low, such as wasteland, water areas, and construction land. This area has low vegetation cover, low carbon density, and poor carbon storage capacity. The higher conservation demand for carbon sequestration services is interpreted as the greater the degree of disturbance and the greater the possibility of patches becoming carbon sources. High values are mainly distributed in the northwest and southeast near human habitation or artificial facilities.
The natural services for water purification are concentrated in the central and southwestern riverine reed patches in a banded pattern. The low values are the built-up areas and agricultural land in the east and the natural land with low vegetation cover in the south. From the mapping of water purification demand, it can be seen that high external and low internal values characterize the overall distribution. The high values are evenly distributed in several catchments in the east and northwest, mainly related to the distance between the catchment and the pollution source, the pollution load, and the slope.
The total and mean landscape aesthetic values were CNY 7.36 × 10⁹ and 4794.65 CNY/hm2, respectively. The high values were mainly concentrated in the reed area and southern watershed in the western part of the study area, where the water system is well developed and the vegetation cover is high, which can bring high landscape aesthetic values. The mapped distribution of demand for natural space is shown in Figure 3h. The high values are mainly located in the reed and inland salt vegetation patches in the southeast and northwest.

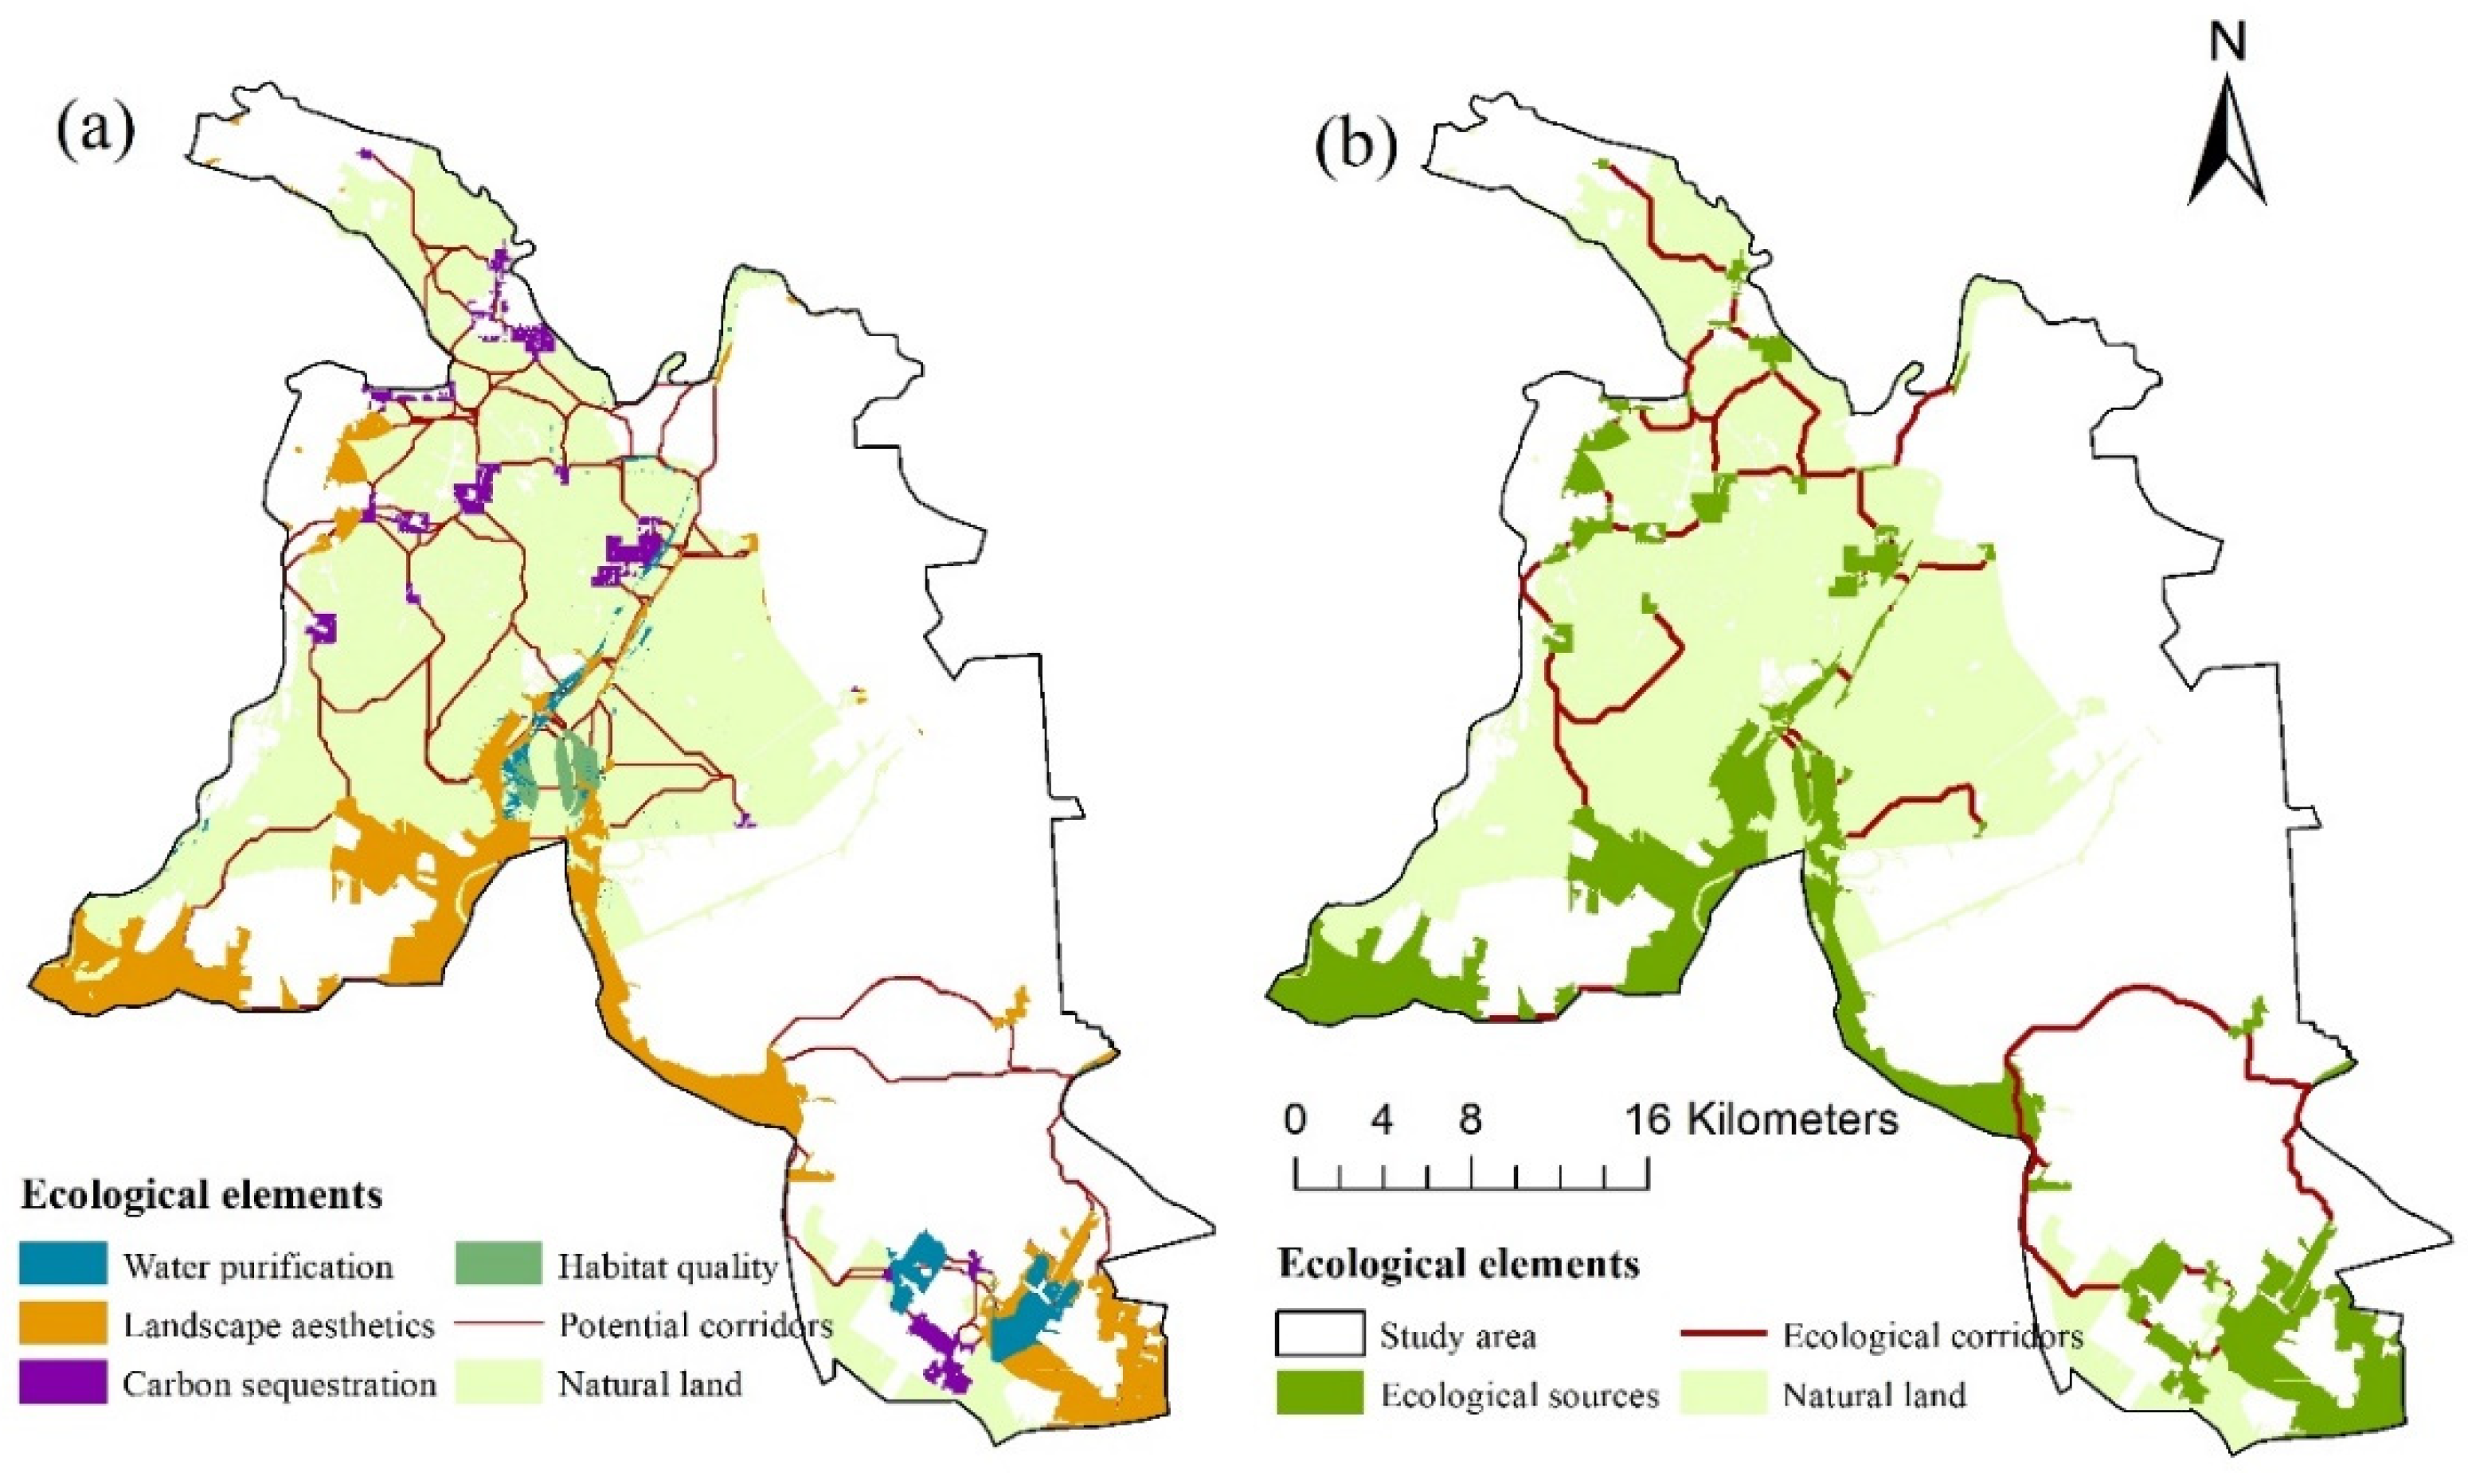
3.2. Spatial Distribution of Ecological Elements

The total number of ecological source sites was 47, with 172.66 km², accounting for 12% of the study area. The distribution within the study area was relatively balanced, with large strip patches in the southern coastal and estuarine areas. The proportion of area in the core protection zone was almost the same as the study area at similar scales. This facilitates the development of prioritized interventions to reduce costs and improve conservation efficiency. The ecological source was a collection of high-value areas for ecological functions, with the four ES core areas of habitat quality, carbon sequestration, water purification, and landscape aesthetics accounting for 4%, 25%, 11%, and 60% of the area, respectively.
The spatial distribution of the initial resistance surface is shown in Figure 4, showing the characteristics of several large settlements in the north and southeast as the center of high values and slowly decreasing to the periphery. According to the related study, the values of NLI above 300.53 and below 0.24 were set to 300.53 and 0, respectively, to exclude the data singularity values. The high values of hydrological connectivity frequency were mainly located in the central and southern water systems, artificial water bodies, and flooding areas, which can provide a suitable living environment for birds, plankton, and benthic organisms. As shown in Figure 4, the resistance surface corrected by NLI and hydrological connectivity frequency improved in both global and local accuracy. Relatively, grids with higher hydrological connectivity frequencies have lower resistance values for the same level of human disturbance.
Based on the ecological sources and improved resistance surfaces, 128 potential ecological corridors were identified (Figure 5a). The potential corridors were in a tic-tac-toe network, mainly concentrated in the west and southeast, and did not cross the built-up area in the east. Their total length was 716.31 km, accounting for 258.33% of the study area boundary length. Some corridors have a high degree of overlap and a high network density in the northwest, with a high degree of network redundancy. The total number of corridor networks optimized by connectivity was 54, with a total length of 145.74 km, accounting for 52.56% of the study area boundary. The optimized ESP is shown in Figure 5b.

4. Discussion

In the case study of the Liao River Delta, we applied the spatial flow approach to connect the service supply and demand areas effectively. The vital ecological elements for monitoring, control, and restoration were identified through the ESP framework to form an overall ecological protection network. The critical process of ecological sources extraction, framework application, and uncertainty still needs to be discussed next.

4.1. The Way of Selecting Ecological Sources

A set of interconnected interregional human and natural systems constitute a remotely coupled system through the flow connections [67]. In previous studies, the issue of connectivity between supply and demand was often neglected, incorrectly narrowing the coupled system’s scope. In this study, the natural supply and demand mapping areas of the ES together represent the natural system, which is remotely coupled to the human system [14]. That is, the ability to deliver services to local demand is maintained, and the potential to deliver services to remote and longer time scales is retained.
The consistency of the natural supply and demand mapping zones of the ES answers whether natural supply can meet human demand and whether human well-being can be met by protecting only ecologically important zones, i.e., high natural supply zones. This determines how we should choose ecological sources. For example, in landscape aesthetics and water purification services, there is little overlap between high supply and high demand mapping zones. This means that both zones need to be protected simultaneously if we are to achieve the pre-determined goals of coupling. Habitat quality services and carbon sequestration services are another way of thinking about source site selection. The high supply and high demand mapping areas for habitat quality services are extensive due to the large wetland areas and signs of biological activity in the study area. In contrast, carbon sequestration services generate demand only when the supply area is disturbed due to the unique properties of wetland carbon sinks. Therefore, the core patches of these two services are the intersection of high natural supply area and high demand mapping.

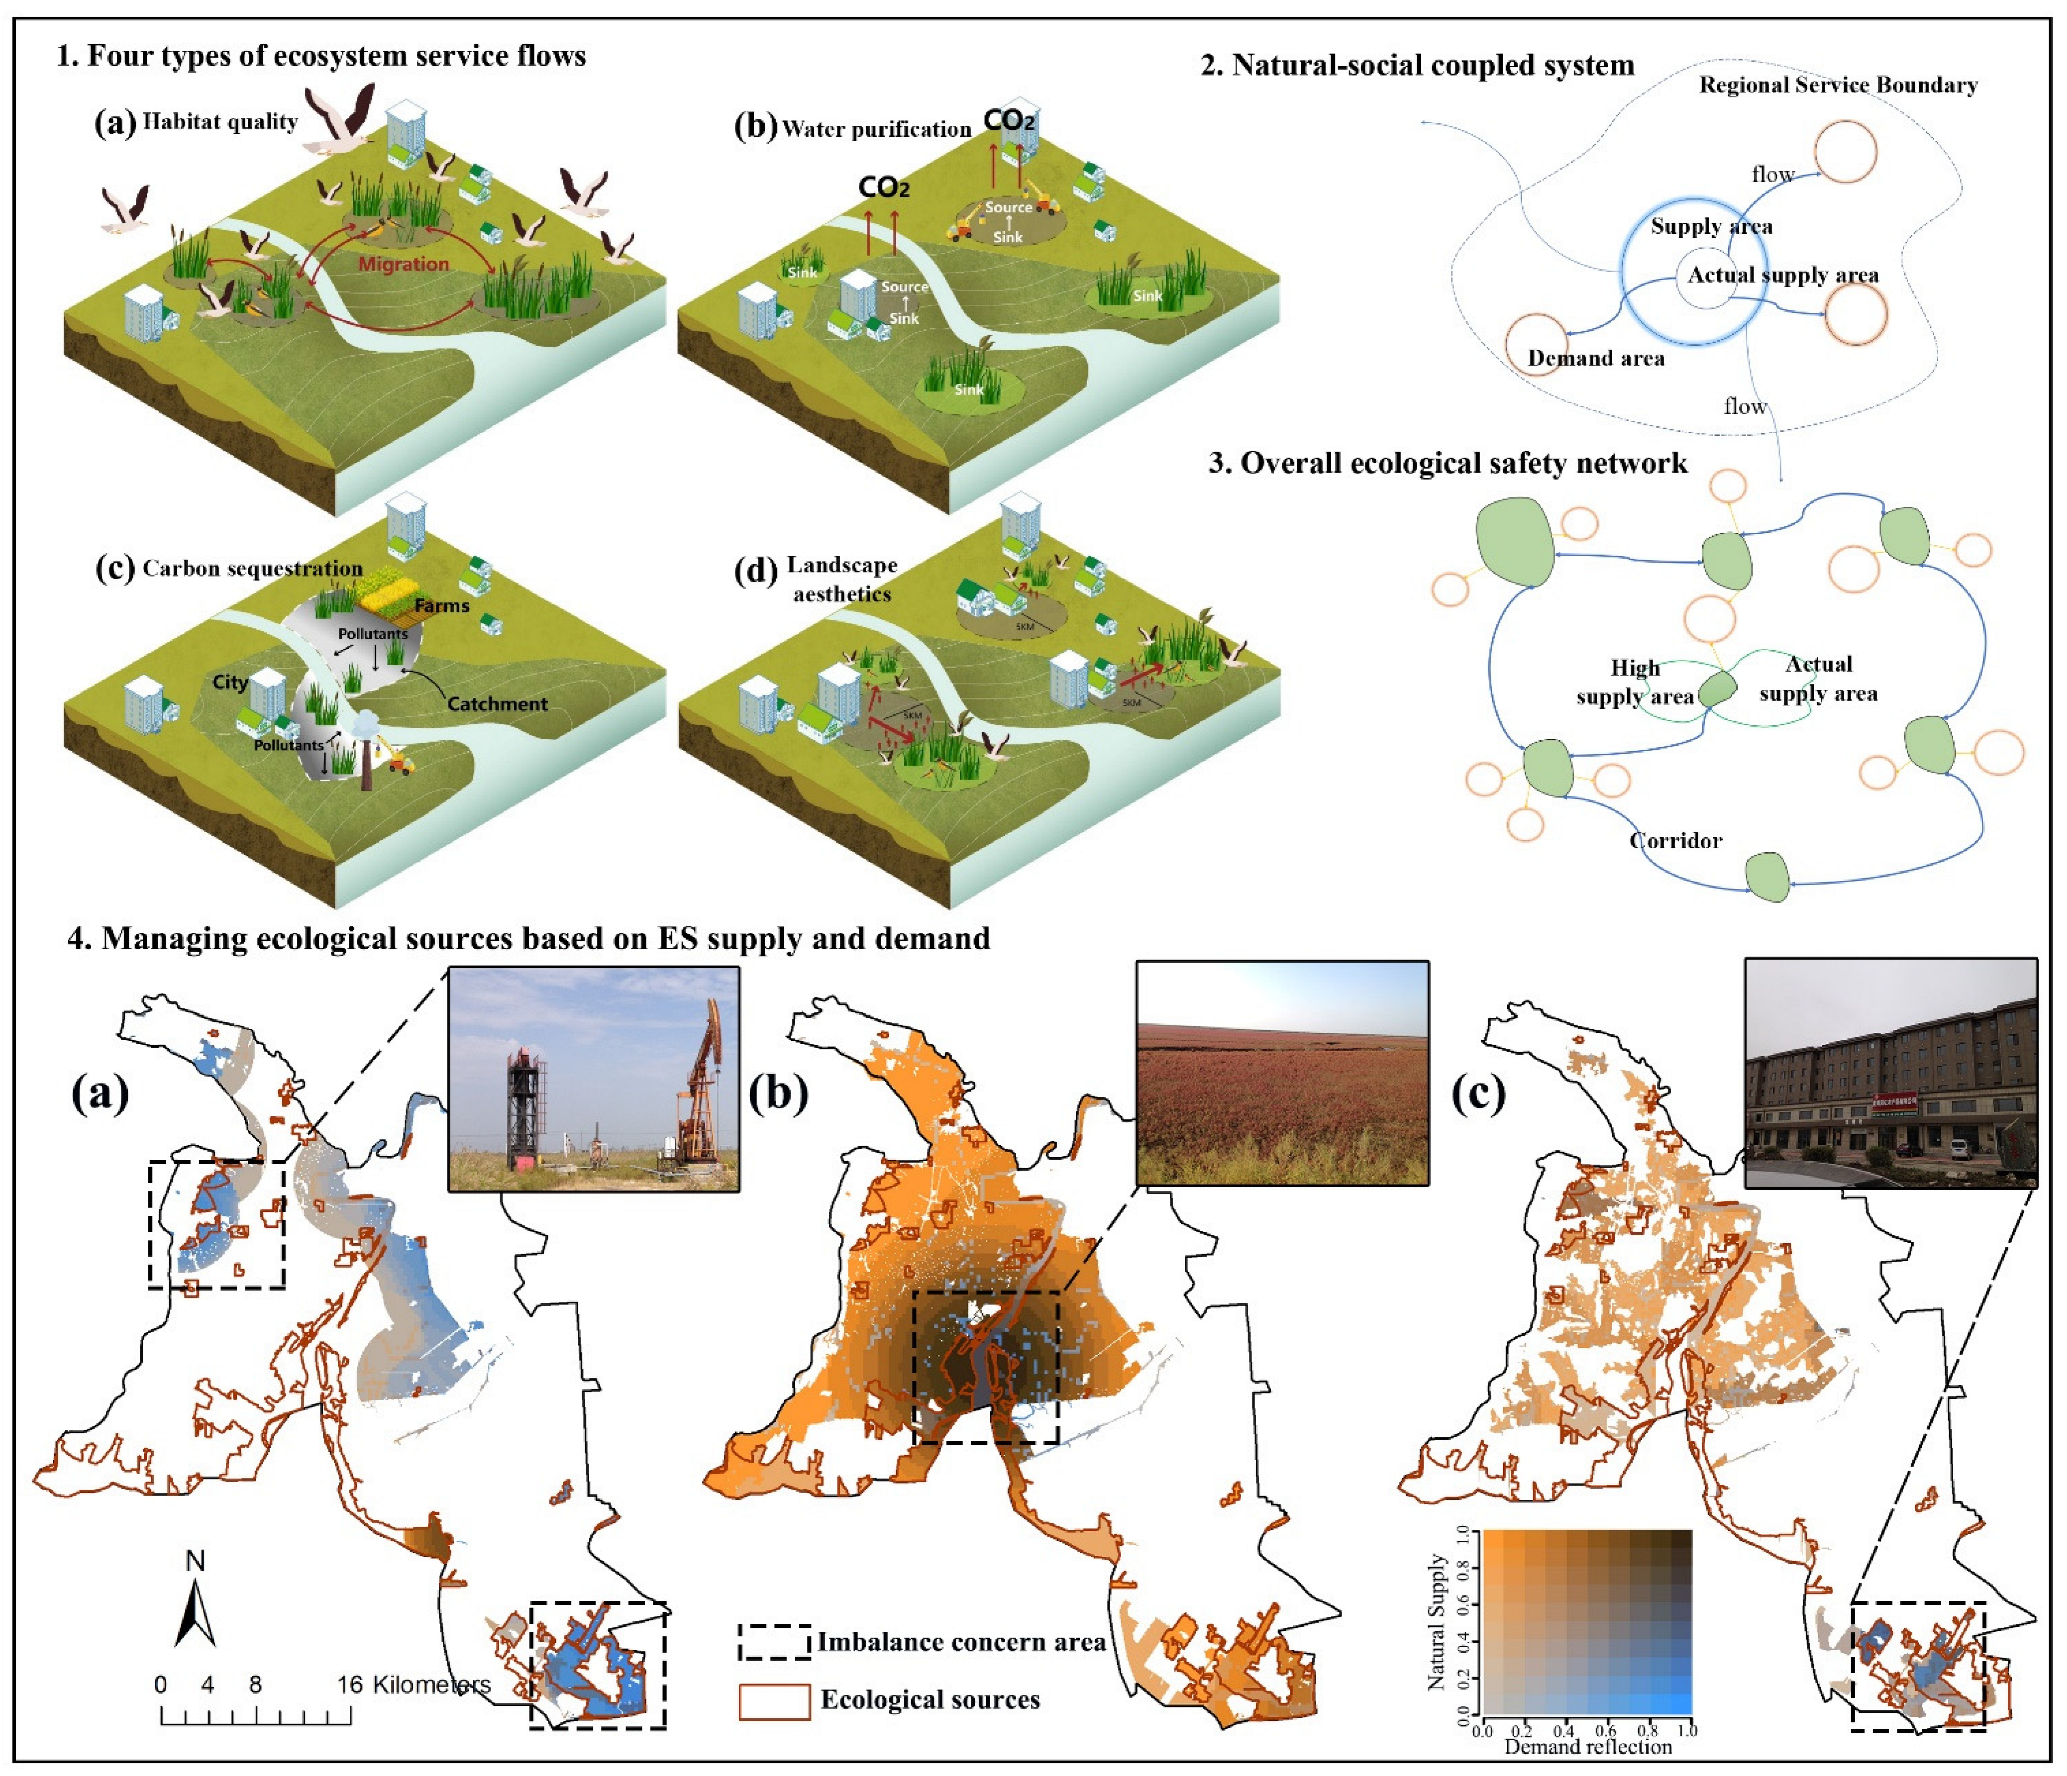
4.2. Ecological Management Logic and Application Based on This ESP Framework

Many ESP studies based on supply and demand often calculate the ratio or coordination between natural supply and macro demand (GDP, population) to determine the degree of supply and demand matching within each larger basic unit and thus make recommendations for ecological management [5,68]. They ignore the objective fact that supply and demand are remotely coupled, and it is difficult to provide concrete knowledge for environmental management. As shown in Figure 6(1–3), the ESP further integrates ecological elements representing demand by means of service flows that allocate demand to natural space, thus improving the coupled system. ESP is a multi-element network system consisting of high natural supply areas and high demand mapping areas and corridors that can provide an important reference point for spatial policy implementation to protect nature and natural resources [2]. In principle, all development and construction activities are prohibited in the high natural supply areas, and the original land functions are permanently preserved, with planned monitoring, protection, and restoration. The high demand mapping area needs to retain both a strong natural supply capacity and the high intensity of pressure exerted by humans. The area further needs to determine whether the natural capacity is meeting human demand, such as whether surface water quality is up to standard and whether people’s recreational needs are being met qualitatively and quantitatively. It is also essential to confirm whether human demand disturbance in the region excessively affects the regular natural supply, such as whether the high demand reflecting area for carbon sequestration is undergoing a functional shift from a carbon sink to a carbon source. These findings will help us select appropriate prioritization interventions to regulate the supply capacity from the natural system and the demand from the social system, respectively.
For this study area, the Pearson coefficients of demand mapping and supply potential are moderately negatively correlated, indicating that the two are not coordinated in growth trends. This suggests that further action should be taken in the demand mapping area to ensure that natural supply can meet human demand. Combined with the results in Figure 6(4a), the natural patches of Liaodong Bay New Town in the southeast and the ecological economic zone in the northwest face high human demand and low supply capacity for landscape aesthetics, and the supply capacity of the SPA,. such as improving the connectivity of these areas to increase the distribution of service flows along the route, expanding flow boundaries, and conducting green infrastructure construction, needs to be further strengthened. An urban central park can be built in Liaodong Bay New Town by relying on the existing large-area natural patches. In addition to the natural patches of ecological sources, community parks will be built near large residential areas in the ecological economic zone, and traffic connections will be ensured. Figure 6(4b) shows that the natural supply of regional habitat quality is sufficient, and there is a pointwise mismatch between supply and demand in the central Red Beach Scenic Area. Ecological restoration measures such as reducing the hydrological impact caused by the construction of upstream agricultural canals, restricting oilfield exploitation activities in nature reserves, and providing habitats on the leeward side are needed. Figure 6(4c) shows that the natural supply of water purification is sufficient, and the natural patches in the southeastern port area face tremendous purification pressure, which can be alleviated by reducing pollution discharge or enhancing green infrastructure construction in conjunction with the Liaodong Bay New City Central Park. In addition, it should strictly implement the return of farmland to wetlands and accelerate the shutdown and withdrawal of oil well facilities in the ecological source of carbon sequestration services.
The demand mapping in this study is an extension and development of the existing studies, which can provide reference and inspiration for ESP studies in other study areas [4,14,42,69]. The technical paths regarding the allocation and mapping of demand for landscape aesthetic and water-related services are relatively clear. Their demand boundaries (e.g., travel willingness range and water catchment area) can be easily accessed through behavioral and spatial analyses. More established studies provide references to human behavioral tendencies and water-related models for pathway allocation. We simplify the complex service flow between the demand and supply areas by taking the conservation target as the demand subject for the demand mapping of habitat quality and carbon sequestration services. Using black box theory to map demand to natural space provides the possibility of incorporating some service types with complex demand allocation processes into the ESP framework [42,70].

4.3. Limitations and Future Research

Although this study constructs an ESP based on landscape-scale supply and demand to strengthen the role played by ecological source sites in coupling human–land systems, it still has limitations and uncertainties. First, this paper used bird observation data and precipitation data to assess the mapping of habitat quality and water purification demand. These data themselves may have uncertainties. For example, the number of bird observations is uploaded to the system by a large number of users, and the precipitation distribution is interpolated from the observed values of multiple stations, which may be somewhat different from the actual values in a specific space. Second, in the assessment of the natural supply of carbon sequestration, the assessment model relies on the carbon stock estimation for each land use type, so we have averaged the sampled data for different land use types. This may be more reasonable in assessing the overall carbon pool, but the highly generalized rank may lead to errors and loss of some spatial information, thus affecting the extraction of ecological sources. Datasets with a large number of sample points and long time spans could be used in future studies to compensate for this deficiency.
Third, in this paper, the threshold settings for corridor and source site extraction take the approach of empirical values and expert judgment, which is somewhat subjective. We did not put a limit on the maximum length of corridors because there is no research showing that ecological corridors have a distance limit in transporting materials and energy for ecosystems. The flow properties of key species at different scales should be included in future studies. Finally, we included ecological source sites jointly for high natural supply and high demand mapping areas and discussed their consistency to ensure the high value of ecological source sites. However, there are similar problems to other ESP studies. The performance and accuracy of ESP cannot be directly verified due to the limitations of controlled experiments [5]. This content will become necessary in the future when sufficient practice samples are available.

5. Conclusions

This study comprehensively considers the natural supply potential of the ecosystem and human needs and constructs an ecological security pattern with the characteristics of coastal wetlands to maintain the integrity of the ecosystem structure, function, and process. The service supply area and the service benefit area are connected by the method of spatial flow to identify the demand reflecting area and make up for the problem of remote coupling of supply and demand. This study proposes a new ESP framework in which various ecological elements can provide decision support on paths and locations for ecological management, safeguard the demand for natural products within the region, and maintain the natural potential for longer-term and wider-scale services. The frame is tried in the Liao River Delta. Based on understanding the processes by which multiple spatial streams of services transport and deliver ES, supply potential and service demand are quantified to identify ecological source sites consisting of high natural supply areas and high demand mapped areas. Based on the resistance surface corrected by hydrological connectivity and NLI, potential ecological corridors were extracted, and then network connectivity was optimized through connectivity evaluation. This study proposes ecological management logic and application according to the multi-level ESP and supply–demand relationship.

Supplementary Materials

The following supporting information can be downloaded at: https://www.mdpi.com/article/10.3390/rs14184663/s1, Figure S1: Remote sensing interpretation accuracy assessment; Table S1: Sensitivity Table; Table S2: Threats Table; Table S3: LULC types and the components of their carbon cools.

Author Contributions

S.C.: conceptualization, software, writing—original draft preparation, writing—reviewing and editing, visualization, investigation; Z.H.: conceptualization, methodology, validation, data curation; X.Y.: conceptualization, amendments, supervision, resources, data curation; X.L. (Xiuzhen Li) and C.L.: software and investigation; W.Z.: software and data curation; X.L. (Xinyuan Li) and J.Z.: language check and investigation. All authors have read and agreed to the published version of the manuscript.

Funding

This work was supported by the National Natural Science Foundation of China (42101113, 41976206, 42141016), the Open Research Fund of State Key Laboratory of Estuarine and Coastal Research (Grant No. SKLEC-KF202107), the Ministry of Education Humanities and Social Sciences Research Youth Fund Project (21YJCZH193), the Natural Science Foundation of Liaoning Province (2020-BS-183).

Data Availability Statement

Not applicable.

Acknowledgments

We thank Amanda Z at UCL for her language and cartographic assistance during the writing of this manuscript.

Conflicts of Interest

The author declares no conflict of interests.

References

  1. He, Q.; Bertness, M.D.; Bruno, J.F.; Li, B.; Chen, G.; Coverdale, T.C.; Altieri, A.H.; Bai, J.; Sun, T.; Pennings, S.C. Economic development and coastal ecosystem change in China. Sci. Rep. 2014, 4, 5995. [Google Scholar] [CrossRef] [PubMed]
  2. Liquete, C.; Kleeschulte, S.; Dige, G.; Maes, J.; Grizzetti, B.; Olah, B.; Zulian, G. Mapping green infrastructure based on ecosystem services and ecological networks: A Pan-European case study. Environ. Sci. Policy 2015, 54, 268–280. [Google Scholar] [CrossRef]
  3. du Toit, M.J.; Cilliers, S.S.; Dallimer, M.; Goddard, M.; Guenat, S.; Cornelius, S.F. Urban green infrastructure and ecosystem services in sub-Saharan Africa. Landsc. Urban Plan. 2018, 180, 249–261. [Google Scholar] [CrossRef]
  4. Vallecillo, S.; Polce, C.; Barbosa, A.; Castillo, C.P.; Vandecasteele, I.; Rusch, G.M.; Maes, J. Spatial alternatives for Green Infrastructure planning across the EU: An ecosystem service perspective. Landsc. Urban Plan. 2018, 174, 41–54. [Google Scholar] [CrossRef]
  5. Jiang, H.; Peng, J.; Dong, J.; Zhang, Z.; Xu, Z.; Meersmans, J. Linking ecological background and demand to identify ecological security patterns across the Guangdong-Hong Kong-Macao Greater Bay Area in China. Landsc. Ecol. 2021, 36, 2135–2150. [Google Scholar] [CrossRef]
  6. Cumming, T.L.; Shackleton, R.T.; Forster, J.; Dini, J.; Khan, A.; Gumula, M.; Kubiszewski, I. Achieving the national development agenda and the Sustainable Development Goals (SDGs) through investment in ecological infrastructure: A case study of South Africa. Ecosyst. Serv. 2017, 27, 253–260. [Google Scholar] [CrossRef]
  7. Hofman, M.P.; Hayward, M.W.; Kelly, M.J.; Balkenhol, N. Enhancing conservation network design with graph-theory and a measure of protected area effectiveness: Refining wildlife corridors in Belize, Central America. Landsc. Urban Plan. 2018, 178, 51–59. [Google Scholar] [CrossRef]
  8. Peng, J.; Zhao, S.; Dong, J.; Liu, Y.; Meersmans, J.; Li, H.; Wu, J. Applying ant colony algorithm to identify ecological security patterns in megacities. Environ. Model. Softw. 2019, 117, 214–222. [Google Scholar] [CrossRef]
  9. Vergnes, A.; Kerbiriou, C.; Clergeau, P. Ecological corridors also operate in an urban matrix: A test case with garden shrews. Urban Ecosyst. 2013, 16, 511–525. [Google Scholar] [CrossRef]
  10. Gao, J.; Du, F.; Zuo, L.; Jiang, Y. Integrating ecosystem services and rocky desertification into identification of karst ecological security pattern. Landsc. Ecol. 2021, 36, 2113–2133. [Google Scholar] [CrossRef]
  11. Liang, J.; He, X.; Zeng, G.; Zhong, M.; Gao, X.; Li, X.; Li, X.; Wu, H.; Feng, C.; Xing, W. Integrating priority areas and ecological corridors into national network for conservation planning in China. Sci. Total Environ. 2018, 626, 22–29. [Google Scholar] [CrossRef]
  12. Wickham, J.D.; Riitters, K.H.; Wade, T.G.; Vogt, P. A national assessment of green infrastructure and change for the conterminous United States using morphological image processing. Landsc. Urban Plan. 2010, 94, 186–195. [Google Scholar] [CrossRef]
  13. Brauman, K.A.; Daily, G.C.; Duarte, T.K.e.; Mooney, H.A. The Nature and Value of Ecosystem Services: An Overview Highlighting Hydrologic Services. Annu. Rev. Environ. Resour. 2007, 32, 67–98. [Google Scholar] [CrossRef]
  14. Shen, J.; Wang, Y. Allocating and mapping ecosystem service demands with spatial flow from built-up areas to natural spaces. Sci. Total Env. 2021, 798, 149330. [Google Scholar] [CrossRef]
  15. Yahdjian, L.; Sala, O.E.; Havstad, K.M. Rangeland ecosystem services: Shifting focus from supply to reconciling supply and demand. Front. Ecol. Environ. 2015, 13, 44–51. [Google Scholar] [CrossRef]
  16. Burkhard, B.; Kroll, F.; Nedkov, S.; Müller, F. Mapping ecosystem service supply, demand and budgets. Ecol. Indic. 2012, 21, 17–29. [Google Scholar] [CrossRef]
  17. García-Nieto, A.P.; García-Llorente, M.; Iniesta-Arandia, I.; Martín-López, B. Mapping forest ecosystem services: From providing units to beneficiaries. Ecosyst. Serv. 2013, 4, 126–138. [Google Scholar] [CrossRef]
  18. Egarter Vigl, L.; Depellegrin, D.; Pereira, P.; de Groot, R.; Tappeiner, U. Mapping the ecosystem service delivery chain: Capacity, flow, and demand pertaining to aesthetic experiences in mountain landscapes. Sci. Total Environ. 2017, 574, 422–436. [Google Scholar] [CrossRef]
  19. Li, D.; Wu, S.; Liu, L.; Liang, Z.; Li, S. Evaluating regional water security through a freshwater ecosystem service flow model: A case study in Beijing-Tianjian-Hebei region, China. Ecol. Indic. 2017, 81, 159–170. [Google Scholar] [CrossRef]
  20. Xu, J.; Xiao, Y.; Xie, G.; Wang, Y.; Jiang, Y. How to Guarantee the Sustainability of the Wind Prevention and Sand Fixation Service: An Ecosystem Service Flow Perspective. Sustainability 2018, 10, 2995. [Google Scholar] [CrossRef] [Green Version]
  21. Shi, Y.; Shi, D.; Zhou, L.; Fang, R. Identification of ecosystem services supply and demand areas and simulation of ecosystem service flows in Shanghai. Ecol. Indic. 2020, 115, 106418. [Google Scholar] [CrossRef]
  22. Garau, E.; Pueyo-Ros, J.; Palom, A.R.; Vila-Subiros, J. Follow the flow: Analysis of relationships between water ecosystem service supply units and beneficiaries. Appl. Geogr. 2021, 133, 102491. [Google Scholar] [CrossRef]
  23. Ma, T.; Li, X.; Bai, J.; Cui, B. Impacts of Coastal Reclamation on Natural Wetlands in Large River Deltas in China. Chin. Geogr. Sci. 2019, 29, 640–651. [Google Scholar] [CrossRef]
  24. Zoppi, C. Ecosystem Services, Green Infrastructure and Spatial Planning, Sustainability; MDPI: Basel, Switzerland, 2020; Volume 12, pp. 1–4. [Google Scholar]
  25. Matthews, G.V.T. The Ramsar Convention on Wetlands: Its History and Development; Ramsar Convention Bureau: Gland, Switzerland, 1993. [Google Scholar]
  26. Peng, J.; Liu, Y.; Corstanje, R.; Meersmans, J. Promoting sustainable landscape pattern for landscape sustainability. Landsc. Ecol. 2021, 36, 1839–1844. [Google Scholar] [CrossRef]
  27. Grimsditch, G.; Alder, J.; Nakamura, T.; Kenchington, R.; Tamelander, J. The Blue Carbon Special Edition–Introduction and Overview; Elsevier: Amsterdam, The Netherlands, 2013. [Google Scholar]
  28. Bagstad, K.J.; Johnson, G.W.; Voigt, B.; Villa, F. Spatial dynamics of ecosystem service flows: A comprehensive approach to quantifying actual services. Ecosyst. Serv. 2013, 4, 117–125. [Google Scholar] [CrossRef]
  29. Smethurst, P.J. Hydrological indicators of flow in headwaters for assessing farm management impacts: Streamside forestry management case study. Ecol. Indic. 2019, 98, 627–633. [Google Scholar] [CrossRef]
  30. Peng, J.; Yang, Y.; Liu, Y.X.; Hu, Y.N.; Du, Y.Y.; Meersmans, J.; Qiu, S.J. Linking ecosystem services and circuit theory to identify ecological security patterns. Sci. Total Environ. 2018, 644, 781–790. [Google Scholar] [CrossRef]
  31. Zhang, L.Q.; Peng, J.; Liu, Y.X.; Wu, J.S. Coupling ecosystem services supply and human ecological demand to identify landscape ecological security pattern: A case study in Beijing-Tianjin-Hebei region, China. Urban Ecosyst. 2017, 20, 701–714. [Google Scholar] [CrossRef]
  32. Blazquez-Cabrera, S.; Ciudad, C.; Gastón, A.; Simón, M.; Saura, S. Identification of strategic corridors for restoring landscape connectivity: Application to the Iberian lynx. Anim. Conserv. 2019, 22, 210–219. [Google Scholar] [CrossRef]
  33. Wu, J.; Feng, Z.; Gao, Y.; Peng, J. Hotspot and relationship identification in multiple landscape services: A case study on an area with intensive human activities. Ecol. Indic. 2013, 29, 529–537. [Google Scholar] [CrossRef]
  34. Sui, Y.; Chen, X.; Li, S.; Sun, D.; Ma, X.; Zhou, T. Spatiotemporal change of coastal blue carbon and its service value evaluation: A case study of Jiaozhou Bay. Resour. Sci. 2019, 41, 2119–2130. [Google Scholar] [CrossRef]
  35. Ma, T.; Li, X.; Bai, J.; Ding, S.; Zhou, F.; Cui, B. Four decades’ dynamics of coastal blue carbon storage driven by land use/land cover transformation under natural and anthropogenic processes in the Yellow River Delta, China. Sci. Total Environ. 2019, 655, 741–750. [Google Scholar] [CrossRef]
  36. Xie, G.; Zhang, C.; Zhen, L.; Zhang, L. Dynamic changes in the value of China’s ecosystem services. Ecosyst. Serv. 2017, 26, 146–154. [Google Scholar] [CrossRef]
  37. Ding, T.; Chen, J.; Fang, Z.; Chen, J. Assessment of coordinative relationship between comprehensive ecosystem service and urbanization: A case study of Yangtze River Delta urban Agglomerations, China. Ecol. Indic. 2021, 133, 108454. [Google Scholar] [CrossRef]
  38. Sharp, R.; Douglass, J.; Wolny, S.; Arkema, K.; Bernhardt, J.; Bierbower, W.; Chaumont, N.; Denu, D.; Fisher, D.; Glowinski, K. InVEST 3.8. 7. User’s Guide; The Natural Capital Project–Stanford University; University of Minnesota Nature Conservation World Wildlife Fund: Standford, CA, USA, 2020. [Google Scholar]
  39. Hall, L.S.; Krausman, P.R.; Morrison, M.L. The habitat concept and a plea for standard terminology. Wildl. Soc. Bull. 1997, 52, 173–182. [Google Scholar]
  40. Callaghan, C.T.; Bino, G.; Major, R.E.; Martin, J.M.; Lyons, M.B.; Kingsford, R.T. Heterogeneous urban green areas are bird diversity hotspots: Insights using continental-scale citizen science data. Landsc. Ecol. 2019, 34, 1231–1246. [Google Scholar] [CrossRef]
  41. de Camargo Barbosa, K.V.; Rodewald, A.D.; Ribeiro, M.C.; Jahn, A.E. Noise level and water distance drive resident and migratory bird species richness within a Neotropical megacity. Landsc. Urban Plan. 2020, 197, 103769. [Google Scholar] [CrossRef]
  42. Liu, Z.; Huang, Q.; Tang, G. Identification of urban flight corridors for migratory birds in the coastal regions of Shenzhen city based on three-dimensional landscapes. Landsc. Ecol. 2021, 36, 2043–2057. [Google Scholar] [CrossRef]
  43. Mcleod, E.; Chmura, G.L.; Bouillon, S.; Salm, R.; Björk, M.; Duarte, C.M.; Lovelock, C.E.; Schlesinger, W.H.; Silliman, B.R. A blueprint for blue carbon: Toward an improved understanding of the role of vegetated coastal habitats in sequestering CO2. Front. Ecol. Environ. 2011, 9, 552–560. [Google Scholar] [CrossRef]
  44. Goldenberg, R.; Kalantari, Z.; Cvetkovic, V.; Mörtberg, U.; Deal, B.; Destouni, G. Distinction, quantification and mapping of potential and realized supply-demand of flow-dependent ecosystem services. Sci. Total Environ. 2017, 593, 599–609. [Google Scholar] [CrossRef]
  45. Bagstad, K.J.; Villa, F.; Batker, D.; Harrison-Cox, J.; Voigt, B.; Johnson, G.W. From theoretical to actual ecosystem services: Mapping beneficiaries and spatial flows in ecosystem service assessments. Ecol. Soc. 2014, 19, 190264. [Google Scholar] [CrossRef] [Green Version]
  46. Syvitski, J.P.; Kettner, A.J.; Overeem, I.; Hutton, E.W.; Hannon, M.T.; Brakenridge, G.R.; Day, J.; Vörösmarty, C.; Saito, Y.; Giosan, L. Sinking deltas due to human activities. Nat. Geosci. 2009, 2, 681–686. [Google Scholar] [CrossRef]
  47. Barbier, E.B.; Koch, E.W.; Silliman, B.R.; Hacker, S.D.; Wolanski, E.; Primavera, J.; Granek, E.F.; Polasky, S.; Aswani, S.; Cramer, L.A. Coastal ecosystem-based management with nonlinear ecological functions and values. Science 2008, 319, 321–323. [Google Scholar] [CrossRef]
  48. Yim, J.; Kwon, B.-O.; Nam, J.; Hwang, J.H.; Choi, K.; Khim, J.S. Analysis of forty years long changes in coastal land use and land cover of the Yellow Sea: The gains or losses in ecosystem services. Environ. Pollut. 2018, 241, 74–84. [Google Scholar] [CrossRef]
  49. Grizzetti, B.; Liquete, C.; Pistocchi, A.; Vigiak, O.; Zulian, G.; Bouraoui, F.; De Roo, A.; Cardoso, A.C. Relationship between ecological condition and ecosystem services in European rivers, lakes and coastal waters. Sci Total Environ. 2019, 671, 452–465. [Google Scholar] [CrossRef]
  50. Leemans, R. The millennium ecosystem assessment: Securing interactions between ecosystems, ecosystem services and human well-being. In Facing Global Environmental Change; Springer: Berlin/Heidelberg, Germany, 2009; pp. 53–61. [Google Scholar]
  51. Vrebos, D.; Staes, J.; Vandenbroucke, T.; Johnston, R.; Muhumuza, M.; Kasabeke, C.; Meire, P. Mapping ecosystem service flows with land cover scoring maps for data-scarce regions. Ecosyst. Serv. 2015, 13, 28–40. [Google Scholar] [CrossRef]
  52. Vigiak, O.; Borselli, L.; Newham, L.; McInnes, J.; Roberts, A. Comparison of conceptual landscape metrics to define hillslope-scale sediment delivery ratio. Geomorphology 2012, 138, 74–88. [Google Scholar] [CrossRef]
  53. Drewry, J.; Newham, L.; Greene, R. Index models to evaluate the risk of phosphorus and nitrogen loss at catchment scales. J. Environ. Manag. 2011, 92, 639–649. [Google Scholar] [CrossRef]
  54. Costanza, R.; d’Arge, R.; De Groot, R.; Farber, S.; Grasso, M.; Hannon, B.; Limburg, K.; Naeem, S.; O’neill, R.V.; Paruelo, J. The value of the world’s ecosystem services and natural capital. Nature 1997, 387, 253–260. [Google Scholar] [CrossRef]
  55. McLeod, S. Maslow’s hierarchy of needs. Simply Psychol. 2007, 1. [Google Scholar]
  56. Wolff, S.; Schulp, C.; Verburg, P. Mapping ecosystem services demand: A review of current research and future perspectives. Ecol. Indic. 2015, 55, 159–171. [Google Scholar] [CrossRef]
  57. Li, S.; Xiao, W.; Zhao, Y.; Lv, X. Incorporating ecological risk index in the multi-process MCRE model to optimize the ecological security pattern in a semi-arid area with intensive coal mining: A case study in northern China. J. Clean. Prod. 2020, 247, 119143. [Google Scholar] [CrossRef]
  58. Qin, K.; Li, J.; Liu, J.; Yan, L.; Huang, H. Setting conservation priorities based on ecosystem services—A case study of the Guanzhong-Tianshui Economic Region. Sci Total Environ. 2019, 650, 3062–3074. [Google Scholar] [CrossRef]
  59. An, Y.; Liu, S.; Sun, Y.; Shi, F.; Beazley, R. Construction and optimization of an ecological network based on morphological spatial pattern analysis and circuit theory. Landsc. Ecol. 2020, 36, 2059–2076. [Google Scholar] [CrossRef]
  60. Su, J.; Yin, H.; Kong, F. Ecological networks in response to climate change and the human footprint in the Yangtze River Delta urban agglomeration, China. Landsc. Ecol. 2021, 36, 2095–2112. [Google Scholar] [CrossRef]
  61. Cong, P.; Chen, K.; Qu, L.; Han, J.; Yang, Z. Determination of Landscape Ecological Network of Wetlands in the Yellow River Delta. Wetlands 2020, 40, 2729–2739. [Google Scholar] [CrossRef]
  62. Peng, J.; Pan, Y.J.; Liu, Y.X.; Zhao, H.J.; Wang, Y.L. Linking ecological degradation risk to identify ecological security patterns in a rapidly urbanizing landscape. Habitat Int. 2018, 71, 110–124. [Google Scholar] [CrossRef]
  63. Davidson, T.A.; Mackay, A.W.; Wolski, P.; Mazebedi, R.; Murray-Hudson, M.; Todd, M. Seasonal and spatial hydrological variability drives aquatic biodiversity in a flood-pulsed, sub-tropical wetland. Freshw. Biol. 2012, 57, 1253–1265. [Google Scholar] [CrossRef]
  64. Qu, Y.; Zheng, Y.; Gong, P.; Shi, J.; Li, L.; Wang, S.; Luo, C.; Zhang, H.; Xu, L. Estimation of wetland biodiversity based on the hydrological patterns and connectivity and its potential application in change detection and monitoring: A case study of the Sanjiang Plain, China. Sci. Total Environ. 2022, 805, 150291. [Google Scholar] [CrossRef]
  65. Pekel, J.-F.; Cottam, A.; Gorelick, N.; Belward, A.S. High-resolution mapping of global surface water and its long-term changes. Nature 2016, 540, 418–422. [Google Scholar] [CrossRef]
  66. Xiao, S.; Wu, W.; Guo, J.; Ou, M.; Pueppke, S.G.; Ou, W.; Tao, Y. An evaluation framework for designing ecological security patterns and prioritizing ecological corridors: Application in Jiangsu Province, China. Landsc. Ecol. 2020, 35, 2517–2534. [Google Scholar] [CrossRef]
  67. Liu, J.; Hull, V.; Batistella, M.; DeFries, R.; Dietz, T.; Fu, F.; Hertel, T.W.; Izaurralde, R.C.; Lambin, E.F.; Li, S. Framing sustainability in a telecoupled world. Ecol. Soc. 2013, 18, 26. [Google Scholar] [CrossRef]
  68. Xin, R.; Skov-Petersen, H.; Zeng, J.; Zhou, J.; Li, K.; Hu, J.; Liu, X.; Kong, J.; Wang, Q. Identifying key areas of imbalanced supply and demand of ecosystem services at the urban agglomeration scale: A case study of the Fujian Delta in China. Sci. Total Environ. 2021, 791, 148173. [Google Scholar] [CrossRef]
  69. Baró, F.; Haase, D.; Gómez-Baggethun, E.; Frantzeskaki, N. Mismatches between ecosystem services supply and demand in urban areas: A quantitative assessment in five European cities. Ecol. Indic. 2015, 55, 146–158. [Google Scholar] [CrossRef]
  70. Bunge, M. A general black box theory. Philos. Sci. 1963, 30, 346–358. [Google Scholar] [CrossRef]
Figure 1. Location of the Liao River Delta: (a) destroyed wetlands; (b) urban sprawl; (c) low-intensity tourism development; (d) industrial development.
Remotesensing 14 04663 g001
Figure 2. The conceptual framework for ecological security pattern.
Remotesensing 14 04663 g002
Figure 3. Natural supply potential and demand reflection of ecosystem services. (a), (c), (e) and (g) are the spatial distribution of natural supply capacity for habitat quality, carbon sequestration, water purification and landscape aesthetic services, respectively; (b), (d), (f) and (h) are reflections of the demand for habitat quality, carbon sequestration, water purification, and landscape aesthetic services in natural space, respectively.
Remotesensing 14 04663 g003
Figure 4. Spatial distribution of initial resistance surface and modified resistance surface.
Remotesensing 14 04663 g004
Figure 5. The ESP of the Liao River Delta. (a) ESP before connectivity optimization; (b) ESP after connectivity optimization.
Remotesensing 14 04663 g005
Figure 6. Ecological management logic and application: (1a) protection of habitat patches indicative of the physical presence of birds; (1b) protection of carbon sinks that are undergoing severe disturbance; (1c) protection of patches that perform the function of purifying pollutants emitted by humans that flow into water systems; (1d) attention to natural patches within people’s living circles; (2) Connecting natural-social systems through ecosystem service flows; (3) A part of the high supply area, the actual supply area and corridors together form an overall ecological safety network; (4) pairwise comparisons were made between the natural service potential and demand-reflecting values of different ecosystem services with SBA as the boundary; (4a) landscape aesthetics; (4b) habitat quality; (4c) water purification.
Remotesensing 14 04663 g006
Table 1. Ecosystem service indicators and quantification methods in the Liao River Delta.
ES IndicatorCalculation MethodUnitExplanationData Source and Parameter Reference
Habitat Quality Q x j = H j [ 1 ( D x j z D x j z + k z ) ] -Qxj is the habitat quality of grid x in land use and land cover (habitat type) j; Dxj is the stress level of grid x in land use and land cover (habitat type) j; k is the half-saturation constant, usually Dxj half of the maximum value; Hj is the habitat suitability of land use and land cover j; and z is a normalized constant, usually 2.5.[33]
Carbon sequestration S C = C _ a b o v e + C _ b e l o w + C _ s o i l + C _ d e a d t/hm2Sc is the total regional carbon storage, C_above is the aboveground carbon storage, C_below is the underground carbon storage, C_soil is the soil carbon storage, and C_dead is the carbon storage stored in dead organic matter, all in units (t/hm2).1, 2 [34,35]
Water purification A j = P i × n i = 1 n P i × N D V I j -The vegetation purification ability index is constructed by using the vegetation phosphorus accumulation Pi; the left side of the multiplication sign represents the relative size of the i type in the vegetation accumulation of all land uses; the vegetation phosphorus content of the i type land use is averaged, and the NDVI is used as the correction coefficient to obtain each grid; and the vegetation purification capacity index of grid j.1, 2
Landscape Aesthetics S L = 1 7 × A i × S i S × Q × P × t T CNY/hm2SL is the service supply of landscape aesthetics (CNY·hm−2); 1/7 is the ratio of the economic value of the equivalent factor of grain production per unit to the market value of food production per unit of arable land; Q is the average grain yield per unit of the study area (Kg·hm−2); P is the average market price of grain in the study area (CNY·kg−1); Ai is the landscape aesthetic service equivalent factor of the i-th land use type; S is the total area of the study area (hm2); Si is the area of the i-th land use type (hm2); t is the national per capita tourism income; and T is the per capita tourism income of the study area.1, 10 [36]
Note: The data source number is the data number in Section 2.1.
Table 2. Ecosystem service demand allocation and quantification methods.
ES IndicatorDemand SubjectBoundaryCalculation MethodExplanationData Source and Parameter Reference
Habitat QualityIndicated species protectionNatural patches in the study area Q j = 1 n h i = 1 n k ( s , h ) ;
k ( s , h ) = 1 2 π h e x p ( x t j x i j 2 2 h 2 )
Q’j is the probability of empirical bird abundance records where k(s,h) is the Gaussian kernel function; h is the bandwidth; s is the distance from point x to the target point; Xtj is the number of migratory birds based on eBirds uploaded by bird watchers over the years; and xij is the distance from pixel j to i Distance (km).7
Carbon sequestrationCarbon sink protectionCarbon sink S j = S j × H M j S’j is the probability of grid j transitioning from a carbon sink to a carbon source. Sj is the total carbon storage of grid j; HMj is the disturbance degree of human activities to grid j.1, 2, 6
Water purificationEnvironmental Department’s Requirements for Surface Water QualityThe catchment area of the water system in the study area A i = j [ l o a d s u r f , j × ( 1 N D R s u r f , j ) ]
N D R s u r f , j = ( 1 e f f j ) [ 1 + e x p ( I C 0 I C j k ) ] 1
A’i is the water purification capacity of natural patches in catchment i; loadsurf,j is the surface pollutant load of grid j in catchment i (kg/(ha·year)); NDRsurf, f is grid j, the proportion of pollutant loads reaching the river; eff’j is the maximum retention efficiency of the land between the grid and the river; IC0 and k are calibration parameters; and ICj is the terrain index, representing the probability of the nutrients in grid j reaching the river.1, 3, 5 [37,38]
Landscape AestheticsDaily travel guarantee for residentsWithin 5 km of settlements S i = P O P j × ( 1 D I S T j 5000 ) S’i is the degree to which settlement j allocates people’s travel needs to natural space i. POPj is the population of settlement j; DISTj is the distance between settlement j and natural space i.1, 4
Table 3. Initial resistance surface.
Land Use Type and POIResistance FactorResistance ValueInfluence Distance (km)
Land for urban and rural developmentResidential land500-
Uncultivated land300-
Inland water50-
Natural coverageEstuary waters and sandbars10-
River10-
Tidal creek10-
Tidal flat1-
Intertidal salt marshes1-
Reed5-
Inland salt planting3-
Agricultural landPaddy field and Dryland30-
Aquaculture100-
Industrial facilityOil wells (restricted production)3001
other5002
Transportation FacilitiesPort5002
Pier3001 *
Railway2502 *
Roads (Expressways, Moderate Roads, Greenways)250, 150, 502.0, 1.5, 1.0 *
Note: with * indicates exponential decay, others are linear decay.
Publisher’s Note: MDPI stays neutral with regard to jurisdictional claims in published maps and institutional affiliations.

