Article

An Analysis of Spatio-Temporal Relationship between Satellite-Based Land Surface Temperature and Station-Based Near-Surface Air Temperature over Brazil

1
Meteorological Information Center, Meteorological Administration of Guangxi Zhuang Autonomous Region, Nanning 530022, China
2
School of Geographical Sciences, Nanjing University of Information Science and Technology, Nanjing 210044, China
3
Hydrological Sciences Laboratory, NASA Goddard Space Flight Center, Greenbelt, MD 20771, USA
4
School of Civil and Environmental Engineering, University of New South Wales, Sydney, NSW 2052, Australia
*
Author to whom correspondence should be addressed.
Remote Sens. 2022, 14(17), 4420; https://doi.org/10.3390/rs14174420
Submission received: 3 August 2022 / Revised: 30 August 2022 / Accepted: 2 September 2022 / Published: 5 September 2022
(This article belongs to the Special Issue Remote Sensing Monitoring of Land Surface Temperature (LST) II)

Abstract

:
A better understanding of the relationship between land surface temperature (Ts) and near-surface air temperature (Ta) is crucial for improving the simulation accuracy of climate models, developing retrieval schemes for soil and vegetation moisture, and estimating large-scale Ta from satellite-based Ts observations. In this study, we investigated the relationship between multiple satellite-based Ts products, derived from the Atmospheric Infrared Sounder (AIRS) and the Moderate Resolution Imaging Spectroradiometer (MODIS) onboard Aqua satellite, and Ta from 204 meteorological stations over Brazil during 2003–2016. Monthly satellite-based Ts products used in this study include: (1) AIRS Version 6 with 1° spatial resolution, (2) AIRS Version 7 with 1° spatial resolution, (3) MODIS Collection 6 with 0.05° spatial resolution, and (4) MODIS Collection 6 with 1° spatial resolution re-sampled from (3) for a direct comparison with AIRS products. We found that satellite-based Ts is lower than Ta over the forest area, but higher than Ta over the non-forest area. Nevertheless, the correlation coefficients (R) between monthly Ta and four Ts products during 2003–2016 are greater than 0.8 over most stations. The long-term trend analysis shows a general warming trend in temperatures, particularly over the central and eastern parts of Brazil. The satellite products could also observe the increasing Ts over the deforestation region. Furthermore, we examined the temperature anomalies during three drought events in the dry season of 2005, 2010, and 2015. All products show similar spatio-temporal patterns, with positive temperature anomalies expanding in areal coverage and magnitude from the 2005 to 2015 event. The above results show that satellite-based Ts is sensitive in reflecting environmental changes such as deforestation and extreme climatic events, and can be used as an alternative to Ta for climatological studies. Moreover, the observed differences between Ts and Ta may inform how thermal assumptions can be improved in satellite-based retrievals of soil and vegetation moisture or evapotranspiration.

Graphical Abstract

1. Introduction

Climatological data can usually provide two kinds of surface temperature: near-surface air temperature (Ta) and the skin temperature or land surface temperature (Ts) [1]. Ta and Ts are key variables for energy balance computations [2,3], weather forecasting [4,5], and environment and climate change studies [6,7]. Ta generally refers to atmospheric temperature at 2 m height above the ground measured by the thermometer from weather stations [8]. Although weather stations provide measurements with high accuracy and temporal resolution, the sparse distribution of meteorological stations is a major limitation in capturing information for a whole region [9]. Due to the spatial limitations of station data, integrating site data into models and trend analysis will cause uncertainties [10]. Various methods of interpolation have been proposed to obtain the spatial information of Ta [11]. However, the accuracy of interpolated temperature data from station-based observations mainly depends on the density of the station network [12]. Elevation and terrain-related factors also affect the accuracy of interpolation [13].
Remote sensing technology can be used to obtain continuous information on land surface characteristics, including Ts, to overcome the limitation of station datasets. The term “Ts” refers to the radiative skin temperature of the uppermost layer of the Earth’s surface [14]. Satellite-based Ts products are generally derived from satellite radiometers based on infrared (IR) or microwave (MW) wavelengths measurements [15], and are relatively objective standard records with a long-term sequence and broad spatial coverage. The most commonly used Ts datasets come from infrared satellite sensors such as the Moderate Resolution Imaging Spectroradiometer (MODIS) on the Aqua and the Terra satellites of NASA’s Earth Observing System (EOS), the Atmospheric Infrared Sounder (AIRS) on the Aqua satellite, the Visible Infrared Imaging Radiometer Suite (VIIRS) onboard the Suomi National Polar-Orbiting Partnership (S-NPP) satellite, the Spinning Enhanced Visible and Infrared Imager (SEVIRI) onboard the geostationary Meteosat Second Generation platforms, and the Sea and Land Surface Temperature Radiometer (SLSTR) on board the Sentinel-3 spacecraft [16,17,18,19].
Brazil is the largest country in South America, with an important ecosystem—the forest biome of Amazonia having an impact on regional and global climate [20]. Under the influence of global climate change and human activities, extreme drought events [21], forest fires [22], deforestation [23], and desertification [24] have frequently appeared in Brazil in recent decades. Since the climate and environment have changed drastically, it has become a research hotspot. Temperature can be used as a sensitive indicator for direct environmental monitoring research. For instance, de Barros Soares et al. (2017) [25] found most parts of South America to have overall warming signals using observational and climate model near-surface air temperature data. Based on the high-quality station-based air temperature, de los Milagros Skansi et al. (2013) [26] calculated indices such as “extreme temperature” and “days of extreme temperature” to assess the spatiotemporal pattern of temperature changes in South America, and provided evidence for warming across entire South America since the mid-20th century. Alternatively, Jiménez-Muñoz et al. (2013) [27] analyzed the spatiotemporal pattern of MODIS and reanalysis Ts data to identify warming in the Amazon region during El-Nino in 2015/2016. Other “direct uses” of Ts for environmental monitoring include the combination with a vegetation index to calculate drought index [28]. Other than using Ts as a direct indicator of environmental change, Ts data are also used indirectly as a model input parameter to retrieve other important physical variables (e.g., soil and vegetation moisture from satellite observations). For all these reasons, the application demand for reliable temperature datasets is increasing for the ecologically important Brazilian region, and satellite remote sensing provides a practical means to obtain continuous spatial Ts information.
Ta and Ts are different in definition, magnitude, and measurement methods [1]. However, they are often used interchangeably at daily and monthly average scales based on the assumption that they are intrinsically linked [29,30,31]. The close correlations between Ta and soil temperature at different depths were observed [32]. Moreover, Goldblatt et al. (2021) [33] found a significant correlation between Ta and Ts at small geographic scales, and proposed that Ts observed by remote sensing has the potential to assess thermal comfort. In fact, some studies have estimated Ta from Ts values because they are both determined by heat exchanges in the form of sensible heat and latent heat between the atmosphere and land surface boundary. The impact of Ts on the long-term variability of Ta, which is an indicator for climate change, motivates this study to assess the relationship between satellite Ts estimates and station-based Ta. The results of this analysis are of significance for the application of remotely sensed Ts, especially since clouds and aerosols often interfere with satellite observations in tropical regions such as Brazil. A close relationship between Ta and Ts has been reported in several studies and offers the possibility of mapping and monitoring the spatial distribution of Ta with the help of satellite Ts [34,35,36]. As a result, several studies have made efforts to estimate Ta using Ts [12,37,38]. However, surface characteristics and atmospheric conditions largely affect the difference between Ts and Ta [9]. A good agreement between minimum Ta and nighttime Ts was found in several studies. However, differences between maximum Ta and daytime Ts are relatively larger [39,40]. Mildrexler et al. (2011) [41] found that daytime Ts from Aqua MODIS was systematically warmer (over 10 °C) than Ta in barren areas. Vancutsem et al. (2010) [8] studied the Ta and MODIS Ts relationship in the different ecosystems over Africa and found that the difference between the two temperatures during daytime is mainly controlled by surface energy balance and strongly varies according to the seasonality, the ecosystems, the solar radiation, and cloud cover. Gallo et al. (2011) [42] compared Ta from 14 stations and Ts under both cloudy-sky and clear-sky conditions and found that the difference was strongly related to cloud conditions. Therefore, understanding the difference between Ts and Ta can provide a reference for estimating Ta based on satellite Ts, as well as assessing climate extremes such as droughts more comprehensively. In addition, remotely sensed Ts in forest areas generally represents the canopy temperature to a certain extent, while station-based observations represent the temperature closer to the surface. Understanding this difference can also improve the simulation of other variables in the inversion of land surface model parameters.
On the other hand, from the perspective of climate analysis, as the climate and environment change, the response difference between Ta and Ts could be used as an indicator to detect the land cover change, such as snow cover melting and vegetation change [41]. Good et al. (2017) [43] explored the relationship between Ta and Ts using over 17 years’ data across various locations and land cover, and found a high consistency between both variables based on trend analysis and heat wave monitoring to suggest a justification to increasingly use Ts in climate and weather research. Therefore, integrating the station-based temperature and remotely sensed Ts data can more accurately assess the temporal and spatial characteristics of temperature changes in a complex region such as Brazil, which has a wide range of climate conditions.
The maximum temperature is a more appropriate metric to estimate large scale climate system heat changes than using the mean daily average temperature [44]. Furthermore, the afternoon Ts has been suggested to be close to the maximum temperature of the land surface so that it is suitable for monitoring drought [45]. Moreover, the maximum surface temperature is more sensitive to land changes. Therefore, here, we focus on examining the relationship between satellite-based Ts from the afternoon overpass and the maximum Ta from station measurements in Brazil from three aspects, including (1) the relationship between monthly station-based Ta and Ts products from different instruments (i.e., AIRS and MODIS), (2) the spatio-temporal consistency of long-term trends in Ta and Ts products, and (3) the capacity of different products to capture temperature anomalies during extreme drought events. The purpose of this study is to explore the potential of satellite-based Ts products in climate research and provide references for their applications.

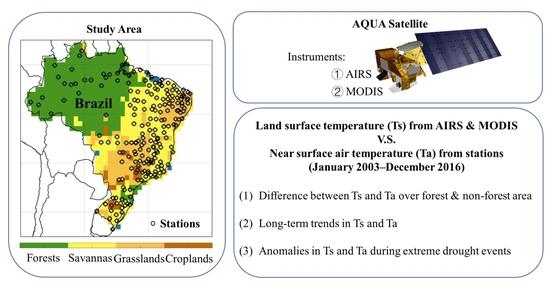
2. Materials and Methods

2.1. Data Sources

2.1.1. Temperature Data

Three satellite-based temperature products during 2003–2016 at monthly intervals are used in this study (Table 1), including (1) land surface temperature (Ts, K) from the daytime overpasses (1:30 PM) of the AIRS onboard Aqua (Version 6, AIRS3STM 006, 1° spatial resolution) [46], (2) land surface temperature (Ts, K) from the daytime overpasses (1:30 PM) of the AIRS onboard Aqua (Version 7, AIRS3STM 7.0, 1° spatial resolution) [47], and (3) land surface temperature (Ts, K) from the daytime overpasses (1:30 PM) of the MODIS onboard Aqua (Collection 6, MYD11C3, 0.05° spatial resolution) [48]. The AIRS and MODIS instruments used in this study are both from Aqua which was launched in May 2002 with the local equatorial crossing times around 1:30 AM for descending swath and 1:30 PM for ascending swath. This selection ensures AIRS and MODIS temperatures have the identical observation time for a direct comparison.
The MODIS instrument has a swath of 2330 km and 36 channels including 20 visible/near-infrared bands and 16 thermal infrared bands ranging from 3 to 15 μm [49]. MYD11C3 is based on a day-night algorithm that simultaneously retrieves surface band emissivity and Ts using MODIS bands 20, 22, 23, 29, and 31–33 [50]. MODIS Ts retrieved by the day/night algorithm have been demonstrated to agree with the in situ measured Ts within ±1 K [51].
The AIRS is a hyperspectral resolution infrared sounder with a swath of 1650 km and 2378 channels covering the 3.7–15.4 µm spectral range [52]. There are far more channels than MODIS, but the AIRS product has a coarser spatial resolution. Susskind et al. (2014) [53] showed the detailed inversion steps of the AIRS retrieval system, in version 6, the shortwave window region (4.0 to 3.76 μm) to simultaneously determine Ts and shortwave emissivity. Comparing the AIRS Ts with the in situ measured, a 1.5–3 K difference was observed at different stations [54]. The most important improvement of AIRS V6 data (AIRS3STM 006) over the previous version is the implementation of a more accurate emissivity initial guess by neural network technology, which can reduce errors caused by clouds [55]. When compared to V6 data, the recently released AIRS V7 monthly Ts data (AIRS3STM 7.0) utilizes a slightly different averaging approach to obtain the monthly average from each valid observation. The V6 data uses the “averaged by observation” approach which considers (1) the number of total valid observations each day in each 1° grid cell and (2) the daily Ts to determine the weight assigned to each day to calculate the average of that month. The V7 product is generated by the “averaged by day” approach in which every day has the same weight regardless of the number of valid observations each day. Ding et al. (2020) [56] applied these two averaging approaches on AIRS V6 Ts data and found that the estimates from the “averaged by observation” approach are generally warmer than the “averaged by day” approach.
The station-based maximum air temperatures used in this study are provided by the Brazilian National Institute of Meteorology (INMET). The network has 265 conventional stations to continuously monitor weather conditions [57]. We selected 204 stations with good temporal coverage and continuity during the study period 2003–2016 (see Figure 1).

2.1.2. Additional Non-Temperature Data

In addition to temperature date, four gridded datasets are used to characterize vegetation distribution, atmospheric condition and energy exchange in this study (Table 1). They are (1) the land cover (LC) product from MODIS (MCD12C1, Collection 6) based on the International Geosphere-Biosphere Programme (IGBP) classification scheme [58], (2) the percentage of tree cover component of the vegetation continuous fields (VCF) from the MODIS (MOD44B Collection 6) [59], (3) the sensible heat flux data from MERRA-2 reanalysis [60], and (4) the cloud fraction (CF) data from AIRS (Version 6, AIRS3STM) [46].

2.1.3. Data Pre-Processing

For a more direct comparison between MODIS and AIRS, the 0.05° resolution MODIS Ts dataset was re-sampled to the AIRS spatial resolution (1°) by aggregation. The aggregation method of Ts is to average the Ts of all 0.05° pixels within 1° resolution. The re-sampled and original MODIS Ts datasets were both used here to examine their performance at different spatial resolutions. In addition, the 0.05° resolution MODIS land cover map was aggregated to 1° resolution by the dominant class of land cover (Figure 1a). The 250 m tree cover percentage dataset was aggregated to 1° resolution by calculating the average tree cover percentage of each 1° grid cell (Figure 1b). The sensible heat flux dataset was re-sampled to 1° resolution by bilinear interpolation from its original resolution.
Stations inevitably have observational uncertainties resulting in incomplete data coverage or with some missing daily values and outliers. Data processing is controlled by setting certain conditions. First, some stations were excluded without observation time coverage to 2016. Then, for the station-based daily maximum air temperature (Ta) data from 2003 to 2016, for each station, values above the 95th percentile or below the 5th percentile of the entire time series were removed to exclude potential outliers. The monthly average temperature was then obtained by averaging the daily temperature if more than 15 days of that month have valid temperature measurements. Otherwise, we consider no valid monthly temperature for that month. The conditions were set based on the fact that the number of available days per month is almost more than 15 days in all sample distribution analysis. This is a suitable condition for the average to represent the monthly value. Finally, stations with insufficient monthly data were excluded to obtain 204 stations with good temporal coverage and continuity.

2.2. Analysis Method

2.2.1. Overall Relationship between Satellite- and Station-Based Temperatures

In this section, we compared the spatial distribution of satellite- and station-based temperatures in Brazil. To achieve this, first, we calculated the multi-year (2003–2016) average temperature for each station based on field measurements, and for each grid cell based on satellite observations. The station measurement is compared with satellite-based observation over the grid cell where the station is located. The agreement of their spatial distribution was examined by three statistical metrics, i.e., Pearson’s correlation coefficient (R), root mean square deviation (RMSD), and bias. Second, we investigated the agreement in temperature dynamics between monthly Ta and Ts during 2003–2016. To achieve this, three statistical metrics (R, RMSD, and bias) were calculated for each station and the corresponding grid cell. Their relationship was further examined for different land cover types.

2.2.2. Long-Term Trends in Satellite- and Station-Based Temperatures

Here we examined the agreement in long-term trends between satellite- and station-based temperatures, as the average change rate is an important aspect for climate change analysis [61]. We first calculated the annual average temperature for each year from 2003 to 2016 for each station and all grid cells in Brazil, and then applied the non-parametric Mann–Kendall (MK) on the annual average temperature to derive the annual change rate during 2003–2016 and associated statistical significance level [62]. The comparison was conducted between each station and the corresponding grid cell using three statistical metrics (R, RMSD, and bias).

2.2.3. Anomalies in Satellite- and Station-Based Temperatures during Extreme Drought Events

Three severe droughts hit the Amazon in 2005, 2010, and 2015–2016, respectively [63]. The events in 2005 and 2010 mainly occurred during July and August, whereas the event in 2015 lasted from July 2015 to July 2016. The anomalies in satellite- and station-based temperatures during July and August in 2005, 2010, and 2015 were compared here. Following the method used in Xu et al. (2011) [64], the standardized anomalies in temperatures were calculated using the equation below.
S t d a n o m a l i e s = T T m e a n σ  
where Stdanomalies represents the standardized anomalies, T is the mean temperature of July and August in a specific year (i.e., 2005, 2010, and 2015). Tmean is the mean temperature in July and August over the reference period, i.e., 2003–2016 excluding drought years 2005, 2010, and 2015, while σ is the standard deviation of mean temperature in July and August over the reference period. The standardized anomalies were calculated for each station and all grid cells in Brazil, while the comparison was conducted between each station and the corresponding grid cell.

3. Results

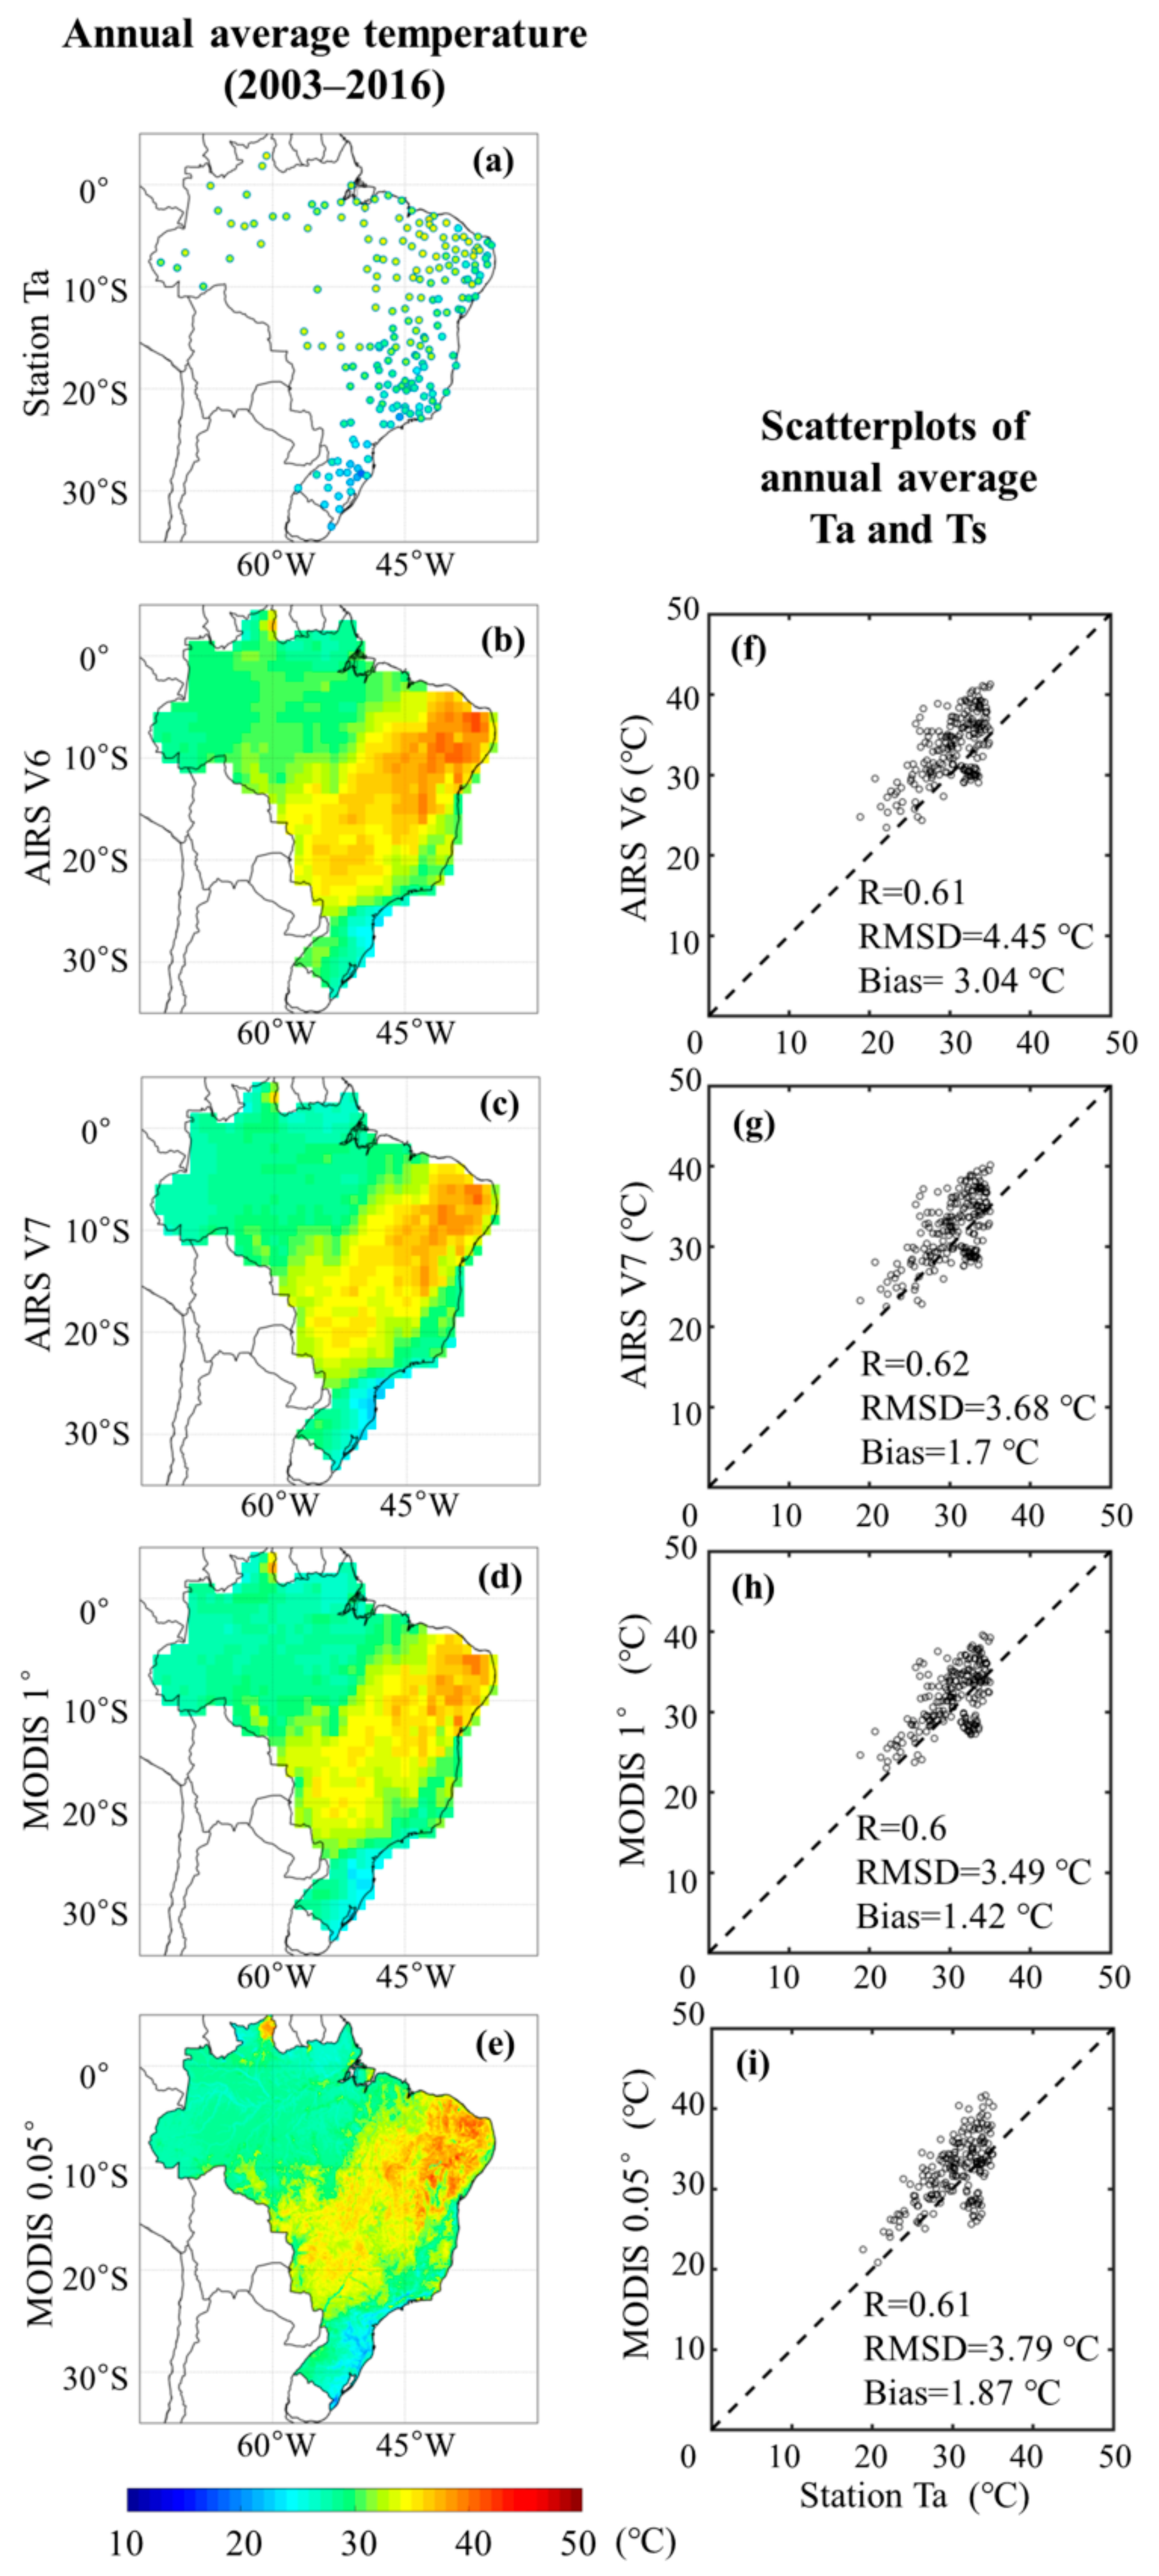
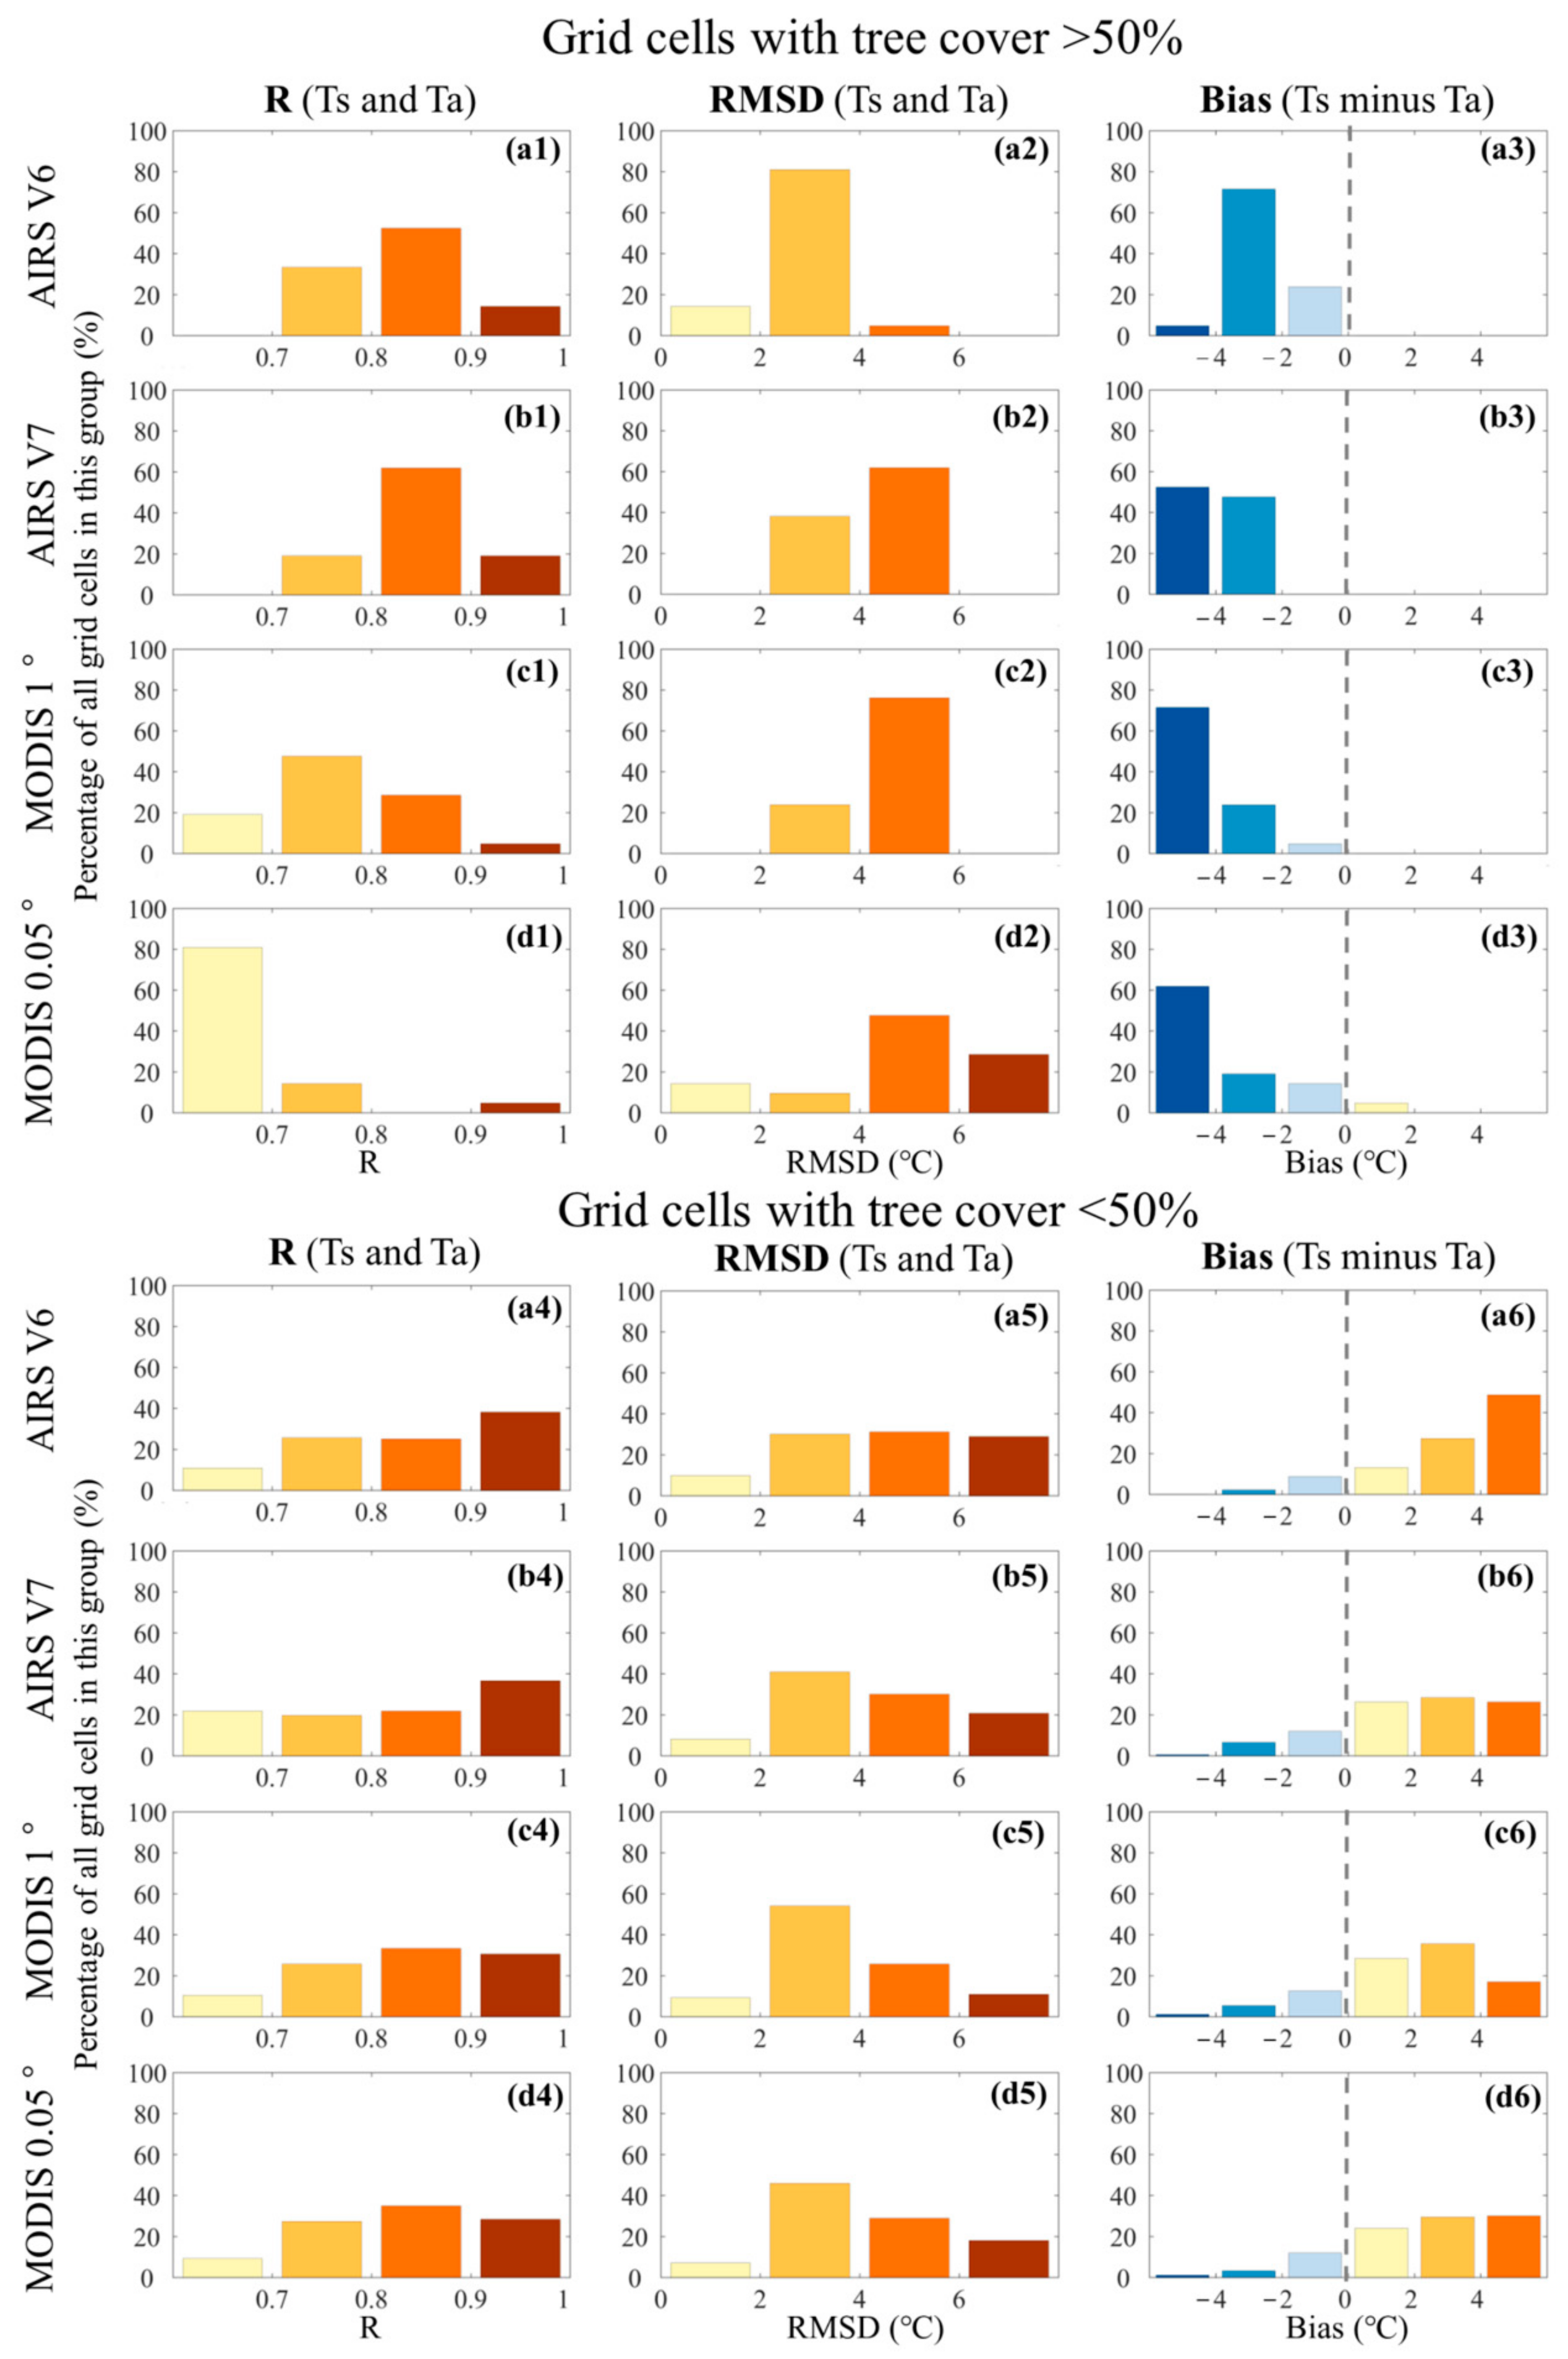
3.1. Overall Relationship between Monthly Satellite- and Station-Based Temperatures

Spatial distributions of average temperatures for all stations and grid cells during 2003–2016 are shown in Figure 2 (left column). All five temperature datasets show a similar pattern, with the highest temperature observed over the non-forest grid cells in the tropics (23.5°N–23.5°S) and the lowest temperature over the region in the southernmost part of Brazil (south of 23.5°S). The scatterplots between individual satellite-based Ts and station-based Ta are displayed in the right column of Figure 2. The correlation coefficient (R) is above 0.6 for all four Ts, suggesting a reasonable spatial agreement between satellite- and station-based temperatures. In these scatterplots, most of the dots are located above the 1:1 line and the bias values are positive for all four satellite-based Ts. AIRS V6 Ts has the largest bias of 3.04 °C (Figure 2f), while the bias values for the other three Ts are between 1.42 and 1.87 °C, i.e., roughly 50–60% of AIRS V6 (Figure 2g–i).
We examined the similarity in temporal variations between monthly Ts and Ta during 2003–2016 for each station and the corresponding grid cell using three metrics R, RMSD, and bias (Figure 3). The spatial patterns of four satellite-based Ts are very similar. R values, shown in the left column of Figure 3, are generally higher than 0.6, with the highest values (>0.9) over the northeastern and southernmost parts of Brazil. RMSD values are basically lower than 8 °C, with the highest values over the eastern part of the country (middle column of Figure 3). The most striking feature is observed in the spatial distribution of bias values, with the negative bias over the forest region versus the positive bias over the non-forest region (right column of Figure 3), which led us to separate the stations in these two regions (i.e., tree cover > 50% and tree cover < 50%) for further examination.
The distribution of R, RMSD, and bias between station- and satellite-based temperatures over the grid cells with tree cover > 50% (i.e., forest area) is shown in the top part of Figure 4. Over the stations in the forest area, the correlation coefficients (R) between Ta and AIRS Ts (both V6 and V7) are higher than those with MODIS Ts (Figure 4(a1–d1)). More than 70% of R values between Ta and AIRS Ts are greater than 0.8, whereas more than 70% of R values of MODIS Ts are lower than 0.8. When it comes to the RMSD values, more than 90% are lower than 4 °C for AIRS V6 Ts, whereas the majority of other three Ts products are higher than 4 °C (Figure 4(a2–d2)). The bias values (i.e., Ts minus Ta) are dominantly negative for all four Ts products (Figure 4(a3–d3)), suggesting satellite-based Ts observations are lower than station-based Ta measurements over the forest area. The bias of AIRS V6 is primarily between −4 to 0 °C, whereas the bias of other Ts products is more negative and mainly lower than −4 °C.
For the stations in the grid cells with tree cover < 50% (i.e., non-forest area), the patterns of R, RMSD, and bias between station- and satellite-based temperatures are very similar among four Ts products (bottom part of Figure 4), which is different from that over the forest area. More than 80% of R values are greater than 0.7 here (Figure 4(a4–d4)). The majority of RMSD values are in the range of 2–8 °C, with AIRS V6 Ts having more grid cells with high RMSD values > 6 °C (Figure 4(a5–d5)). Most of the bias values are positive (i.e., Ts higher than Ta) (Figure 4(a6–d6)). AIRS V6 Ts has the strongest bias with 50% of the values higher than 4 °C, while other Ts products only have 20–30% higher than 4 °C.

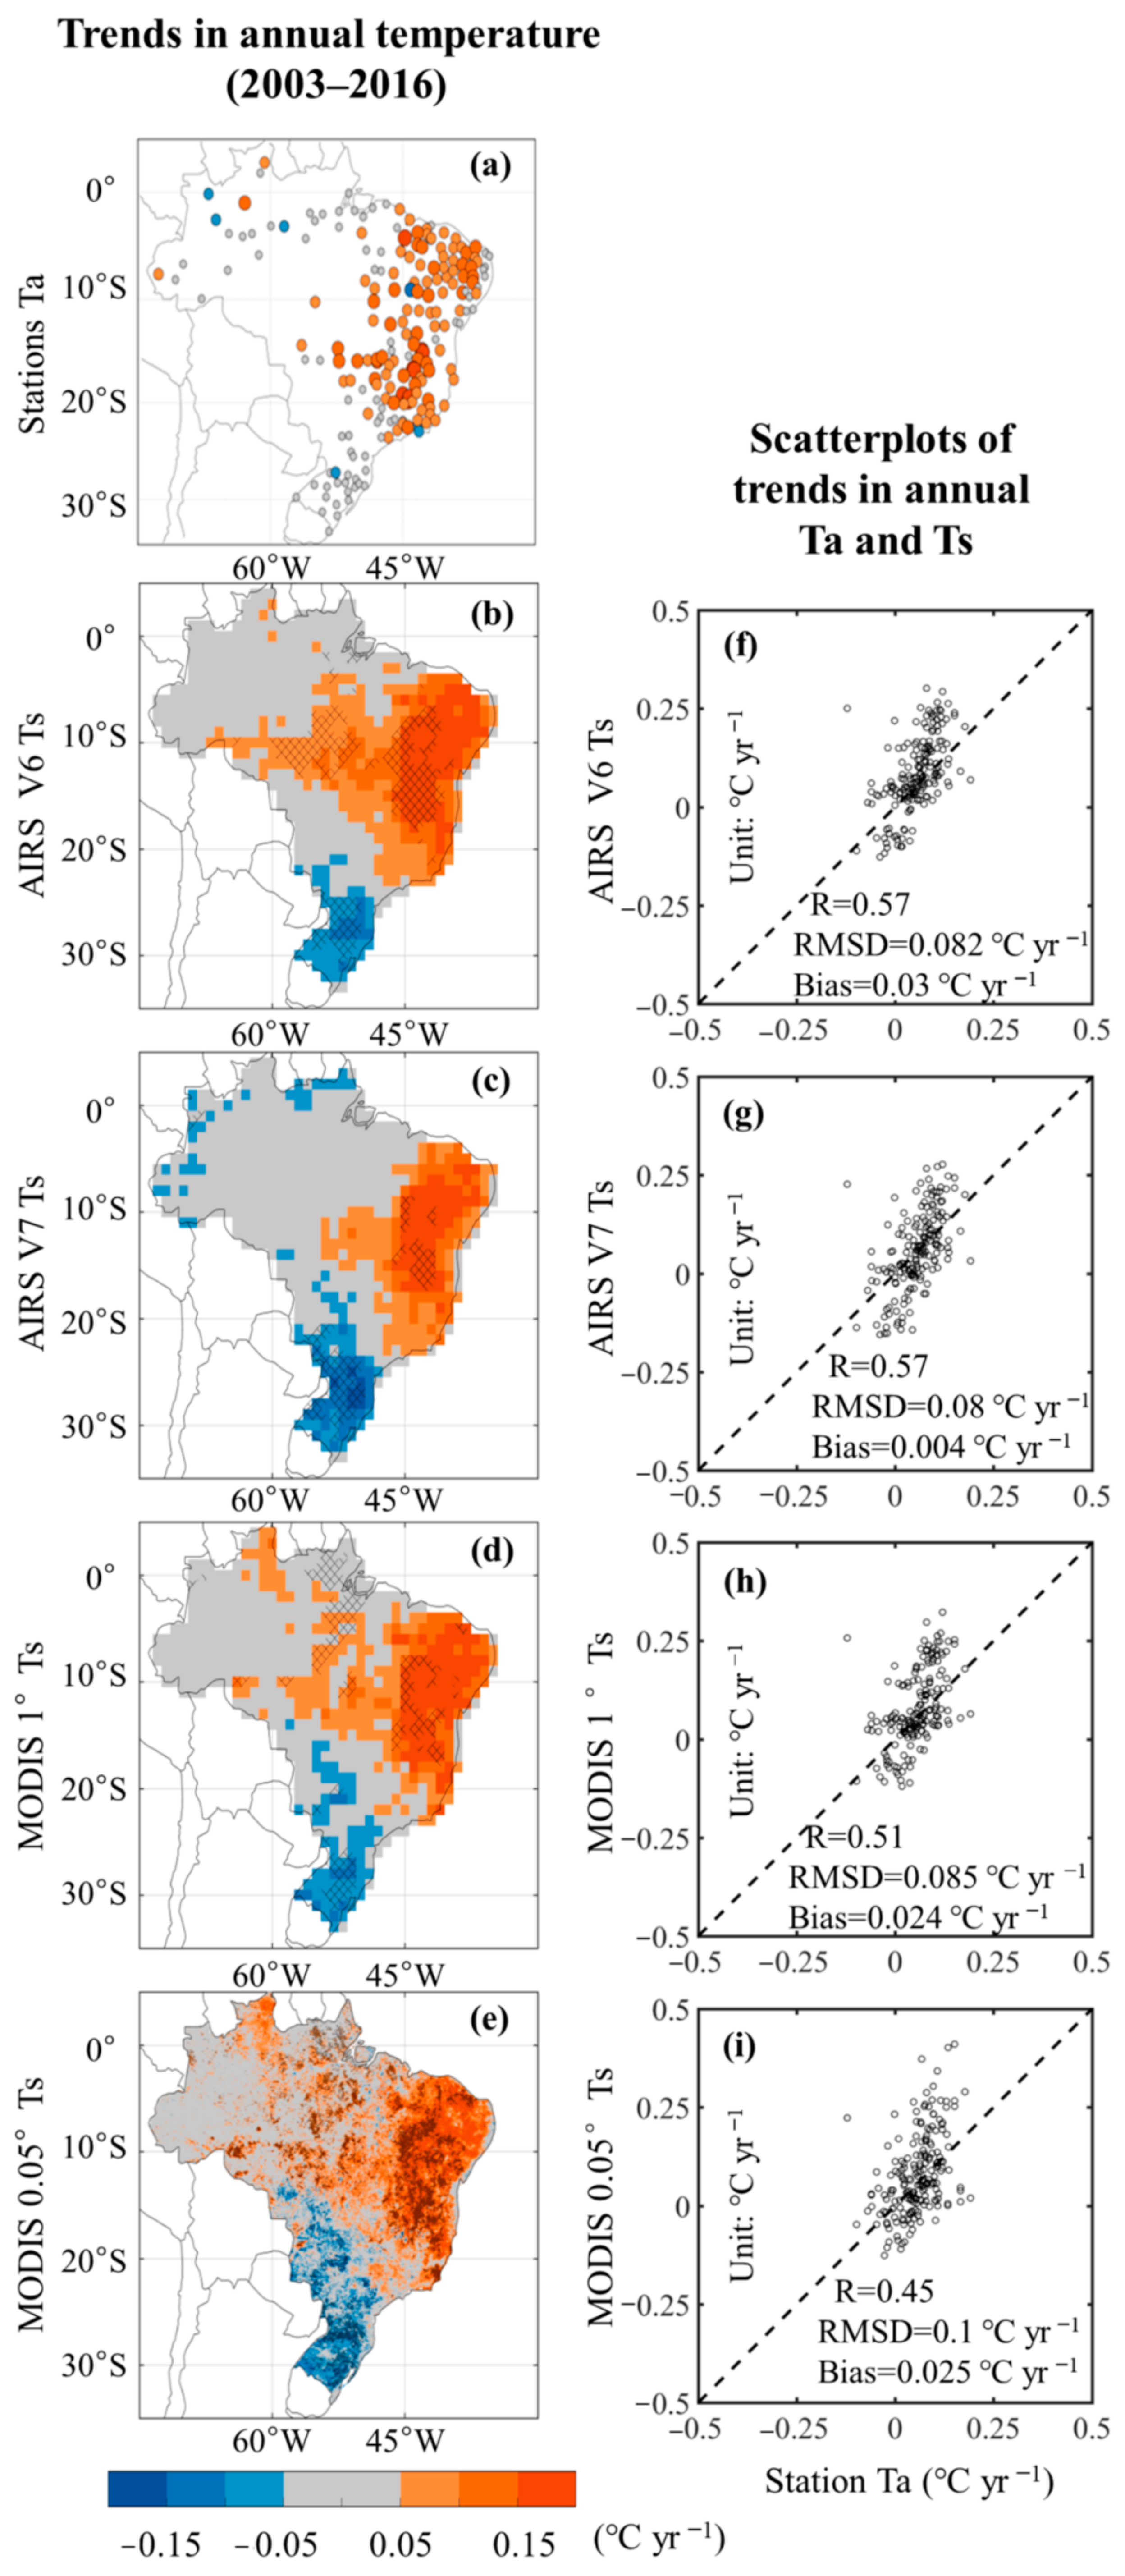
3.2. Long-Term Trends in Satellite- and Station-Based Temperatures

Spatial distributions of long-term trends in annual average Ta for each station and four Ts products for each grid cell during 2003 and 2016 are shown in Figure 5 (left column). An overall increasing trend in temperatures is detected from all five datasets, with the strongest increase in the eastern Brazil (>0.15 °C yr−1). Their main difference is observed over the forest. AIRS V6 Ts shows large-scale significant decreasing trends over the southeast part of the forest, but AIRS V7 Ts rarely captures these decreases. MODIS 1° and 0.05° Ts can generally detect the decreasing trends over the southeast part of the forest, they also show warming signals over the central and north parts of the forest. Apart from the increasing trends, all satellite-based Ts datasets show decreasing trends in temperature over the southernmost Brazil (Figure 5b–e), while the changes are not obvious in the station-based Ta measurements.
Scatterplots of trends between four satellite-based Ts products and station-based Ta are shown in Figure 5 (right column). Three metrics, R, RMSD, and bias, are used to quantify their relationship. R values between two AIRS Ts products and Ta (0.57) are higher than MODIS Ts products. All three 1° Ts products have similar RMSD values (~0.08 °C yr−1), while MODIS 0.05° Ts has a slightly higher RMSD value (0.1 °C yr−1). Regarding the bias, AIRS V7 Ts has a much lower value (0.004 °C yr−1) than the other three products (0.024 to 0.03 °C yr−1) as AIRS V7 has more grid cells with decreasing trends.

3.3. Anomalies in Satellite- and Station-Based Temperatures during Extreme Drought Events

Figure 6 shows the standardized anomalies in station-based Ta and four satellite-based Ts during the drought events in 2005, 2010, and 2015, respectively. All temperature products show similar spatio-temporal patterns. The spatial extent and magnitude of positive anomalies in temperatures increased from 2005 to 2015. Positive anomalies in 2005 are only observed in the forest area, especially over the southwestern part of the forest. When it comes to 2015, nearly entire Brazil witnessed positive anomalies in temperatures with the strongest anomalies (greater than two standard deviations) over the western part of the forest.
Quantitative comparisons between anomalies in Ts and Ta in 2005, 2010, and 2015 are presented in the scatterplots of Figure 6 (right column). The correlations between Ta and four Ts products are very similar, with the highest R value (0.7) between AIRS V6 and Ta and the lowest R value (0.62) between MODIS 0.05° and Ta. Positive bias values are observed from four Ts products indicate that standardized anomalies in Ts are higher than Ta. The RMSDs of the four Ts products vary from 0.86 for AIRS V6 to 0.98 for MODIS 0.05°. Overall, the anomalies in AIRS products appear to be more consistent with station-based Ta than MODIS products.

4. Discussion

4.1. Overall Relationship between Monthly Satellite- and Station-Based Temperatures

Our study shows that annual average Ts over the forest area is lower than the non-forest area in Brazil. Moreover, Ts is lower than Ta over the forest area, but higher than Ta over the non-forest area. Ts over the vegetated regions are lower because they mainly reflect the top of the canopy temperature which may be cooler than the air temperature near the soil ground. Li et al. (2015) [65] showed that forests have a strong cooling effect throughout the year in tropical regions. This surface’s cooling effect is mainly through the process of evapotranspiration and heat convection [66]. On the other hand, eastern Brazil has a mainly arid and semi-arid climate, a relatively dry region with low vegetation coverage. Arid areas are more sensitive to radiative forcing [29], because areas with low vegetation coverage such as bare land have a lower heat capacity than air [67]. As the temperature rises, more energy accumulates at the surface [41]. The above reasons suggest why there is more heating at the land surface than in the air. Thus, Ts is generally higher than Ta during the daytime. Therefore, the negative and positive biases between Ts and Ta as shown in Figure 3 and Figure 4 appear to vary as a function of vegetation density.
Some studies also show that there is a relationship between the difference in Ts and Ta (i.e., Ts minus Ta) and the sensible heat fluxes [68,69,70]. Accordingly, we examined the relationship between Ts minus Ta and the sensible heat fluxes in Brazil (Figure 7). There is a linear relationship between Ts−Ta from four different Ts products and the multi-year average sensible heat fluxes. The correlation coefficient (R) values of all Ts products are very similar. In general, areas with high tree cover correspond to low values of sensible heat flux, and areas with low tree cover correspond to high sensible heat flux. For areas with high vegetation coverage, especially tropical rain forests, the daytime solar radiation is mainly constrained by evapotranspiration, resulting in low sensible heat fluxes. With the decrease of vegetation density, the evapotranspiration activity decreases, and the sensible heat flux increases. Therefore, there is usually a high sensible heat fluxes in drier regions which are normally characterized by larger differences in Ts and Ta. We note here that, although we generally expect Ts−Ta would be approximate to sensible heat fluxes, thus resulting in almost no sensible heat fluxes when Ts − Ta = 0, this assumption breaks down especially over high vegetation areas since [69,71]. Additionally, studies such as Gerken et al. (2018) [72] showed that there is a lack of surface energy closure in the forested areas of the Amazon. This explains why the sensible heat does not strictly converge to 0 in the forested regions (greener circles) in Figure 7.
The atmospheric conditions (e.g., clouds and aerosols) may also impact the results of our analysis. Based on the distribution of multi-year average clouds fraction, shown in Figure 8, there are higher cloud fraction (over 0.5) over the rainforest, mainly due to water vapor brought about by evapotranspiration which leads to cloud formation [73]. The Amazon region is an important source of aerosols due to biomass burning, deforestation, and agricultural practices [74]. Clouds and aerosol can also block the amount of sunlight reaching the surface. Although within the satellite data, Ts observations contaminated by clouds and heavy aerosols have been removed, there still exist uncertainties within the satellite Ts datasets since it is rather difficult to accurately identify pixels of clouds and aerosols [67]. Cold clouds may be mistaken for land surface temperature due to subpixel uncertainties. Arid and semi-arid regions with relatively low cloud cover make it easier for solar radiation to reach the surface, further increasing the possibility of Ts higher than Ta. In addition, meteorological factors such as wind and topographical factors such as elevation also affect the relationship between Ta and Ts [36].
Our study also found that MODIS Ts product is generally lower than AIRS, which is consistent with the previous study [75]. It showed that MODIS C5 is systematically lower (~1.7 K) than AIRS/AMSU V5 between 50°N–50°S, and contributed the difference to different algorithms and sensor characteristics. However, the relatively low correlation coefficient between MODIS Ts and Ta over the cloudy tropical rainforest may suggest that the impacts of clouds are much stronger on MODIS Ts than on AIRS Ts. AIRS, using only shortwave channels, has greatly improved the ability to obtain more accurate Ts under more stressing partial cloud cover conditions [76]. This may make AIRS data more consistent with Ta over cloudy areas.

4.2. Long-Term Trends in Satellite- and Station-Based Temperatures

Both satellite-based Ts and station-based Ta show consistent temperature change signals during 2003 and 2016, although certain differences are noticed at different scales. The most significant increase in central Brazil is based on temperature data from 1975 to 2004 [25]. The mean land surface temperatures of the four daily representative observations of MODIS from Aqua and Terra were used to evaluate the changes in global Ts during 2003–2016 [77], and global surface skin temperature change was studied based on AIRS data for the period 2003 through 2017 [78]. Their results all showed consistent findings with the outcome of this study. The most obvious linear warming trend is observed in eastern Brazil. Recently, Chen et al. (2019) [79] used MODIS Leaf Area Index (LAI) data to find that the forests and Cerrado are browning in eastern South America. Desertification in these areas is intensified due to severe drought events, deforestation and agricultural expansion [80].
The Ts trends of MODIS 0.05° product observes more spatial details and more grid cells with warming signals in the central Amazon forest than the 1° product, which reflects the advantages of MODIS with high resolution. There are no obvious warming signals in the northwest of the forest area based on the four satellite-based products, but the southeast of the forest area experienced significantly warming trends. The southeast part of the tropical rainforest is a deforestation zone called the “arc of deforestation” [23]. Ts warming signals from our result are spatially consistent with “arc of deforestation”. Deforestation can cause a warming effect of 0.28 °C per decade in tropical regions where the effect of evapotranspiration on temperature exceeds albedo [81]. Although the new version of V7 AIRS cannot detect such abnormal signals, satellite Ts can sensitively reflect changes in surface conditions such as canopy conditions.
Based on a review of precipitation trends in the Americas [82], the positive trends in average precipitation and extreme precipitation events are increasing in southern Brazil. Montini et al. (2019) [83] found that the increase in precipitation in southeastern South America is related to the low-level jet transporting large amounts of water from the Amazon to subtropical regions. Therefore, the anomalous cooling signals based on Ts and Ta are very likely related to the local humidity.

4.3. Anomalies in Satellite- and Station-Based Temperatures during Extreme Drought Events

The anomalies in satellite-based Ts products and station-based Ta are spatially consistent in the dry season of three drought years, 2005, 2010, and 2015. Widespread positive standardized anomalies of temperature are mainly in the Amazon region of Brazil. The spatial extent of positive temperature anomalies extended from the Amazon to the entire Brazil, and the magnitudes of these anomalies increased as well. These extreme anomalous signals detected by AIRS are stronger than MODIS, but closer to the result of Ta.
Although we only show the Amazon part of Brazil, our results are consistent with previous studies on the temperature anomaly patterns of these three drought events. Jiménez-Muñoz et al. (2015) [84] found that the positive anomalies of the dry season in 2005 were mainly in the southwest and northeastern parts of the rainforest, but the result of 2010 year was more widespread in the Amazon region, and more serious in the southeastern Amazon based on MODIS and ERA-Interim land surface temperatures data. The response of vegetation to these two drought events confirmed such anomalous spatial patterns [85]. The extreme surface temperature in 2015 broke a record over the Amazon region [86]. The wider and stronger anomalies in temperature during the drought event in 2015 reveal a more extensive drought in 2015 [87]. Panisset et al. (2018) [88] studied the climatic conditions of the Amazon during the drought period (June–September) in 2005, 2010, and 2015, and found that the drought associated with precipitation, Ts, and radiation. In particular, the negative anomaly in precipitation in 2015 greatly exceeded previous events in terms of both magnitude and spatial extent. Jimenez et al. (2018) [63] analyzed these three drought events from the perspective of total cloud cover, and found that a significant downward trend of the total amount of clouds in the southern Amazon basin during the dry season, which may explain the increase in radiation and the decrease in precipitation in these areas. The increase in biomass burning in Brazil is also related to the three drought events [89]. The most obvious signals have different spatial and temporal distribution patterns, such as southwestern Amazon in the dry season in 2005, central Brazil in the dry season in 2010, and the areas north of 20°S in Brazil during the 2015–2016 dry-to-wet transition season. Increase in aerosol concentration may enhance drought [90], promoting a mechanism between deforestation, fire and drought [88]. Severe drought in the dry season will lead to significant water stress and higher temperatures [91], which makes the local environment more sensitive and drought, and exacerbate the local water shortage.
The transition from negative anomalies to positive anomalies in eastern Brazil from 2005 to 2015 reflects a wider range of temperature warming signals. As the overall warming trends in eastern Brazil based on the analysis of the trend in the previous section, the increase in temperature over Brazil is also a potential factor to explain the increase in the intensity of the standardized anomaly. Droughts have frequently occurred in the northeastern region of Brazil since 2012 [92]. Under drought conditions characterized by high temperature and lack of precipitation, the forest is likely to be converted to a drier savanna-like biome [93]. The inconsistent spatial patterns of different year events are related to climate background. The drought in 2005 and 2010 was related to the abnormal warming over the Indian Ocean and the tropical North Atlantic, and the drought in 2010 and 2015 was also accompanied by the El Niño event, especially stronger in 2015 [87]. Meanwhile, atmospheric conditions, changes in the surface, and human activities also exacerbate environmental changes.

5. Conclusions

In this study, we investigated the relationship between monthly satellite-based land surface temperature (Ts) products (from AIRS and MODIS) and station-based near-surface air temperature (Ta) during the period 2003–2016 over Brazil. Ts products are found lower than Ta over the highly vegetated region (e.g., tree cover > 50%), but higher than Ta over non-forest regions (e.g., tree cover < 50%). Nevertheless, the temporal correlation between Ts and Ta is generally high. AIRS Ts product has a more consistent relationship with Ta than MODIS product over the cloudy tropical rainforest areas.
All four satellite-based Ts products show an overall warming trend in Brazil during 2003–2016, with the strongest increase in eastern Brazil. These trend signals from satellite-based Ts agree with the ground measurements very well. This warming trend may have been intensified as a result of large-scale deforestation activities in Brazil. This study also examined the temperature anomalies during extreme drought events in 2005, 2010, and 2015. Both satellite-based Ts and station-based Ta show very similar spatio-temporal patterns. It is found that the spatial extent and magnitude of positive temperature anomalies (i.e., hotter conditions) expanded considerably from 2005 to 2015.
Understanding the relationship between Ts and Ta in different ecosystems will improve the accuracy of climate models and the methods of estimating air temperature and soil moisture from satellite-based Ts products. Ts is very sensitive to changes in the atmosphere and surface environment, and therefore helpful in monitoring environmental changes. It is expected the findings of this study will help improve the applicability of Ts products derived from AIRS and MODIS, for example, in understanding Ts uncertainties in soil moisture retrievals in the daytime, and understanding how Ts drives Ta trends.

Author Contributions

Conceptualization, J.L. and Y.L.; methodology, J.L. and Y.L.; writing—original draft preparation, J.L.; writing—review and editing, J.L., Y.L., D.F.T.H. and T.R.H.; supervision, D.F.T.H. and T.R.H. All authors have read and agreed to the published version of the manuscript.

Funding

This research received no external funding.

Acknowledgments

In this study, multi-resource data were downloaded from different data centers. The authors thank the Land Processes Distributed Active Archive Center, Goddard Earth Sciences Data Information and Services Center, the Brazilian National Institute of Meteorology for making their data freely available.

Conflicts of Interest

The authors declare no conflict of interest.

References

  1. Jin, M.; Dickinson, R.E. Land surface skin temperature climatology: Benefitting from the strengths of satellite observations. Environ. Res. Lett. 2010, 5, 044004. [Google Scholar] [CrossRef]
  2. Savage, M.J.; Everson, C.S.; Metelerkamp, B. Bowen ratio evaporation measurement in a remote montane grassland: Data integrity and fluxes. J. Hydrol. 2009, 376, 249–260. [Google Scholar] [CrossRef]
  3. Stephens, G.L.; L’Ecuyer, T. The Earth’s energy balance. Atmos. Res. 2015, 166, 195–203. [Google Scholar] [CrossRef]
  4. Atlaskin, E.; Vihma, T. Evaluation of NWP results for wintertime nocturnal boundary-layer temperatures over Europe and Finland. Q. J. R. Meteorol. Soc. 2012, 138, 1440–1451. [Google Scholar] [CrossRef]
  5. Singh, R.; Singh, C.; Ojha, S.P.; Kumar, A.S.; Kishtawal, C.; Kumar, A.K. Land surface temperature from INSAT-3D imager data: Retrieval and assimilation in NWP model. J. Geophys. Res. Atmos. 2016, 121, 6909–6926. [Google Scholar] [CrossRef]
  6. Foster, G.; Rahmstorf, S. Global temperature evolution 1979–2010. Environ. Res. Lett. 2011, 6, 044022. [Google Scholar] [CrossRef]
  7. Overland, J.; Hanna, E.; Hanssen-Bauer, I.; Kim, S.; Walsh, J.; Wang, M.; Bhatt, U.; Thoman, R.; Ballinger, T. Surface air temperature. Arct. Rep. Card 2015, 2015, 10–16. [Google Scholar]
  8. Vancutsem, C.; Ceccato, P.; Dinku, T.; Connor, S.J. Evaluation of MODIS land surface temperature data to estimate air temperature in different ecosystems over Africa. Remote Sens. Environ. 2010, 114, 449–465. [Google Scholar] [CrossRef]
  9. Noi, P.T.; Kappas, M.; Degener, J. Estimating daily maximum and minimum land air surface temperature using MODIS land surface temperature data and ground truth data in Northern Vietnam. Remote Sens. 2016, 8, 1002. [Google Scholar] [CrossRef]
  10. Urban, M.; Eberle, J.; Hüttich, C.; Schmullius, C.; Herold, M. Comparison of satellite-derived land surface temperature and air temperature from meteorological stations on the pan-Arctic Scale. Remote Sens. 2013, 5, 2348–2367. [Google Scholar] [CrossRef]
  11. Wang, M.; He, G.; Zhang, Z.; Wang, G.; Zhang, Z.; Cao, X.; Wu, Z.; Liu, X. Comparison of spatial interpolation and regression analysis models for an estimation of monthly near surface air temperature in China. Remote Sens. 2017, 9, 1278. [Google Scholar] [CrossRef] [Green Version]
  12. Vogt, J.V.; Viau, A.A.; Paquet, F. Mapping regional air temperature fields using satellite-derived surface skin temperatures. Int. J. Climatol. A J. R. Meteorol. Soc. 1997, 17, 1559–1579. [Google Scholar] [CrossRef]
  13. Stahl, K.; Moore, R.; Floyer, J.; Asplin, M.; McKendry, I. Comparison of approaches for spatial interpolation of daily air temperature in a large region with complex topography and highly variable station density. Agric. For. Meteorol. 2006, 139, 224–236. [Google Scholar] [CrossRef]
  14. Eleftheriou, D.; Kiachidis, K.; Kalmintzis, G.; Kalea, A.; Bantasis, C.; Koumadoraki, P.; Spathara, M.E.; Tsolaki, A.; Tzampazidou, M.I.; Gemitzi, A. Determination of annual and seasonal daytime and nighttime trends of MODIS LST over Greece-climate change implications. Sci. Total Environ. 2018, 616, 937–947. [Google Scholar] [CrossRef]
  15. Ermida, S.L.; Trigo, I.F.; DaCamara, C.C.; Jimenez, C.; Prigent, C. Quantifying the clear-sky bias of satellite land surface temperature using microwave-based estimates. J. Geophys. Res. Atmos. 2019, 124, 844–857. [Google Scholar] [CrossRef]
  16. Liu, Y.; Yu, Y.; Yu, P.; Göttsche, F.M.; Trigo, I.F. Quality assessment of S-NPP VIIRS land surface temperature product. Remote Sens. 2015, 7, 12215–12241. [Google Scholar] [CrossRef]
  17. Niclos, R.; Galve, J.M.; Valiente, J.A.; Estrela, M.J.; Coll, C. Accuracy assessment of land surface temperature retrievals from MSG2-SEVIRI data. Remote Sens. Environ. 2011, 115, 2126–2140. [Google Scholar] [CrossRef]
  18. Parkinson, C.L. Summarizing the first ten years of NASA’s Aqua mission. IEEE J. Sel. Top. Appl. Earth Obs. Remote Sens. 2013, 6, 1179–1188. [Google Scholar] [CrossRef]
  19. Yang, J.; Zhou, J.; Göttsche, F.-M.; Long, Z.; Ma, J.; Luo, R. Investigation and validation of algorithms for estimating land surface temperature from Sentinel-3 SLSTR data. Int. J. Appl. Earth Obs. Geoinf. 2020, 91, 102136. [Google Scholar] [CrossRef]
  20. Malhi, Y.; Roberts, J.T.; Betts, R.A.; Killeen, T.J.; Li, W.; Nobre, C.A. Climate change, deforestation, and the fate of the Amazon. Science 2008, 319, 169–172. [Google Scholar] [CrossRef]
  21. Ferreira, V.; Montecino, H.; Ndehedehe, C.; Heck, B.; Gong, Z.; De Freitas, S.; Westerhaus, M. Space-based observations of crustal deflections for drought characterization in Brazil. Sci. Total Environ. 2018, 644, 256–273. [Google Scholar] [CrossRef] [PubMed]
  22. Cochrane, M.A. Fire, land use, land cover dynamics, and climate change in the Brazilian Amazon. In Tropical Fire Ecology; Springer: Berlin/Heidelberg, Germany, 2009; pp. 389–426. [Google Scholar]
  23. Ometto, J.P.; Aguiar, A.P.D.; Martinelli, L.A. Amazon deforestation in Brazil: Effects, drivers and challenges. Carbon Manag. 2011, 2, 575–585. [Google Scholar] [CrossRef]
  24. Oyama, M.D.; Nobre, C.A. Climatic consequences of a large-scale desertification in northeast Brazil: A GCM simulation study. J. Clim. 2004, 17, 3203–3213. [Google Scholar] [CrossRef]
  25. De Barros Soares, D.; Lee, H.; Loikith, P.C.; Barkhordarian, A.; Mechoso, C.R. Can significant trends be detected in surface air temperature and precipitation over South America in recent decades? Int. J. Climatol. 2017, 37, 1483–1493. [Google Scholar] [CrossRef]
  26. Skansi, M.D.L.M.; Brunet, M.; Sigró, J.; Aguilar, E.; Groening, J.A.A.; Bentancur, O.J.; Geier, Y.R.C.; Amaya, R.L.C.; Jácome, H.; Ramos, A.M. Warming and wetting signals emerging from analysis of changes in climate extreme indices over South America. Glob. Planet. Change 2013, 100, 295–307. [Google Scholar] [CrossRef]
  27. Jiménez-Muñoz, J.C.; Sobrino, J.A.; Mattar, C.; Malhi, Y. Spatial and temporal patterns of the recent warming of the Amazon forest. J. Geophys. Res. Atmos. 2013, 118, 5204–5215. [Google Scholar] [CrossRef]
  28. Xie, F.; Fan, H. Deriving drought indices from MODIS vegetation indices (NDVI/EVI) and Land Surface Temperature (LST): Is data reconstruction necessary? Int. J. Appl. Earth Obs. Geoinf. 2021, 101, 102352. [Google Scholar] [CrossRef]
  29. Lian, X.; Zeng, Z.; Yao, Y.; Peng, S.; Wang, K.; Piao, S. Spatiotemporal variations in the difference between satellite-observed daily maximum land surface temperature and station-based daily maximum near-surface air temperature. J. Geophys. Res. Atmos. 2017, 122, 2254–2268. [Google Scholar] [CrossRef]
  30. Sheng, Y.; Liu, X.; Yang, X.; Xin, Q.; Deng, C.; Li, X. Quantifying the spatial and temporal relationship between air and land surface temperatures of different land-cover types in Southeastern China. Int. J. Remote Sens. 2017, 38, 1114–1136. [Google Scholar] [CrossRef]
  31. Shi, X.; Wang, G.; Chen, T.; Li, S.; Lu, J.; Hagan, D.F.T. Long-term changes in layered soil temperature based on ground measurements in Jiangsu Province, China. Int. J. Climatol. 2021, 41, 2996–3009. [Google Scholar] [CrossRef]
  32. Zhan, M.-j.; Xia, L.; Zhan, L.; Wang, Y. Recognition of changes in air and soil temperatures at a station typical of China’s subtropical monsoon region (1961–2018). Adv. Meteorol. 2019, 2019, 6927045. [Google Scholar] [CrossRef] [Green Version]
  33. Goldblatt, R.; Addas, A.; Crull, D.; Maghrabi, A.; Levin, G.G.; Rubinyi, S. Remotely sensed derived land surface temperature (LST) as a proxy for air temperature and thermal comfort at a small geographical scale. Land 2021, 10, 410. [Google Scholar] [CrossRef]
  34. Hill, D.J. Evaluation of the temporal relationship between daily min/max air and land surface temperature. Int. J. Remote Sens. 2013, 34, 9002–9015. [Google Scholar] [CrossRef]
  35. Zeng, L.; Wardlow, B.D.; Tadesse, T.; Shan, J.; Hayes, M.J.; Li, D.; Xiang, D. Estimation of daily air temperature based on MODIS land surface temperature products over the corn belt in the US. Remote Sens. 2015, 7, 951–970. [Google Scholar] [CrossRef]
  36. Niclòs Corts, R.; Valiente, J.A.; Barberà, M.J.; Caselles Miralles, V. Land surface air temperature retrieval from EOS-MODIS images. IEEE Geosci. Remote Sens. Lett. 2014, 11, 1380–1384. [Google Scholar] [CrossRef]
  37. Yan, H.; Zhang, J.; Hou, Y.; He, Y. Estimation of air temperature from MODIS data in east China. Int. J. Remote Sens. 2009, 30, 6261–6275. [Google Scholar] [CrossRef]
  38. Zhu, W.; Lű, A.; Jia, S. Estimation of daily maximum and minimum air temperature using MODIS land surface temperature products. Remote Sens. Environ. 2013, 130, 62–73. [Google Scholar] [CrossRef]
  39. Liu, W.; Chen, S.; Jiang, H.; Wang, C.; Li, D. Spatiotemporal Analysis of MODIS Land Surface Temperature With In Situ Meteorological Observation and ERA-Interim Reanalysis: The Option of Model Calibration. IEEE J. Sel. Top. Appl. Earth Obs. Remote Sens. 2017, 10, 1357–1371. [Google Scholar] [CrossRef]
  40. Mostovoy, G.V.; King, R.L.; Reddy, K.R.; Kakani, V.G.; Filippova, M.G. Statistical estimation of daily maximum and minimum air temperatures from MODIS LST data over the state of Mississippi. GIScience Remote Sens. 2006, 43, 78–110. [Google Scholar] [CrossRef]
  41. Mildrexler, D.J.; Zhao, M.; Running, S.W. A global comparison between station air temperatures and MODIS land surface temperatures reveals the cooling role of forests. J. Geophys. Res. Biogeosci. 2011, 116. [Google Scholar] [CrossRef]
  42. Gallo, K.; Hale, R.; Tarpley, D.; Yu, Y. Evaluation of the relationship between air and land surface temperature under clear-and cloudy-sky conditions. J. Appl. Meteorol. Climatol. 2011, 50, 767–775. [Google Scholar] [CrossRef]
  43. Good, E.J.; Ghent, D.J.; Bulgin, C.E.; Remedios, J.J. A spatiotemporal analysis of the relationship between near-surface air temperature and satellite land surface temperatures using 17 years of data from the ATSR series. J. Geophys. Res. Atmos. 2017, 122, 9185–9210. [Google Scholar] [CrossRef]
  44. Pielke Sr, R.A.; Davey, C.A.; Niyogi, D.; Fall, S.; Steinweg-Woods, J.; Hubbard, K.; Lin, X.; Cai, M.; Lim, Y.K.; Li, H. Unresolved issues with the assessment of multidecadal global land surface temperature trends. J. Geophys. Res. Atmos. 2007, 112, 1–26. [Google Scholar] [CrossRef]
  45. Wan, Z.; Zhang, Y.; Zhang, Q.; Li, Z.-L. Quality assessment and validation of the MODIS global land surface temperature. Int. J. Remote Sens. 2004, 25, 261–274. [Google Scholar] [CrossRef]
  46. Team, AIRS.; Teixeira, J. AIRS/Aqua L3 Monthly Standard Physical Retrieval (AIRS-only) 1 Degree x 1 Degree V006; Goddard Earth Sciences Data and Information Services Center (GES DISC): Greenbelt, MD, USA, 2013. [Google Scholar] [CrossRef]
  47. AIRS Project. Aqua/AIRS L3 Monthly Standard Physical Retrieval (AIRS-only) 1 Degree x 1 Degree V7.0; Goddard Earth Sciences Data and Information Services Center (GES DISC): Greenbelt, MD, USA, 2019. [Google Scholar] [CrossRef]
  48. Wan, Z.; Hook, S.; Hulley, G. MYD11C3 MODIS/Aqua Land Surface Temperature/Emissivity Monthly L3 Global 0.05Deg CMG V006; NASA EOSDIS Land Processes DAAC: Sioux Falls, SD, USA, 2015. [Google Scholar] [CrossRef]
  49. Barnes, W.L.; Pagano, T.S.; Salomonson, V.V. Prelaunch characteristics of the moderate resolution imaging spectroradiometer (MODIS) on EOS-AM1. IEEE Trans. Geosci. Remote Sens. 1998, 36, 1088–1100. [Google Scholar] [CrossRef]
  50. Wan, Z.; Li, Z.-L. A physics-based algorithm for retrieving land-surface emissivity and temperature from EOS/MODIS data. IEEE Trans. Geosci. Remote Sens. 1997, 35, 980–996. [Google Scholar]
  51. Wan, Z.; Zhang, Y.; Zhang, Q.; Li, Z.-l. Validation of the land-surface temperature products retrieved from Terra Moderate Resolution Imaging Spectroradiometer data. Remote Sens. Environ. 2002, 83, 163–180. [Google Scholar] [CrossRef]
  52. Aumann, H.H.; Chahine, M.T.; Gautier, C.; Goldberg, M.D.; Kalnay, E.; McMillin, L.M.; Revercomb, H.; Rosenkranz, P.W.; Smith, W.L.; Staelin, D.H. AIRS/AMSU/HSB on the Aqua mission: Design, science objectives, data products, and processing systems. IEEE Trans. Geosci. Remote Sens. 2003, 41, 253–264. [Google Scholar] [CrossRef]
  53. Susskind, J.; Blaisdell, J.M.; Iredell, L. Improved methodology for surface and atmospheric soundings, error estimates, and quality control procedures: The atmospheric infrared sounder science team version-6 retrieval algorithm. J. Appl. Remote Sens. 2014, 8, 084994. [Google Scholar] [CrossRef]
  54. Hulley, G.C.; Hook, S.J. A radiance-based method for estimating uncertainties in the Atmospheric Infrared Sounder (AIRS) land surface temperature product. J. Geophys. Res. Atmos. 2012, 117. [Google Scholar] [CrossRef]
  55. Olsen, E.T.; Friedman, S.; Fishbein, E.; Granger, S.; Hearty, T.; Irion, F.; Lee, S.; Licata, S.; Manning, E. AIRS/AMSU/HSB Version 6 Changes from Version 5; Jet Propulsion Laboratory, California Institute of Technology: Pasadena, CA, USA, 2013. [Google Scholar]
  56. Ding, F.; Savtchenko, A.; Hearty, T.; Wei, J.; Theobald, M.; Vollmer, B.; Tian, B.; Fetzer, E. Assessing the impacts of two averaging methods on AIRS Level 3 monthly products and multiyear monthly means. J. Atmos. Ocean. Technol. 2020, 37, 1027–1050. [Google Scholar] [CrossRef]
  57. Moura, A.D.; Fortes, L.T.G. The Brazilian National Institute of Meteorology (INMET) and its contributions to agrometeorology. Agrometeoros Pass Fundo. 2016, 24, 15–27. [Google Scholar] [CrossRef]
  58. Friedl, M.; Sulla-Menashe, D. MCD12C1 MODIS/Terra+ Aqua Land Cover Type Yearly L3 Global 0.05 Deg CMG V006; NASA EOSDIS Land Processes DAAC: Sioux Falls, SD, USA, 2015. [Google Scholar] [CrossRef]
  59. Dimiceli, C.; Carroll, M.; Sohlberg, R.; Kim, D.; Kelly, M.; Townshend, J. MOD44B MODIS/Terra Vegetation Continuous Fields Yearly L3 Global 250m SIN Grid V006; NASA EOSDIS Land Processes DAAC: Sioux Falls, SD, USA, 2015. [Google Scholar]
  60. MERRA, G. Tavg1_2d_flx_Nx: 2d, 1-Hourly, Time-Averaged, Single-Level, Assimilation, Surface Flux Diagnostics V5. 12.4; GES DISC: Greenbelt, MD, USA, 2015. [Google Scholar]
  61. Susskind, J.; Lee, J.N.; Iredell, L. Spatial Correlations of Anomaly Time Series of AIRS Version-6 Land Surface Skin Temperatures with the Niño-4 Index. In Proceedings of the AGU Fall Meeting 2013, San Francisco, CA, USA, 9–13 December 2013. [Google Scholar]
  62. Yue, S.; Wang, C. The Mann-Kendall test modified by effective sample size to detect trend in serially correlated hydrological series. Water Resour. Manag. 2004, 18, 201–218. [Google Scholar] [CrossRef]
  63. Jimenez, J.C.; Libonati, R.; Peres, L.F. Droughts over Amazonia in 2005, 2010, and 2015: A cloud cover perspective. Front. Earth Sci. 2018, 6, 227. [Google Scholar] [CrossRef]
  64. Xu, L.; Samanta, A.; Costa, M.H.; Ganguly, S.; Nemani, R.R.; Myneni, R.B. Widespread decline in greenness of Amazonian vegetation due to the 2010 drought. Geophys. Res. Lett. 2011, 38. [Google Scholar] [CrossRef]
  65. Li, Y.; Zhao, M.; Motesharrei, S.; Mu, Q.; Kalnay, E.; Li, S. Local cooling and warming effects of forests based on satellite observations. Nat. Commun. 2015, 6, 1–8. [Google Scholar] [CrossRef]
  66. Peng, S.-S.; Piao, S.; Zeng, Z.; Ciais, P.; Zhou, L.; Li, L.Z.; Myneni, R.B.; Yin, Y.; Zeng, H. Afforestation in China cools local land surface temperature. Proc. Natl. Acad. Sci. USA 2014, 111, 2915–2919. [Google Scholar] [CrossRef]
  67. Shen, S.; Leptoukh, G.G. Estimation of surface air temperature over central and eastern Eurasia from MODIS land surface temperature. Environ. Res. Lett. 2011, 6, 045206. [Google Scholar] [CrossRef]
  68. Hall, F.G.; Huemmrich, K.F.; Goetz, S.J.; Sellers, P.J.; Nickeson, J.E. Satellite remote sensing of surface energy balance: Success, failures, and unresolved issues in FIFE. J. Geophys. Res. Atmos. 1992, 97, 19061–19089. [Google Scholar] [CrossRef]
  69. Holmes, T.; De Jeu, R.; Owe, M.; Dolman, A. Land surface temperature from Ka band (37 GHz) passive microwave observations. J. Geophys. Res. Atmos. 2009, 114. [Google Scholar] [CrossRef]
  70. Prigent, C.; Aires, F.; Rossow, W.B. Land surface skin temperatures from a combined analysis of microwave and infrared satellite observations for an all-weather evaluation of the differences between air and skin temperatures. J. Geophys. Res. Atmos. 2003, 108. [Google Scholar] [CrossRef]
  71. Penman, H.L. Natural evaporation from open water, bare soil and grass. Proc. R. Soc. London. Ser. A. Math. Phys. Sci. 1948, 193, 120–145. [Google Scholar]
  72. Gerken, T.; Ruddell, B.L.; Fuentes, J.D.; Araújo, A.; Brunsell, N.A.; Maia, J.; Manzi, A.; Mercer, J.; dos Santos, R.N.; Von Randow, C. Investigating the mechanisms responsible for the lack of surface energy balance closure in a central Amazonian tropical rainforest. Agric. For. Meteorol. 2018, 255, 92–103. [Google Scholar] [CrossRef]
  73. Jackson, R.B.; Randerson, J.T.; Canadell, J.G.; Anderson, R.G.; Avissar, R.; Baldocchi, D.D.; Bonan, G.B.; Caldeira, K.; Diffenbaugh, N.S.; Field, C.B. Protecting climate with forests. Environ. Res. Lett. 2008, 3, 044006. [Google Scholar] [CrossRef]
  74. Koren, I.; Remer, L.A.; Longo, K. Reversal of trend of biomass burning in the Amazon. Geophys. Res. Lett. 2007, 34. [Google Scholar] [CrossRef]
  75. Lee, Y.-R.; Yoo, J.-M.; Jeong, M.-J.; Won, Y.-I.; Hearty, T.; Shin, D.-B. Comparison between MODIS and AIRS/AMSU satellite-derived surface skin temperatures. Atmos. Meas. Tech. 2013, 6, 445–455. [Google Scholar] [CrossRef]
  76. Susskind, J.; Blaisdell, J.; Iredell, L. Improved determination of surface and atmospheric temperatures using only shortwave AIRS channels: The AIRS version-6 retrieval algorithm. In Proceedings of the 2010 IEEE International Geoscience and Remote Sensing Symposium, Honolulu, HI, USA, 25–30 July 2010; pp. 2948–2951. [Google Scholar]
  77. Sobrino, J.A.; Julien, Y.; García-Monteiro, S. Surface temperature of the planet earth from satellite data. Remote Sens. 2020, 12, 218. [Google Scholar] [CrossRef]
  78. Susskind, J.; Schmidt, G.; Lee, J.; Iredell, L. Recent global warming as confirmed by AIRS. Environ. Res. Lett. 2019, 14, 044030. [Google Scholar] [CrossRef]
  79. Chen, C.; Park, T.; Wang, X.; Piao, S.; Xu, B.; Chaturvedi, R.K.; Fuchs, R.; Brovkin, V.; Ciais, P.; Fensholt, R. China and India lead in greening of the world through land-use management. Nat. Sustain. 2019, 2, 122–129. [Google Scholar] [CrossRef]
  80. Tomasella, J.; Vieira, R.M.S.P.; Barbosa, A.A.; Rodriguez, D.A.; de Oliveira Santana, M.; Sestini, M.F. Desertification trends in the Northeast of Brazil over the period 2000–2016. Int. J. Appl. Earth Obs. Geoinf. 2018, 73, 197–206. [Google Scholar] [CrossRef]
  81. Li, Y.; Zhao, M.; Mildrexler, D.J.; Motesharrei, S.; Mu, Q.; Kalnay, E.; Zhao, F.; Li, S.; Wang, K. Potential and actual impacts of deforestation and afforestation on land surface temperature. J. Geophys. Res. Atmos. 2016, 121, 14–372. [Google Scholar] [CrossRef]
  82. Carvalho, L.M. Assessing precipitation trends in the Americas with historical data: A review. Wiley Interdiscip. Rev. Clim. Change 2020, 11, e627. [Google Scholar] [CrossRef]
  83. Montini, T.L.; Jones, C.; Carvalho, L.M. The South American low-level jet: A new climatology, variability, and changes. J. Geophys. Res. Atmos. 2019, 124, 1200–1218. [Google Scholar] [CrossRef]
  84. Jiménez-Muñoz, J.C.; Mattar, C.; Sobrino, J.A.; Malhi, Y. A database for the monitoring of thermal anomalies over the Amazon forest and adjacent intertropical oceans. Sci. Data 2015, 2, 1–9. [Google Scholar] [CrossRef]
  85. Liu, Y.Y.; van Dijk, A.I.; Miralles, D.G.; McCabe, M.F.; Evans, J.P.; de Jeu, R.A.; Gentine, P.; Huete, A.; Parinussa, R.M.; Wang, L. Enhanced canopy growth precedes senescence in 2005 and 2010 Amazonian droughts. Remote Sens. Environ. 2018, 211, 26–37. [Google Scholar] [CrossRef]
  86. Jiménez-Muñoz, J.C.; Mattar, C.; Barichivich, J.; Santamaría-Artigas, A.; Takahashi, K.; Malhi, Y.; Sobrino, J.A.; Schrier, G.v.d. Record-breaking warming and extreme drought in the Amazon rainforest during the course of El Niño 2015–2016. Sci. Rep. 2016, 6, 1–7. [Google Scholar] [CrossRef]
  87. Jimenez, J.C.; Barichivich, J.; Mattar, C.; Takahashi, K.; Santamaría-Artigas, A.; Sobrino, J.A.; Malhi, Y. Spatio-temporal patterns of thermal anomalies and drought over tropical forests driven by recent extreme climatic anomalies. Philos. Trans. R. Soc. B Biol. Sci. 2018, 373, 20170300. [Google Scholar] [CrossRef]
  88. Panisset, J.S.; Libonati, R.; Gouveia, C.M.P.; Machado-Silva, F.; França, D.A.; França, J.R.A.; Peres, L.F. Contrasting patterns of the extreme drought episodes of 2005, 2010 and 2015 in the Amazon Basin. Int. J. Climatol. 2018, 38, 1096–1104. [Google Scholar] [CrossRef]
  89. Ribeiro, I.O.; Andreoli, R.V.; Kayano, M.T.; Sousa, T.R.; Medeiros, A.; Godoi, R.H.M.; Godoi, A.F.L.; Junior, S.D.; Martin, S.T.; Souza, R.A.F.d. Biomass burning and carbon monoxide patterns in Brazil during the extreme drought years of 2005, 2010, and 2015. Environ. Pollut. 2018, 243, 1008–1014. [Google Scholar] [CrossRef]
  90. Bevan, S.L.; North, P.R.; Grey, W.M.; Los, S.O.; Plummer, S.E. Impact of atmospheric aerosol from biomass burning on Amazon dry-season drought. J. Geophys. Res. Atmos. 2009, 114. [Google Scholar] [CrossRef]
  91. Anderson, L.O.; Ribeiro Neto, G.; Cunha, A.P.; Fonseca, M.G.; Mendes de Moura, Y.; Dalagnol, R.; Wagner, F.H.; de Aragão, L.E.O.e.C. Vulnerability of Amazonian forests to repeated droughts. Philos. Trans. R. Soc. B Biol. Sci. 2018, 373, 20170411. [Google Scholar] [CrossRef] [PubMed]
  92. Cunha, A.P.M.; Zeri, M.; Deusdará Leal, K.; Costa, L.; Cuartas, L.A.; Marengo, J.A.; Tomasella, J.; Vieira, R.M.; Barbosa, A.A.; Cunningham, C. Extreme drought events over Brazil from 2011 to 2019. Atmosphere 2019, 10, 642. [Google Scholar] [CrossRef]
  93. Marengo, J.A.; Souza, C.M., Jr.; Thonicke, K.; Burton, C.; Halladay, K.; Betts, R.A.; Alves, L.M.; Soares, W.R. Changes in climate and land use over the Amazon region: Current and future variability and trends. Front. Earth Sci. 2018, 6, 228. [Google Scholar] [CrossRef]
Figure 1. Spatial distribution of (a) land cover types in Brazil and locations of stations and (b) tree cover (%).
Remotesensing 14 04420 g001
Figure 2. Spatial distribution of annual average temperature during 2003–2016 for (a) station Ta, (b) AIRS V6, (c) AIRS V7, (d) MODIS 1°, and (e) MODIS 0.05°. Scatter plots of annual average Ts from (f) AIRS V6, (g) AIRS V7, (h) MODIS 1°, and (i) MODIS 0.05° against station Ta, respectively.
Remotesensing 14 04420 g002
Figure 3. Relationship between Ta of each station and Ts in the corresponding grid cell from (top row, (a1a3)) AIRS V6, (second row, (b1b3)) AIRS V7, (third row, (c1c3)) MODIS 1°, and (bottom row, (d1d3)) MODIS 0.05°. Three metrics are used here, including (left column) Pearson’s correlation coefficient (R), (middle column) root mean square deviation (RMSD), and (right column) bias (i.e., Ts minus Ta).
Remotesensing 14 04420 g003
Figure 4. Comparison of R, RMSD, and Bias values, shown in Figure 3, over the grid cells with tree cover (top panels) higher than 50% and (bottom panels) lower than 50%. The corresponding statistics are from (a1a6) AIRS V6, (b1b6) AIRS V7, (c1c6) MODIS 1°, and (d1d6) MODIS 0.05°.
Remotesensing 14 04420 g004
Figure 5. Spatial patterns of trends in annual temperature during 2003–2016 for (a) station Ta, (b) AIRS V6 Ts, (c) AIRS V7 Ts, (d) MODIS 1° Ts, and (e) MODIS 0.05° Ts, respectively. Hatched areas represent statistically significant trends (p < 0.05). Scatter plots of trends in Ts from (f) AIRS V6, (g) AIRS V7 and (h) MODIS 1°, and (i) MODIS 0.05° against station Ta, respectively.
Remotesensing 14 04420 g005
Figure 6. Spatial patterns of standardized anomalies in (a1a3) station Ta, (b1b3) AIRS V6 Ts, (c1c3) AIRS V7 Ts, (d1d3) MODIS 1° Ts, and (e1e3) MODIS 0.05° Ts for drought events during July-August in 2005, 2010, and 2015, respectively. Scatter plots of standardized anomaly in Ts from (f) AIRS V6, (g) AIRS V7, (h) MODIS 1°, and (i) MODIS 0.05° against station Ta, respectively. Different years are labelled by different colors, while R, RMSD, and bias are calculated based on all dots from these three years.
Remotesensing 14 04420 g006
Figure 7. Relation between Ts−Ta and multi-year average sensible heat fluxes for 2003–2006. The four subfigures are based on (a) AIRS V6 Ts, (b) AIRS V7 Ts, (c) MODIS 1° Ts, and (d) MODIS 0.05° Ts, respectively. Each point represents the difference between Ts−Ta and the sensible heat flux value of the corresponding grid cell. The color of each point corresponds to the tree cover (%) of that grid cell (see Figure 1b). The black line shows the linear fitting relationship of the scattered points.
Remotesensing 14 04420 g007
Figure 8. Spatial distribution of annual average cloud fraction during 2003–2016.
Remotesensing 14 04420 g008
Table 1. Major characteristics of gridded datasets used herein.
VariableSourcesOriginal Spatial and Temporal
Resolution
Download Links
Temperature data
Land Surface Temperature
(Ts)
AIRS/
Aqua
1°/
monthly
https://acdisc.gesdisc.eosdis.nasa.gov/data/Aqua_AIRS_Level3/AIRS3STM.006/ (accessed on 16 January 2020)
(“SurfSkinTemp_A”)
“A” representing ascending overpasses with equatorial crossing time 1:30 PM
Land Surface Temperature
(Ts)
AIRS/
Aqua
1°/
monthly
https://acdisc.gesdisc.eosdis.nasa.gov/data/Aqua_AIRS_Level3/AIRS3STM.7.0/ (“SurfSkinTemp_A”) (accessed on 16 January 2020)
Land Surface Temperature
(Ts)
MODIS/
Aqua
0.05°/
monthly
https://ladsweb.modaps.eosdis.nasa.gov/search/order/1/MYD11C3--6
(“LST_Day_CMG”) (accessed on 16 January 2020)
“Day” representing ascending overpasses with equatorial crossing time 1:30 PM
Non-temperature data
Land coverMODIS/
Aqua and Terra
0.05°/
yearly
https://ladsweb.modaps.eosdis.nasa.gov/search/order/1/MCD12C1--6
(year of data: 2009; Majority_Land_Cover_Type_1 representing International Geosphere-Biosphere Programme (IGBP) classification)
(accessed on 10 May 2020)
Vegetation Continuous Fields (VCF)MODIS/
Terra
250 m/
yearly
https://ladsweb.modaps.eosdis.nasa.gov/search/order/1/MOD44B--6
(“Percent_Tree_Cover”) (accessed on 20 January 2020)
Sensible heat fluxNASA atmospheric reanalysis0.625° × 0.5°/
hourly
https://disc.gsfc.nasa.gov/datasets/M2T1NXFLX_5.12.4/summary?keywords=merra2 (accessed on 1 September 2020)
Cloud fraction (CF)AIRS/
Aqua
1°/
monthly
https://acdisc.gesdisc.eosdis.nasa.gov/data/Aqua_AIRS_Level3/AIRS3STM.006/ (accessed on 16 January 2020)
(CloudFrc_A)
“A” representing ascending overpasses with equatorial crossing time 1:30 PM
Publisher’s Note: MDPI stays neutral with regard to jurisdictional claims in published maps and institutional affiliations.

