
PS-InSAR Based Monitoring of Land Subsidence by Groundwater Extraction for Lahore Metropolitan City, Pakistan

 , ,
, ,
Abstract
:1. Introduction
2. Materials and Methods
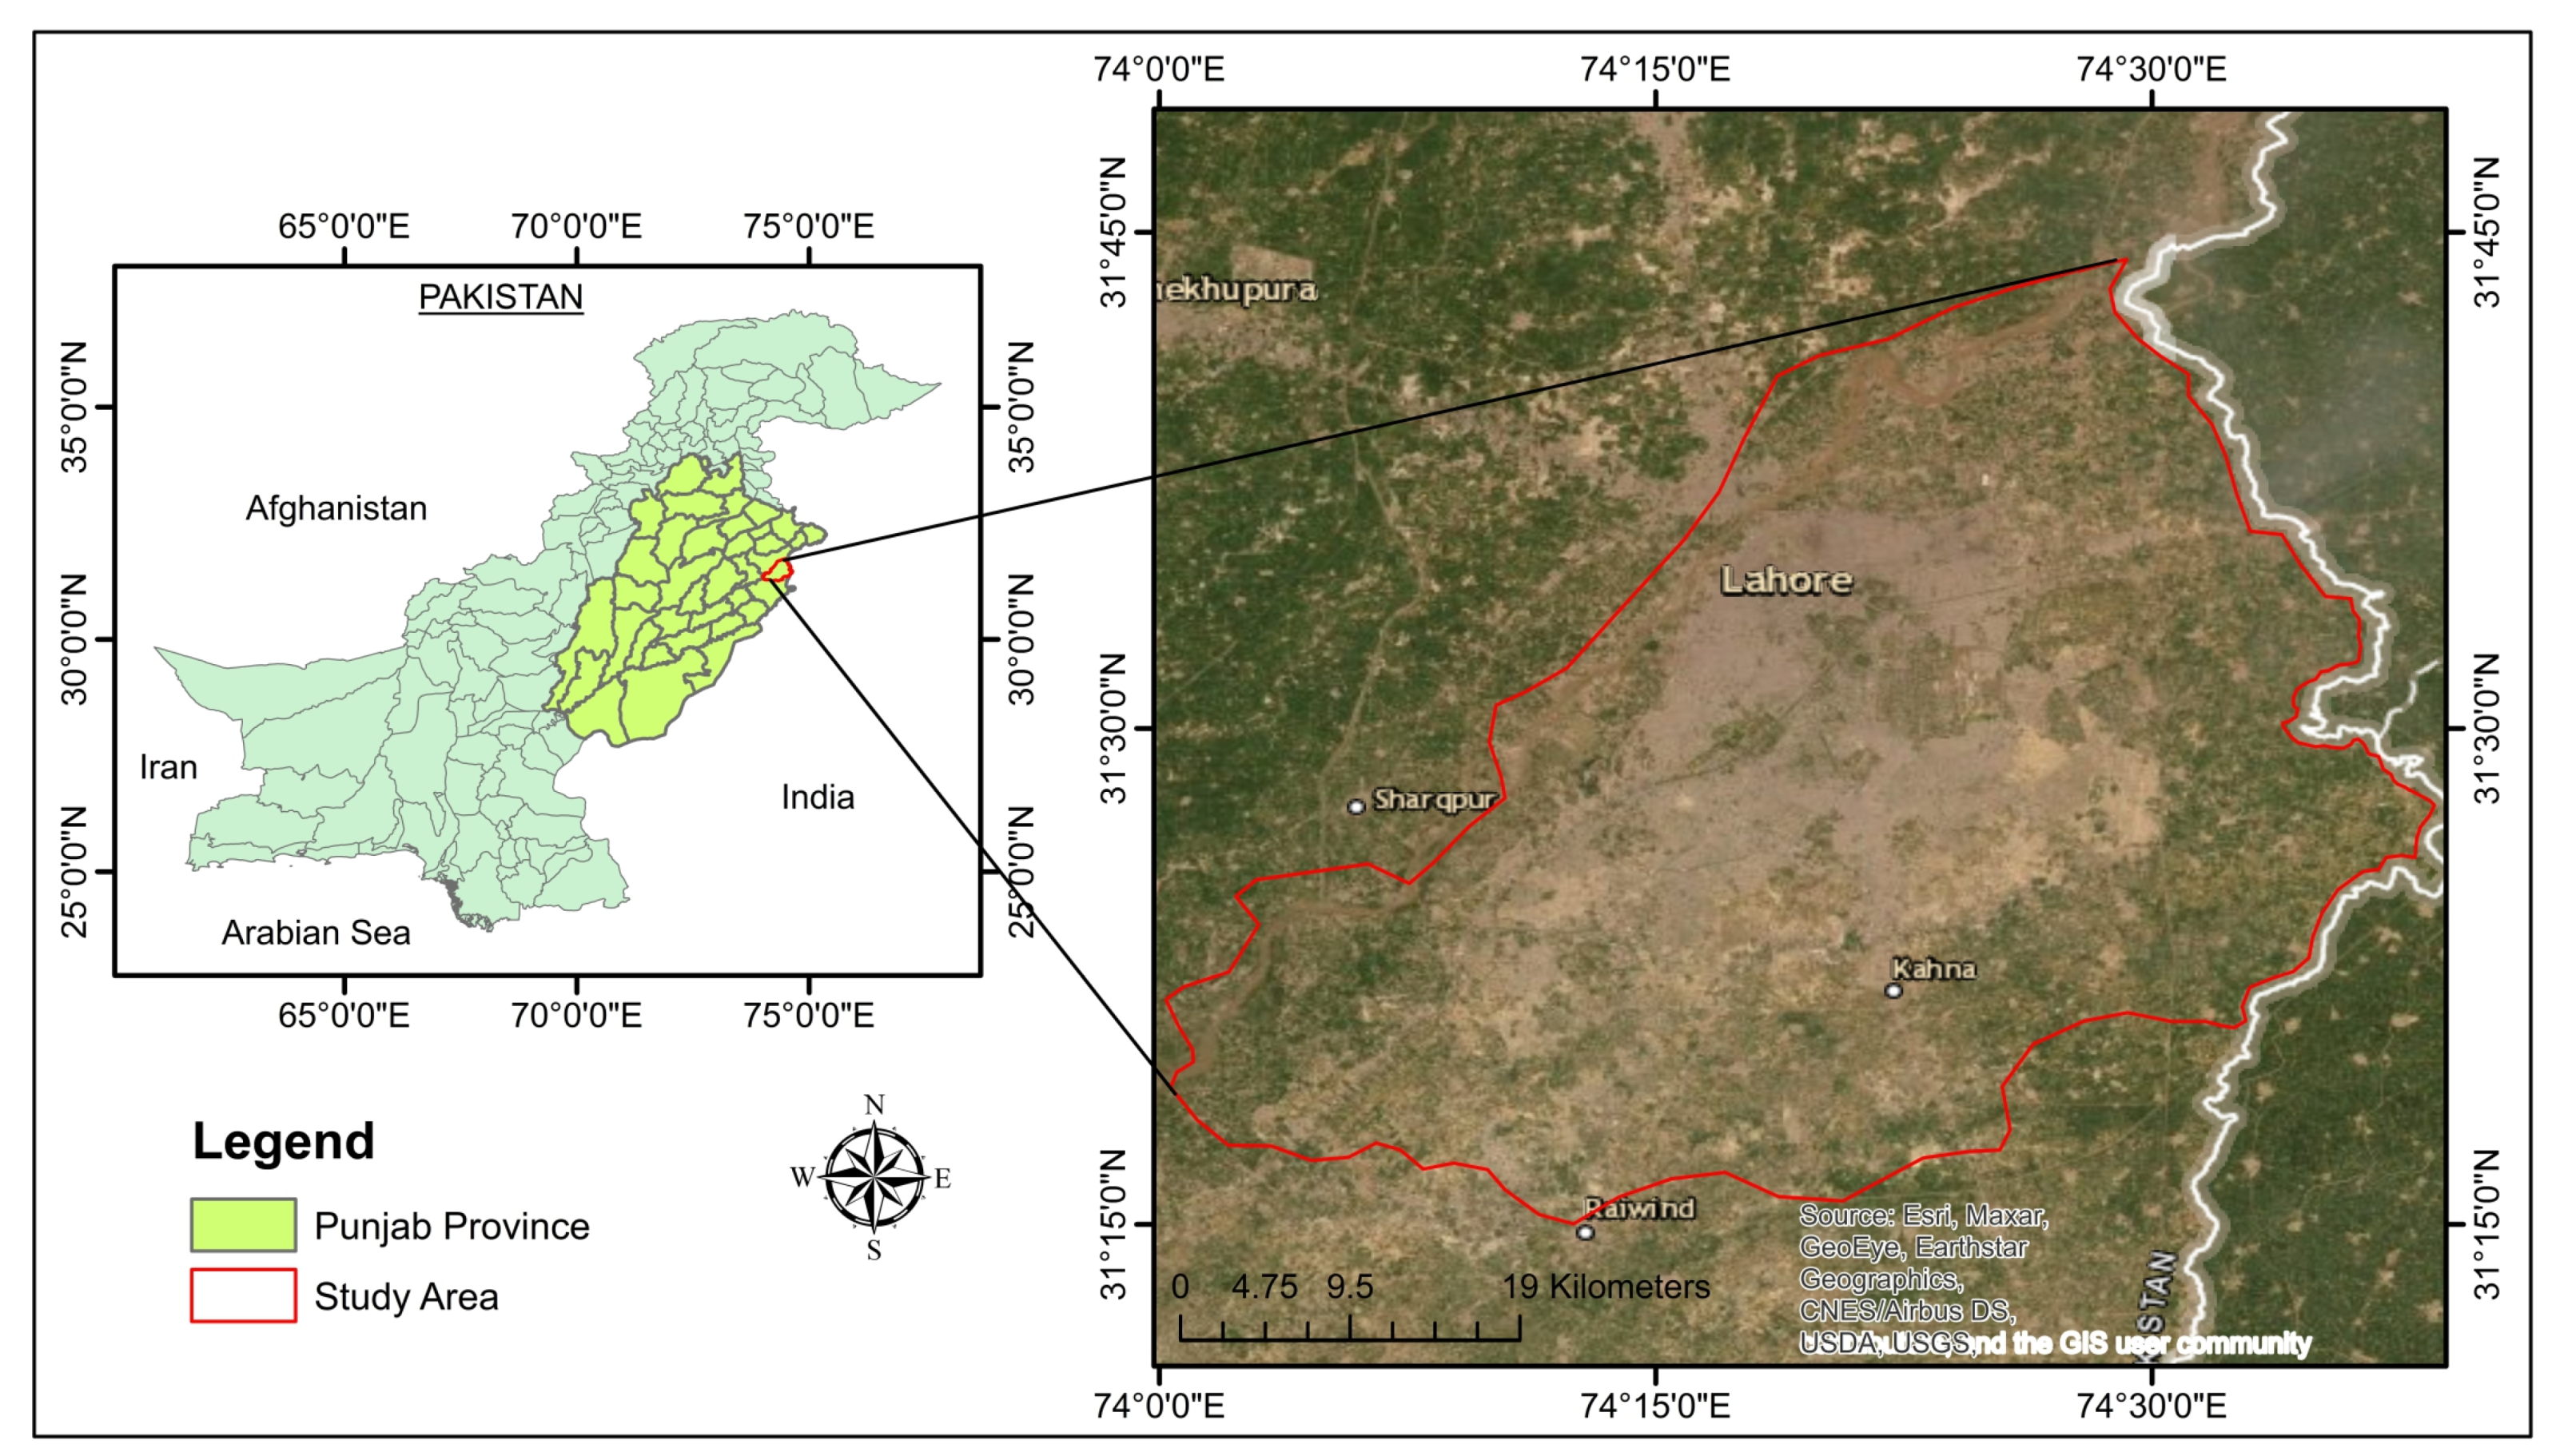
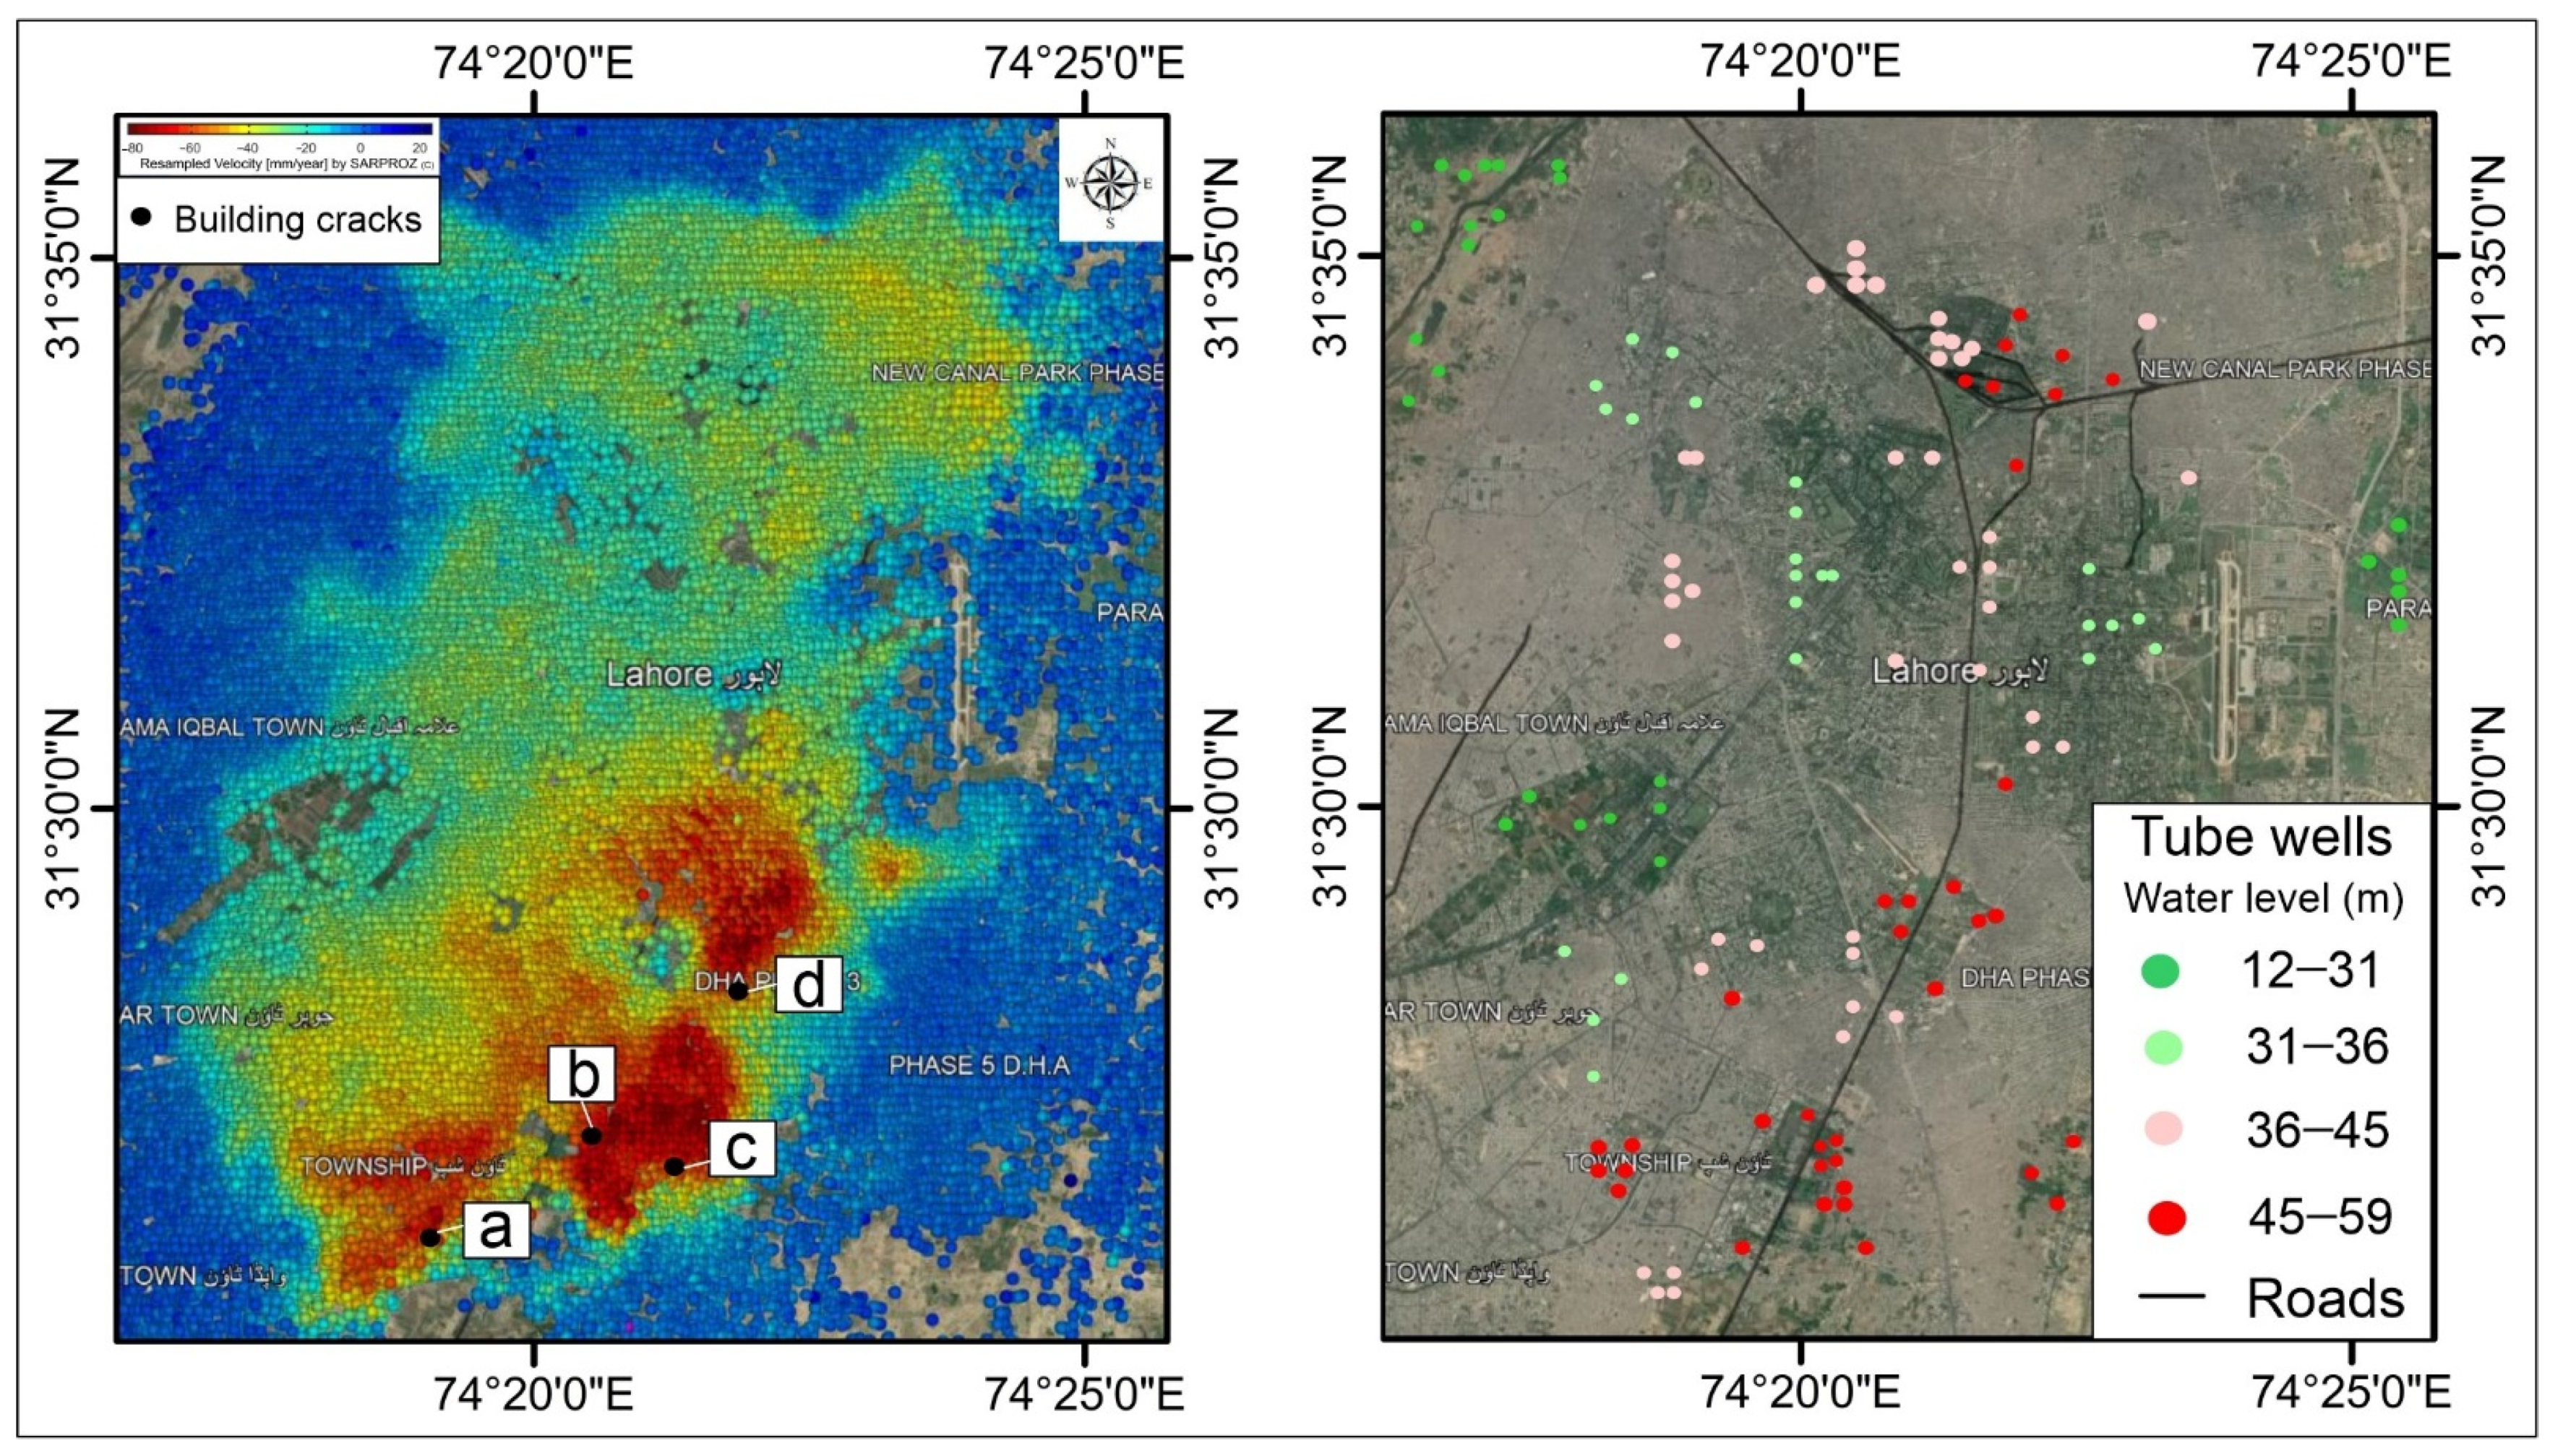
2.1. Study Area
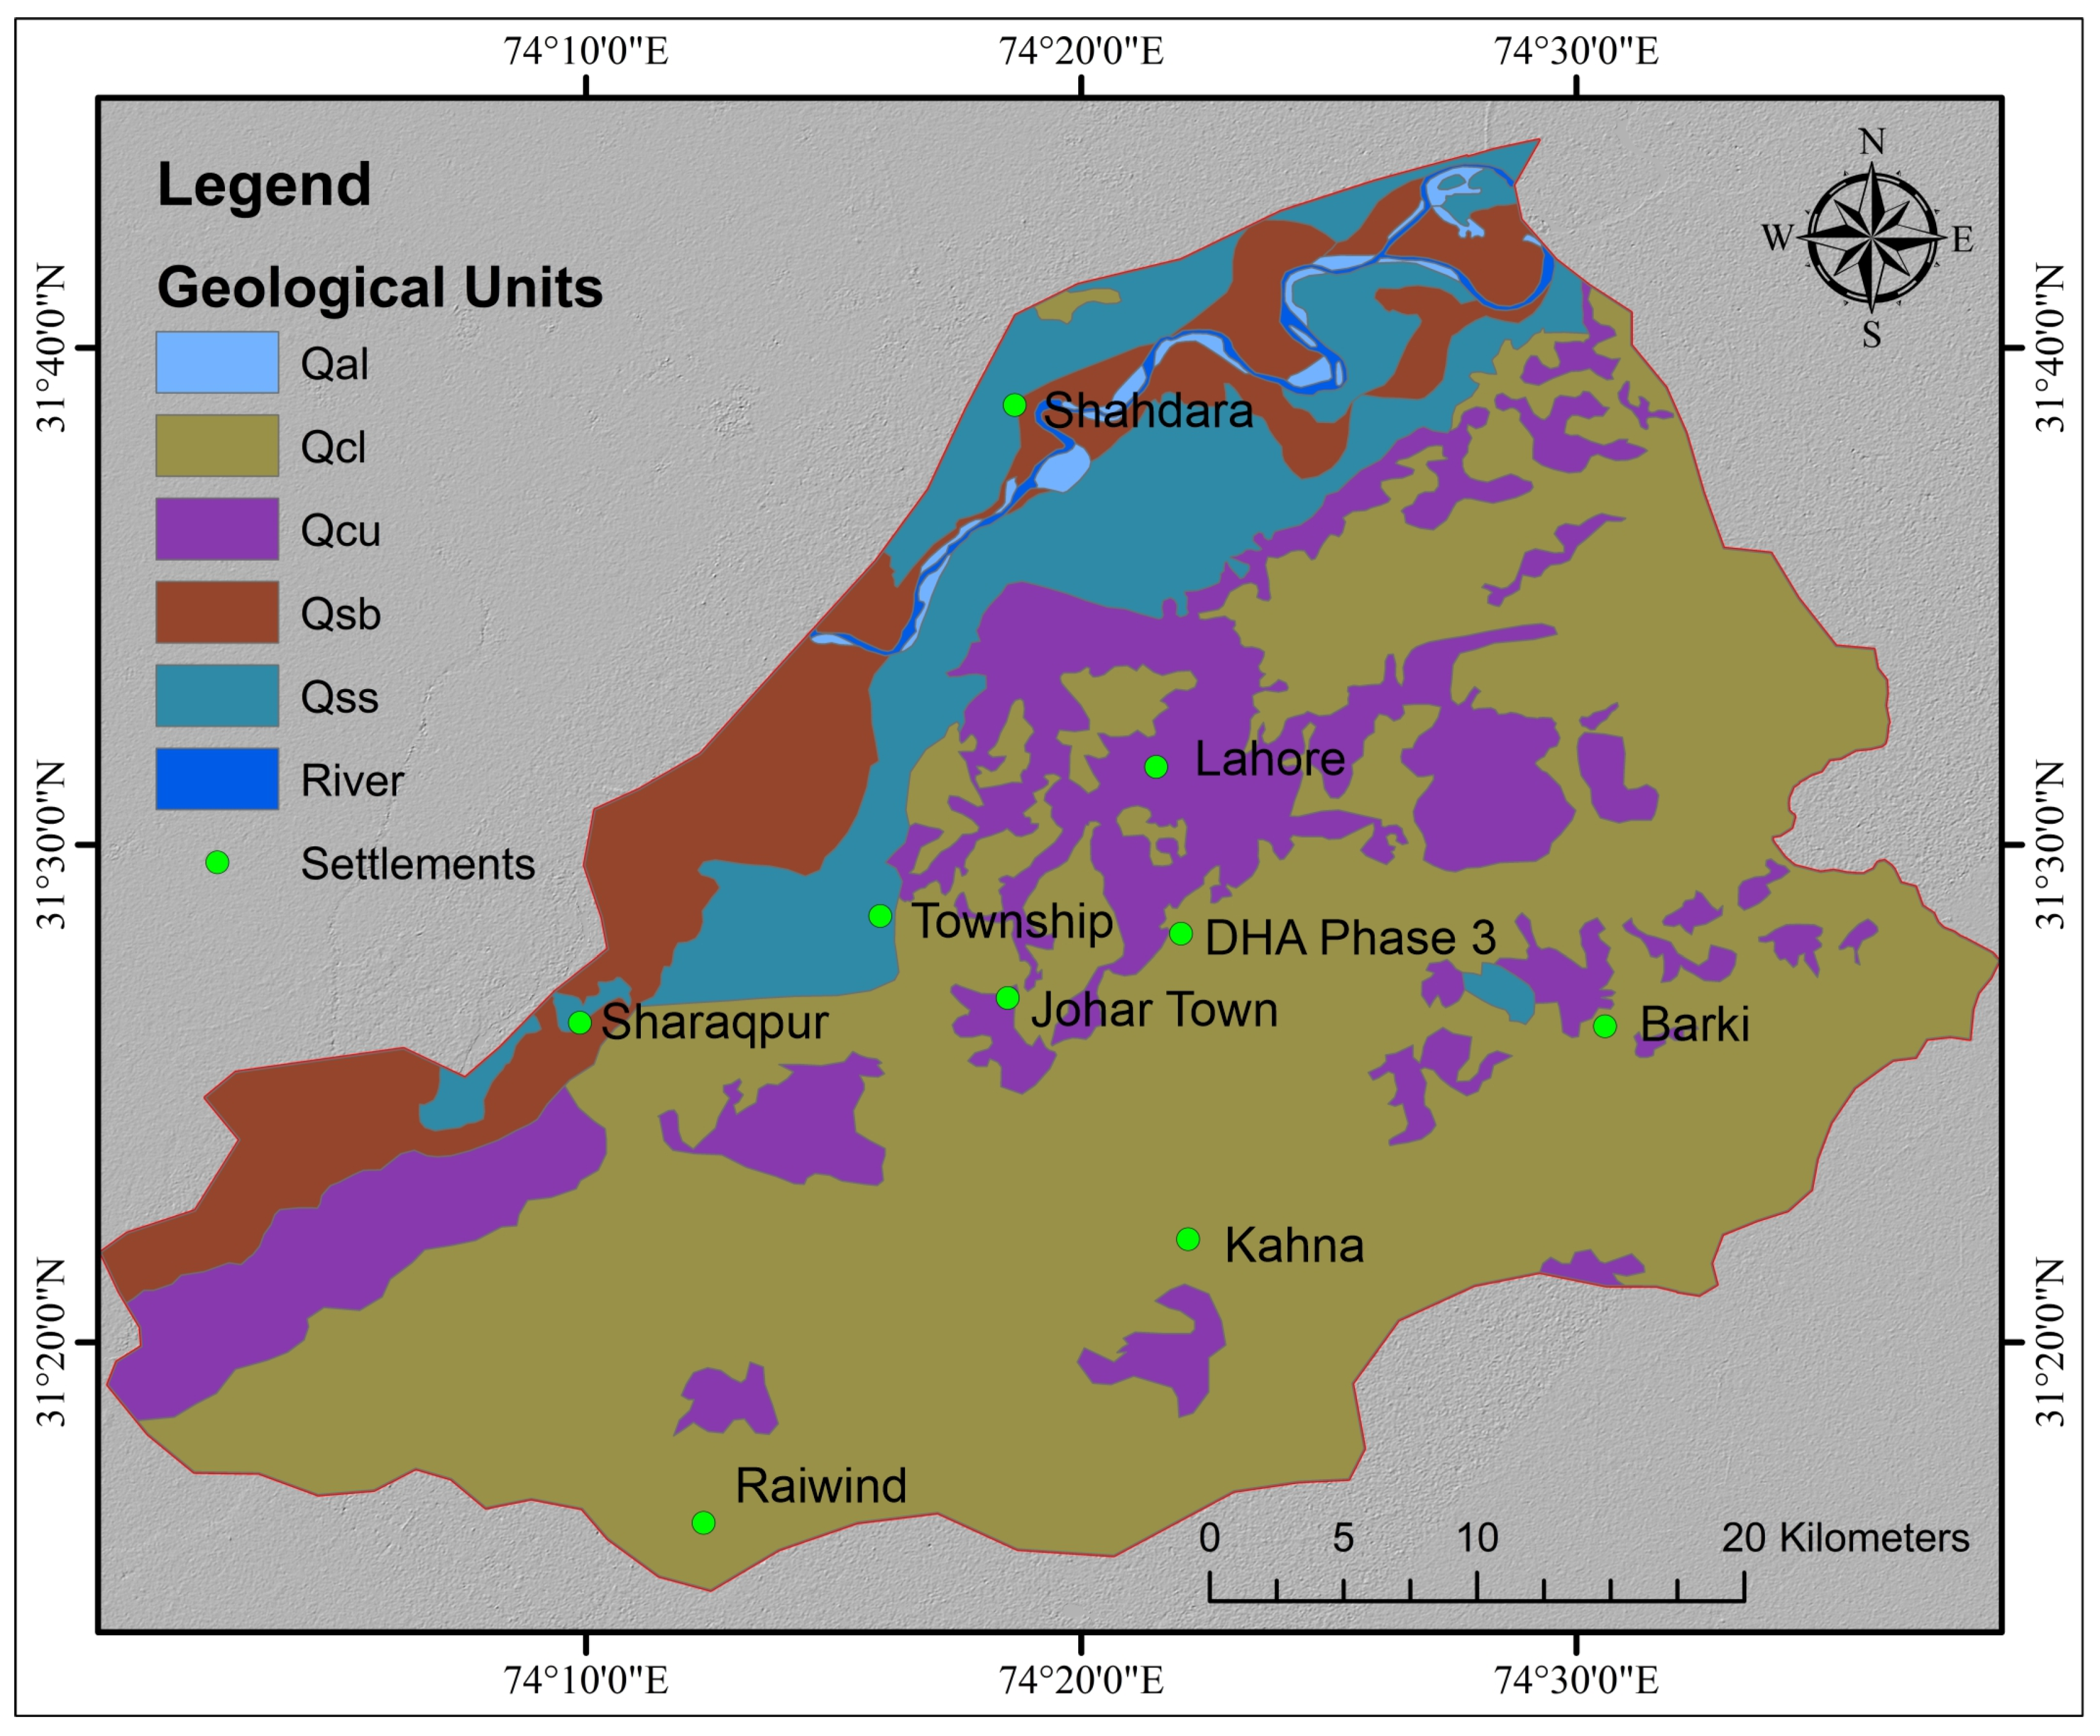
2.2. Geology of the Area
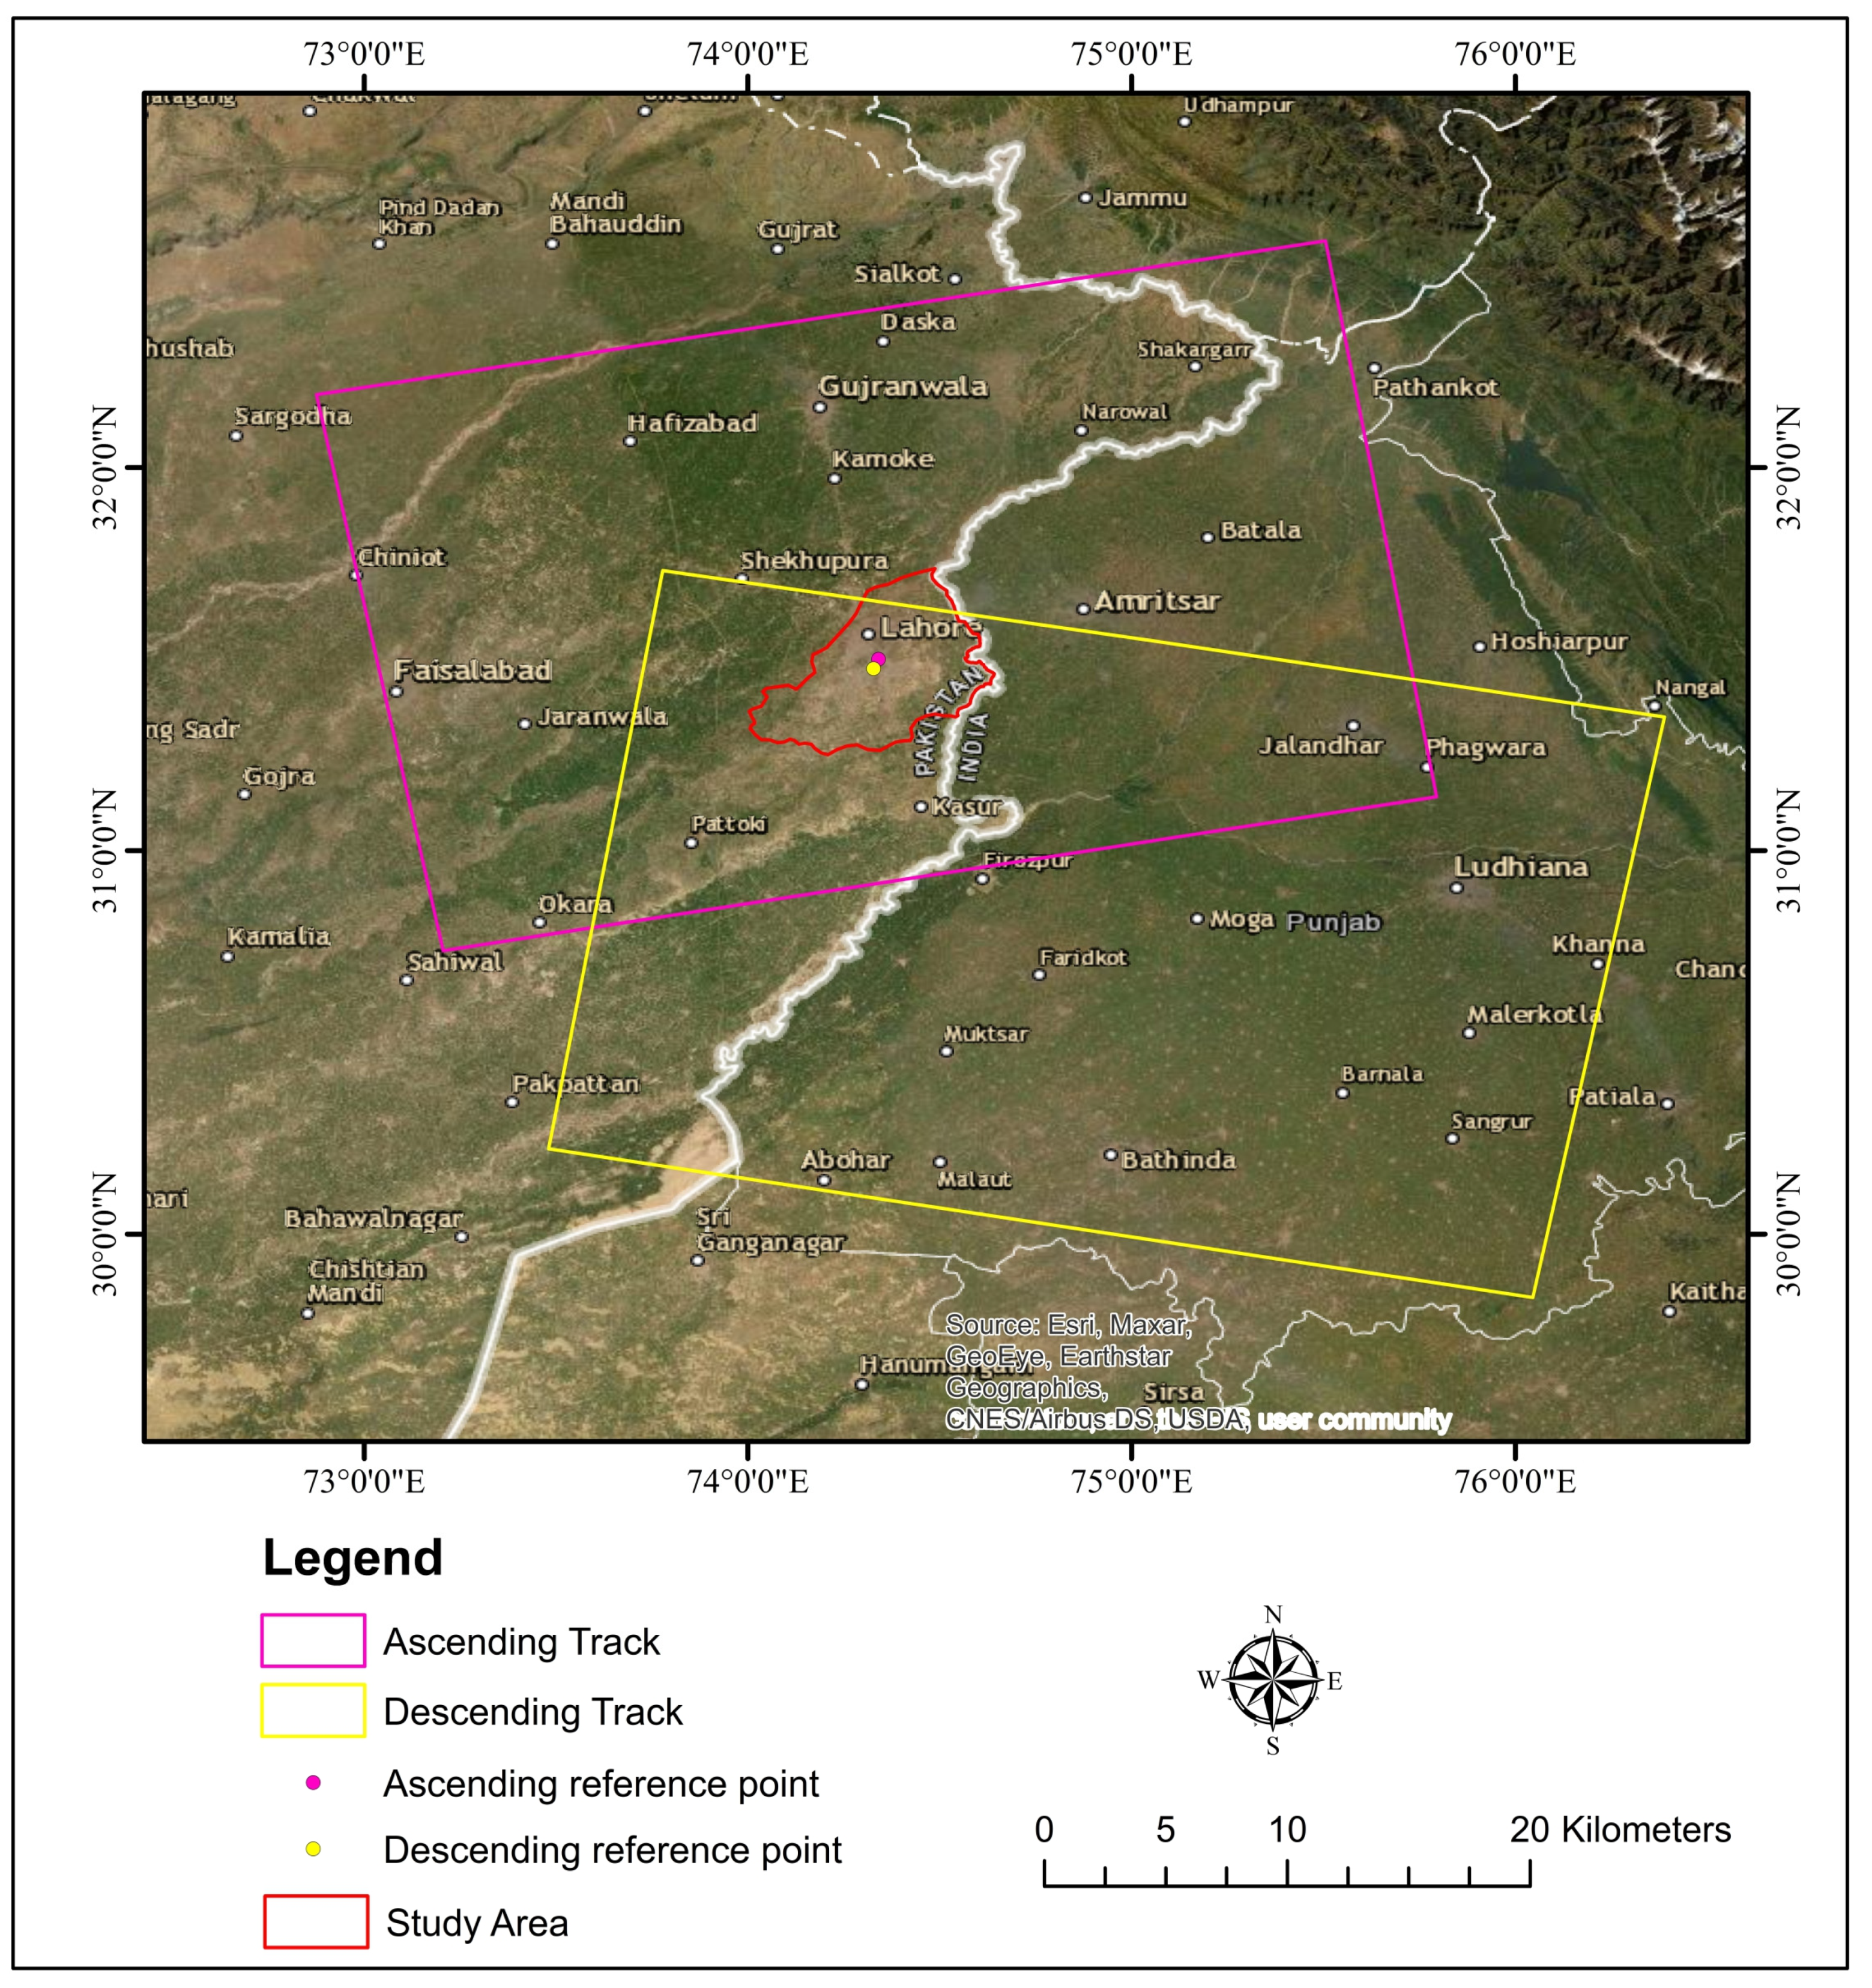
2.3. Dataset
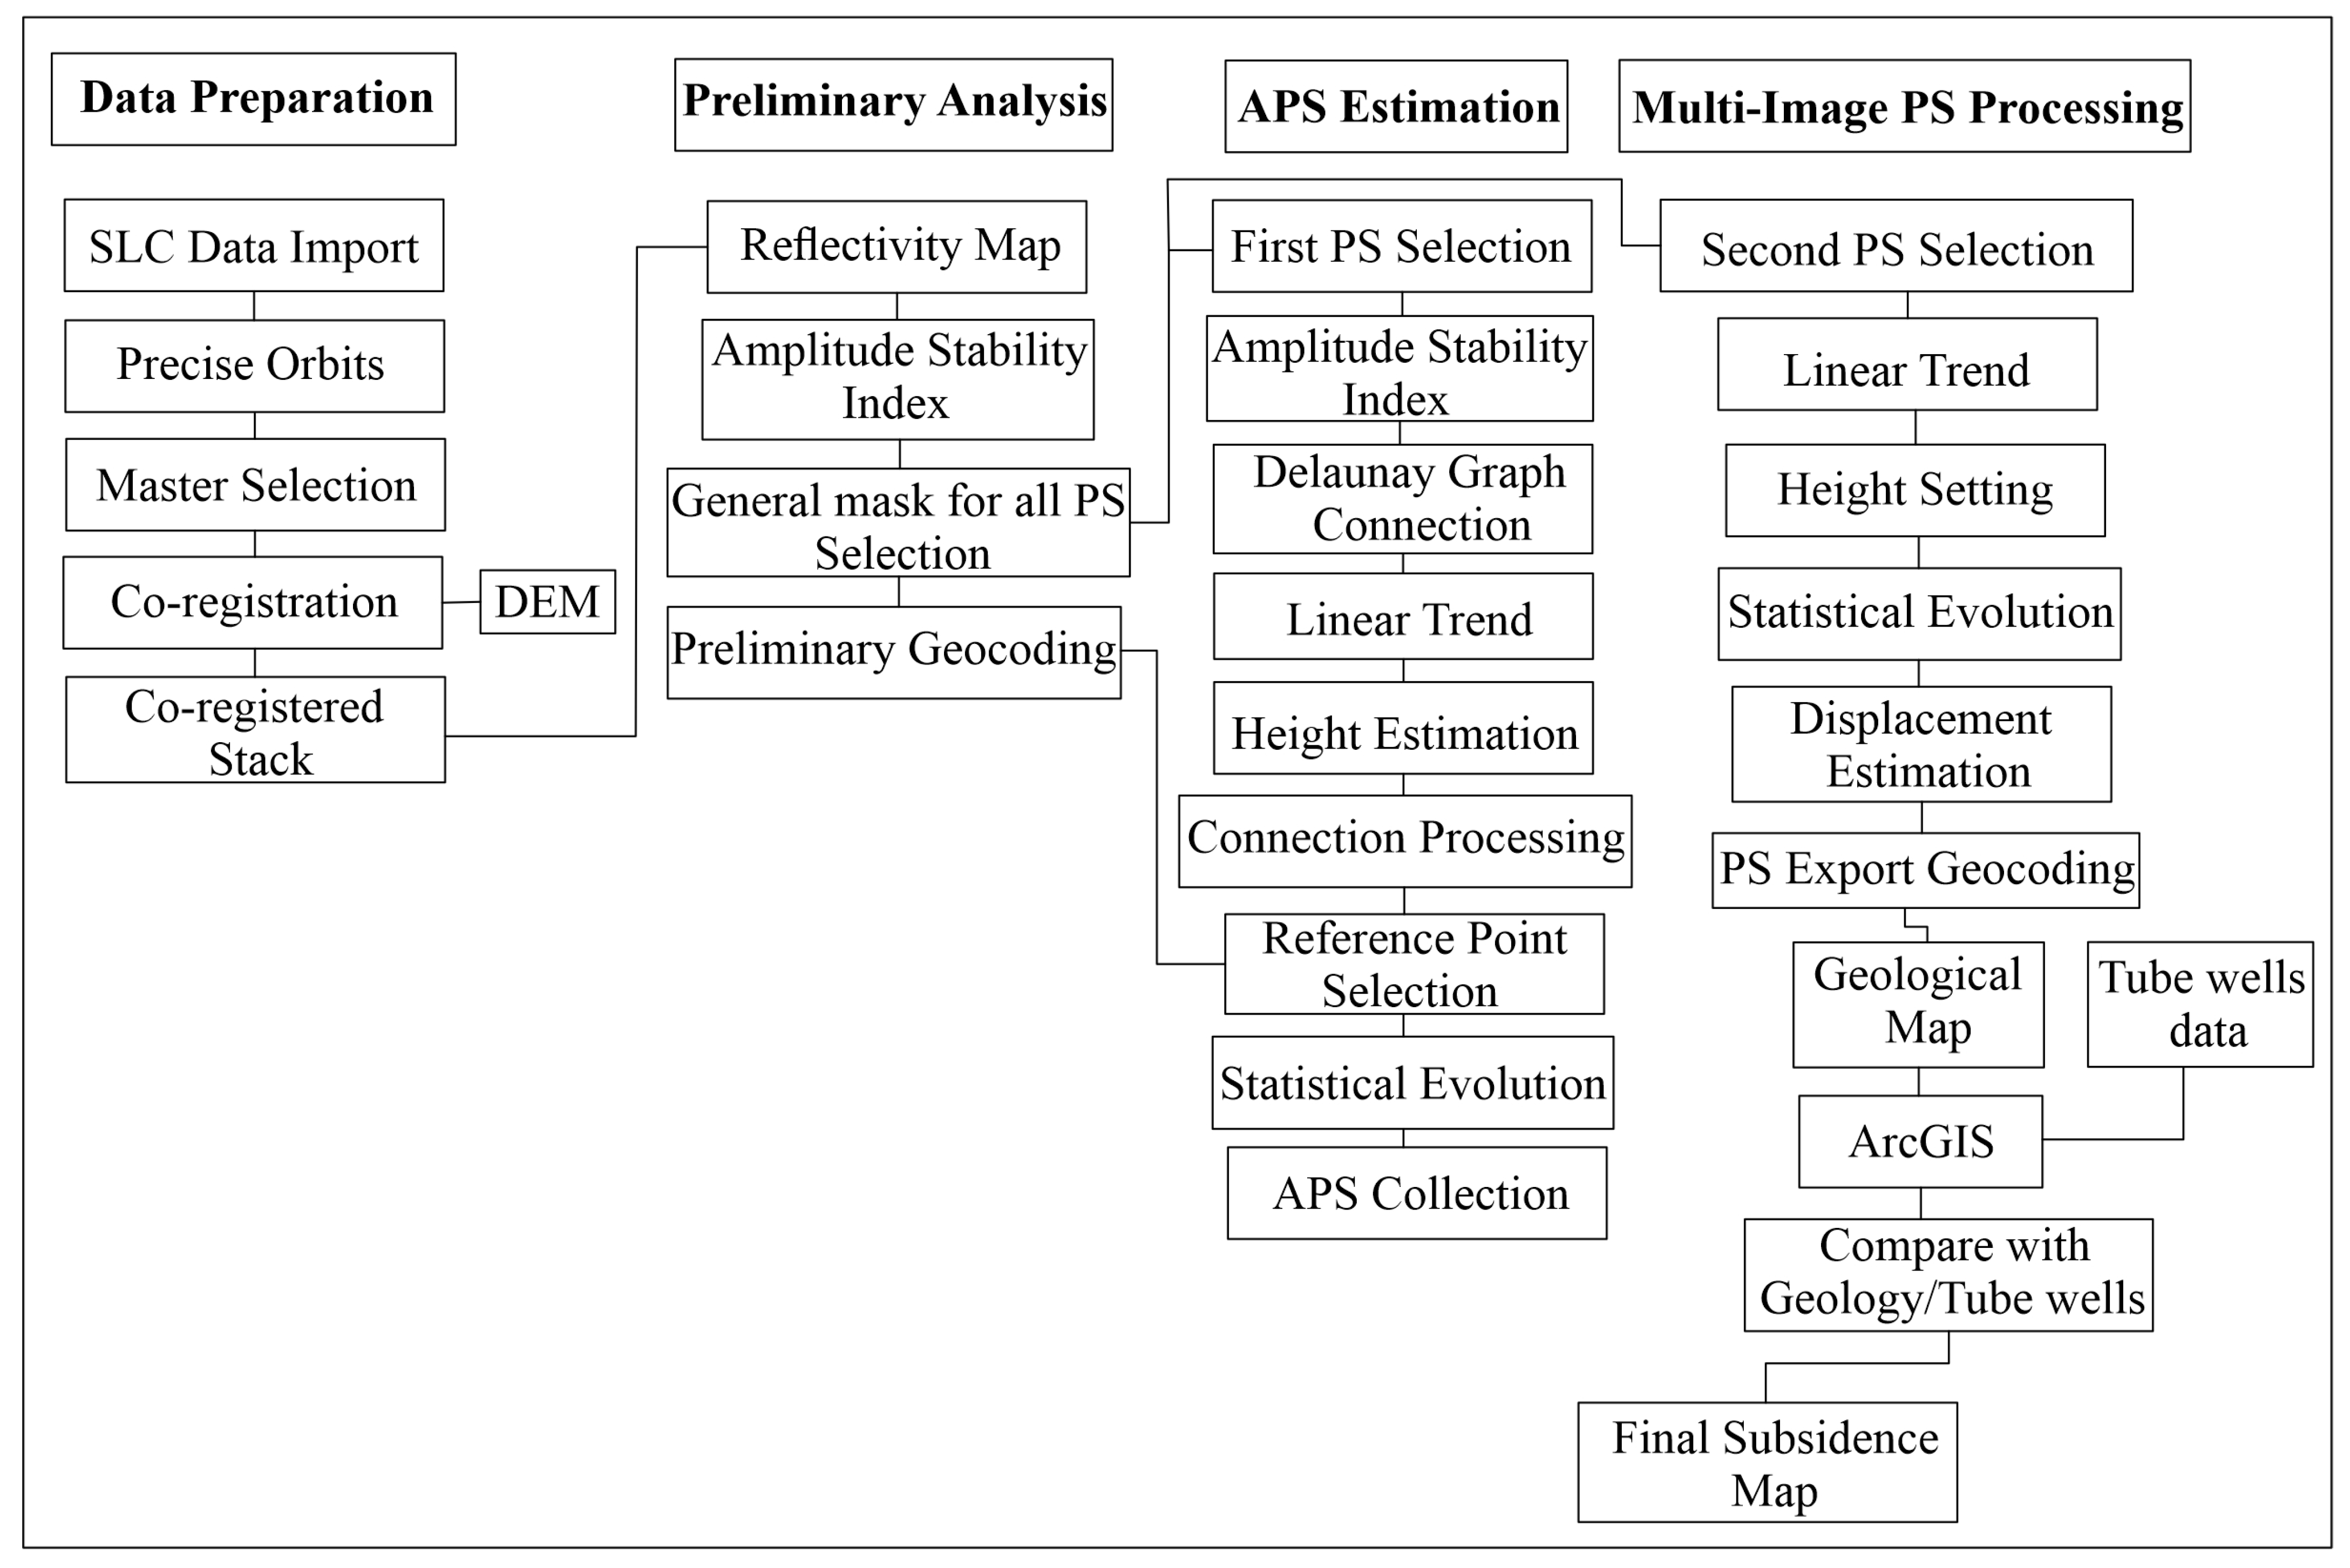
2.4. Data Processing
3. Results
4. Discussion
4.1. Subsurface Geology
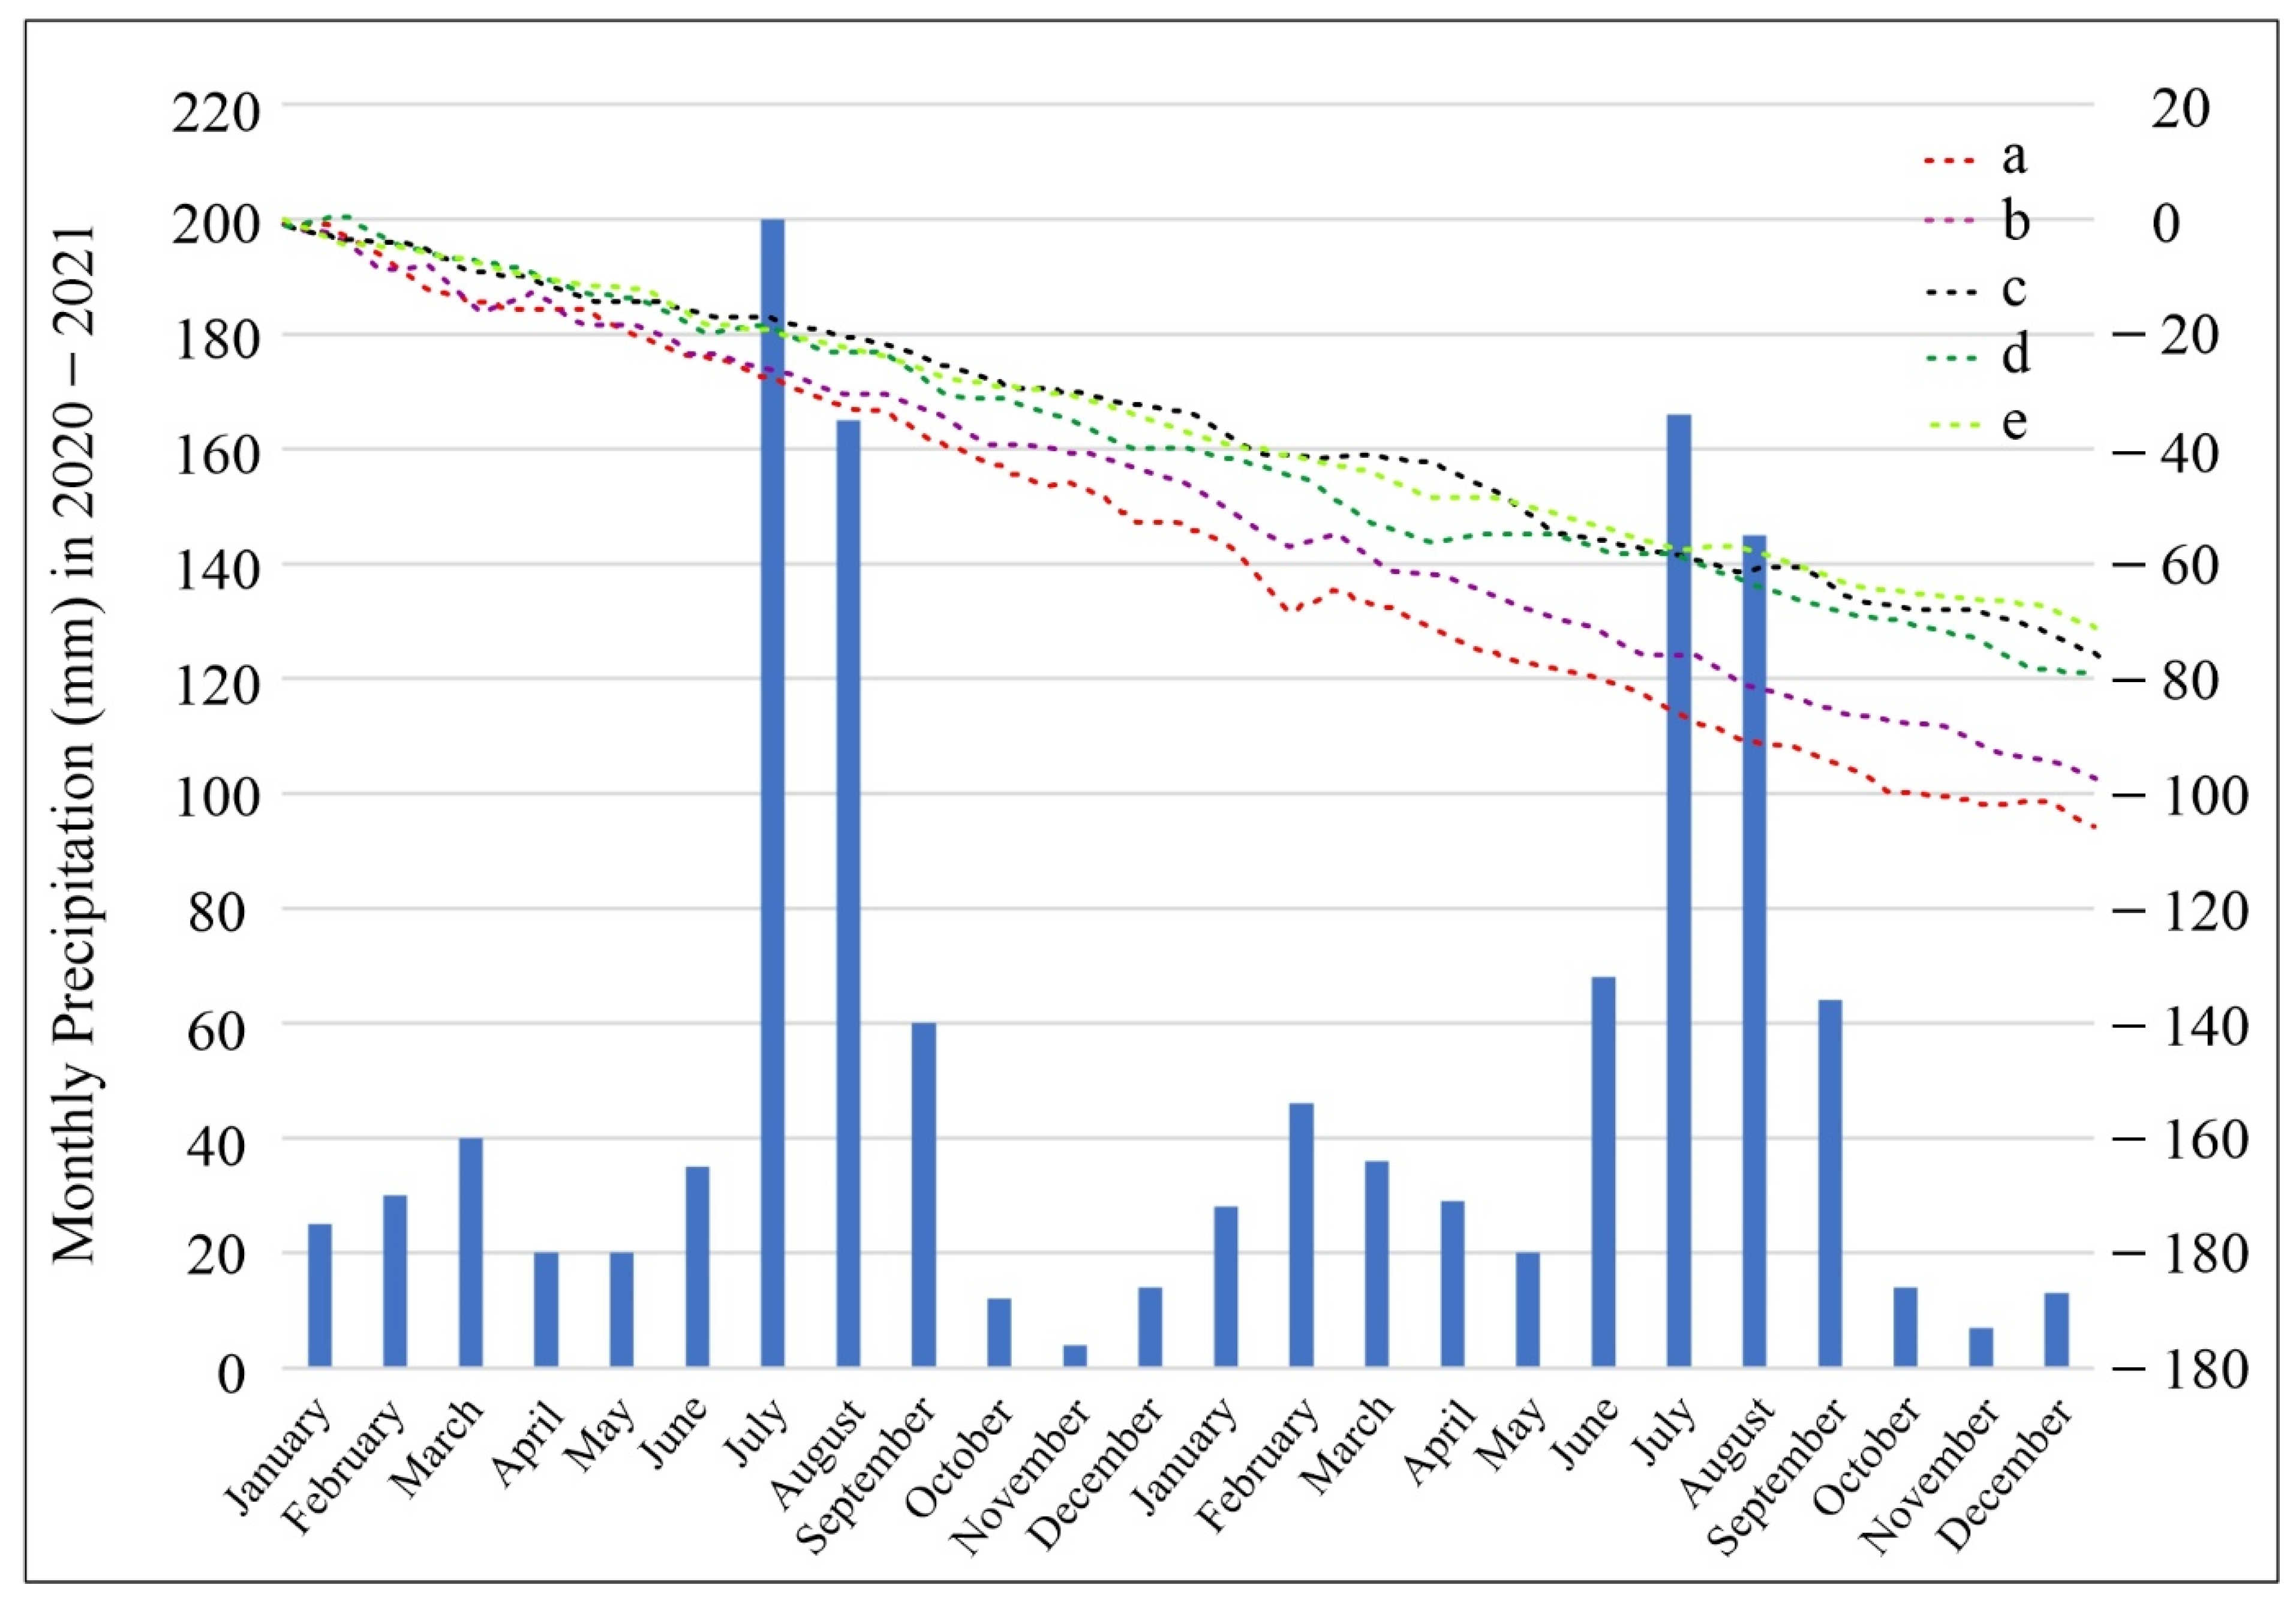
4.2. Precipitation
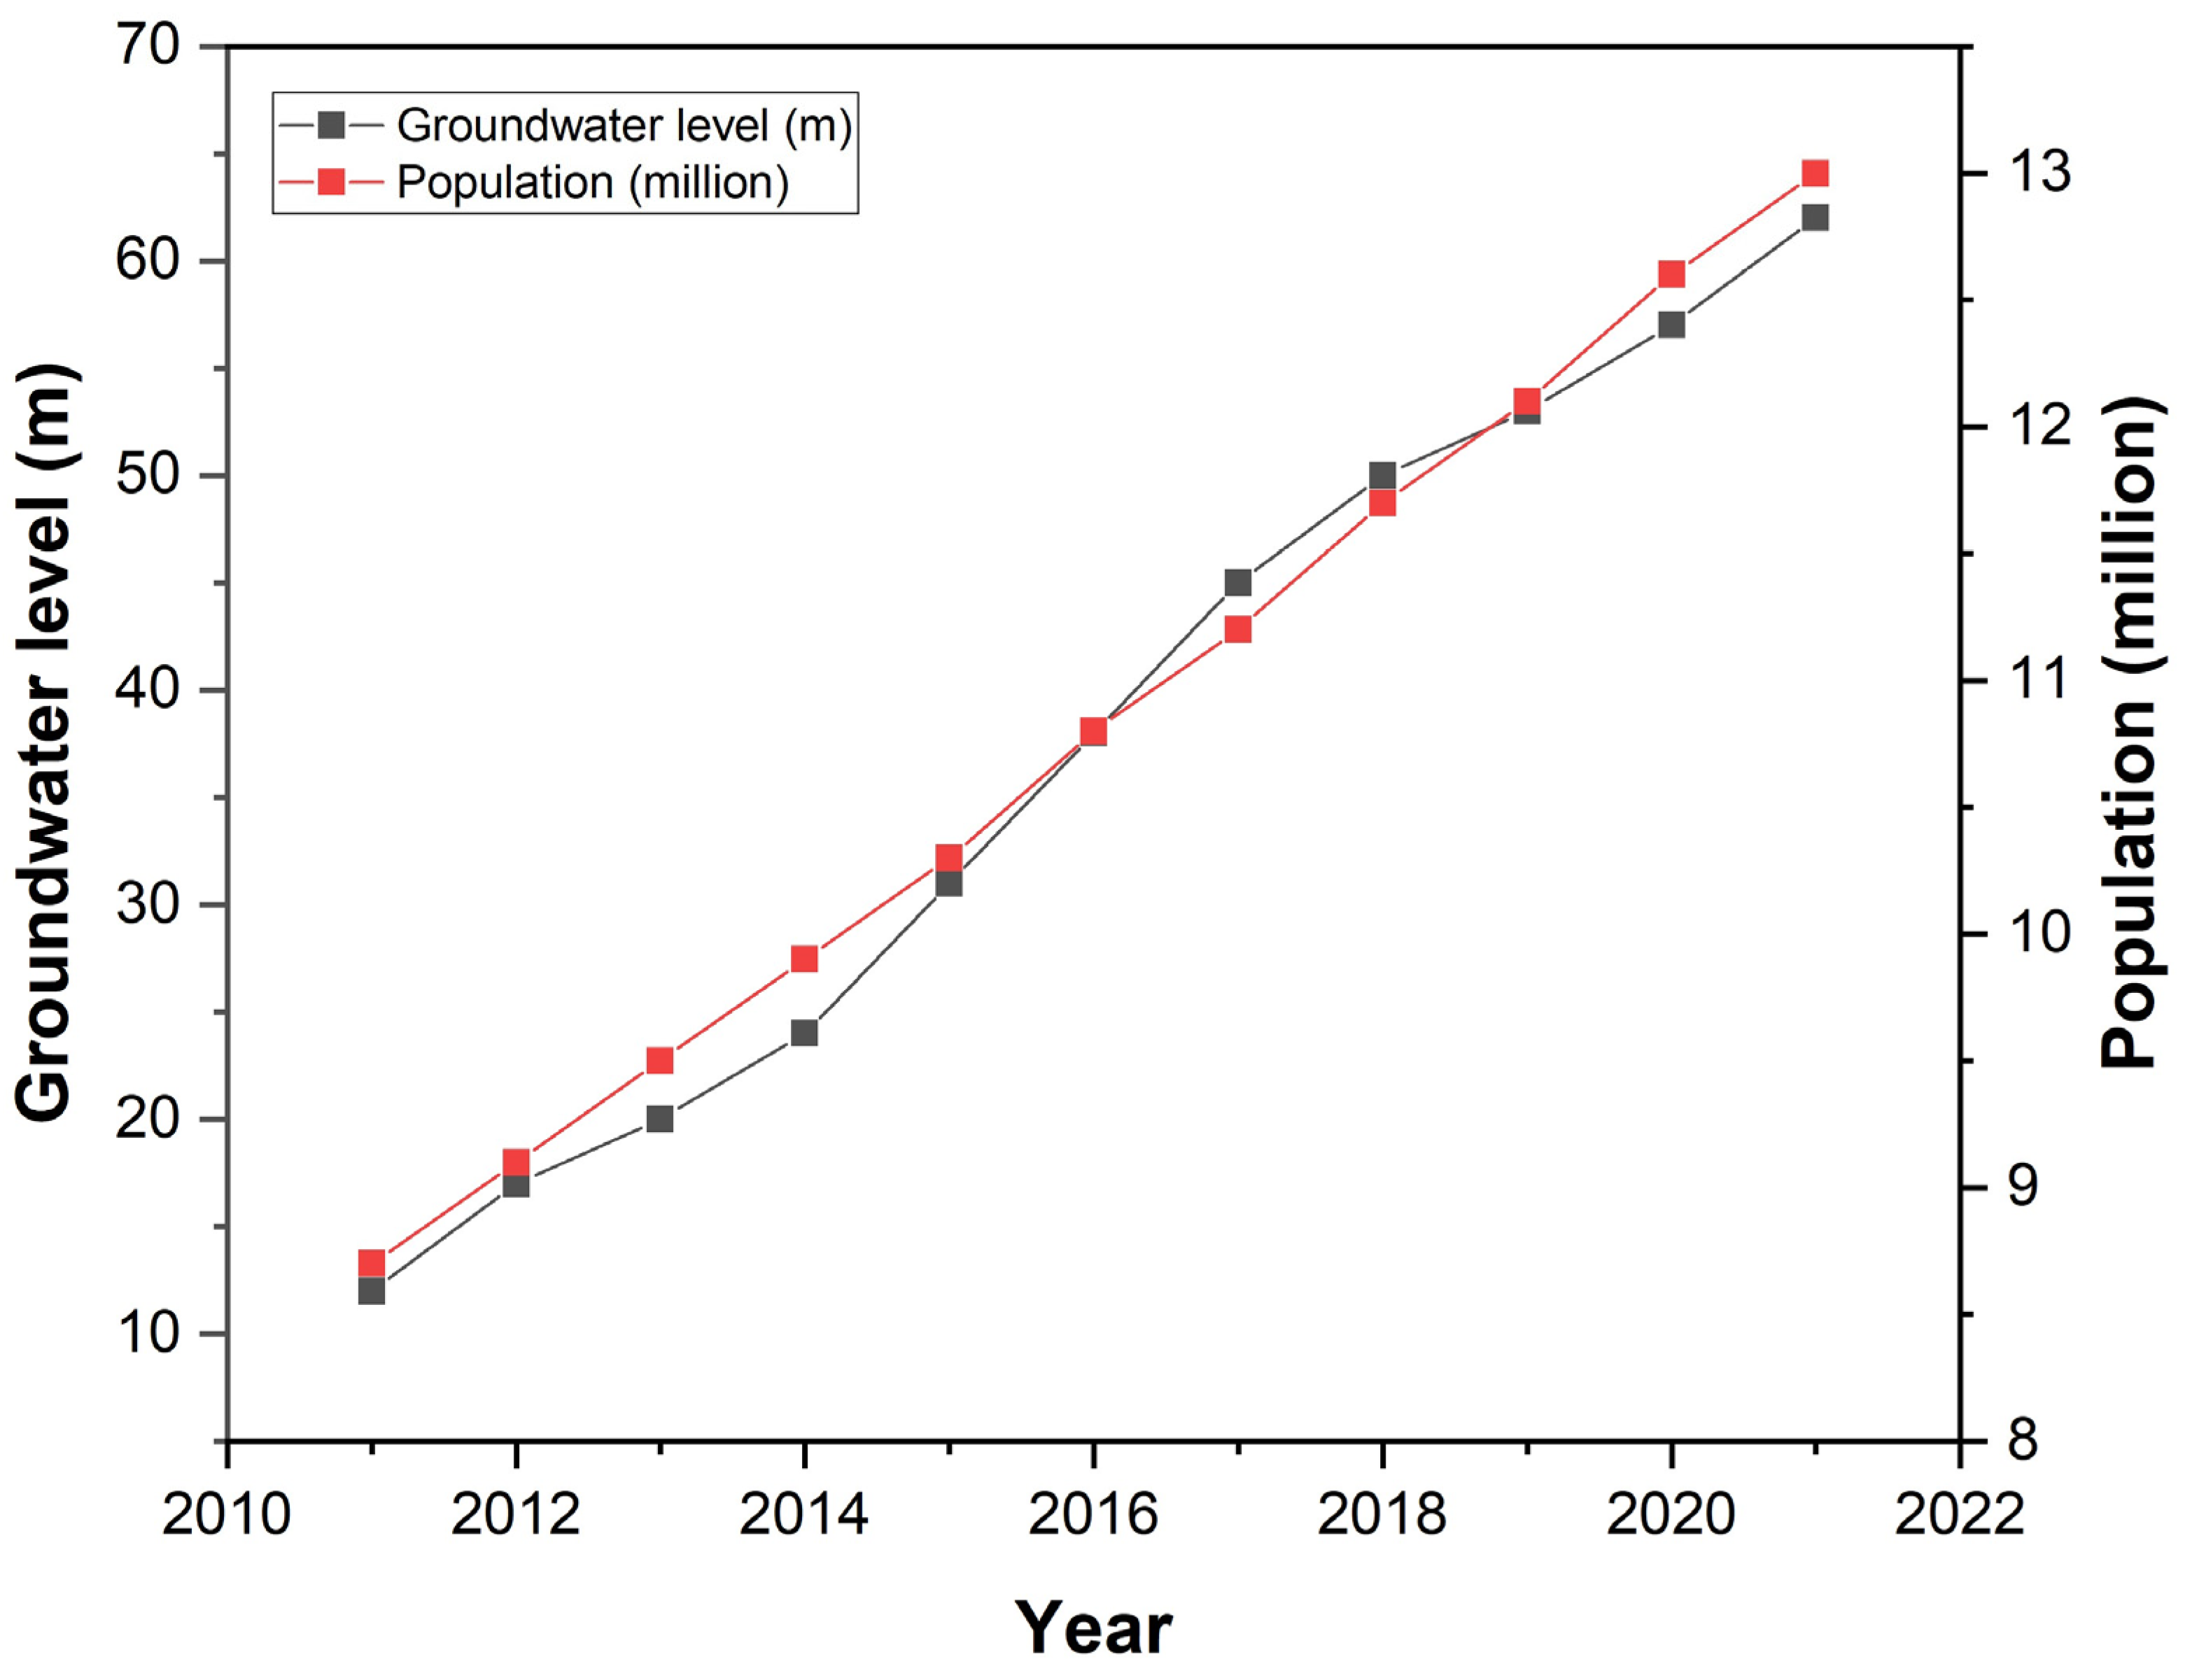
4.3. Groundwater Extraction
4.4. Uncertainties
5. Conclusions
Author Contributions
Funding
Data Availability Statement
Conflicts of Interest
References
- Zhou, L.; Guo, J.; Hu, J.; Li, J.; Xu, Y.; Pan, Y.; Shi, M. Wuhan surface subsidence analysis in 2015–2016 based on Sentinel-1A data by SBAS-InSAR. Remote Sens. 2017, 9, 982. [Google Scholar] [CrossRef]
- Hu, B.; Zhou, J.; Wang, J.; Chen, Z.; Wang, D.; Xu, S. Risk assessment of land subsidence at Tianjin coastal area in China. Environ. Earth Sci. 2009, 59, 269–276. [Google Scholar] [CrossRef]
- Du, Z.; Ge, L.; Ng, A.H.-M.; Xiaojing, L.; Li, L. Mapping land subsidence over the eastern Beijing city using satellite radar interferometry. Int. J. Digit. Earth 2018, 11, 504–519. [Google Scholar] [CrossRef]
- Chen, M.; Tomás, R.; Li, Z.; Motagh, M.; Li, T.; Hu, L.; Gong, H.; Li, X.; Yu, J.; Gong, X. Imaging land subsidence induced by groundwater extraction in Beijing (China) using satellite radar interferometry. Remote Sens. 2016, 8, 468. [Google Scholar] [CrossRef]
- Zhang, T.; Shen, W.-B.; Wu, W.; Zhang, B.; Pan, Y. Recent surface deformation in the Tianjin area revealed by Sentinel-1A data. Remote Sens. 2019, 11, 130. [Google Scholar] [CrossRef]
- Chen, J.; Wu, J.; Zhang, L.; Zou, J.; Liu, G.; Zhang, R.; Yu, B. Deformation trend extraction based on multi-temporal InSAR in Shanghai. Remote Sens. 2013, 5, 1774–1786. [Google Scholar] [CrossRef]
- Zhu, W.; Li, W.-L.; Zhang, Q.; Yang, Y.; Zhang, Y.; Qu, W.; Wang, C.-S. A decade of ground deformation in Kunming (China) revealed by multi-temporal synthetic aperture radar interferometry (InSAR) technique. Sensors 2019, 19, 4425. [Google Scholar] [CrossRef] [PubMed]
- Liu, X.; Xing, X.; Wen, D.; Chen, L.; Yuan, Z.; Liu, B.; Tan, J. Mining-induced time-series deformation investigation based on SBAS-InSAR technique: A case study of drilling water solution rock salt mine. Sensors 2019, 19, 5511. [Google Scholar] [CrossRef] [PubMed]
- Zhang, Y.; Liu, Y.; Jin, M.; Jing, Y.; Liu, Y.; Liu, Y.; Sun, W.; Wei, J.; Chen, Y. Monitoring land subsidence in Wuhan city (China) using the SBAS-InSAR method with radarsat-2 imagery data. Sensors 2019, 19, 743. [Google Scholar] [CrossRef]
- Liu, G.; Luo, X.; Chen, Q.; Huang, D.; Ding, X. Detecting land subsidence in Shanghai by PS-networking SAR interferometry. Sensors 2008, 8, 4725–4741. [Google Scholar] [CrossRef]
- Ma, J.; Xia, D.; Guo, H.; Wang, Y.; Niu, X.; Liu, Z.; Jiang, S. Metaheuristic-based support vector regression for landslide displacement prediction: A comparative study. Landslides 2022, 19, 1–23. [Google Scholar] [CrossRef]
- Kumar, S.; Kumar, D.; Donta, P.K.; Amgoth, T. Land subsidence prediction using recurrent neural networks. Stoch. Environ. Res. Risk Assess. 2022, 36, 373–388. [Google Scholar] [CrossRef]
- Subhanil, G.; Govil, H. Estimating the seasonal relationship between land surface temperature and normalized difference bareness index using Landsat data series. Int. J. Eng. Geosci. 2020, 7, 9–16. [Google Scholar]
- Orhan, O.; Oliver-Cabrera, T.; Wdowinski, S.; Yalvac, S.; Yakar, M. Land subsidence and its relations with sinkhole activity in Karapınar region, Turkey: A multi-sensor InSAR time series study. Sensors 2021, 21, 774. [Google Scholar] [CrossRef]
- Ahady, A.B.; Kaplan, G. Classification comparison of Landsat-8 and Sentinel-2 data in Google Earth Engine, study case of the city of Kabul. Int. J. Eng. Geosci. 2022, 7, 24–31. [Google Scholar] [CrossRef]
- Karimzadeh, S.; Matsuoka, M. Remote Sensing X-Band SAR Data for land subsidence and pavement monitoring. Sensors 2020, 20, 4751. [Google Scholar] [CrossRef] [PubMed]
- Mohebbi Tafreshi, G.; Nakhaei, M.; Lak, R. A GIS-based comparative study of hybrid fuzzy-gene expression programming and hybrid fuzzy-artificial neural network for land subsidence susceptibility modeling. Stoch. Environ. Res. Risk Assess. 2020, 34, 1059–1087. [Google Scholar] [CrossRef]
- Arabameri, A.; Santosh, M.; Rezaie, F.; Saha, S.; Coastache, R.; Roy, J.; Mukherjee, K.; Tiefenbacher, J. Application of novel ensemble models and k-fold CV approaches for Land subsidence susceptibility modelling. Stoch. Environ. Res. Risk Assess. 2022, 36, 201–223. [Google Scholar] [CrossRef]
- Ezquerro, P.; Del Soldato, M.; Solari, L.; Tomás, R.; Raspini, F.; Ceccatelli, M.; Fernández-Merodo, J.A.; Casagli, N.; Herrera, G. Vulnerability assessment of buildings due to land subsidence using InSAR data in the ancient historical city of Pistoia (Italy). Sensors 2020, 20, 2749. [Google Scholar] [CrossRef]
- Stramondo, S.; Bozzano, F.; Marra, F.; Wegmuller, U.; Cinti, F.; Moro, M.; Saroli, M. Subsidence induced by urbanisation in the city of Rome detected by advanced InSAR technique and geotechnical investigations. Remote Sens. Environ. 2008, 112, 3160–3172. [Google Scholar] [CrossRef]
- Pratesi, F.; Tapete, D.; Del Ventisette, C.; Moretti, S. Mapping interactions between geology, subsurface resource exploitation and urban development in transforming cities using InSAR Persistent Scatterers: Two decades of change in Florence, Italy. Appl. Geogr. 2016, 77, 20–37. [Google Scholar] [CrossRef]
- Solari, L.; Ciampalini, A.; Raspini, F.; Bianchini, S.; Moretti, S. PSInSAR analysis in the Pisa urban area (Italy): A case study of subsidence related to stratigraphical factors and urbanization. Remote Sens. 2016, 8, 120. [Google Scholar] [CrossRef]
- Nonaka, T.; Asaka, T.; Iwashita, K.; Ogushi, F. Evaluation of the trend of deformation around the Kanto Region estimated using the time series of PALSAR-2 Data. Sensors 2020, 20, 339. [Google Scholar] [CrossRef] [PubMed]
- Zheng, M.; Fukuyama, K.; Sanga-Ngoie, K. Application of InSAR and GIS techniques to ground subsidence assessment in the Nobi Plain, Central Japan. Sensors 2014, 14, 492–509. [Google Scholar] [CrossRef]
- Castellazzi, P.; Arroyo-Domínguez, N.; Martel, R.; Calderhead, A.I.; Normand, J.C.; Gárfias, J.; Rivera, A. Land subsidence in major cities of Central Mexico: Interpreting InSAR-derived land subsidence mapping with hydrogeological data. Int. J. Appl. Earth Obs. Geoinf. 2016, 47, 102–111. [Google Scholar] [CrossRef]
- Chaussard, E.; Wdowinski, S.; Cabral-Cano, E.; Amelung, F. Land subsidence in central Mexico detected by ALOS InSAR time-series. Remote Sens. Environ. 2014, 140, 94–106. [Google Scholar] [CrossRef]
- Ng, A.H.-M.; Ge, L.; Li, X.; Abidin, H.Z.; Andreas, H.; Zhang, K. Mapping land subsidence in Jakarta, Indonesia using persistent scatterer interferometry (PSI) technique with ALOS PALSAR. Int. J. Appl. Earth Obs. Geoinf. 2012, 18, 232–242. [Google Scholar] [CrossRef]
- Chaussard, E.; Amelung, F.; Abidin, H.; Hong, S.-H. Sinking cities in Indonesia: ALOS PALSAR detects rapid subsidence due to groundwater and gas extraction. Remote Sens. Environ. 2013, 128, 150–161. [Google Scholar] [CrossRef]
- Amin, G.; Shahzad, M.I.; Jaweria, S.; Zia, I. Measuring land deformation in a mega city Karachi-Pakistan with Sentinel SAR Interferometry. Geocarto Int. 2021, 1, 1–15. [Google Scholar] [CrossRef]
- Khan, J.; Ren, X.; Hussain, M.A.; Jan, M.Q. Monitoring Land Subsidence Using PS-InSAR Technique in Rawalpindi and Islamabad, Pakistan. Remote Sens. 2022, 14, 3722. [Google Scholar] [CrossRef]
- Shahzad, N.; Ding, X.; Wu, S.; Liang, H. Ground deformation and its causes in abbottabad city, pakistan from sentinel-1a data and mt-insar. Remote Sens. 2020, 12, 3442. [Google Scholar] [CrossRef]
- Hussain, M.A.; Chen, Z.; Shoaib, M.; Shah, S.U.; Khan, J.; Ying, Z. Sentinel-1A for monitoring land subsidence of coastal city of Pakistan using Persistent Scatterers In-SAR technique. Sci. Rep. 2022, 12, 1–18. [Google Scholar]
- Kaneko, S.; Toyota, T. Long-term urbanization and land subsidence in Asian Megacities: An indicators system approach. In Groundwater and Subsurface Environments; Springer: Berlin/Heidelberg, Germany, 2011; pp. 249–270. [Google Scholar]
- Infante, D.; Di Martire, D.; Confuorto, P.; Tessitore, S.; Tòmas, R.; Calcaterra, D.; Ramondini, M. Assessment of building behavior in slow-moving landslide-affected areas through DInSAR data and structural analysis. Eng. Struct. 2019, 199, 109638. [Google Scholar] [CrossRef]
- Peduto, D.; Pisciotta, G.; Nicodemo, G.; Arena, L.; Ferlisi, S.; Gullà, G.; Borrelli, L.; Fornaro, G.; Reale, D. A procedure for the analysis of building vulnerability to slow-moving landslides. In Proceedings of the 1st IMEKO International Workshop on Metrology for Geotechnics, Athena Srl, Benevento, Italy, 17–18 March 2016; pp. 248–254. [Google Scholar]
- Shoaib, M.; Yang, W.; Liang, Y.; Rehman, G. Stability and deformation analysis of landslide under coupling effect of rainfall and reservoir drawdown. Civ. Eng. J. 2021, 7, 1098–1111. [Google Scholar] [CrossRef]
- Talledo, D.A.; Miano, A.; Bonano, M.; Di Carlo, F.; Lanari, R.; Manunta, M.; Meda, A.; Mele, A.; Prota, A.; Saetta, A. Satellite radar interferometry: Potential and limitations for structural assessment and monitoring. J. Build. Eng. 2022, 46, 103756. [Google Scholar] [CrossRef]
- Ma, J.; Xia, D.; Wang, Y.; Niu, X.; Jiang, S.; Liu, Z.; Guo, H. A comprehensive comparison among metaheuristics (MHs) for geohazard modeling using machine learning: Insights from a case study of landslide displacement prediction. Eng. Appl. Artif. Intell. 2022, 114, 105150. [Google Scholar] [CrossRef]
- Ikuemonisan, F.E.; Ozebo, V.C. Characterisation and mapping of land subsidence based on geodetic observations in Lagos, Nigeria. Geod. Geodyn. 2020, 11, 151–162. [Google Scholar] [CrossRef]
- Buzzanga, B.; Bekaert, D.P.; Hamlington, B.D.; Sangha, S.S. Toward sustained monitoring of subsidence at the coast using InSAR and GPS: An application in Hampton Roads, Virginia. Geophys. Res. Lett. 2020, 47, e2020GL090013. [Google Scholar] [CrossRef]
- Da Lio, C.; Tosi, L. Land subsidence in the Friuli Venezia Giulia coastal plain, Italy: 1992–2010 results from SAR-based interferometry. Sci. Total Environ. 2018, 633, 752–764. [Google Scholar] [CrossRef]
- Tzouvaras, M.; Kouhartsiouk, D.; Agapiou, A.; Danezis, C.; Hadjimitsis, D.G. The use of Sentinel-1 synthetic aperture radar (SAR) images and open-source software for cultural heritage: An example from Paphos area in Cyprus for mapping landscape changes after a 5.6 magnitude earthquake. Remote Sens. 2019, 11, 1766. [Google Scholar] [CrossRef]
- Chen, B.; Gong, H.; Li, X.; Lei, K.; Gao, M.; Zhou, C.; Ke, Y. Spatial–temporal evolution patterns of land subsidence with different situation of space utilization. Nat. Hazards 2015, 77, 1765–1783. [Google Scholar] [CrossRef]
- Hussain, M.A.; Chen, Z.; Zheng, Y.; Shoaib, M.; Shah, S.U.; Ali, N.; Afzal, Z. Landslide susceptibility mapping using machine learning algorithm validated by persistent scatterer In-SAR technique. Sensors 2022, 22, 3119. [Google Scholar] [CrossRef] [PubMed]
- Manconi, A.; Kourkouli, P.; Caduff, R.; Strozzi, T.; Loew, S. Monitoring surface deformation over a failing rock slope with the ESA sentinels: Insights from Moosfluh instability, Swiss Alps. Remote Sens. 2018, 10, 672. [Google Scholar] [CrossRef]
- Fiorentini, N.; Maboudi, M.; Leandri, P.; Losa, M. Can machine learning and PS-InSAR reliably stand in for road profilometric surveys? Sensors 2021, 21, 3377. [Google Scholar] [CrossRef] [PubMed]
- Galve, J.P.; Castañeda, C.; Gutiérrez, F.; Herrera, G. Assessing sinkhole activity in the Ebro Valley mantled evaporite karst using advanced DInSAR. Geomorphology 2015, 229, 30–44. [Google Scholar] [CrossRef]
- Tofani, V.; Raspini, F.; Catani, F.; Casagli, N. Persistent Scatterer Interferometry (PSI) technique for landslide characterization and monitoring. Remote Sens. 2013, 5, 1045–1065. [Google Scholar] [CrossRef]
- Yang, Q.; Ke, Y.; Zhang, D.; Chen, B.; Gong, H.; Lv, M.; Zhu, L.; Li, X. Multi-scale analysis of the relationship between land subsidence and buildings: A case study in an eastern Beijing Urban Area using the PS-InSAR technique. Remote Sens. 2018, 10, 1006. [Google Scholar] [CrossRef]
- Gao, M.; Gong, H.; Chen, B.; Zhou, C.; Chen, W.; Liang, Y.; Shi, M.; Si, Y. InSAR time-series investigation of long-term ground displacement at Beijing Capital International Airport, China. Tectonophysics 2016, 691, 271–281. [Google Scholar] [CrossRef]
- Shi, L.; Gong, H.; Chen, B.; Zhou, C. Land Subsidence Prediction Induced by Multiple Factors Using Machine Learning Method. Remote Sens. 2020, 12, 4044. [Google Scholar] [CrossRef]
- Beladam, O.; Balz, T.; Mohamadi, B.; Abdalhak, M. Using ps-insar with sentinel-1 images for deformation monitoring in northeast Algeria. Geosciences 2019, 9, 315. [Google Scholar] [CrossRef]
- Milillo, P.; Giardina, G.; DeJong, M.J.; Perissin, D.; Milillo, G. Multi-temporal InSAR structural damage assessment: The London crossrail case study. Remote Sens. 2018, 10, 287. [Google Scholar] [CrossRef]
- Agarwal, V.; Kumar, A.; L Gomes, R.; Marsh, S. Monitoring of ground movement and groundwater changes in London using InSAR and GRACE. Appl. Sci. 2020, 10, 8599. [Google Scholar] [CrossRef]
- Khorrami, M.; Abrishami, S.; Maghsoudi, Y.; Alizadeh, B.; Perissin, D. Extreme subsidence in a populated city (Mashhad) detected by PSInSAR considering groundwater withdrawal and geotechnical properties. Sci. Rep. 2020, 10, 1–16. [Google Scholar] [CrossRef] [PubMed]
- Khorrami, M.; Alizadeh, B.; Ghasemi Tousi, E.; Shakerian, M.; Maghsoudi, Y.; Rahgozar, P. How groundwater level fluctuations and geotechnical properties lead to asymmetric subsidence: A PSInSAR analysis of land deformation over a transit corridor in the Los Angeles metropolitan area. Remote Sens. 2019, 11, 377. [Google Scholar] [CrossRef]
- Mateos, R.M.; Ezquerro, P.; Luque-Espinar, J.A.; Béjar-Pizarro, M.; Notti, D.; Azañón, J.M.; Montserrat, O.; Herrera, G.; Fernández-Chacón, F.; Peinado, T. Multiband PSInSAR and long-period monitoring of land subsidence in a strategic detrital aquifer (Vega de Granada, SE Spain): An approach to support management decisions. J. Hydrol. 2017, 553, 71–87. [Google Scholar] [CrossRef]
- Cian, F.; Blasco, J.M.D.; Carrera, L. Sentinel-1 for monitoring land subsidence of coastal cities in Africa using PSInSAR: A methodology based on the integration of SNAP and StaMPS. Geosciences 2019, 9, 124. [Google Scholar] [CrossRef]
- Grzempowski, P.; Badura, J.; Milczarek, W.; Blachowski, J.; Głowacki, T.; Zając, M. Determination of the Long-Term Ground Surface Displacements Using a PSI Technique—Case Study on Wrocław (Poland). Appl. Sci. 2020, 10, 3343. [Google Scholar] [CrossRef]
- Khan, R.; Li, H.; Afzal, Z.; Basir, M.; Arif, M.; Hassan, W. Monitoring Subsidence in Urban Area by PSInSAR: A Case Study of Abbottabad City, Northern Pakistan. Remote Sens. 2021, 13, 1651. [Google Scholar] [CrossRef]
- Pepe, A.; Calò, F. A review of interferometric synthetic aperture RADAR (InSAR) multi-track approaches for the retrieval of Earth’s surface displacements. Appl. Sci. 2017, 7, 1264. [Google Scholar] [CrossRef]
- Zhou, C.; Lan, H.; Gong, H.; Zhang, Y.; Warner, T.A.; Clague, J.J.; Wu, Y. Reduced rate of land subsidence since 2016 in Beijing, China: Evidence from Tomo-PSInSAR using RadarSAT-2 and Sentinel-1 datasets. Int. J. Remote Sens. 2020, 41, 1259–1285. [Google Scholar] [CrossRef]
- Duan, W.; Zhang, H.; Tang, Y.; Wang, C.; Zeng, X.; Wang, J. Land subsidence monitoring for Beijing-tianjin-hebei region using sentinel-1. In Proceedings of the 2019 SAR in Big Data Era (BIGSARDATA), Beijing, China, 5–6 August 2019; pp. 1–4. [Google Scholar]
- Kazmi, A.H.; Jan, M.Q. Geology and Tectonics of Pakistan; Graphic Publishers: Karachi, Pakistan, 1997. [Google Scholar]
- Naeem, M.; Khan, K.; Rehman, S.; Iqbal, J. Environmental assessment of ground water quality of Lahore area, Punjab, Pakistan. J. Appl. Sci. 2007, 7, 41–46. [Google Scholar] [CrossRef]
- Crosetto, M.; Devanthéry, N.; Cuevas-González, M.; Monserrat, O.; Crippa, B. Exploitation of the full potential of PSI data for subsidence monitoring. Proc. Int. Assoc. Hydrol. Sci. 2015, 372, 311–314. [Google Scholar] [CrossRef]
- Hussain, M.A.; Chen, Z.; Wang, R.; Shoaib, M. PS-InSAR-Based Validated Landslide Susceptibility Mapping along Karakorum Highway, Pakistan. Remote Sens. 2021, 13, 4129. [Google Scholar] [CrossRef]
- Yagüe-Martínez, N.; Prats-Iraola, P.; Gonzalez, F.R.; Brcic, R.; Shau, R.; Geudtner, D.; Eineder, M.; Bamler, R. Interferometric processing of Sentinel-1 TOPS data. IEEE Trans. Geosci. Remote Sens. 2016, 54, 2220–2234. [Google Scholar] [CrossRef]
- Zhou, C.; Gong, H.; Zhang, Y.; Warner, T.A.; Wang, C. Spatiotemporal evolution of land subsidence in the Beijing plain 2003–2015 using persistent scatterer interferometry (PSI) with multi-source SAR data. Remote Sens. 2018, 10, 552. [Google Scholar] [CrossRef]
- Ferretti, A.; Prati, C.; Rocca, F. Nonlinear subsidence rate estimation using permanent scatterers in differential SAR interferometry. IEEE Trans. Geosci. Remote Sens. 2000, 38, 2202–2212. [Google Scholar] [CrossRef]
- Fárová, K.; Jelének, J.; Kopačková-Strnadová, V.; Kycl, P. Comparing DInSAR and PSI techniques employed to Sentinel-1 data to monitor highway stability: A case study of a massive Dobkovičky landslide, Czech Republic. Remote Sens. 2019, 11, 2670. [Google Scholar] [CrossRef]
- Perissin, D. Interferometric SAR multitemporal processing: Techniques and applications. In Multitemporal Remote Sensing; Springer: Berlin/Heidelberg, Germany, 2016; pp. 145–176. [Google Scholar]
- Ahmad, A.; Sultan, M.; Falak, A. Urban subsidence monitoring by PSInSAR and its causes in Lahore, Pakistan. In Proceedings of the 2021 SAR in Big Data Era (BIGSARDATA), Nanjing, China, 22–24 September 2021; pp. 1–4. [Google Scholar]
- Malik, A. Geotechnical Statistical Evaluation of Lahore Site Data and Deep Excavation Design. Master’s Thesis, Portland State University, Portland, OR, USA, 2015. [Google Scholar]
- Ahmad, N.; Ahmad, M.; Rafiq, M.; Iqbal, N.; Ali, M.; Sajjad, M.I. Hydrological modeling of the Lahore-Aquifer, using isotopic, chemical and numerical techniques. Back Issues J. Sci. Vis. 2002, 7, 16. [Google Scholar]
- Holzer, T.L.; Johnson, A.I. Land subsidence caused by ground water withdrawal in urban areas. GeoJournal 1985, 11, 245–255. [Google Scholar] [CrossRef]
- Hassan, G.Z.; Hassan, F.R.; Akhtar, S. Environment threats to groundwater in Lahore area. In Proceedings of the Pakistan Engineering Congress World Environment Day, Lahore, Pakistan, 5 June 2014; pp. 68–98. [Google Scholar]
- Wang, Y.-Q.; Wang, Z.-F.; Cheng, W.-C. A review on land subsidence caused by groundwater withdrawal in Xi’an, China. Bull. Eng. Geol. Environ. 2019, 78, 2851–2863. [Google Scholar] [CrossRef]
- Figueroa-Miranda, S.; Tuxpan-Vargas, J.; Ramos-Leal, J.A.; Hernández-Madrigal, V.M.; Villaseñor-Reyes, C.I. Land subsidence by groundwater over-exploitation from aquifers in tectonic valleys of Central Mexico: A review. Eng. Geol. 2018, 246, 91–106. [Google Scholar] [CrossRef]
- Ullah, Z.; Talib, M.A.; Rashid, A.; Ghani, J.; Shahab, A.; Irfan, M.; Rauf, A.; Bawazeer, S.; Almarhoon, Z.M.; Mabkhot, Y.N.J.W. Hydrogeochemical investigation of elevated arsenic based on entropy modeling, in the aquifers of District Sanghar, Sindh, Pakistan. Water 2021, 13, 3477. [Google Scholar] [CrossRef]
- Meribole, J. The Water Crisis in Pakistan. In Borgen Magazine; The Borgen Project: Seattle, WA, USA, 2020. [Google Scholar]
- Jo, M.-J.; Won, J.-S.; Kim, S.-W. A time-series observation of ground subsidence at Ulsan area using SAR interferometry. In Proceedings of the 2011 3rd International Asia-Pacific Conference on Synthetic Aperture Radar (APSAR), Seoul, Korea, 26–30 September 2011; pp. 1–3. [Google Scholar]
- Ge, D.; Wang, Y.; Zhang, L.; Li, M.; Guo, X. Integrating medium and high resolution psinsar data to monitor terrain motion along large scale manmade linear features-A case study in shanghai. In Proceedings of the 2013 IEEE International Geoscience and Remote Sensing Symposium-IGARSS, Melbourne, Australia, 21–26 July 2013; pp. 4034–4037. [Google Scholar]
- Osmanoğlu, B.; Dixon, T.H.; Wdowinski, S.; Cabral-Cano, E.; Jiang, Y. Mexico City subsidence observed with persistent scatterer InSAR. Int. J. Appl. Earth Obs. Geoinf. 2011, 13, 1–12. [Google Scholar] [CrossRef]
- Liu, X.; Wang, Z.; Huang, R. Prediction on carbon emissions trend in Beijing Tianjing and Hebei Province. In Proceedings of the 2011 19th International Conference on Geoinformatics, Shanghai, China, 24–26 June 2011; pp. 1–4. [Google Scholar]
- Galloway, D.L.; Burbey, T.J. Regional land subsidence accompanying groundwater extraction. Hydrogeol. J. 2011, 19, 1459–1486. [Google Scholar] [CrossRef]
- Iqbal, J.; Su, C.; Rashid, A.; Yang, N.; Baloch, M.Y.J.; Talpur, S.A.; Ullah, Z.; Rahman, G.; Rahman, N.U.; Sajjad, M.M. Hydrogeochemical assessment of groundwater and suitability analysis for domestic and agricultural utility in Southern Punjab, Pakistan. Water 2021, 13, 3589. [Google Scholar] [CrossRef]
- Kaplan, G.; Avdan, Z.Y. Space-borne air pollution observation from sentinel-5p tropomi: Relationship between pollutants, geographical and demographic data. Int. J. Eng. Geosci. 2020, 5, 130–137. [Google Scholar] [CrossRef]
- Jat Baloch, M.Y.; Zhang, W.; Chai, J.; Li, S.; Alqurashi, M.; Rehman, G.; Tariq, A.; Talpur, S.A.; Iqbal, J.; Munir, M. Shallow Groundwater Quality Assessment and Its Suitability Analysis for Drinking and Irrigation Purposes. Water 2021, 13, 3361. [Google Scholar] [CrossRef]
- Rana, I.A.; Bhatti, S.S. Lahore, Pakistan-Urbanization challenges and opportunities. Cities 2018, 72, 348–355. [Google Scholar] [CrossRef]
- Tahir, A.A.; Muhammad, A.; Mahmood, Q.; Ahmad, S.S.; Ullah, Z. Impact of rapid urbanization on microclimate of urban areas of Pakistan. Air Qual. Atmos. Health 2015, 8, 299–306. [Google Scholar] [CrossRef]
- Nof, R.N.; Baer, G.; Ziv, A.; Raz, E.; Atzori, S.; Salvi, S. Sinkhole precursors along the Dead Sea, Israel, revealed by SAR interferometry. Geology 2013, 41, 1019–1022. [Google Scholar] [CrossRef]


| Data Information | Ascending | Descending |
|---|---|---|
| Product type | Sentinel 1 IW SLC | |
| Polarization | VV + VH | |
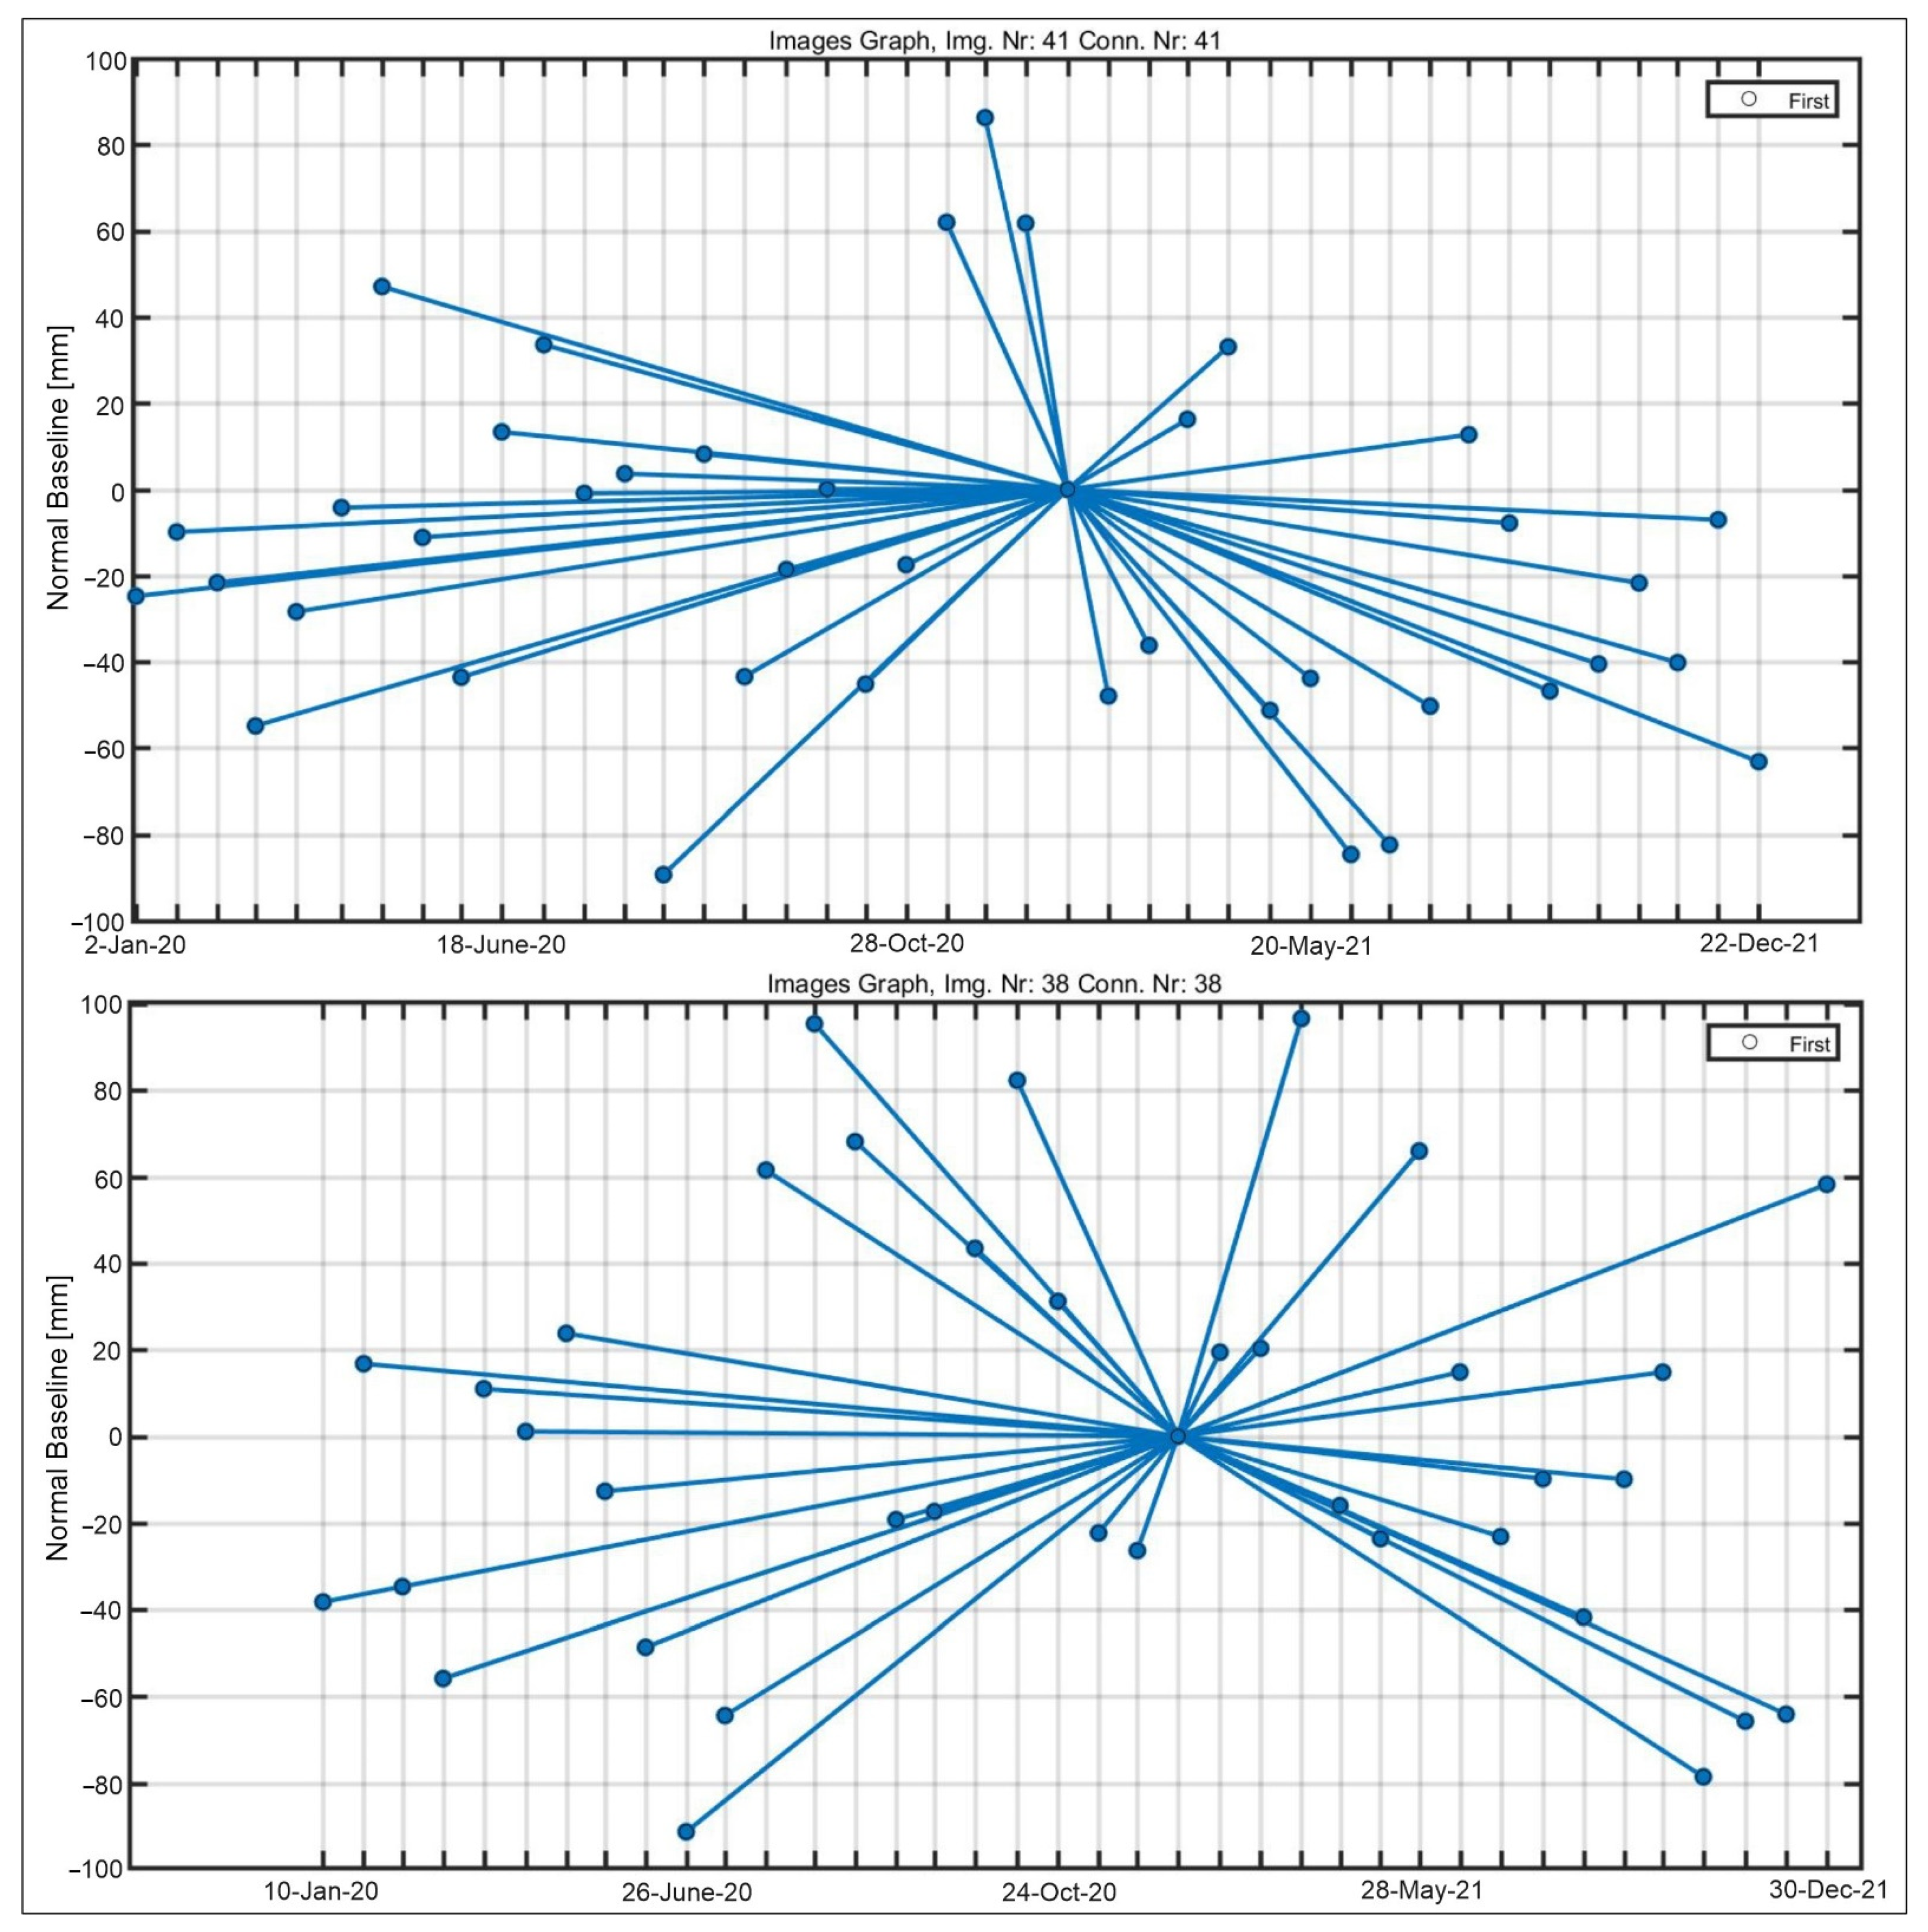
| No. of images | 41 | 38 |
| Time period | 2 January 2020–22 December 2021 | 10 January 2020–30 December 2021 |
| Track | 100 | 34 |
| Frame | 99 | 487 |
| Coverage (km2) | 250 | |
| Incident angle | horizontal (~45°) to vertical (~23°) | |
| Range (m) | 5 | |
| Azimuth resolution (m) | 20 | |
Publisher’s Note: MDPI stays neutral with regard to jurisdictional claims in published maps and institutional affiliations. |
© 2022 by the authors. Licensee MDPI, Basel, Switzerland. This article is an open access article distributed under the terms and conditions of the Creative Commons Attribution (CC BY) license (https://creativecommons.org/licenses/by/4.0/).
Share and Cite
Hussain, M.A.; Chen, Z.; Zheng, Y.; Shoaib, M.; Ma, J.; Ahmad, I.; Asghar, A.; Khan, J. PS-InSAR Based Monitoring of Land Subsidence by Groundwater Extraction for Lahore Metropolitan City, Pakistan. Remote Sens. 2022, 14, 3950. https://doi.org/10.3390/rs14163950
Hussain MA, Chen Z, Zheng Y, Shoaib M, Ma J, Ahmad I, Asghar A, Khan J. PS-InSAR Based Monitoring of Land Subsidence by Groundwater Extraction for Lahore Metropolitan City, Pakistan. Remote Sensing. 2022; 14(16):3950. https://doi.org/10.3390/rs14163950
Chicago/Turabian StyleHussain, Muhammad Afaq, Zhanlong Chen, Ying Zheng, Muhammad Shoaib, Junwei Ma, Ijaz Ahmad, Aamir Asghar, and Junaid Khan. 2022. "PS-InSAR Based Monitoring of Land Subsidence by Groundwater Extraction for Lahore Metropolitan City, Pakistan" Remote Sensing 14, no. 16: 3950. https://doi.org/10.3390/rs14163950