Article

A Controllable Suppression Jamming Method against SAR Based on Active Radar Transponder

1
National Key Laboratory of Microwave Imaging Technology, Aerospace Information Research Institute, Chinese Academy of Sciences, Beijing 100190, China
2
School of Electronic, Electrical and Communication Engineering, University of Chinese Academy of Sciences, Beijing 100049, China
3
Beijing Remote Sensing Information Institute, Beijing 100192, China
*
Author to whom correspondence should be addressed.
Remote Sens. 2022, 14(16), 3949; https://doi.org/10.3390/rs14163949
Submission received: 8 July 2022 / Revised: 5 August 2022 / Accepted: 11 August 2022 / Published: 14 August 2022
(This article belongs to the Special Issue Recent Progress and Applications on Multi-Dimensional SAR)

Abstract

:
A chirp-mismatch echo signal can be generated by exchanging the I and Q baseband signals of a received SAR signal. In this paper, the basic generation principles of a chirp-mismatch echo signal are analyzed. Then, a suppression jamming method with controllable jamming position and coverage area is proposed. This method firstly performs chirp-mismatch processing on the received SAR signals, then controls the range jamming coverage and center position through range shift-frequency modulation and time delay, and controls the azimuth jamming coverage and center position through motion modulation and azimuth shift-frequency modulation. Theoretical analysis and simulation results show that this method can effectively control the location and coverage of a jamming result without convolution modulation, and it is easy to implement in engineering. The simulation results verify the correctness of the theoretical model, which can provide a basis for the implementation and application of SAR jamming based on the active radar transponder.

1. Introduction

Synthetic aperture radar (SAR) can perform all-day, all-weather and high-resolution imaging of ground targets, and has many advantages such as high processing gain, long-distance observation and multi-polarization, so it has been widely used in marine observation, agriculture and forestry development, terrain mapping and intelligence reconnaissance, etc. [1]. With the in-depth development of SAR imaging technology, especially in the military field, SAR has become key equipment for remote sensing data information acquisition [2]. In order to protect important targets and regions, research on SAR jamming technology has become an important topic in the field of radar countermeasures. In this paper, the controllable suppression jamming method against a SAR system based on active radar transponder is proposed and verified. First of all, the jamming realization principles based on active radar transponder are analyzed. Then, a suppression jamming method with a flexible and controllable jamming area and position is proposed and analyzed theoretically. Finally, the verification simulations of the proposed suppression jamming method are performed based on airborne SAR raw echo data. The simulation results are consistent with the theoretical analysis, which verifies the correctness of the theoretical model and can provide a basis for the jamming application and implementation of an active radar transponder.
According to the energy source of the jamming signal, SAR jamming can be mainly divided into passive jamming and active jamming [3]. Passive jamming refers to jamming methods in which the jammer itself can only reflect the electromagnetic wave and cannot actively emit jamming signals. Active jamming refers to the jamming methods in which jamming equipment can actively transmit or forward electromagnetic signals. According to the effect of the jamming method, SAR jamming can be mainly divided into suppression jamming [4,5,6,7,8] and deceptive jamming [9,10,11,12,13,14,15]. Suppression jamming submerges the original echo signals by launching high-power jamming signals. Deceptive jamming utilizes jamming signals to generate false targets or scenes. In the suppression jamming method of the SAR system, traditional noise jamming transmits high-power noise jamming signals to reduce the signal-to-noise ratio of SAR image. This kind of jamming method is simple to implement, but cannot control the position and suppression area of jamming result [16]. The suppression jamming methods with convolution modulation can control the suppression area and position of the jamming result precisely, but the complexity of the convolution algorithm is large and the difficulty of jamming implementation is high [17,18,19]. Thus, it is necessary to work on a controllable suppression jamming method with small computation and easy realization.
Reference [20] analyzes and simulates the variation characteristics of the jamming effect of shift-frequency jamming under different frequency shift amounts. Reference [21] establishes the imaging model of a uniformly moving target and analyzes the performance of the jamming method base on uniform motion modulation. However, these jamming methods can only generate false targets in the range or azimuth direction. In the reference [22], the imaging model of chirp-mismatch echo signal is established, and the feasibility of a jamming method based on chirp-mismatch processing is analyzed. The active radar transponder can produce a suppression jamming effect by transmitting a chirp-mismatch echo signal, but cannot control the suppression area of the imaging result of a chirp-mismatch echo signal. Based on the above background, a suppression jamming method with a flexible and controllable jamming position and suppression area is proposed and verified in this paper. This jamming method firstly performs chirp-mismatch processing on the received SAR signals, then controls the range jamming coverage and position via range shift-frequency modulation and time delay, respectively, while controlling the azimuth jamming coverage and position via uniform motion modulation and azimuth shift-frequency modulation, respectively. This suppression jamming method is analyzed theoretically, and experimental simulations are performed to verify the theoretical analysis.
The organization of this paper is as follows. Section 2 elaborates on the jamming scenario and the jamming realization principle of an active radar transponder. In Section 3, the imaging model and the jamming effect of the proposed suppression jamming method are analyzed theoretically. Based on the theoretical analysis, the effectiveness of proposed jamming method, the influence of reconnaissance errors and the suppression jamming performance are simulated, respectively, in Section 4. The conclusions of this paper are provided in Section 5.

2. Jamming Realization Principles Based on Active Radar Transponder

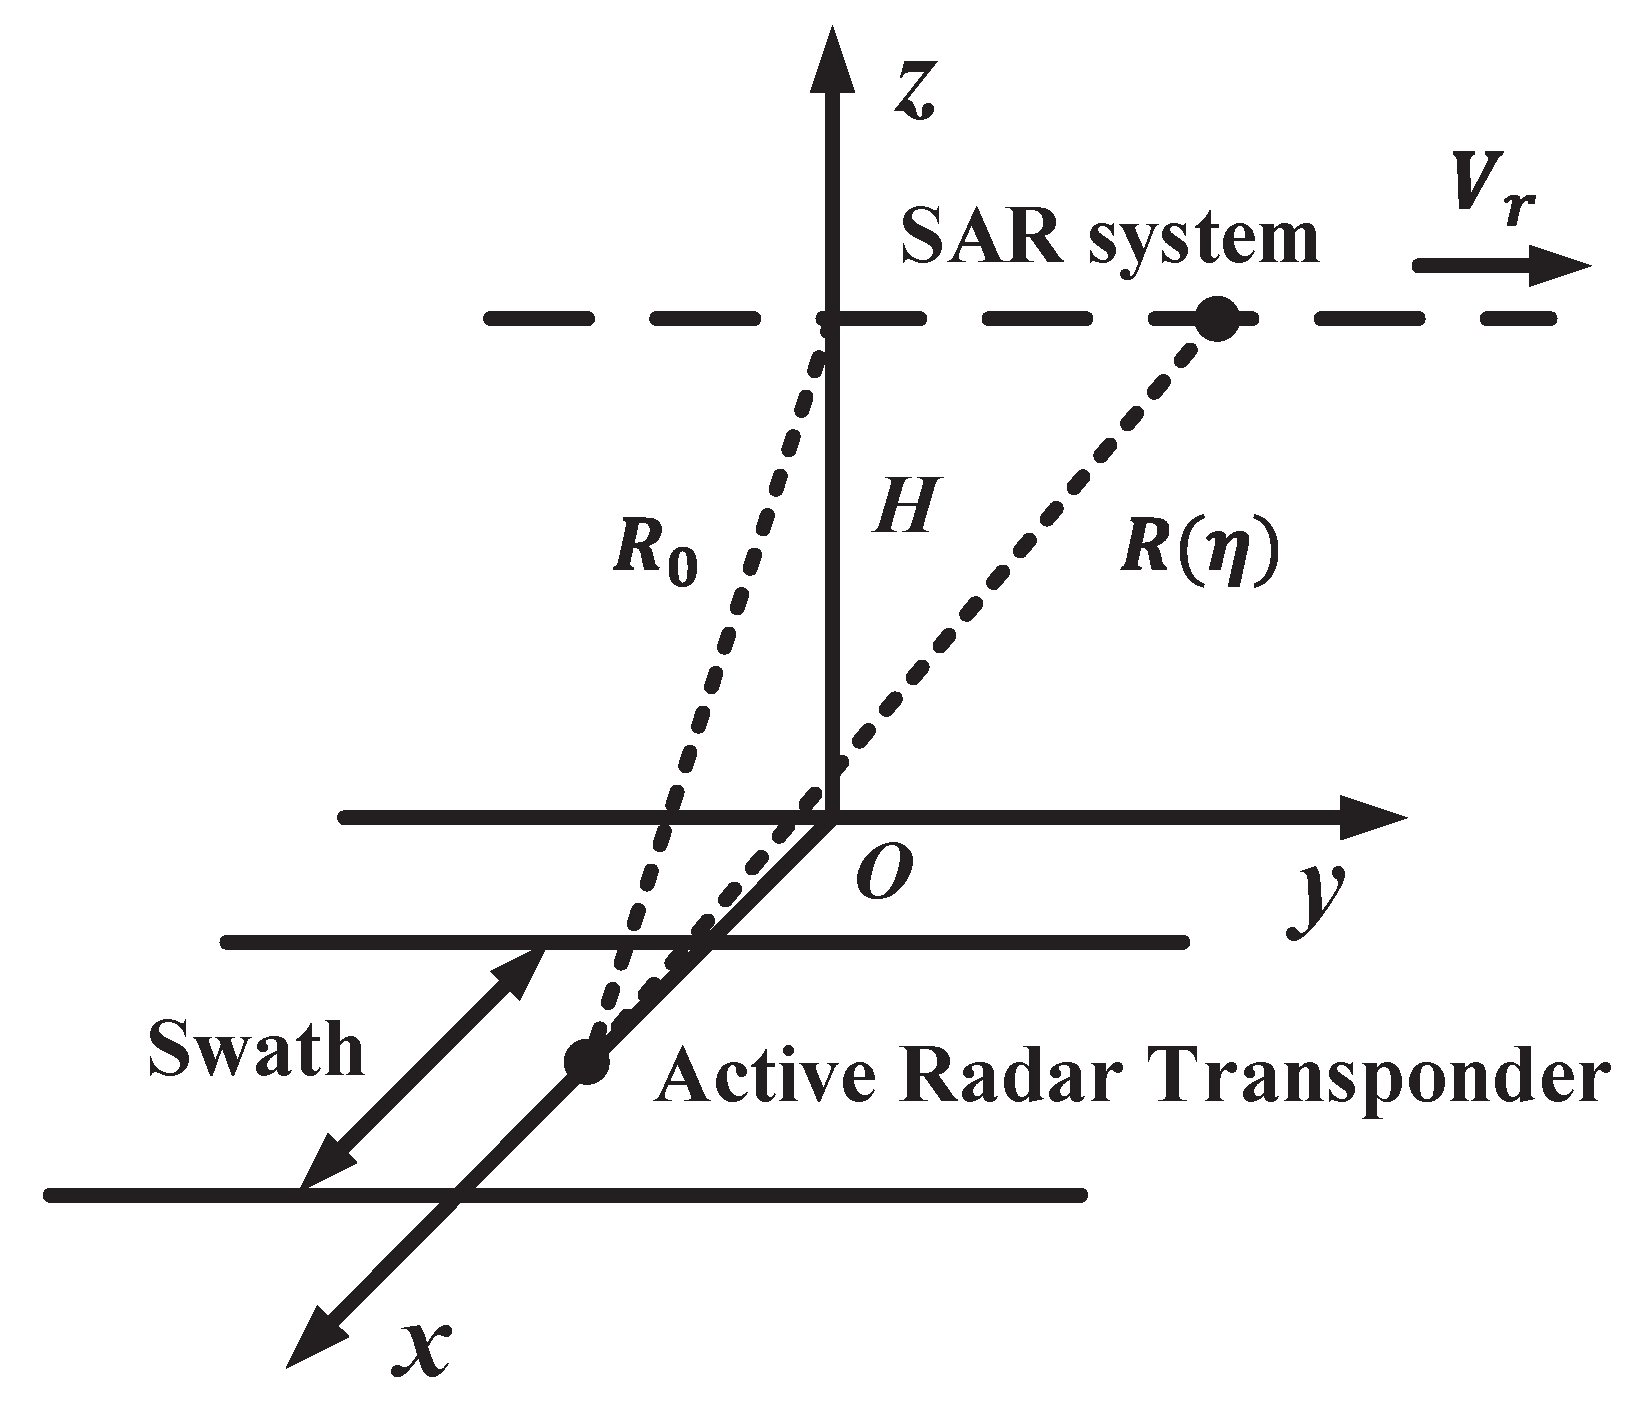
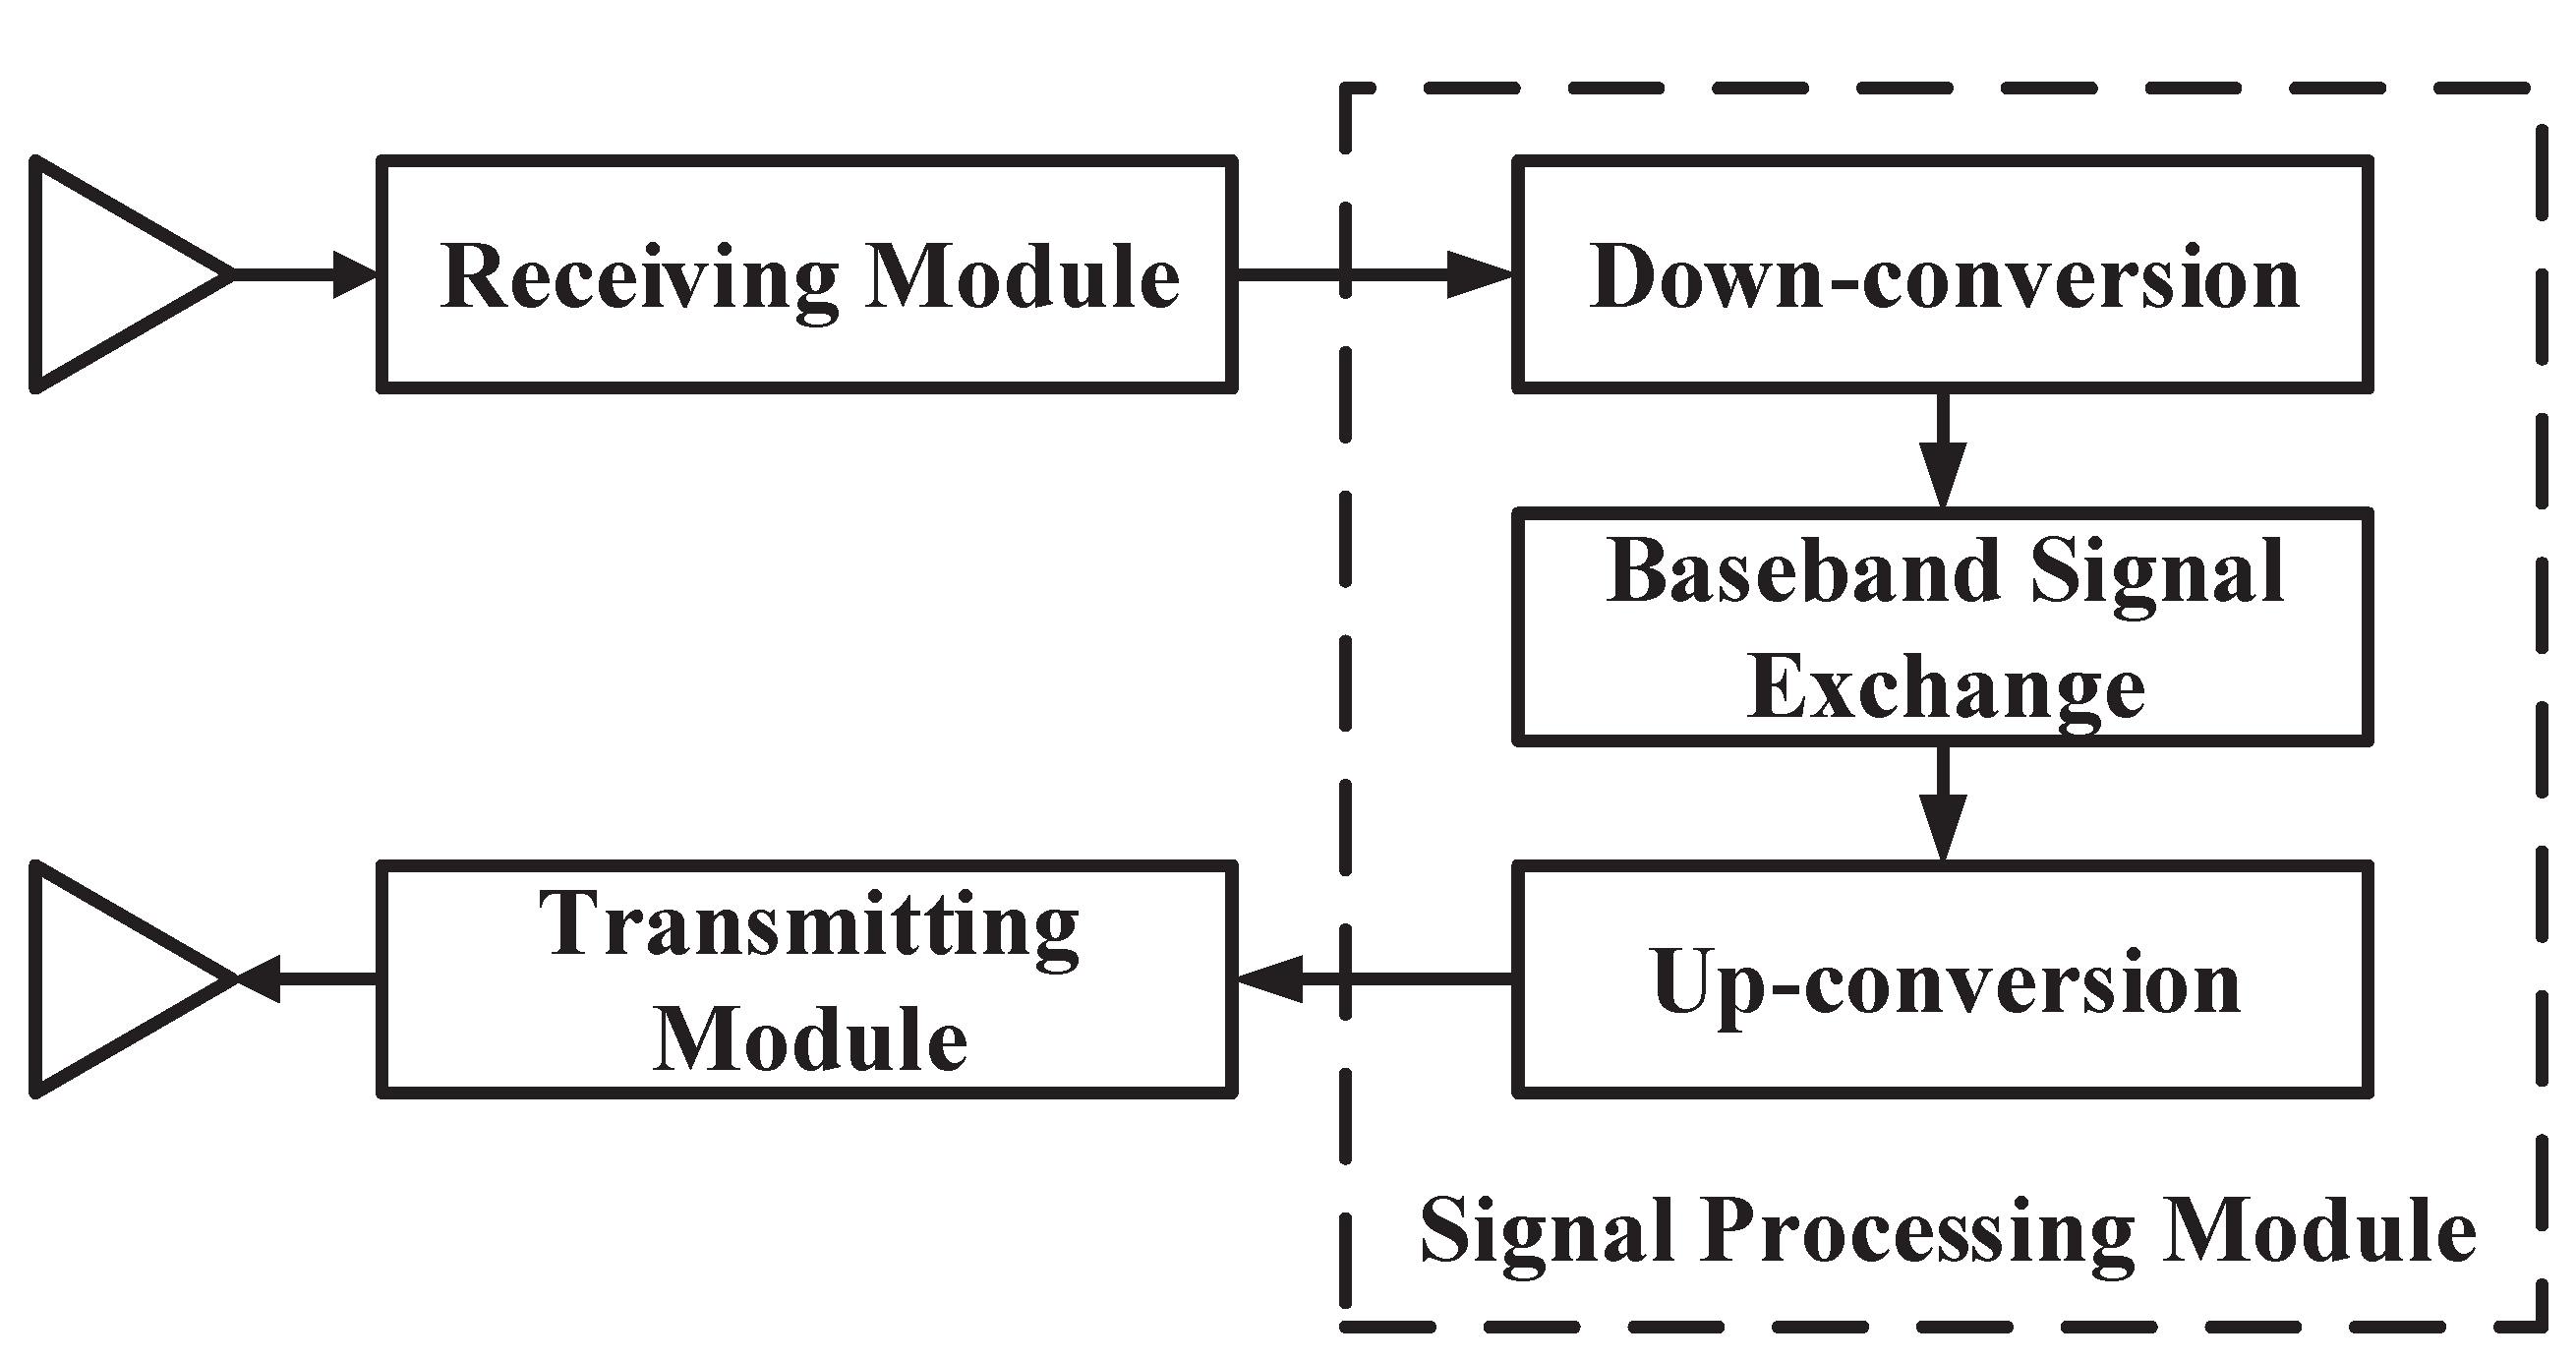
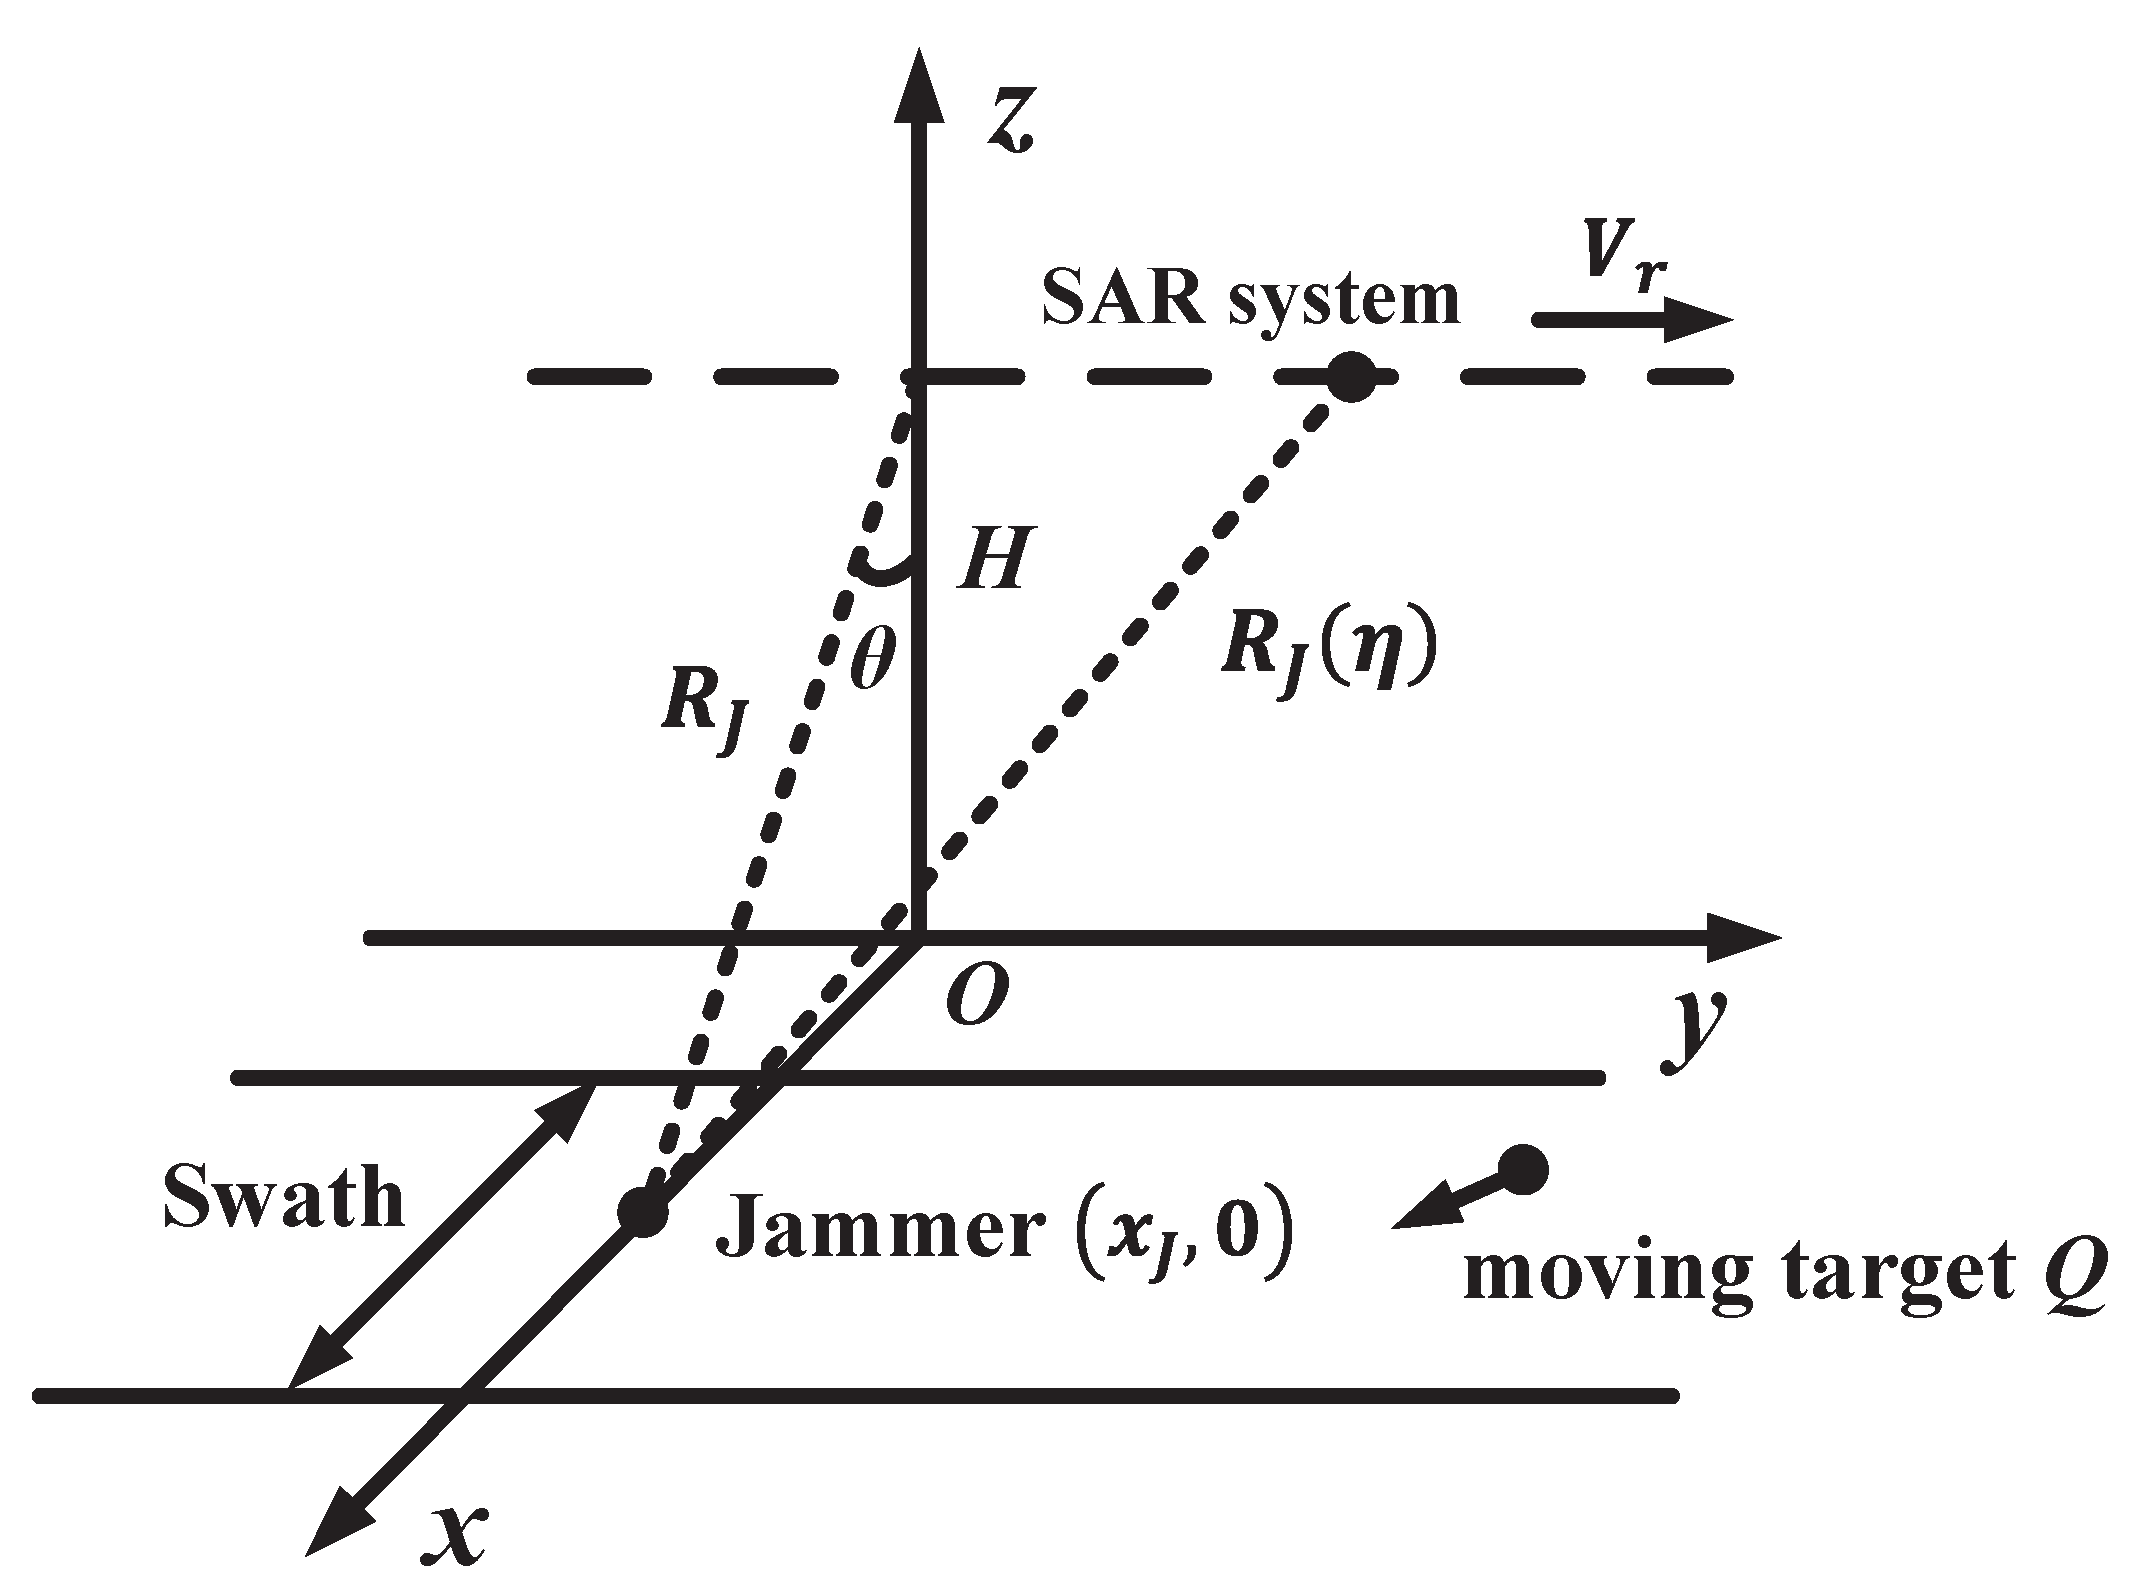
2.1. Analysis of Jamming Scenario and Active Radar Transponder System

The geometric model of a jamming scenario based on an active radar transponder is shown in Figure 1. The airborne SAR system is assumed to be side-looking strip mode, the effective speed is denoted as V r , the flight altitude is denoted as H and the azimuth slow time is denoted as η . Then, the coordinate system is established and the ground projection of the flight platform is set as the coordinate origin and denoted as O when the azimuth slow time η = 0 . The motion direction of SAR system is set as y-axis positive and the direction perpendicular to the track is set as x-axis positive.
Assuming that the active radar transponder is located at the center of the swath along the x-axis, and the nearest slant range between active radar transponder and SAR system is denoted as R 0 , the instantaneous slant range between the active radar transponder and the SAR system can be expressed as [1]
R ( η ) = R 0 2 + V r 2 η 2 R 0 + V r 2 η 2 2 R 0
The LFM signal emitted by SAR system is
s ( τ ) = rect τ T r cos 2 π f 0 τ + π K r τ 2
where the range time is denoted as τ , the time width is denoted as T r , the carrier frequency of the transmitted signal of the SAR system is denoted as f 0 and the chirp rate is denoted as K r .

2.2. Generation Principle of Chirp-Mismatch Echo Signal

The chirp-mismatch echo signal can be generated by exchanging the IQ baseband signal of the received SAR signal [23], and the principle diagram of chirp-mismatch echo signal generation is shown in Figure 2. The active radar transponder system can be mainly divided into three parts: the receiving module, the signal processing module and the transmitting module. The receiving module receives the SAR signal and transmits it to the signal processing module. The signal processing module first performs orthogonal demodulation on the SAR signal to achieve down-conversion processing, then exchanges the I and Q baseband signals of the SAR signal and performs complex addition. Finally, it performs orthogonal modulation on the resulting signal to achieve up-conversion processing, thereby realizing the chirp-mismatch processing of the received SAR signal. Then, the processed signal is forwarded to the SAR system by the transmitting module after power amplification.
The emitted LFM signal of the SAR system, which is shown in Equation (2), is received by active radar transponder and quadrature demodulated into I and Q baseband signals. The I and Q baseband signals are denoted as s r i τ , η and s r q τ , η , respectively. The expressions of I and Q signals are presented as follows
s r i ( τ , η ) = rect τ R ( η ) / c T r · cos 2 π f 0 R ( η ) c + π K r τ R ( η ) c 2
s r q ( τ , η ) = rect τ R ( η ) / c T r · sin 2 π f 0 R ( η ) c + π K r τ R ( η ) c 2
Then, the baseband signals of the I and Q channels are exchanged and complexly added. Finally, the up-conversion and power amplification are performed to obtain the chirp-mismatch echo signal transmitted by the active radar transponder. The expression of the chirp-mismatch echo signal is presented as Equation (5).
s t c ( τ , η ) = s r q ( τ , η ) + j s r i ( τ , η ) = rect τ R ( η ) / c T r · exp j π 2 · exp j 2 π f 0 τ + R ( η ) c π K r τ R ( η ) c 2
The chirp-mismatch echo signal is received by the SAR system and demodulated to the baseband signal. The expression of the baseband signal is shown below.
s t m ( τ , η ) = A 0 rect τ 2 R ( η ) / c T r rect η T a · exp j π 2 π K r τ 2 R ( η ) c 2
where A 0 denotes the amplitude of the baseband signal and T a denotes the synthetic aperture time. Compared with the original echo, the chirp rate of the echo signal is reversed and the chirp-mismatch echo signal lacks the phase item of exp j 4 π f 0 R ( η ) / c , so it is considered that the azimuth doppler information of chirp-mismatch echo signal is lost.

2.3. Principle Analysis of Motion Modulation Jamming

The geometric model of motion modulation jamming in general is shown in Figure 3. The SAR platform moves in a straight line at a constant speed along the positive y-axis at a speed V r ; the jammer is set to be located in the center of the swath. The coordinate of jammer is x J , 0 and x J = H · tan θ ; then, the shortest slant range between the jammer and the SAR system is R J = x J 2 + H 2 .
In order to facilitate the subsequent theoretical analysis, this section simplifies the jamming model and assumes that the moving target Q moves at a constant velocity of V y along the azimuth direction, and the coordinates of the moving target are the same as that of the jammer when the azimuth slow time η = 0 . Then, the echo signal characteristics of the moving target Q and the imaging model of jamming signal with azimuth uniform motion modulation are analyzed. Based on the geometric model of motion modulation jamming, the instantaneous slant range between the moving target Q and the SAR platform is
R Q ( η ) = R J 2 + V y η V r η 2 R J + V y V r 2 2 R J η 2
Since at any time, the instantaneous slant range between the jammer and the SAR system is
R J ( η ) = R J 2 + V r 2 η 2 R J + V r 2 2 R J η 2
Therefore, the deviation of instantaneous slant range between the moving target Q and the jammer is
Δ R r = R Q ( η ) R J ( η ) V y η V r η 2 2 R J V r 2 η 2 2 R J = V y 2 2 V y V r 2 R J η 2
Then, the additional phase required for the azimuth uniform motion modulation can be expressed as
Δ φ = 4 π λ Δ R r = 2 π λ R J V y 2 2 V y V r η 2
The jammer modulates the above phase term on the received SAR signal to obtain the motion modulation jamming signal. According to the transmitted signal of the SAR system shown in Equation (2), the baseband signal expression of the jamming signal received and demodulated by the SAR system is as follows
s J ( τ , η ) = A J · rect η T a rect τ 2 R J ( η ) / c T r · exp j 4 π R J ( η ) λ + j π K r τ 2 R J ( η ) c 2 j 2 π λ R J V y 2 2 V y V r η 2
where A J is the amplitude of the jamming signal. Based on the imaging characteristics of uniformly moving targets [21,24,25], the imaging result of jamming signal of azimuth uniform motion modulation is as follows
I ( τ , η ) = 1 τ * T r 1 η * T a · sinc π μ r τ * T r τ * · sinc π μ a η * T a η *
where, τ * = τ 2 R J / c , η * = η η a m , η a m is the azimuth center time corresponding to the stationary phase point u * and the expression of η a m is
η a m = V y 2 2 V y V r V r 2 u *
According to the above results, it can be concluded that the imaging result of the jamming signal with azimuth uniform motion modulation is broadened in the azimuth direction, and the broadening amount is calculated as
Δ Y Q = V y 2 2 V y V r V r T a
The azimuth uniform motion modulation of the SAR signal can change the azimuth coverage of echo imaging results. Based on this characteristic, the azimuth uniform motion modulation is performed on the chirp-mismatch echo signal in this paper, so as to control the azimuth coverage of jamming result.

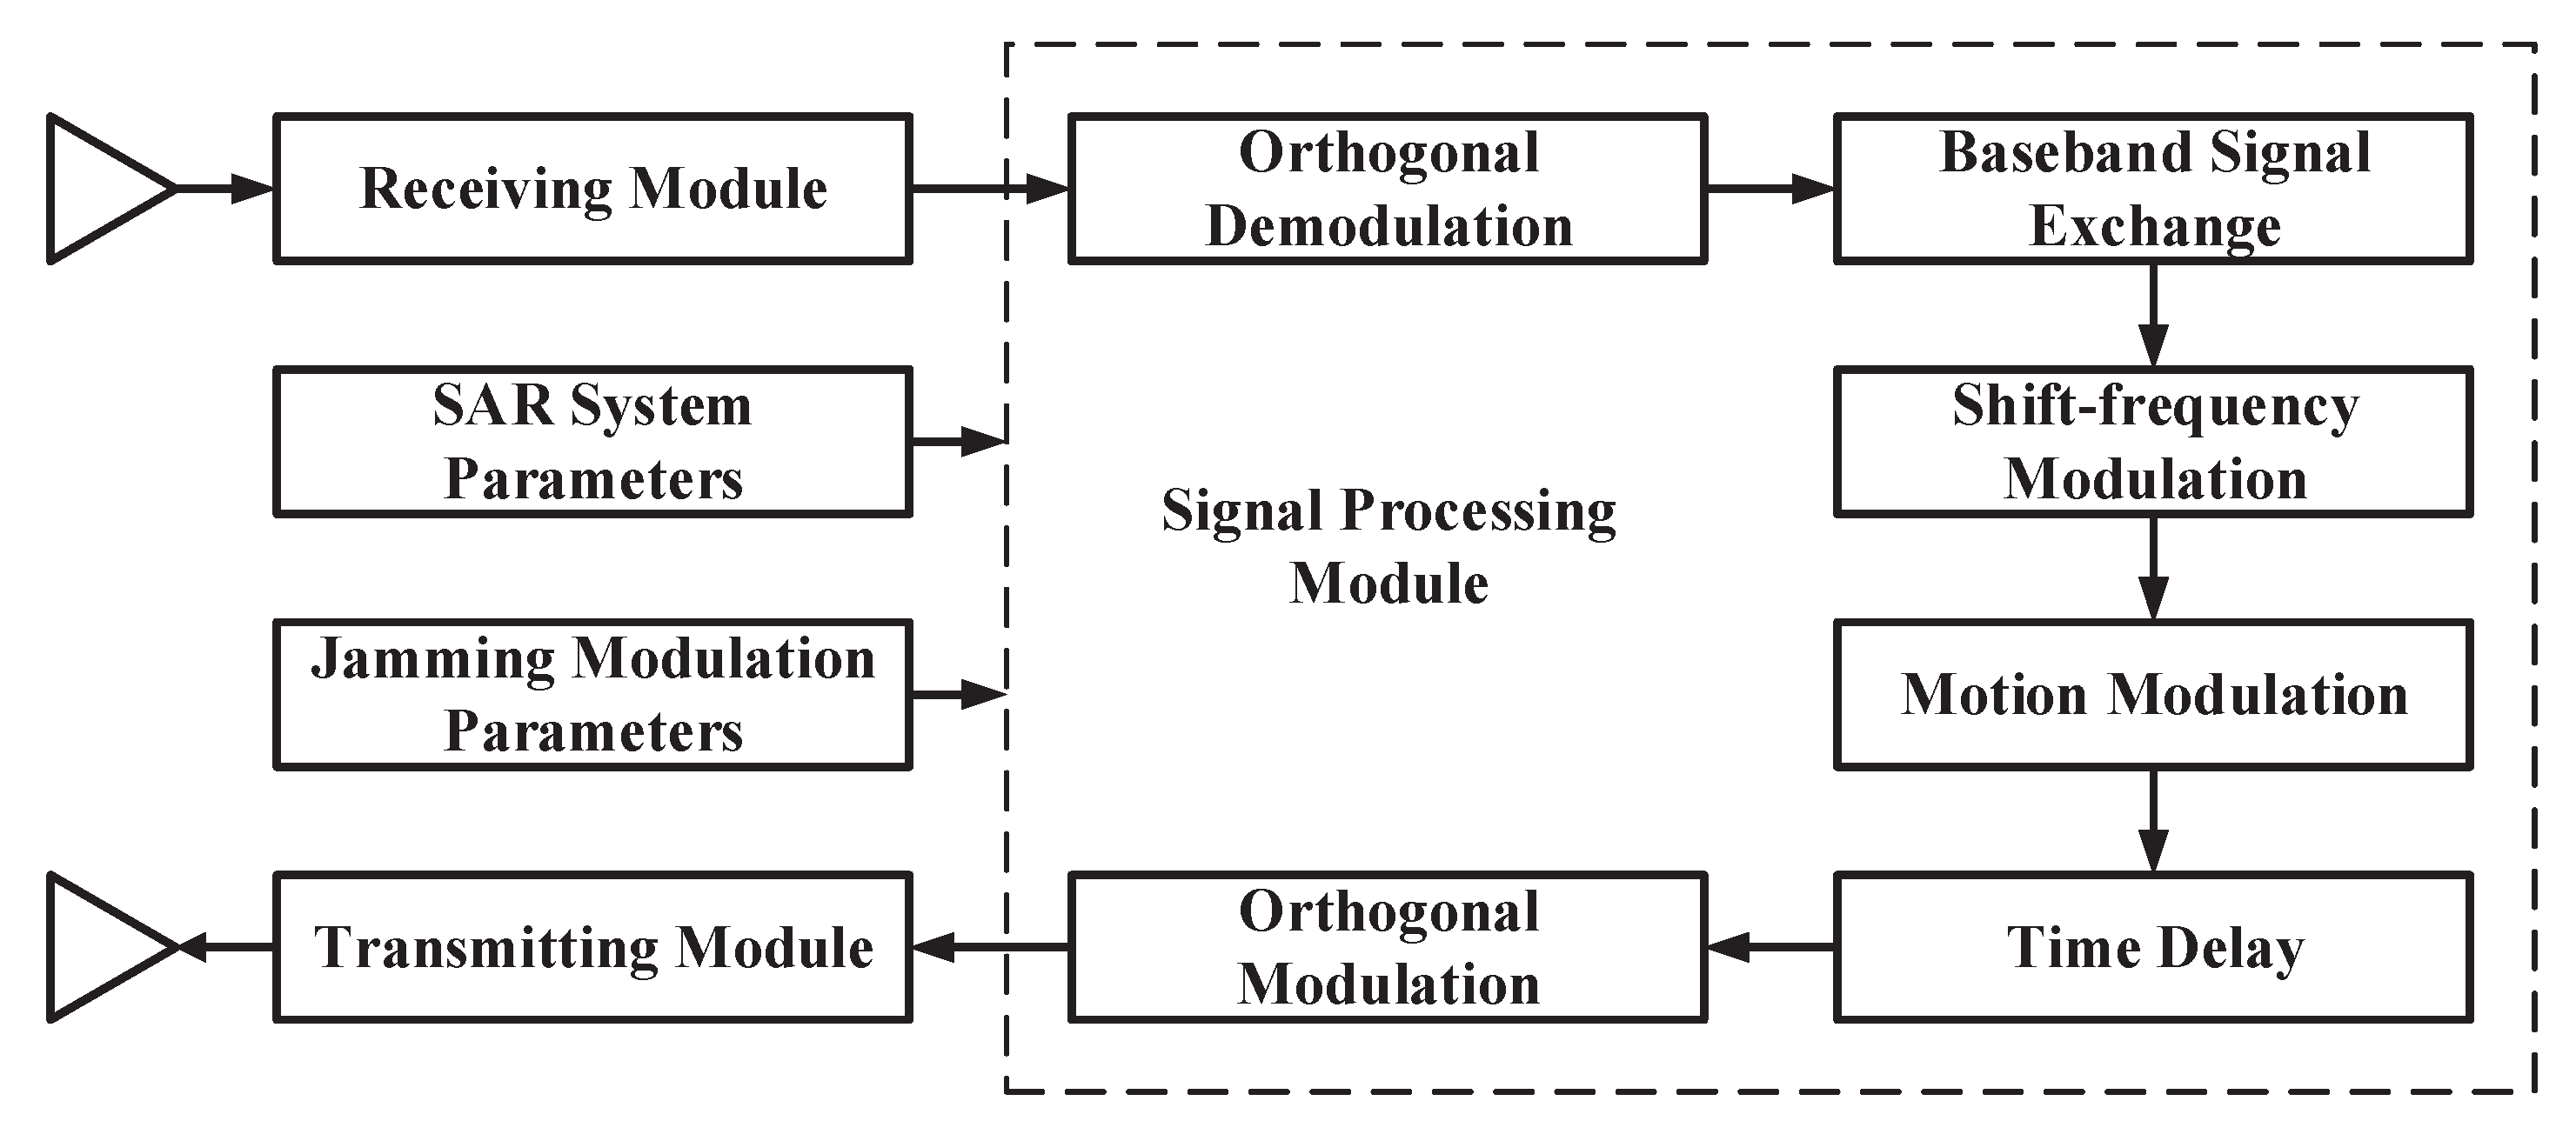
2.4. Generation Principle of Controllable Suppression Jamming Signal

In this paper, chirp-mismatch processing is combined with range shift-frequency modulation, azimuth shift-frequency modulation, azimuth uniform motion modulation and time delay to generate the controllable suppression jamming signal. Figure 4 shows the principle diagram of the controllable suppression jamming method.
The receiving module of the jammer receives the SAR signal and transmits it to the signal processing module. Then, the signal processing module performs parameter reconnaissance on the received SAR signal. Based on the detected SAR system parameters (SAR platform speed, carrier frequency, pulse timewidth, chirp rate, PRF, etc.) and the jamming modulation parameters, the signal processing module performs a series of operations, including orthogonal demodulation, baseband signal exchange, shift-frequency modulation, motion modulation, time delay and orthogonal modulation, on the received SAR signal to generate the required jamming signal. Finally, the obtained jamming signal is forwarded to the target SAR system through the transmitting module. Thus, the obtained suppression jamming signal can be expressed as
s a t ( τ , η ) = A 1 rect τ τ 1 R ( η ) / c T r · exp j π 2 · exp j 2 π f 0 + f d r τ τ 1 + 2 π f d a η + 2 π f 0 R ( η ) c · exp j π K r τ τ 1 R ( η ) c 2 + 2 π · V y 2 2 V y V r λ R 0 η 2
where A 1 is the amplitude of the suppression jamming signal, τ 1 is the time delay, f d r is the frequency shift amount in the range direction, f d a is the frequency shift amount in the azimuth direction and exp j 2 π V y 2 2 V y V r / λ R 0 η 2 is the additional phase term of azimuth uniform motion modulation.

3. Theoretical Analysis of Controllable Suppression Jamming Method

3.1. Imaging Model of Controllable Suppression Jamming Method

The controllable suppression jamming signal is received and demodulated by the SAR system, and the baseband signal is obtained as
s j r ( τ , η ) = A 1 rect η T a rect τ τ 1 2 R ( η ) / c T r · exp j π 2 · exp j 2 π f d a η 2 π f 0 τ 1 2 π · V y 2 2 V y V r λ R 0 η 2 · exp j 2 π f d r τ τ 1 R ( η ) c π K r τ τ 1 2 R ( η ) c 2
Then, the range Fourier transform is performed to obtain the range spectrum of the jamming signal, and the result is presented as Equation (17).
S j r s f τ , η = A 1 rect η T a rect f τ f d r K r T r · exp j π 2 · exp j 2 π f d a η 2 π f 0 τ 1 2 π · V y 2 2 V y V r λ R 0 η 2 · exp j π f τ f d r 2 K r + 2 π f d r R ( η ) c 2 π f τ τ 1 + 2 R ( η ) c
The frequency domain matched filter is used to perform range pulse compression on the suppression jamming signal, and the expression of matched filter is
H r g f τ = rect f τ K r T r exp j π f τ 2 K r
It can be calculated that the frequency domain result of the range pulse compression of the suppression jamming signal is
S j r c f τ , η = A 1 rect η T a rect f τ f d r f d r 2 2 K r T r f d r · exp j π 2 2 π f 0 τ 1 · exp j π f τ f d r 2 K r + π f τ 2 K r 2 π f τ τ 1 + 2 R ( η ) c · exp j 2 π f d a η + 2 π f d r R ( η ) c 2 π · V y 2 2 V y V r λ R 0 η 2
Through the inverse Fourier transform of the above equation, the time domain result of the range pulse compression of the suppression jamming signal is obtained as follows
s j r c τ , η = A 1 rect η T a rect 1 2 · τ 2 R η 2 R η c c τ 1 T r f d r f d r K r K r · exp j π 2 2 π f 0 τ 1 + π f d r 2 2 K r 2 π · V y 2 2 V y V r λ R 0 η 2 · exp j 2 π f d a η + π f d r τ τ 1 π K r 2 τ 2 R ( η ) c τ 1 2
After the range cell migration correction, the time domain result of the range pulse compression of the suppression jamming signal can be converted into
s j r c τ , η = A 1 rect η T a rect 1 2 · τ 2 R 0 2 R 0 c c τ 1 T r f d r f d r K r K r · exp j π 2 2 π f 0 τ 1 + π f d r 2 2 K r 2 π · V y 2 2 V y V r λ R 0 η 2 · exp j 2 π f d a η + π f d r τ τ 1 π K r 2 τ 2 R ( η ) c τ 1 2
Based on the above results, it can be seen that the suppression area and the center position offset of the suppression jamming result in the range direction are as follows
δ l r = T r f d r K r · c
Δ r l = c 2 · τ 1
Therefore, the range coverage area of the jamming result decreases with the increase in the range frequency shifts, and the range center position offset of the jamming result increases with the increase in the time delay. Assuming that the time domain representation of the azimuth matched filter is expressed as
h a ( η ) = rect η T a exp j π K a η 2
then the matched filtering process in the azimuth direction can be solved by convolution calculation in the time domain.
s j r a ( τ , η ) = s j r c ( τ , η ) h a ( η ) = s j r c ( τ , u ) h a ( η u ) d u
According to Equations (21) and (24), the above result can be transformed into
s j r a ( τ , η ) = A 1 rect 1 2 · τ 2 R 0 / c τ 1 T r f d r / K r · exp j π 2 + π f d r 2 2 K r + π f d r τ τ 1 2 π f 0 τ 1 · rect u T a rect η u T a · exp j θ 1 ( u ) d u
where the expression of θ 1 ( u ) is obtained as follows
θ 1 ( u ) = 2 π f d a u 2 π · V y 2 2 V y V r λ R 0 u 2 π K r 2 τ 2 R ( u ) c τ 1 2 + π K a ( η u ) 2
Based on the Fresnel approximation and the analysis in Section 2.3, the above equation can be solved with the principle of stationary phase, and the phase relationship at the stationary phase point u * can be obtained as
d θ 1 ( u ) d u u = u * = 2 π f d a + 2 V r 2 c R 0 π K r τ 2 R u * c τ 1 u * 2 π K a η u * 4 π · V y 2 2 V y V r λ R 0 u *
When d θ 1 ( u ) / d u u = u * = 0 , the azimuth time η l a corresponding to the stationary phase point u * is
η l a = f d a K a 2 · V y 2 2 V y V r λ R 0 K a u * + K r V r 2 c R 0 K a τ 2 R u * c τ 1 u * + u *
The constant term in the above expression will cause the azimuth center position offset of the jamming result, and the primary term of u * will cause the azimuth broadening of the jamming result. The azimuth center position offset and the broadening of jamming result can be expressed, respectively, as follows
η 0 = f d a K a · V r = λ R 0 2 V r f d a
δ l a = 1 V y 2 2 V y V r V r 2 T a V r + K r 2 f 0 τ 2 R 0 2 + V r 2 T a 2 c τ 1 T a V r
where, T r f d r / K r τ 2 R 0 / c τ 1 T r f d r / K r . Thus, the azimuth center position and coverage area of the jamming result can be controlled, respectively, through the azimuth frequency shift amount and the velocity information of the azimuth motion modulation. Additionally, the variation in the azimuth coverage of the jamming result along the range direction is
Δ δ l a = K r f 0 T r f d r K r T a V r
When the bandwidth of SAR signal is much smaller than the radar operating frequency, the influence of the azimuth coverage variation can be ignored, so the jamming area can be approximated as a rectangular area. Combined with Equation (22), the total suppression area of the jamming result can be expressed as
S l = δ l r · δ l a

3.2. Analysis of the Influence of Reconnaissance Errors

This section analyzes the influence of the reconnaissance errors so as to reflect the dependence of the jamming effect on the reconnaissance parameters. The reconnaissance parameters required mainly include the pulse timewidth T r , the chirp rate K r , the wavelength λ , the SAR system velocity V r and the shortest slant range R 0 between the SAR system and the transponder. Suppose the absolute reconnaissance errors of the above parameters are Δ T r , Δ K r , Δ λ , Δ V r and Δ R 0 , respectively, and the relative errors are ε T r = Δ T r / T r , ε K r = Δ K r / K r , ε λ = Δ λ / λ , ε V r = Δ V r / V r , ε R 0 = Δ R 0 / R 0 , respectively. Then, the range coverage, the azimuth center position and the azimuth coverage area of the jamming results can be expressed as follows [21,26]
δ l r = 1 ε T r ε T r ε K r T r 1 + ε K r f d r K r · c
η 0 = 1 + ε V r 1 + ε λ 1 + ε R 0 λ R 0 2 V r f d a
δ l a = T a V r 1 1 + ε λ 1 + ε R 0 1 + 2 V y V r 2 V y V r V y 2 ε V r V y 2 2 V y V r V r 2 T a V r + K r 2 f 0 τ 2 R 0 2 + V r 2 T a 2 c τ 1 T a V r
Based on the above results, it can be seen that the reconnaissance errors will cause the actual jamming result to deviate from the predetermined effect: the range coverage of the jamming result is inversely proportional to ϵ T r and ϵ K r , the azimuth center position of the jamming result is proportional to ϵ V r and inversely proportional to ϵ λ and ϵ R 0 and the azimuth coverage of jamming result is proportional to ϵ λ and ϵ R 0 ; meanwhile, when V y < 0 , the azimuth coverage of jamming result is inversely proportional to ϵ V r , when V y > 0 , the azimuth coverage of jamming result is proportional to ϵ V r .

3.3. Analysis of the Variation in Jamming Performance with Modulation Parameters

3.3.1. Range Shift-Frequency Modulation

Due to the chirp-mismatch processing, the jamming signal of proposed method is completely mismatched with the range matched filter of the SAR system, so the range pulse compression of the jamming signal is the incoherent processing [27]. The range shift-frequency modulation of the suppression jamming signal will cause the frequency spectrum of the suppression jamming signal to be mismatched with the frequency band of the matched filter, which will eventually lead to range bandwidth loss and the energy reduction of the jamming result.
According to the calculation and analysis of Equation (19), when the range frequency shift amount is zero, the range bandwidth of the jamming result is K r T r and the total suppression area of the jamming result is about T r c · T a V r . Assuming that the energy of the jamming result at this time is E, then it can be calculated that the energy per unit area of the jamming result in the suppression area is
B 0 = E T r c · T a V r
When the range frequency shift amount is f d r , the range bandwidth of the jamming result is K r T r f d r and the energy of the jamming result is K r T r f d r / K r T r · E . At this time, the total suppression area of the jamming result is about T r f d r / K r c · T a V r ; thus, the energy per unit area of the jamming result in the suppression area can be obtained as
B 1 = K r T r f d r K r T r E · 1 T r f d r / K r c · T a V r = E T r c · T a V r
It can be concluded that when the energy of the jamming signal is constant, the energy per unit area of the jamming result in the suppression area does not change with the range frequency shift amount.

3.3.2. Velocity Information of Azimuth Motion Modulation

The azimuth pulse compression of the jamming signal shows that the additional phase term of the motion modulation can change the degree of mismatch between the jamming signal and the azimuth matched filter of the SAR system.
According to Equations (21) and (24), the azimuth frequency modulation rate of the suppression jamming signal is 2 V v 2 2 V v V r / λ R 0 and the frequency modulation rate of the azimuth matched filter of the SAR system is 2 V r 2 / λ R 0 . Therefore, the mismatch of the frequency modulation rate in the azimuth pulse compression of the suppression jamming signal can be expressed as
Δ K a z = 2 V r 2 λ R 0 2 V y 2 2 V y V r λ R 0 = 2 V r 2 V y 2 + 2 V y V r λ R 0
Combined with Equation (31), it can be concluded that the azimuth coverage of the jamming result decreases with the decrease in the mismatch of frequency modulation rate and the power of the jamming result in the coverage area increases as the azimuth coverage of the jamming result decreases.

4. Simulation Verification and Analysis of the Suppression Jamming Method

In this section, the simulation verification and analysis of the suppression jamming method are performed based on the side-looking strip mode airborne SAR system parameters shown in Table 1. Firstly, the effectiveness of the suppression jamming method is verified. Then, the control effect of the modulation parameters on the jamming results and the influence of the parameter reconnaissance error on the jamming results are analyzed, respectively. Finally, the variation characteristics of the jamming performance of proposed method with the modulation parameters are simulated and analyzed.

4.1. Validation of the Suppression Jamming Method

Firstly, the airborne SAR raw echo data under the condition of system parameters shown in Table 1 are used for imaging simulation, and the imaging result is shown in Figure 5. Meanwhile, the azimuth scope of the imaged scene is [ 1184 , 1184 ] m and the range scope is [23,486, 25,724] m. It should be noted that the original SAR echo data used in this paper are the baseband data after demodulation, and the jamming process of the active radar transponder to the target SAR system is simulated by manipulating the baseband data.
The active radar transponder is set at the center of the scene, and the position coordinate of the transponder is (24,649, 0). Then, jamming signals with different power are added to the raw data to simulate the jamming process of the active radar transponder against the SAR system. Finally, the imaging simulations of the obtained data are performed, respectively.
Figure 6 shows the imaging results of jamming data when the jamming to signal ratio (JSR) at the receiver of the SAR system is 0 dB, 3 dB, 6 dB and 9 dB, respectively. In the meantime, all the modulation parameters of the jamming signal, including the range frequency shift amount, the azimuth frequency shift amount, the velocity information of the azimuth motion modulation and the time delay, are set to zero.
Based on the simulation results shown in Figure 6, the suppression area of the jamming result is about 705 × 1005 m 2 , which is basically consistent with the theoretical value of 720 × 1020 m 2 calculated by Equation (33). Therefore, it is feasible to use this jamming method to achieve the suppression jamming effect.
In order to quantitatively study the effect of the suppression jamming method, this section utilizes the mean-normalized correlation measure and the structural similarity to evaluate the quality of the interfered SAR images under different jamming to signal ratios. The calculation methods of the two indicators are given below.
Assuming that P and Q represent the gray matrix of the original SAR image and the disturbed SAR image, respectively, the matrix size is assumed to be n × m ; then, the mean-normalized correlation measure can be expressed as [28]
r m = i = 1 n j = 1 m P i , j μ P Q i , j μ Q i = 1 n j = 1 m P i , j μ P 2 i = 1 n j = 1 m Q i , j μ Q 2
where μ P and μ Q denote the mean values of P and Q, respectively. The expressions of μ P and μ Q are presented as follows
μ P = 1 n × m i = 1 n j = 1 m P ( i , j )
μ Q = 1 n × m i = 1 n j = 1 m Q ( i , j )
The smaller the mean normalized correlation measure value, the greater the difference between the original image and the disturbed image, and the better the jamming effect.
The structural similarity of the SAR images before and after the disturbance can be compared through three indexes of brightness comparison, contrast comparison and structure comparison. The expressions of these indexes are presented as [29,30]
L ( P , Q ) = 2 μ P μ Q + C 1 μ P 2 + μ Q 2 + C 1
C ( P , Q ) = 2 σ P σ Q + C 2 σ P 2 + σ Q 2 + C 2
S ( P , Q ) = σ P Q + C 3 σ P σ Q + C 3
where L ( P , Q ) , C ( P , Q ) and S ( P , Q ) denote the brightness comparison, the contrast comparison and the structure comparison, respectively; σ P and σ Q denote the standard deviations of the gray matrix P and Q, respectively; and σ P Q is the covariance of the SAR image before and after disturbance. C 1 , C 2 and C 3 represent the minimum constants and are all set to zero in this paper. The expressions of σ P 2 , σ Q 2 , σ P Q are expressed as follows
σ P 2 = 1 n × m i = 1 n j = 1 m P ( i , j ) μ P 2
σ Q 2 = 1 n × m i = 1 n j = 1 m Q ( i , j ) μ Q 2
σ P Q = 1 n × m i = 1 n j = 1 m P ( i , j ) μ P Q ( i , j ) μ Q
Thus, the mathematical expression of SSIM ( P , Q ) is obtained as
SSIM ( P , Q ) = L ( P , Q ) C ( P , Q ) S ( P , Q )
The smaller the structural similarity value, the lower the structural similarity of SAR images before and after the interference, and the better the interference effect is.
Then, the mean-normalized correlation measure and the structural similarity are used to evaluate and analyze the performance of the suppression jamming signals under different jamming to signal ratios shown in Figure 6, respectively. The simulation results of the jamming performance evaluation are shown in Table 2.
According to the simulation results, with the increase in the jamming to signal ratio, the objective evaluation indexes of the disturbed image gradually decrease; that is, the quality of the disturbed image gradually decreases, which verifies the effectiveness of the suppression jamming method.
This section also simulates the jamming effect of Gaussian white noise with the jamming to signal ratio of 6 dB, and the obtained result is shown in Figure 7. In order to verify the high efficiency of the proposed jamming method, the energy of the Gaussian white noise is set to be the same as that of the jamming signal under the same jamming to signal ratio.
Comparing Figure 6c, it can be seen that the energy of Gaussian white noise jamming is dispersed in the whole azimuth, and the jamming effect is poor. However, the energy of the suppression jamming method proposed in this paper is more concentrated, and the jamming efficiency is higher.

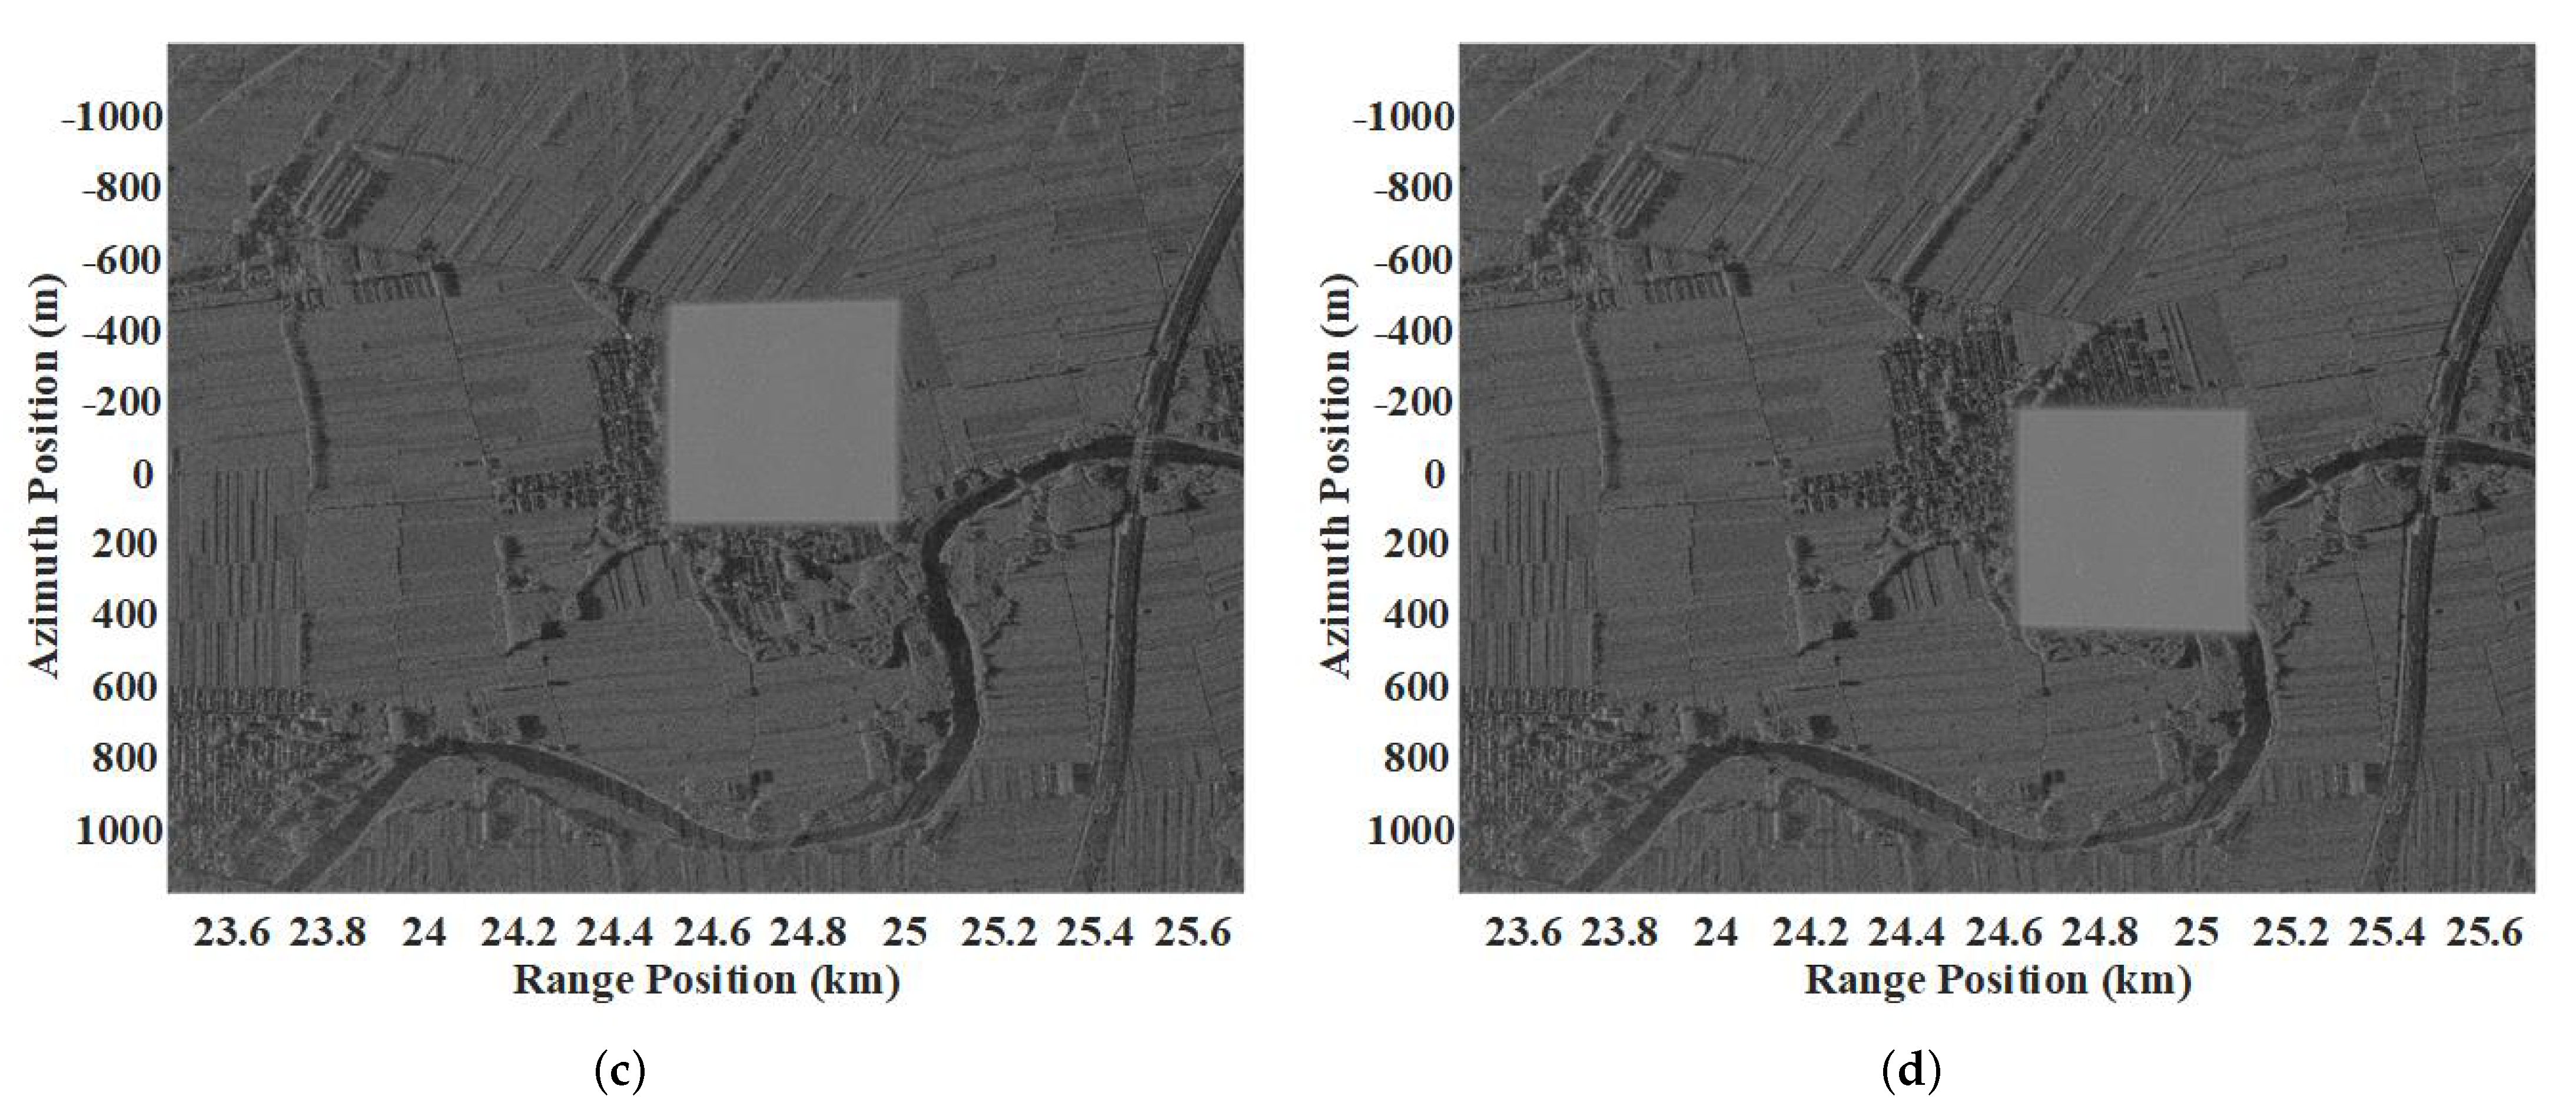
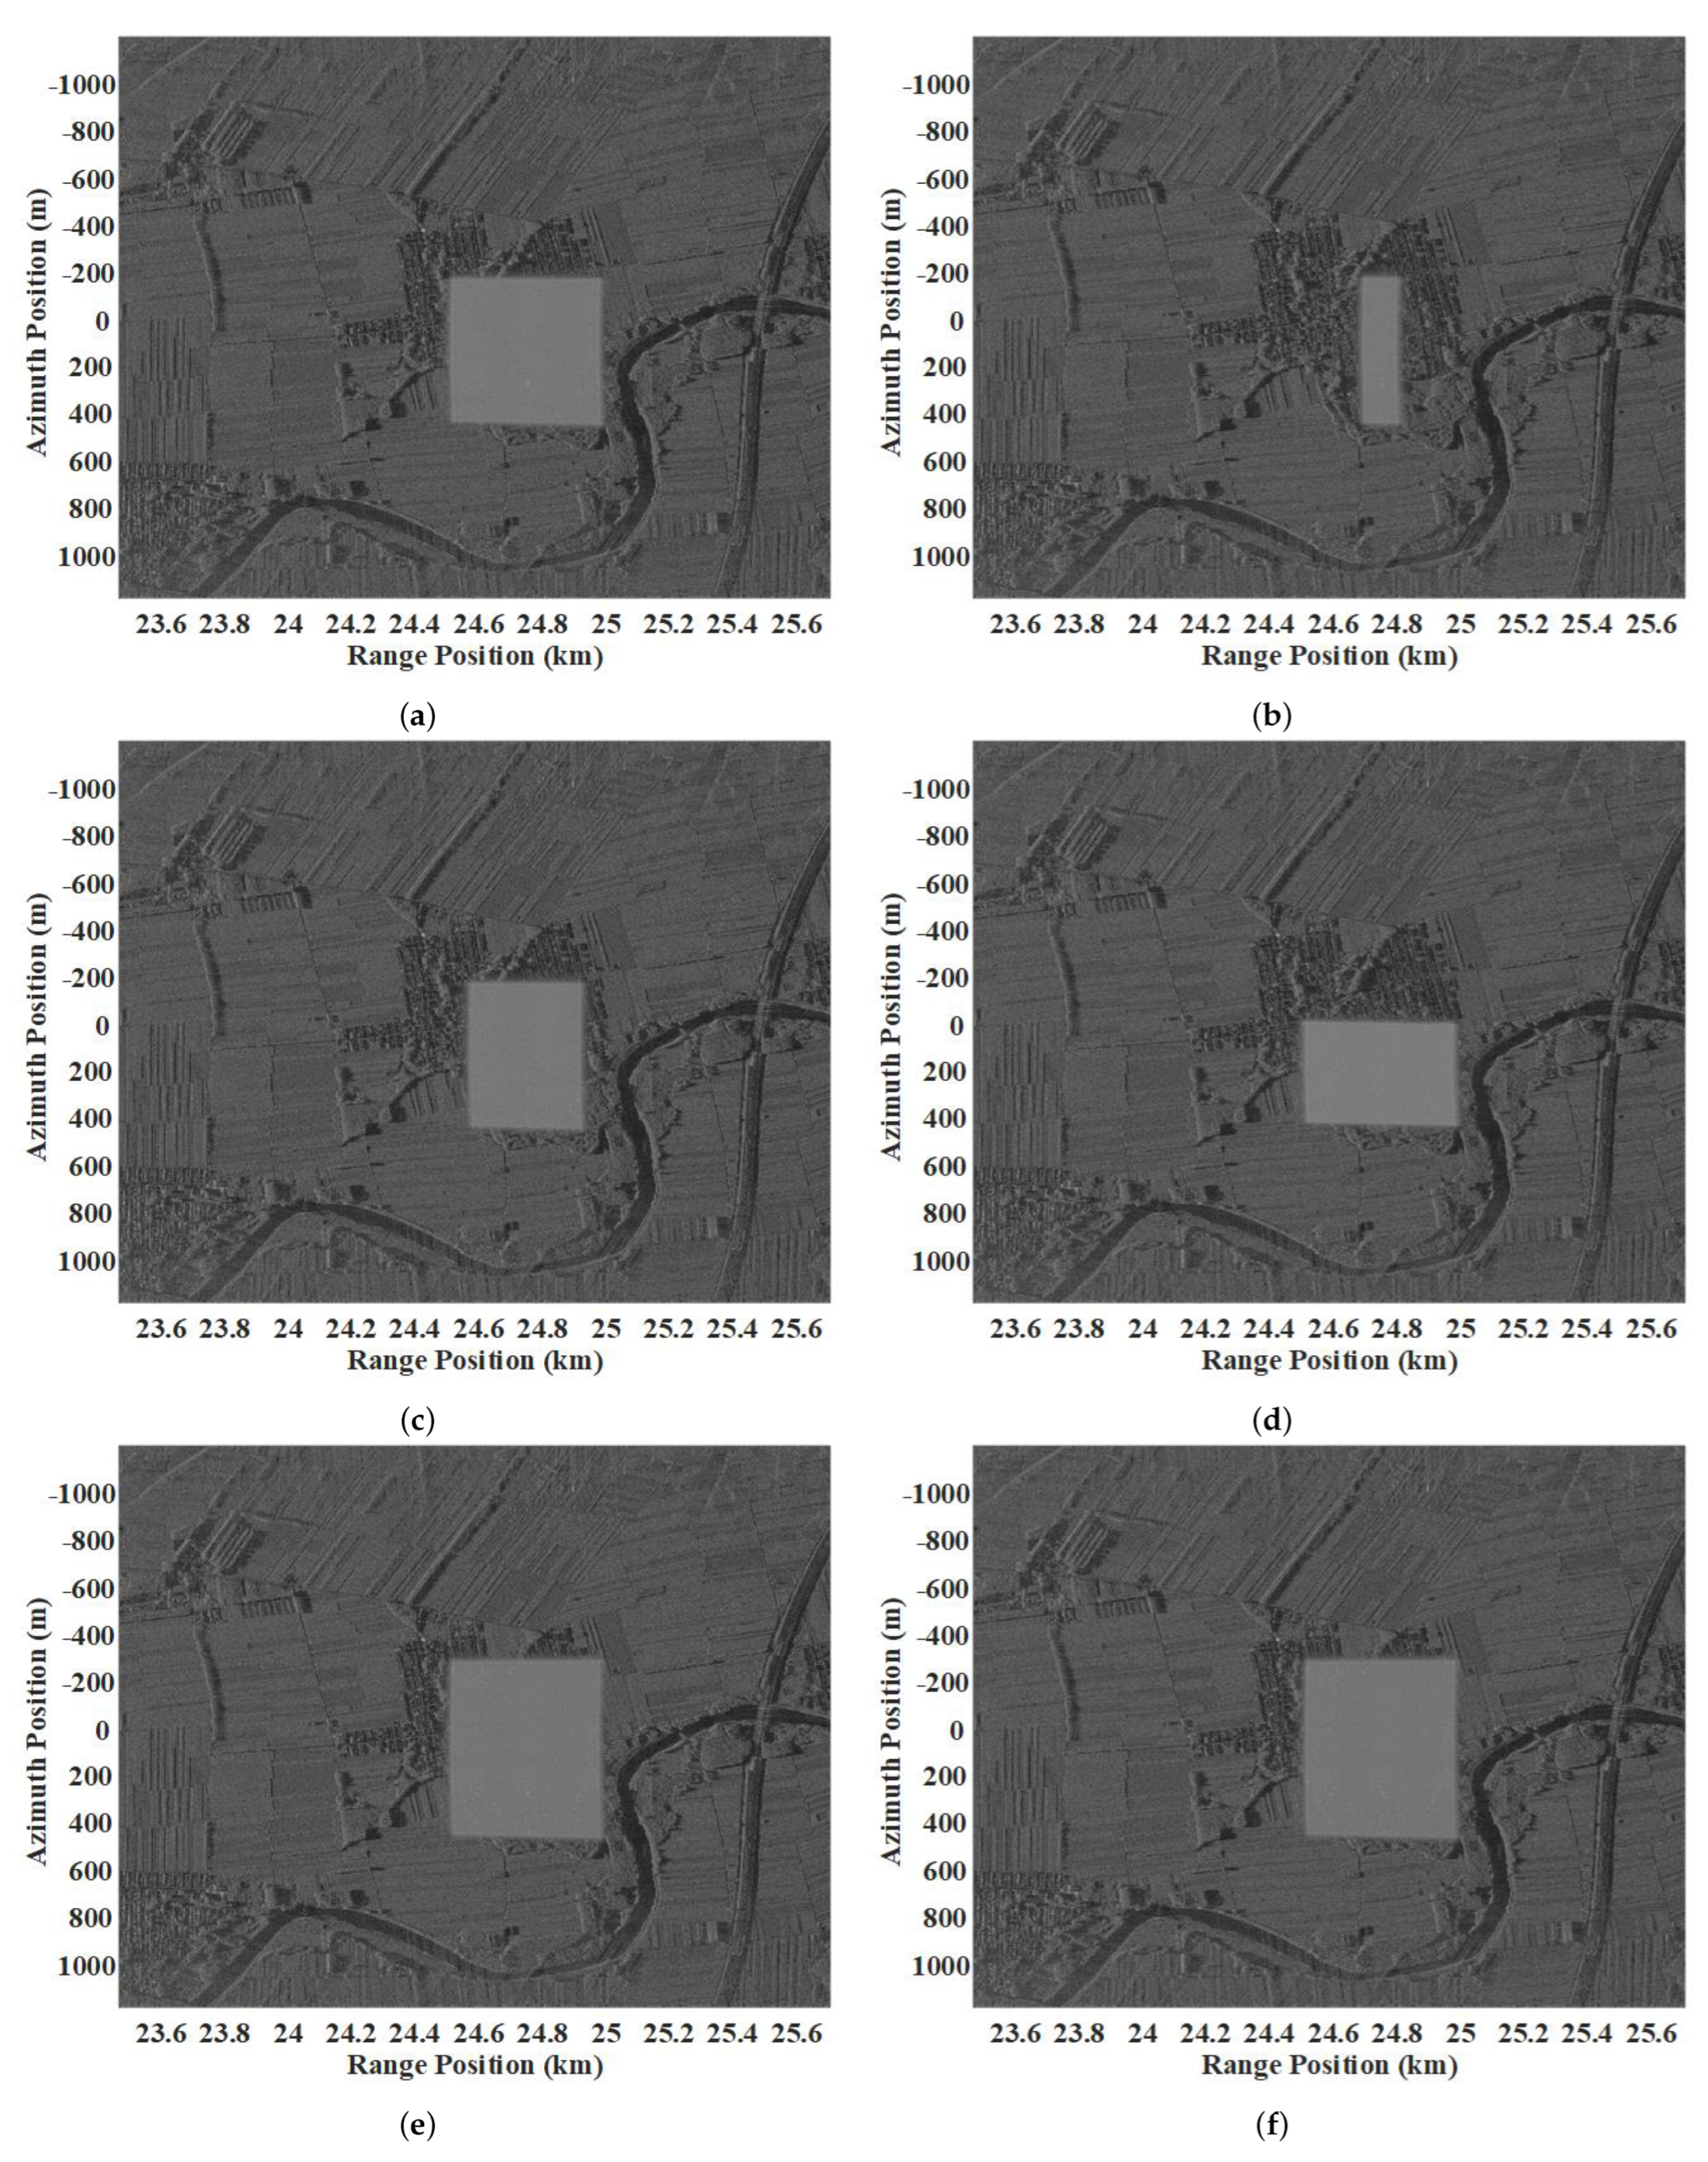
4.2. Simulations and Analysis of the Control Effect of Modulation Parameters on Jamming Result

In this section, the jamming results under different modulation parameters are simulated and analyzed so as to verify the control effect of the modulation parameters on the suppression area of the proposed jamming method.
Firstly, the modulation parameters are set as f d r = 160 MHz , V y = 29 m / s , f d a = 60 Hz and τ 1 = 0.8 us , then the imaging simulation of the suppression jamming signal under these above modulation parameters is performed, and the obtained results are shown in Figure 8.
According to the amplification diagram of the jamming result shown in Figure 8b, the center position of the jamming result is approximately (24,775, 147), and the total suppression area is approximately 466 × 585 m 2 , which is basically consistent with the theoretical value of the center position (24,769, 155) and the theoretical value of the suppression area 480 × 600 m 2 calculated by Equations (22), (23), (30) and (31). Therefore, it is feasible to realize the controllable suppression jamming effect using the proposed jamming method in this paper. Then, the imaging simulations of suppression jamming signals under different modulation parameters are performed, respectively, and the obtained results are shown in Figure 9.
Compared with Figure 8a, setting different range frequency shift amounts can change the range coverage of the jamming result, as shown in Figure 9a; setting different velocity modulation information can change the azimuth coverage of the jamming result, as shown in Figure 9b; setting different azimuth frequency shift amounts can change the azimuth center position of the jamming result, as shown in Figure 9c; and setting different time delays can change the range center position of the jamming result, as shown in Figure 9d. Therefore, the center position and suppression coverage of jamming results can be flexibly controlled by changing modulation parameters.

4.3. Simulations and Analysis of the Influence of Reconnaissance Errors

In order to analyze the influence of the reconnaissance errors, set the relative errors ε T r , ε K r , ε V r , ε λ and ε R 0 are 50 % , respectively, then the jamming results under different parameter reconnaissance errors are shown in Figure 10.
Compared with the jamming result when all the reconnaissance parameters are accurate, the error of ϵ T r will cause the range coverage of the jamming result to reach 120 m , as shown in Figure 10b; the error of ϵ K r will cause the range coverage of jamming to reach 360 m , as shown in Figure 10c; the error of ϵ V r will cause the azimuth coverage of jamming to reach 409 m and the azimuth center position of jamming to reach 233 m , as shown in Figure 10d. Both the error of ϵ λ and the error of ϵ R 0 will cause the azimuth coverage of jamming to reach 741 m , and the azimuth center position of jamming to reach 104 m , as shown in Figure 10e,f, respectively. The simulation results are consistent with the theoretical analysis. Thus, in the case of large reconnaissance parameter errors, this jamming method can still achieve the suppression jamming effect.

4.4. Simulations and Analysis of the Jamming Performance Variation with Modulation Parameters

In order to analyze the suppression performance variation of the proposed jamming method with different modulation parameters, this section simulates and calculates the energy value and the power value of the jamming result with different range frequency shifts and different velocities of azimuth motion modulation, respectively.
The power value of the jamming signal is set as one, and imaging simulations of the jamming signal under different range frequency shift amounts are performed. Then, the energy value and the power value of the jamming results are calculated, respectively. The obtained results are shown in Table 3. At the same time, imaging simulations of the jamming signal under different velocity information of azimuth motion modulation are also performed. Then, the energy value and the power value of the jamming results are calculated, respectively. The obtained results are shown in Table 4.
It can be seen from the simulation results in Table 3 that with the increase in the range frequency shift amount, the range coverage of the jamming result gradually decreases, but the power value of the jamming result is basically unchanged. Meanwhile, it can be seen from the simulation results in Table 4 that with the change in the velocity information, the azimuth coverage of the jamming result gradually decreases, and the power value of the jamming result gradually increases. Therefore, the simulation results verify the correctness of the theoretical analysis.

5. Conclusions

Based on the digital realization method of the chirp-mismatch echo signal, this paper proposes a suppression jamming method with a flexibly controllable jamming position and suppression area. The coverage area and the center position in the range direction of the jamming result are controlled by range shift-frequency modulation and time delay, respectively; the coverage area and the center position in the azimuth direction of the jamming result are controlled by motion modulation and azimuth shift-frequency modulation. The simulation experiments are performed with the airborne SAR raw data to verify the effectiveness and suppression performance of the proposed jamming method. This controllable suppression jamming method does not need a convolution operation, so it is easy to implement in engineering. This controllable suppression jamming method can provide a certain reference value for the jamming application and implementation based on an active radar transponder.

Author Contributions

J.H. played the leading role in preparing this paper. G.L. performed the simulations and analyzed the data. L.L. contributed to the structure and revision of this paper and provided insightful comments and suggestions. F.M. and X.S. provided valuable suggestions and revised the manuscript. All authors have read and agreed to the published version of the manuscript.

Funding

This research was funded by the National Natural Science Foundation of China (No. 61571417).

Conflicts of Interest

The authors declare no conflict of interest.

References

  1. Cumming, I.G.; Wong, F.H. Digital Processing of Synthetic Aperture Radar Data: Algorithms and Implementation; Artech House: Boston, MA, USA, 2005; pp. 40–60. [Google Scholar]
  2. Goj, W.W. Synthetic-Aperture Radar and Electronic Warfare; Artech House: Norwood, MA, USA, 1993; pp. 20–40. [Google Scholar]
  3. Bang, H.; Wang, W.Q.; Zhang, S.; Liao, Y. FDA-Based Space-Time-Frequency Deceptive Jamming Against SAR Imaging. IEEE Trans. Aerosp. Electron. Syst. 2021, 58, 2127–2140. [Google Scholar] [CrossRef]
  4. Zhang, Y.; Ai, X.; Fan, Z.; Dai, D. A Doppler history modulated jamming against MIMO SAR. In Proceedings of the 2019 IEEE International Conference on Signal, Information and Data Processing (ICSIDP), Chongqing, China, 11–13 December 2019; pp. 1–4. [Google Scholar] [CrossRef]
  5. Chang, X.; Dong, C. A Barrage Noise Jamming Method Based on Double Jammers Against Three Channel SAR GMTI. IEEE Access 2019, 7, 18755–18763. [Google Scholar] [CrossRef]
  6. Xu, J.; Wang, H. Jamming Simulation of Synthetic Aperture Radar Imaging. In Proceedings of the 2018 12th International Symposium on Antennas, Propagation and EM Theory (ISAPE), Hangzhou, China, 3–6 December 2018; pp. 1–4. [Google Scholar] [CrossRef]
  7. Zhang, J.; Dai, D.; Xing, S.; Xiao, S.; Pang, B. A novel barrage repeater jamming against SAR-GMTI. In Proceedings of the 2016 10th European Conference on Antennas and Propagation (EuCAP), Davos, Switzerland, 10–15 April 2016; pp. 1–5. [Google Scholar] [CrossRef]
  8. Shi, Y.; Huang, H.; Ma, Z. An Inter-Pulse Non-Coherent Jamming Technology Against SAR Based on Stepped Time-Delay. In Proceedings of the 2021 7th International Conference on Systems and Informatics (ICSAI), Chongqing, China, 13–15 November 2021; pp. 1–5. [Google Scholar] [CrossRef]
  9. Zhou, Q.; Zhou, S.; Yang, L.; Ning, X.; Xing, M. Synthetic Aperture Radar Interference Based on Scene Fusion and Active Cancellation. IEEE J. Sel. Top. Appl. Earth Obs. Remote Sens. 2021, 14, 10375–10382. [Google Scholar] [CrossRef]
  10. Yang, K.; Ma, F.; Ran, D.; Ye, W.; Li, G. Fast Generation of Deceptive Jamming Signal Against Spaceborne SAR Based on Spatial Frequency Domain Interpolation. IEEE Trans. Geosci. Remote Sens. 2022, 60, 1–15. [Google Scholar] [CrossRef]
  11. Yang, K.; Ye, W.; Ma, F.; Li, G.; Tong, Q. A Large-Scene Deceptive Jamming Method for Space-Borne SAR Based on Time-Delay and Frequency-Shift with Template Segmentation. Remote Sens. 2020, 12, 53. [Google Scholar] [CrossRef]
  12. Fan, W.; Zhou, F.; Tian, T. A Deceptive Jamming Template Synthesis Method for SAR Using Generative Adversarial Nets. In Proceedings of the IGARSS 2020—2020 IEEE International Geoscience and Remote Sensing Symposium, Waikoloa, HI, USA, 26 September–2 October 2020; pp. 6926–6929. [Google Scholar] [CrossRef]
  13. Zhao, B.; Huang, L.; Zhou, F.; Zhang, J. Performance Improvement of Deception Jamming Against SAR Based on Minimum Condition Number. IEEE J. Sel. Top. Appl. Earth Obs. Remote Sens. 2017, 10, 1039–1055. [Google Scholar] [CrossRef]
  14. Huang, B.; Wang, W.Q.; Zhang, S.; Wang, H.; Gui, R.; Lu, Z. A Novel Approach for Spaceborne SAR Scattered-Wave Deception Jamming Using Frequency Diverse Array. IEEE Geosci. Remote Sens. Lett. 2020, 17, 1568–1572. [Google Scholar] [CrossRef]
  15. Yang, K.; Ye, W.; Wu, X.; Ma, F.; Li, G. Fast Generation of Deceptive Jamming Signal Against Space-Borne SAR. IEEE J. Sel. Top. Appl. Earth Obs. Remote Sens. 2020, 13, 5580–5596. [Google Scholar] [CrossRef]
  16. Harness, R.S.; Budge, M.C. A study on SAR noise jamming and false target insertion. In Proceedings of the IEEE Southeastcon 2014, Lexington, KY, USA, 13–16 March 2014; pp. 1–8. [Google Scholar] [CrossRef]
  17. Ammar, M.A.; Abdel-Latif, M.S. A Novel Technique for Generation of Multiple Noise Patches on SAR Image. In Proceedings of the 2020 12th International Conference on Electrical Engineering (ICEENG), Cairo, Egypt, 7–9 July 2020; pp. 277–280. [Google Scholar] [CrossRef]
  18. Ammar, M.A.; Abdel-Latif, M.S.; Elgamel, S.A.; Azouz, A. Performance Enhancement of Convolution Noise Jamming Against SAR. In Proceedings of the 2019 36th National Radio Science Conference (NRSC), Port Said, Egypt, 16–18 April 2019; pp. 126–134. [Google Scholar] [CrossRef]
  19. Ye, W.; Ruan, H.; Zhang, S.X.; Yan, L. Study of noise jamming based on convolution modulation to SAR. In Proceedings of the 2010 International Conference on Computer, Mechatronics, Control and Electronic Engineering, Changchun, China, 24–26 August 2010; Volume 6, pp. 169–172. [Google Scholar] [CrossRef]
  20. Liu, G.; Li, L.; Hong, J.; Ming, F. Shift-Frequency Jamming Imaging and Analysis Based on Active Radar Calibrator. In Proceedings of the 2021 IEEE International Geoscience and Remote Sensing Symposium IGARSS, Brussels, Belgium, 11–16 July 2021; pp. 3948–3951. [Google Scholar] [CrossRef]
  21. Wu, X.; Wang, X.; Liang, J. Modulation jamming method for high-vivid false uniformly-moving targets against SAR-GMTI. J. Astronaut. 2012, 33, 1472–1479. [Google Scholar] [CrossRef]
  22. Liu, G.; Li, L.; Hong, J.; Ming, F. Study of Chirp-mismatch SAR Echo Imaging and Application Based on Active Radar Transponder. In Proceedings of the 2022 Photonics & Electromagnetics Research Symposium (PIERS), Hangzhou, China, 25–29 April 2022; pp. 283–287. [Google Scholar] [CrossRef]
  23. Liang, L.; Jun, H.; Feng, M. Study on digital coded technology in active radar calibrator of SAR. In Proceedings of the 2012 IEEE International Geoscience and Remote Sensing Symposium, Munich, Germany, 22–27 July 2012; pp. 4509–4512. [Google Scholar] [CrossRef]
  24. Ji, P.; Dai, D.; Xing, S.; Feng, D. A Controllable Suppressed Jamming Area Generation Method Against SAR-GMTI Based on Double Synergetic Jammers. J. Signal Process. 2022, 38, 667–676. [Google Scholar] [CrossRef]
  25. Wu, X.; Dai, D.; Wang, X.; Lu, H. Quantized analysis of the target motion influence on the strip image of airborne sidelooking mode SAR in azimuth direction. J. Signal Process. 2010, 26, 665–672. [Google Scholar]
  26. Huang, D.; Xing, S.; Liu, Y.; Li, Y.; Xiao, S. Fake SAR signal generation method based on noise convolution modulation. J. Radars 2020, 9, 898–907. [Google Scholar] [CrossRef]
  27. Yang, L.; Gao, S.; Hu, R.; Wei, H. Performance analysis of coherent jamming and non-coherent jamming against SAR. Syst. Eng. Electron. 2018, 40, 2444–2449. [Google Scholar] [CrossRef]
  28. Liang, W. Study on Intelligent Jamming Policy and Jamming Methods of SAR. Master’s Thesis, University of Electronic Science and Technology of China, Chengdu, China, 2019. [Google Scholar]
  29. Han, G.Q.; Li, Y.Z.; Wang, X.S.; Xing, S.Q.; Liu, Q.F. Evaluation of jamming effect on SAR based on method of modified structural similarity. J. Electron. Inf. Technol. 2011, 33, 711–716. [Google Scholar] [CrossRef]
  30. Tian, T.; Zhou, F.; Li, Y.; Sun, B.; Fan, W.; Gong, C.; Yang, S. Performance Evaluation of Deception Against Synthetic Aperture Radar Based on Multifeature Fusion. IEEE J. Sel. Top. Appl. Earth Obs. Remote Sens. 2021, 14, 103–115. [Google Scholar] [CrossRef]
Figure 1. Geometric model of jamming scenario based on active radar transponder.
Remotesensing 14 03949 g001
Figure 2. Principle diagram of chirp-mismatch echo signal generation.
Remotesensing 14 03949 g002
Figure 3. Schematic diagram of motion modulation jamming.
Remotesensing 14 03949 g003
Figure 4. Principle diagram of controllable suppression jamming method.
Remotesensing 14 03949 g004
Figure 5. Imaging result of airborne SAR raw echo data.
Remotesensing 14 03949 g005
Figure 6. Imaging results of jamming data under different jamming to signal ratios. (a) JSR is 0 dB; (b) JSR is 3 dB; (c) JSR is 6 dB; (d) JSR is 9 dB.
Remotesensing 14 03949 g006
Figure 7. Imaging result of white Gaussian noise jamming.
Remotesensing 14 03949 g007
Figure 8. Imaging result of suppression jamming signal under specific modulation parameters. (a) Imaging result of jamming signal; (b) amplification diagram of jamming result.
Remotesensing 14 03949 g008
Figure 9. Imaging results of suppression jamming signals under different modulation parameters. (a) f d r = 320 MHz , V y = 29 m / s , f d a = 60 Hz and τ 1 = 0.8 us ; (b) f d r = 160 MHz , V y = 50 m / s , f d a = 60 Hz and τ 1 = 0.8 us ; (c) f d r = 160 MHz , V y = 29 m / s , f d a = 60 Hz and τ 1 = 0.8 us ; (d) f d r = 160 MHz , V y = 29 m / s , f d a = 60 Hz and τ 1 = 1.6 us .
Remotesensing 14 03949 g009aRemotesensing 14 03949 g009b
Figure 10. Imaging results of suppression jamming signal under different reconnaissance errors. (a) No reconnaissance error; (b) ε T r = 0.5 ; (c) ε K r = 0.5 ; (d) ε V r =0.5; (e) ε λ = 0.5 ; (f) ε R 0 = 0.5 .
Remotesensing 14 03949 g010
Table 1. Parameters of X-band side-looking airborne SAR system.
Parameter TypeParameter Value
Radar center frequency9.6 GHz
Slant range of scene center25.54 km
Effective velocity of radar154.2 m/s
Transmitted pulse duration2.4 μ s
Transmitted pulse bandwidth480 MHz
Azimuth beam width0.04 rad
Table 2. Simulation results of jamming performance evaluation.
JSR (dB)The Mean-Normalized Correlation MeasureThe Structural Similarity
00.86420.4565
30.82310.3094
60.79080.1890
90.77890.1092
Table 3. Energy value and power value of the suppression jamming results under different range frequency shifts.
Range Frequency Shift Amount (MHz)Range Coverage (m)Energy Value of Jamming ResultPower Value of Jamming Result
0705.3 1.1189 × 10 11 2.9579 × 10 3
60619 9.7379 × 10 10 2.9430 × 10 3
120528.1 8.3344 × 10 10 2.9384 × 10 3
180438.5 6.9335 × 10 10 2.9329 × 10 3
240348.4 5.5352 × 10 10 2.9261 × 10 3
300258.5 4.1378 × 10 10 2.9154 × 10 3
Table 4. Energy value and power value of the suppression jamming results under different velocity information of azimuth motion modulation.
Velocity Information (m/s)Azimuth Coverage (m)Energy Value of Jamming ResultPower Value of Jamming Result
−50244.6 1.2528 × 10 11 1.2831 × 10 4
−40413.4 1.2511 × 10 11 7.8185 × 10 3
−30574.4 1.2481 × 10 11 5.6899 × 10 3
−20726.8 1.2413 × 10 11 4.5073 × 10 3
−10870.6 1.2264 × 10 11 3.7344 × 10 3
01005.2 1.1189 × 10 11 2.9579 × 10 3
Publisher’s Note: MDPI stays neutral with regard to jurisdictional claims in published maps and institutional affiliations.

