
Surface Upwelling off the Zhoushan Islands, East China Sea, from Himawari-8 AHI Data


1
College of Marine Science and Technology, Zhejiang Ocean University, Zhoushan 316022, China
2
Ocean College, Zhejiang University, Zhoushan 316021, China
3
Key Laboratory of Tropical Marine Ecosystem and Bioresources, Fourth Institute of Oceanography, Ministry of Natural Resources, Beihai 536000, China
*
Author to whom correspondence should be addressed.
Remote Sens. 2022, 14(14), 3261; https://doi.org/10.3390/rs14143261
Submission received: 27 May 2022
/
Revised: 1 July 2022
/
Accepted: 5 July 2022
/
Published: 6 July 2022
(This article belongs to the Special Issue Advances of Remote Sensing on North Pacific Ecosystems, the Equatorial Pacific Band, and Adjacent Seas)
Abstract
:The summer upwelling around the Zhoushan Islands is well-known. The previous concise review of (mostly) observational studies reveals that the present knowledge of the Zhoushan upwelling is unsatisfactory and has focused on seasonal variations. In this study, a sea surface temperature (SST) gradient-based upwelling detection algorithm was used. The Level 3 daily and hourly SST data from the geostationary satellite Himawari-8 were used to explore statistical features, seasonal variations, and short-term variations of the Zhoushan upwelling. Despite the duration period being like in previous studies, there is a new finding that the location of the upwelling center has a significant monthly migration. The statistical results show that the potential upwelling spots are clustered in the location with large topographic gradients and can be divided into four aggregation areas: between Gouqi Island and Lvhua Island, off Shengsi Island, around the Zhongjieshan Islands, and off the Taohua-Liuheng Islands. The core area of the Zhoushan upwelling is located at 122°E–123°E, 29.5°N–31.15°N with an irregular ellipse extending from southwest to northeast. The continuous cloud-free satellite images display that the lifecycle of the short-term variations was about 24 h and included two stages: intensification and decay. Meanwhile, the surface upwelling center has onshore–offshore movement under the advective transport of local tidal currents. A preliminary discussion suggests that the quasi-24 h periodic variations may be caused by the competing effect between tidal mixing and the stratification in the water column.
1. Introduction
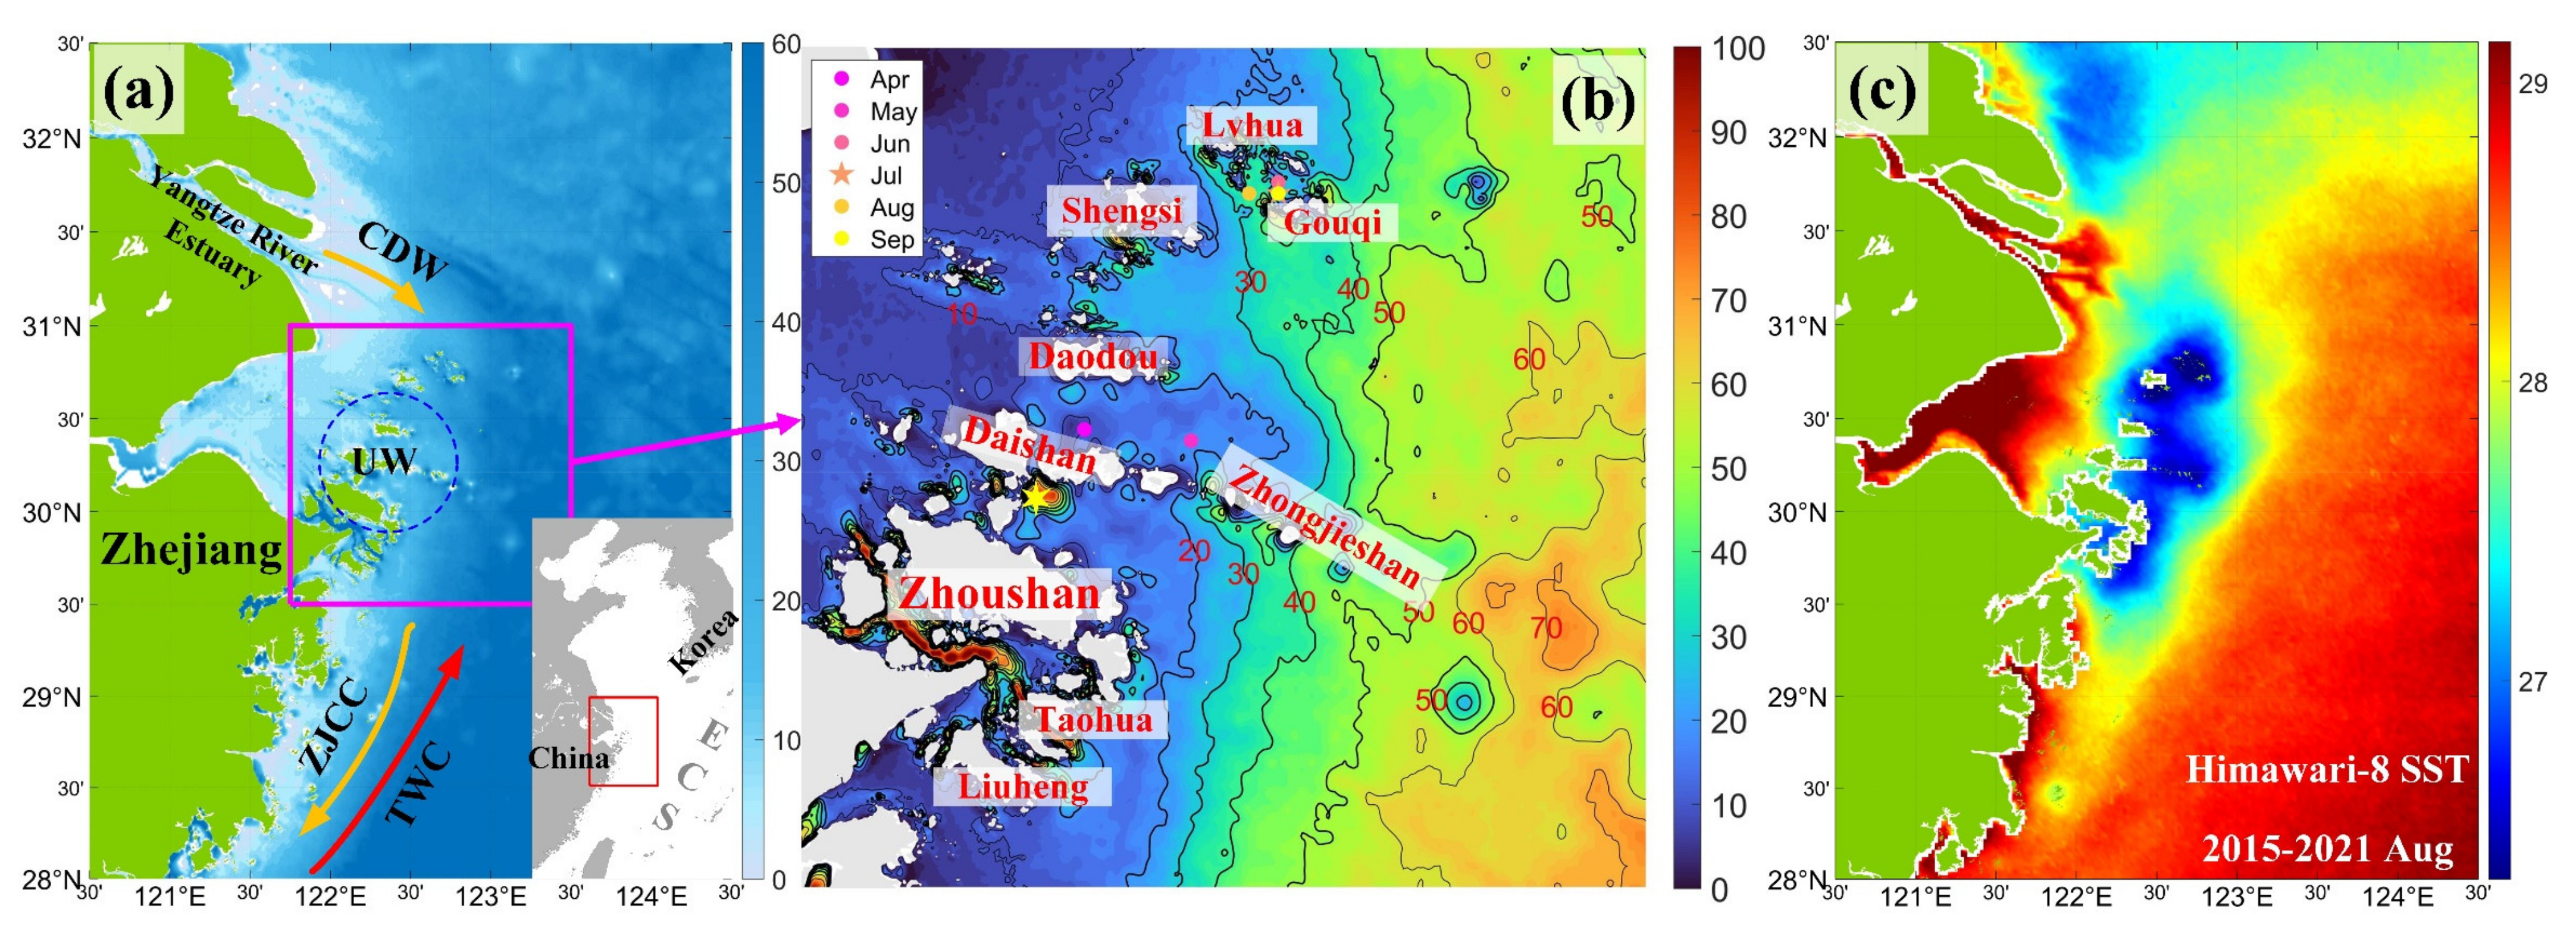
Seasonal summertime upwelling east of Zhoushan Island has been known for centuries, particularly because this area is a famously rich fishing ground, one of the best in the China Seas (Figure 1a,c). Local fishermen undoubtedly noticed that in summer this area is appreciably colder (by up to 3-to-4 °C) compared to ambient waters (Figure 1c). The traditional importance of this area for marine fisheries is currently amplified by marine aquaculture and marine ranching. These factors and the proximity to major research centers stimulated numerous studies of this region from in situ and lately from satellite data that are briefly reviewed below.
Since upwellings usually feature low temperatures relative to ambient waters, most remote sensing studies of upwellings utilize sea surface temperature (SST) data. For decades, the bulk of SST data has been provided by the advanced very high-resolution radiometers (AVHRR) flown on polar-orbiting National Oceanic and Atmospheric Administration (NOAA) satellites. The AVHRR data from multiple NOAA satellites have been thoroughly calibrated and inter-calibrated under the Pathfinder project. Since the early 2000s, SST data are also provided by the moderate resolution imaging spectroradiometers (MODIS) flown on the MODIS-Terra and MODIS-Aqua satellites operated by National Aeronautics and Space Administration (NASA). The visible infrared imaging radiometer suite (VIIRS) radiometer aboard the Suomi National Polar-orbiting Partnership (Suomi-NPP) satellite launched in 2011 and operated by NASA provides high-quality SST data. The above-mentioned instruments provide SST data with spatial resolution down to 1 km, which is sufficient for studies of meso-scale phenomena, including most upwellings. The temporal resolution of infrared SST radiometers is compromised by cloudiness that results in data series with numerous gaps. Various techniques have been proposed to alleviate this major shortcoming of infrared SST data. One approach is to merge infrared SST data with microwave SST data because microwave radiometers can see through clouds. Unfortunately, the spatial resolution of microwave SST data is rather poor (a few tens of kilometers). Another approach involves compositing satellite images. The basic idea behind this approach is that cloud patches in individual images could be eliminated by artificial intelligence (AI) algorithms. Such pattern recognition algorithms recognize clouds as patches with different temperatures that move relatively fast over the ocean.
Geostationary satellites, owing to their stable positions over fixed points on Earth, allow their payload instruments to carry out extremely high-frequency sampling of the sea surface. The sampling frequency is limited only by the scanning speed of their imagers. For example, instruments aboard the Japanese geostationary satellites Himawari (“Sunflower”) scan the Earth’s disc every 10 min. Smart AI algorithms for compositing frequent images of sea surface could effectively filter out most clouds, thereby providing high-frequency time series of satellite imagery to study short-term variability of oceanic phenomena, including upwellings.
Lü et al. [1], in their modeling study, inspected a few quasi-synoptical (5-day) composite AVHRR SST images and climatological (15-year) SST maps (based largely on satellite data) to note “the stable presence of a cold-water mass near Zhoushan Islands” (ibid., p. 6), which was up to 4 °C cooler than ambient water. The latter claim is not fully supported by their own data. Indeed, the three quasi-synoptic SST maps from July–August 1997–1998 reveal the absolute SST minimum of 25 °C vs. ambient SST of 28 °C (ibid., Figure 5), yielding the SST difference of 3 °C; while in the climatological SST maps (ibid., Figure 6) the same difference is <2 °C. Lü et al. [1] noted: “The cold water is enclosed by relatively warm water, so it should not be formed by the horizontal advection. It is most likely that the water upwells from the lower layer” (ibid., p. 6). In a follow-up modeling study, Lü et al. [2] simulated summer upwelling off the Zhoushan Islands and concluded that “in the study area about 60% of the upwelling is attributed to tidal effects, which should be the primary inducement for upwelling” (ibid., p. 472).
Hu and Zhao [3] studied summer upwelling off northeastern Zhejiang from diverse datasets (AVHRR SST, 1987–2005; SeaWiFS Chl-a, 2002–2006; QuikSCAT wind, 1992–2006) and documented long-term variations (LTV) of the upwelling on the seasonal to interannual time scales. In a follow-up study based on the same datasets, Hu and Zhao [4] studied short-term variations (STV) of upwelling off the Zhejiang coast in May–October 2004 and concluded that the upwelling variations are closely associated with the along-shore SW wind variations. Hu and Zhao [4] identified two upwelling areas: one east of the Zhoushan Island, with the upwelling core near 30°N, another off the Yangtze River estuary, with the upwelling core at 31.5°N. The location of the Zhoushan upwelling core (30°N) differs from that determined by other authors.
Lou et al. [5] and Lou et al. [6] reported summer upwelling off Zhejiang from MODIS SST data, 2007–2009. They noted that the upwelling appears in June, which is consistent with the results by Hu and Zhao [4] from 2004, yet inconsistent with the latest results, including this study. Lou et al. [5] and Lou et al. [6] pointed out that the Zhejiang upwelling vanishes in September, in accordance with Hu and Zhao [4] and later studies, including this paper.
Liu and Gan [7] investigated dynamics of intensified upwelling caused by a topographic promontory (“coastal headland”) east of the Zhoushan Islands at ~30°N, ~122.4°E. In the observational part of this paper, Liu and Gan [7] presented maps of SST from June–August 2000–2009 and from August 2009. Both maps feature the coldest SST spot at ~30.7°N, ~122.5°E (ibid., Figure 2b,c), centered around the Shengsi Islands (part of the Zhoushan Archipelago). Both maps reveal that the upwelling SST intensity (defined as the core SST minus ambient SST) is ~2 °C or less.
Huang et al. [8] analyzed all-weather (cloud-free) monthly mean data derived from the Multiscale Ultrahigh Resolution (MUR) SST dataset and concluded that the Zhoushan upwelling emerges in April to June and vanishes in September. They also ran the Regional Ocean Modeling System (ROMS) to investigate the wind influence on the upwelling. The simulation revealed that the wind is essential in inducing the Zhoushan upwelling.
Xu et al. [9] investigated interannual variations of the Zhoushan upwelling using MUR 1 km resolution SST data from 2003–2014 and Pathfinder 0.05° × 0.05° resolution SST data from 1985–2002. The upwelling occurred from April through September with about the same strength over 30 years (1985–2014). The coldest SST spot was usually located around the Shengsi Islands, while the SST upwelling intensity (from SST climatology) was ~2 °C (ibid., Figure 3).
Yang et al. [10] proposed a dimensionless upwelling intensity index (NUI) by combining the area of upwelling and the intensity of cold center. Unfortunately, as all indices, the NUI cannot be interpreted in terms of observables (directly measured quantities).
The above concise review of (mostly) observational studies reveals that our present knowledge of the Zhoushan upwelling is unsatisfactory and has focused on seasonal variations. Variations on other timescales, especially the short-term variability of the Zhoushan upwelling remain virtually unexplored.
In this study, the Level 3 daily and hourly SST data from Himawari-8 (JAXA-SST, Figure 1c) were used to explore statistical features, seasonal variations, and short-term variations of the Zhoushan upwelling. The Himawari-8 is a new-generation Japanese geostationary meteorological satellite, whose instrument, the Advanced Himawari Imager (AHI) has a sampling interval of 10 min and a spatial resolution of 2 km. Its high temporal resolution allows AHI to capture short-term (hourly and daily) variations in surface manifestations of upwelling. To quantify surface features of upwelling, an SST-gradient-based upwelling detection algorithm which was successfully applied in a study of upwelling off northeastern Taiwan [11] was used to demarcate the Zhoushan upwelling. An upwelling intensity index was developed to quantify the Zhoushan upwelling’s surface manifestation and its short-term variations. Such statistical results have never been reported before. The structure of this paper is as follows. Section 2 describes the data and methods used in this study. Section 3 and Section 4 present results and discussion. The main results are summed up in Section 5 (Conclusions).
2. Data and Methods
2.1. JAXA-SST
In this study, the nearly seven years (July 2015–December 2021) of JAXA-SST daily and hourly data from Himawari-8 were used. The Himawari-8 is a geostationary meteorological satellite operated by the Japan Meteorological Agency since 7 July 2015 to replace the Japanese Multifunctional Transport Satellite 2 (MTSAT-2). The new satellite is located at 140.7°E and observes the Earth from 80°E to 160°W between 60°N and 60°S. The Advanced Himawari Imager (AHI) is an optical radiometer on board the Himawari-8. Its observation frequencies are every 10 min for the full disk and every 2.5 min for the area adjacent to Japan. The AHI has 16 spectral bands from visible to infrared wavelengths. The spatial resolution of the infrared (IR) bands is 2 km [12]. The IR bands centered at 3.9, 8.6, 10.4, 11.2, and 12.4 μm are usable for sea surface temperature (SST) retrieval. The Earth Observation Research Center of the Japan Aerospace Exploration Agency (JAXA, Tokyo, Japan) produces Himawari-8 skin SSTs calculated from 10.4, 11.2, and 8.6 μm data along with SSTs calculated from 10.4, 11.2, and 3.9 μm data, both in near real-time. The SSTs were calculated with a new quasi-physical SST algorithm, which calculates skin SSTs by solving a parameterized IR radiative transfer equation. A comparison with in situ data showed a root-mean-square difference of ~0.59 K and a bias of −0.16 K [13]. This dataset was downloaded from the website (https://www.eorc.jaxa.jp/ptree/) accessed on 1 April 2021.
2.2. Sea Surface Wind
The surface wind data used to explore the role of the wind-stress curl in surface upwelling were downloaded from Remote Sensing Systems (https://www.remss.com/measurements/ccmp/) accessed on 14 March 2022. This cross-calibrated multi-platform (CCMP) gridded surface vector wind dataset was produced using a variational analysis method to combine extensive cross-calibrated multiple satellite datasets with in situ data and ECMWF analyses [14]. It has a spatiotemporal resolution of 0.25° and 6 hr. A comparison between the CCMP wind data and the in situ observed data shows that their differences are small, approximately 0.5 m/s [14], indicating that the CCMP wind data provide reliable ocean climatology for regional and large-scale ocean dynamic processes.
2.3. SST-Gradient-Based Upwelling Detection Algorithm
To quantify the upwelling’s features, an SST-gradient-based upwelling detection algorithm, which has been successfully applied in a quantitative study of upwelling in northeastern Taiwan was adapted for this study. The algorithm assumes that the radial distribution of SST in a pointwise upwelling can be approximated by a ring-like structure (Figure 2a). Namely, it has a core area (the blue ring in Figure 2a) with a relatively low temperature in the upwelling center, a surrounding area (“shell”; the red ring in Figure 2a) with a relatively high temperature, and a mixed zone (the yellow ring in Figure 2a) between the core area and the surrounding area. The temperature increases gradually in the radial direction from the cold core area to the warm surrounding area (the red line in Figure 2b). The upwelling center is the point with the lowest temperature. Following the definition of the upwelling boundary by Cheng et al. [15], the point where the temperature increases the fastest (the point with the maximum SST gradient, the blue dot in Figure 2b) is regarded as the boundary between the core area and the mixed area. The boundary between the mixed area and the surrounding area is defined as the point where the temperature increase is equal to zero or at minimum (the point with a zero or minimum SST gradient, the red dot in Figure 2b). Based on the above definitions, the upwelling’s features (such as its center, core area, and boundaries) were extracted from satellite SST images:
2.3.1. Data Smoothing and Identification of Upwelling Center
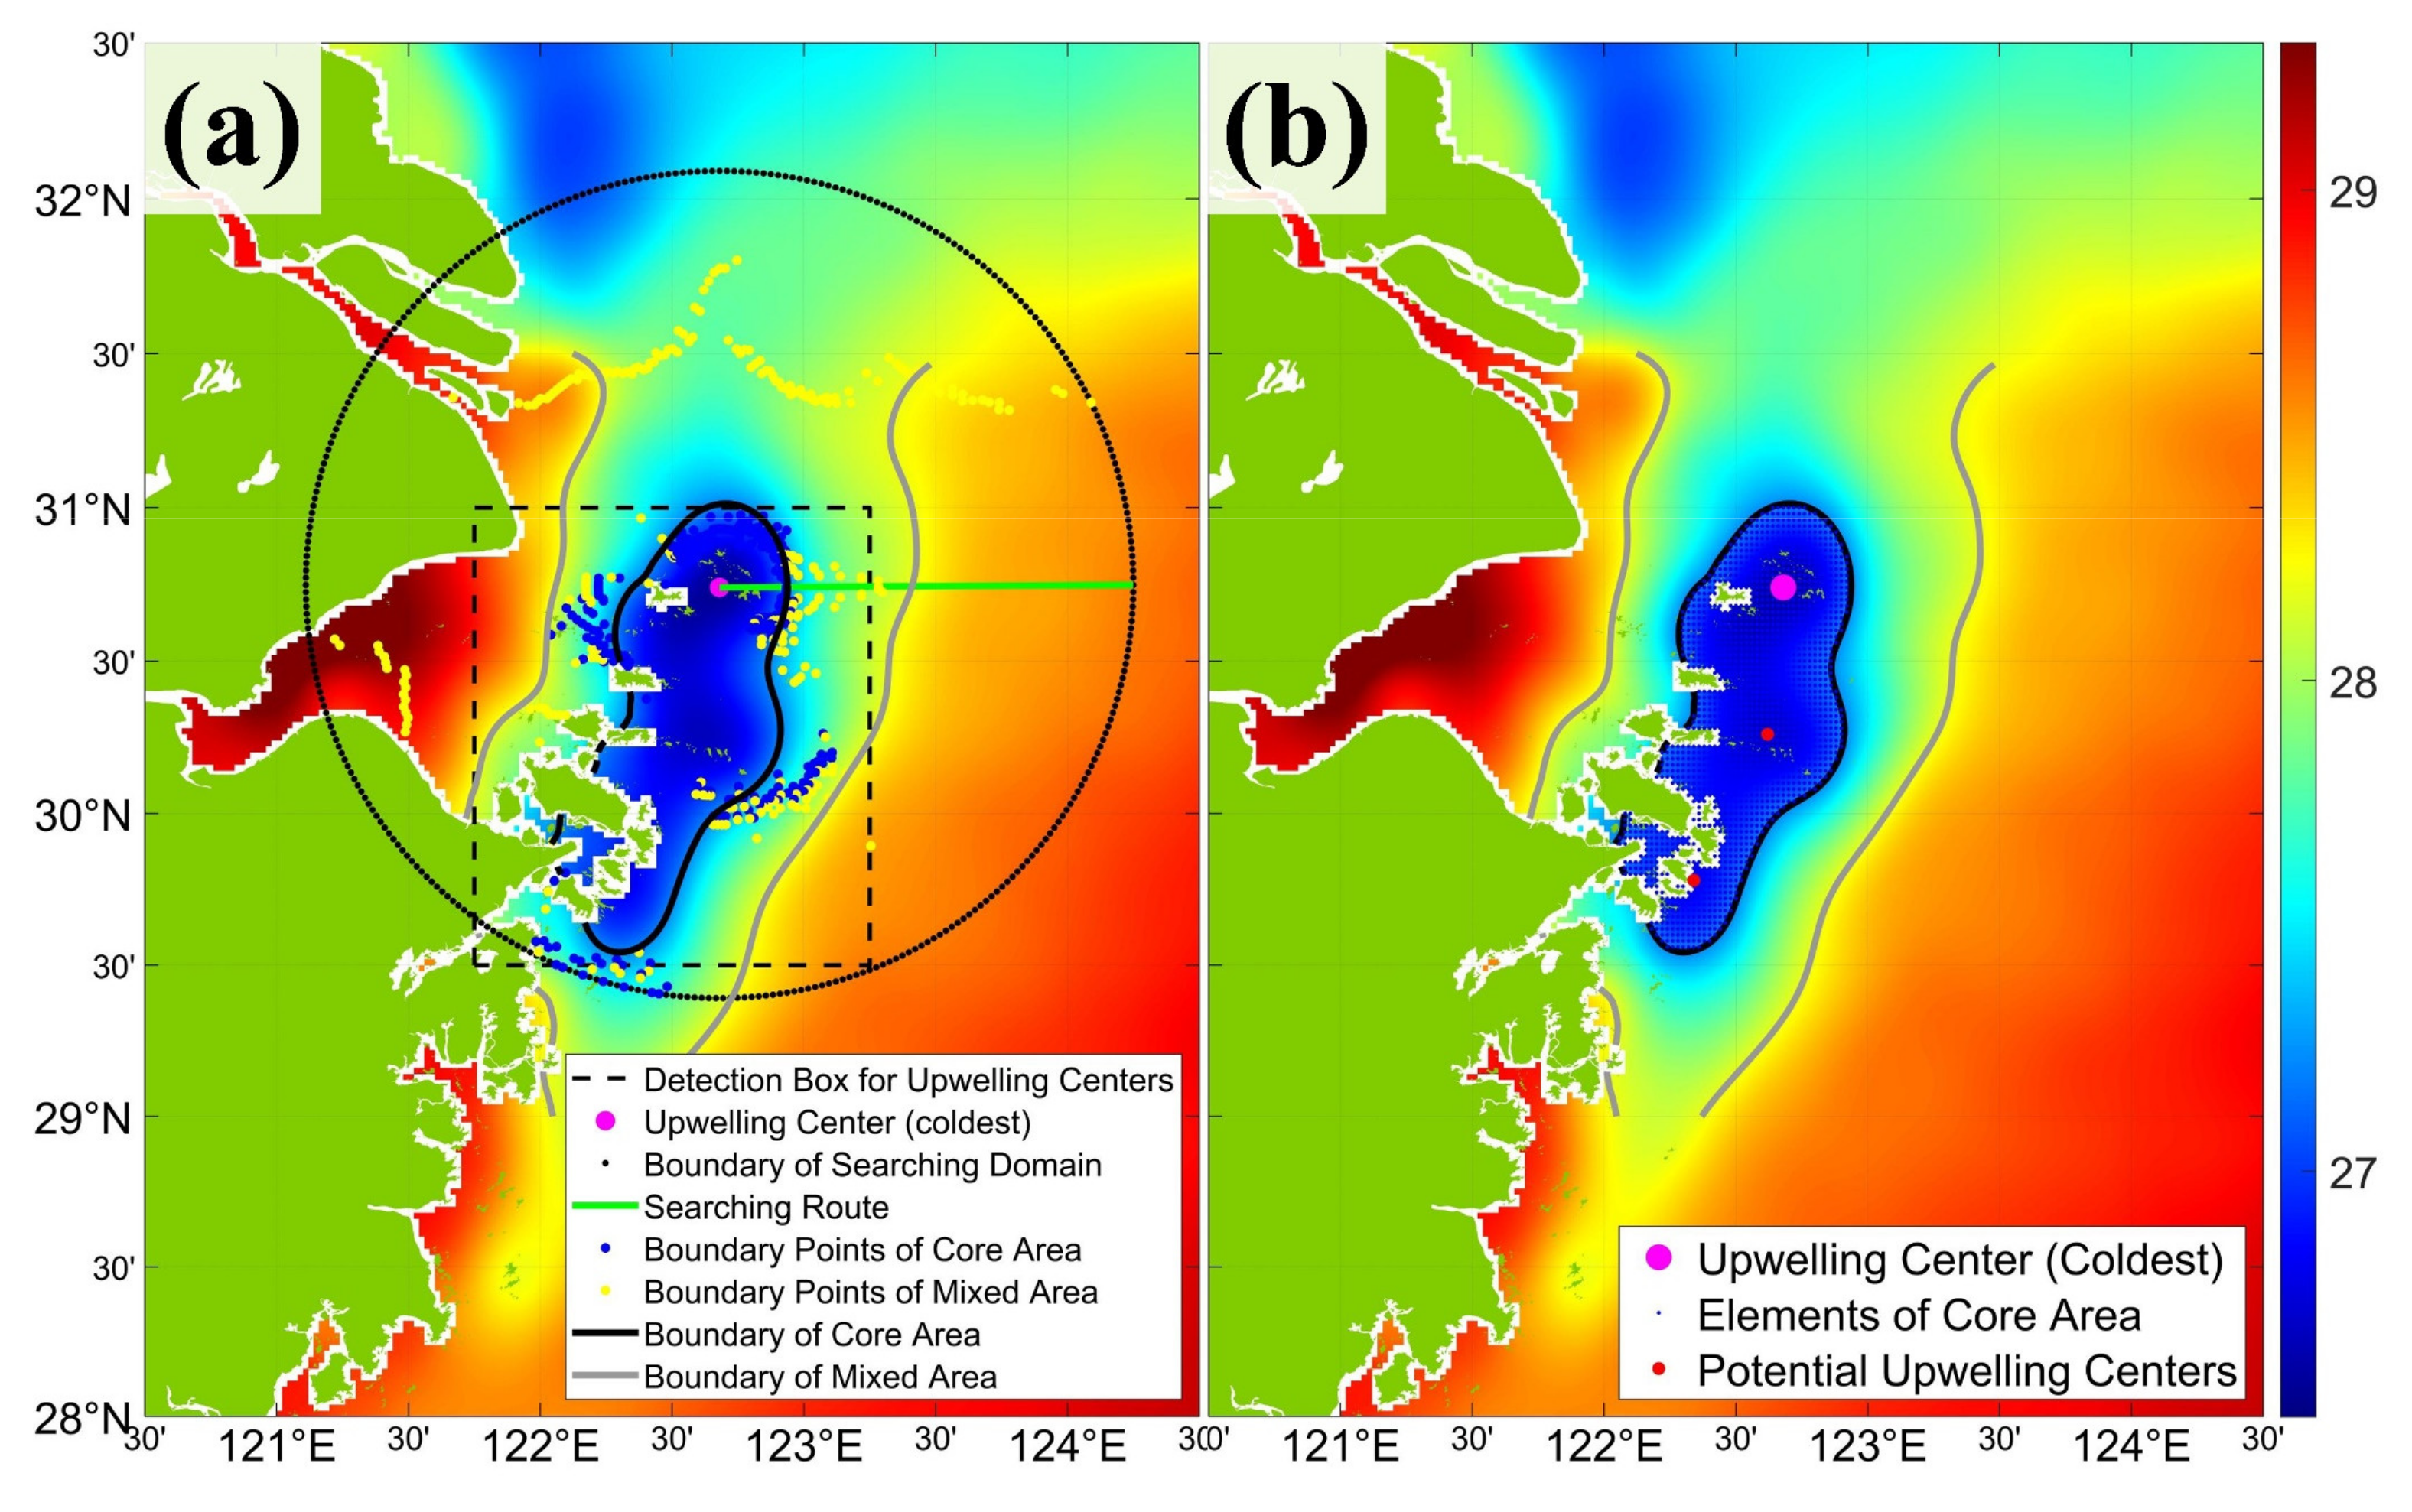
The upwelling center is its coldest point. The original JAXA-SST images (Figure 1c) were smoothed with a two-dimensional 9 × 9 point running filter [16]. Second, a center-searching 1.5° × 1.5° box (the black dotted box in Figure 3a) was specified based on previous studies of the Zhoushan upwelling. Third, local temperature minimum points within the center-searching box (the dots in Figure 3b) were identified as potential upwelling points. Finally, the coldest potential upwelling point was defined as the upwelling center (the magenta dot in Figure 3a), and the associated temperature was denoted as .
2.3.2. Identification of Boundaries of Core Area and Mixed Area
After the center point is determined, the boundary-searching domain for the upwelling was specified as a circular area with the upwelling center at the center of the circle and a sufficiently large radius to cover the entire upwelling zone. A radius of 150 km was chosen for the circular searching area in this study based on the spatial cumulative frequency map of Zhejiang Coastal Upwelling during 2007~2009 made by Lou et al. [6]. Then, the circle was divided evenly into 360 parts using 360 points along the circumference of the circle (the black dots in Figure 3a). Finally, 360 searching routes connecting the upwelling center to the black points were constructed (e.g., the green line in Figure 3a). To reduce errors caused by surrounding islands or clouds, the searching route with the number of available SST data is less than 70% will be discarded. The radial gradient of SST along each searching route was calculated subsequently.
The point with the maximum radial SST gradient (blue dots in Figure 3a) along each radius was identified as the boundary point between the core area and mixed area, and the associated SST was recorded as . To reduce the sampling error caused by the unreasonable values in the radial SST gradient, the temperature threshold () of the boundary (the black line in Figure 3a) between the core area and mixed area is defined by the mean of the 360 points (Equation (1)). Similarly, the point with the minimum (or zero) radial SST gradient (yellow dots in Figure 3a) along each searching route was considered as the boundary point between the mixed area and surrounding area, and its associated temperature was recorded as . The temperature threshold of the boundary (the gray line in Figure 3a) between the mixed area and surrounding area () is defined as the mean of the 360 points (Equation (2)). The 2D extent of the upwelling core () is defined as the total area of all pixels (blue dots in Figure 3b) in the core area (Equation (3)). The temperature difference between and is defined as the upwelling index (UPI; Equation (4)) and is used to measure the intensity of the surface manifestation of upwelling.
where indicate the number of pixels in the core area; the is the area of one pixel.
2.4. Calculation of Pixel-Based Frequency of Potential Upwelling Points and Core Area
The statistical analysis in this study primarily focuses on the following two aspects: the distribution of potential upwelling points and the spatial structure of the core area. To obtain these statistics, the above-described upwelling parameterization algorithm was used to extract daily parameters of upwelling (potential upwelling points and core area elements) first. Second, using the daily parameters, the pixel-based frequency of potential upwelling points (UPF) and core area (CAF) was calculated as the ratio of the number of times that the pixel was identified as a potential upwelling point () or core area element () to the number of times that the pixel was cloud-free () from April to September, 2015–2021:
3. Results and Discussion
3.1. Monthly Variability of Zhoushan Upwelling and Potential Dynamics
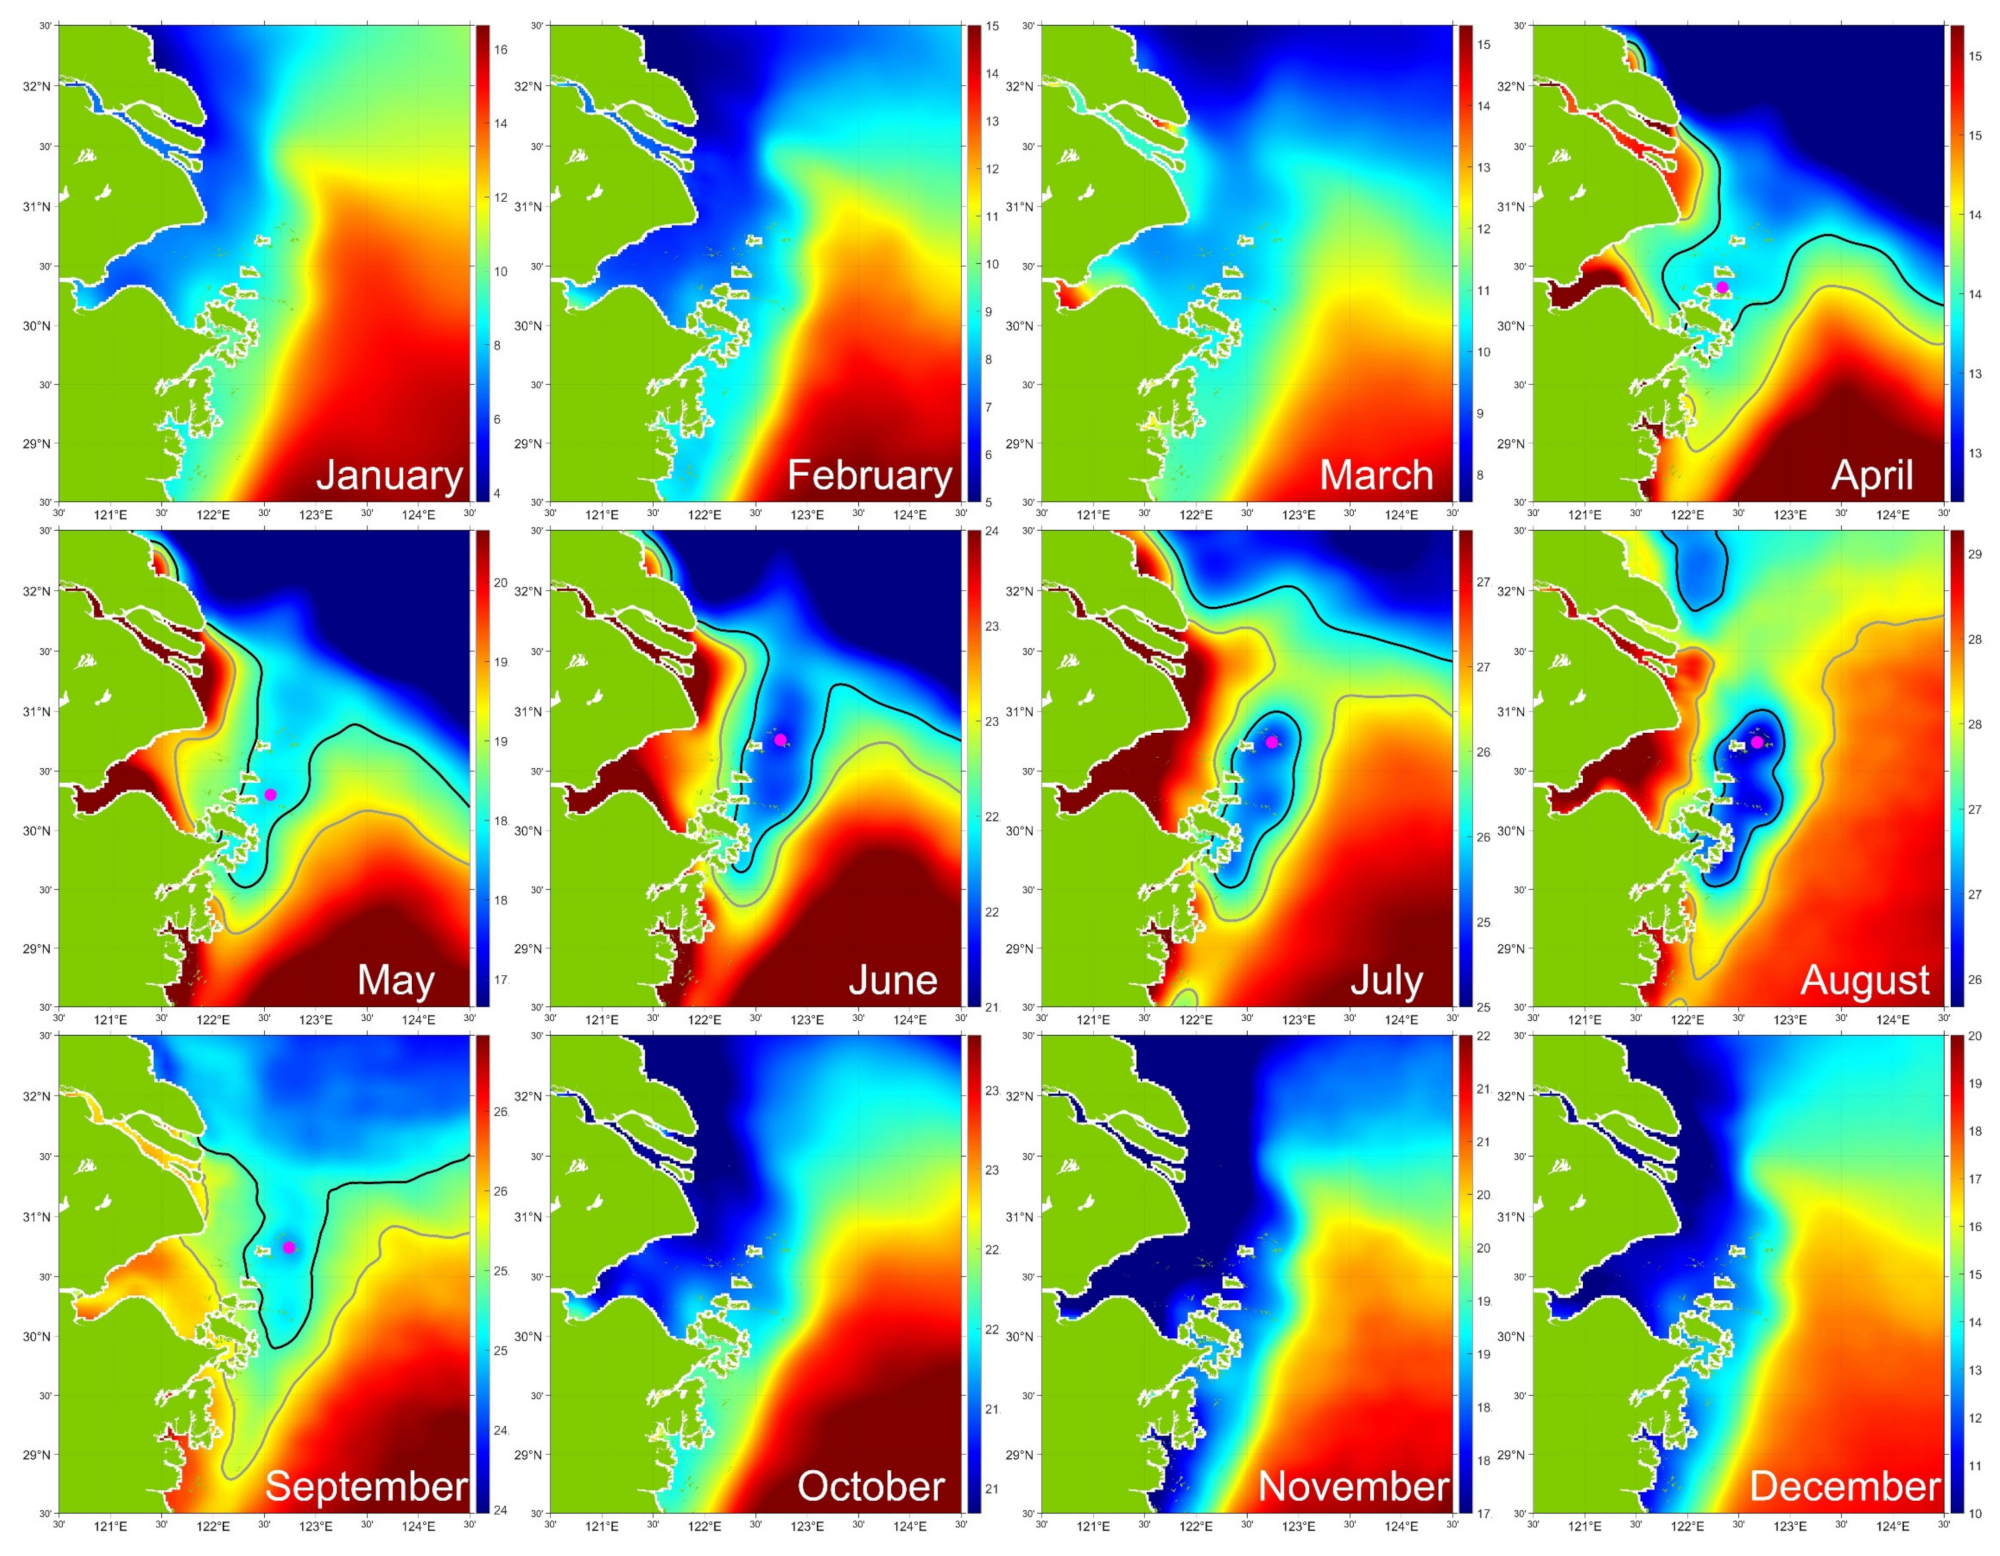
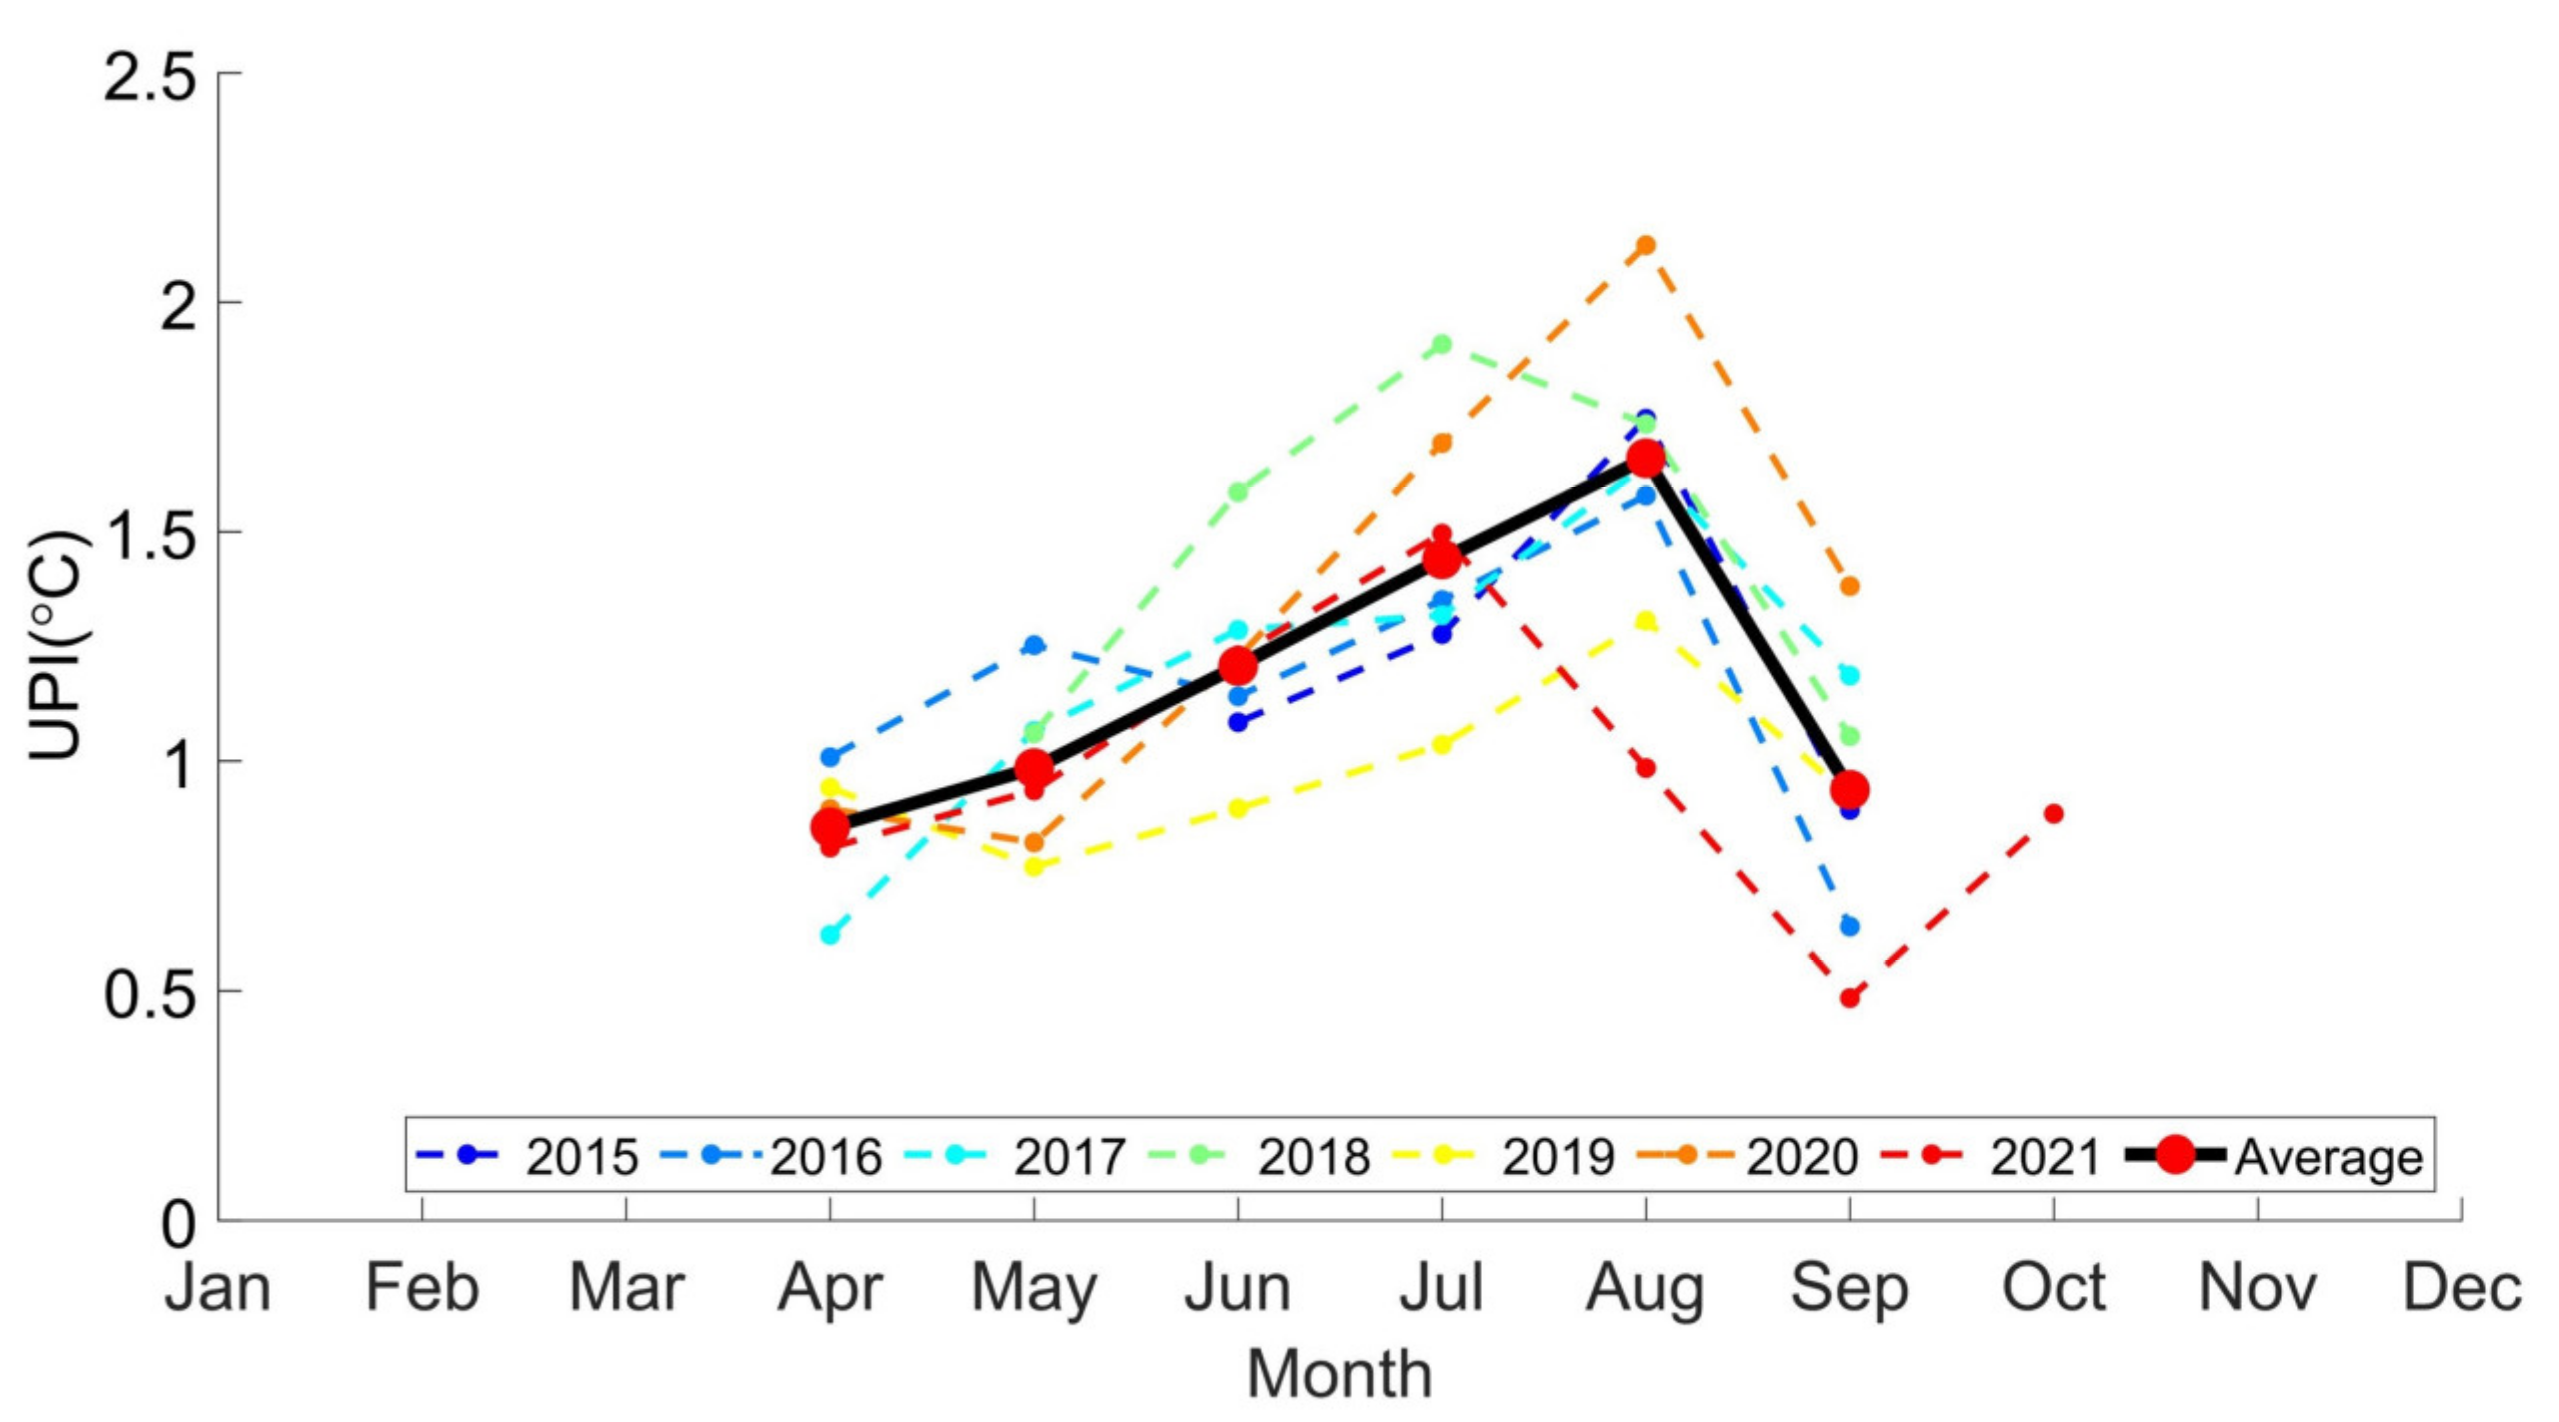
Similar to previous studies, the Zhoushan upwelling appears in April, usually peaks in August, and begins to disappear in September (Figure 4). Although the Zhoushan upwelling exists year-round in the previous studies [2,17], it cannot be seen in satellite imagery in other months (October to March of the following year) because of the influence of the nearshore cold water mass. The UPI shows the same variations: during the intensification stage, between April to August, the UPI intensified quickly from 0.8 to 1.7 °C (Figure 5); after the intensity peaked in August, the upwelling rapidly decayed in September (Figure 5).
The upwelling center, which has never been reported in previous studies, first appears near the northern of Daishan Island in April, then moves eastward to the northern sea of Zhongjieshan Islands in May, and finally moves to the northeast of Shengsi Island, the area between Gouqi Island and Lvhua Island in June, and remains quasi-stationary until the upwelling disappears in September (Figure 1b).
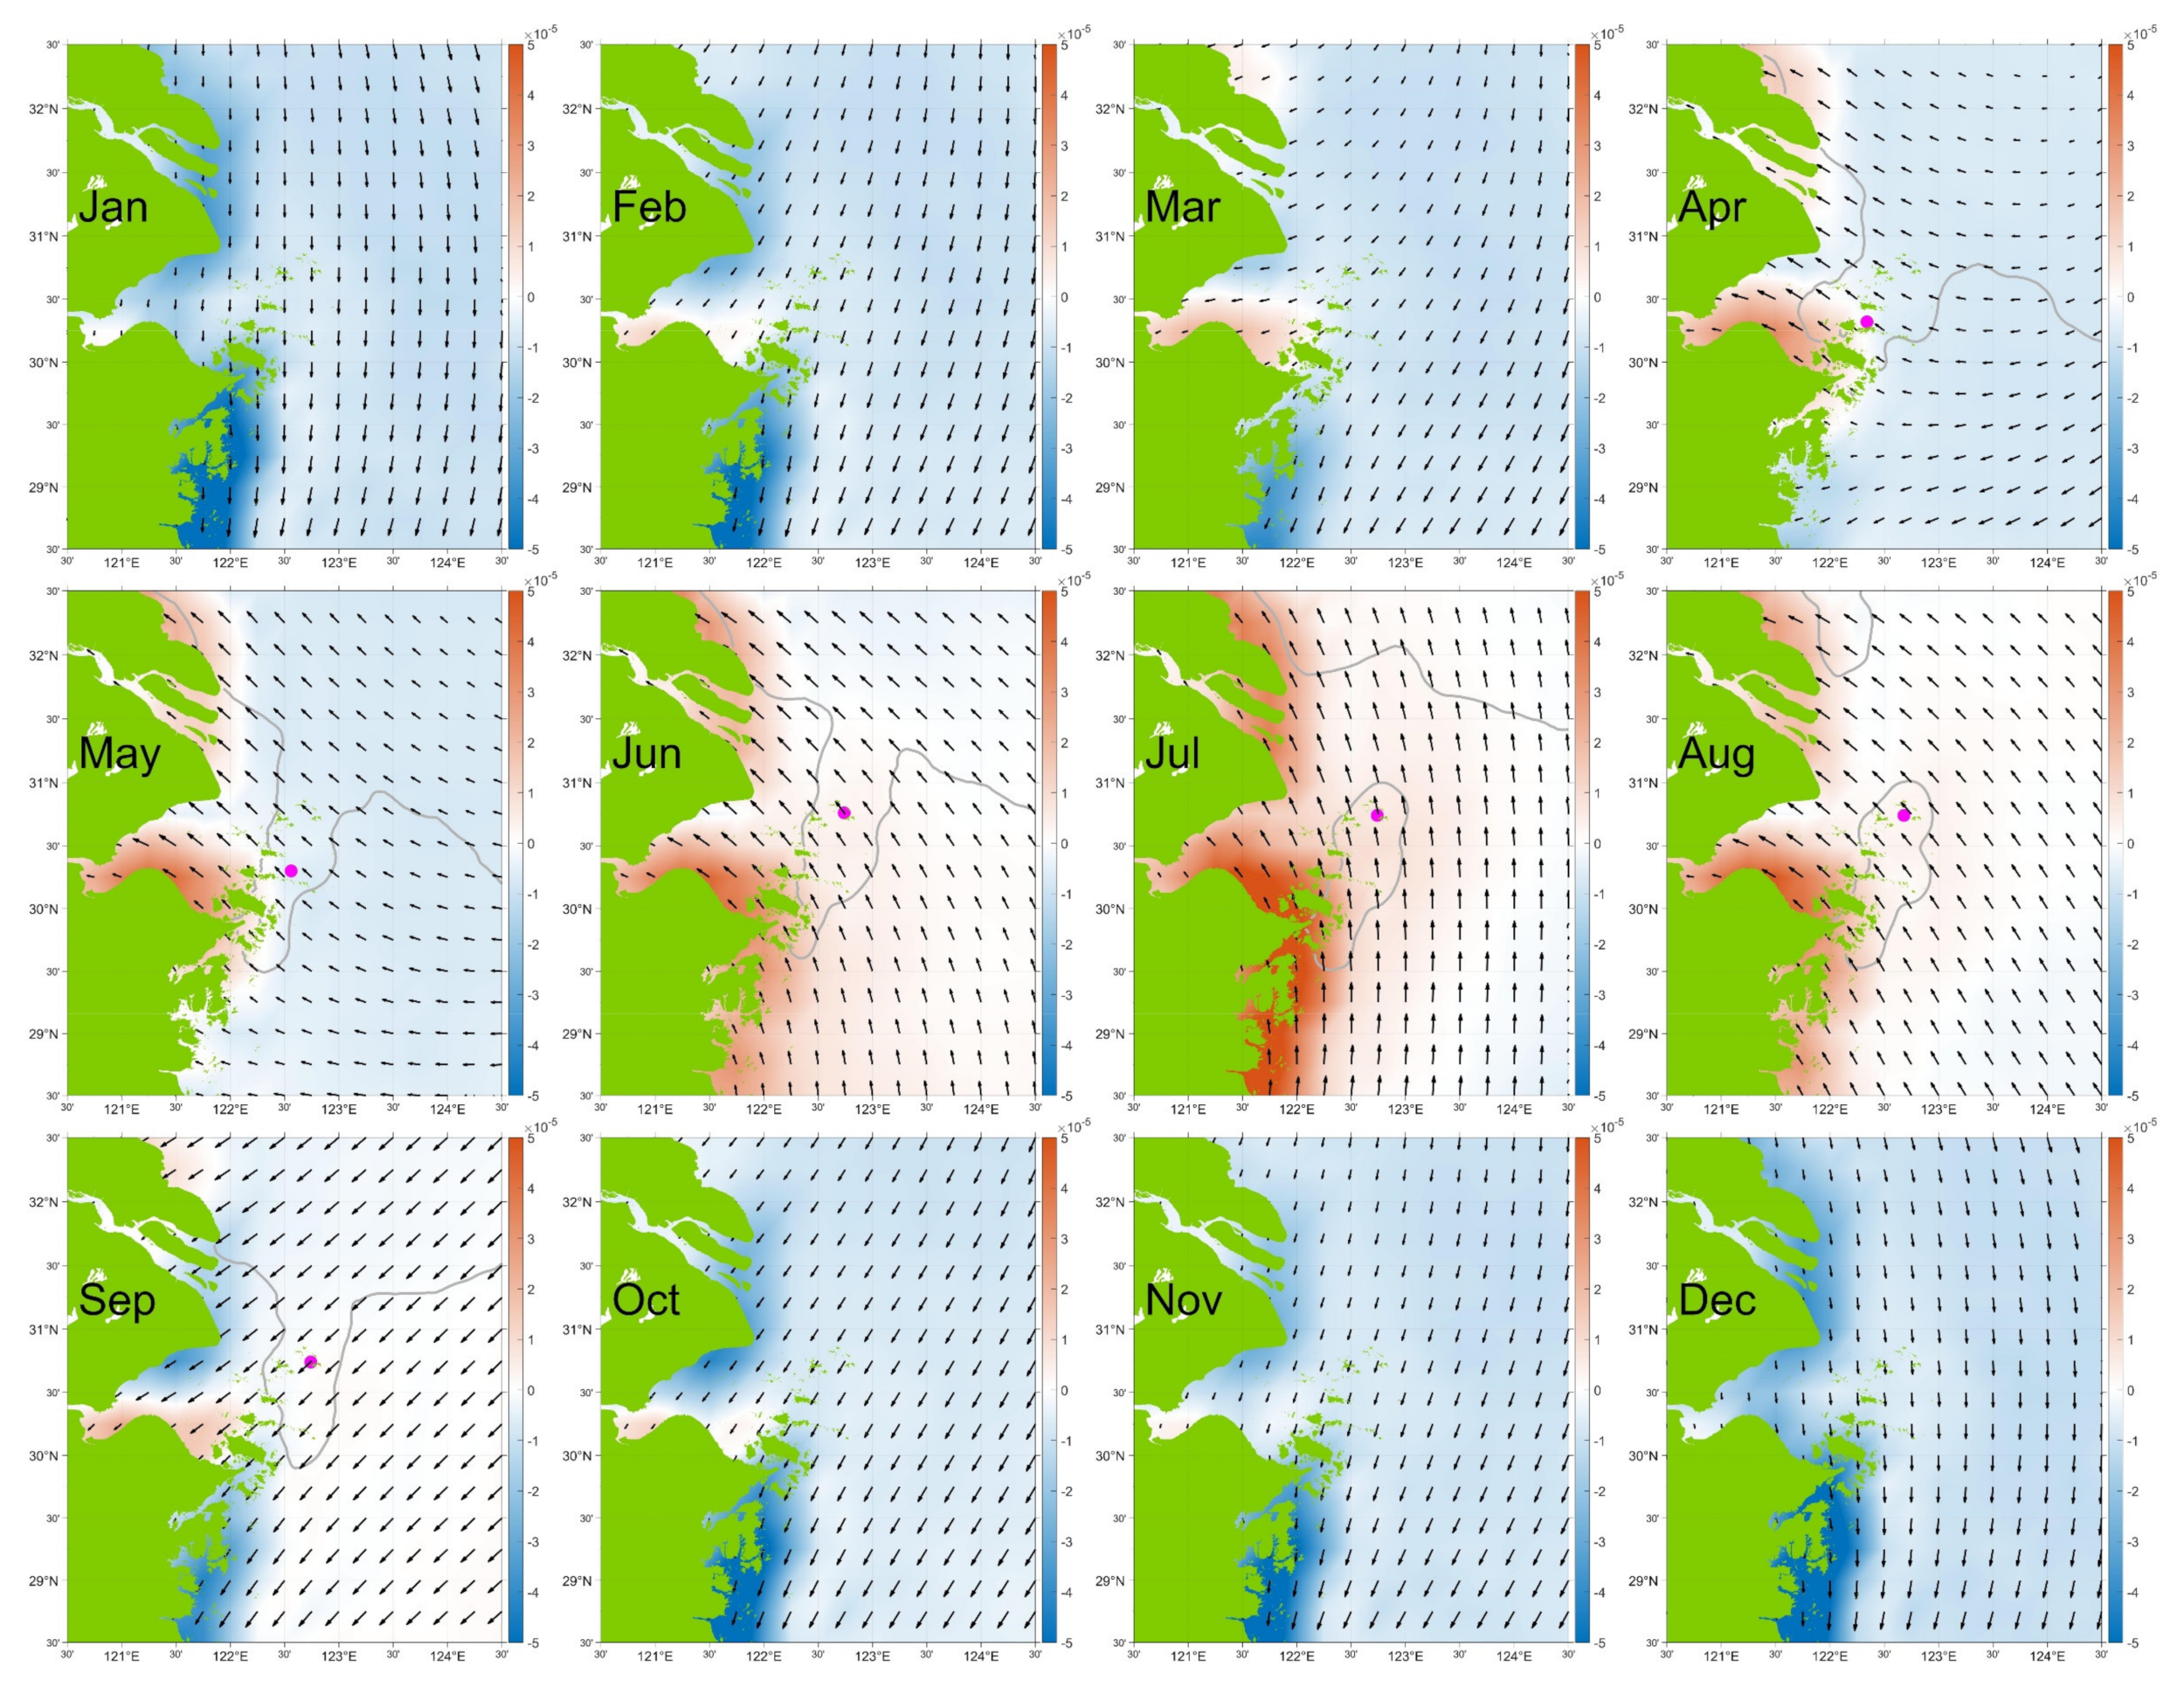
The mechanism of monthly variations of upwelling is well documented in previous studies [3,18,19]. According to the classical Ekman transport theory, alongshore wind causes cross-shore transport of surface water and thus induces coastal upwelling or downwelling. The Zhoushan Islands are in the East Asian monsoon region, with southerly winds prevailing in summer and northerly winds prevailing in winter (Figure 6). The seasonal shift in wind direction thus becomes a vital mechanism for the monthly variations of surface upwelling. A positive/negative wind curl indicates that divergent/convergent flow drives upward/downward vertical motion and intensifies/weakens the surface upwelling [20]. Therefore, a monthly reversal in the wind curl can result in monthly variations in the UPI. As can be seen from Figure 6, the wind curl in the upwelling area began to turn from negative to positive and intensified in April, and gradually weakened again in August, starting to turn from positive to negative in September. This is basically consistent with the variations in the intensity of upwelling. Therefore, the wind curl should also play an important role in the monthly variations of Zhoushan upwelling.
3.2. Statistical Features of Zhoushan Upwelling
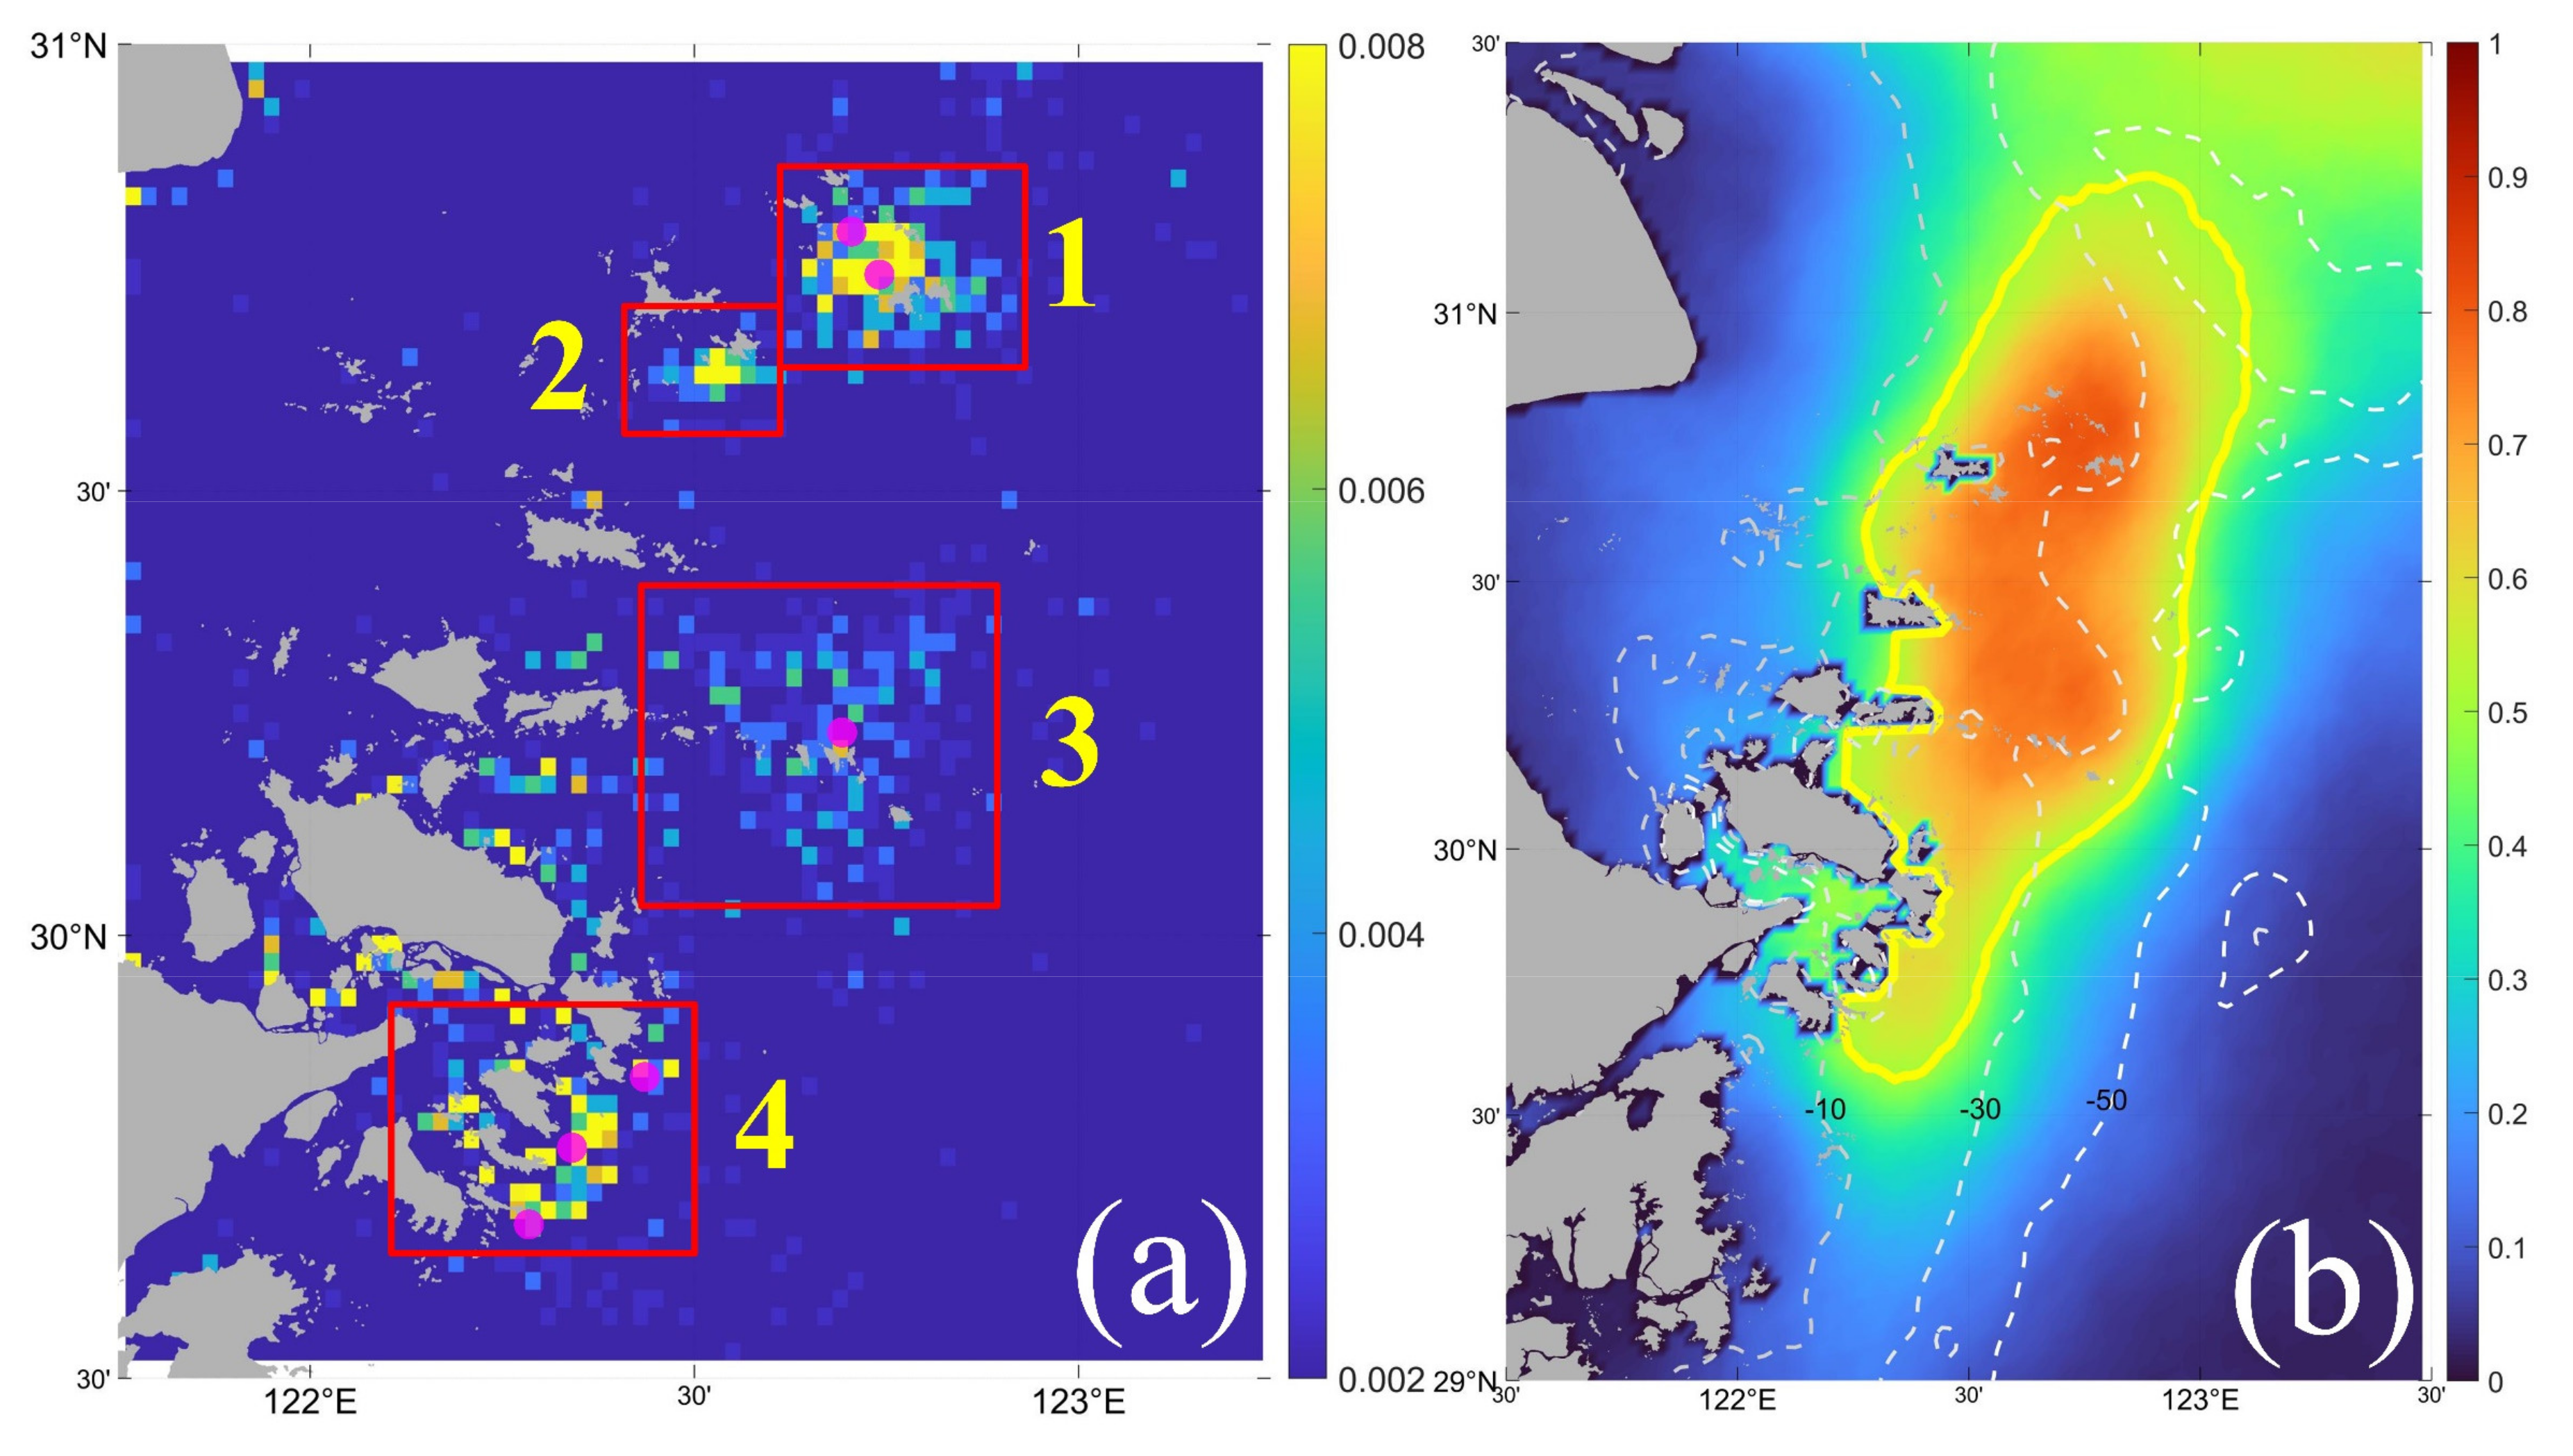
The statistical result of UPF shows that most of the potential upwelling points are clustered in places with large topographic gradients (Figure 1b and Figure 7a). This finding suggests that the topography exerts profound influences on the formation of the Zhoushan upwelling by steering bottom currents to ascend upward and regulating tidal fronts in both location and intensity [1,21,22]. The frequency map of potential upwelling points reveals four clusters (the red box in Figure 7a) located between Gouqi Island and Lvhua Island, in the southeast sea off Shengsi Island, around the Zhongjieshan Islands, and off the east coast of the Taohua-Liuheng Islands. These clusters are collocated with six national marine ranching demonstration areas of China (NMRDACs) around the Zhoushan Islands (see the six magenta dots in Figure 7a). The four clusters (aggregation areas of potential upwelling points) identified in this study have never been reported before. This finding provides observational support for the site selection of potential marine ranches and artificial upwelling.
The frequency map of core area (Figure 7b) portrays the core area of Zhoushan upwelling as an irregular ellipse extending from southwest (SW) to northeast (NE). The absolute maximum frequency of core area is in the 29.5°N–31.25°N, 122°E–123°E area. The southern boundary of the core area is southeast (SE) of Zhoushan Island, while the northern boundary is east of the Yangtze River Estuary. The area of core area with frequency greater than 50% is about 8582 km2. There is a significant correlation between the core area of upwelling and topography (bathymetry): the direction of the major axis of the core area is basically consistent with the direction of the 30 m isobath while the core area distribution is confined to the water depths between 10 m and 50 m.
3.3. Short-Term Variability of Zhoushan Upwelling and Potential Dynamics
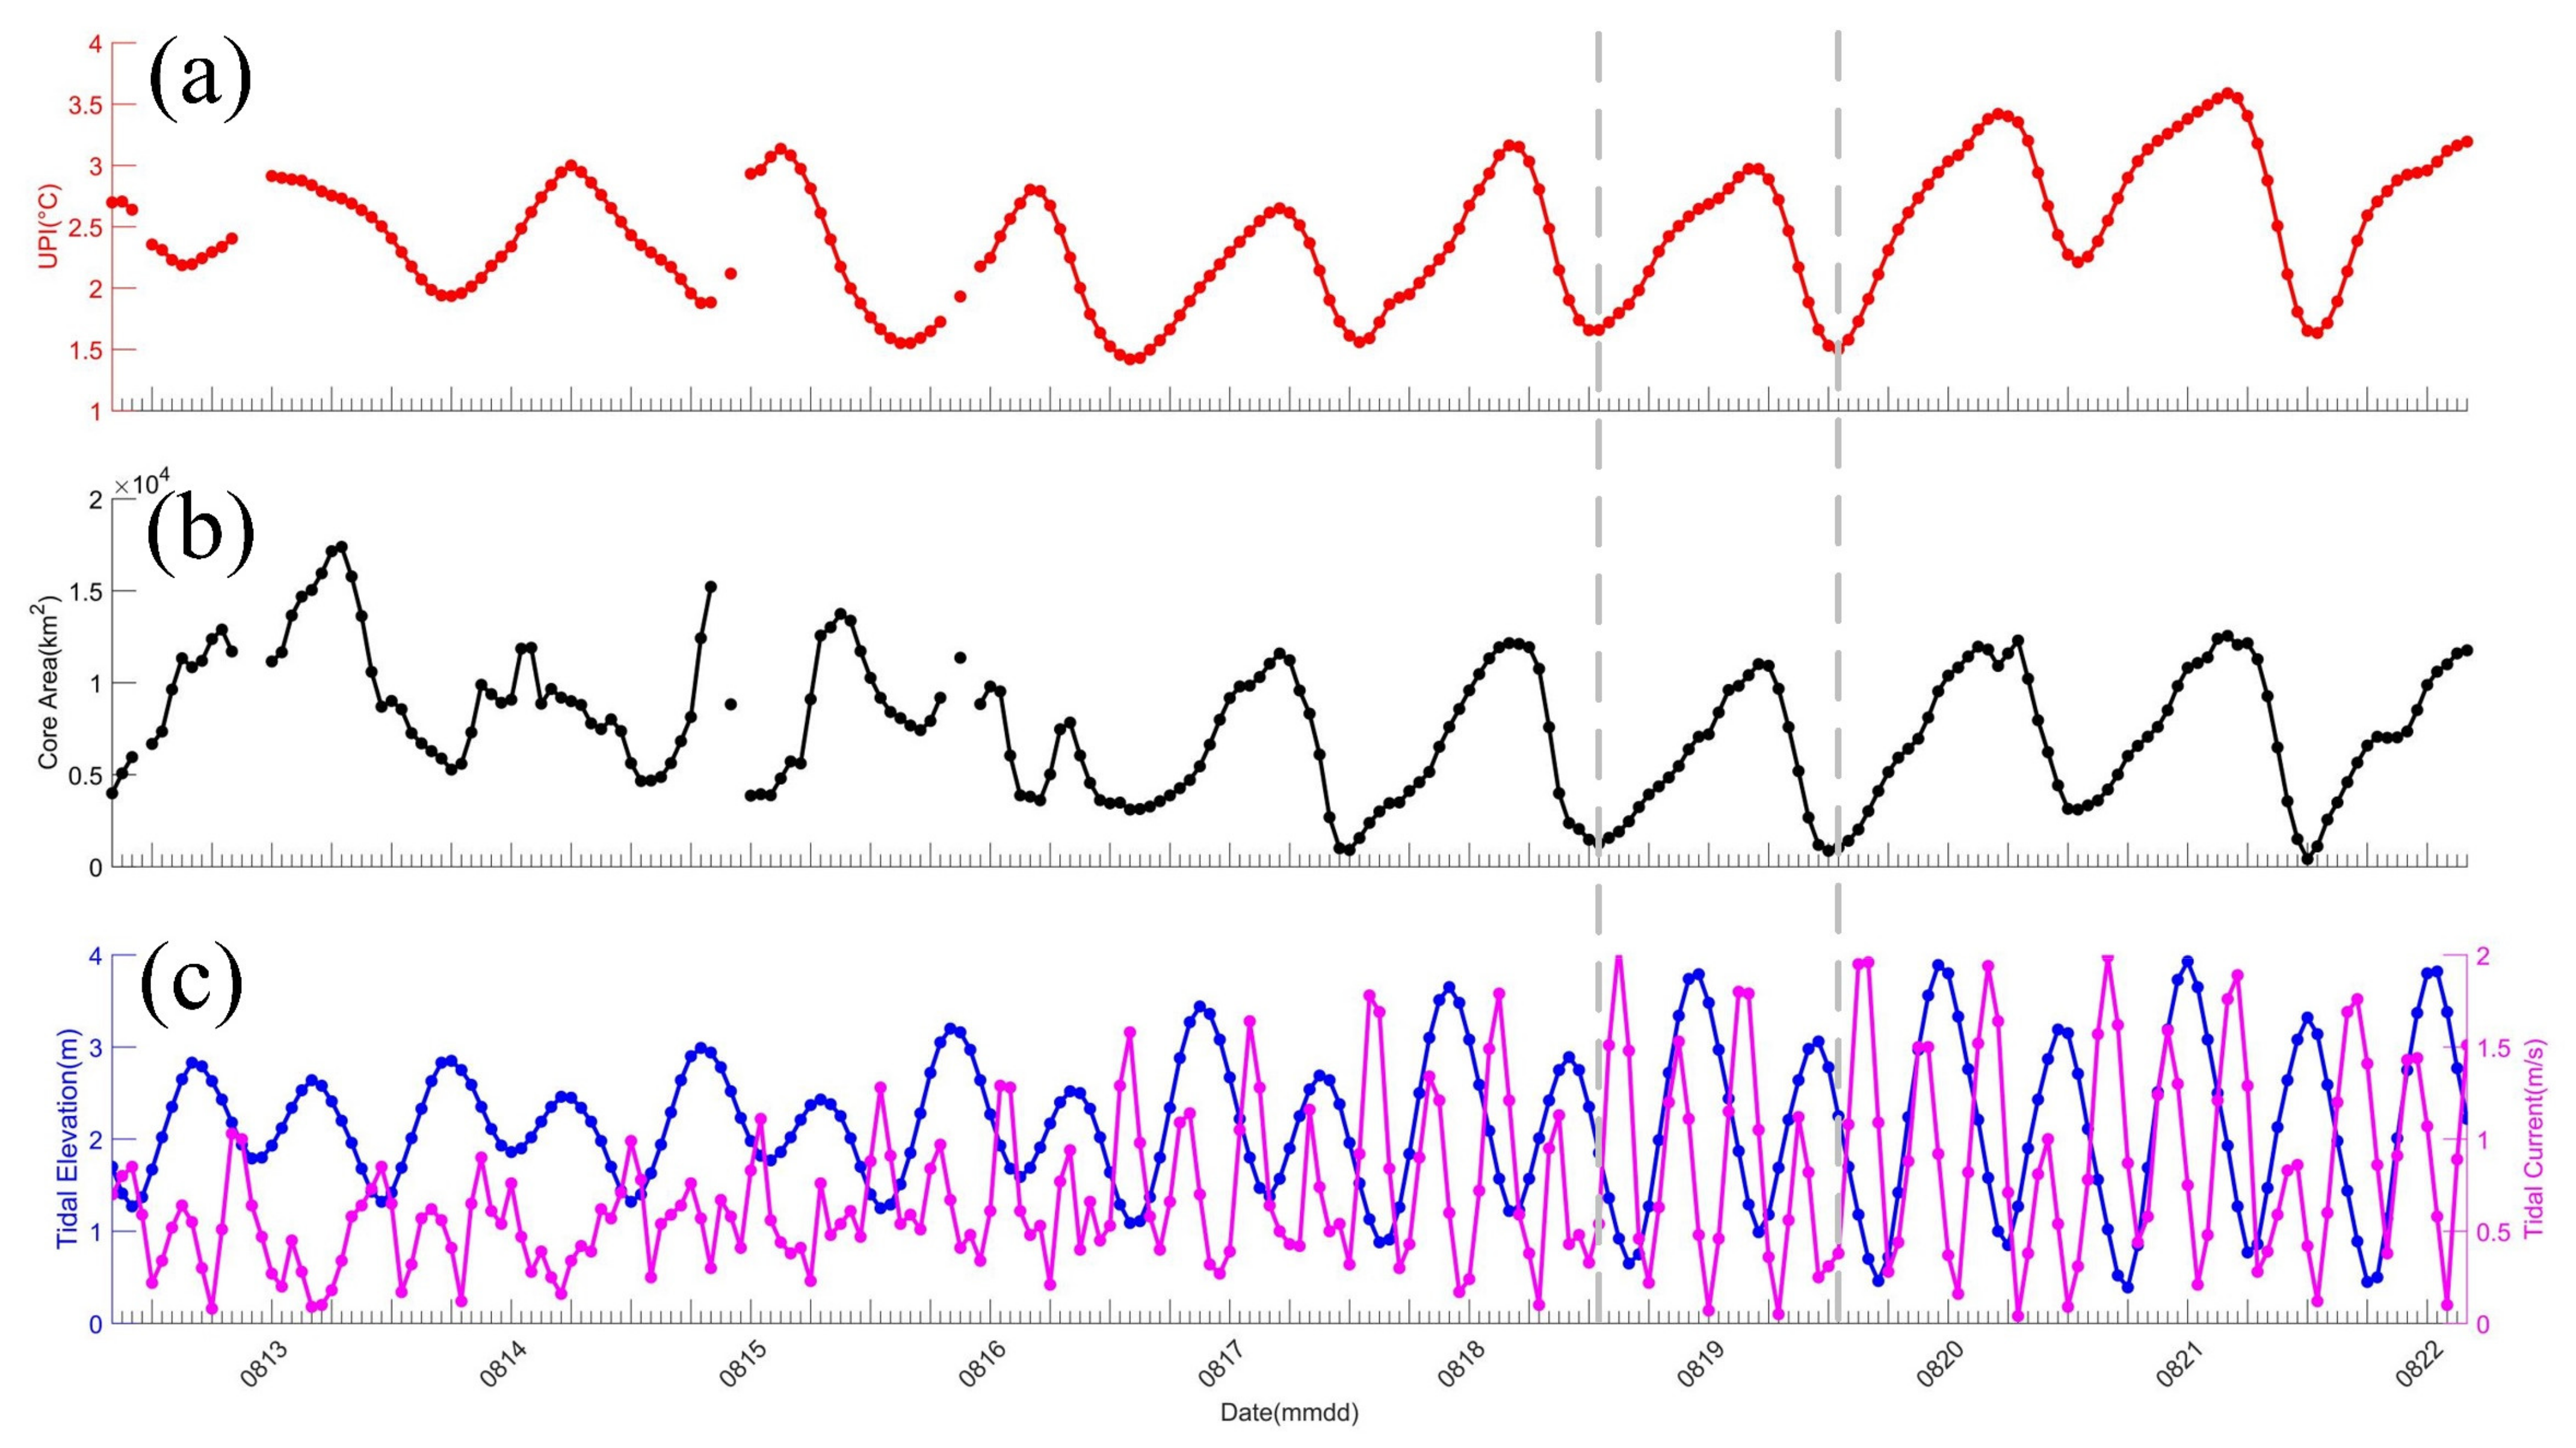
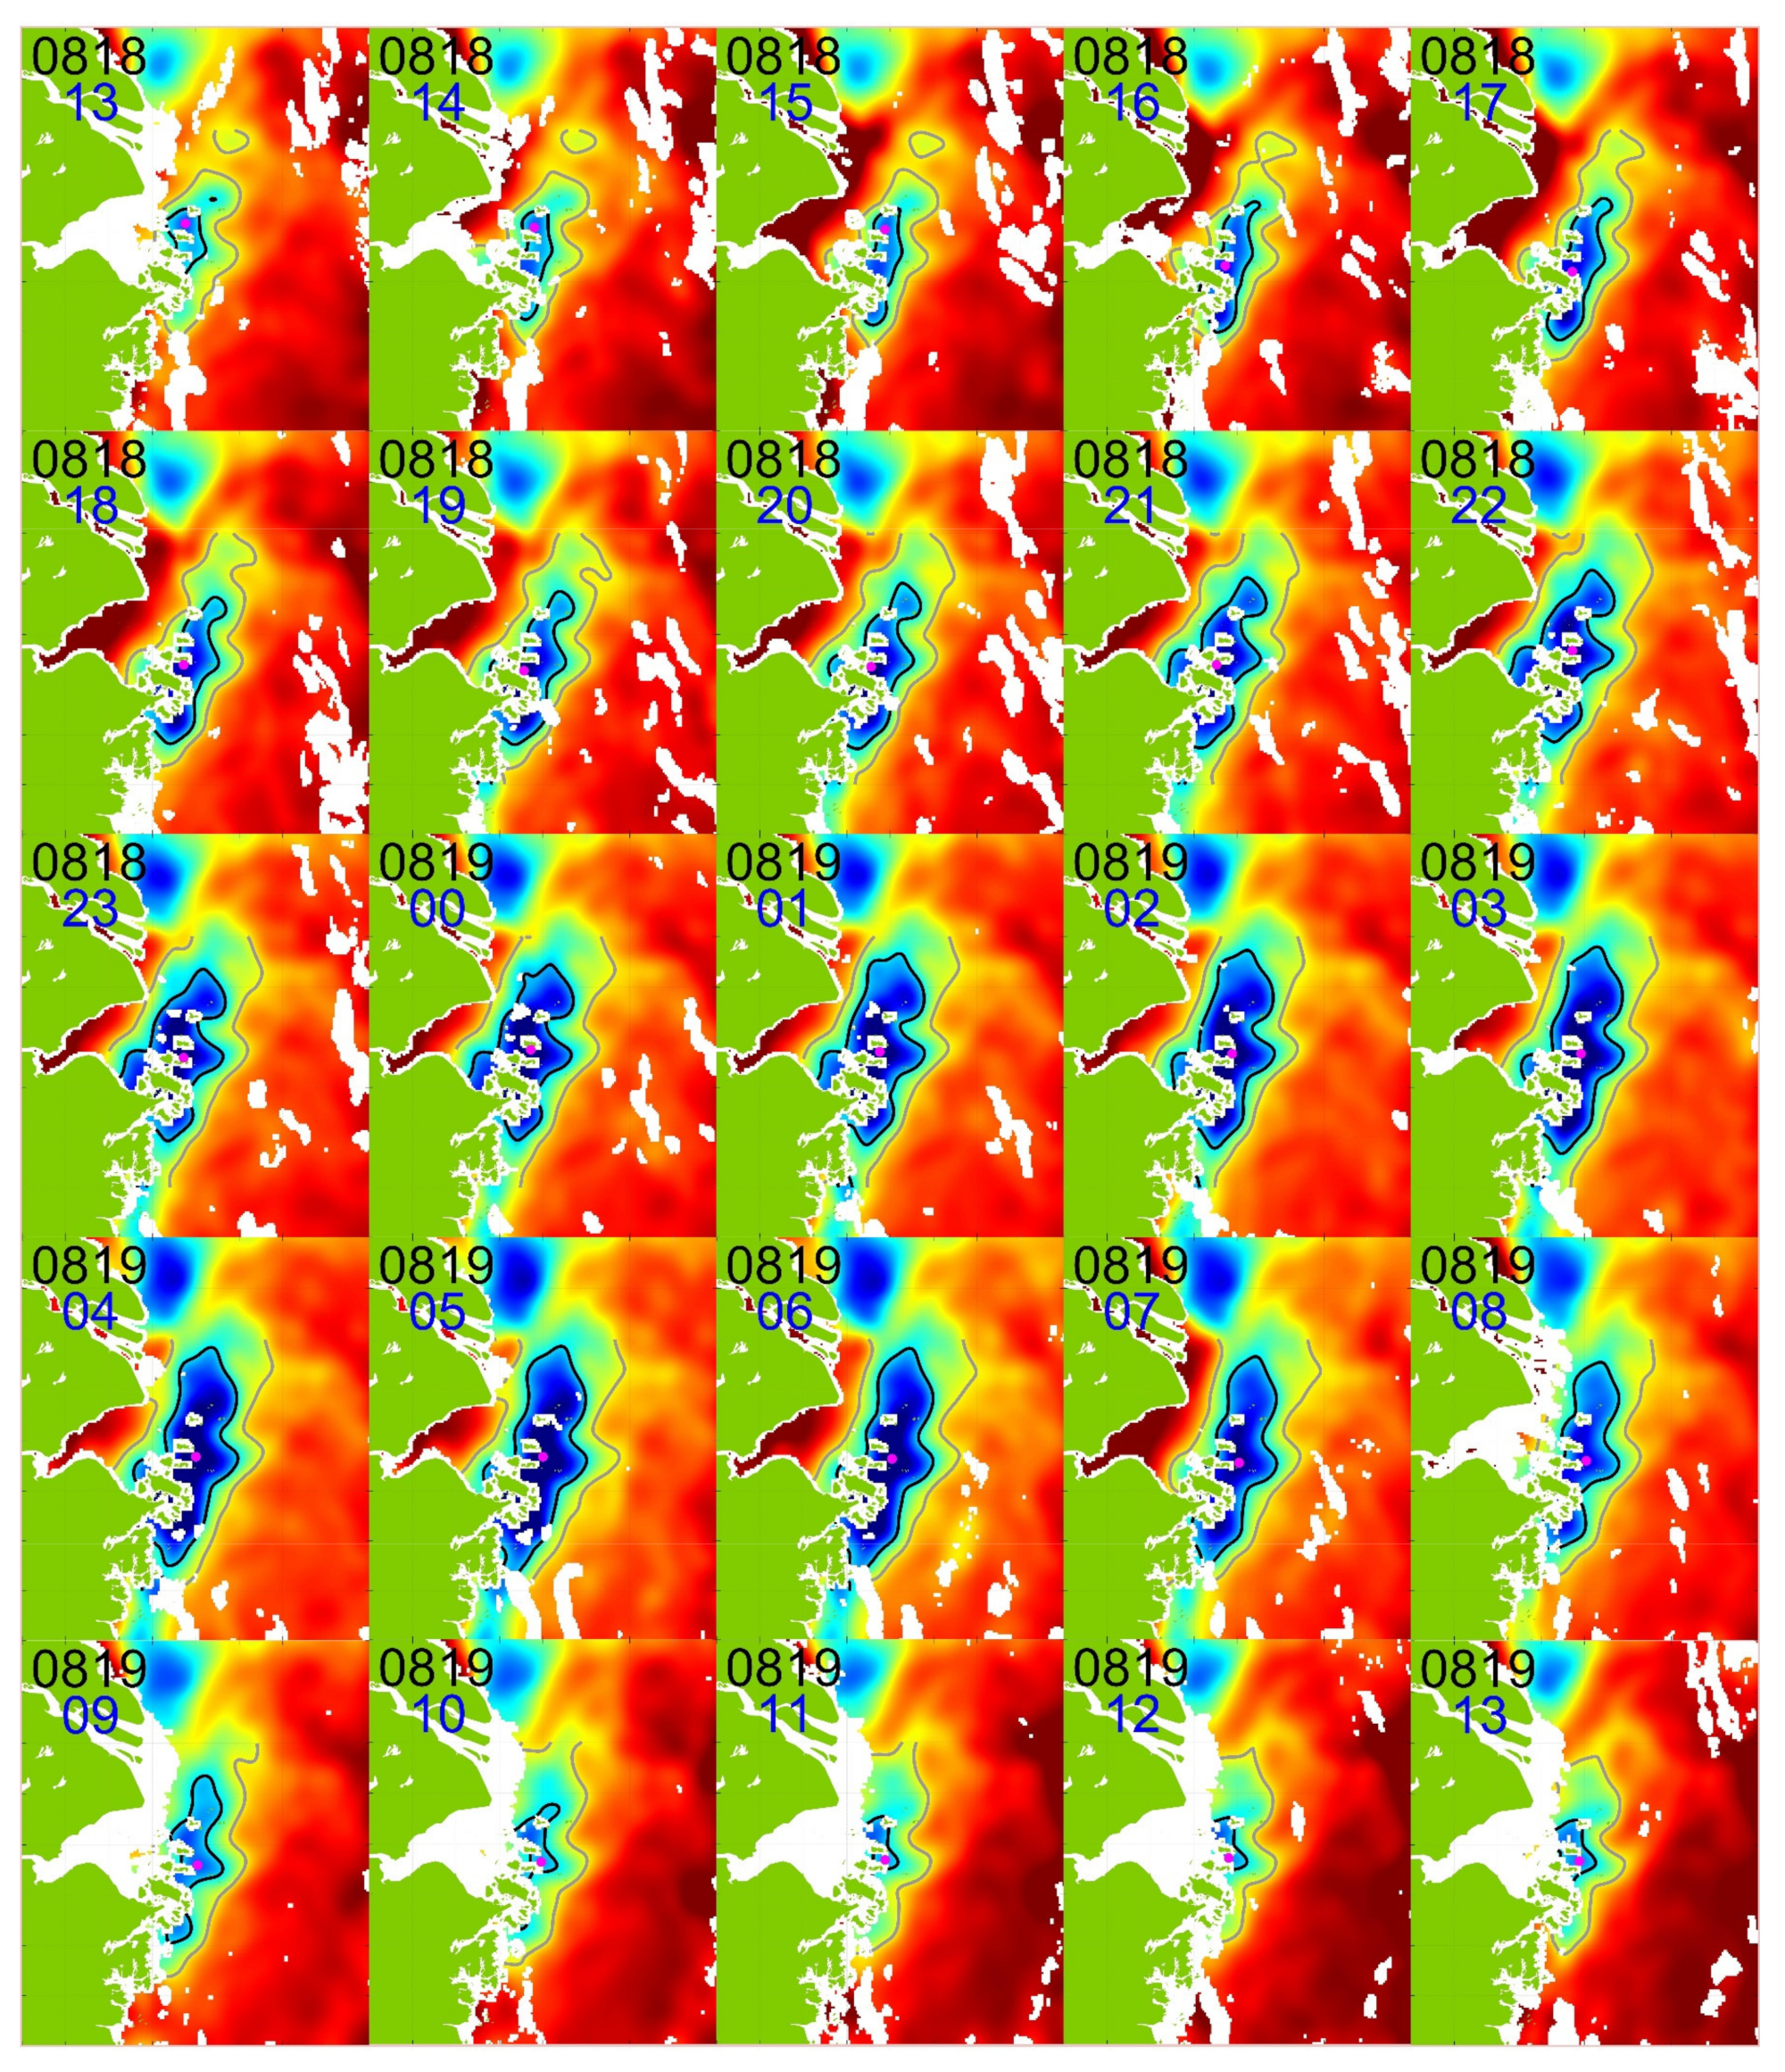
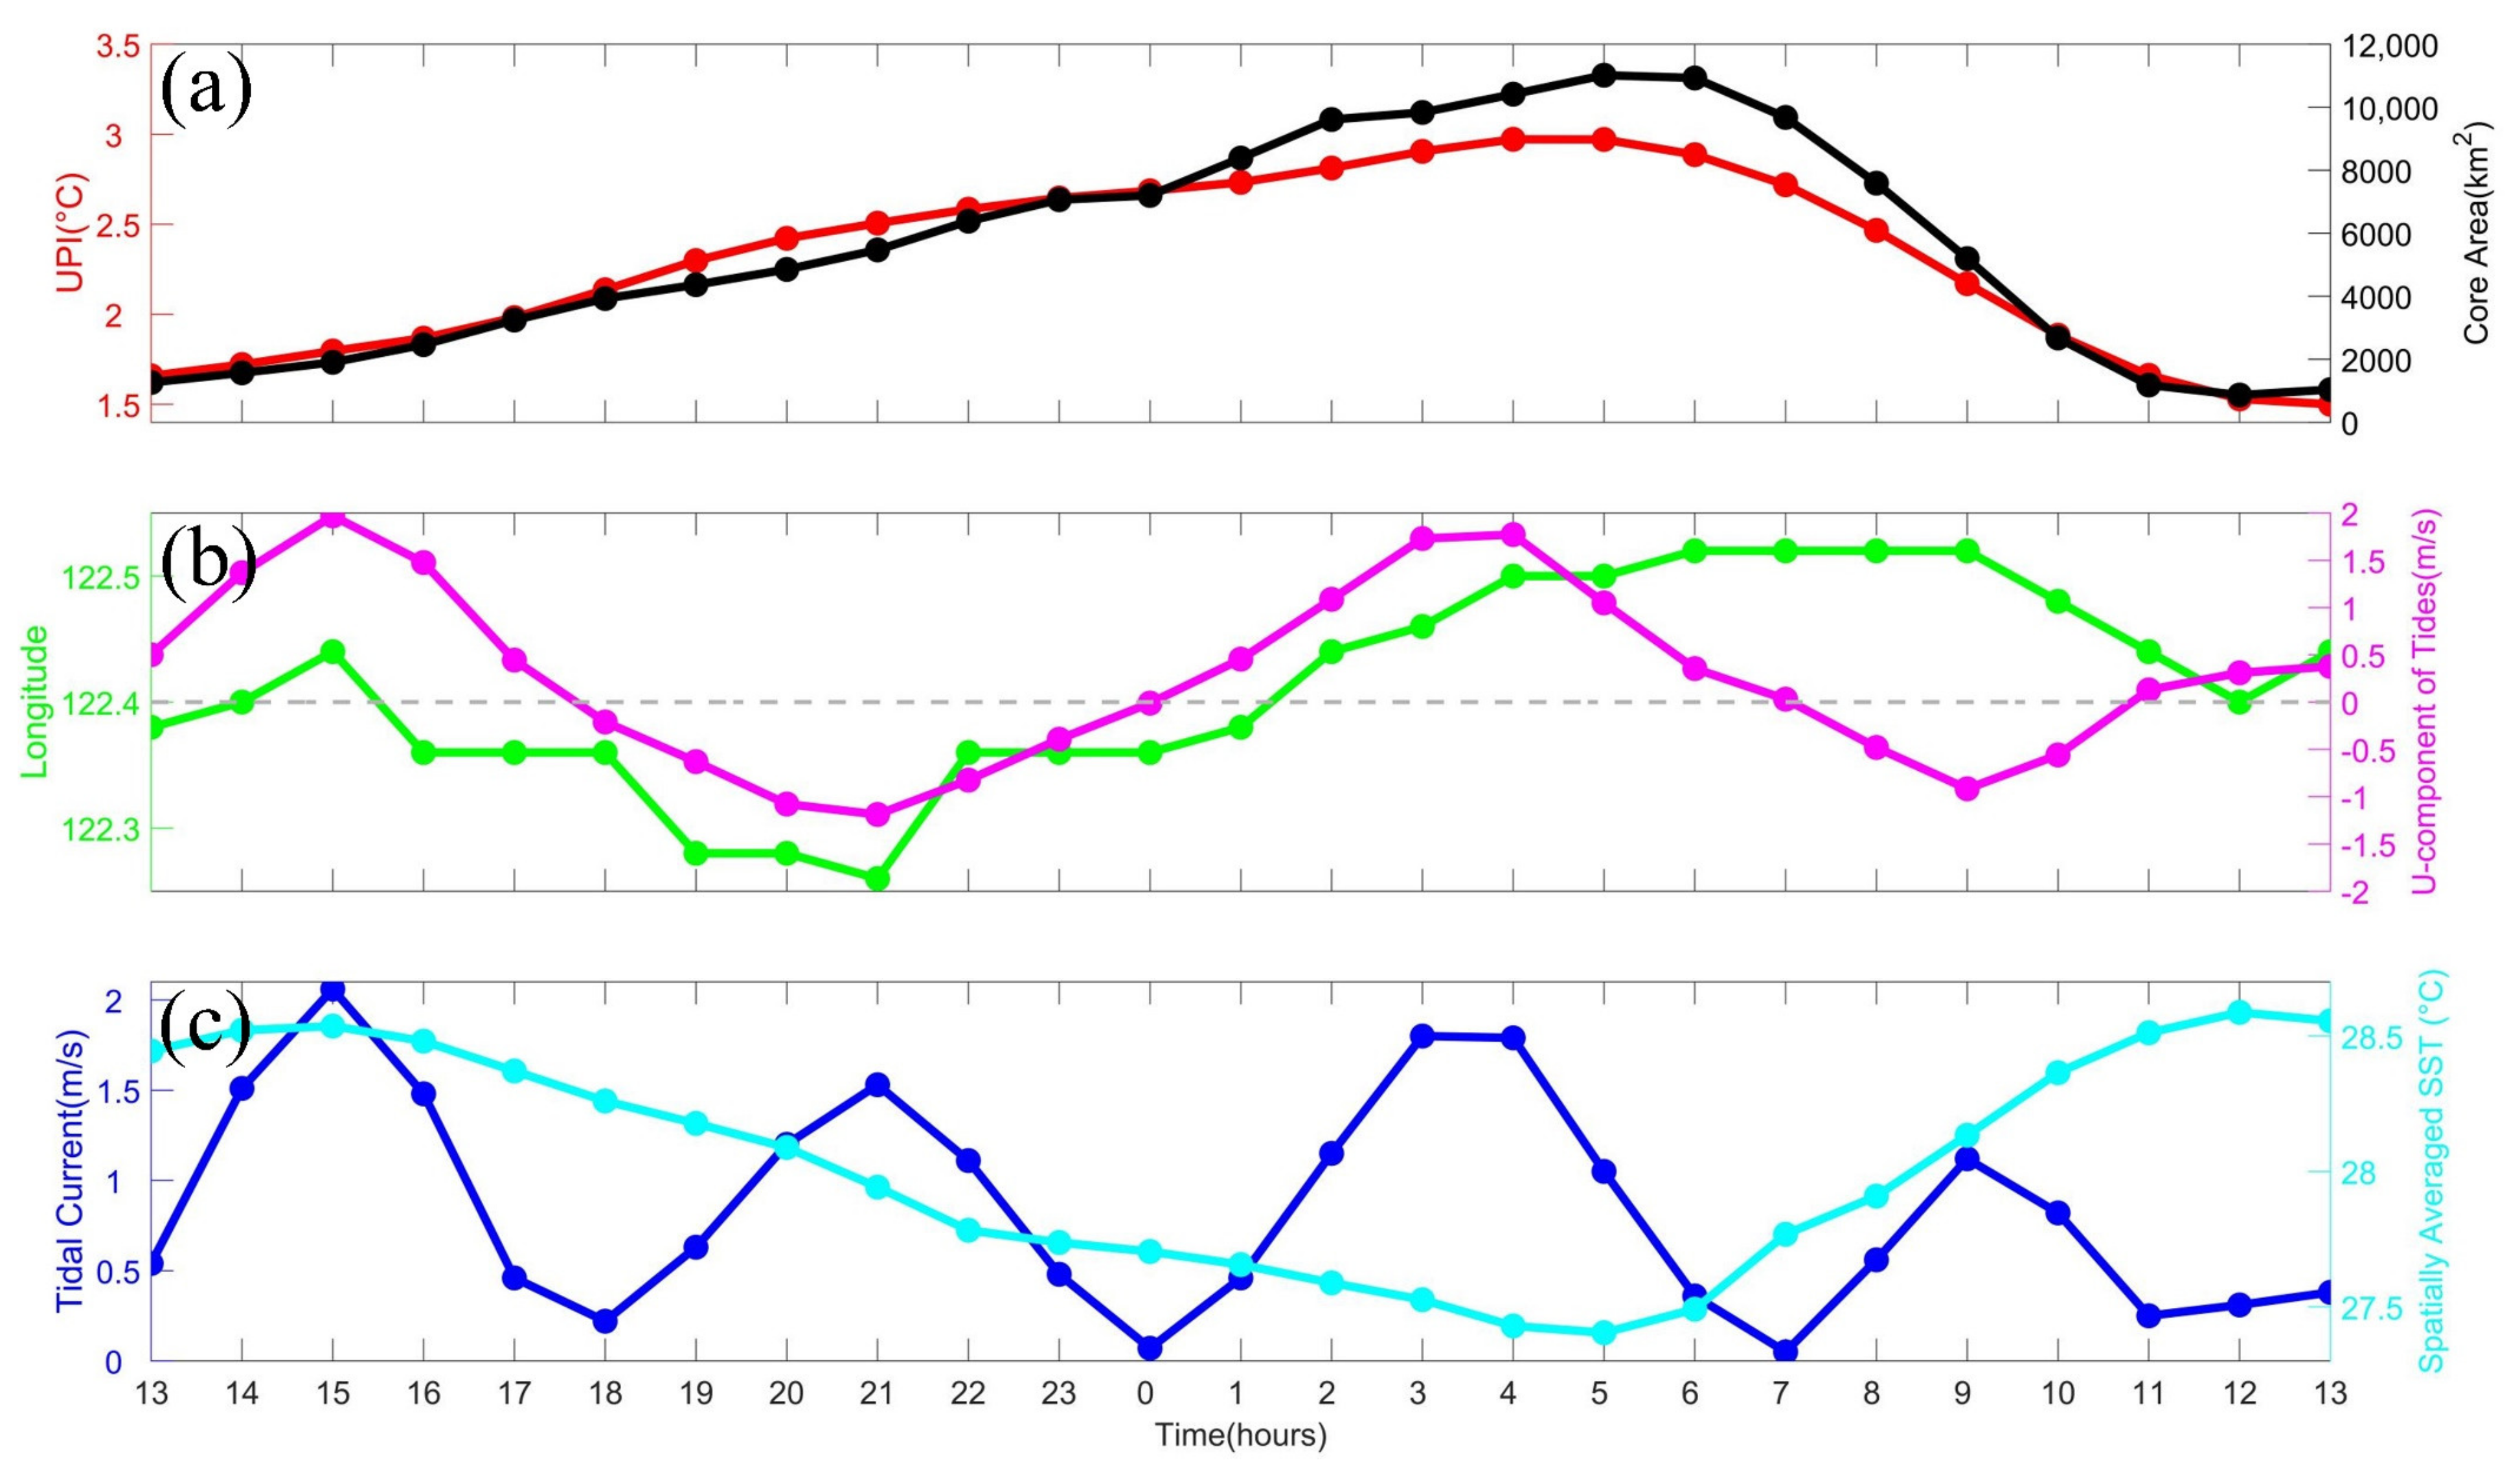
Short-term variations of the Zhoushan upwelling have been mentioned in a few previous papers [4,6]; however, they have not been studied in detail because of the limitations in the temporal resolution and spatial coverage of the observed data. The geostationary satellite images over the last seven years confirmed the universality of the quasi-24 h periodic surface upwelling variations (not shown in this paper, can be seen in Figures S1 and S2). Nearly 10 days of continuous cloud-free Himawari-8 hourly images between 08:00 12 August and 04:00 22 August 2020 (Local time, UTC + 8) were used in this study to show the short-term variation with a period of quasi-24 h (Figure 8a,b, and Video S1). For a detailed analysis of the short-term variation, the 25 satellite images of hourly SST between 13:00 18 August and 13:00 19 August 2020 (Figure 9) were selected as a case for quantitative analysis. In this study, the temperature difference (UPI) and the area of the upwelling () defined in Equations (3) and (4) are used as indicators of the upwelling extension and intensity. High UPI and large indicate more intensive upwelling. Based on the variations in the UPI and (Figure 10a,b), the entire diurnal process can be divided into two stages: from 13:00 18 to 04:00 19 (the intensification stage) and from 05:00 to 13:00 19 (the decay stage).
During the intensification stage, between 13:00 18th and 04:00 19th, the UPI is slowly intensifying, from 1.7 °C to near 3 °C, and the core area expanded from 1264 km2 to 10,414 km2 (Figure 9 and Figure 10a). Under the eastward advection of tidal current (the magenta line in Figure 10b), the center of the upwelling moved seaward from 112.38°E to 122.44°E (the green line in Figure 10b); After 18:00, the center moved shoreward from 122.36°E to 122.26°E within 3 h pushed by the westward tidal current; finally, the center moved seaward again from 122.26°E to 122.5°E between 21:00 18 and 04:00 19. The JAXA-SST spatial pattern (Figure 9) indicates that the core area is shaped as an irregular elliptical with a long axis pointing northeast. The boundaries of the core area (the black line in Figure 9) and the mixed area (the gray line in Figure 9) began to expand eastward and northward throughout the stage, and the northern boundary of the core area reached outside the Yangtze River Estuary.
After the intensity peaked at 04:00 19, the upwelling switched to the decay stage until 13:00 19. The UPI decreased quickly from 3 °C to 1.5 °C, and the core area decreased from 11,016 km2 to 1038 km2 (Figure 9 and Figure 10a). Due to the advection of the tidal current, the center of the upwelling continues to move slowly toward the shore to 122.52°E from 4:00 to 10:00 and then starts to move offshore to 122.4°E from 10:00 to 12:00 (Figure 10b). After 12:00, the center moved offshore again, affected by the eastward tidal current. The boundaries of the core area and the mixed area began to gradually shrink to the northern coastal area of Daishan Island (Figure 9). At this point, the upwelling has undergone a full quasi-24 h periodic cycle.
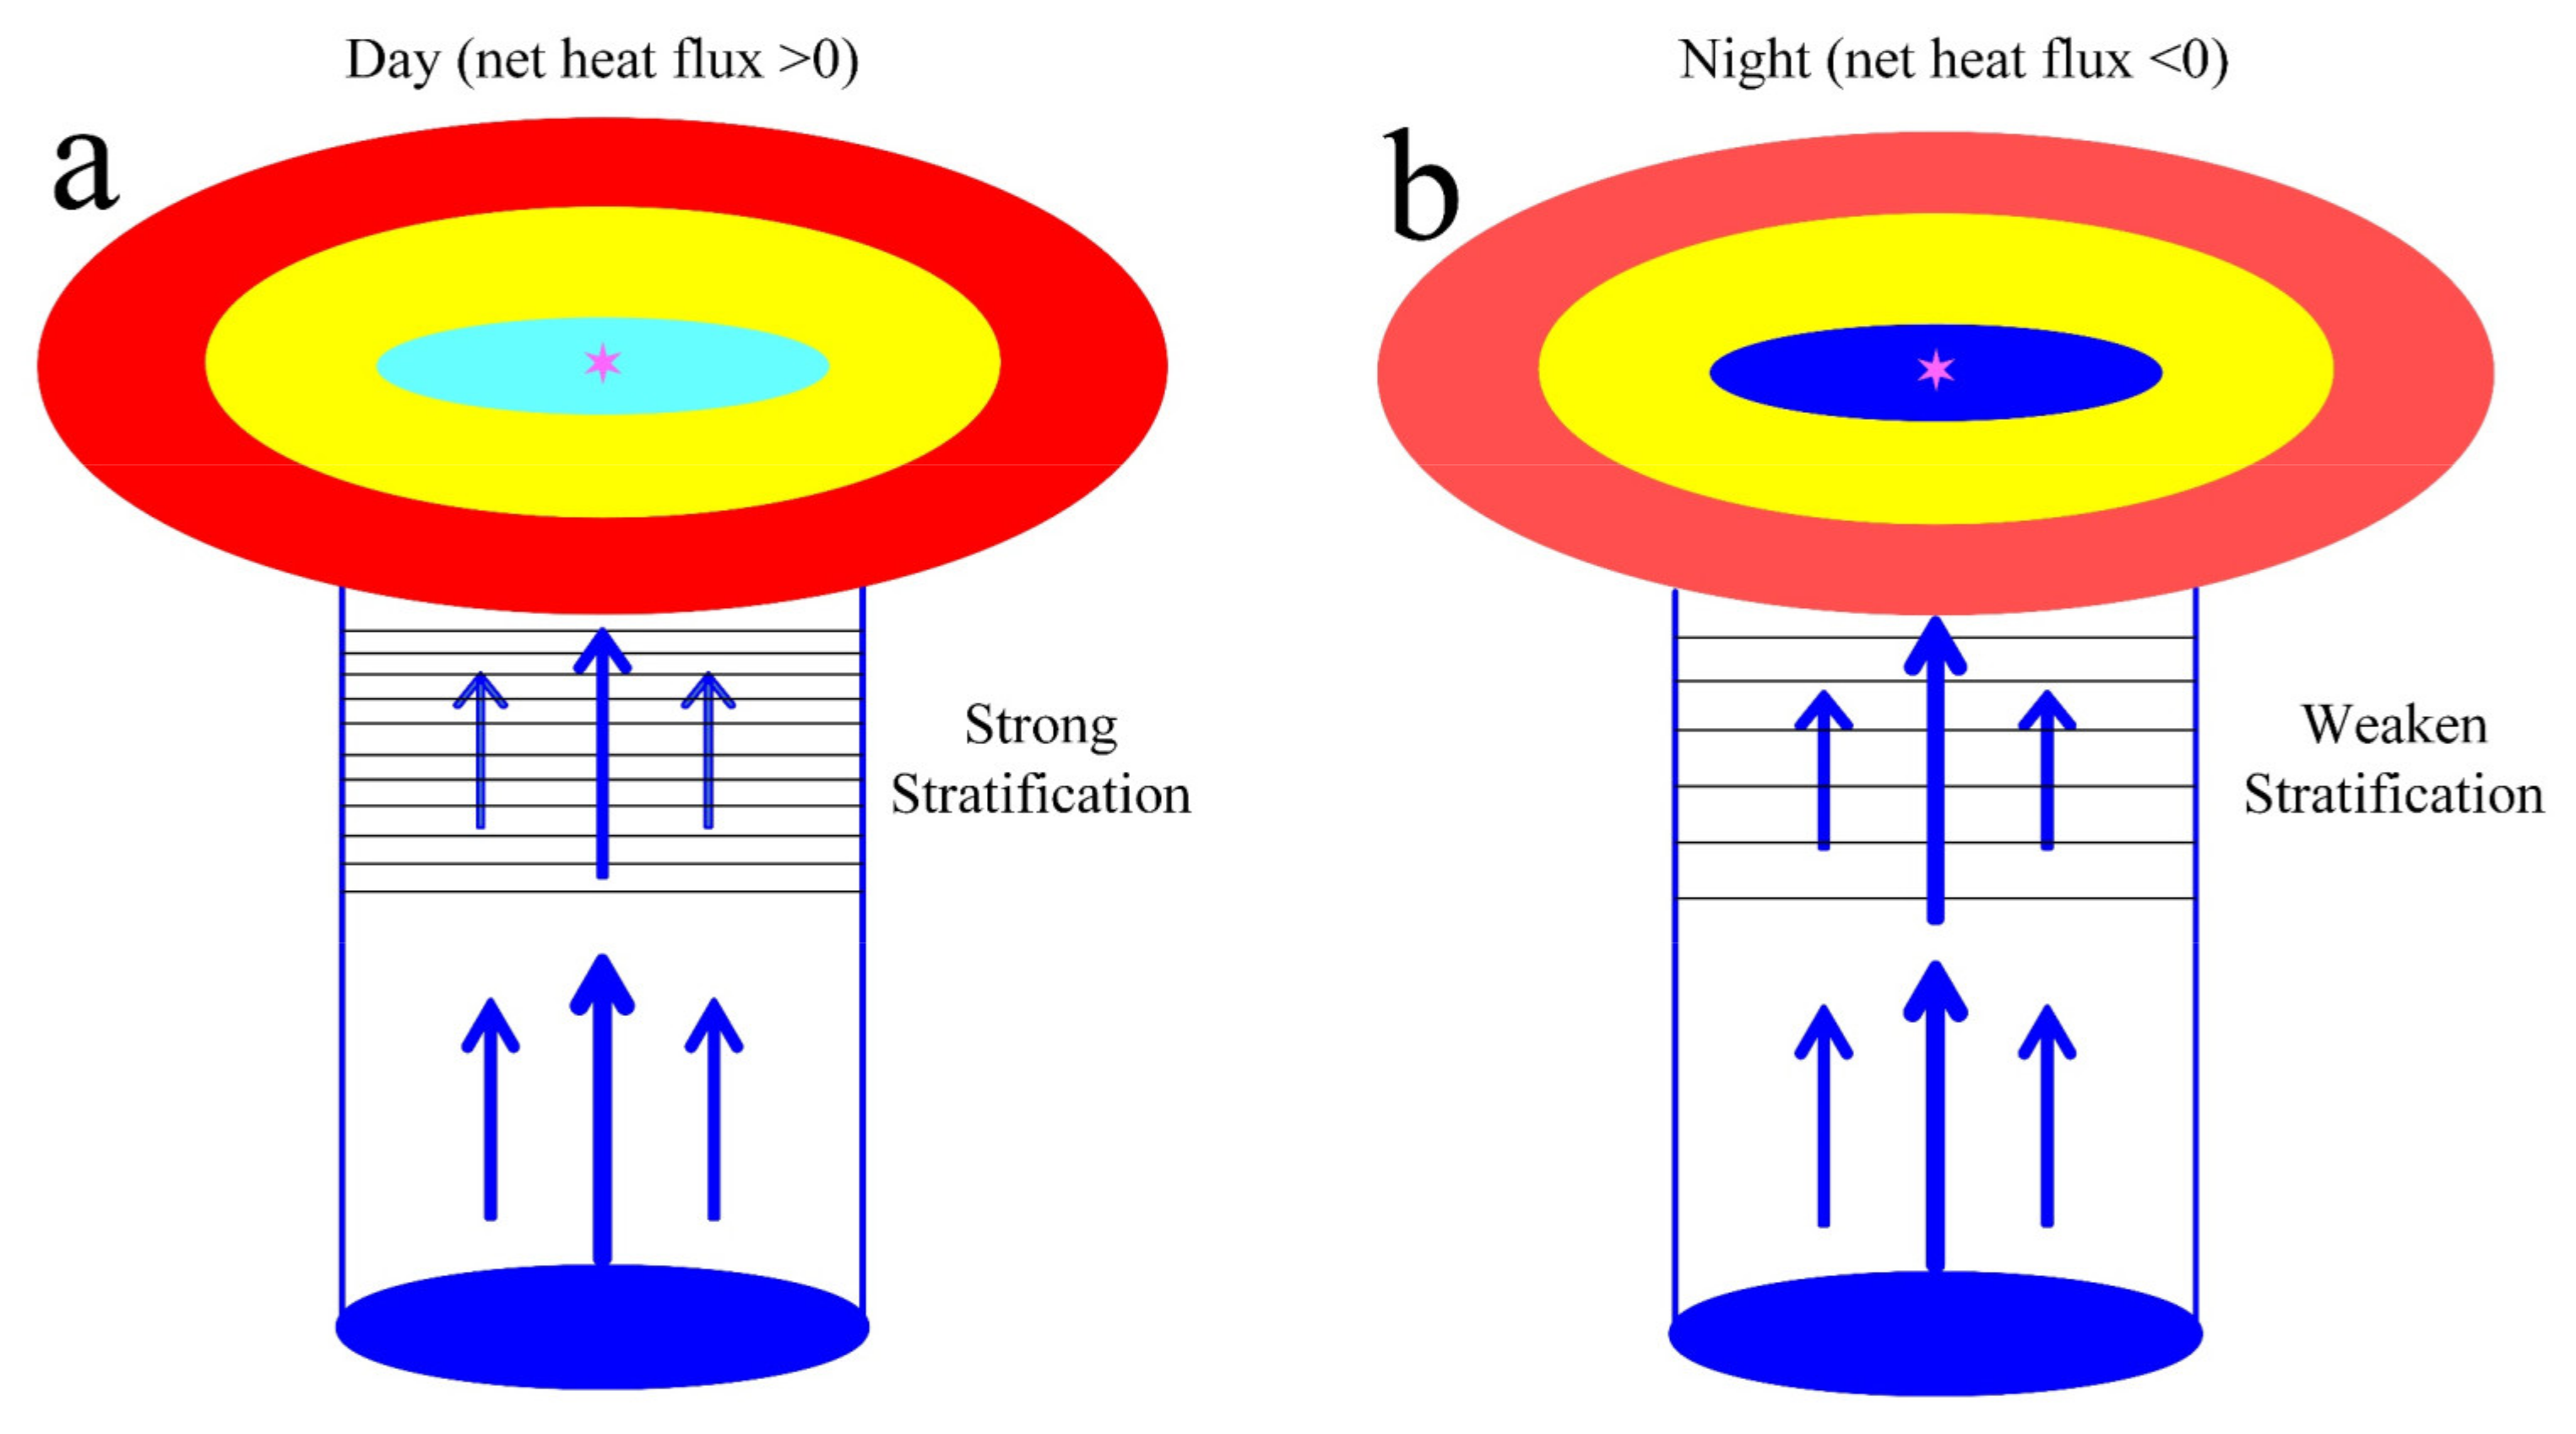
The quasi-24 h periodic variations of Zhoushan surface upwelling observed in this study are beyond expectation. Although the upwelling was caused by the collective effect of many factors, the tide is a key and dominant inducement of the upwelling around the Zhoushan Islands [1,2,17]. The tides contribute to the generation of upwelling because tidal mixing facilitates the expansion of the Yangtze River plume water [17], and strong tidal mixing results in a considerable horizontal density gradient across a tidal front and thus induces upwelling [1,2]. Observational data show that the tide in Zhoushan is dominated by M2 tides, and there are two ebb and flood tides in one day (Figure 8c). Dominated by the tide, the UPI should theoretically have two periodic (~12 h) variations in one day. Namely, when the tidal current increases/decrease, the mixing effect becomes stronger/weaker, and the UPI increases/decreases. The discrepancy between the theoretical and the observational results indicated that the tide may not be the only dominant factor affecting the short-term variations of upwelling. There are other factors that have been invoked to explain the variations in surface upwelling in previous studies, such as wind [8,9], TWC [23,24], CDW [1], and topography [7]. The time scales of these factors do not match with the short-term variations of upwelling (quasi-24 h) and therefore they are not the factors that dominate the diurnal variation. Through correlation analysis, it is found that the spatially averaged SST over the core area (the cyan line in Figure 10c) has a good negative correlation with UPI (the red line in Figure 10a), and the correlation coefficient is −0.98. Therefore, the quasi-24 h periodic variation of SST may be playing an important role in the diurnal variation of UPI. A key process for tidal mixing to induce upwelling is to break the barrier of stratification in the upper ocean. The intensity of stratification in the upper ocean is usually affected by SST in the study area. During the daytime, the increase of SST will lead to the enhancement of stratification, so that tidal mixing cannot break the barrier and result in the decrease of UPI (Figure 11a). At nighttime, the cooling of the sea surface will be weakening the stratification, thus tidal mixing can easily break the barrier and lead to the increase of UPI (Figure 11b). In conclusion, the competing effect of tidal mixing and stratification in the upper ocean may be the dominant mechanism for the surface upwelling’s quasi-24 h periodic variations in this study.
4. Discussion
The only criterion for judging the existence of upwelling in the detection algorithm is whether there is an upwelling center in the center-searching box. The upwelling center is defined as the coldest temperature minimum point in the center-searching box. The existence of the temperature minimum point depends on the SST distribution within and around the center-searching box, especially the CDW located north of the box and the shallower nearshore water mass in the west. If the water temperature outside the box is less than that inside the box, the temperature decreases from the inside to the outside, then there is no temperature minimum point in the box (such as the monthly SST image in October in Figure 4), the algorithm in this paper will automatically determine that there is no upwelling phenomenon in the satellite image at this moment. This usually occurs in autumn and winter, because when the net heat flux at the sea surface is negative, the seawater on the west side of the box cools down faster due to the shallow topography, while the water mass on the north side comes from colder river water. This is the reason why the algorithm used in this study cannot find the upwelling from the SST satellite images from October to March of the following year, although the upwelling exists all year round. It is the main inability of the algorithm, and one of the directions of future work.
Previous studies pointed out that the upwelling appears in June and vanishes in September [4,5,6,25], while the result in this study shows the upwelling occurs as early as April (Figure 5), which is consistent with the results by Xu et al. [9]. Although He et al. [25] noted that the wind-induced upwelling in July is the strongest, which is consistent with the result by Hu and Zhao [3], and the temperature difference (near 1.5 °C) in August is larger than in July (near 1 °C) (ibid., Figure 1); the result of UPI monthly variations in this study also confirmed this (Figure 5). In addition to this, the results of this study also show the location of the upwelling center has a significant monthly migration, which has not been reported in previous studies.
Previous studies have different views on the location of the upwelling center. The SST maps of Liu and Gan [7] feature the coldest SST spot at ~30.7°N, ~122.5°E (ibid., Figure 2b,c), centered around the Shengsi Islands (part of the Zhoushan Archipelago). Hu and Zhao [4] pointed out that there have two upwelling centers: one is near 30°N and another is at 31.5°N. Xu et al. [9] noted that the coldest SST spot was usually located around the Shengsi Islands. Different from the previous statement of single-center or double-center upwelling, the statistical result of UPF show that Zhoushan upwelling has multiple potential upwelling points and can be divided into four clusters: located between Gouqi Island and Lvhua Island, in the southeast sea off Shengsi Island (same to the result of Liu and Gan [7] and Xu et al. [9]), around the Zhongjieshan Islands, and off the east coast of the Taohua-Liuheng Islands. This new finding shows that the upwelling around Zhoushan is a multi-center upwelling system, which was combined by multiple isolated upwelling. The upwelling core area in this study is located at 122°E–123°E, 29.5°N–31.15°N with an irregular ellipse extending from SW to NE (Figure 7b), which is consistent with the results by Hu and Zhao [4] and He et al. [25], and smaller than Lou et al. [5]. In addition to this, it is found that the direction of the major axis of the core area is basically consistent with the direction of the 30 m isobath while the core area distribution is confined to the water depths between 10 m and 50 m. This finding confirms a view reported in the previous studies that topography is a key factor in the formation of Zhoushan upwelling [7].
Due to limitations in the temporal resolution and coverage of the observed data, the short-term variations (daily and hourly) of the Zhoushan upwelling are occasionally mentioned. By analyzing three years’ data of temperature differences from surrounding non-upwelling waters, Lou et al. [5] pointed out that the upwelling has short-time (several-day) variations (ibid., Figure 7). After checking the AVHRR SST images between 18 July and 9 August 2004 (ibid., Figure 3), Hu and Zhao [4] concluded that the Zhoushan upwelling has a short-term daily variation, and is related to the variation of southwest alongshore wind. Compared with previous results (daily), the results in this study finely characterize the quasi-24 h periodic process of surface upwelling on a smaller timescale (hourly). This finding is beyond expectation and has never been reported before. A preliminary discussion suggests that in addition to tidal mixing, changes in the intensity of upper ocean stratification due to diurnal variations in solar radiation are also playing an important role in the quasi-24 h periodic variation of surface upwelling. These new findings and mechanisms may contribute to future theoretical and numerical studies.
5. Conclusions
The Level 3 daily and hourly SST data from Himawari-8 AHI were used to quantitatively document statistical features, seasonal variations, and short-term variations of the Zhoushan upwelling. To quantify the features of surface upwelling, an SST-gradient-based upwelling detection algorithm, which has been successfully applied in a quantitative study of upwelling in northeastern Taiwan, was adapted for this study. The results once again demonstrate the usability of the algorithm and, therefore, can be extended to other regions to detect surface upwelling.
Similar to previous studies, our results show that the Zhoushan upwelling appears in April, usually peaks in August, and rapidly disappears in September. It was also found that the location of the upwelling center also has a significant monthly migration: it appeared first in the coastal area with steep terrain near the northern Daishan Island in April, then moved eastward to the northern sea of Zhongjieshan Islands in May; finally it moved to the northeast of Shengsi Island, in between Gouqi Island and Lvhua Island in June, and remained quasi-stationary until the upwelling disappeared in October.
The statistical results show that potential upwelling points are clustered in places with large topographic gradients and can be divided into four aggregation areas: (1) between Gouqi Island and Lvhua Island, (2) SE of Shengsi Island, (3) around the Zhongjieshan Islands, and (4) east of the Taohua-Liuheng Islands. The core area of Zhoushan upwelling runs from SW to NE between 10 m and 50 m isobaths. These findings have never been reported before and may provide observational support for site selection of potential marine ranching and artificial upwelling.
The unexpected short-term variations of upwelling in the actual observations were captured by Himawari-8. The lifecycle was shown to be quasi-24 h and can be divided into two stages: intensification and decay. In addition, an hourly migration of the upwelling center under the advection of tidal current was also found. A preliminary analysis suggests that the quasi-24 h periodic variations may be caused by the competing effect between tidal mixing and the stratification in the water column. The quantitative analysis of the detailed features in this process will greatly improve our observational understanding of the details in the short-term variation and provide an empirical basis for future theoretical and numerical studies.
Supplementary Materials
The following supporting information can be downloaded at https://www.mdpi.com/article/10.3390/rs14143261/s1: Video S1 shows the animation of Zhoushan upwelling short-term variation between 08:00 12 August and 04:00 22 August 2020 (Beijing time, UTC + 8). Figure S1 shows the quasi-24 h periodic variation of UPI between 00:00 28 July and 23:00 08 August 2019. Figure S2 shows the quasi-24 h periodic variation of UPI in July 2018.
Author Contributions
Conceptualization, W.Y. and S.H.; methodology, W.Y.; software, W.Y. and Y.M.; validation, W.Y. and D.W.; formal analysis, W.Y. and Y.M.; investigation, W.Y. and D.W.; resources, W.Y. and Y.M.; data curation, W.Y. and D.W.; writing—original draft preparation, W.Y.; writing—review and editing, S.H. and D.H.; visualization, W.Y. and Y.M. All authors have read and agreed to the published version of the manuscript.
Funding
This research was funded by the National Natural Science Foundation of China, grant Number (41906025); the National Natural Science Foundation of China, grant Number (41876031); the National Key Research and Development Plan of China, grant number (2018YFD0900901); the Hainan Provincial Natural Science Foundation of China, grant number (420QN289).
Data Availability Statement
The JAXA-SST data used in this study can be downloaded from the Japan Aerospace Exploration Agency (http://www.eorc.jaxa.jp/ptree accessed on 1 April 2021); the CCMP wind data used in this study can be downloaded from the Remote Sensing System (https://www.remss.com/measurements/ccmp/ accessed on 14 March 2022); the tide data used in this study can be obtained from the Zhoushan Sea Tide Information Release System (http://hai.edianweb.cn accessed on 12 April 2022).
Acknowledgments
We deeply thank Igor Belkin (US) for his assistance in improving this manuscript.
Conflicts of Interest
The authors declare no conflict of interest.
References
- Lü, X.; Qiao, F.; Xia, C.; Zhu, J.; Yuan, Y. Upwelling off Yangtze River estuary in summer. J. Geophys. Res. Ocean. 2006, 111. [Google Scholar] [CrossRef]
- Lü, X.; Qiao, F.; Xia, C.; Yuan, Y. Tidally induced upwelling off Yangtze River estuary and in Zhejiang coastal waters in summer. Sci. China Ser. D Earth Sci. 2007, 50, 462–473. [Google Scholar] [CrossRef]
- Hu, M.; Zhao, C. Long-time observation of upwelling in the Zhoushan Islands and adjacent seas during the summer season. Period. Ocean Univ. China 2007, 1, 235–240. [Google Scholar]
- Hu, M.; Zhao, C. Upwelling in Zhejiang coastal areas during summer detected by satellite observations. Natl. Remote Sens. Bull. 2008, 12, 304. [Google Scholar]
- Lou, X.; Huang, W.; Shi, A. Spatial and Temporal Characteristics of Upwelling Along the Zhejiang Coast of the East China Sea. In Proceedings of the Dragon 2 Programme Mid-Term Results 2008–2010, Guilin City, China, 17–21 May 2010; 684, p. 29. [Google Scholar]
- Lou, X.; Shi, A.; Xiao, Q.; Zhang, H. Satellite observation of the Zhejiang Coastal upwelling in the East China Sea during 2007–2009. In Proceedings of the Remote Sensing of the Ocean, Sea Ice, Coastal Waters, and Large Water Regions 2011, Prague, Czech Republic, 21–22 September 2011; p. 81751M. [Google Scholar]
- Liu, Z.Q.; Gan, J.P. Modeling study of variable upwelling circulation in the East China Sea: Response to a coastal promontory. J. Phys. Oceanogr. 2014, 44, 1078–1094. [Google Scholar] [CrossRef]
- Huang, Q.; Xu, Q.; Zhang, S.; Cheng, Y. Study of coastal upwelling around Zhoushan Islands based on satellite measurements and numerical model. In Proceedings of the 2016 Progress in Electromagnetic Research Symposium (PIERS), Shanghai, China, 8–11 August 2016; pp. 4764–4768. [Google Scholar]
- Xu, Q.; Zhang, S.S.; Cheng, Y.C.; Zuo, J.C. Interannual Feature of Summer Upwelling around the Zhoushan Islands in the East China Sea. J. Coast. Res 2017, 33, 125–134. [Google Scholar] [CrossRef]
- Yang, S.; Mao, X.; Jiang, W. Interannual variation of coastal upwelling in summer in zhejiang, china. Period. Ocean Univ. China 2020, 50, 1–8. [Google Scholar]
- Yin, W.; Huang, D. Short-Term Variations in the Surface Upwelling off Northeastern Taiwan Observed via Satellite Data. J. Geophys. Res. Ocean. 2019, 124, 939–954. [Google Scholar] [CrossRef]
- Bessho, K.; Date, K.; Hayashi, M.; Ikeda, A.; Imai, T.; Inoue, H.; Kumagai, Y.; Miyakawa, T.; Murata, H.; Ohno, T. An introduction to Himawari-8/9—Japan’s new-generation geostationary meteorological satellites. J. Meteorol. Soc. Japan. Ser. II 2016, 94, 151–183. [Google Scholar] [CrossRef] [Green Version]
- Kurihara, Y.; Murakami, H.; Kachi, M. Sea surface temperature from the new Japanese geostationary meteorological Himawari-8 satellite. Geophys. Res. Lett. 2016, 43, 1234–1240. [Google Scholar] [CrossRef] [Green Version]
- Atlas, R.; Hoffman, R.N.; Ardizzone, J.; Leidner, S.M.; Jusem, J.C.; Smith, D.K.; Gombos, D. A cross-calibrated, multiplatform ocean surface wind velocity product for meteorological and oceanographic applications. Bull. Am. Meteorol. Soc. 2011, 92, 157–174. [Google Scholar] [CrossRef]
- Cheng, Y.-H.; Ho, C.-R.; Zheng, Z.-W.; Lee, Y.-H.; Kuo, N.-J. An algorithm for cold patch detection in the Sea off northeast Taiwan using multi-sensor data. Sensors 2009, 9, 5521–5533. [Google Scholar] [CrossRef] [PubMed] [Green Version]
- Reeves, G. smooth2a. MATLAB Central File Exchange. 2022. Available online: https://www.mathworks.com/matlabcentral/fileexchange/23287-smooth2a (accessed on 1 August 2013).
- Qiao, F.; Yang, Y.; Lü, X.; Xia, C.; Chen, X.; Wang, B.; Yuan, Y. Coastal upwelling in the East China Sea in winter. J. Geophys. Res. Ocean. 2006, 111. [Google Scholar] [CrossRef] [Green Version]
- Jing, Z.; Qi, Y.; Hua, Z. Numerical study on upwelling and its seasonal variation along Fujian and Zhejiang coast. J. Hohai Univ. (Nat. Sci.) 2007, 35, 464–470. [Google Scholar]
- Jing, Z.; Hua, Z.; Qi, Y.; Cheng, X. Numerical study on the coastal upwelling and its seasonal variation in the East China Sea. J Coast. Res 2007, 50, 555–563. [Google Scholar]
- Cheng, Y.H.; Hu, J.Y.; Zheng, Q.N.; Su, F.C. Interannual variability of cold domes northeast of Taiwan. Int. J. Remote Sens. 2018, 39, 4293–4303. [Google Scholar] [CrossRef] [Green Version]
- Pan, Y.; Xu, R.; Xu, J. The front structures, variation and cause of the upwelling front zone off Zhejiang. Acta Oceanol. Sin. 1985, 4, 401–411. [Google Scholar]
- Luo, Y.; Gao, G. Numerical studies of wind and TWC driven upwelling in coastal areas of the East China Sea. J. Ocean Univ. Qingdao 1998, 28, 536–542. [Google Scholar]
- Yang, D.; Yin, B.; Liu, Z.; Feng, X. Numerical study of the ocean circulation on the East China Sea shelf and a Kuroshio bottom branch northeast of Taiwan in summer. J. Geophys. Res. Ocean. 2011, 116. [Google Scholar] [CrossRef] [Green Version]
- Yang, D.; Yin, B.; Sun, J.; Zhang, Y. Numerical study on the origins and the forcing mechanism of the phosphate in upwelling areas off the coast of Zhejiang province, China in summer. J. Mar. Syst. 2013, 123–124, 1–18. [Google Scholar] [CrossRef]
- He, Q.; Zhang, C.; Gao, G.; Wei, Y.; An, B. Study on the temporal and spatial characteristics of Zhoushan coastal upwelling and relationship with wind field in Summer period. J. Shanghai Ocean. Univ. 2016, 25, 142–151. [Google Scholar]
Figure 1.
(a) Bathymetry and circulation patterns (meters) of the East China Sea; (b) the bathymetry (meters) of study area; (c) monthly mean SST (°C) in August 2015−2021 from the Himawari−8 data. The dots and five−pointed star in panel (b) show monthly locations of the upwelling center between July 2015 and December 2021. The yellow six−pointed star in panel (b) shows the location of the tide station used in Section 3.3. The black lines in panel (b) are the isobaths between 10 m and 70 m. CDW: Changjiang diluted water; ZJCC: Zhejiang coastal current; TWC: Taiwan Warm Current; UW: upwelling.

Figure 2.
(a) Schematic of the pointwise upwelling’s spatial structure; (b) radial distribution of SST and its gradient within the pointwise upwelling, adapted with permission from Ref. [11]. 2019, Wenbin Yin and Daji Huang.
Figure 2.
(a) Schematic of the pointwise upwelling’s spatial structure; (b) radial distribution of SST and its gradient within the pointwise upwelling, adapted with permission from Ref. [11]. 2019, Wenbin Yin and Daji Huang.

Figure 3.
(a) Schematic of the upwelling detection algorithm; (b) distribution of potential upwelling points and pixels of core area.
Figure 3.
(a) Schematic of the upwelling detection algorithm; (b) distribution of potential upwelling points and pixels of core area.

Figure 4.
Monthly mean SST maps between July 2015 and December 2021. The magenta dot shows the location of upwelling center. The black line shows the boundary between the core area and mixed area. The gray line shows the boundary between the mixed area and surrounding area.
Figure 4.
Monthly mean SST maps between July 2015 and December 2021. The magenta dot shows the location of upwelling center. The black line shows the boundary between the core area and mixed area. The gray line shows the boundary between the mixed area and surrounding area.

Figure 5.
Monthly UPI between July 2015 and December 2021.

Figure 6.
The cross−calibrated multi-platform monthly sea surface wind field (black vector, m/s) and wind curl (shade color, s−1) between 2015−2021. The magenta dot shows the location of the upwelling center extracted from the monthly SST. The gray line is the boundary of core area.
Figure 6.
The cross−calibrated multi-platform monthly sea surface wind field (black vector, m/s) and wind curl (shade color, s−1) between 2015−2021. The magenta dot shows the location of the upwelling center extracted from the monthly SST. The gray line is the boundary of core area.

Figure 7.
The spatial cumulative frequency map of potential upwelling points (a) and core area (b) from April to September, 2015–2021. The red boxes in panel (a) shows the aggregation area of potential upwelling points. The magenta dots in panel (a) show the location of the six national marine ranching demonstration areas of China. The yellow line in panel (b) shows the frequency contour of 0.5. The dashed lines in panel (b) show 10 m, 30 m, and 50 m isobaths.

Figure 8.
The UPI (a), the area of core area (b), and the tidal elevation/current (c) between 08:00 12 August and 04:00 22 August 2020 (Beijing time, UTC + 8).
Figure 8.
The UPI (a), the area of core area (b), and the tidal elevation/current (c) between 08:00 12 August and 04:00 22 August 2020 (Beijing time, UTC + 8).

Figure 9.
SST images of a complete quasi−24 h periodic surface upwelling process between 13:00 18 August and 13:00 19 August 2020 (Beijing time, UTC + 8).
Figure 9.
SST images of a complete quasi−24 h periodic surface upwelling process between 13:00 18 August and 13:00 19 August 2020 (Beijing time, UTC + 8).

Figure 10.
The UPI and core area (a), longitude of upwelling center and U−component of tidal current (b), tidal current and area−mean SST over the center−searching box (c) between 13:00 18 August and 13:00 19 August 2020 (Beijing time, UTC + 8). The gray dashed line in panel (b) shows the zero-speed line. The tidal data were downloaded from the Zhoushan Sea Tide Information Release System (http://hai.edianweb.cn) accessed on 12 April 2022.

Figure 11.
The mechanism sketch of short-term variations. The upwelling and stratification in upper ocean during daytime (a) and nighttime (b). The black lines represent the isotherms. The blue vectors represent the tidal mixing. The thickness of the arrow represents the strength of tidal mixing.
Figure 11.
The mechanism sketch of short-term variations. The upwelling and stratification in upper ocean during daytime (a) and nighttime (b). The black lines represent the isotherms. The blue vectors represent the tidal mixing. The thickness of the arrow represents the strength of tidal mixing.

Publisher’s Note: MDPI stays neutral with regard to jurisdictional claims in published maps and institutional affiliations. |
© 2022 by the authors. Licensee MDPI, Basel, Switzerland. This article is an open access article distributed under the terms and conditions of the Creative Commons Attribution (CC BY) license (https://creativecommons.org/licenses/by/4.0/).
Share and Cite
MDPI and ACS Style
Yin, W.; Ma, Y.; Wang, D.; He, S.; Huang, D. Surface Upwelling off the Zhoushan Islands, East China Sea, from Himawari-8 AHI Data. Remote Sens. 2022, 14, 3261. https://doi.org/10.3390/rs14143261
AMA Style
Yin W, Ma Y, Wang D, He S, Huang D. Surface Upwelling off the Zhoushan Islands, East China Sea, from Himawari-8 AHI Data. Remote Sensing. 2022; 14(14):3261. https://doi.org/10.3390/rs14143261
Chicago/Turabian StyleYin, Wenbin, Youzhi Ma, Dian Wang, Shuangyan He, and Daji Huang. 2022. "Surface Upwelling off the Zhoushan Islands, East China Sea, from Himawari-8 AHI Data" Remote Sensing 14, no. 14: 3261. https://doi.org/10.3390/rs14143261
Note that from the first issue of 2016, this journal uses article numbers instead of page numbers. See further details here.