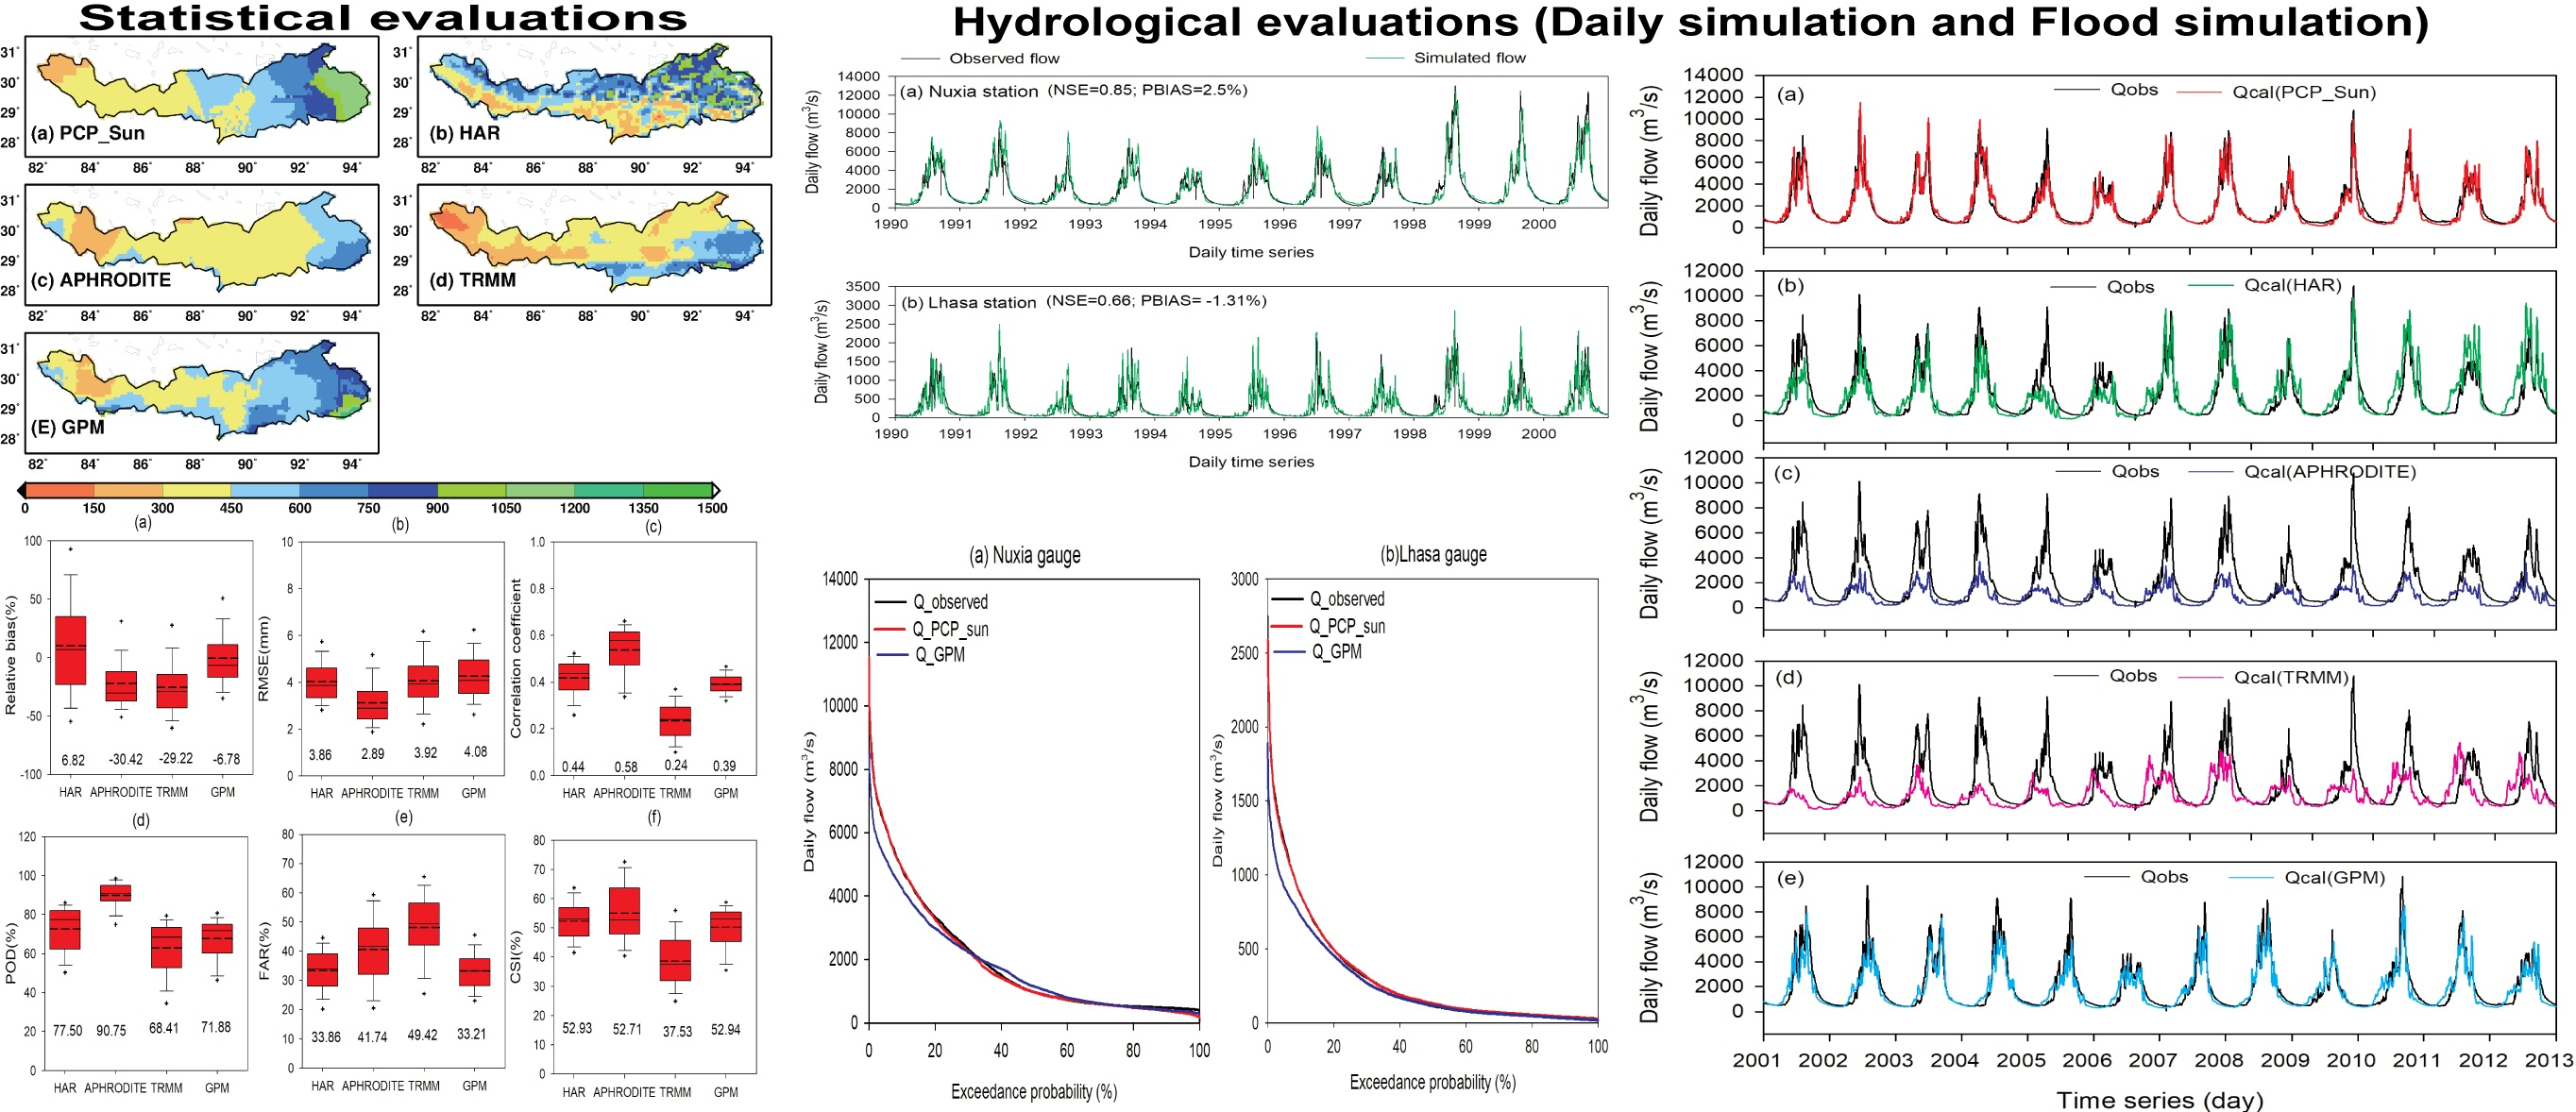
Figure 1.
Location and topography of the Upper Brahmaputra River Basin. The black solid dots denote the meteorological stations.
Figure 1.
Location and topography of the Upper Brahmaputra River Basin. The black solid dots denote the meteorological stations.
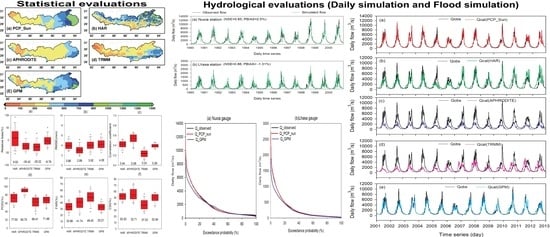
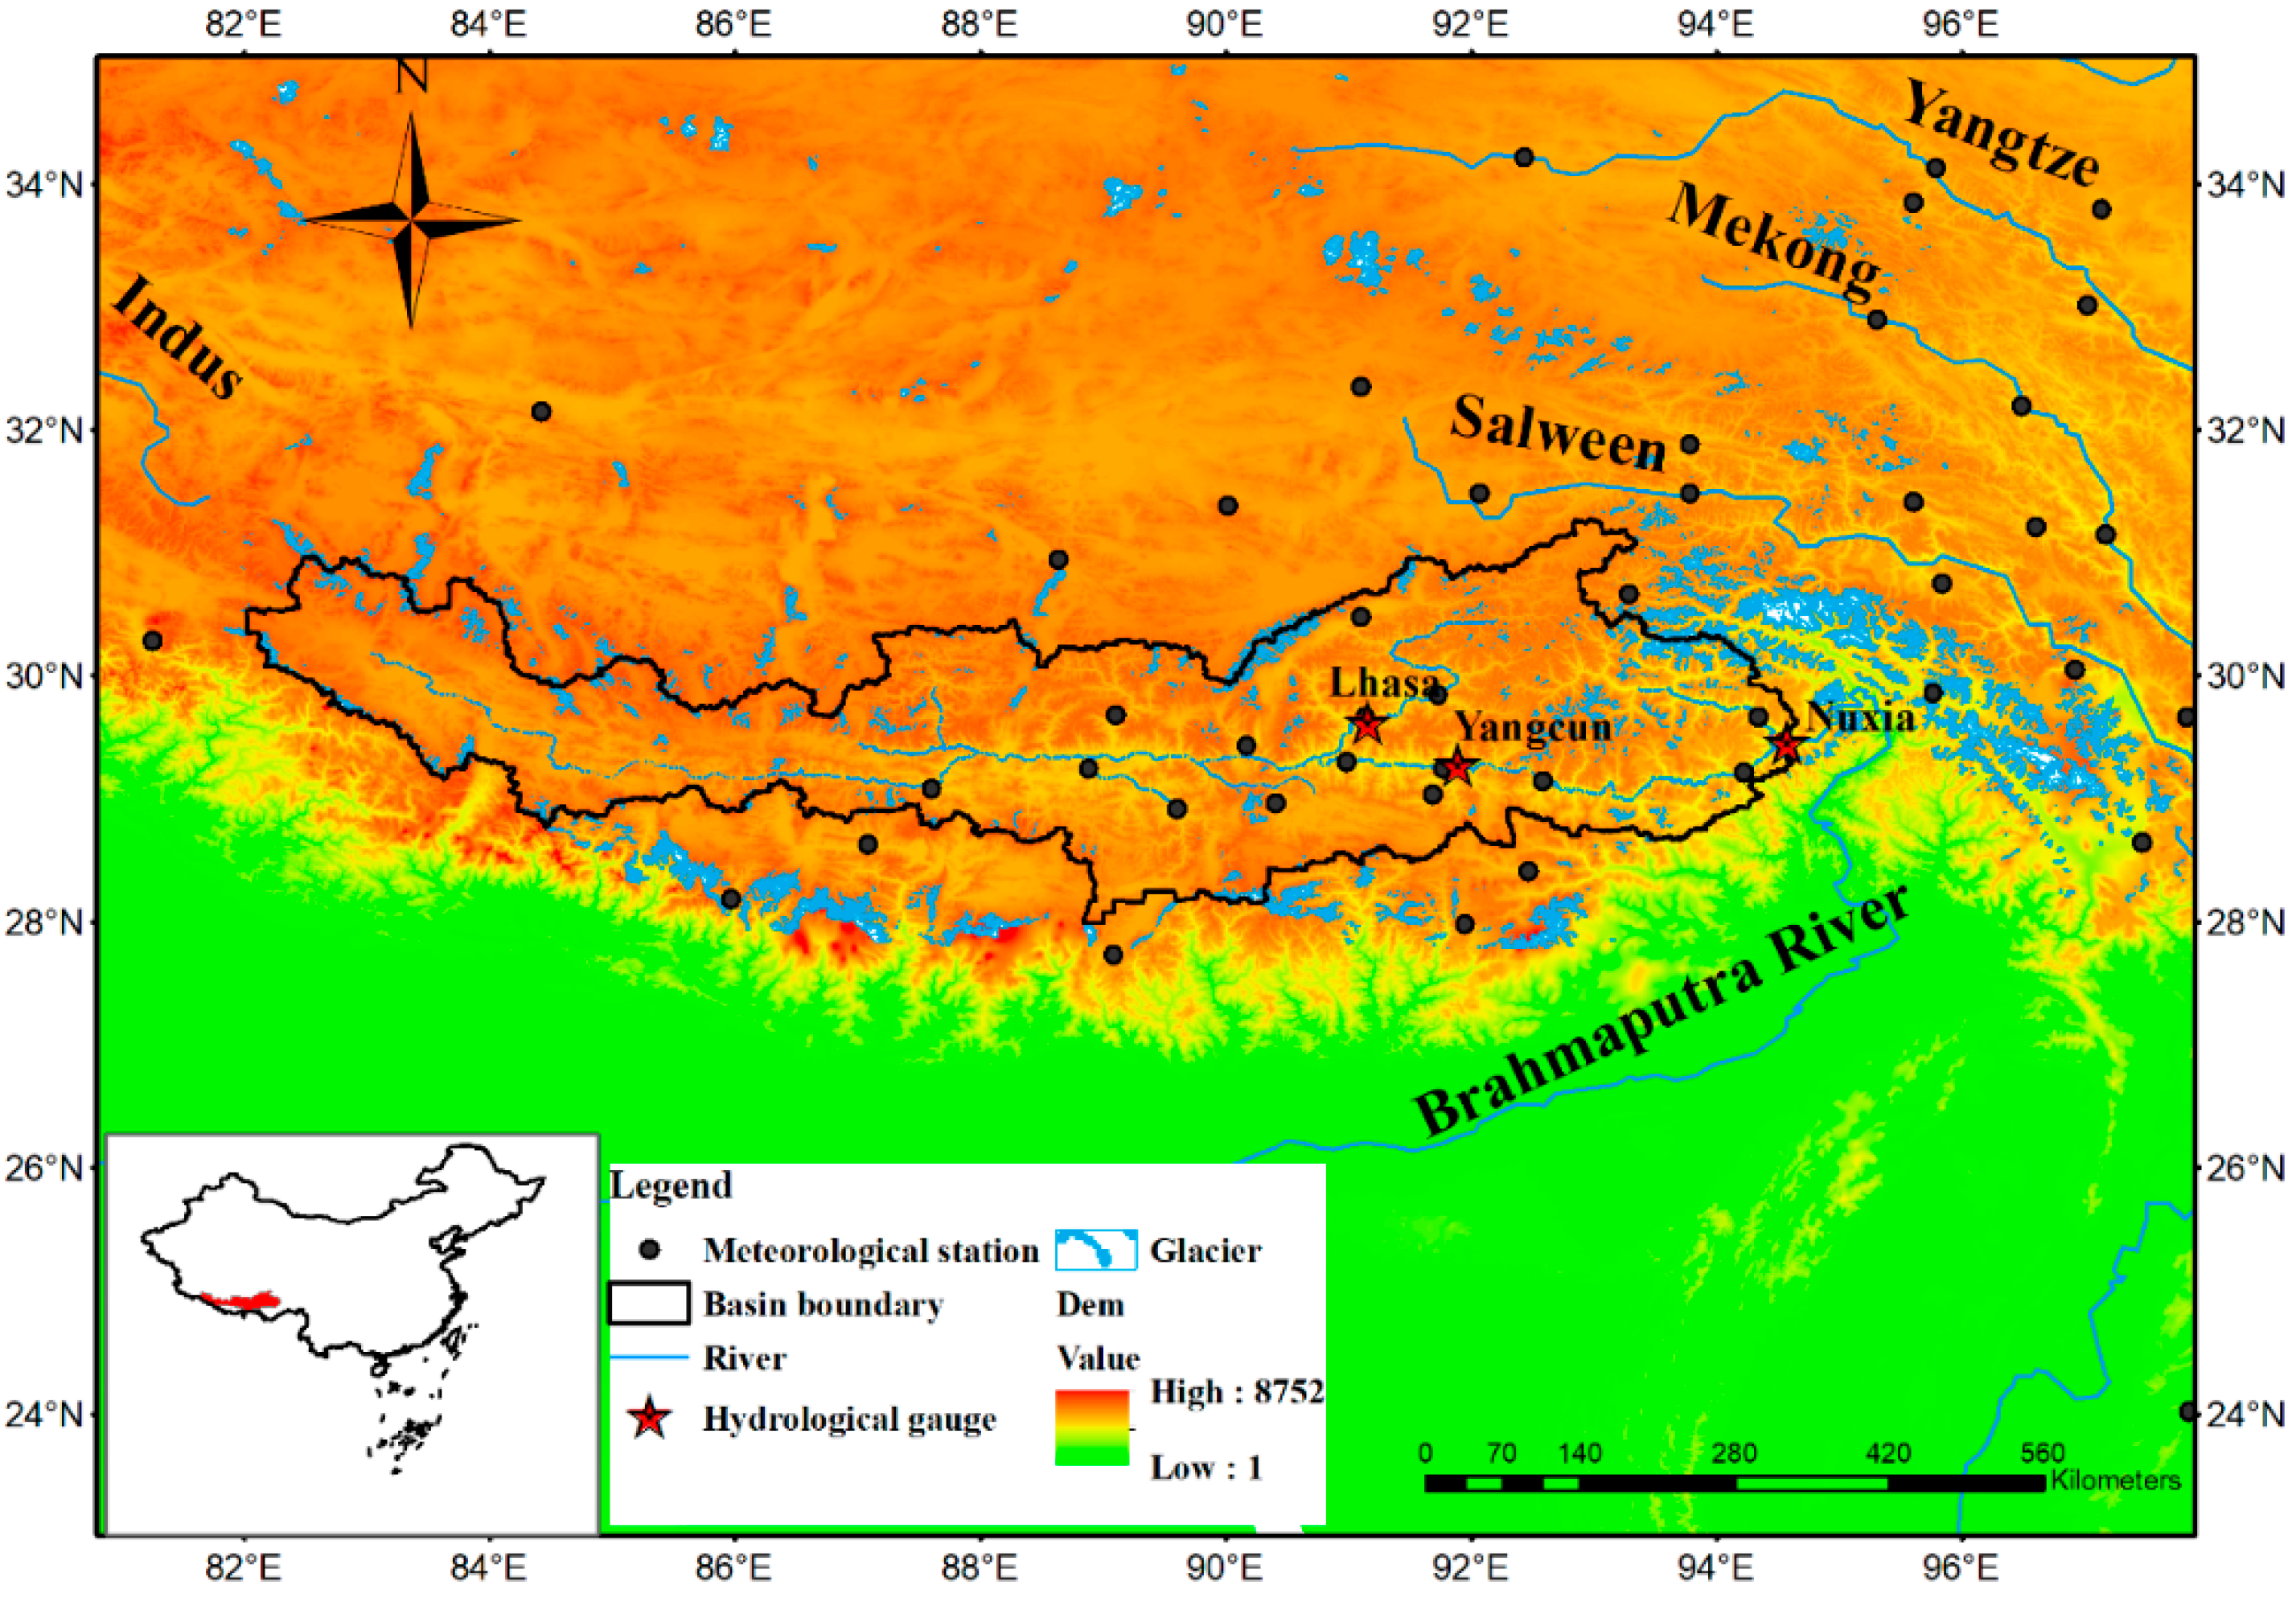
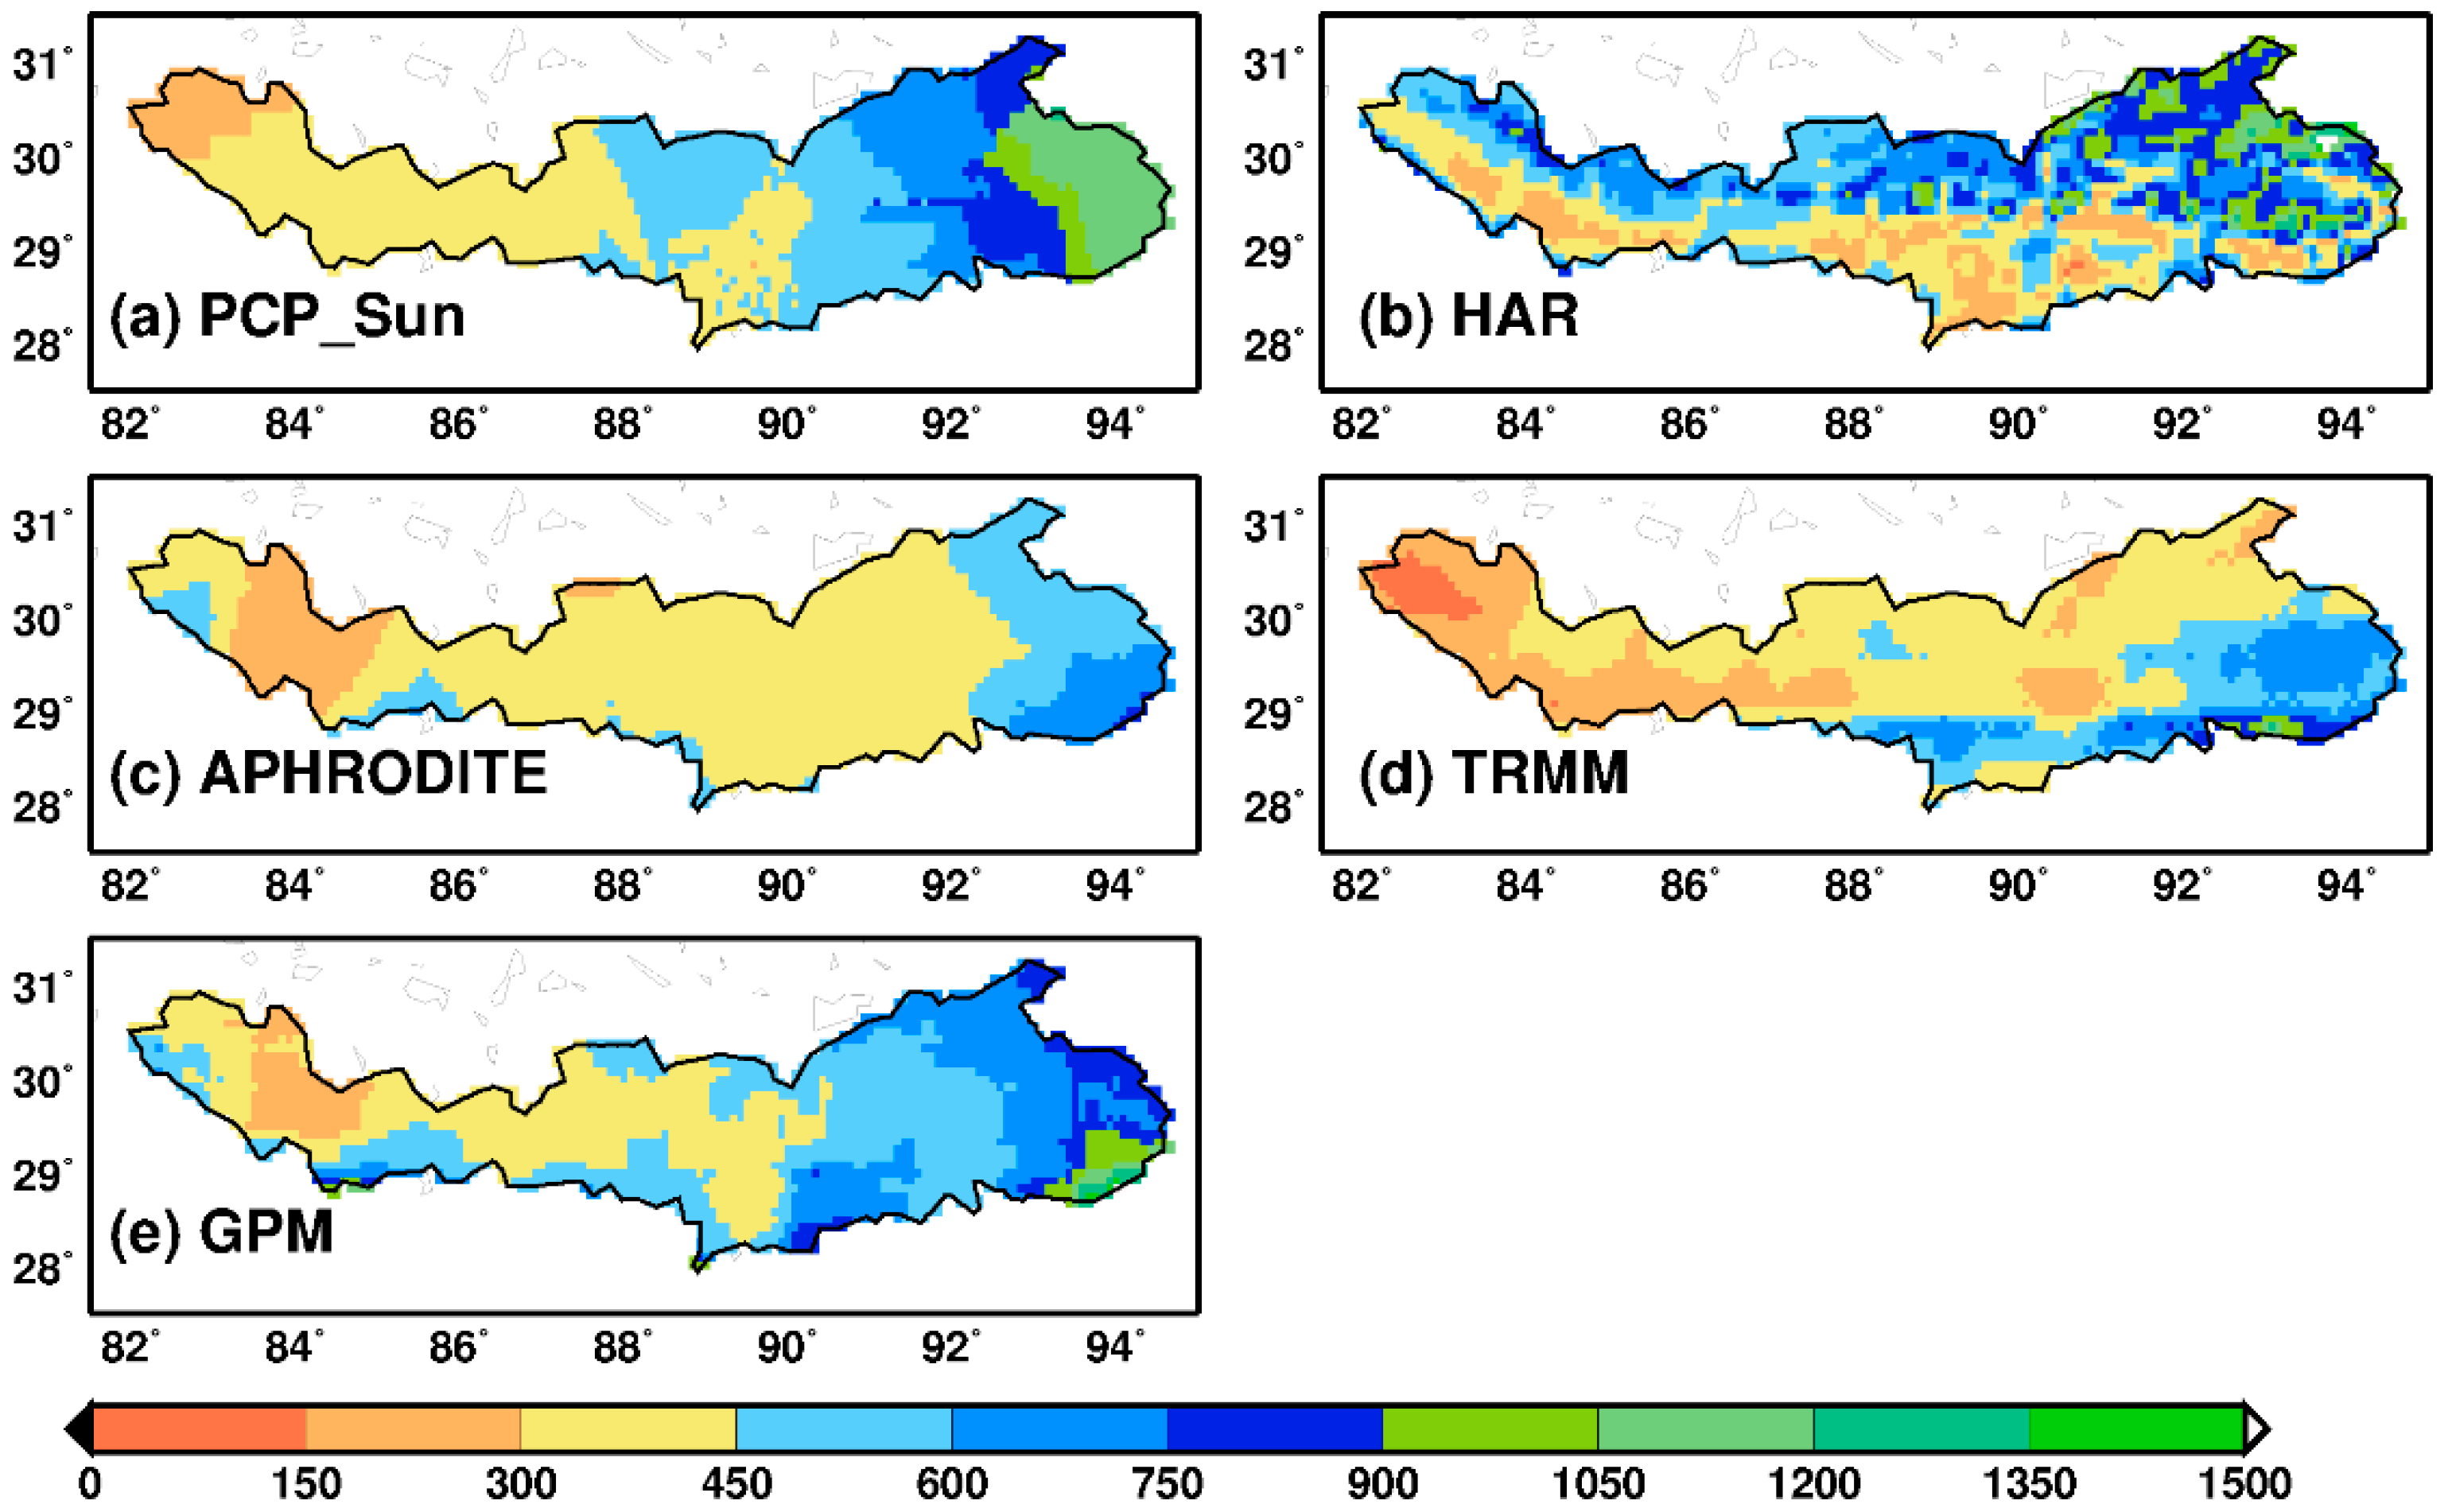
Figure 2.
Spatial distributions of annual mean precipitation for reference precipitation (PCP_Sun) and four gridded precipitation datasets among 2001–2013 over the UB (mm/year).
Figure 2.
Spatial distributions of annual mean precipitation for reference precipitation (PCP_Sun) and four gridded precipitation datasets among 2001–2013 over the UB (mm/year).
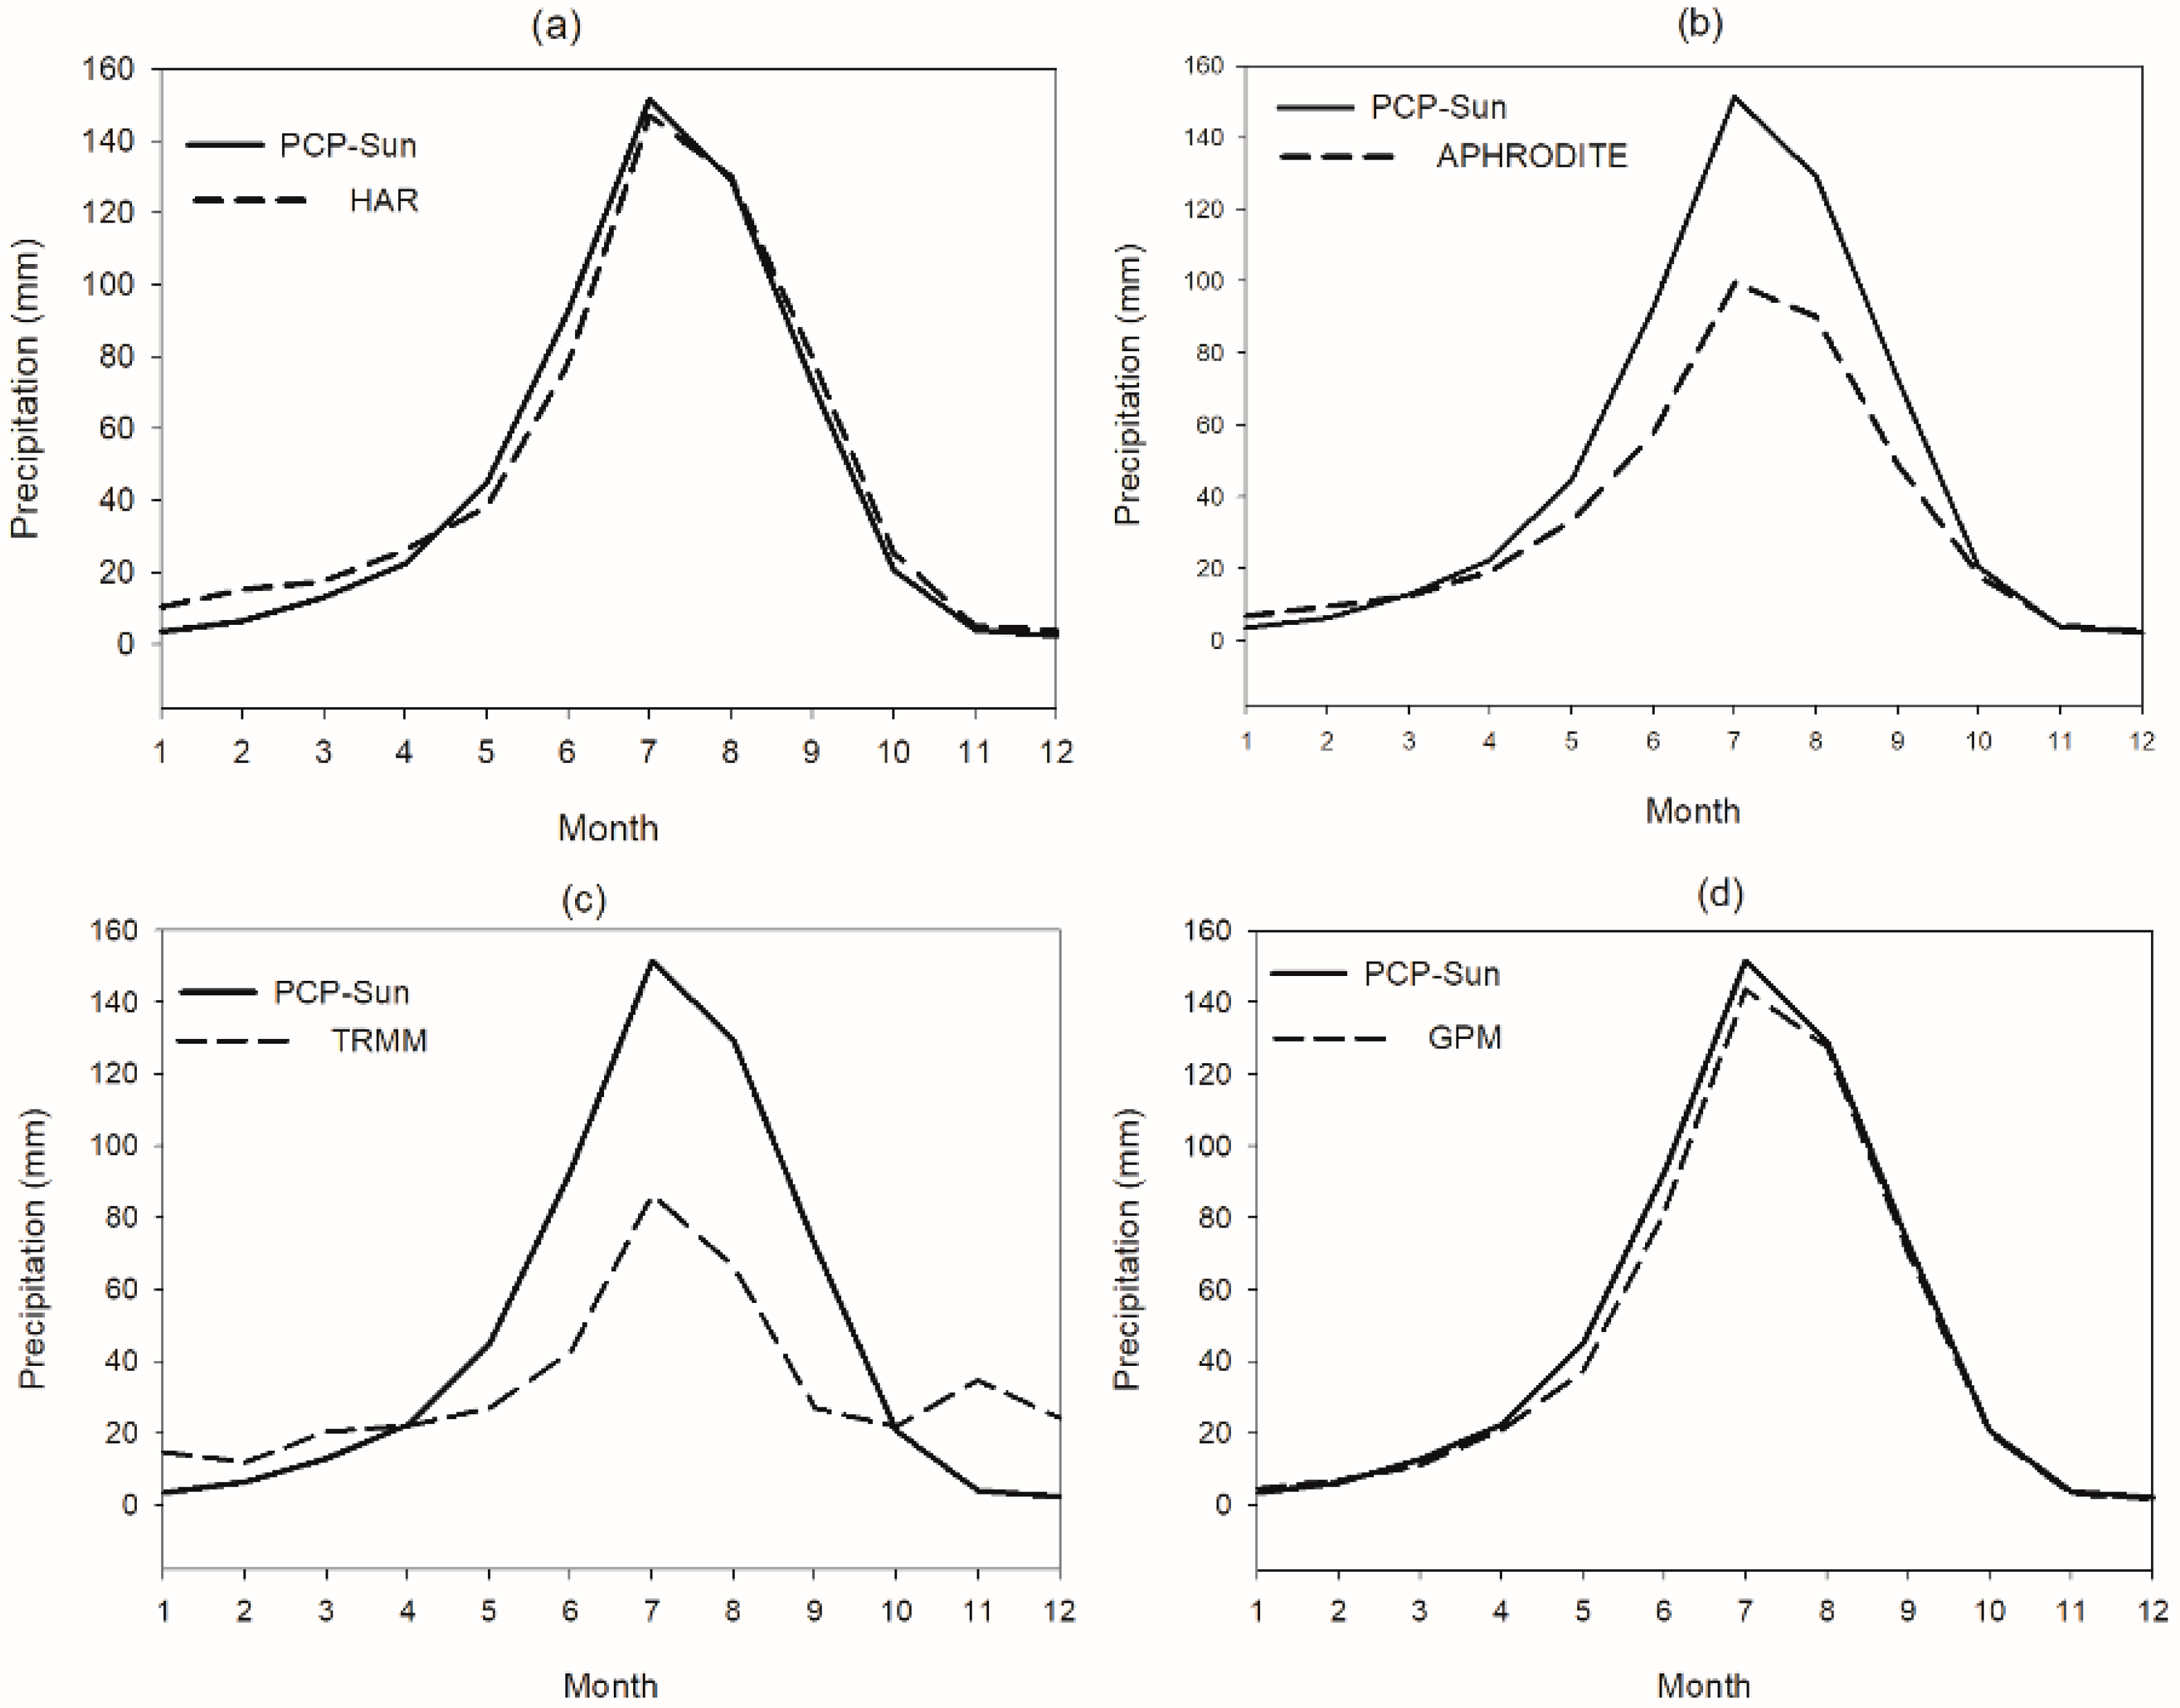
Figure 3.
Mean monthly precipitation from four products (a) HAR, (b) APHRODITE, (c) TRMM and (d) GPM versus reference precipitation during 2001–2013 over the UB.
Figure 3.
Mean monthly precipitation from four products (a) HAR, (b) APHRODITE, (c) TRMM and (d) GPM versus reference precipitation during 2001–2013 over the UB.
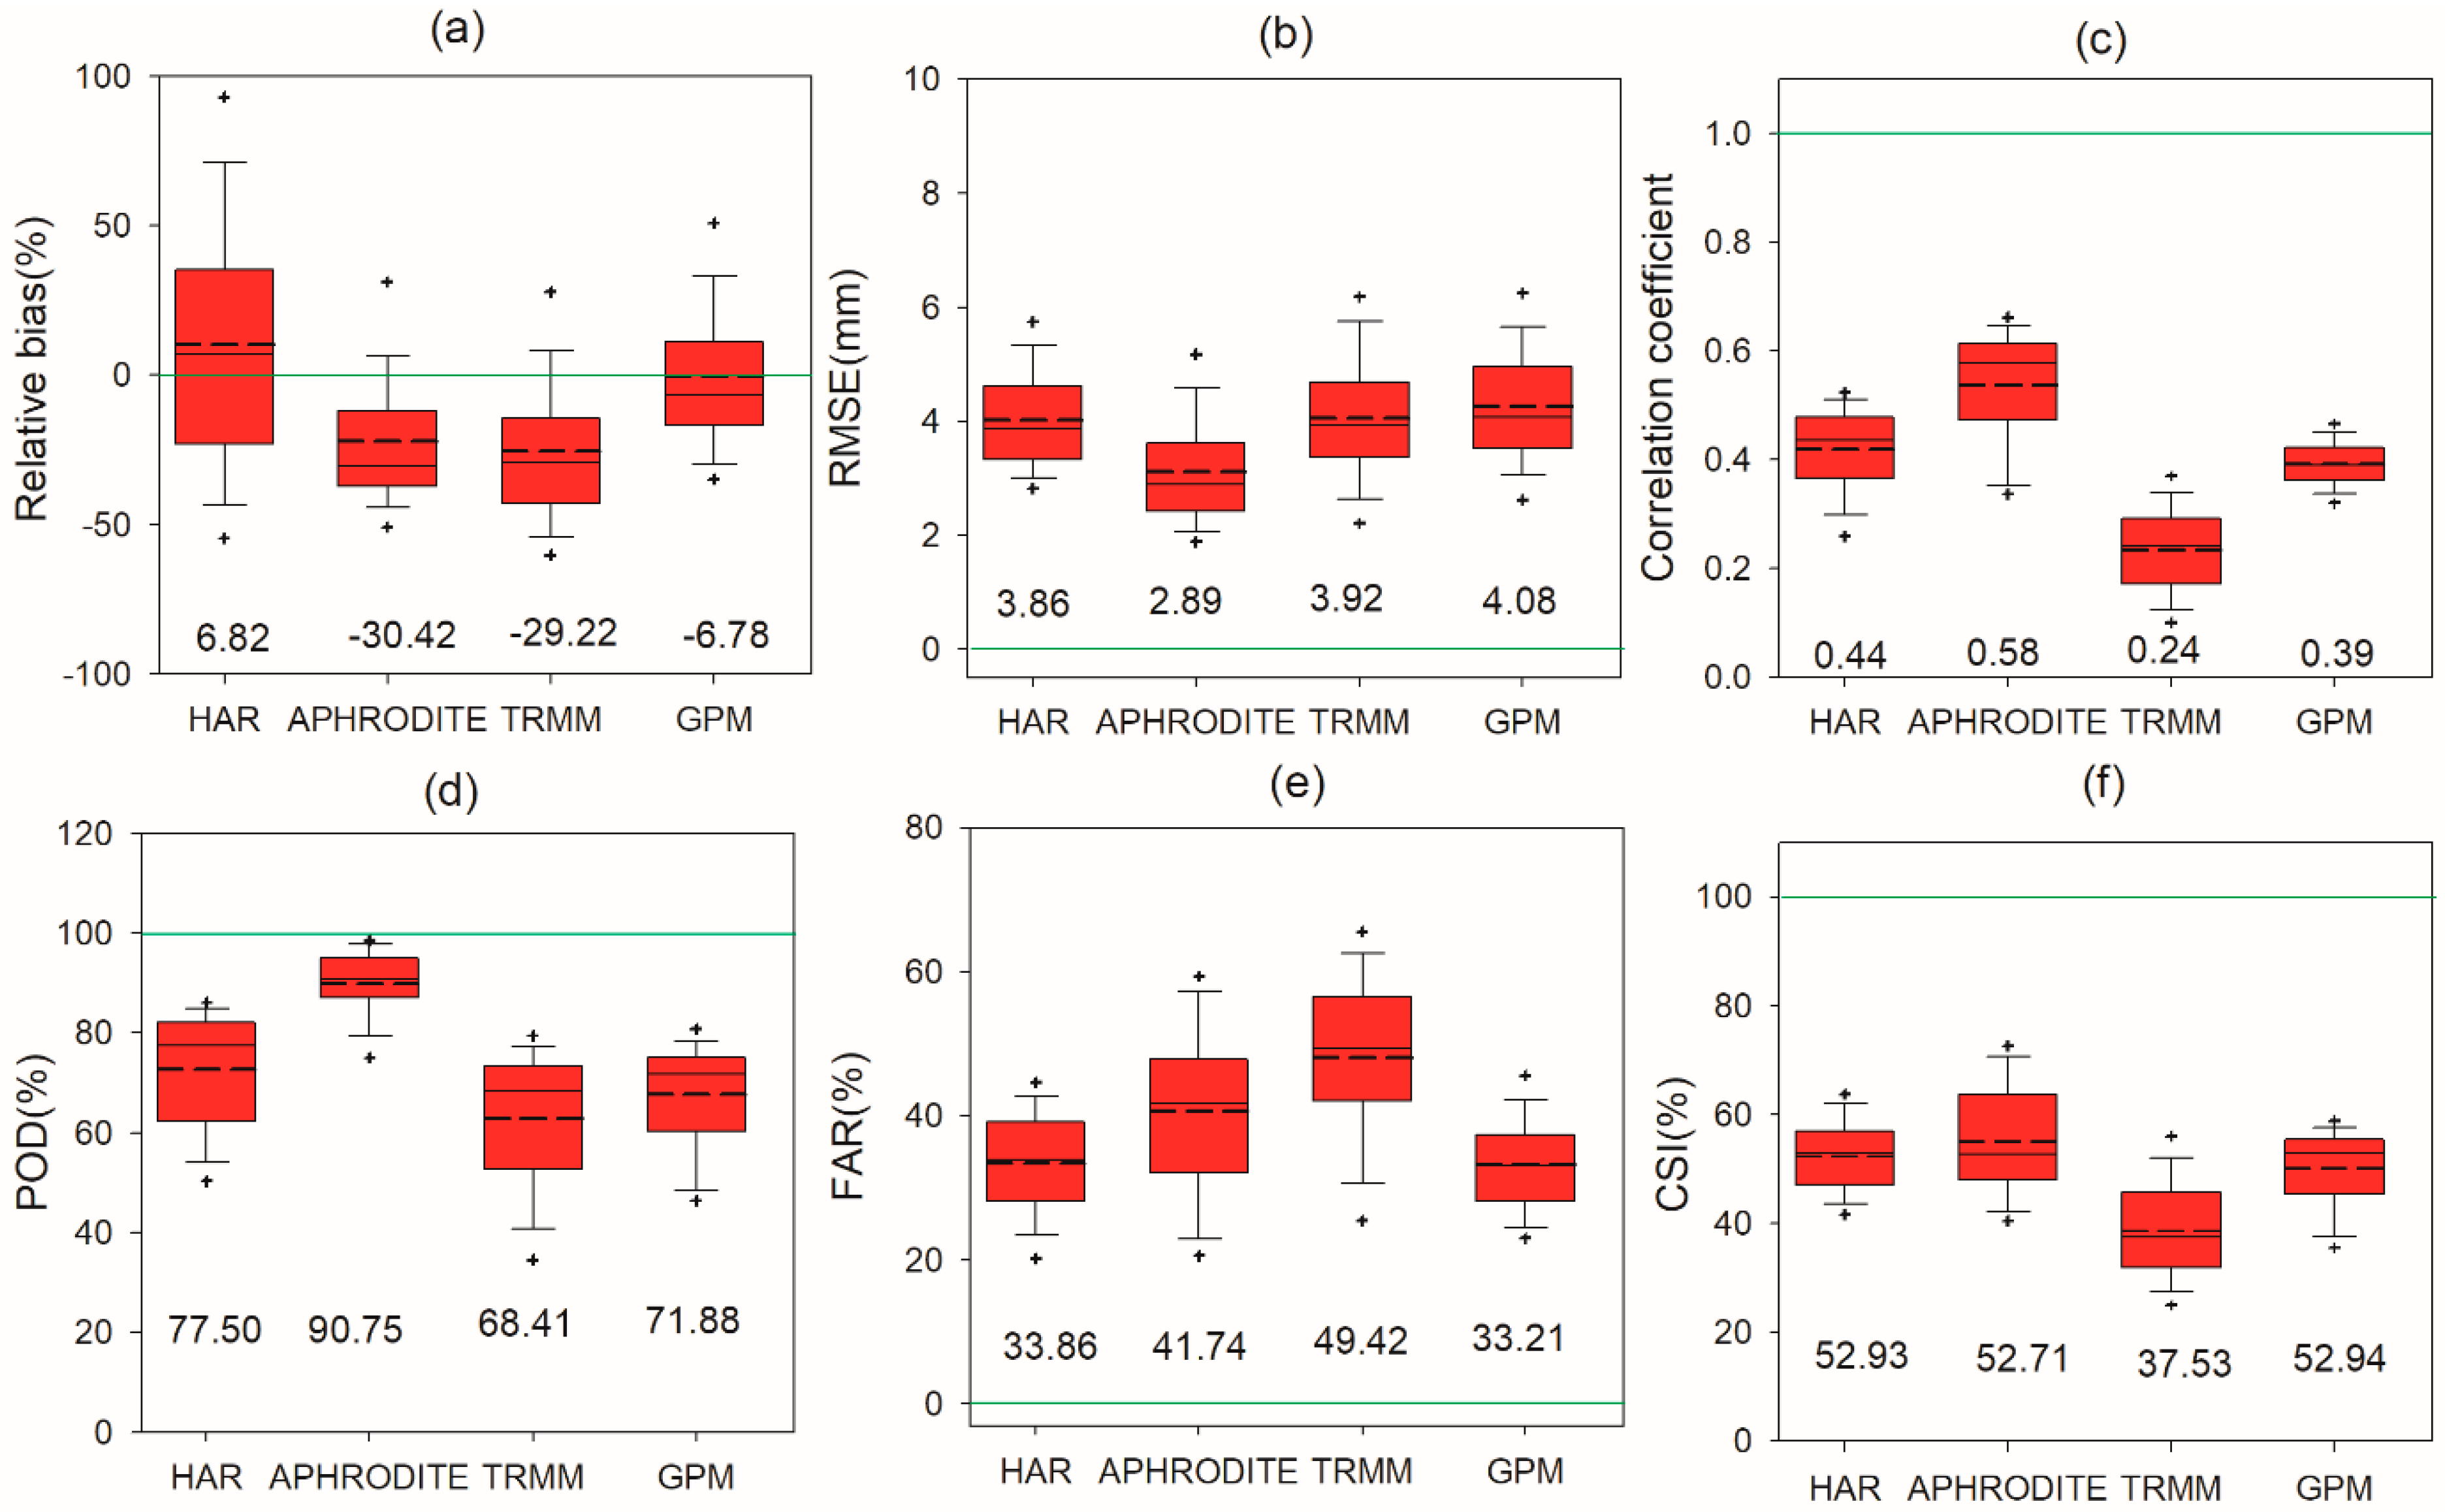
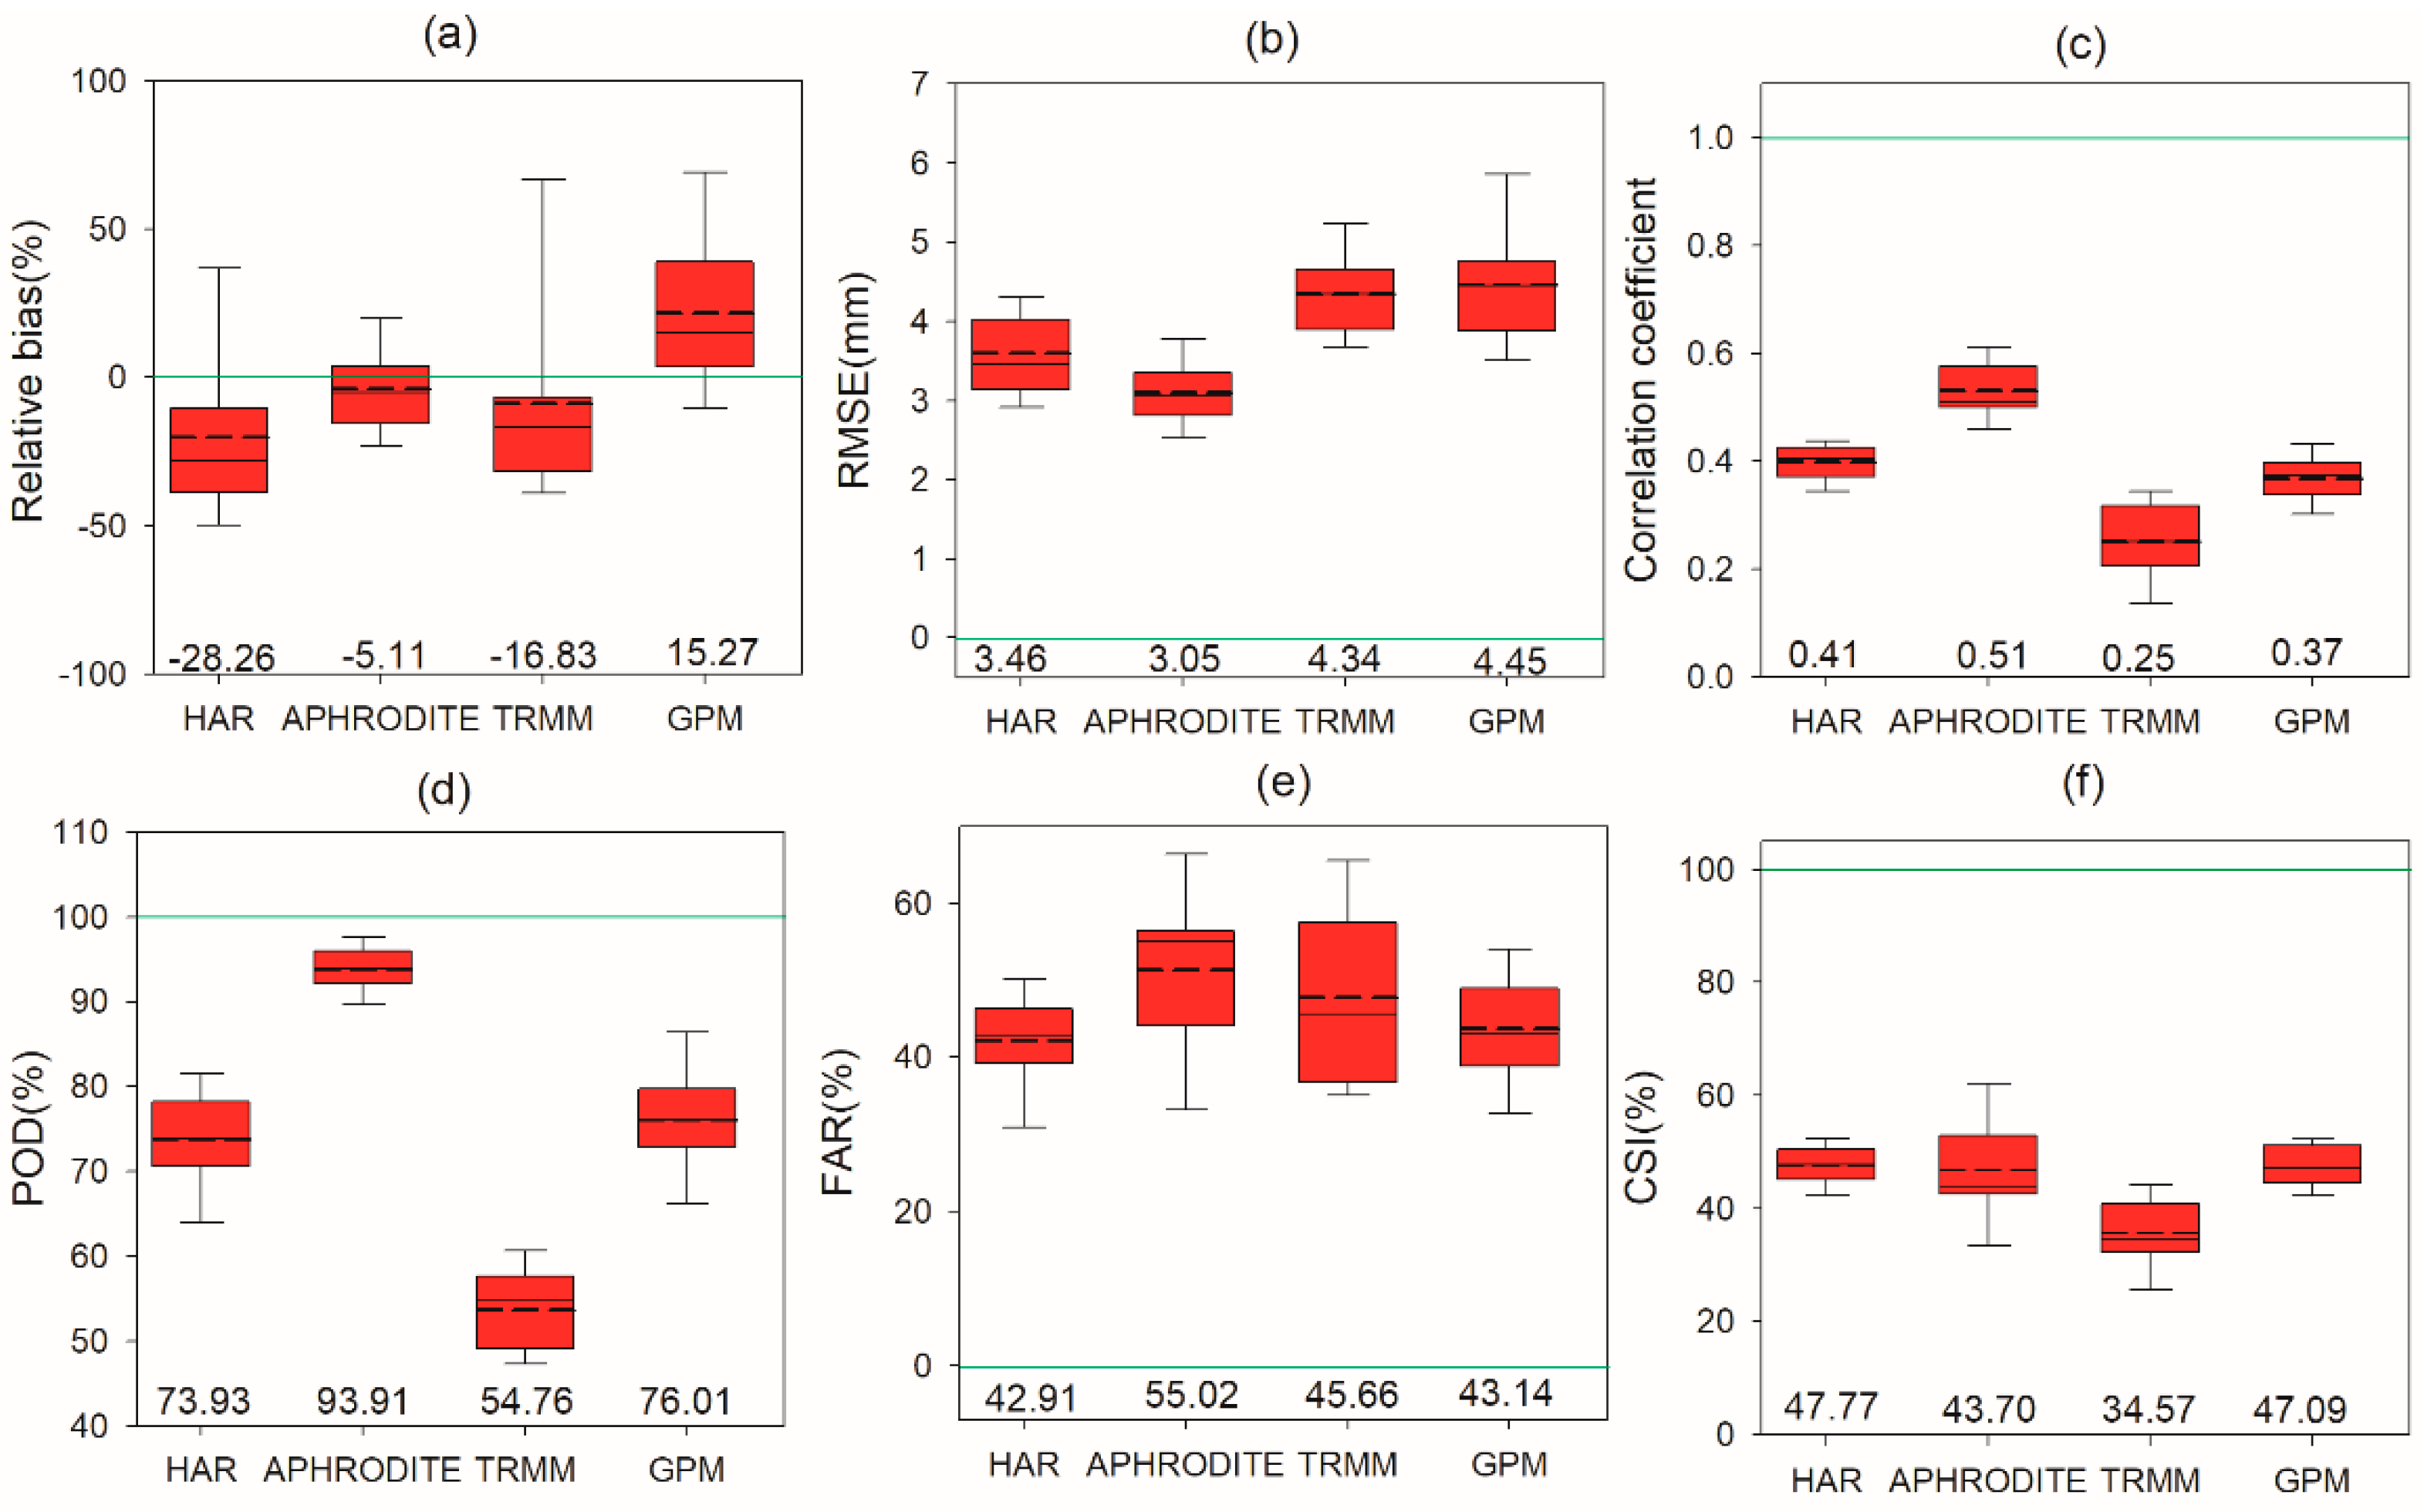
Figure 4.
Box plots of grid-based statistical metrics at daily scale for years 2001–2013: (a) RB, (b) RMSE, (c) CC, (d) POD, (e) FAR, and (f) CSI. The number at the base of the box plot is the median value of each statistical metric. The short dash line in box plots denotes the mean value of statistical metric. The green horizontal line indicates the optimum value. The symbol “+” in box plots represents the outlier of statistical metric value.
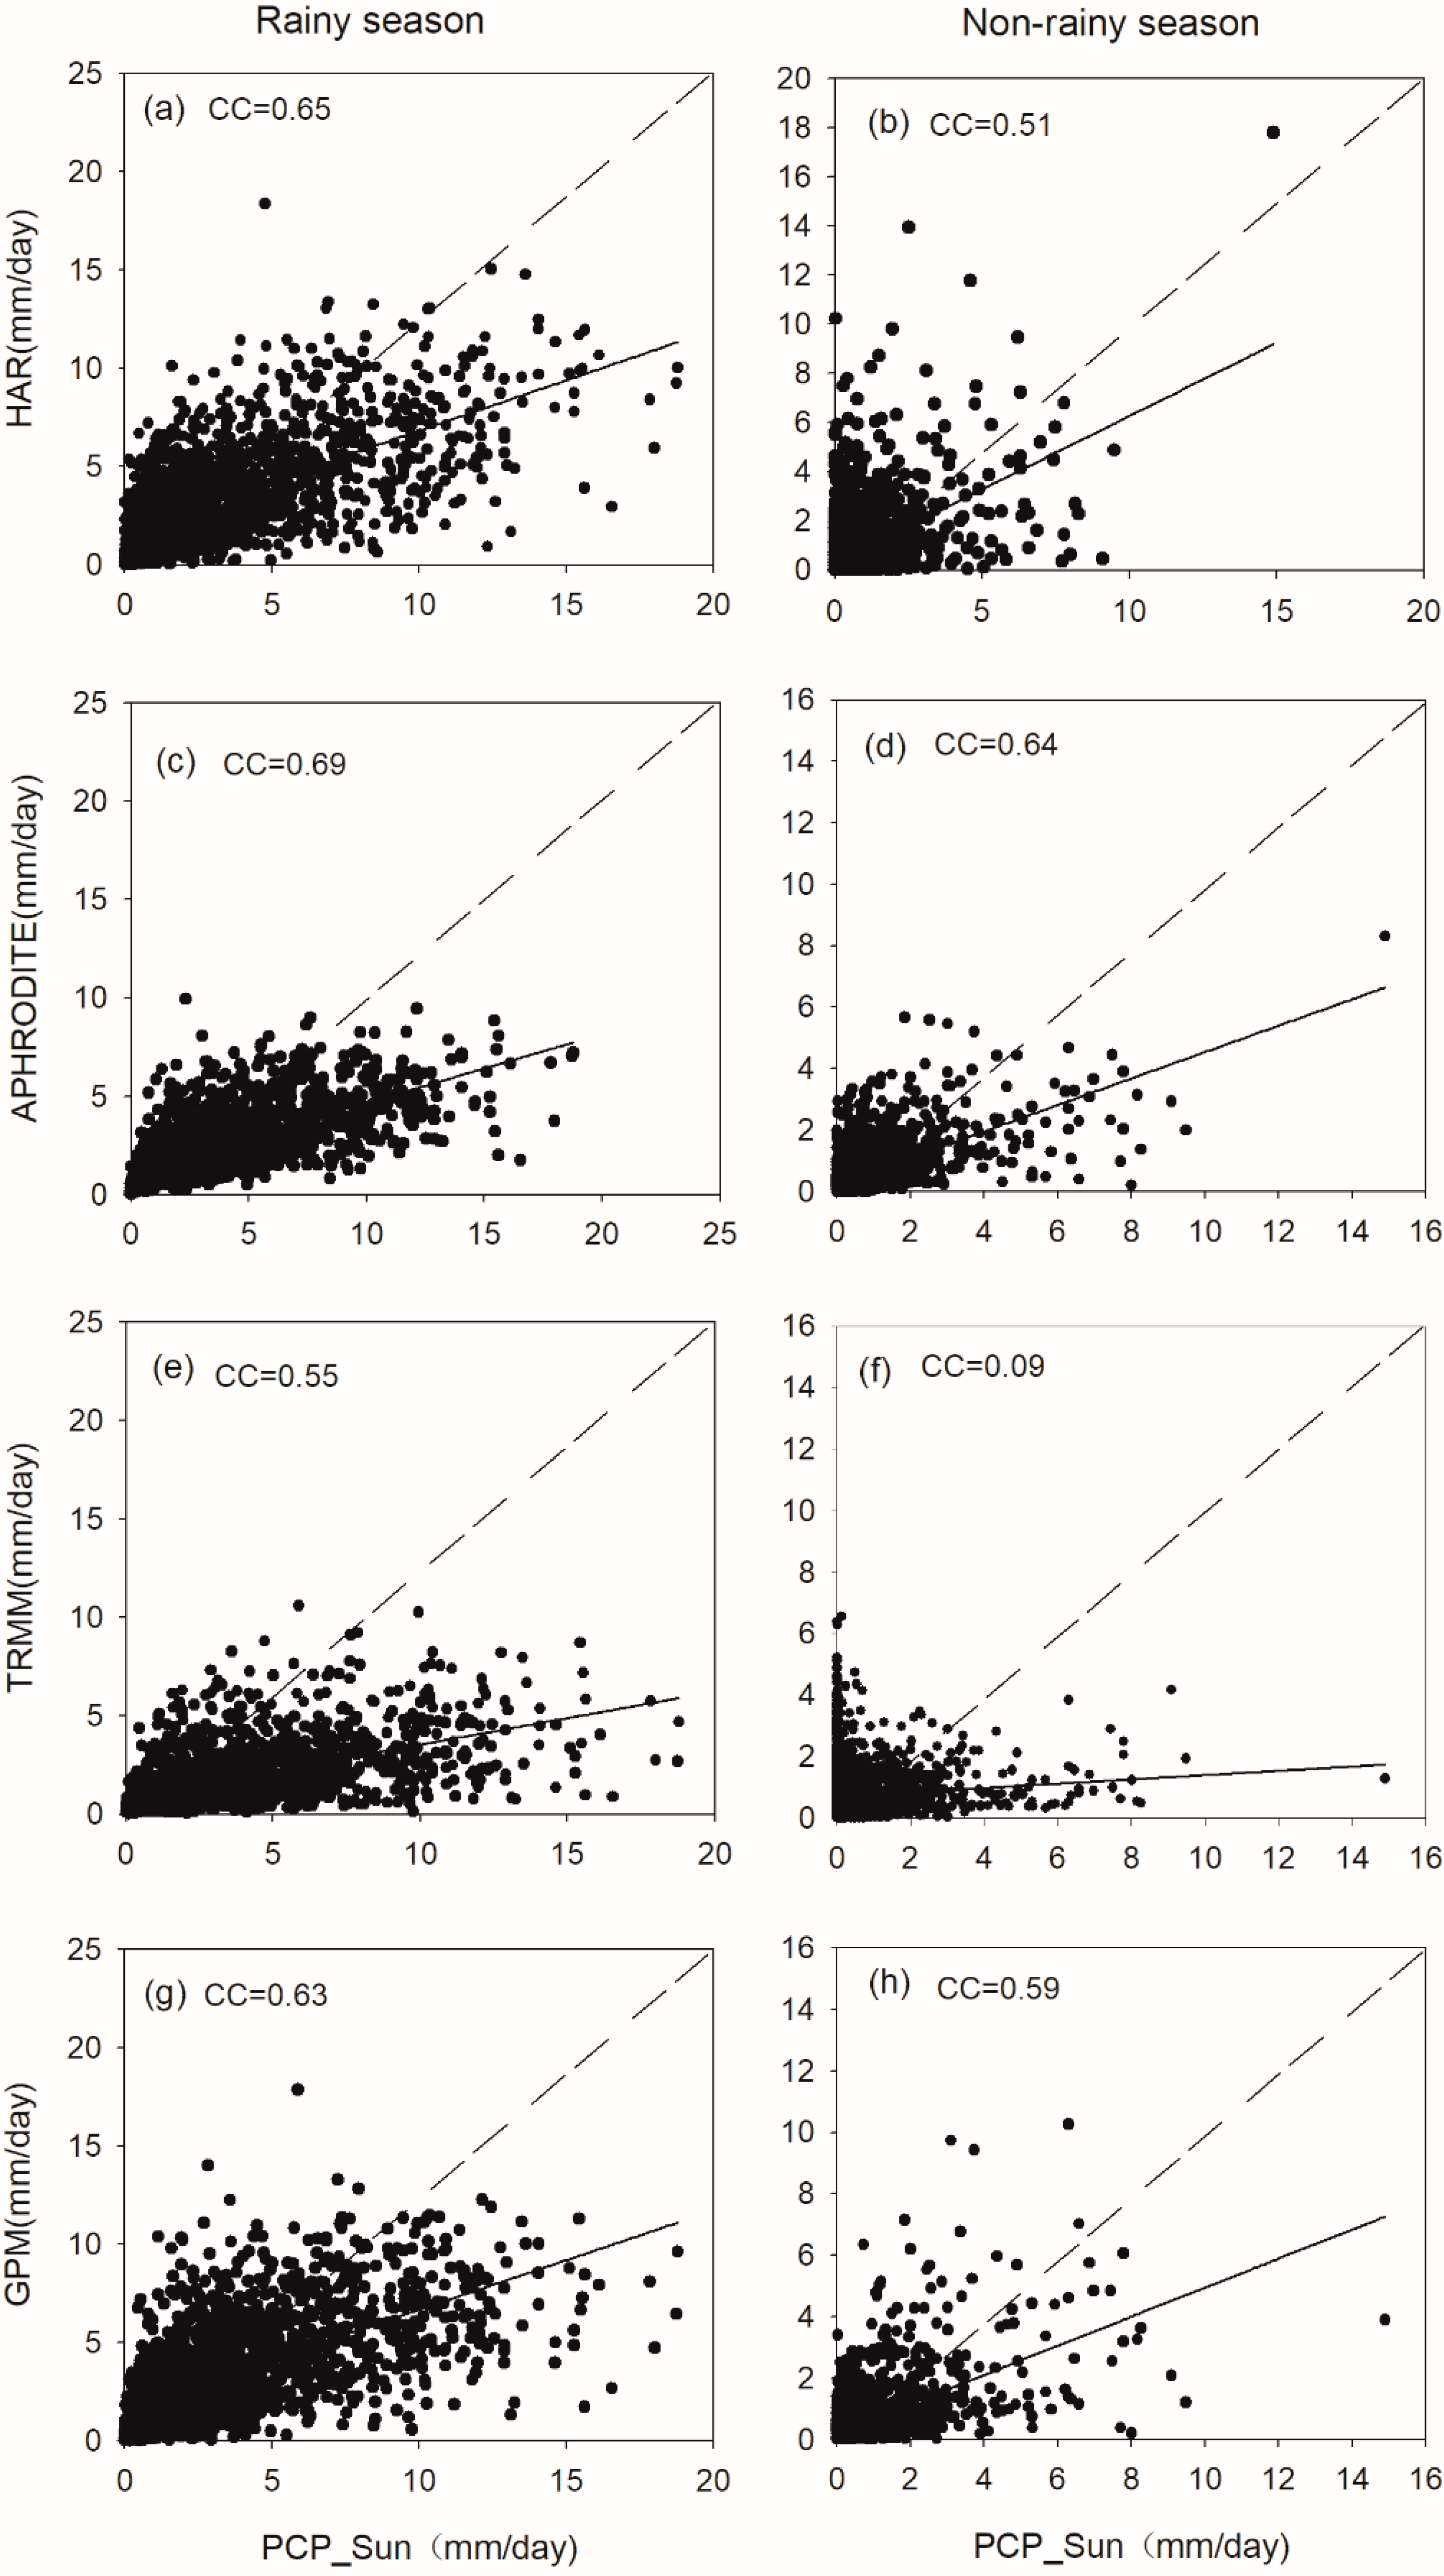
Figure 5.
Scatterplots of daily basin-wide precipitation between gridded precipitation and reference precipitation during rainy season ((a) HAR, (c) APHRODITE, (e) TRMM, (g) GPM), and non-rainy season ((b) HAR, (d) APHRODITE, (f) TRMM, (h) GPM). The solid line shows the linear least-squares result, and the diagonal dash line shows the 1:1 line.
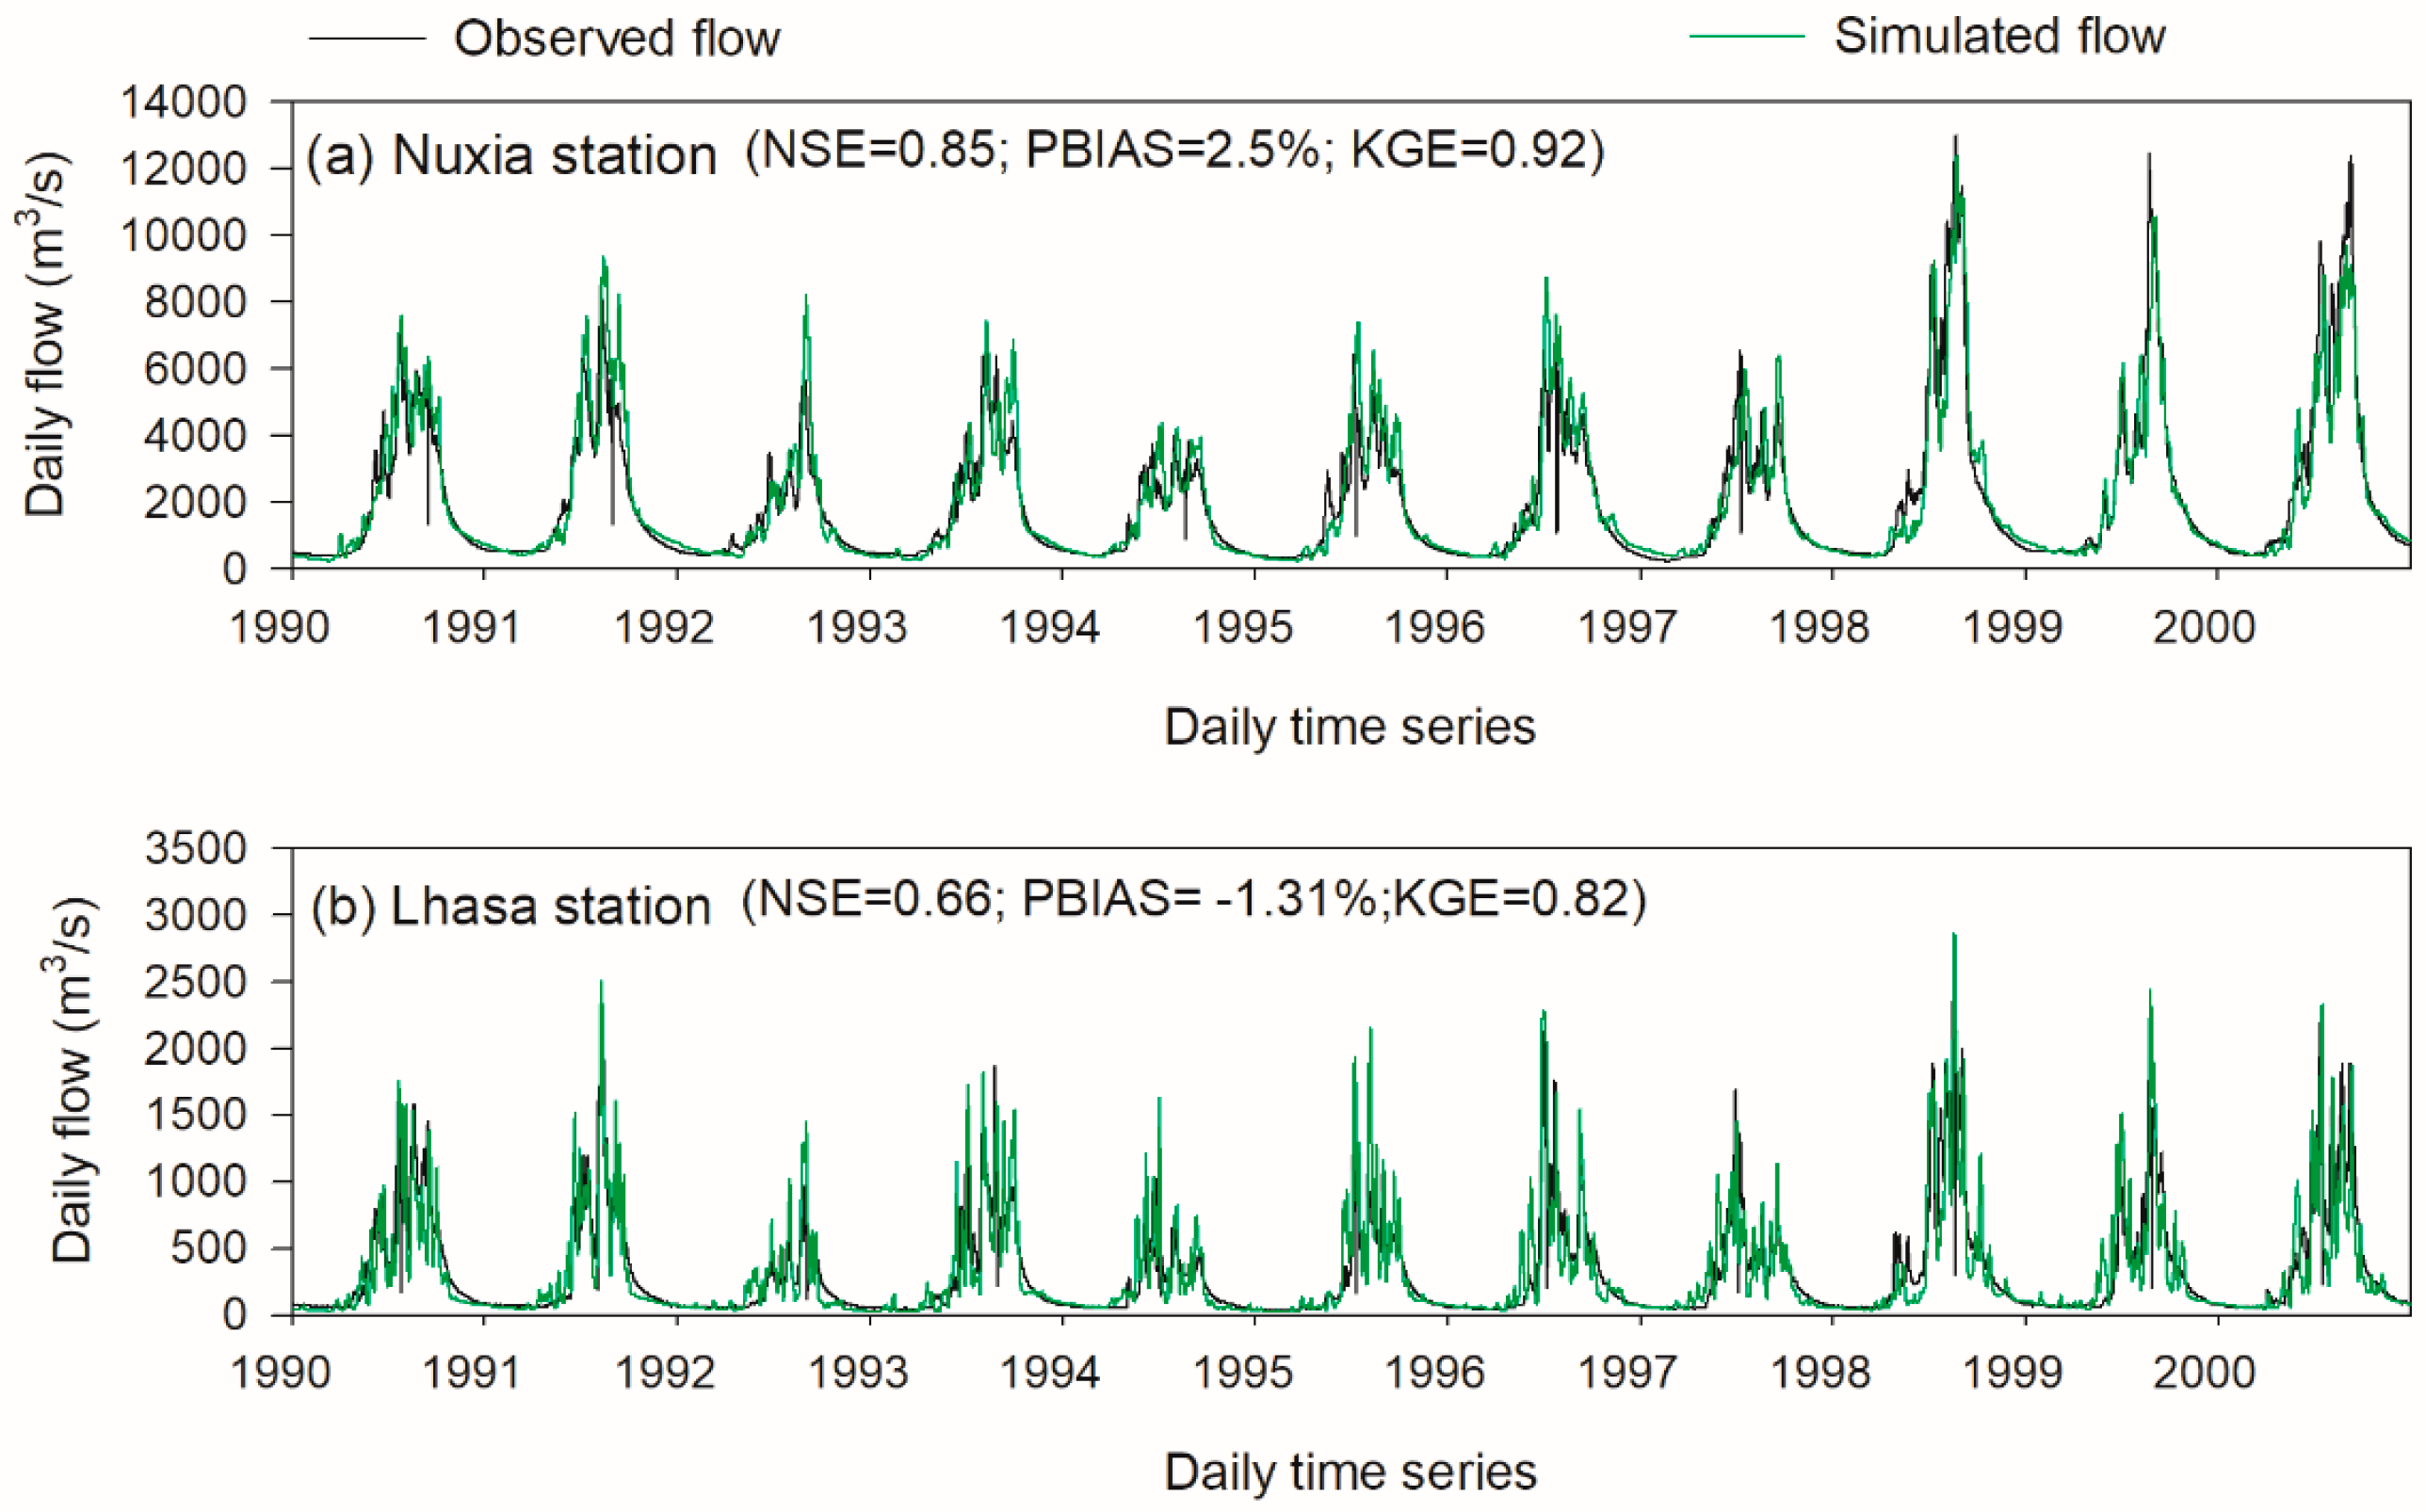
Figure 6.
Daily flow simulation at Nuxia (a) and Lhasa hydrological stations (b) during the calibration period (1990–2000).
Figure 6.
Daily flow simulation at Nuxia (a) and Lhasa hydrological stations (b) during the calibration period (1990–2000).
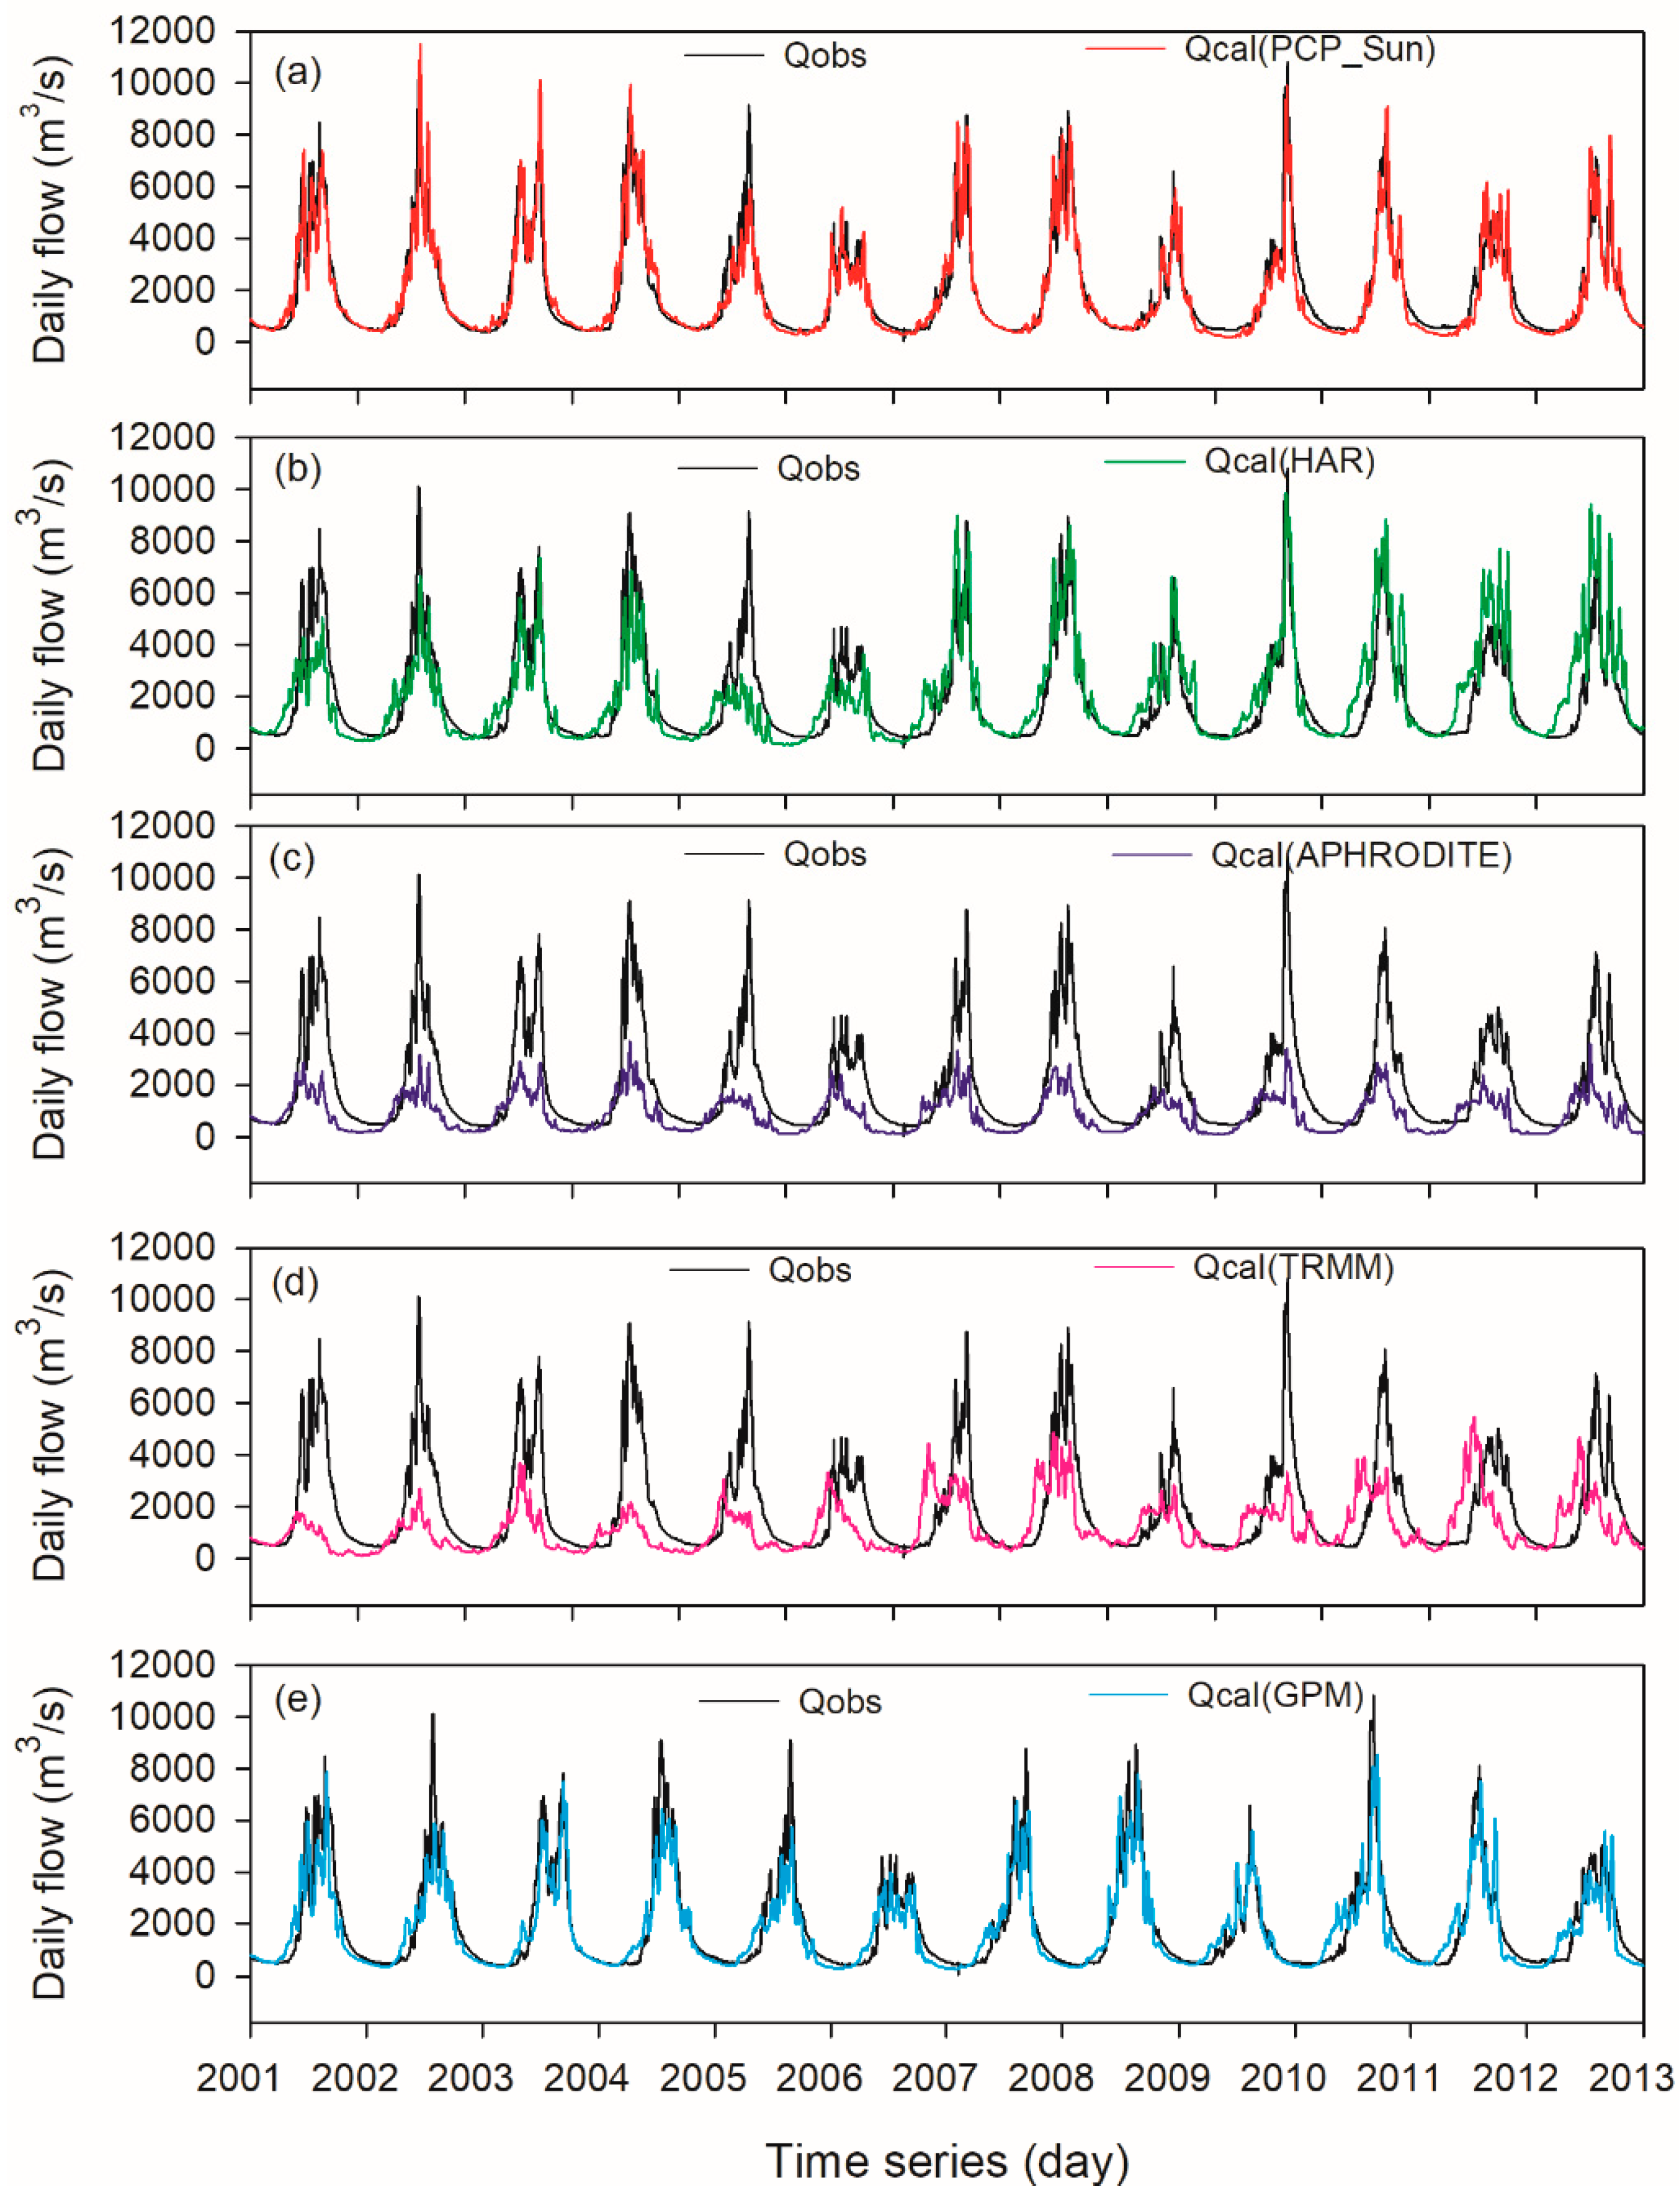
Figure 7.
Daily flow simulation driven by (a) reference precipitationand four precipitation datasets: (b) HAR, (c) APHRODITE, (d) TRMM and (e) GPM, at Nuxia hydrological station during years 2001–2013. Qobs represents the observed streamflow. Qcal(PCP_Sun), Qcal(HAR), Qcal(APHRODITE), Qcal(TRMM) and Qcal(GPM) represent the calculated streamflow using the corresponding individual precipitation dataset.
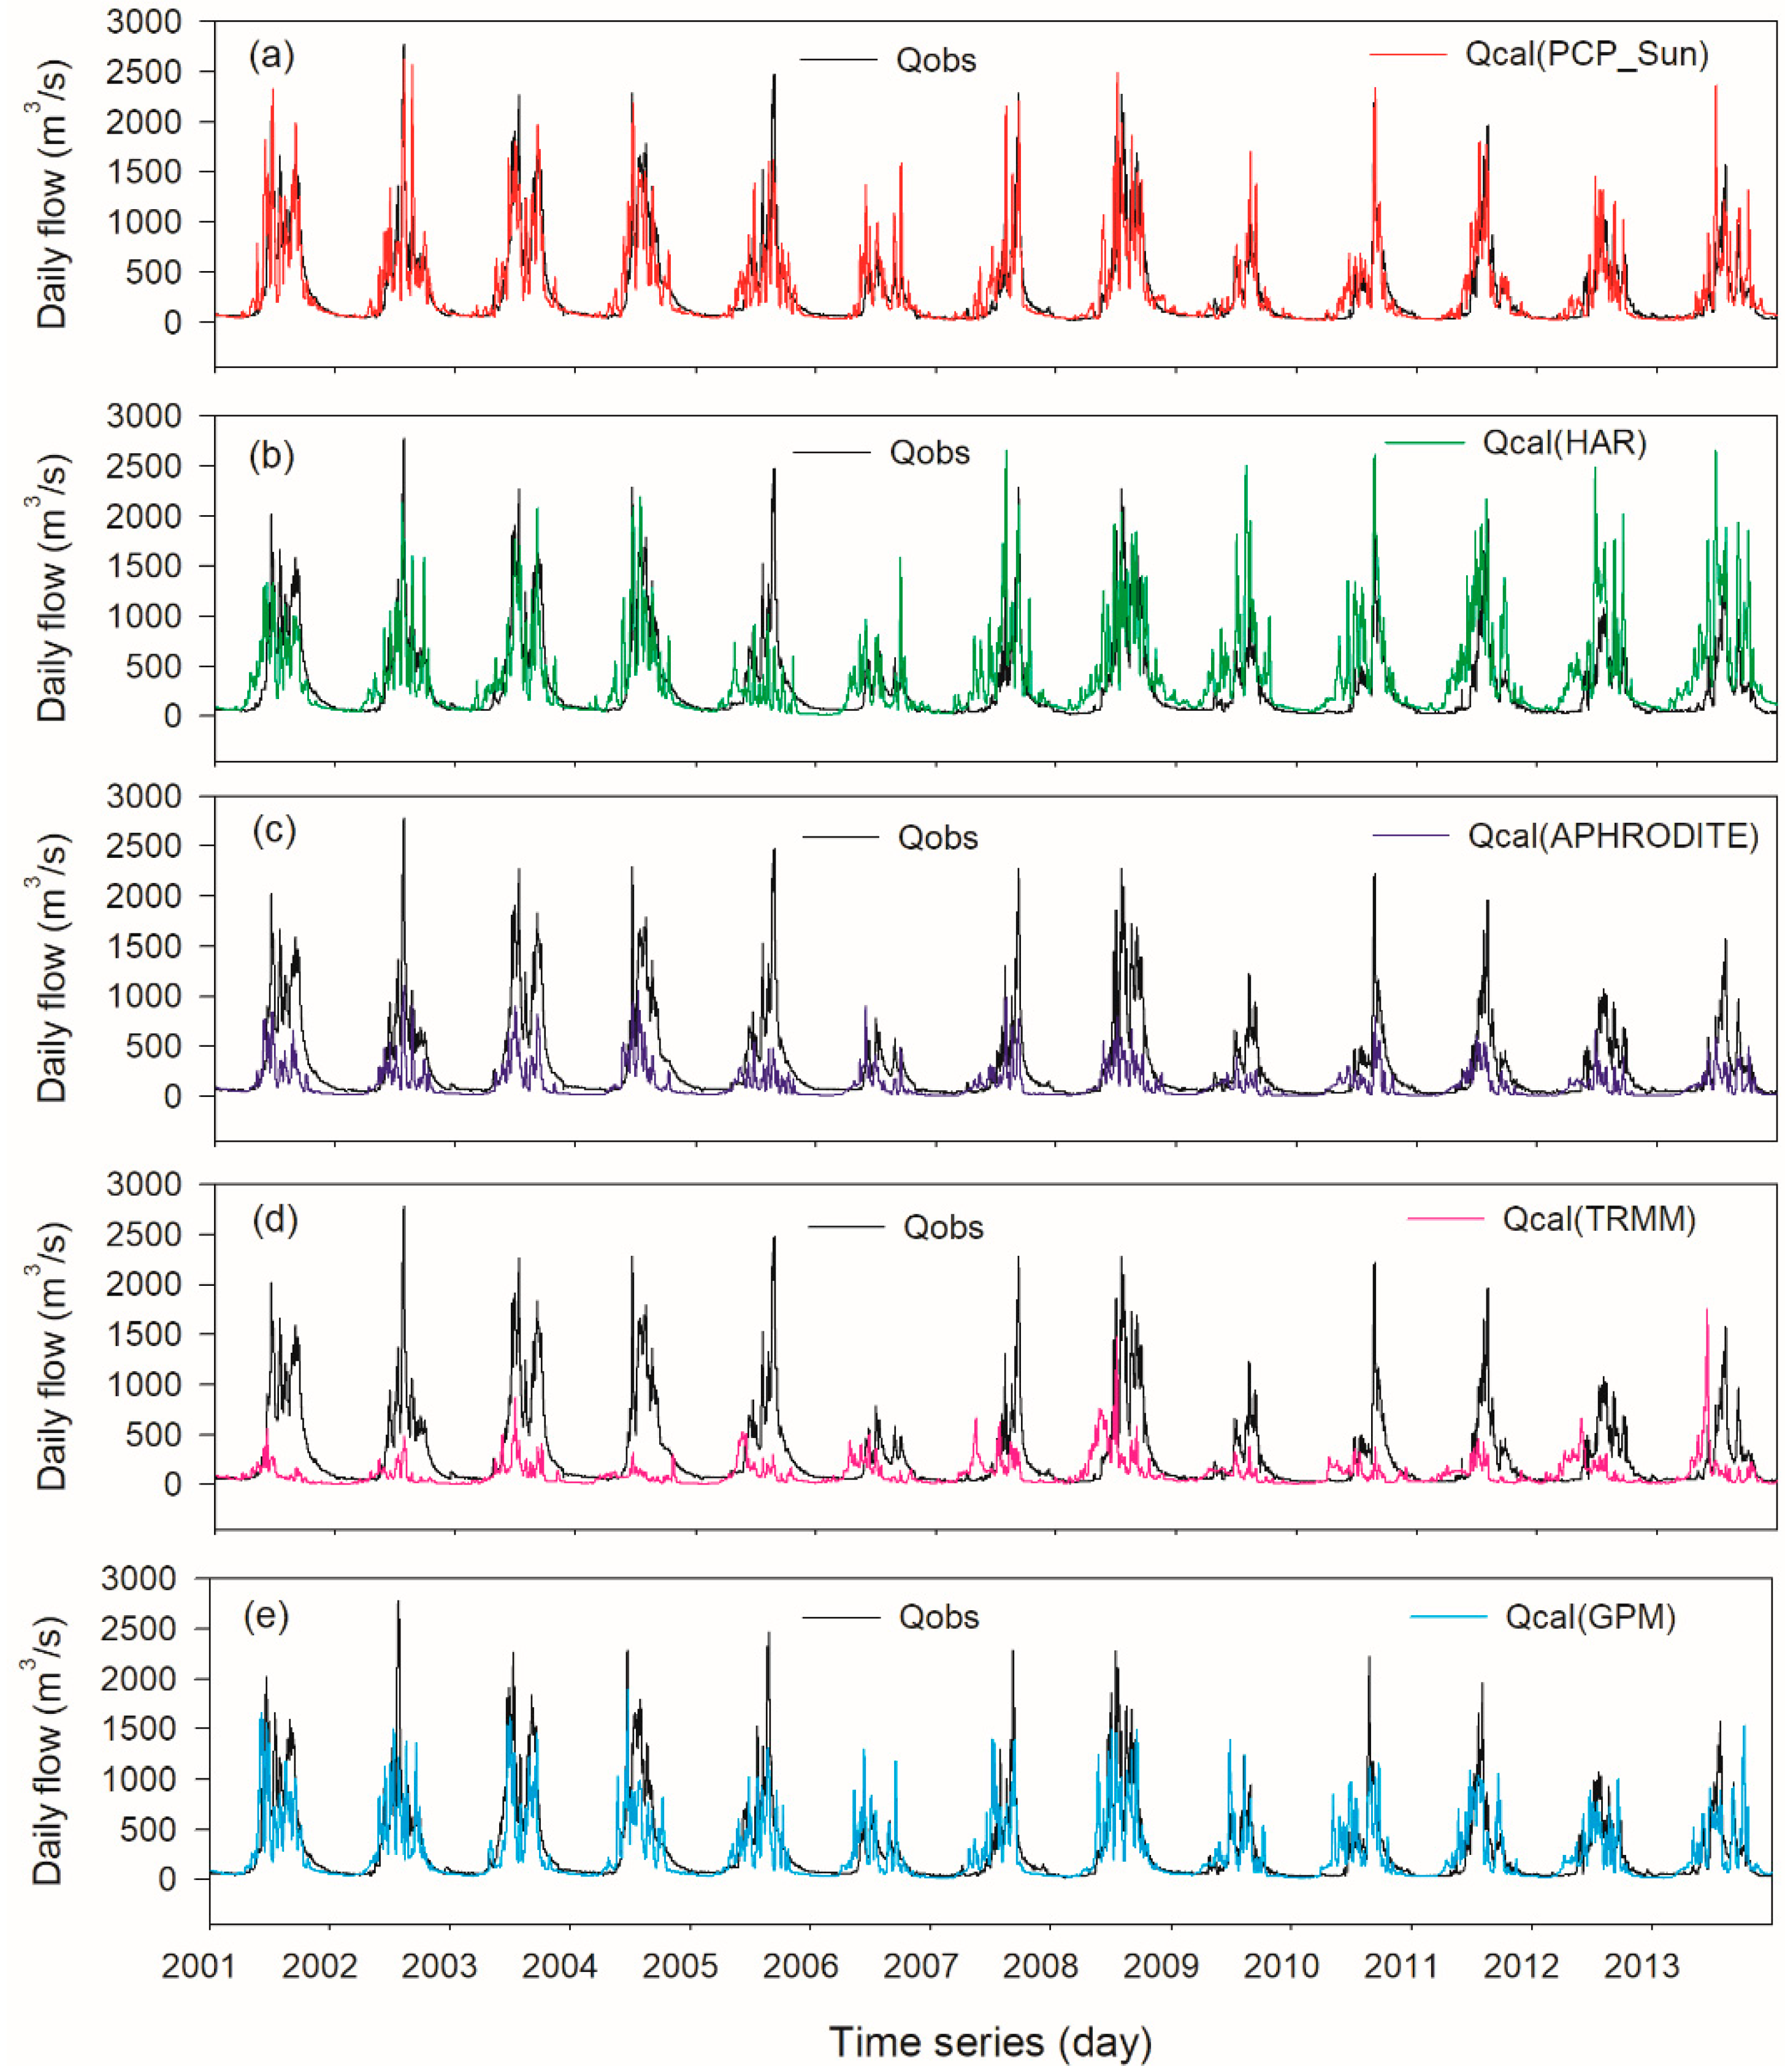
Figure 8.
Daily flow simulation driven by (a) reference precipitation and four precipitation datasets: (b) HAR, (c) APHRODITE, (d) TRMM and (e) GPM, at Lhasa hydrological station during years 2001–2013.
Figure 8.
Daily flow simulation driven by (a) reference precipitation and four precipitation datasets: (b) HAR, (c) APHRODITE, (d) TRMM and (e) GPM, at Lhasa hydrological station during years 2001–2013.
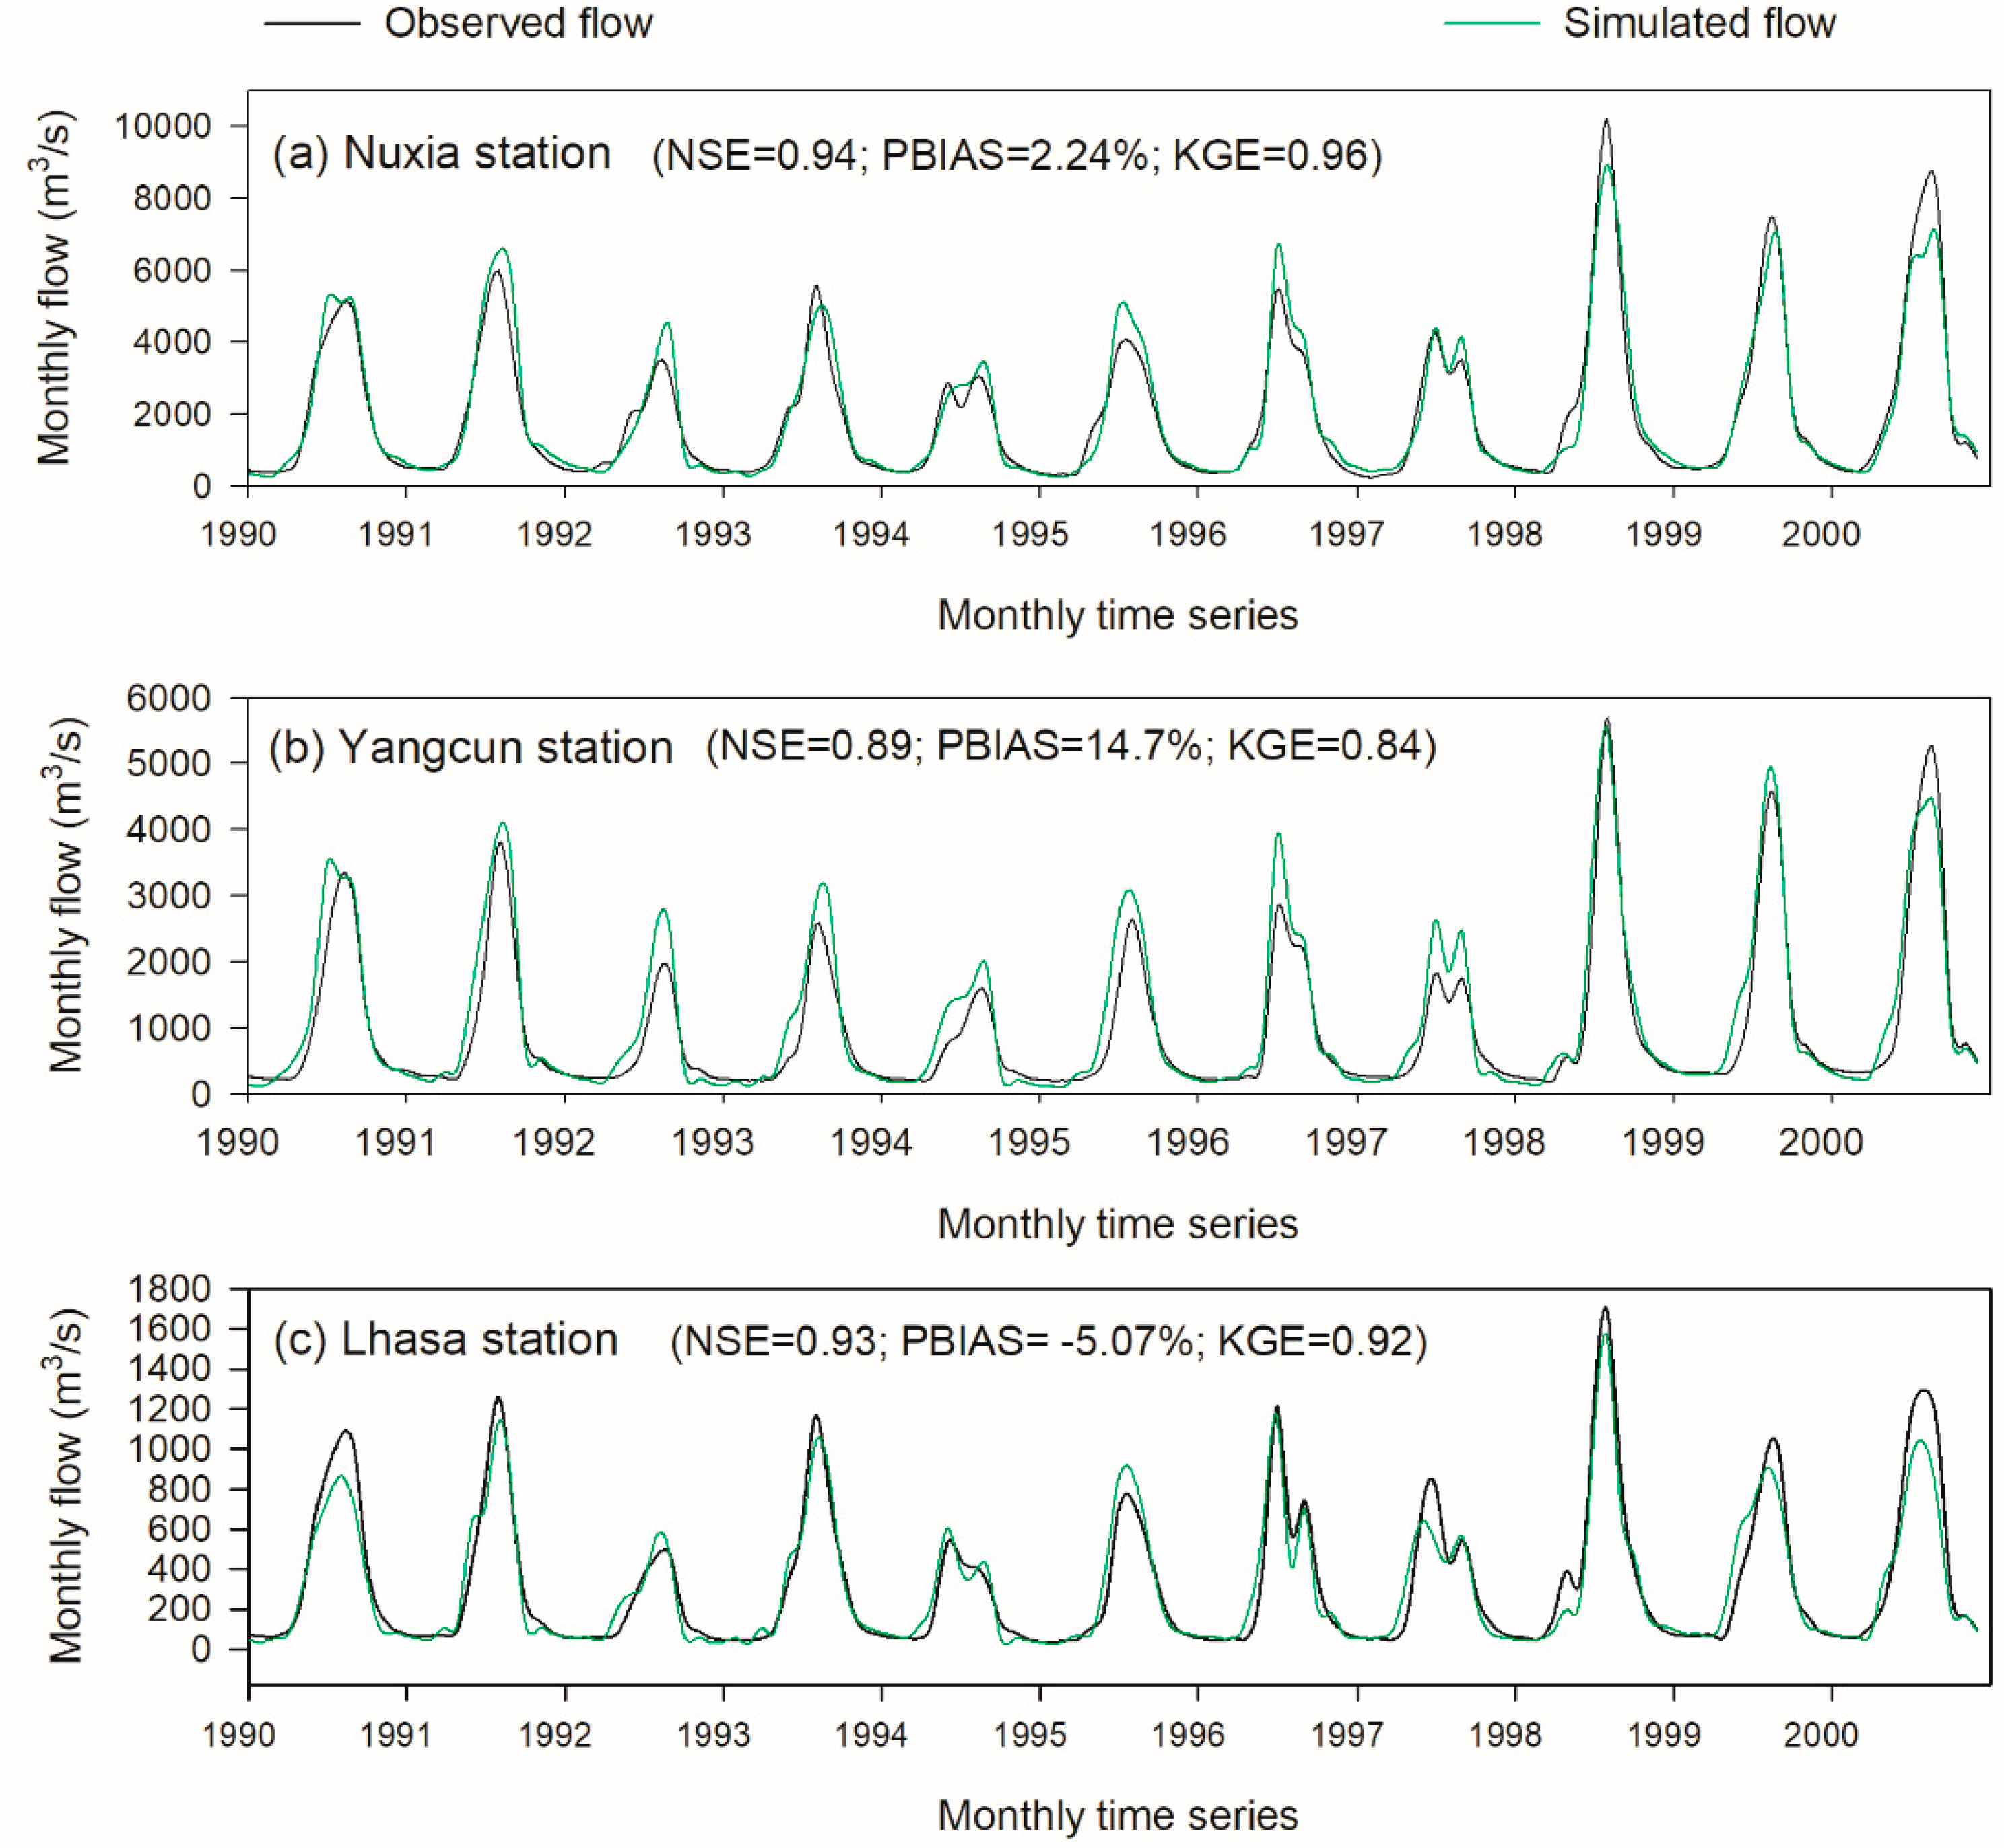
Figure 9.
Monthly flow simulation at (a) Nuxia, (b) Yangcun, and (c) Lhasa hydrological stations during calibration period (1990–2000).
Figure 9.
Monthly flow simulation at (a) Nuxia, (b) Yangcun, and (c) Lhasa hydrological stations during calibration period (1990–2000).
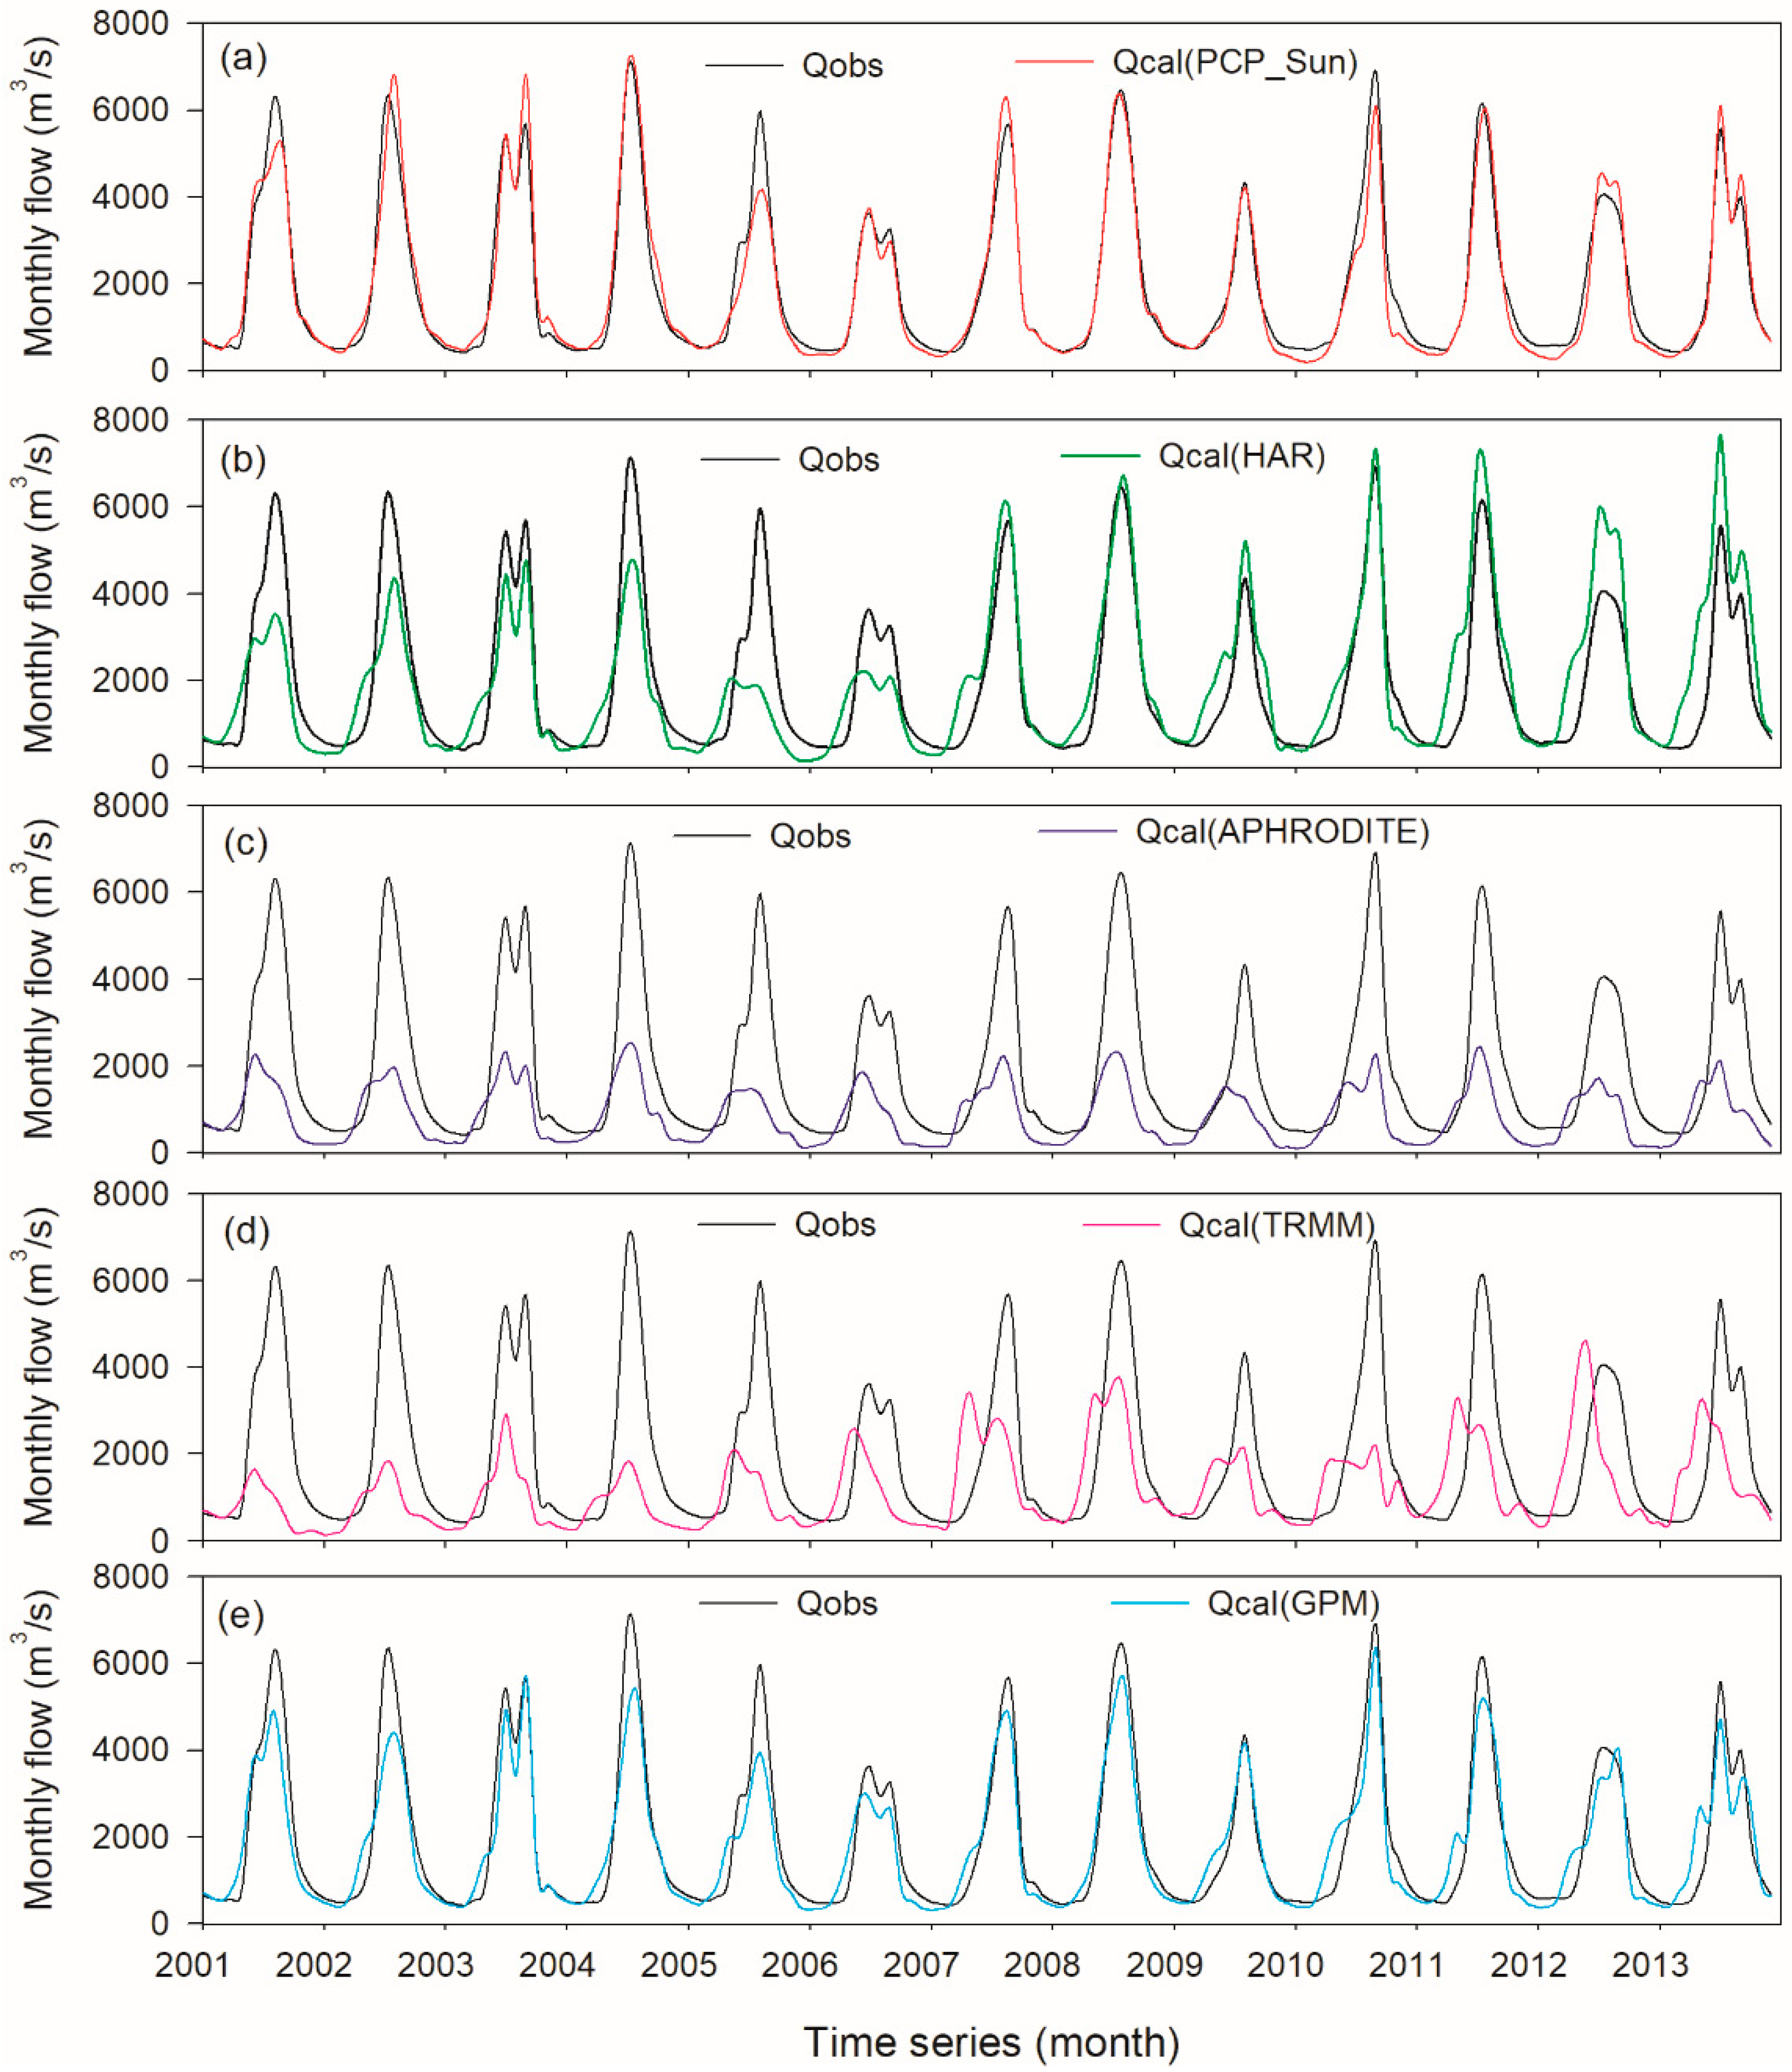
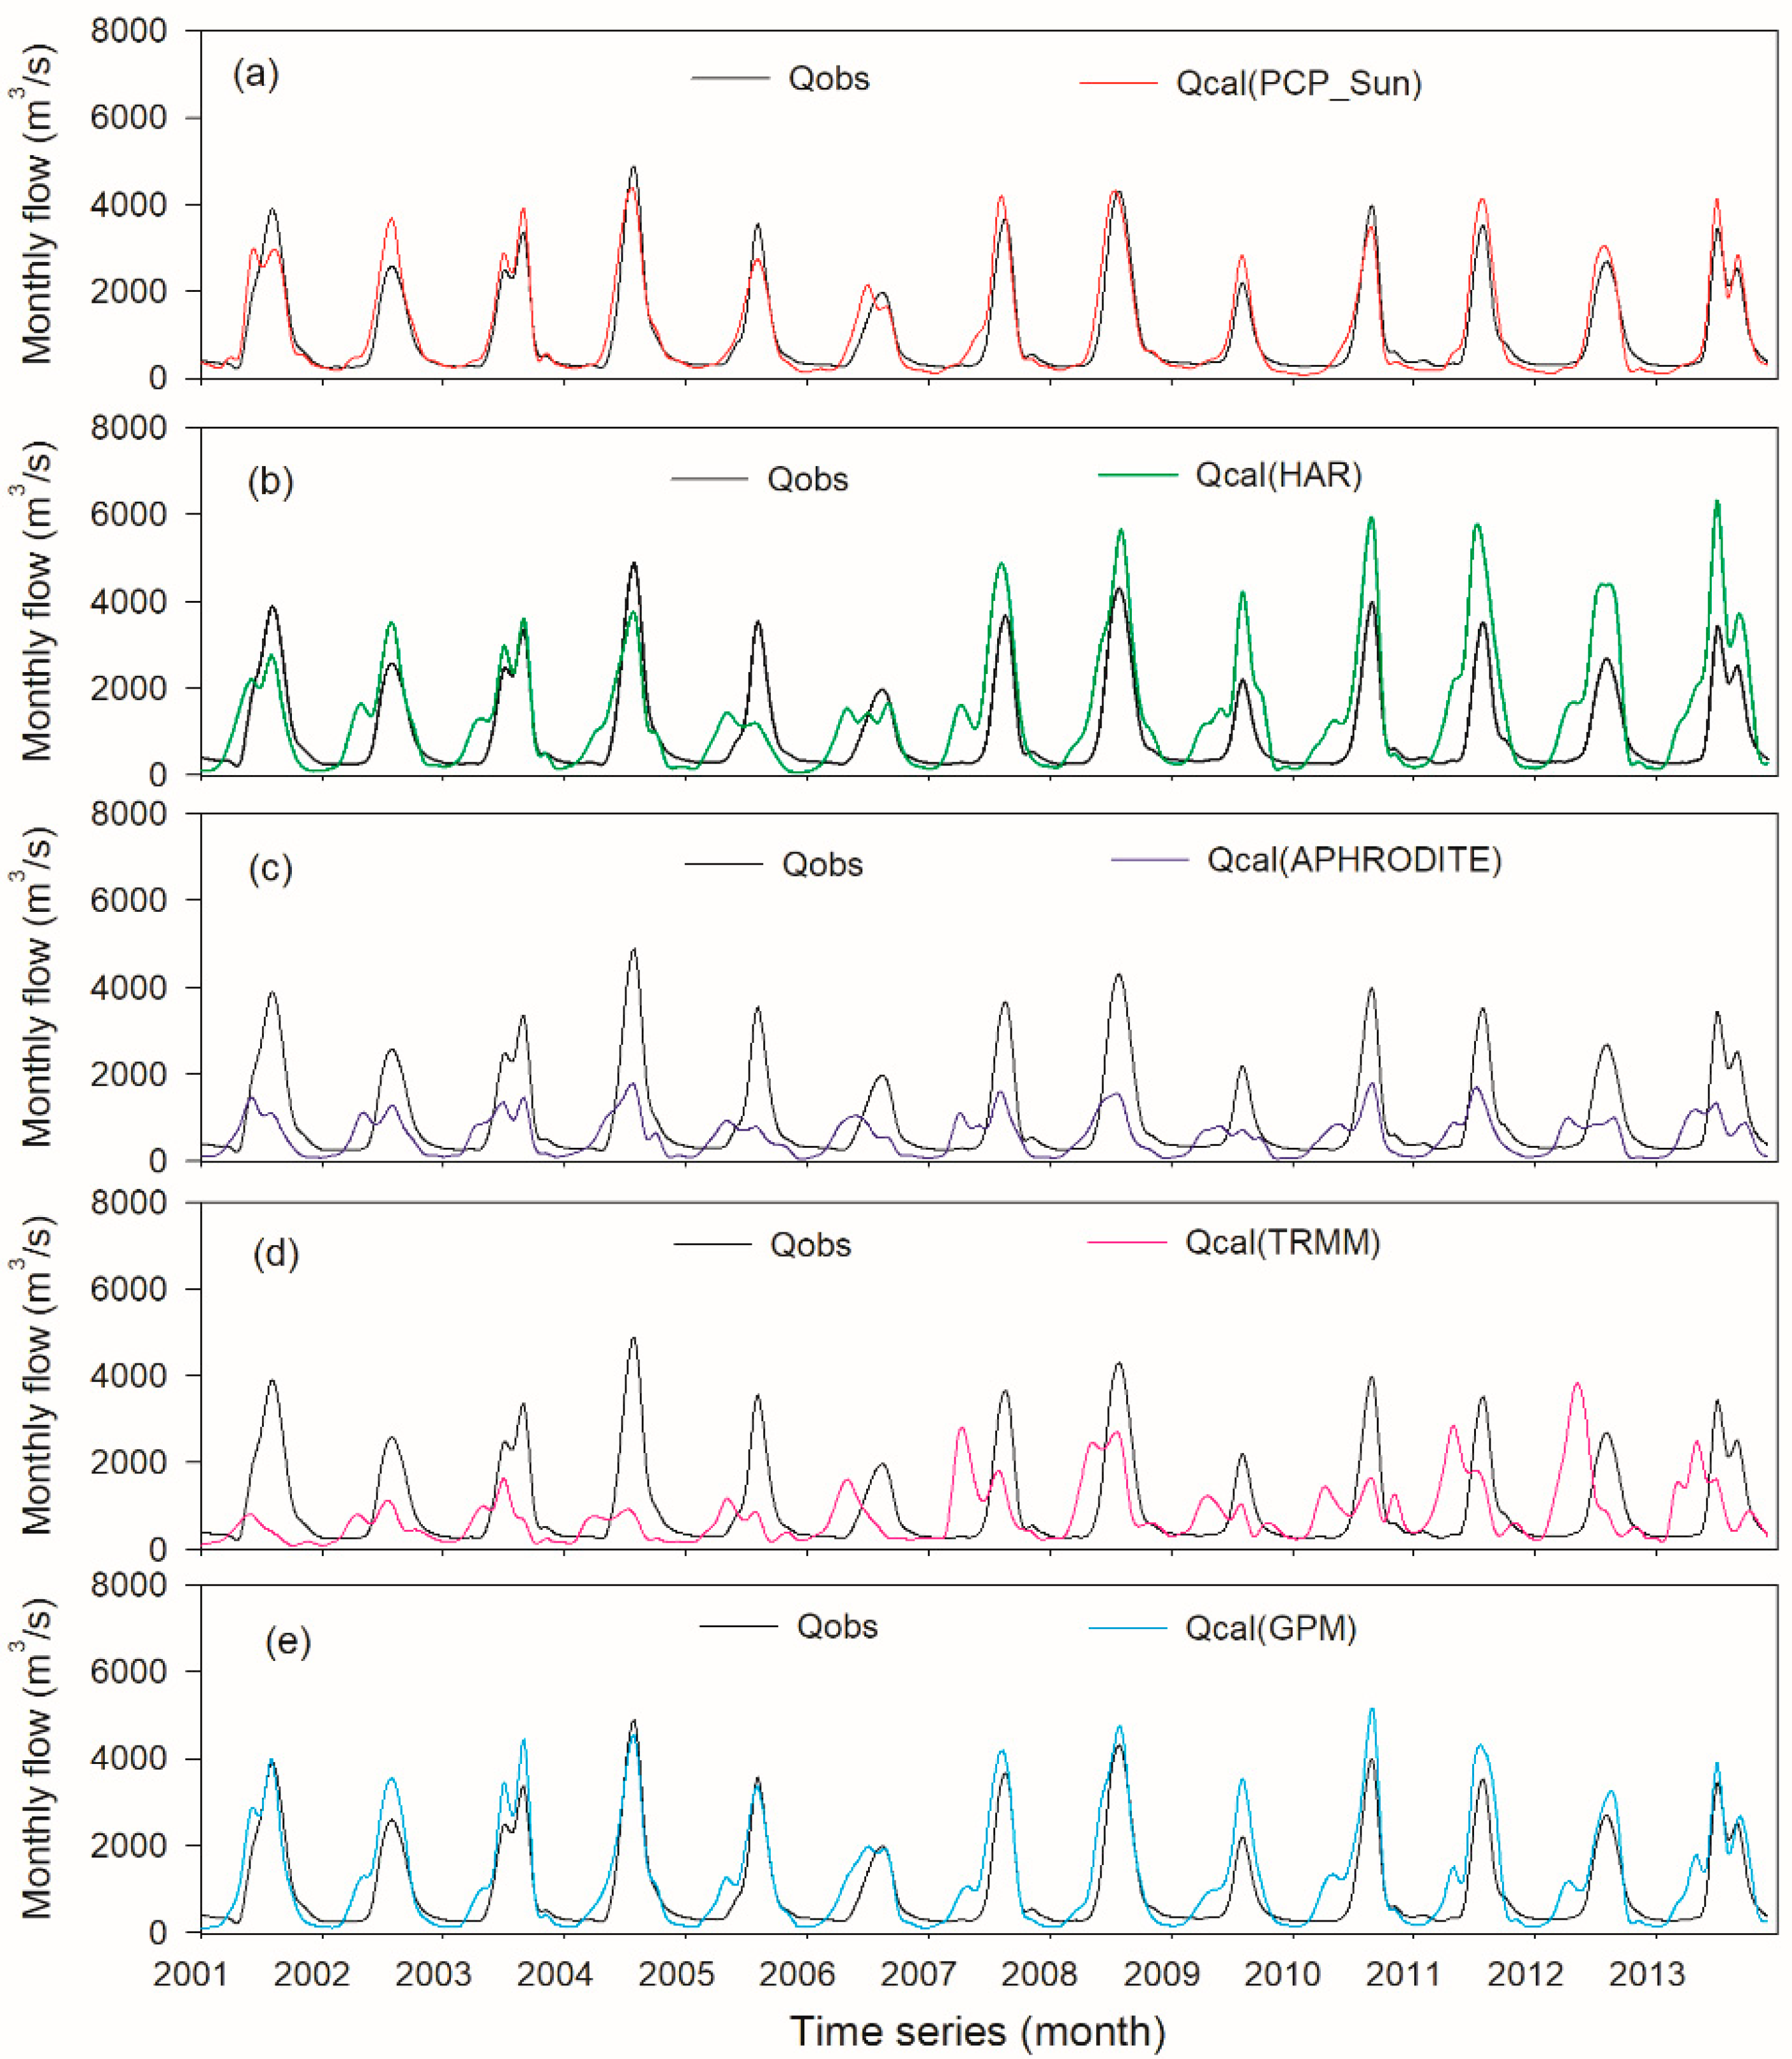
Figure 10.
Monthly flow simulation driven by (a) reference precipitation and four precipitation datasets: (b) HAR, (c) APHRODITE, (d) TRMM and (e) GPM, at Nuxia hydrological station during years 2001–2013.
Figure 10.
Monthly flow simulation driven by (a) reference precipitation and four precipitation datasets: (b) HAR, (c) APHRODITE, (d) TRMM and (e) GPM, at Nuxia hydrological station during years 2001–2013.
Figure 11.
Monthly flow simulation driven by (a) reference precipitation and four precipitation datasets: (b) HAR, (c) APHRODITE, (d) TRMM and (e) GPM, at Yangcun hydrological station during years 2001–2013.
Figure 11.
Monthly flow simulation driven by (a) reference precipitation and four precipitation datasets: (b) HAR, (c) APHRODITE, (d) TRMM and (e) GPM, at Yangcun hydrological station during years 2001–2013.
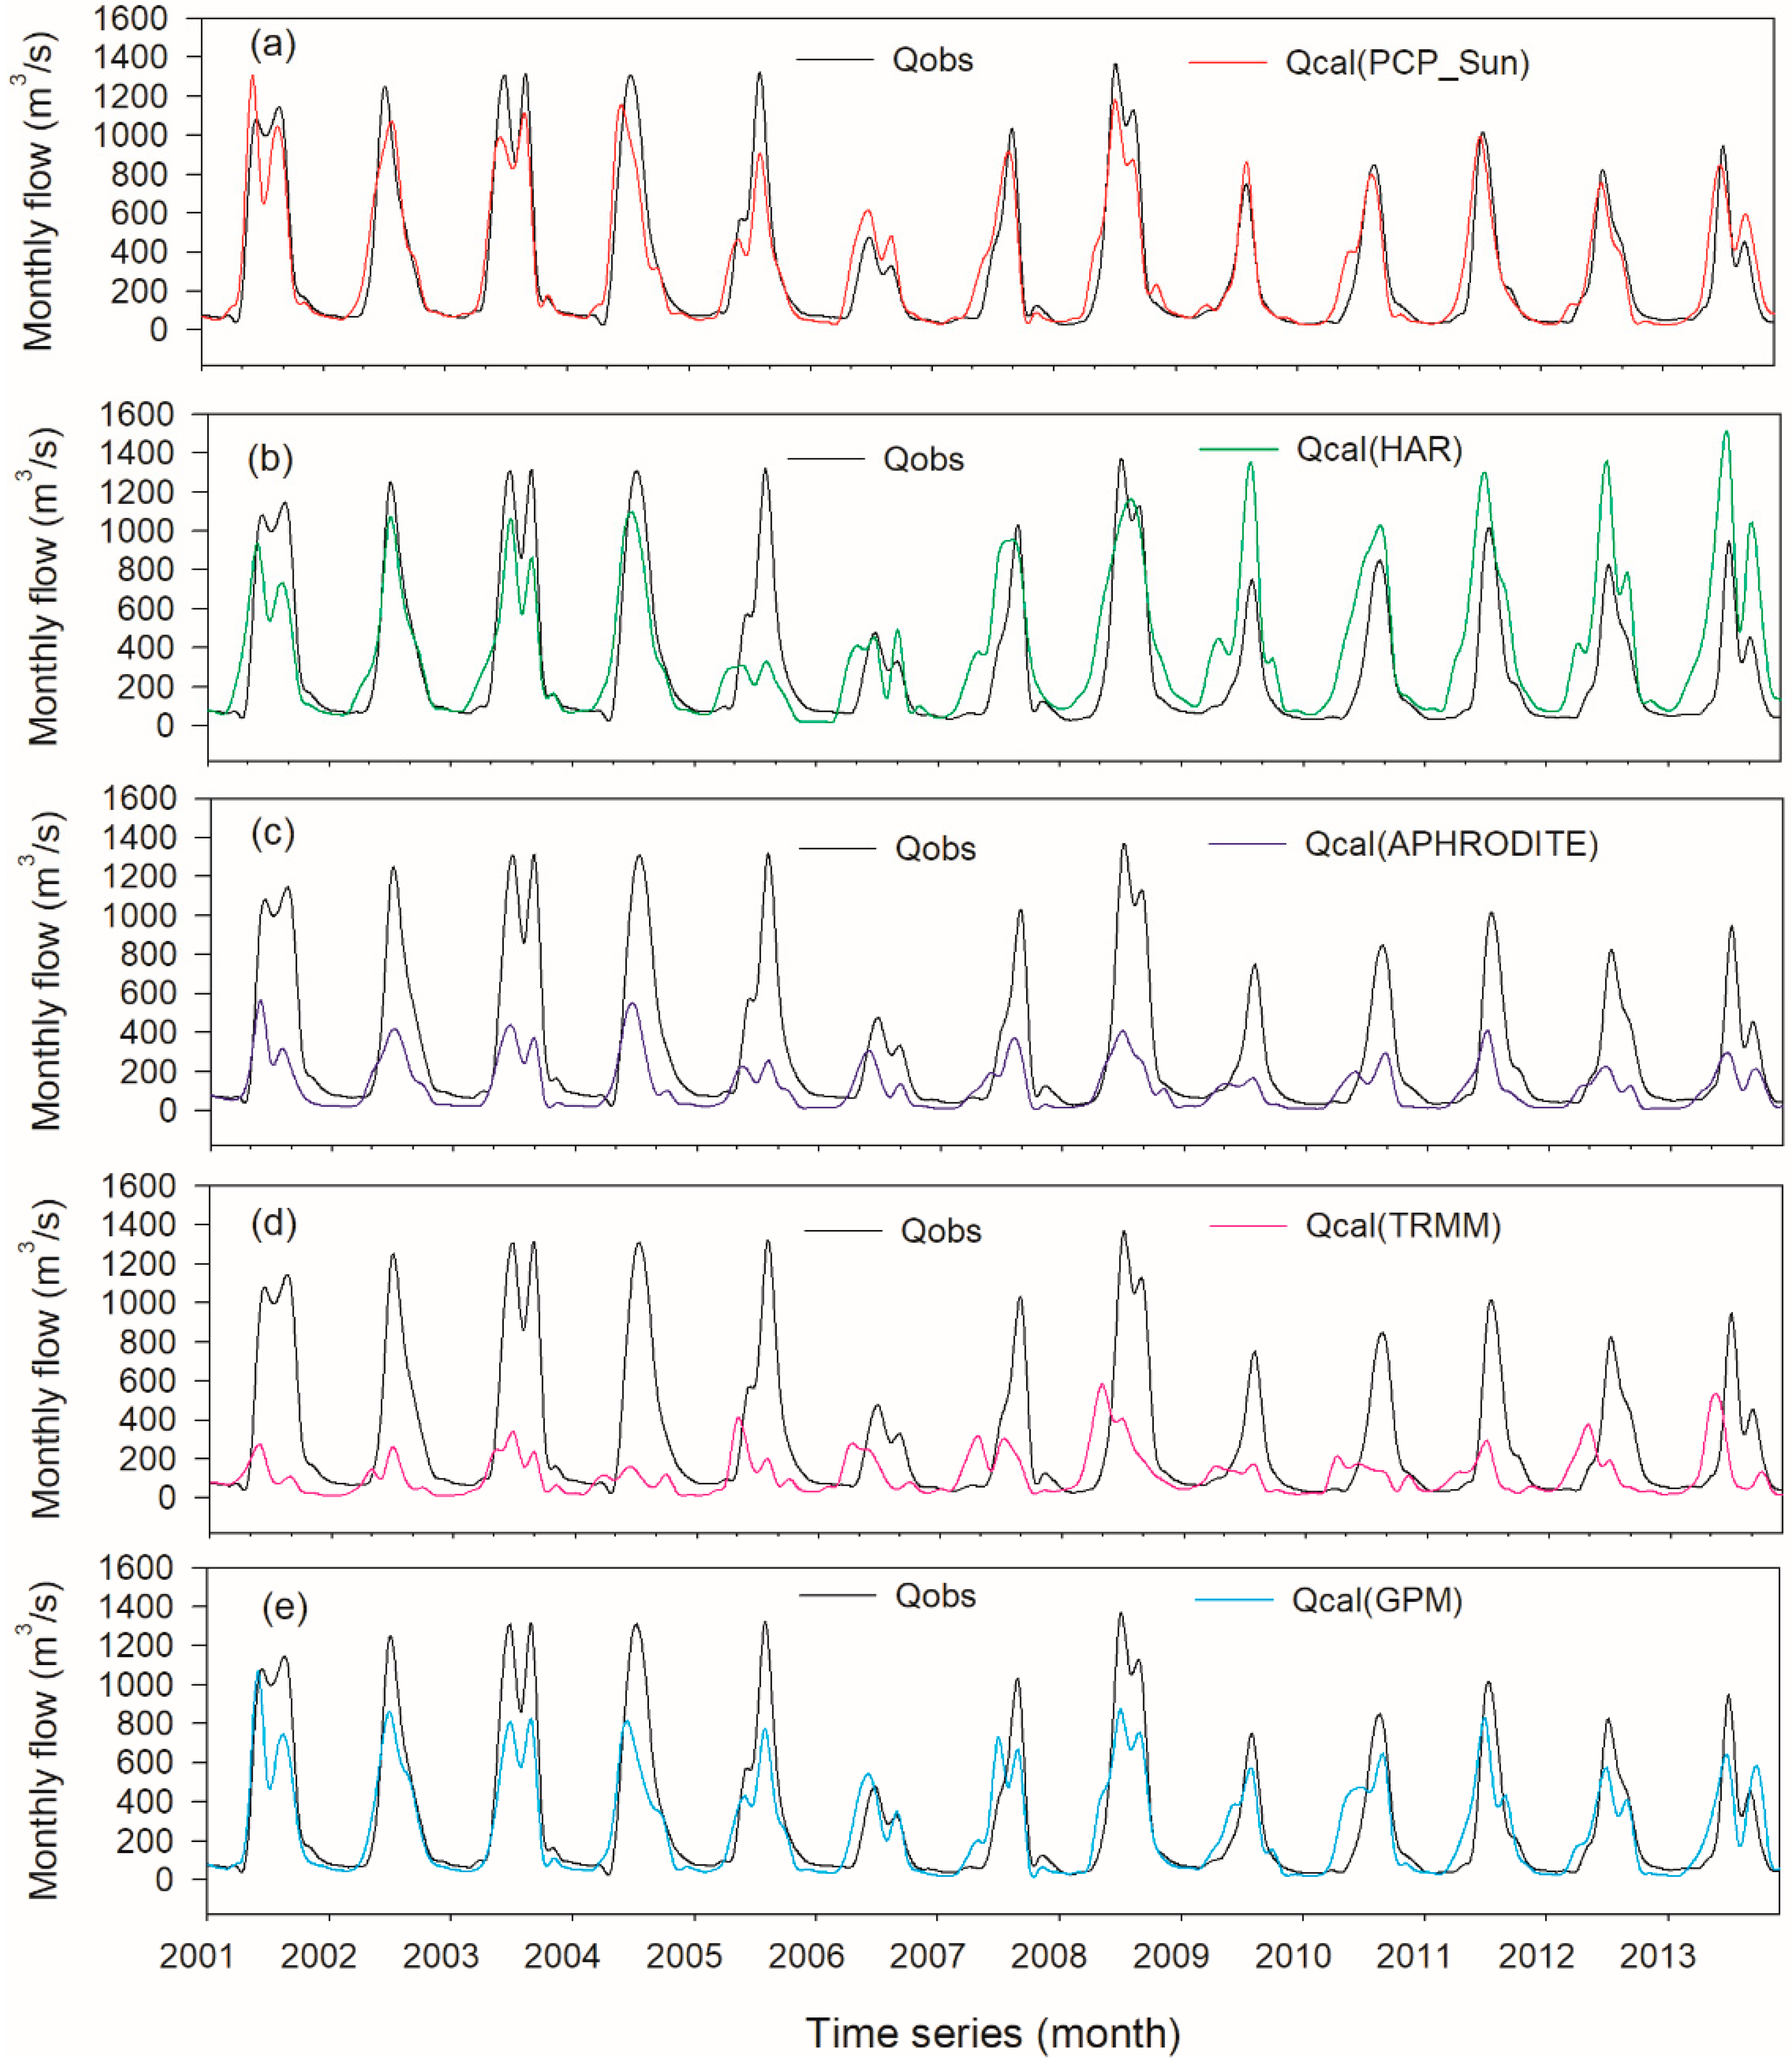
Figure 12.
Monthly flow simulation driven by (a) reference precipitation and four precipitation datasets: (b) HAR, (c) APHRODITE, (d) TRMM and (e) GPM, at Lhasa hydrological station during years 2001–2013.
Figure 12.
Monthly flow simulation driven by (a) reference precipitation and four precipitation datasets: (b) HAR, (c) APHRODITE, (d) TRMM and (e) GPM, at Lhasa hydrological station during years 2001–2013.
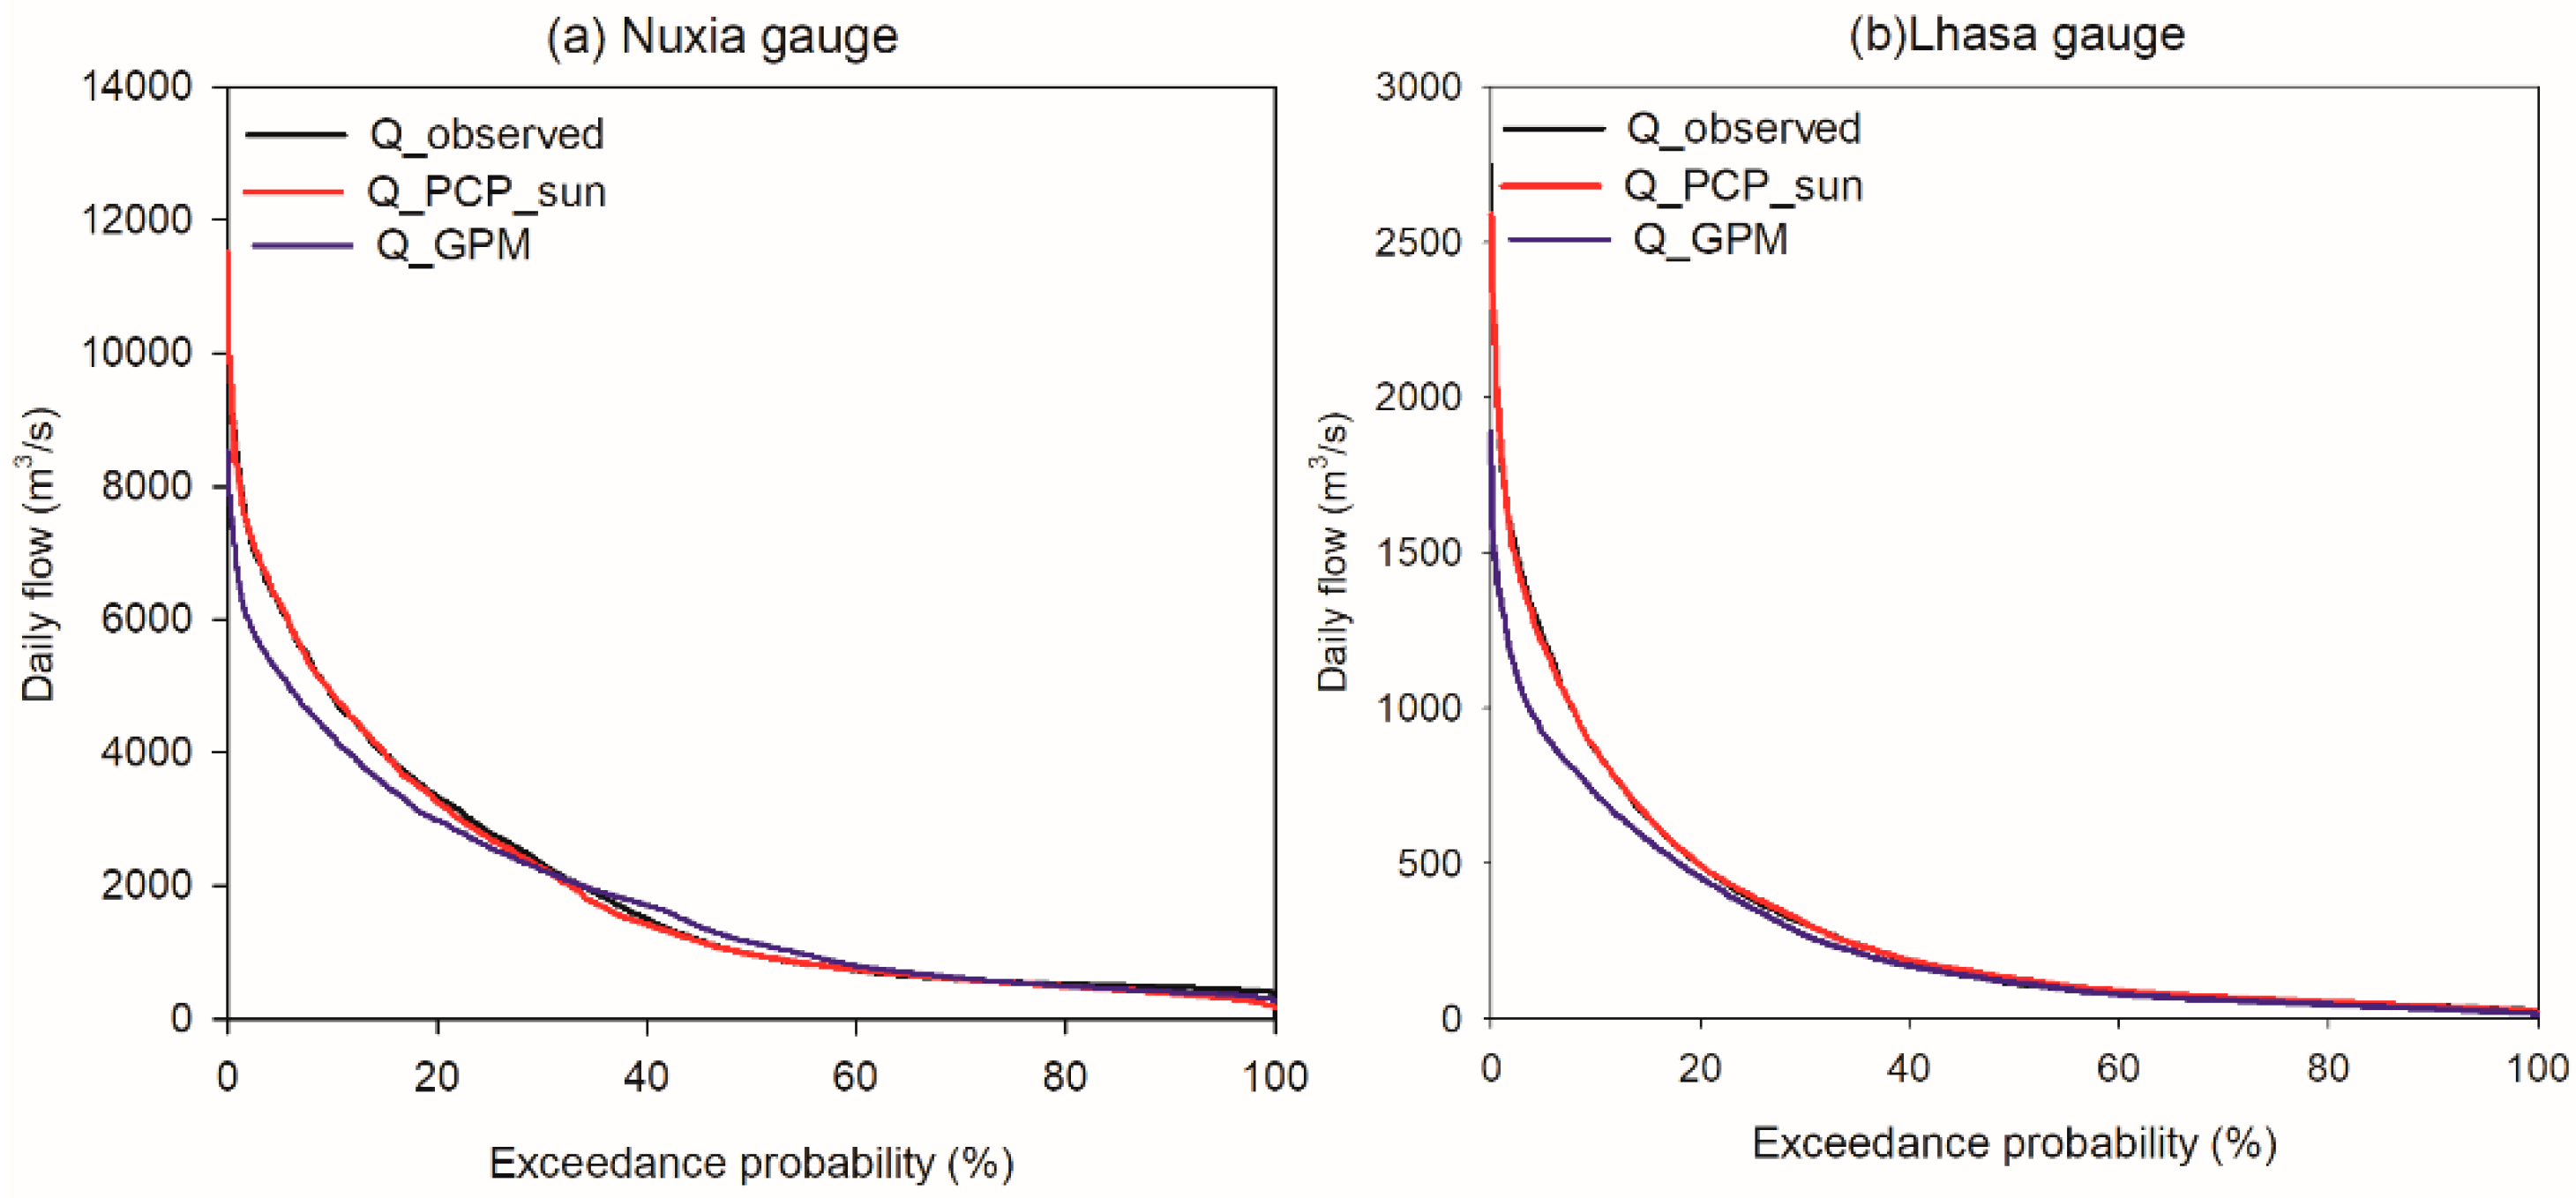
Figure 13.
Flow duration curves of the observed and simulated daily discharge at (a) Nuxia and (b) Lhasa hydrological stations.
Figure 13.
Flow duration curves of the observed and simulated daily discharge at (a) Nuxia and (b) Lhasa hydrological stations.
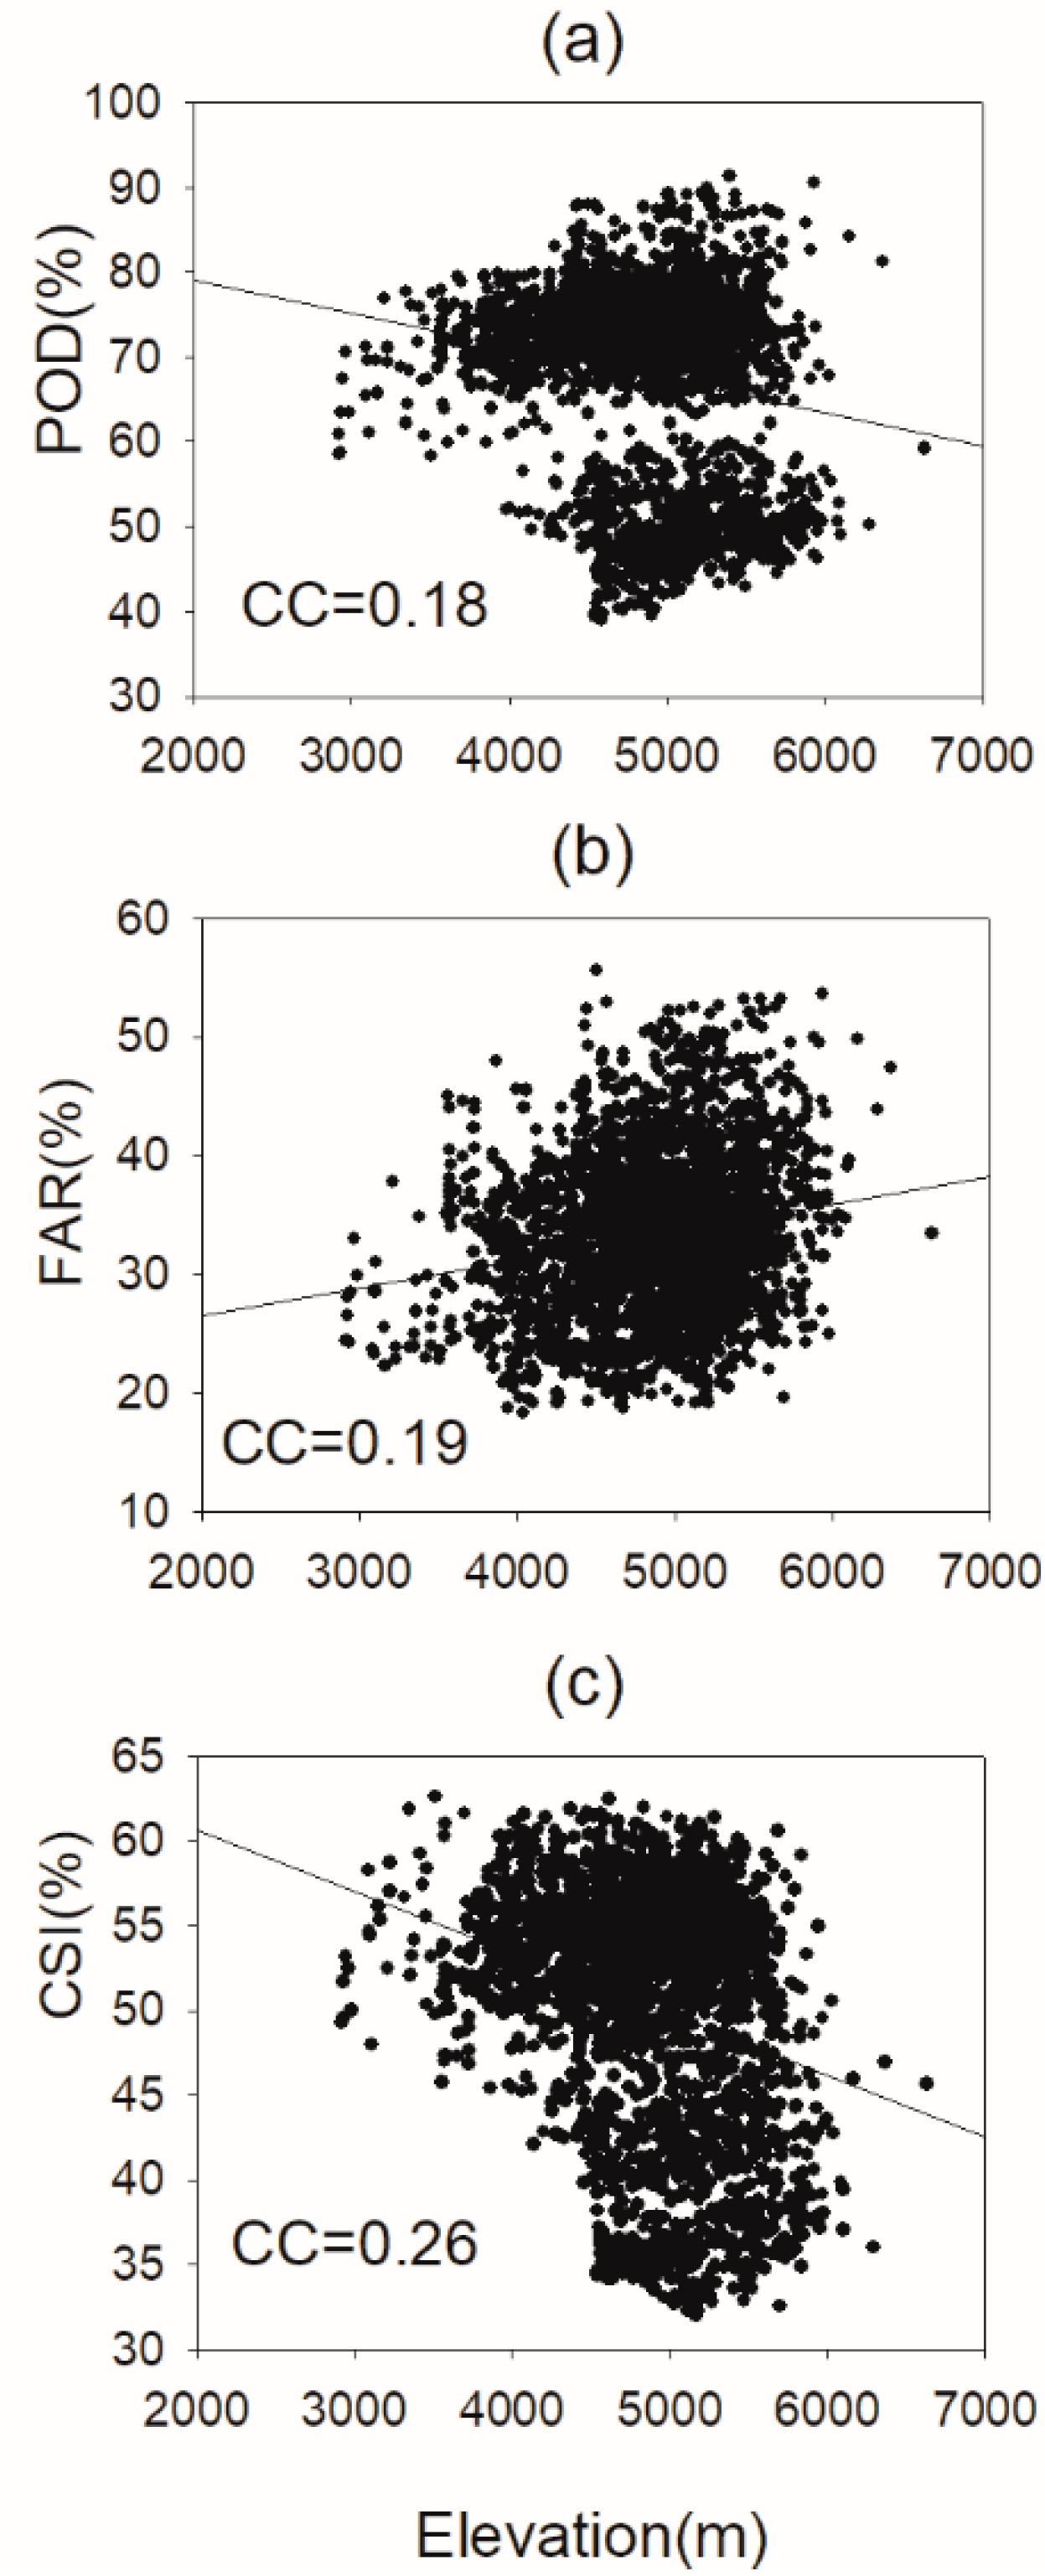
Figure 14.
Relationship between the statistical metrics and the altitude for GPM: (a) POD, (b) FAR, and (c) CSI. Black lines show the linear trends estimated with the least-squares-error method. CC, correlation coefficient.
Figure 14.
Relationship between the statistical metrics and the altitude for GPM: (a) POD, (b) FAR, and (c) CSI. Black lines show the linear trends estimated with the least-squares-error method. CC, correlation coefficient.
Figure 15.
Box plots of 15 CMA stations-based statistical metrics over the UB at the grid scale: (a) RB, (b) RMSE, (c) CC, (d) POD, (e) FAR, and (f) CSI at daily scale for years 2001–2013. The number at the base of the box plot is the median value of each statistical metric. The short dash line in box plots denotes the mean value of statistical metric. The green horizontal line indicates the optimum value.
Table 1.
Basic information of the three flow gauges in the Upper Brahmaputra River Basin.
Table 1.
Basic information of the three flow gauges in the Upper Brahmaputra River Basin.
| Gauge | Latitude (°N) | Longitude (°E) | Drainage Area (km2) | Glacier Area (km2) | Percent of Drainage Area for Glacier (%) |
|---|
| Lhasa | 29.63 | 91.15 | 26,235 | 356 | 1.36 |
| Yangcun | 29.28 | 91.88 | 153,191 | 3295 | 2.16 |
| Nuxia | 29.47 | 94.57 | 201,200 | 4225.2 | 2.11 |
Table 2.
Description of the four gridded precipitation products.
Table 2.
Description of the four gridded precipitation products.
Table 3.
List of the statistical metrics used for evaluating precipitation products.
Table 3.
List of the statistical metrics used for evaluating precipitation products.
| Statistic Metrics | Formula | Unit | Perfect Value |
|---|
| Correlation coefficient (CC) | | - | 1 |
| Root-mean-squared error (RMSE) | | mm | 0 |
| Relative bias (RB) | | % | 0 |
| Probability of detection (POD) | | % | 100% |
| False-alarm ration (FAR) | | % | 0 |
| Critical success index (CSI) | | % | 100% |
Table 4.
Summary of model parameters, ranges, and calibrated values used in VIC-glacier model over the UB.
Table 4.
Summary of model parameters, ranges, and calibrated values used in VIC-glacier model over the UB.
| Model Parameter | Unit | Range | Determined Value |
|---|
| Degree–day factor for ice-melt (DDFice) | mm °C−1 day−1 | 3.4–11.8 | 9 |
| Degree–day factor for snowmelt (DDFsnow) | mm °C−1 day−1 | 3.0–7.9 | 4.1 |
| Fraction of Dsmax where non-linear baseflow begins (Ds) | None | 0–1 | 0.3 |
| Maximum velocity of baseflow (Dsmax) | mm/d | 0–50 | 10 |
| Fraction of maximum soil moisture where non-linear baseflow occurs (Ws) | None | 0–1 | 0.9 |
| Variable infiltration curve parameter (binfilt) | None | 0–0.4 | 0.2 |
| Thickness of the second soil moisture layer (d2) | m | 0–3 | 1.1 |
Table 5.
Statistics of annual precipitation at basin scale over the UB.
Table 5.
Statistics of annual precipitation at basin scale over the UB.
| Precipitation Products | Mean (mm) | Minimum (mm) | Maximum (mm) | Standard Deviation (mm) | Median (mm) | q25 * (mm) | q75 * (mm) |
|---|
| PCP_Sun | 563.3 | 417.9 | 680.3 | 80.7 | 581.1 | 501.1 | 623.7 |
| HAR | 576.8 | 337.6 | 785.8 | 127.0 | 551.6 | 518.7 | 688.2 |
| APHRODITE | 402.5 | 308.4 | 456.3 | 41.4 | 411.7 | 380.2 | 423.0 |
| TRMM | 399.4 | 238.9 | 529.6 | 87.8 | 362.2 | 345.1 | 481.3 |
| GPM | 528.7 | 441.0 | 596.8 | 49.8 | 534.7 | 496.0 | 567.0 |
Table 6.
Statistical indices’ median values during rainy and non-rainy seasons.
Table 6.
Statistical indices’ median values during rainy and non-rainy seasons.
| Period | Precipitation Dataset | RB (%) | RMSE | CC | POD (%) | FAR (%) | CSI (%) |
|---|
| | HAR | 2.05 | 6.02 | 0.33 | 87.02 | 19.54 | 69.95 |
| Rainy season | APHRODITE | −35.21 | 4.71 | 0.47 | 97.28 | 22.82 | 74.56 |
| | TRMM | −51.39 | 5.95 | 0.22 | 75.76 | 18.63 | 62.39 |
| | GPM | −4.49 | 6.66 | 0.29 | 81.36 | 16.07 | 68.69 |
| | HAR | 33.30 | 2.11 | 0.28 | 55.79 | 58.05 | 26.09 |
| Non-rainy season | APHRODITE | 0.87 | 1.36 | 0.46 | 81.94 | 63.31 | 30.34 |
| TRMM | 55.54 | 2.21 | 0.03 | 48.97 | 75.56 | 15.71 |
| | GPM | −12.37 | 1.82 | 0.28 | 49.16 | 61.85 | 24.09 |
Table 7.
Statistical indices of the simulated streamflow at the three hydrological stations during 2001–2013 in the UB.
Table 7.
Statistical indices of the simulated streamflow at the three hydrological stations during 2001–2013 in the UB.
| Hydrological Station | Precipitation Inputs | Daily Simulation Period (2001–2013) | Monthly Simulation Period (2001–2013) |
|---|
| PBIAS (%) | NSE | KGE | PBIAS (%) | NSE | KGE |
|---|
| Nuxia | PCP_Sun | −2.34 | 0.85 | 0.91 | −2.40 | 0.95 | 0.95 |
| | HAR | 3.23 | 0.60 | 0.78 | 2.99 | 0.70 | 0.82 |
| | APHRODITE | −54.86 | 0.13 | 0.38 | −54.97 | 0.15 | 0.40 |
| | TRMM | −37.70 | 0.07 | 0.32 | −37.85 | 0.11 | 0.33 |
| | GPM | −7.61 | 0.80 | 0.83 | −7.82 | 0.88 | 0.86 |
| Yangcun | PCP_Sun | - | - | - | 6.91 | 0.88 | 0.91 |
| | HAR | - | - | - | 42.52 | 0.22 | 0.53 |
| | APHRODITE | - | - | - | −41.75 | 0.25 | 0.42 |
| | TRMM | - | - | - | −19.64 | −0.20 | 0.16 |
| | GPM | - | - | - | 23.45 | 0.72 | 0.73 |
| Lhasa | PCP_Sun | 1.02 | 0.67 | 0.83 | 0.99 | 0.87 | 0.86 |
| | HAR | 26.71 | 0.29 | 0.56 | 26.92 | 0.48 | 0.57 |
| | APHRODITE | −60.64 | 0.21 | 0.34 | −60.43 | 0.17 | 0.35 |
| | TRMM | −63.83 | −0.13 | 0.06 | −64.12 | −0.15 | 0.08 |
| | GPM | −15.81 | 0.61 | 0.72 | −15.90 | 0.74 | 0.74 |
Table 8.
Statistics for the streamflow simulation during rainy season at Nuxia hydrological station over 2001–2013.
Table 8.
Statistics for the streamflow simulation during rainy season at Nuxia hydrological station over 2001–2013.
| Precipitation Inputs | Daily Simulation during Rainy Season |
|---|
| PBIAS (%) | NSE |
|---|
| PCP_Sun | −1.37 | 0.56 |
| GPM | −13.55 | 0.48 |
Table 9.
Statistics of the simulated flood events at the two hydrological stations in the UB.
Table 9.
Statistics of the simulated flood events at the two hydrological stations in the UB.
| Station | Exceedance Probability (%) | Observed Flow (m3/s) | Q_PCP_Sun (m3/s) | RB * for Q_PCP_Sun (%) | Q_GPM (m3/s) | RB for Q_GPM (%) |
|---|
| | 1% (Q1) | 8270 | 8185 | −1.03 | 6594 | −20.27 |
| Nuxia | 5% (Q5) | 6190 | 6251 | 0.99 | 5185 | −16.24 |
| | 10% (Q10) | 4840 | 4876 | 0.74 | 4251 | −12.17 |
| | 1% (Q1) | 1760 | 1826 | 3.75 | 1330 | −24.43 |
| Lhasa | 5% (Q5) | 1230 | 1204 | −2.11 | 917 | −25.45 |
| | 10% (Q10) | 859 | 869 | 1.16 | 724 | −15.72 |


