1. Introduction
To date, the evolution and behavior of aerosols have been widely investigated, owing to its important role in climate change, cloud distribution, weather forecast, and atmospheric pollution research, to name a few [
1,
2,
3,
4,
5]. Among all the instruments for aerosol monitoring, lidar outweighs its counterparts for its long penetration distance, high spatial and temporal resolution, and full-time automatic observation capability [
6,
7,
8,
9]. Despite its success in continuous aerosol and cloud measurement, the use of a laser has also brought about the issue of eye safety. Fortunately, lasers operating at ~1.5 μm possess the maximum permissible exposure (MPE) up to 1 J/cm
2, which is over two orders of magnitude higher than the visible or 1 μm lasers, making them suitable light sources for eye-safe aerosol and cloud lidars [
10,
11,
12].
As another crucial component for a lidar system, the detector has witnessed great progress in the recent few years at ~1.5 μm wavelength band resulting from the prosperity of advanced material growth and processing technologies. Photon detection efficiency (PDE) of over 95% has been achieved for a superconducting nanowire single-photon detector (SNSPD) at 0.8 K [
13] and a PDE of over 60% has been realized for the HgCdTe avalanche photodiode (APD) at 110 K [
14]. However, mandatory cooling systems should always be applied to these detectors so as to maintain their high PDE, which would inevitably make the whole detector bulky and expensive. Although the PDE of InGaAs/InP detectors have been raised to ~60% at 300 K [
15], the dark count rate (DCR) and after-pulse probability (Pap) are also dramatically increased to hundreds of kcps and ~15%, respectively. Such a performance may prevent them from precise atmospheric monitoring.
As an alternative, an upconversion detector (UPD) employs a nonlinear crystal and a pump source to convert the shortwave or even midwave infrared photons into visible or near-infrared photons via sum-frequency generation (SFG). In this way, the upconverted photons can be recorded by the most sophisticated detectors, such as the photomultiplier tube (PMT) or silicon-based APD (Si-APD). Thanks to the high efficiency of the upconversion process and the good performance of these mature detectors, a UPD could achieve applicable PDE, low DCR, negligible Pap, and short dead time simultaneously at room temperature, which makes them excellent candidates for atmospheric lidar detection in the eye-safe wavelength regime.
In early trials, Xia et al. demonstrated the first UPD-based aerosol lidar, where the backscattered photons at ~1548 nm were upconverted to 863 nm before being recorded by a commercial Si-APD [
16,
17]. However, suffering from the insufficient pump power at ~1950 nm, a single-mode fiber-coupled periodically poled lithium niobate waveguide (PPLN-W) with small mode field diameter (MFD) should be utilized to realize efficient SFG. The small MFD and large insertion loss would reduce the field of view (FOV) of the receiver and the overall detection efficiency to some extent. In order to enlarge the FOV, free-space coupled bulk PPLN and chirped PPLN crystals with much larger apertures and/or acceptance angles were adopted [
18,
19,
20,
21]. In order to maintain the same conversion efficiency, pulsed pumps with a high peak power were employed to make up the enlarged beam diameter and/or reduced nonlinear coefficient. Despite their excellent performance in ranging and imaging, the discrete behavior of such UPDs can hardly be used in aerosol monitoring, where signal continuity is highly required for both temporal and spatial domains.
A possible solution to efficient and constant upconversion with a large FOV is to introduce the free-space intracavity SFG configuration, where the gain and nonlinear crystals, producing the pump and SFG, respectively, share the same optical cavity. The cavity is highly reflective at the pump wavelength, which can achieve high intracavity pump power for an efficient SFG, even with a moderate external pump power for the gain crystal. Meanwhile, the beam size on the crystals can also be optimized with different cavity designs to obtain a better match with the receiving FOV. Since its advent, the free-space intracavity UPDs have been successfully applied to the measurements of atmospheric CO
2 and CH
4 with either hard target reflection or atmospheric backscattering [
22,
23,
24]. Nevertheless, studies on continuous aerosol monitoring by this method are still absent. Reports on the long-term performance of an intracavity UPD-based atmospheric lidar are also inadequate.
Herein, we report, to the best of our knowledge, the first eye-safe aerosol and cloud lidar based on a free-space intracavity UPD. A home-made erbium-doped fiber laser (EDFL) delivering linearly polarized pulses at 15 kHz with pulse energies of ~70 μJ and pulse widths of ~7 ns centered at 1550 nm was utilized as the light source. The divergence angle of the laser was reduced to ~0.4 mrad by a beam expander and its echoes were collected by a self-assembled Keplerian telescope with a FOV of ~1 mrad in a paraxial configuration. The received photons were recorded by a free-space intracavity UPD and registered with different timestamps by a time-to-digital converter (TDC) for distance-resolved measurement. Reflected signals peaked at ~6.8 km from a hard target were measured with a distance resolution of 0.6 m for an integral duration of 10 s. Atmospheric back-scattered signals, with a range of ~6 km, were also detectable for longer integral durations. The evolution of aerosols and clouds were recorded by this lidar in a preliminary experiment with a continuous measuring time of over 18 h. Clear boundary and fine structures of clouds from approximately 2.5 to 6 km with high signal-to-noise ratio (SNR) were identified, indicating its capability for long-term meteorology observation and aerosol detection.
2. Theory and Simulation of the Intracavity Upconversion
As the most crucial part of the UPD, the intracavity upconversion process, dominating the PDE, acceptance angle, and optical aperture of the detector, was investigated first. The upconversion process is also known as SFG, where a received signal photon is combined with one of the pump photons to produce an upconverted photon with the shortest wavelength in a phase matched nonlinear crystal. Usually, the pump power is orders of magnitude higher than the input signal, and the minimal signal energy in a certain detection window can be as low as few photons. Therefore, the SFG efficiency can be easily estimated in the small-signal assumption outlined by V. G. Dmitriev et al. [
25].
where
represents the SFG efficiency.
and
are the optical power and reflective index of the interacting wave with wavelength
. The subscripts
s,
p, and
u denote the signal, pump, and up-converted light in the SFG process.
and
L are the effective nonlinear coefficient and the length of the nonlinear crystal, respectively.
c is the speed of light.
is the vacuum permittivity.
A is the effective overlap cross section between the pump laser and the incoming signal in the crystal.
is the phase mismatch of the SFG process.
In order to get efficient SFG, PPLN is usually adopted as the nonlinear crystal for its large
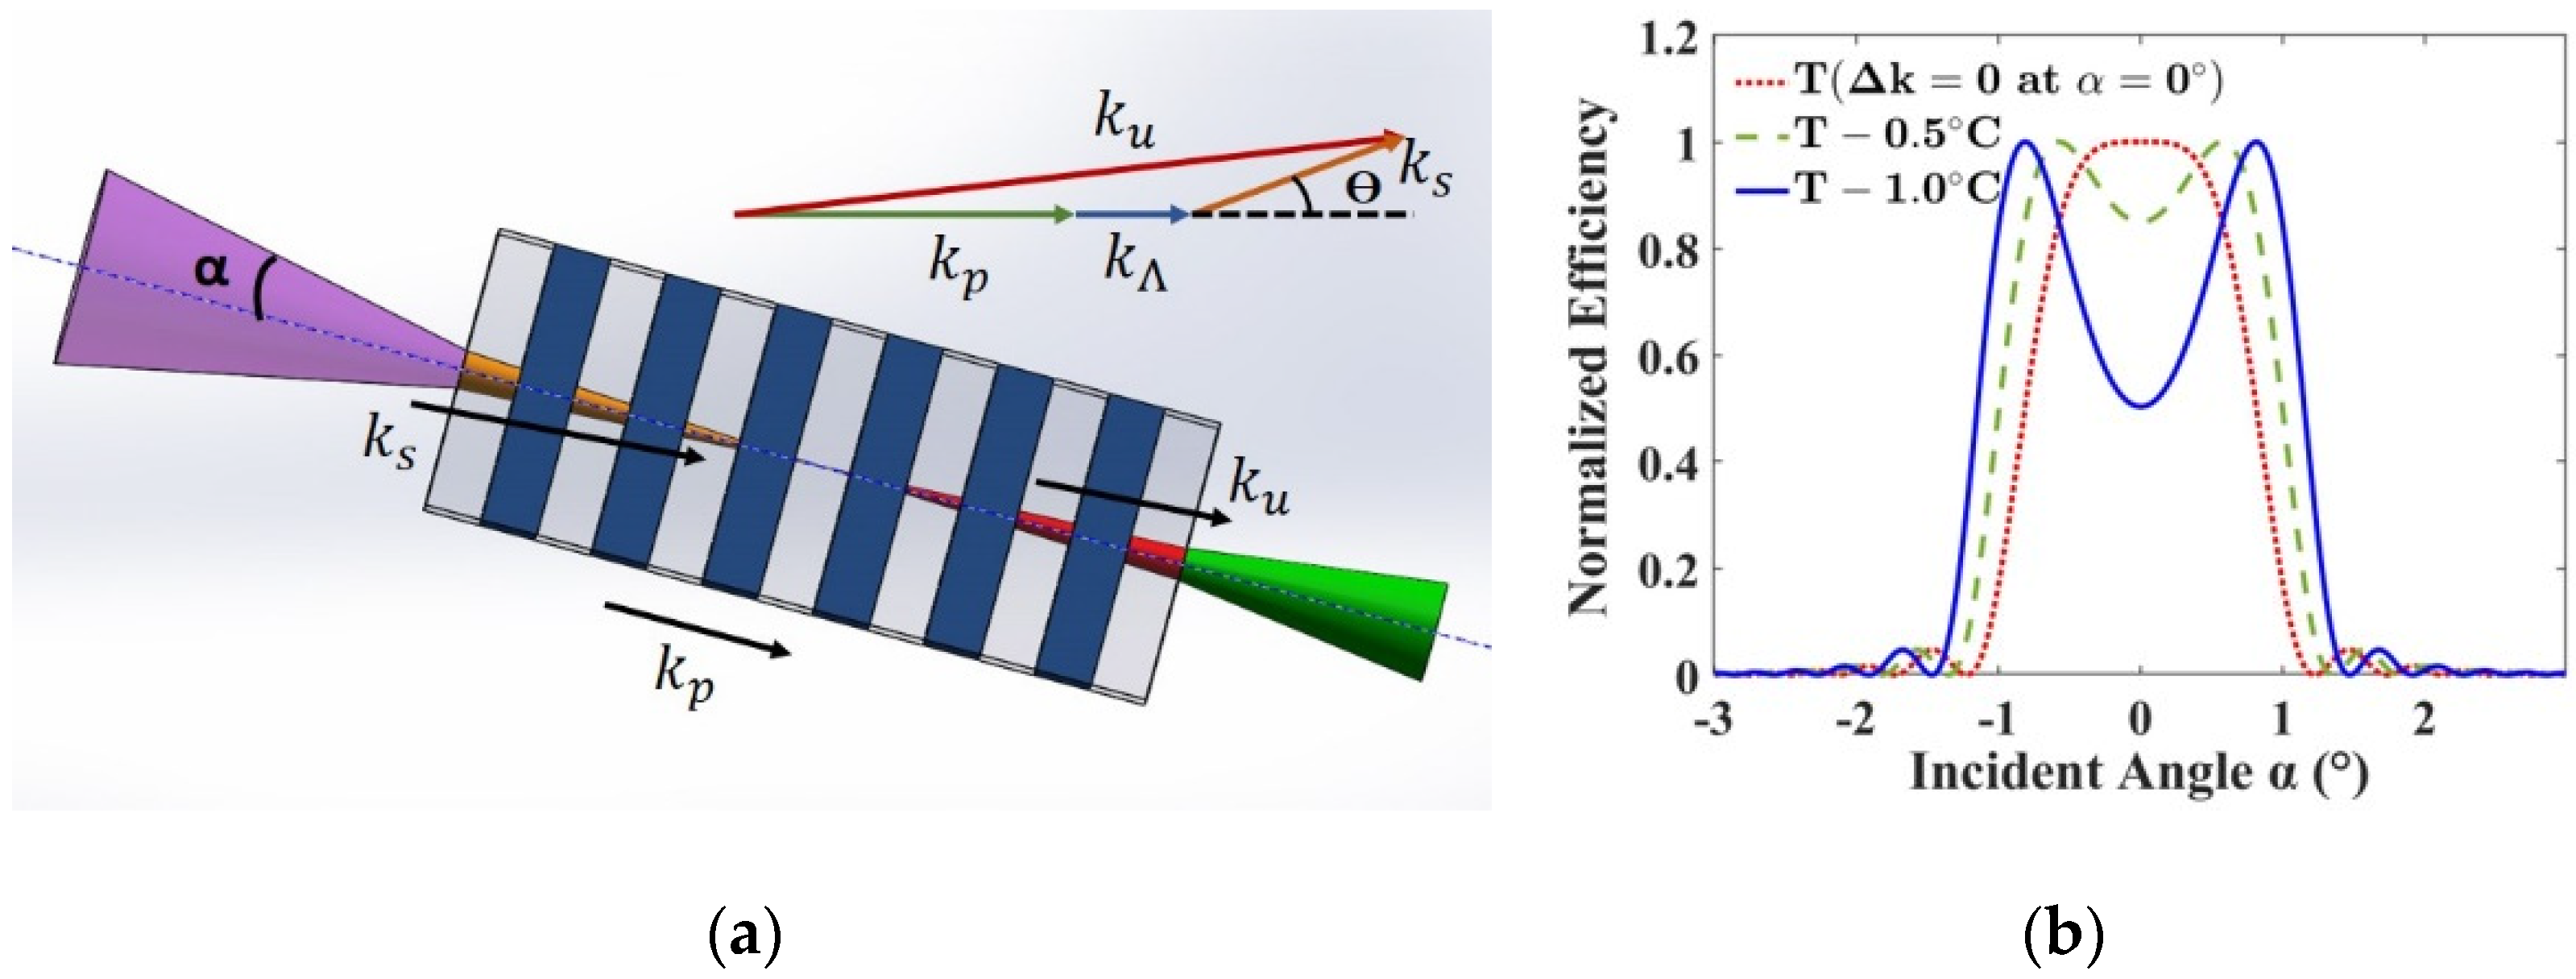
, long interactive length, and flexible phase matching capabilities across its full transparency range through structure engineering. In the actual case of UPD, the received photons are usually incident onto the PPLN crystal with different incident angles, as was depicted in
Figure 1a. Therefore, the phase mismatch can be calculated by the noncollinear interaction condition, as follows:
where
is the poling period of the PPLN crystal,
is the value of propagation constant for the optical wave with wavelength
, and
θ is the angle between the propagating direction of the pump and signal in the crystal, which can be easily translated to the incident angle by the Snell’s law,
Figure 1b compares the normalized efficiencies with respect to the incident angles of the signal photons in three different cases calculated with Equations (1)–(3). The pump, signal, and upconverted wavelengths were set to be 1064 nm, 1550 nm, and 631 nm, respectively, in the calculation. A PPLN crystal with a poling period of 11.73 μm and length of 25 mm was selected from off-the-shelf products of HC Photonics. Normally, a perfect phase matching condition (
) for the chief ray (
), i.e., the collinear phase matching condition, is set as the working point of the noncollinear upconversion through temperature tuning [
22]. However, a slight temperature detuning would result in better efficiencies for the marginal rays. The acceptance angle could be enlarged from 1.6° to 2.3° with a temperature decrease of 1 °C according to our simulation. As a consequence, the actual operation temperature of the PPLN crystal may be finely optimized around its collinear phase matching point during experiment for a better overall PDE of the UPD.
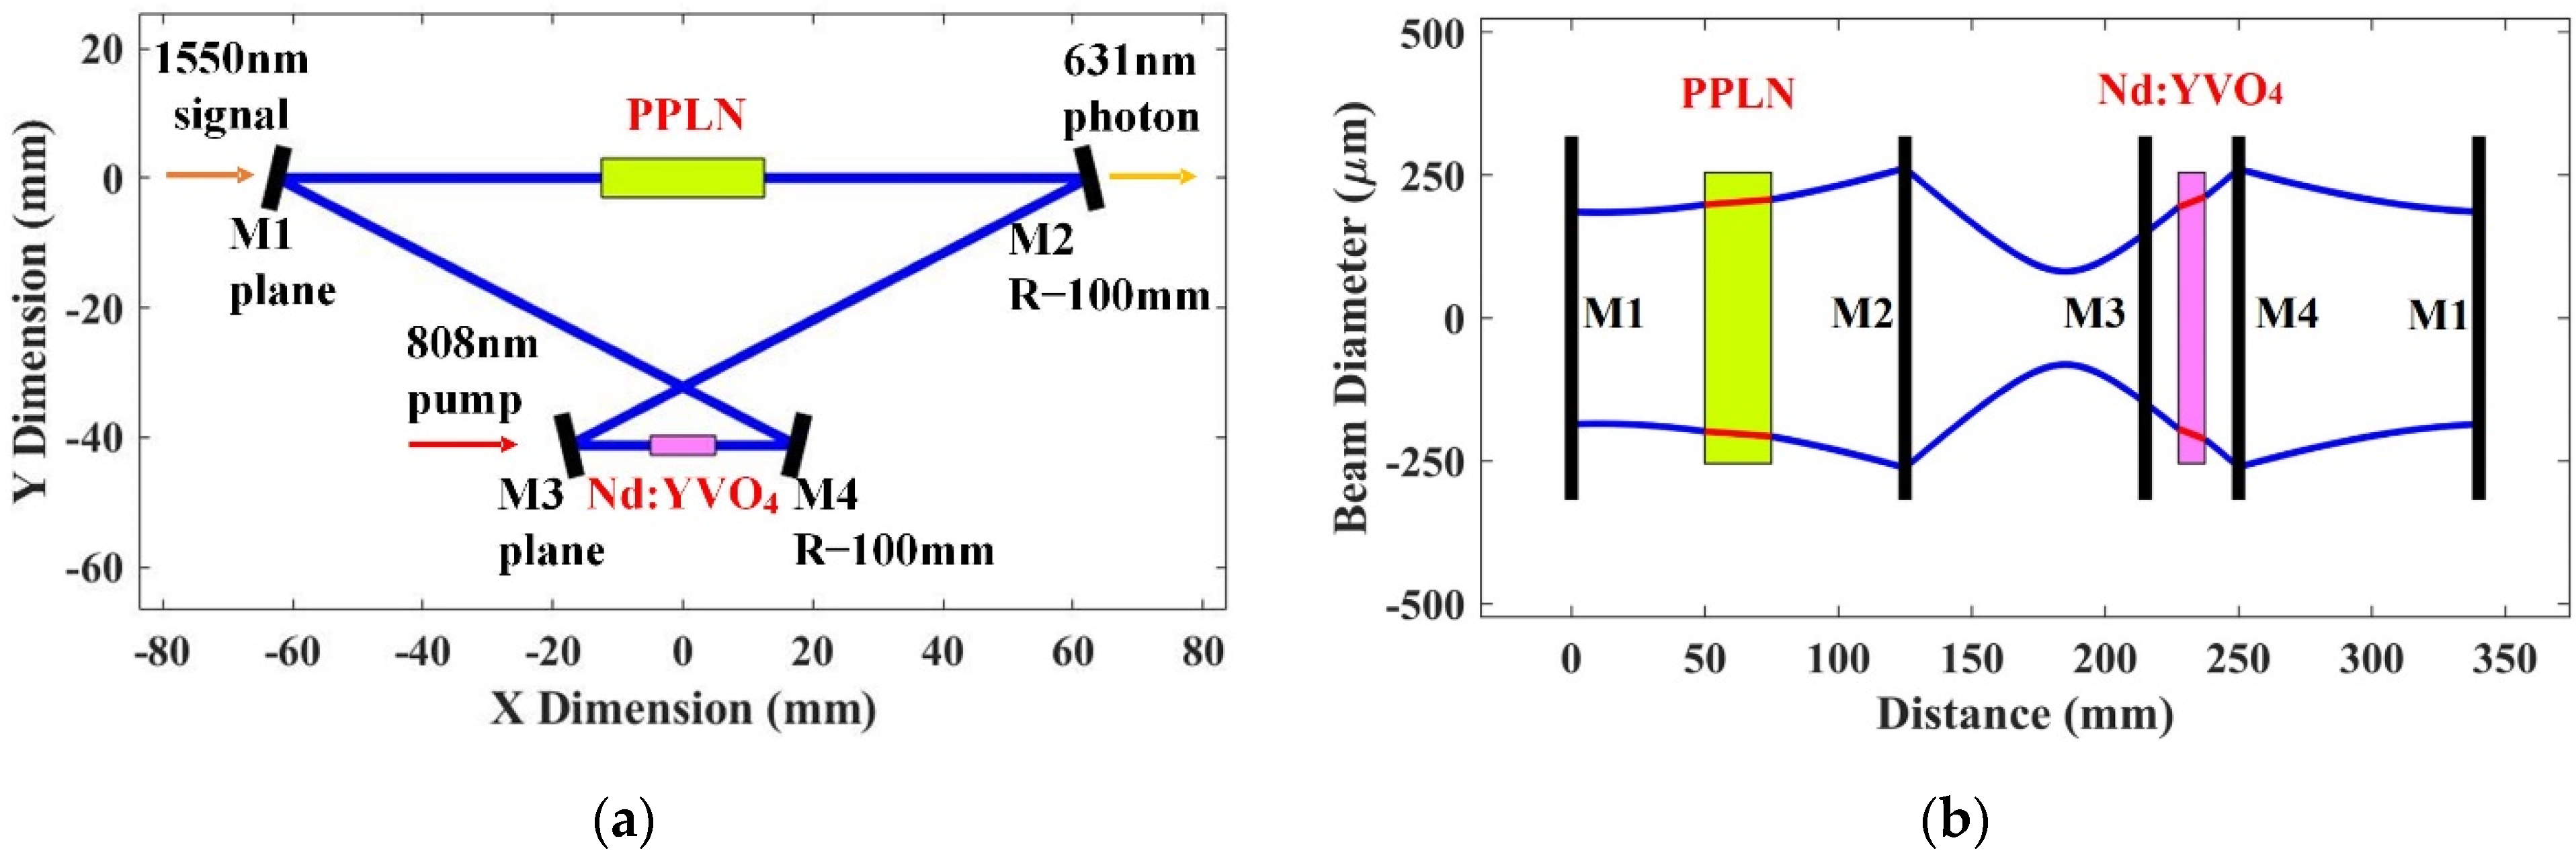
Apart from the PPLN crystal, the resonant cavity, or the dominating the optical aperture, also plays an important role in a UPD. A four-mirror bowtie-structured cavity was adopted in our design, providing two degrees of freedom (the position and radius of curvature) for each mirror. The design was carried out by matrix optics until the final layout of the cavity was obtained, as was demonstrated in
Figure 2a. The evolution of fundamental MFD of the oscillating pump wave in the cavity was depicted in
Figure 2b. The input mirrors for the signal (M1) and external pump of the Nd:YVO
4 crystal (M3) are plane so as not to induce undesired focal power. The radius of curvature for the other two mirrors were −100 mm, which was used to provide stable oscillating condition for the resonator. The beam sizes for both crystals were ~400 μm, matching the aperture of the received signal at 1550 nm and the waist diameter of the external pump at 808 nm, respectively.
3. Instrumental Description
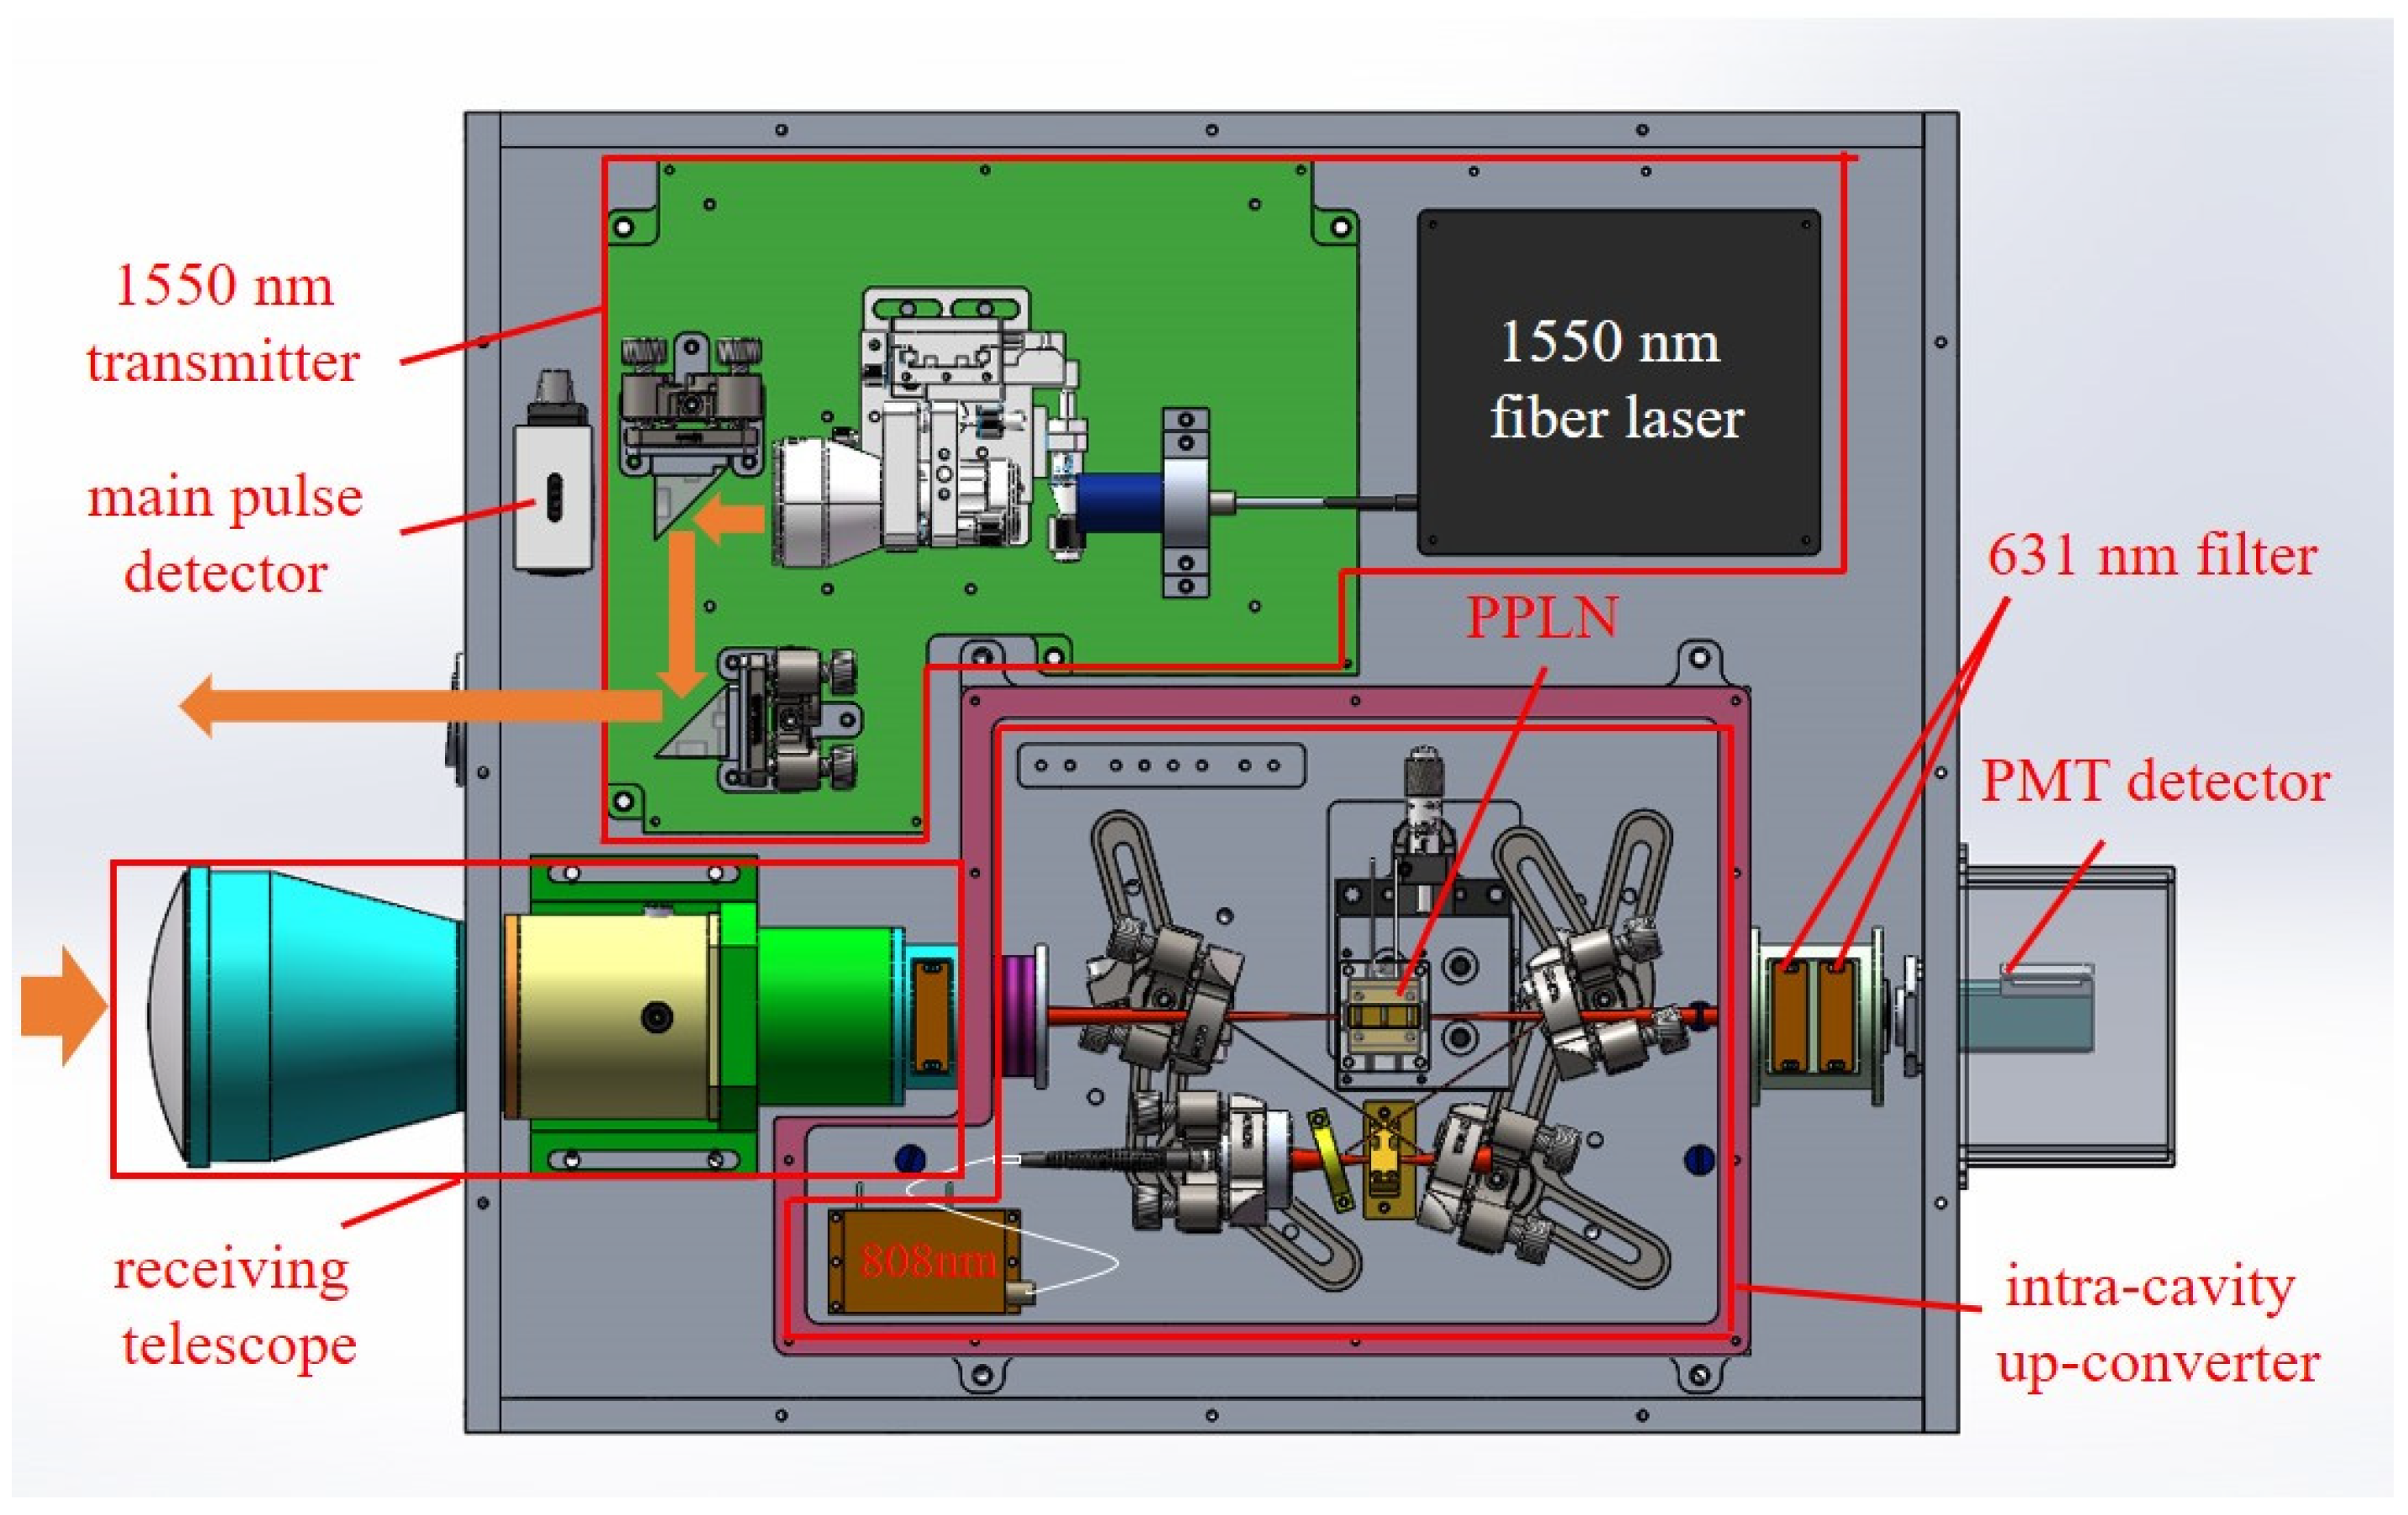
After the preliminary assumption on the free-space intracavity UPD, the eye-safe aerosol and cloud lidars were built accordingly. The lidar system was mainly comprised of a 1550 nm transmitter, a receiving telescope, the intracavity upconverter, and two detectors, as were shown in
Figure 3. A home-made linearly polarized EDFL with a configuration similar to that in a previous report [
10] was utilized as the laser source for the lidar. The repetition rate, pulse width, and pulse energy of the laser were 15 kHz, 7 ns, and ~70 μJ, respectively. In order to further reduce the laser divergence angle for long distance detection, an 8× beam expander was inserted after the output collimator of the EDFL. The laser direction could be finely adjusted with the help of two silver mirrors after the beam expander. An InGaAs photodetector was placed behind the first mirror to record the leaked laser pulse as the starting timestamp for time-of-flight (TOF) measurement. The laser beam diameter at the exit of the instrument was ~10 mm, corresponding to the energy density of 90 μJ/cm
2, which is much smaller than the eye-safety threshold of 1 J/cm
2 at 1550 nm. However, due to the high repetition rate, the accumulated pulse energy still exceeds the MPE at the near field for 10 s [
26]. This value dropped dramatically with distance because of the beam divergence and became eye safe for distances longer than 65 m. The backscattered photons were collected by a self-assembled Keplerian telescope comprising two aspheric lenses with focal lengths of 200 mm and 50 mm, respectively. A field stop with a diameter of 200 μm was inserted at the intermediate focal plane to block the detrimental background photons beyond the receiving FOV of ~1 mrad. A band-pass filter with a bandwidth of 12 nm centered at 1550 nm was inserted after the telescope to further block the background photons in the spectral domain. The spatial and spectral filtered signal photons were then focused on to the middle of PPLN crystal in the UPD cavity. For the upconversion detector, the receiving bandwidth is dominated by the phase-matching condition of the PPLN crystal, serving as a narrow band-pass filter with a bandwidth of ~0.5 nm. The broadband filter in front of the UPD is only utilized to filter out the visible light around 630 nm, and its bandwidth is not a crucial parameter.
The intracavity UPD was built in a bowtie configuration, comprising a Nd:YVO
4 crystal, a PPLN crystal, and four mirrors, according to the simulation in
Section 2. A fiber pigtailed laser diode (LD) with the maximal output power of ~35 W at 808 nm was utilized as the external pump of the Nd:YVO
4 crystal. The external pump power was delivered through a multimode beam delivery fiber with core diameter and numerical aperture of 105 μm and 0.22, respectively. Its output power was collimated by a plano-convex lens with a focal length of 10 mm and then reimaged on to the Nd:YVO
4 crystal with another plano-convex lens with focal length of 37.5 mm, forming a pump beam diameter of ~400 μm. The Nd:YVO
4 crystal (a-cut, 0.4 at.%) was 10 mm in length ensuring >98% pump absorption at 808 nm. The four mirrors were all highly reflective (>99%) at 1064 nm and highly transmissive (>98%) at 630 nm, 808 nm, and 1550 nm bands. An off-the-shelf PPLN crystal (HC Photonics) with a length of 25 mm was employed as the nonlinear crystal. The PPLN crystal possessed five channels with poling periods ranging from 11.25 μm to 12.45 μm, in which a channel with period of 11.73 μm was selected for the UPD. The PPLN was mounted on a copper clamp, which was temperature stabilized by a commercial controller (Thorlabs, TC200) with a precision of 0.1 °C. The copper clamp was enclosed in a heat-isolated house to significantly reduce the temperature influence from ambient air flow. The working temperature was coarsely determined in a preliminary experiment, where another fiber laser at 1550 nm was directly coupled into the UPD cavity. After the final alignment of the lidar, this value was finely adjusted for the maximal photon counts from the receiving echoes.
Two identical band-pass filters with a bandwidth of 37 nm were placed after the UPD cavity. Each filter possessed a least suppression ratio of 60 dB within the whole spectral responsible range of the succeeding PMT (H10721-20, Hamamatsu), resulting in a total suppression ratio of over 120 dB. The quantum efficiency of the PMT was ~15% peaked at ~630 nm, coincident with the wavelength of the up-converted photons. The photon-sensitive diameter of the PMT was ~8 mm, which was also advantageous to optical alignment.
A customized TDC system was utilized to record the timestamps of the main pulses and the upconverted photon events, from which the distance can be calculated by simple TOF algorithm. The minimal temporal resolution of the system was 64 ps and this value could be reduced by a factor of 2N, where N is an integer number. In our experiments, the original temporal resolution was set to be 4.096 ns, corresponding to a distance resolution of ~0.6 m. Photon events at adjacent bins can also be merged to improve the SNR at the cost of slightly poorer distance resolution in post data processing.
4. System Alignment, Calibration, Testing
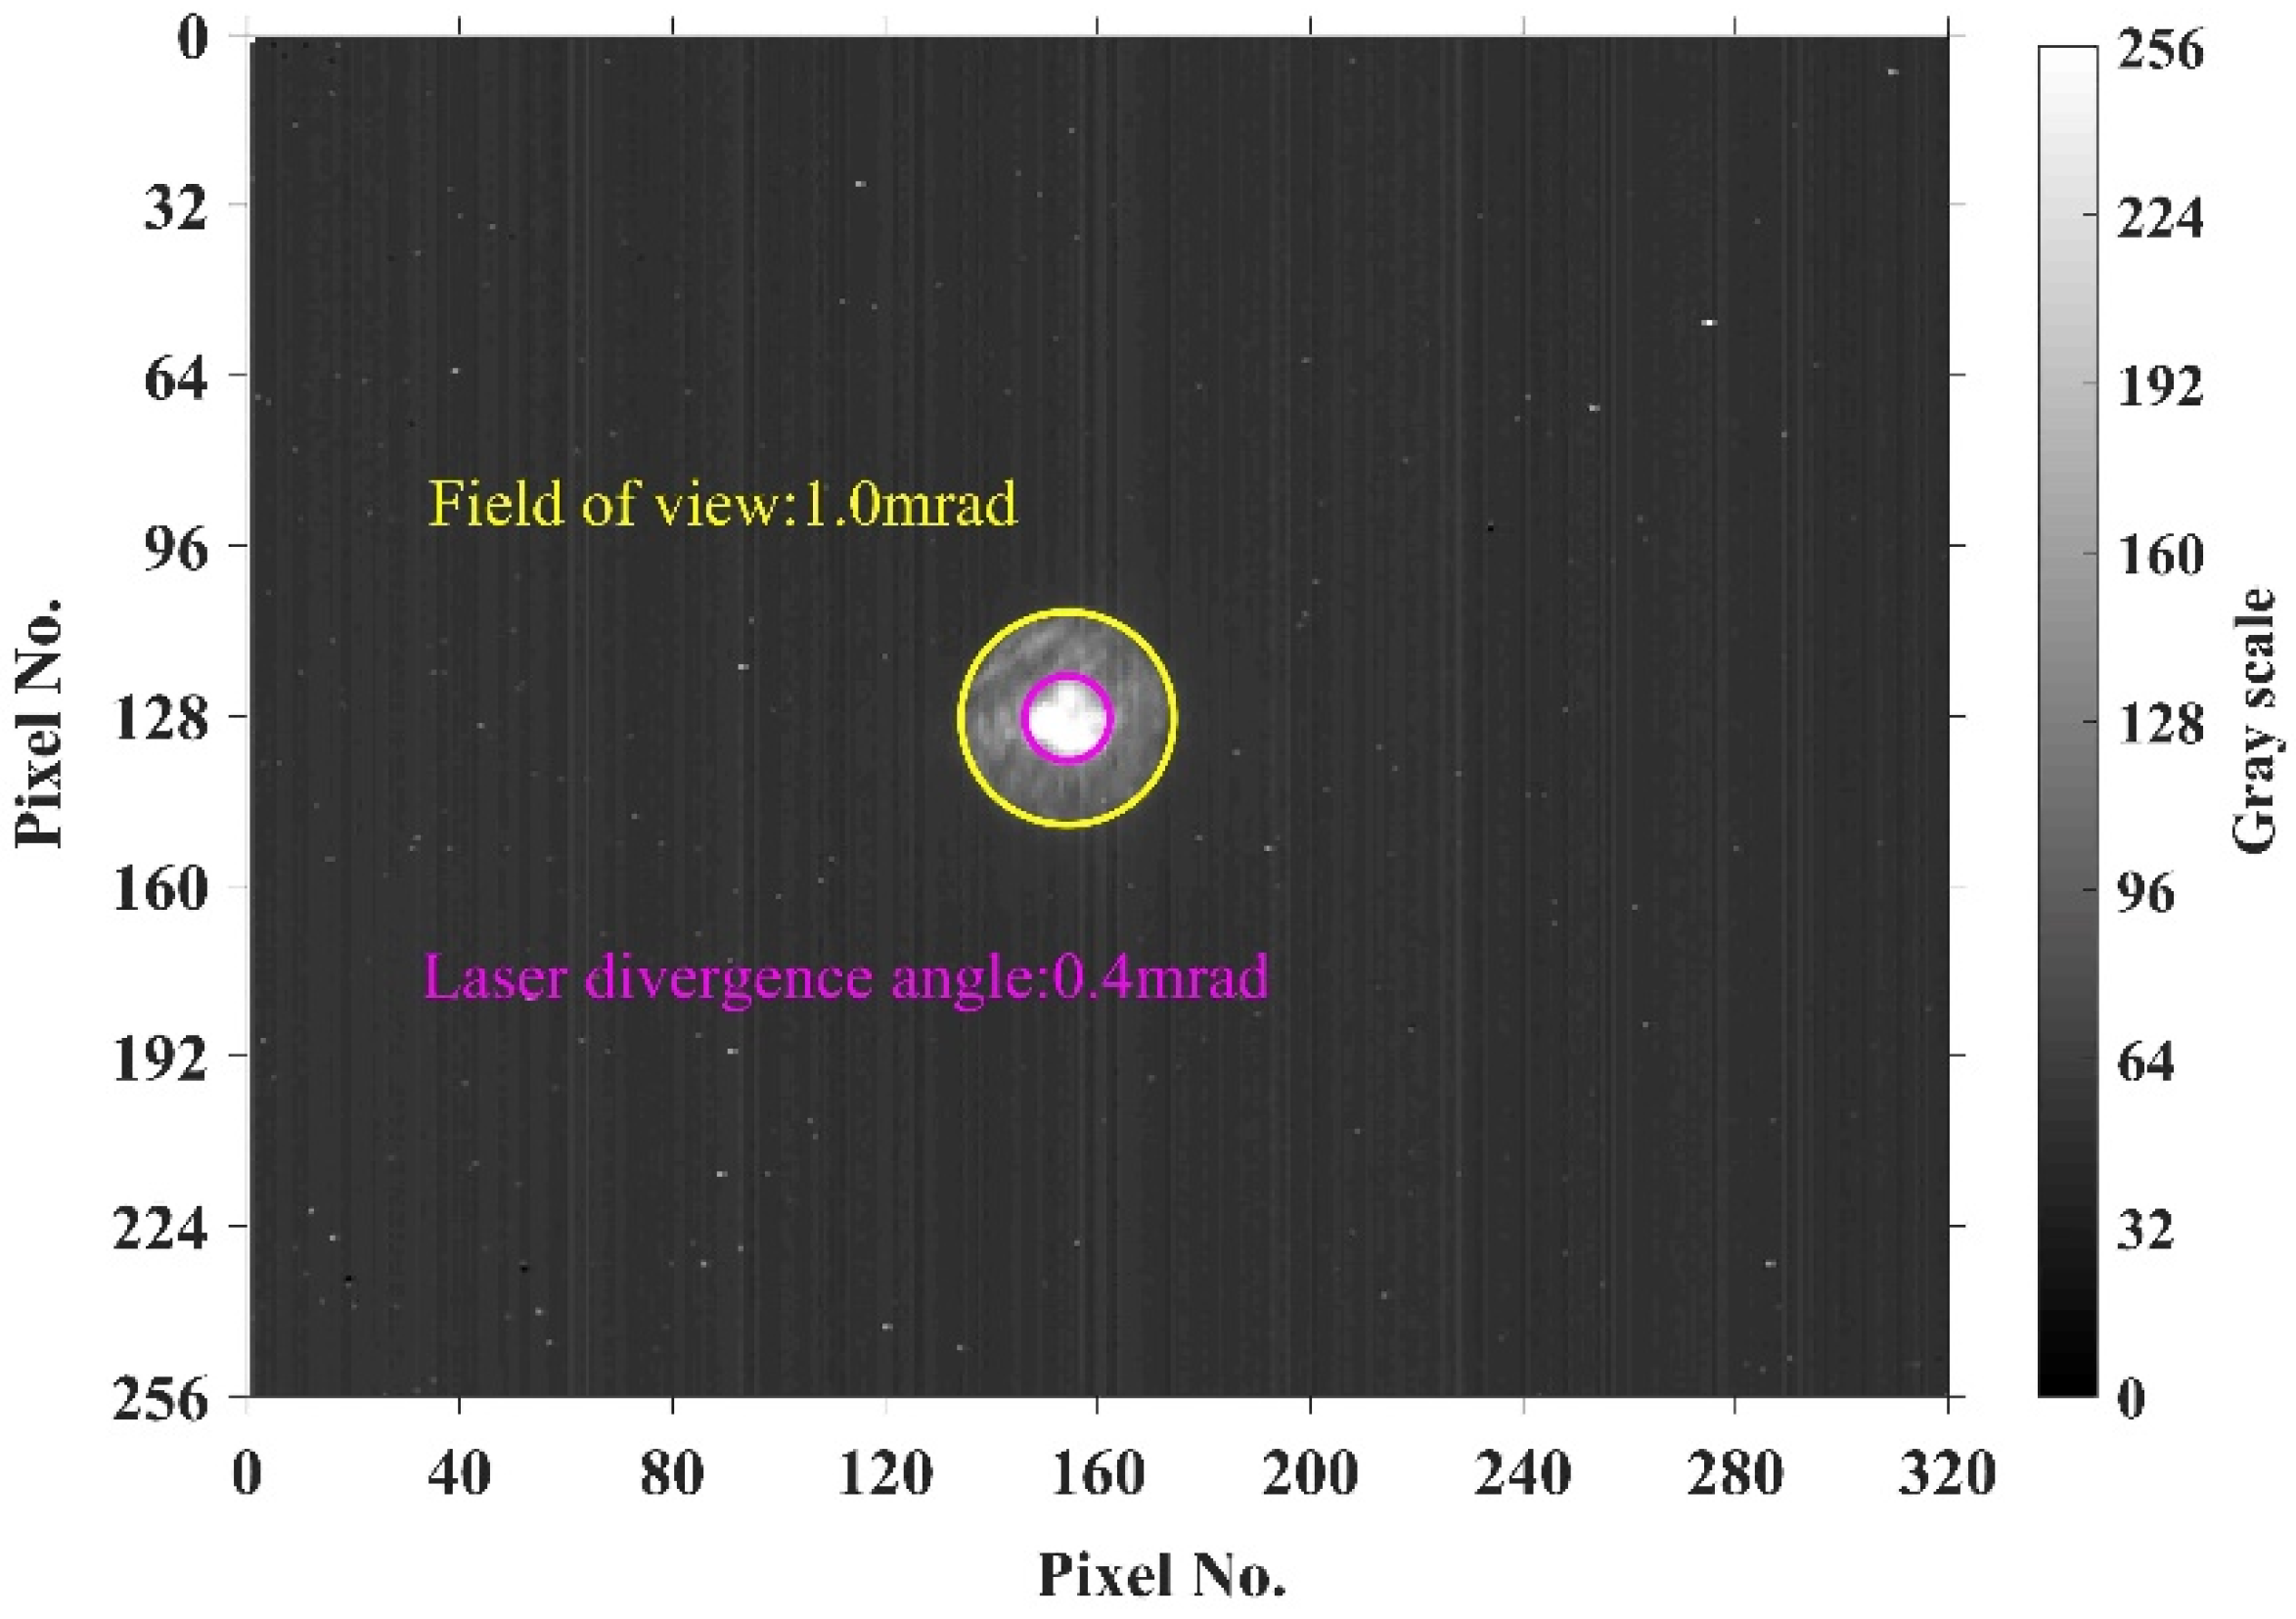
Before actual aerosol and cloud measurements, the optical axes of the transmitter and receiver were aligned under the help of a Newtonian telescope with a focal length of 1.2 m. An InGaAs-based infrared camera with pixel size of 30 μm and scale of 320 × 256 was placed at the focal plane of the telescope to measure the pointing positions and divergence angles of the transmitter and receiver. During alignment, the lidar was placed on a three-dimensional translating stage in front of the telescope and the field stop of its receiver was illuminated by another laser source at 1550 nm from the back direction. This counter-propagated light was collimated by the lidar receiver and then focused on the infrared camera, forming a bright circle. This circle, indicating the pointing direction at the far field, was set as the basis for axes alignment. The silver mirrors, adjusting the pointing direction of the transmitted laser beam, were then finely tuned until the attenuated laser was also focused on the infrared camera with the same center of gravity. In this scenario, the axes of the transmitter and receiver were aligned with the same direction.
The captured diameters of the receiver (yellow circle) and transmitter (pink circle) were 1200 μm and 480 μm, as were shown in
Figure 4, corresponding to a FOV of 1 mrad and a divergence angle of 0.4 mrad, respectively. In other words, the FOV of the receiver was 2.5 times larger than the divergence angle of the transmitter, making it insensitive to misalignment and still sufficient enough to block the detrimental background photons in the spatial domain.
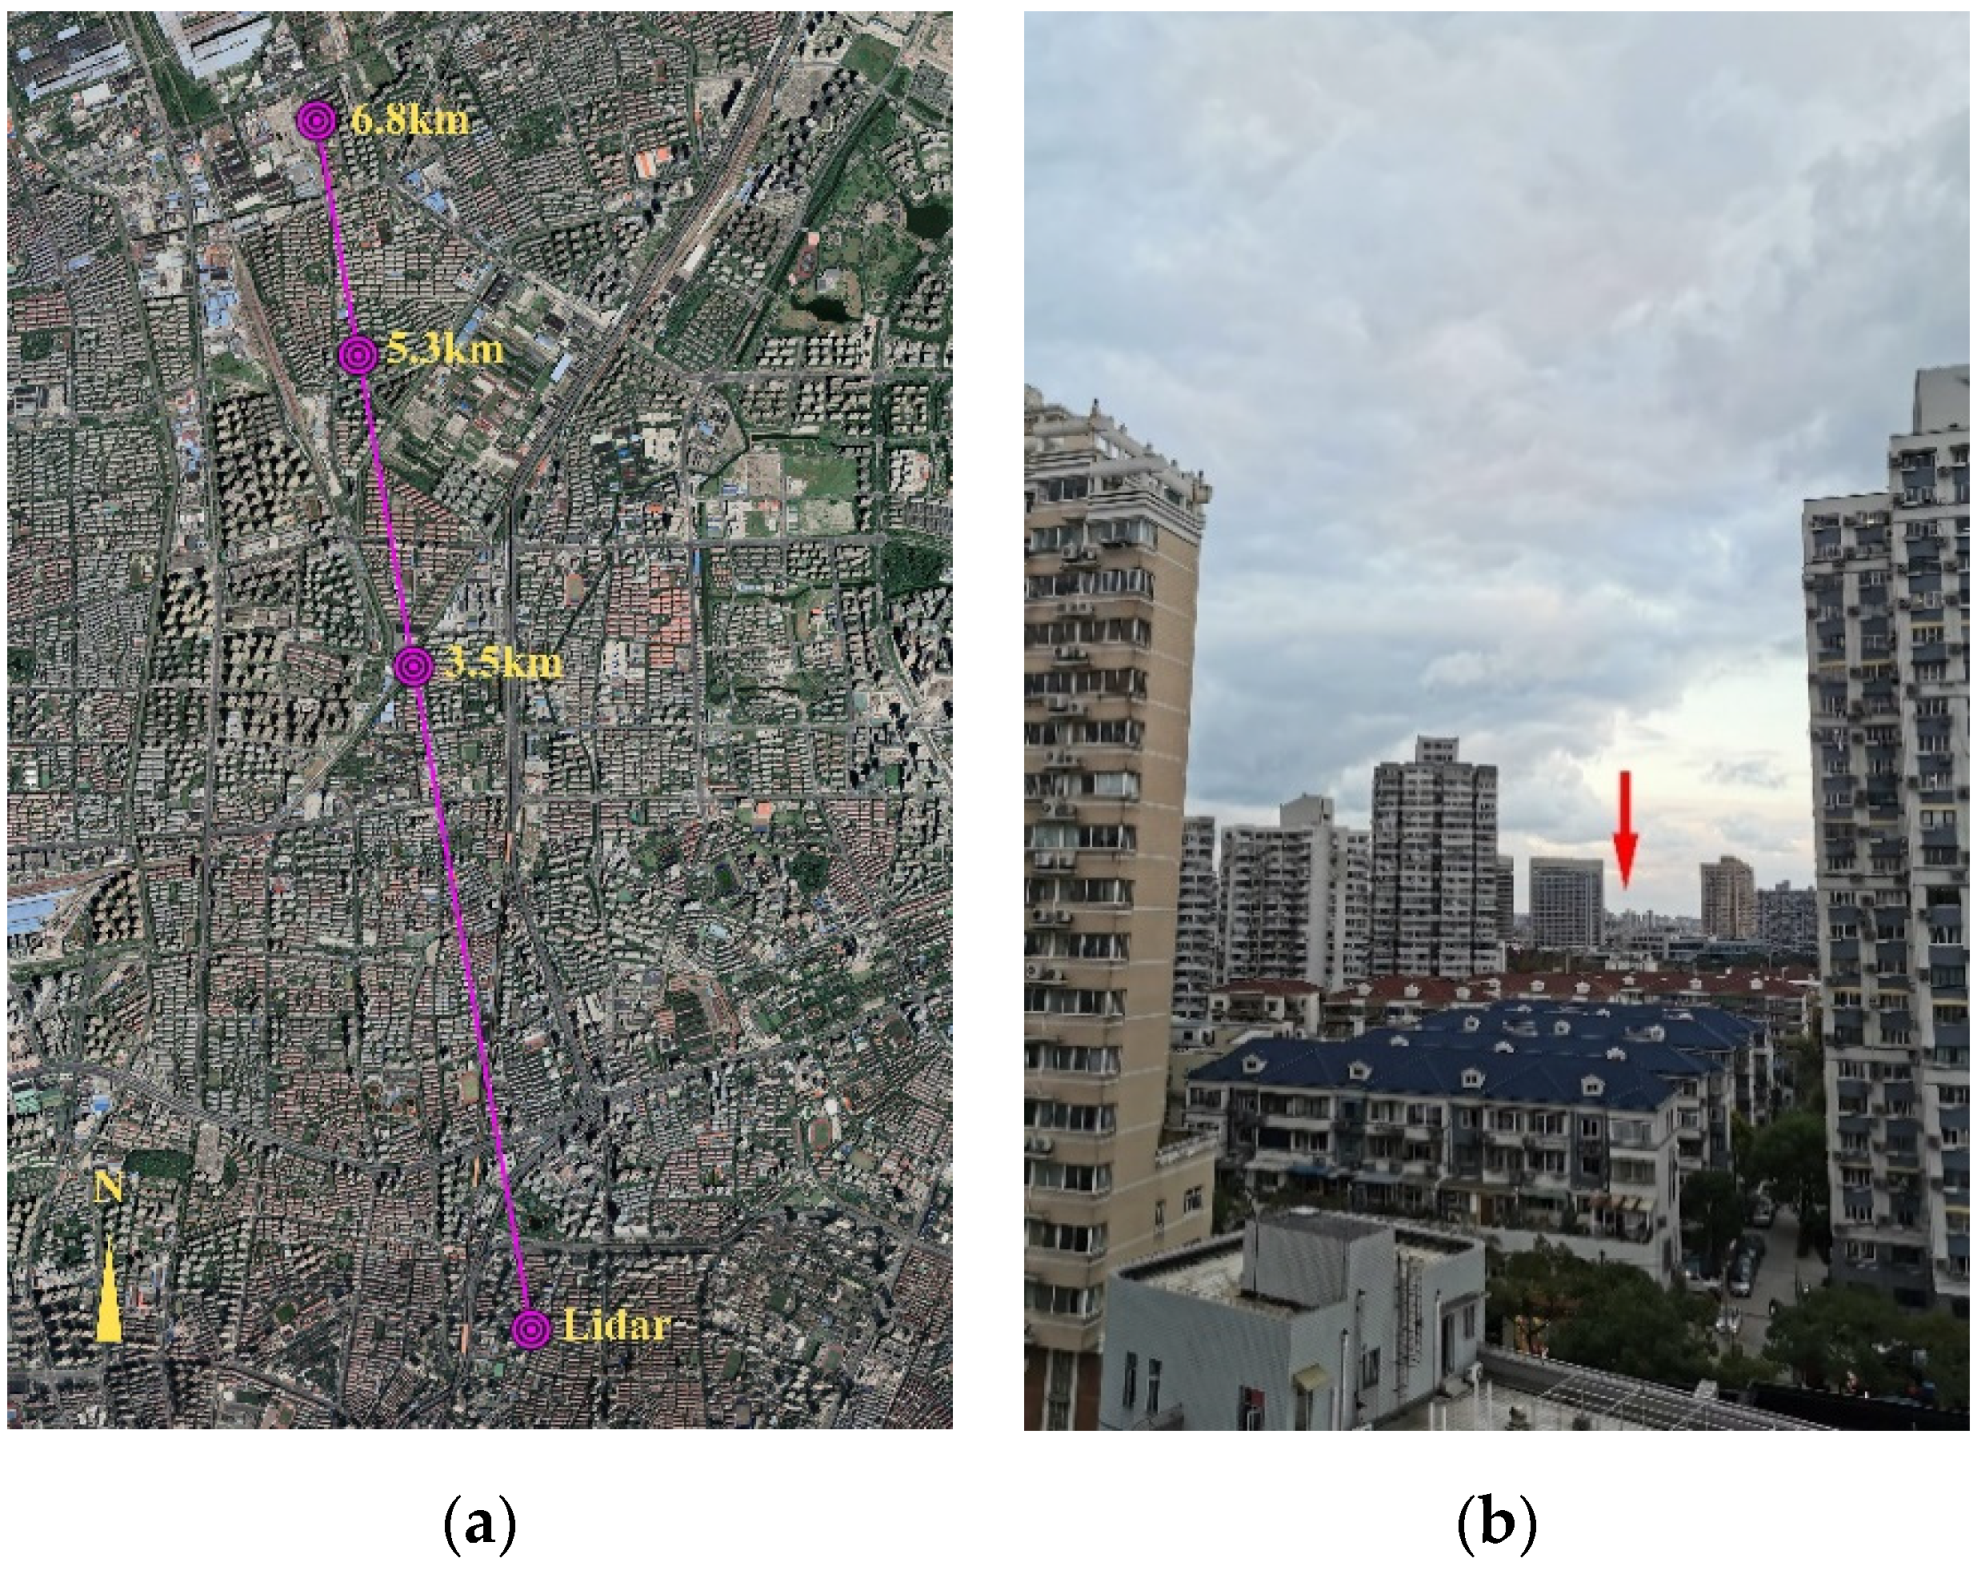
After the optical axes alignment, the performance of the UPD was tested with hard targets. In this test, the lidar was finely adjusted to a special path from the window of our laboratory, in which the transmitted laser can simultaneously illuminated the edges of several buildings with different distances. This special path on Google Earth and the targets captured from our laboratory were demonstrated in
Figure 5a,b respectively.
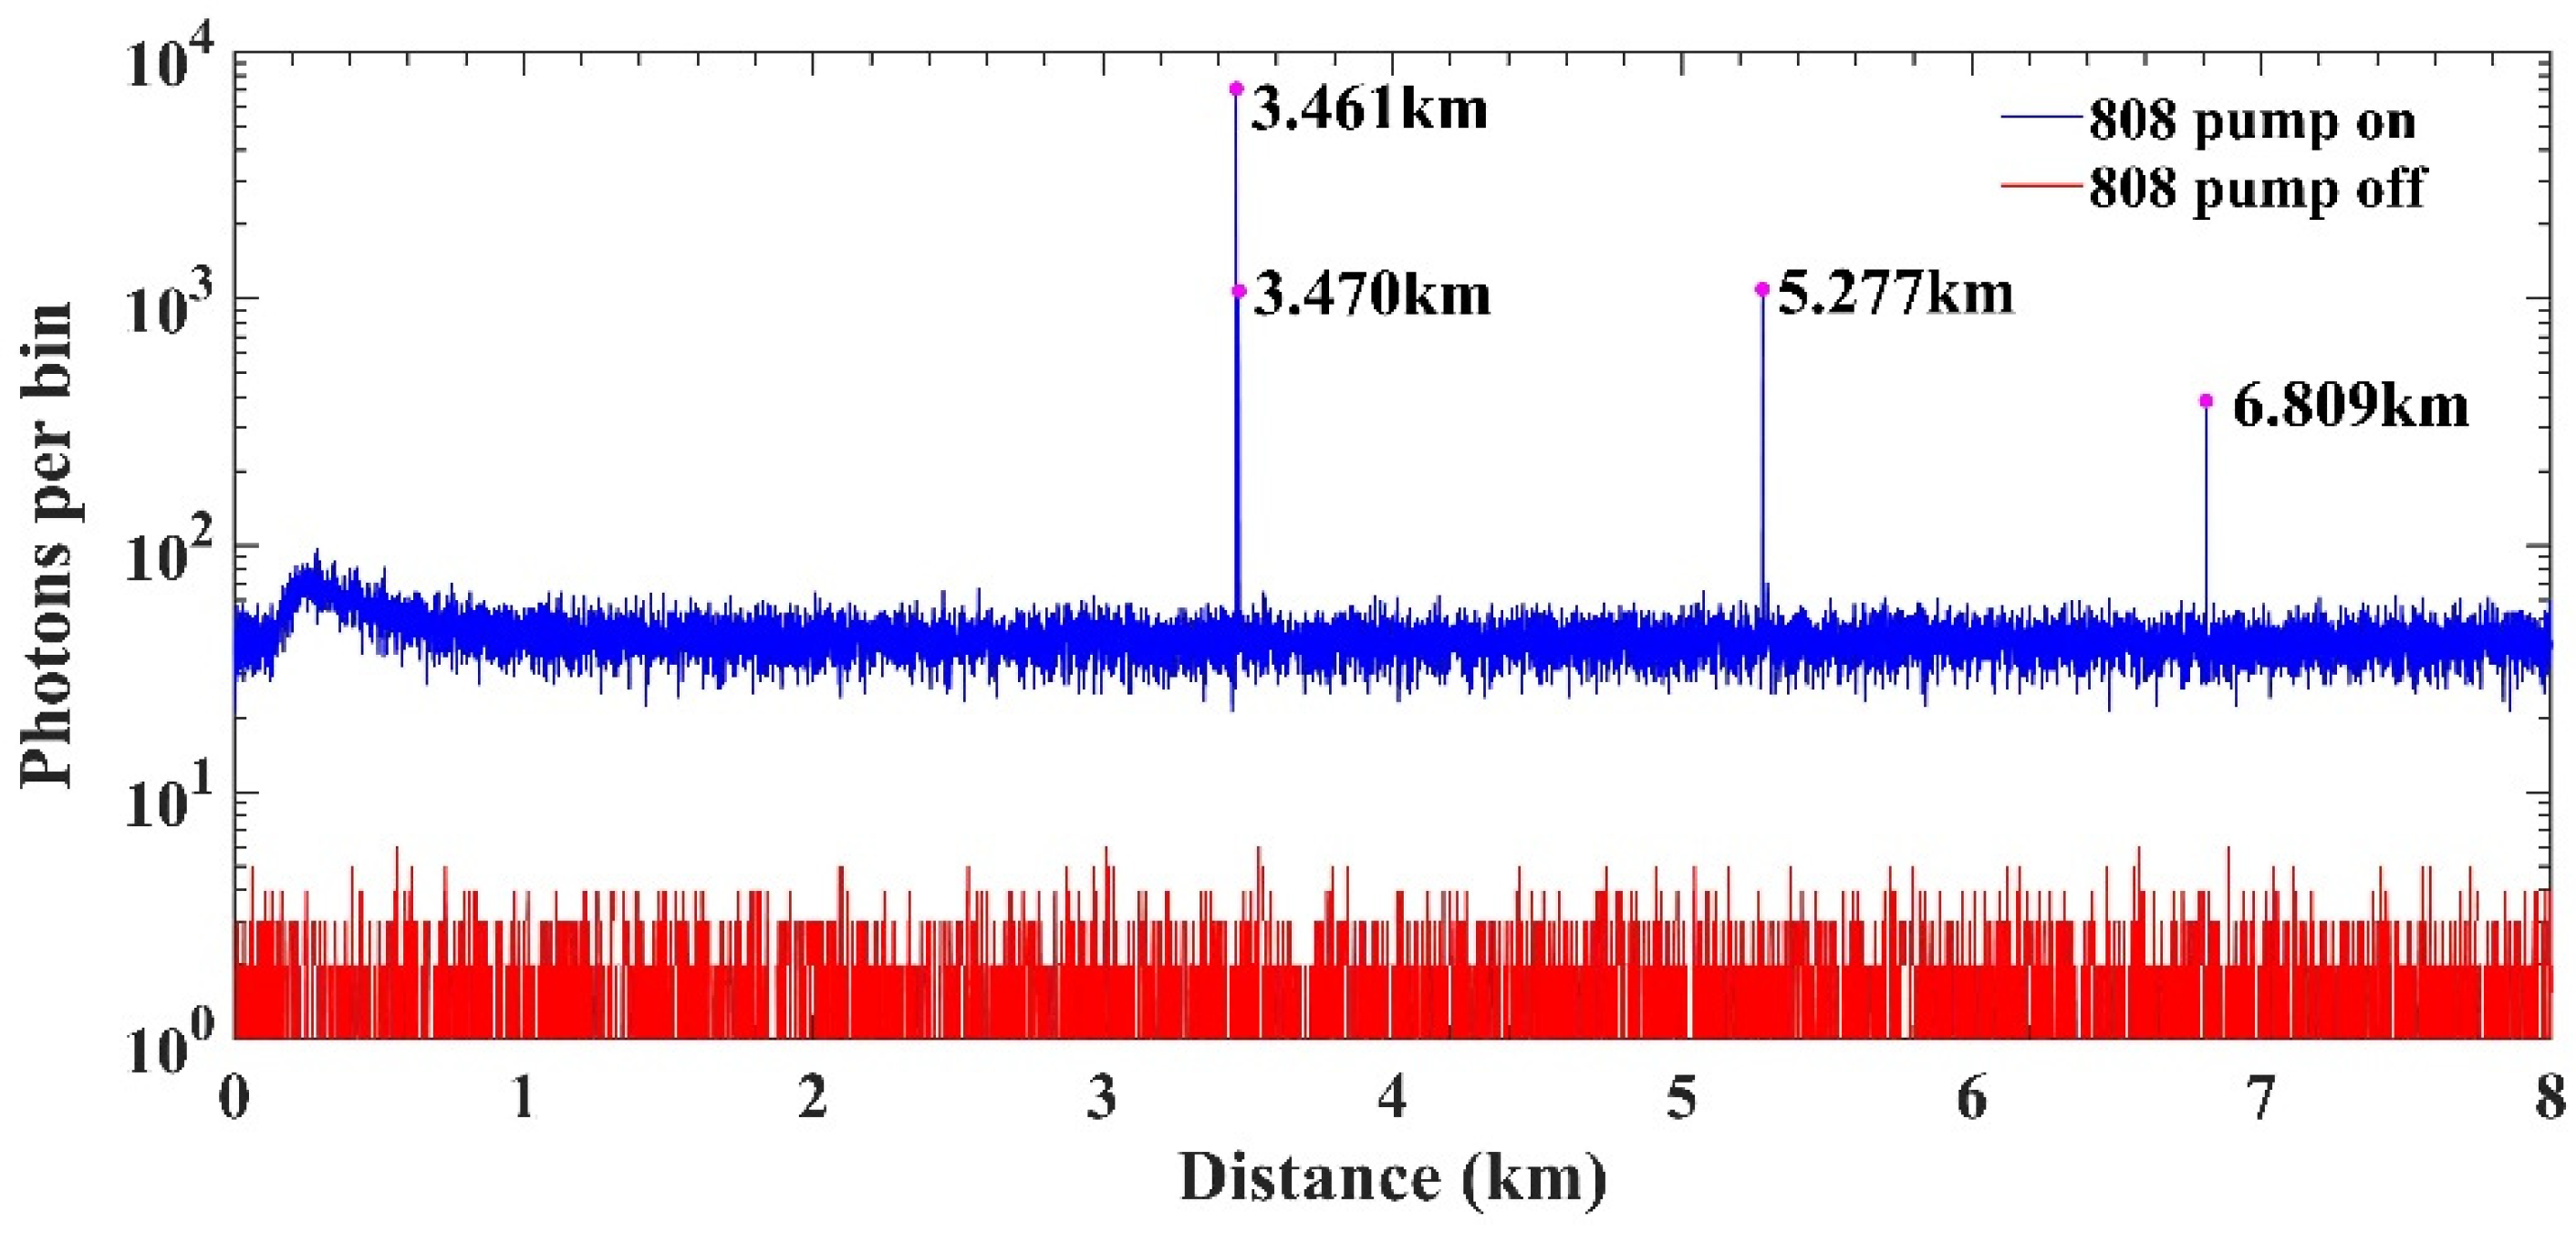
Figure 6 shows the accumulated photon events with an integral time of 10 s at an external 808 nm pump power of 13 W for the intracavity UPD. The photon histogram acquired without the external 808 nm pump was also compared in the same figure for noise evaluation. Clearly, the background noise kept at a low level from the original dark count of visible detector when the external pump was turned off. These noise floor grow dramatically by more than one order of magnitude when the external 808 nm pump was increased to 13 W. We attribute this to the excited-state absorption (ESA) and energy transfer upconversion (ETU) of the Nd:YVO
4 crystal, especially at high pump power [
27]. Although higher external pump power would result in a higher photon counting rate for the targets, the noise floor would also raise due to severer ESA and ETU effect. As a result, the SNR could not be improved with external pump power higher than 13 W. An intracavity band-pass filter, blocking the undesired luminescence, may solve the problem. However, we do not have this element in hand. Nevertheless, since the ESA or ETU would only generate stable and continuous photon flow in theory, its impact could be calibrated by a simple background deduction. Strong echo signals from four buildings were detected at distances of 3.461, 3.470, 5.277, and 6.809 km with resolution of 0.6 m, as was shown in
Figure 6. It is also worth mentioning that the nonambiguous distance of the lidar, limited by the repetition rate of 15 kHz, was 10 km, while the nearest detectable distance was limited by the overlap factor of the transmitter and receiver in such a paraxial configuration.
The overlap factor of an atmospheric lidar, defined as proportion of the emitted laser beam overlapping with the cone of the receiving FOV, is distance-dependent and should be measured so as to calibrate the signals in the near-zone. Although normally a lidar possesses larger receiving FOV than transmitting divergence angle, at distances very close to the lidar, even zero overlap factor can occur. This region is also known as the blind-zone, in which no backscattered photons can reach the detector. The overlap factor starts to grow monolithically from a certain distance, where part of the backscattered photons starts to enter the receiving FOV until the maximal overlap factor of 1 is achieved at a farther distance. In order to retrieve the actual intensity of the backscattered signal, the evolution of the overlap factor should be predetermined. A simple method to measure the overlap factor is to analyze the backscattered signals from the atmosphere in horizontal direction, in which the echo signal can be expressed by the following function,
where the constant
C is the system constant. It includes the laser power, receiving aperture area, optical efficiency, and quantum efficiency of the detector.
O(
z) is the overlap factor.
σ and
β are the atmospheric extinction and backscattering coefficients, respectively. Suppose that the atmosphere is uniform at the laser path, e.g., the lidar points horizontally and there are no significant pollution sources in the laser path,
σ and
β can be considered as distance independent. Hence, Equation (4) can be rewritten as
where the constant
C’ is the product of the constant
C and the backscattering coefficient
β. The extinction coefficient
σ and the constant
C’ can be obtained by the least squares fitting from the signals in the far field, where the overlap factor is 1. In this scenario,
becomes the only variable and can be numerically calculated from the near-zone signal.
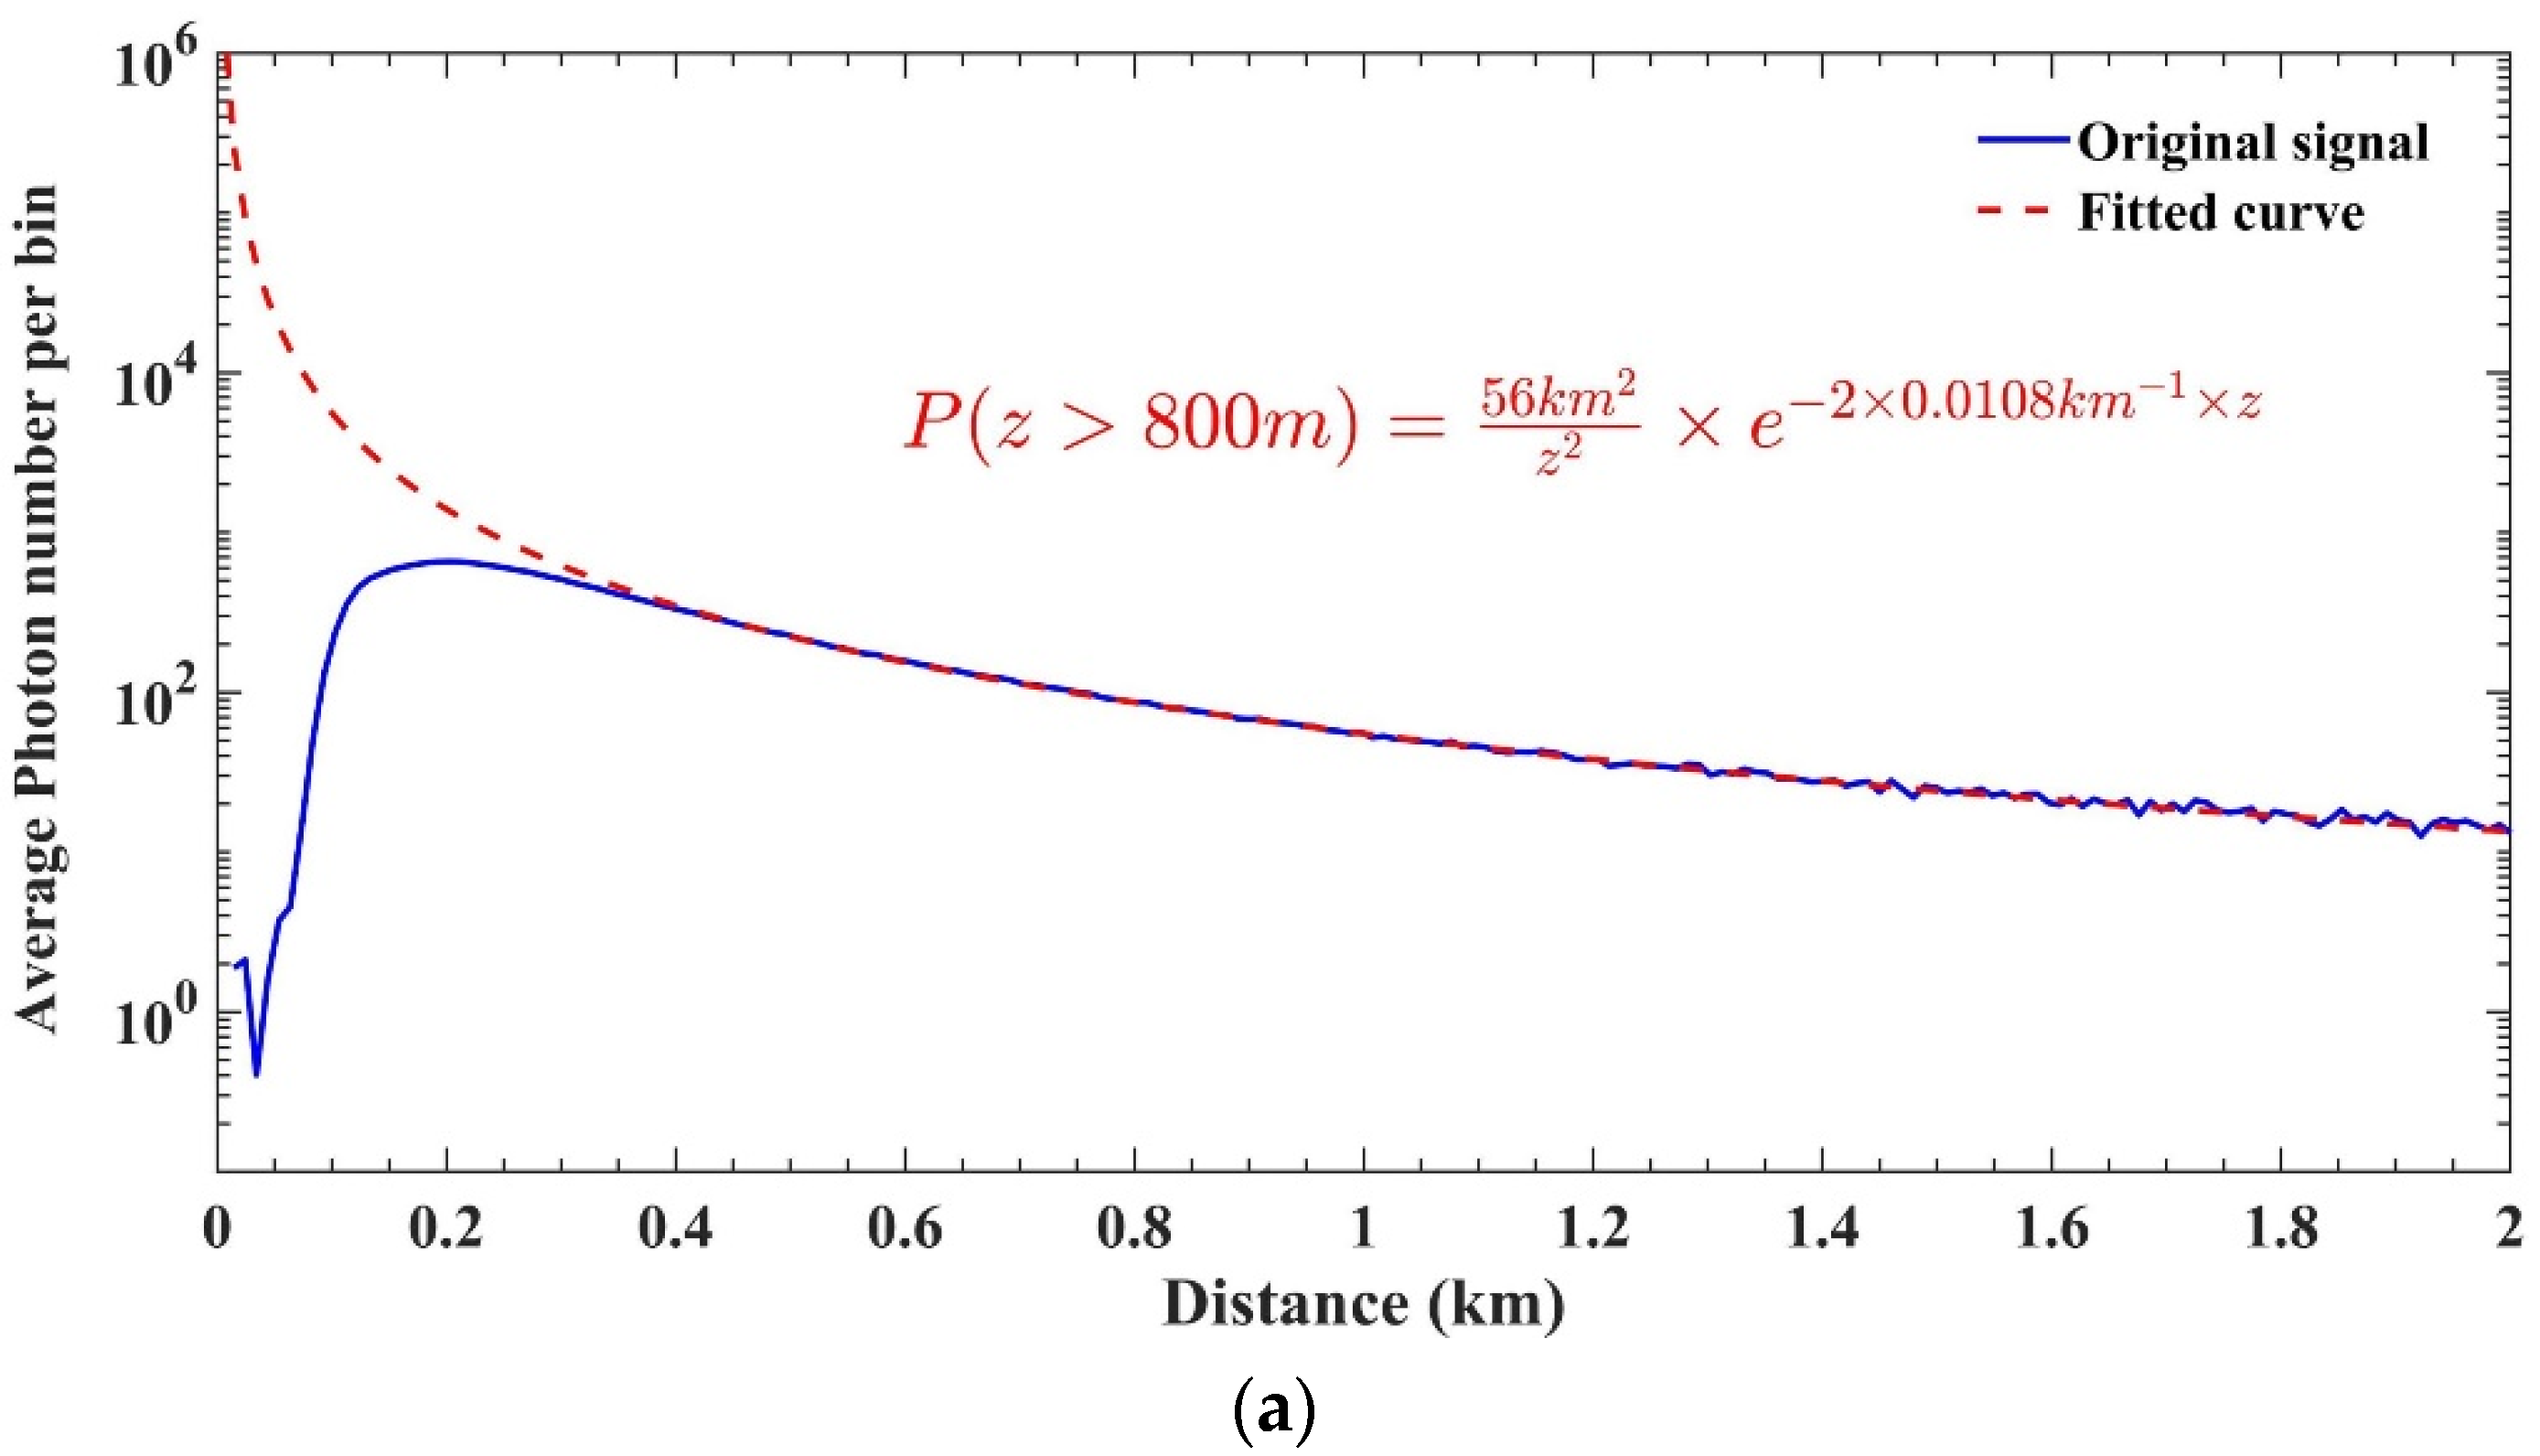
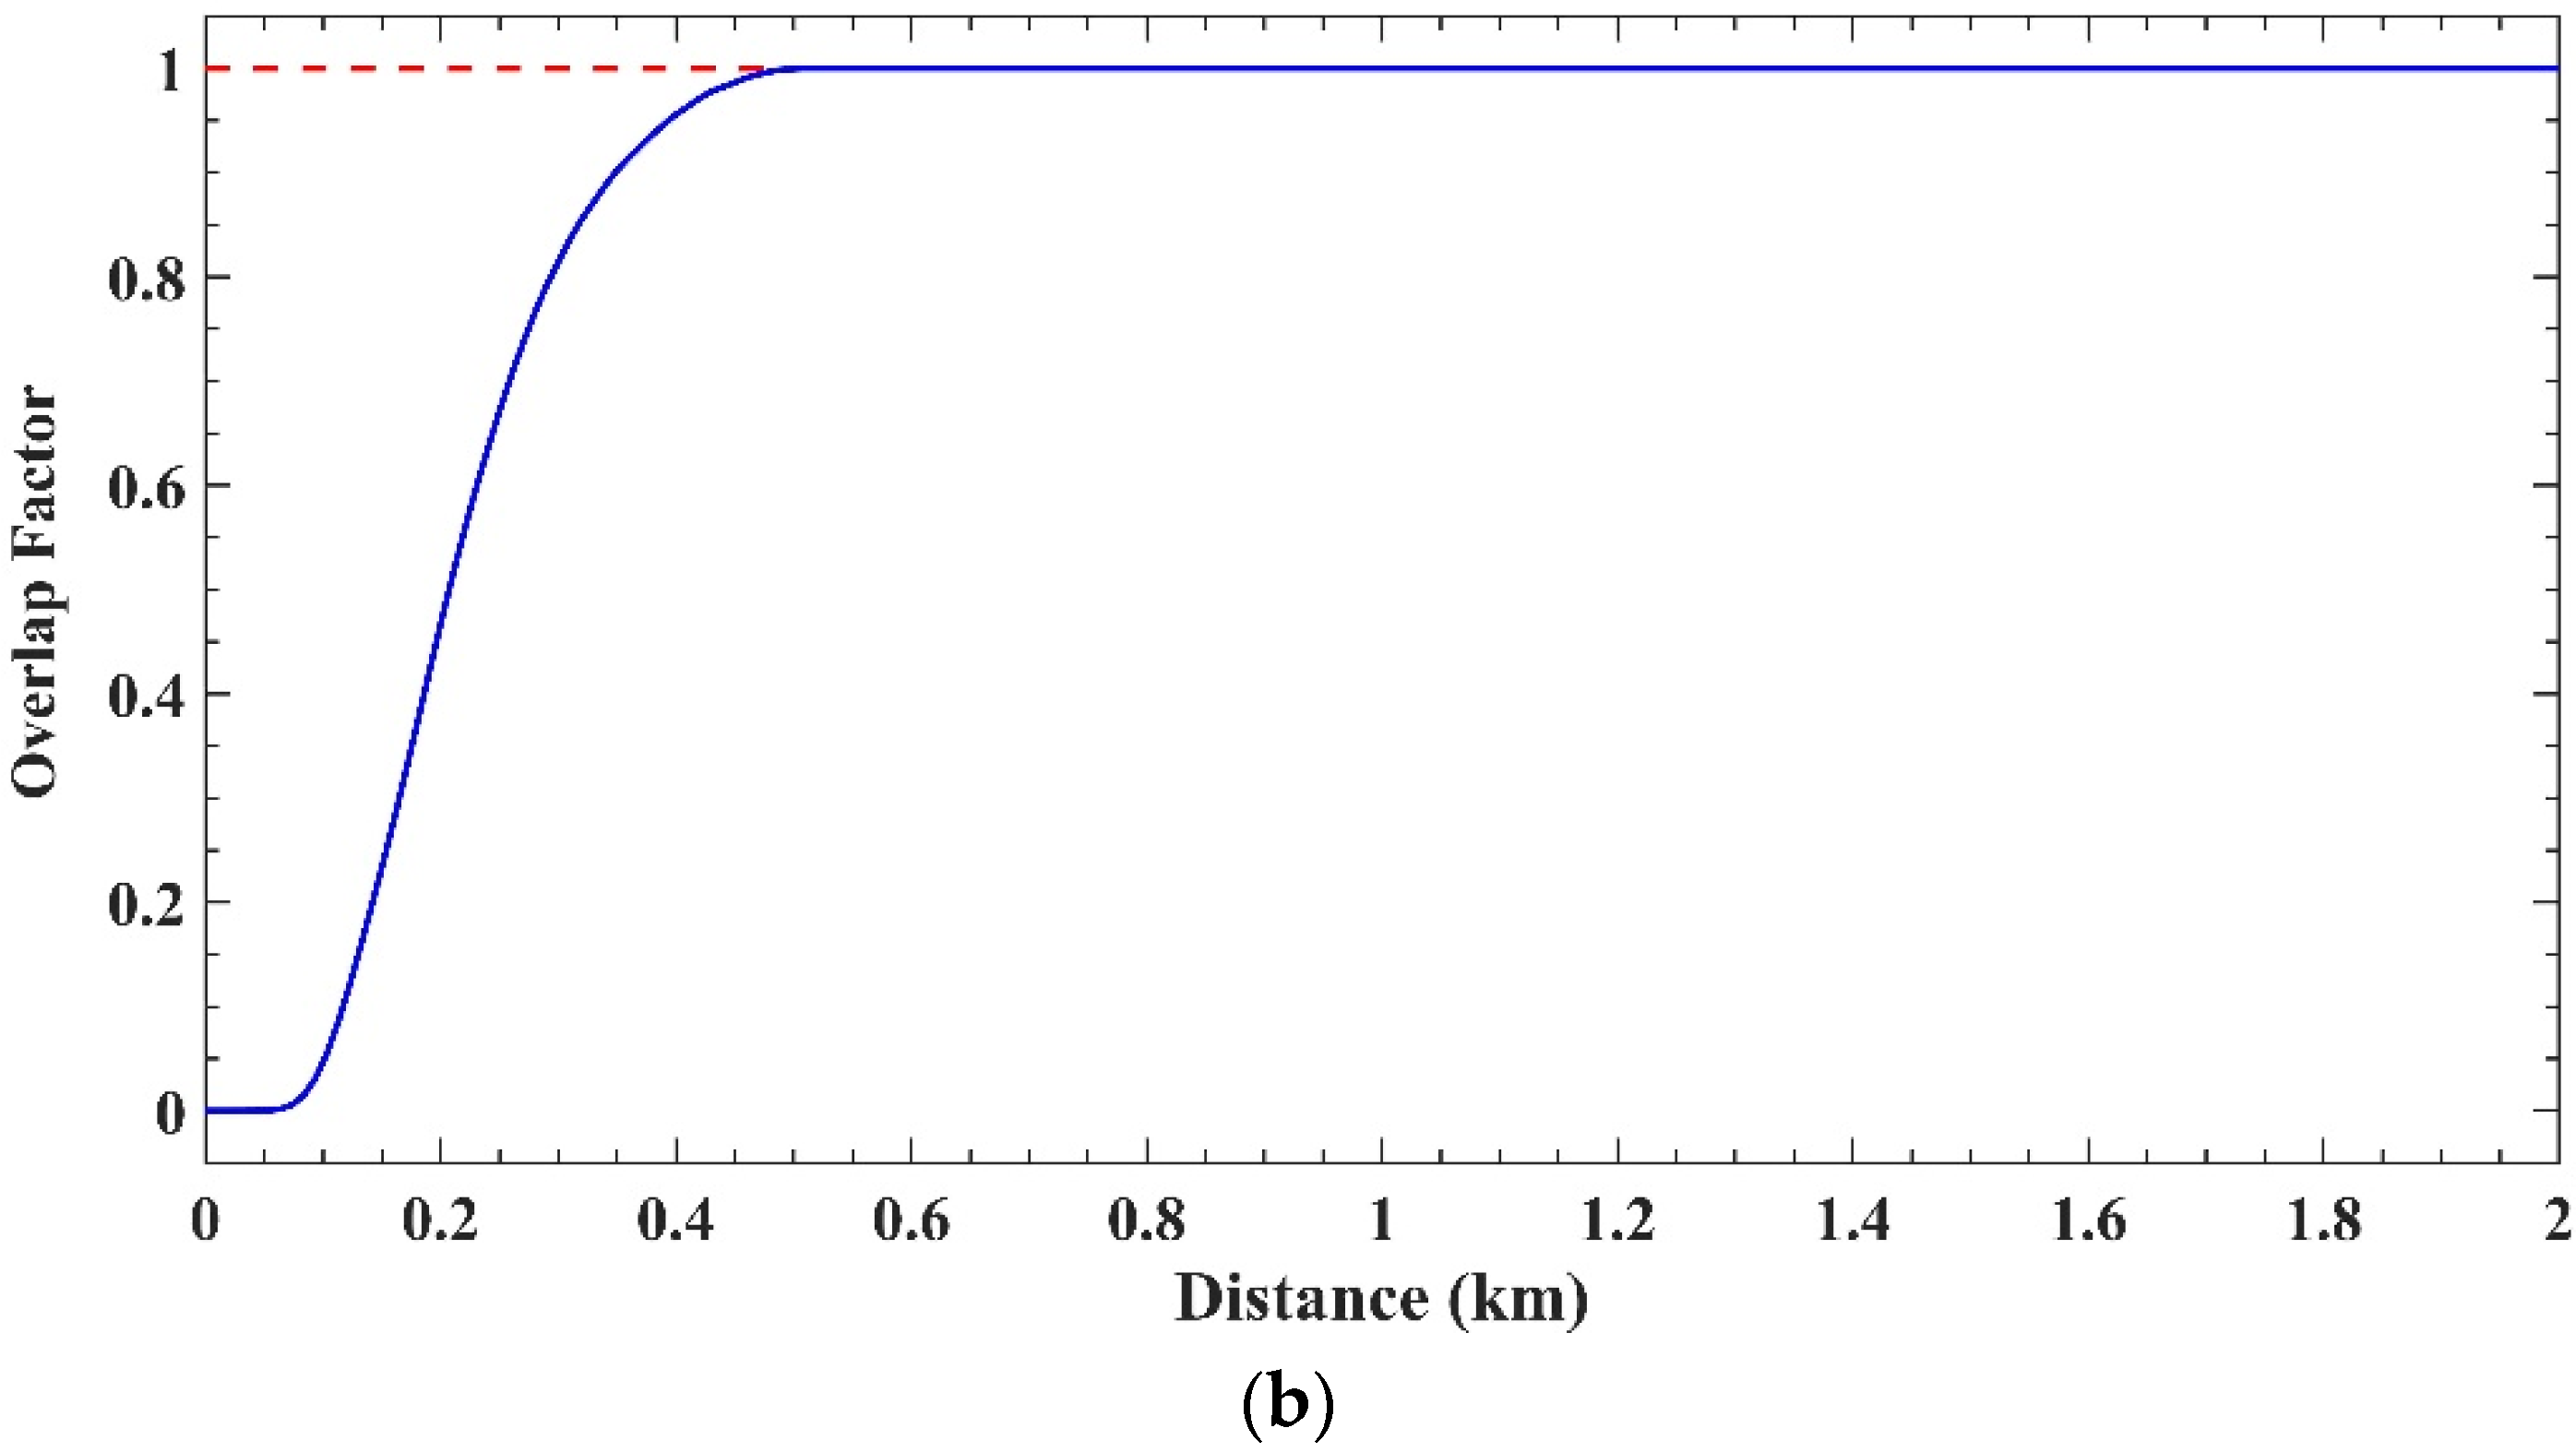
Figure 7a shows the original signal of the lidar when it was pointed to the horizontal direction. We took the form of Equation (5) to fit the signal from 800 to 1500 m, where the system constant
C’ of 56 km
2 and the average extinction coefficient
σ of 0.0108 km
−1 were obtained. The formula in
Figure 7a is the fitting results while the red dotted curve represents the estimated signal variation trends if the overlap factor equals to one at all ranges. Therefore, the overlap factor can be retrieved by comparing the original near-zone signal and the fitted curve from the far-field, as was shown in
Figure 7b. The blind-zone of our lidar was less than 0.1 km and the overlap factor grew steeply from 0.1 km to 0.5 km, reaching the maximal value of 1 for the succeeding distance. Such a short distance with incomplete overlap factor of our lidar is also solid evidence of a large FOV of the intra-cavity UPD, especially when compared with the PPLN-W-based UPD.
5. Aerosols and Clouds Observation Results
As the calibration and detecting capability of hard targets were confirmed, the actual measurements for aerosols and clouds were carried out thereafter with its pointing direction towards the low altitude clouds.
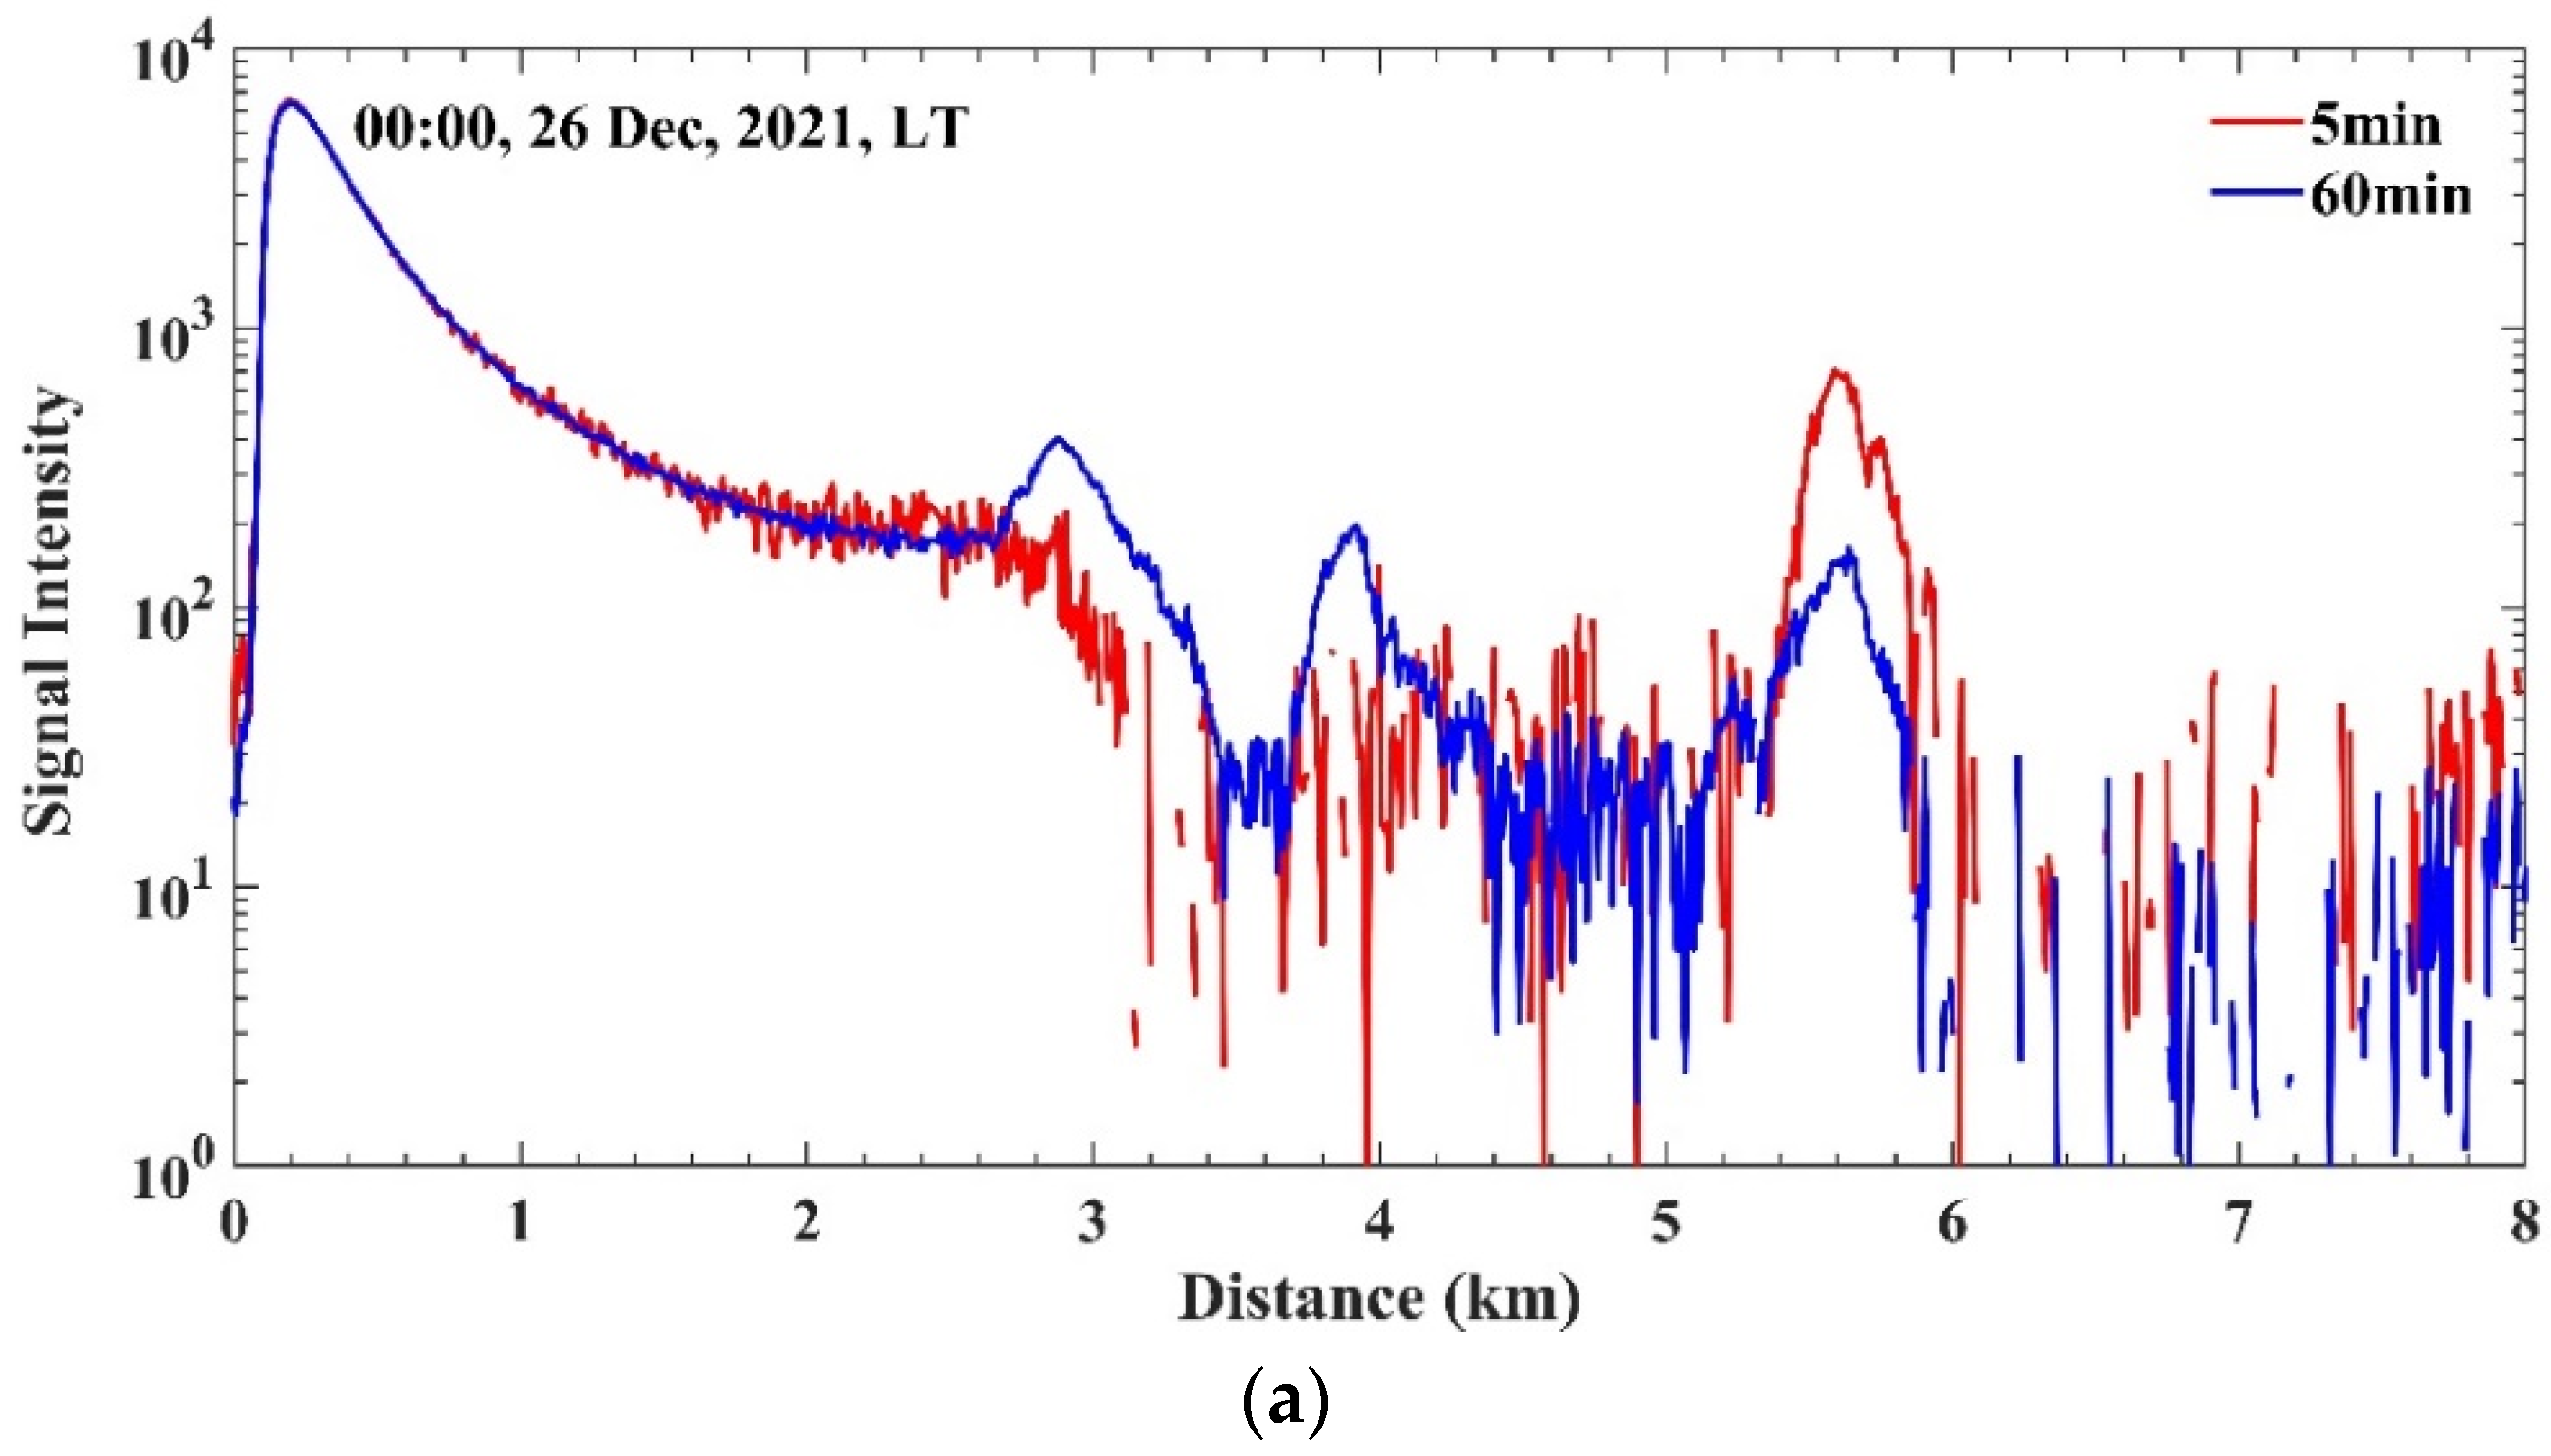
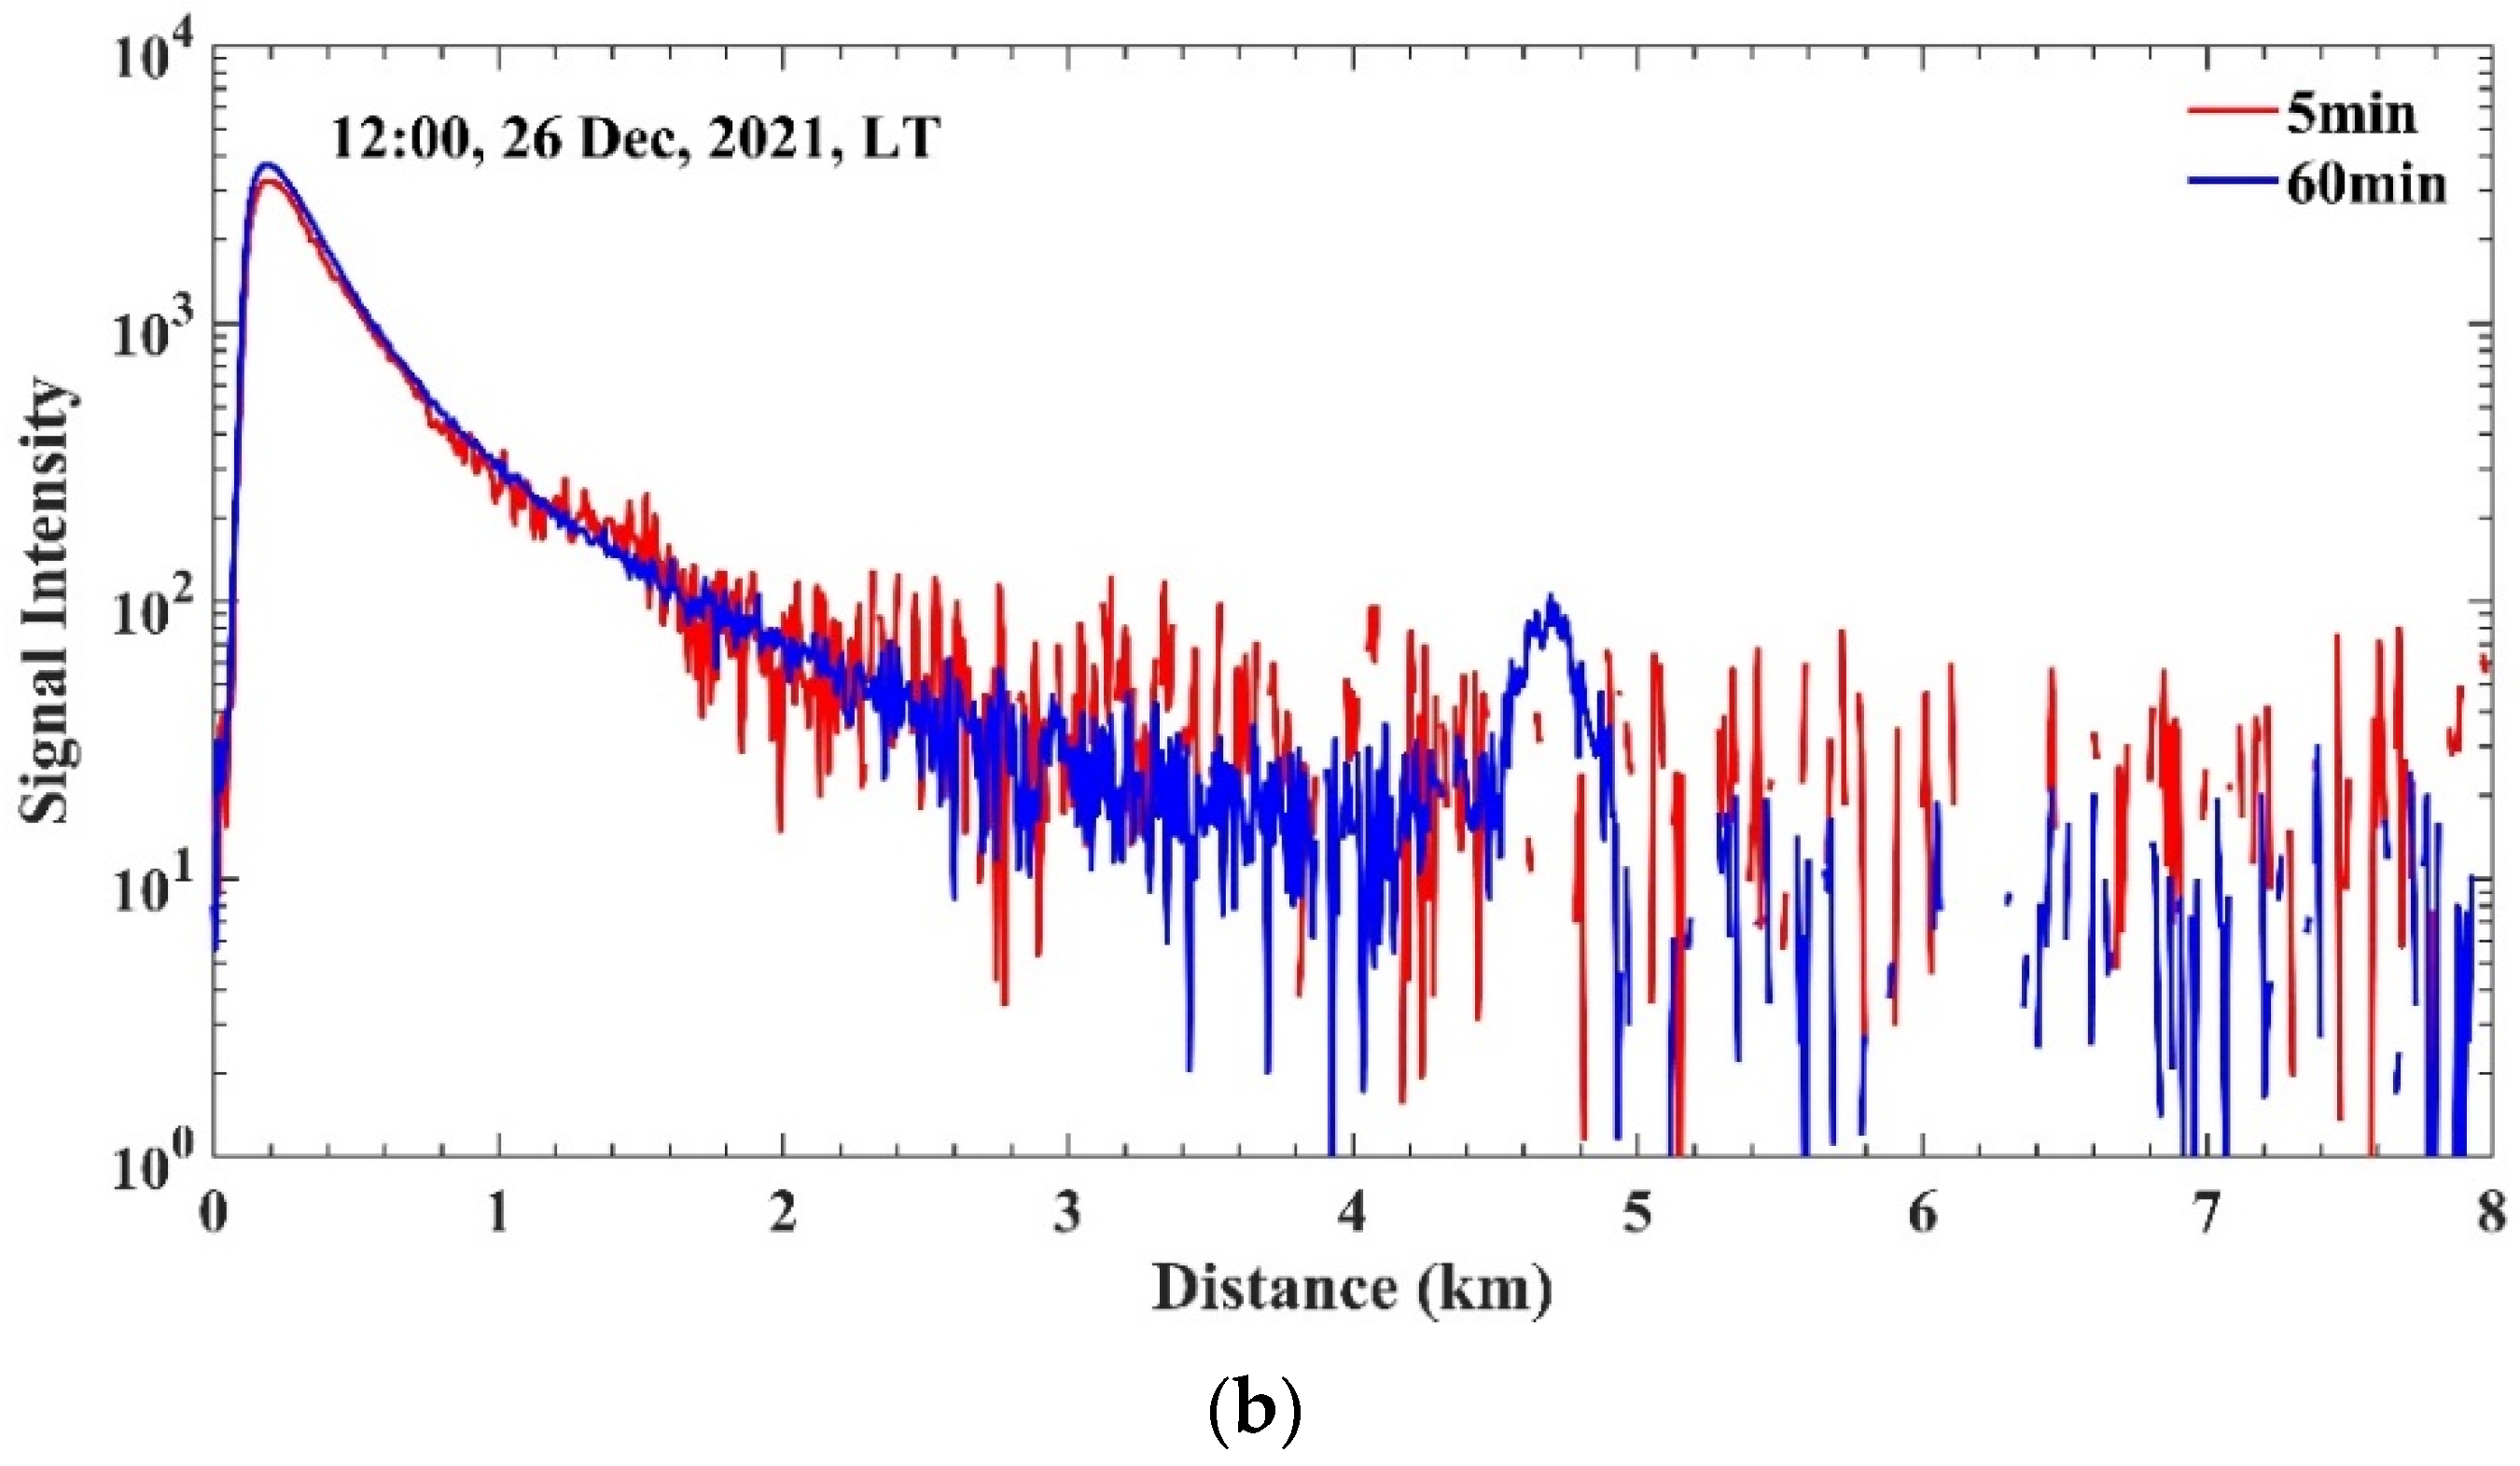
Figure 8a,b show two typical backscattered signal profiles from 0 to 8 km at midnight and noon, respectively. On account of the weak backscattering coefficient of the atmospheric aerosol and molecule at the near-infrared wavelength, every 16 bins of the original signal were merged to enhance the SNR, resulting in a reduced spatial resolution of 9.8 m. In addition, signals were also accumulated in the time domain with different integral durations of 5 min and 60 min, respectively, for both cases. The nocturnal clouds saw several clusters from 2.5 to 6 km during the measured time duration. Compared with the nocturnal signal, the diurnal signal witnessed a poorer SNR. Nevertheless, clouds at a distance of ~4.6 km were still distinguishable for an integral duration of 60 min, which is mainly benefited from the low solar background at near-infrared wavelength band. The narrow bandwidth filter at 1550 nm and the narrowband characteristics of the upconversion mechanism also play important roles in the daytime background noise reduction. The estimated upconversion efficiency is ~20% and the quantum efficiency of the PMT is ~15% at 631 nm, forming an overall PDE of 3%. Although the PDE is not outstanding, the low Pap and short dead time of a PMT were inherited by the UPD, which were beneficial for high-dynamic-range atmospheric signal observation.
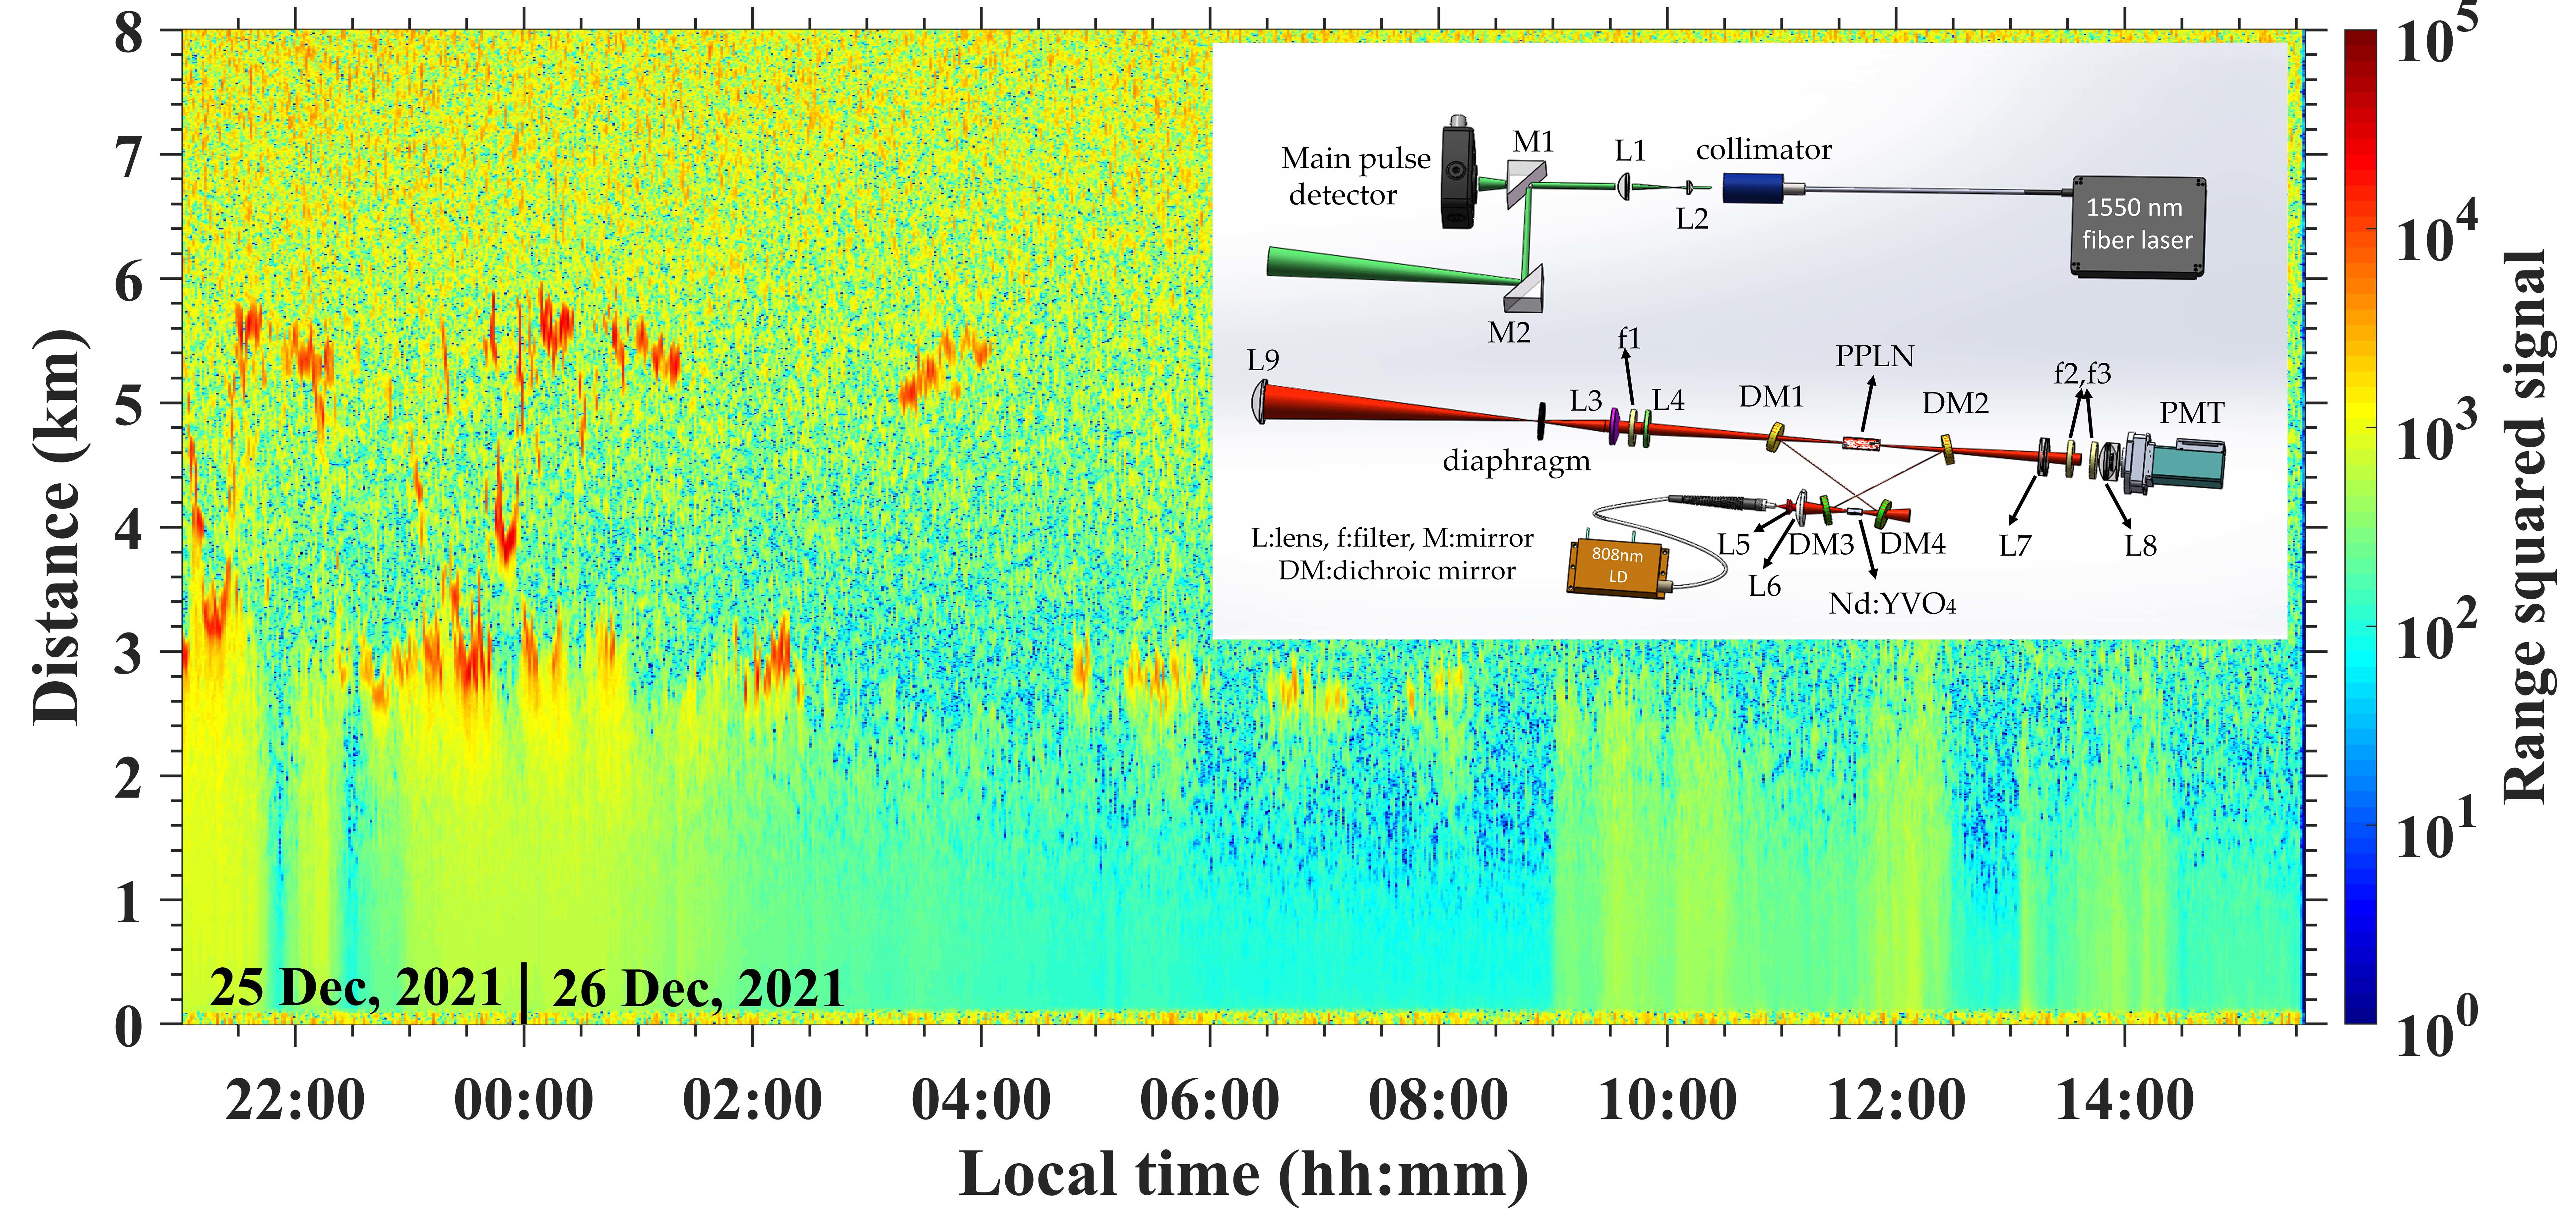
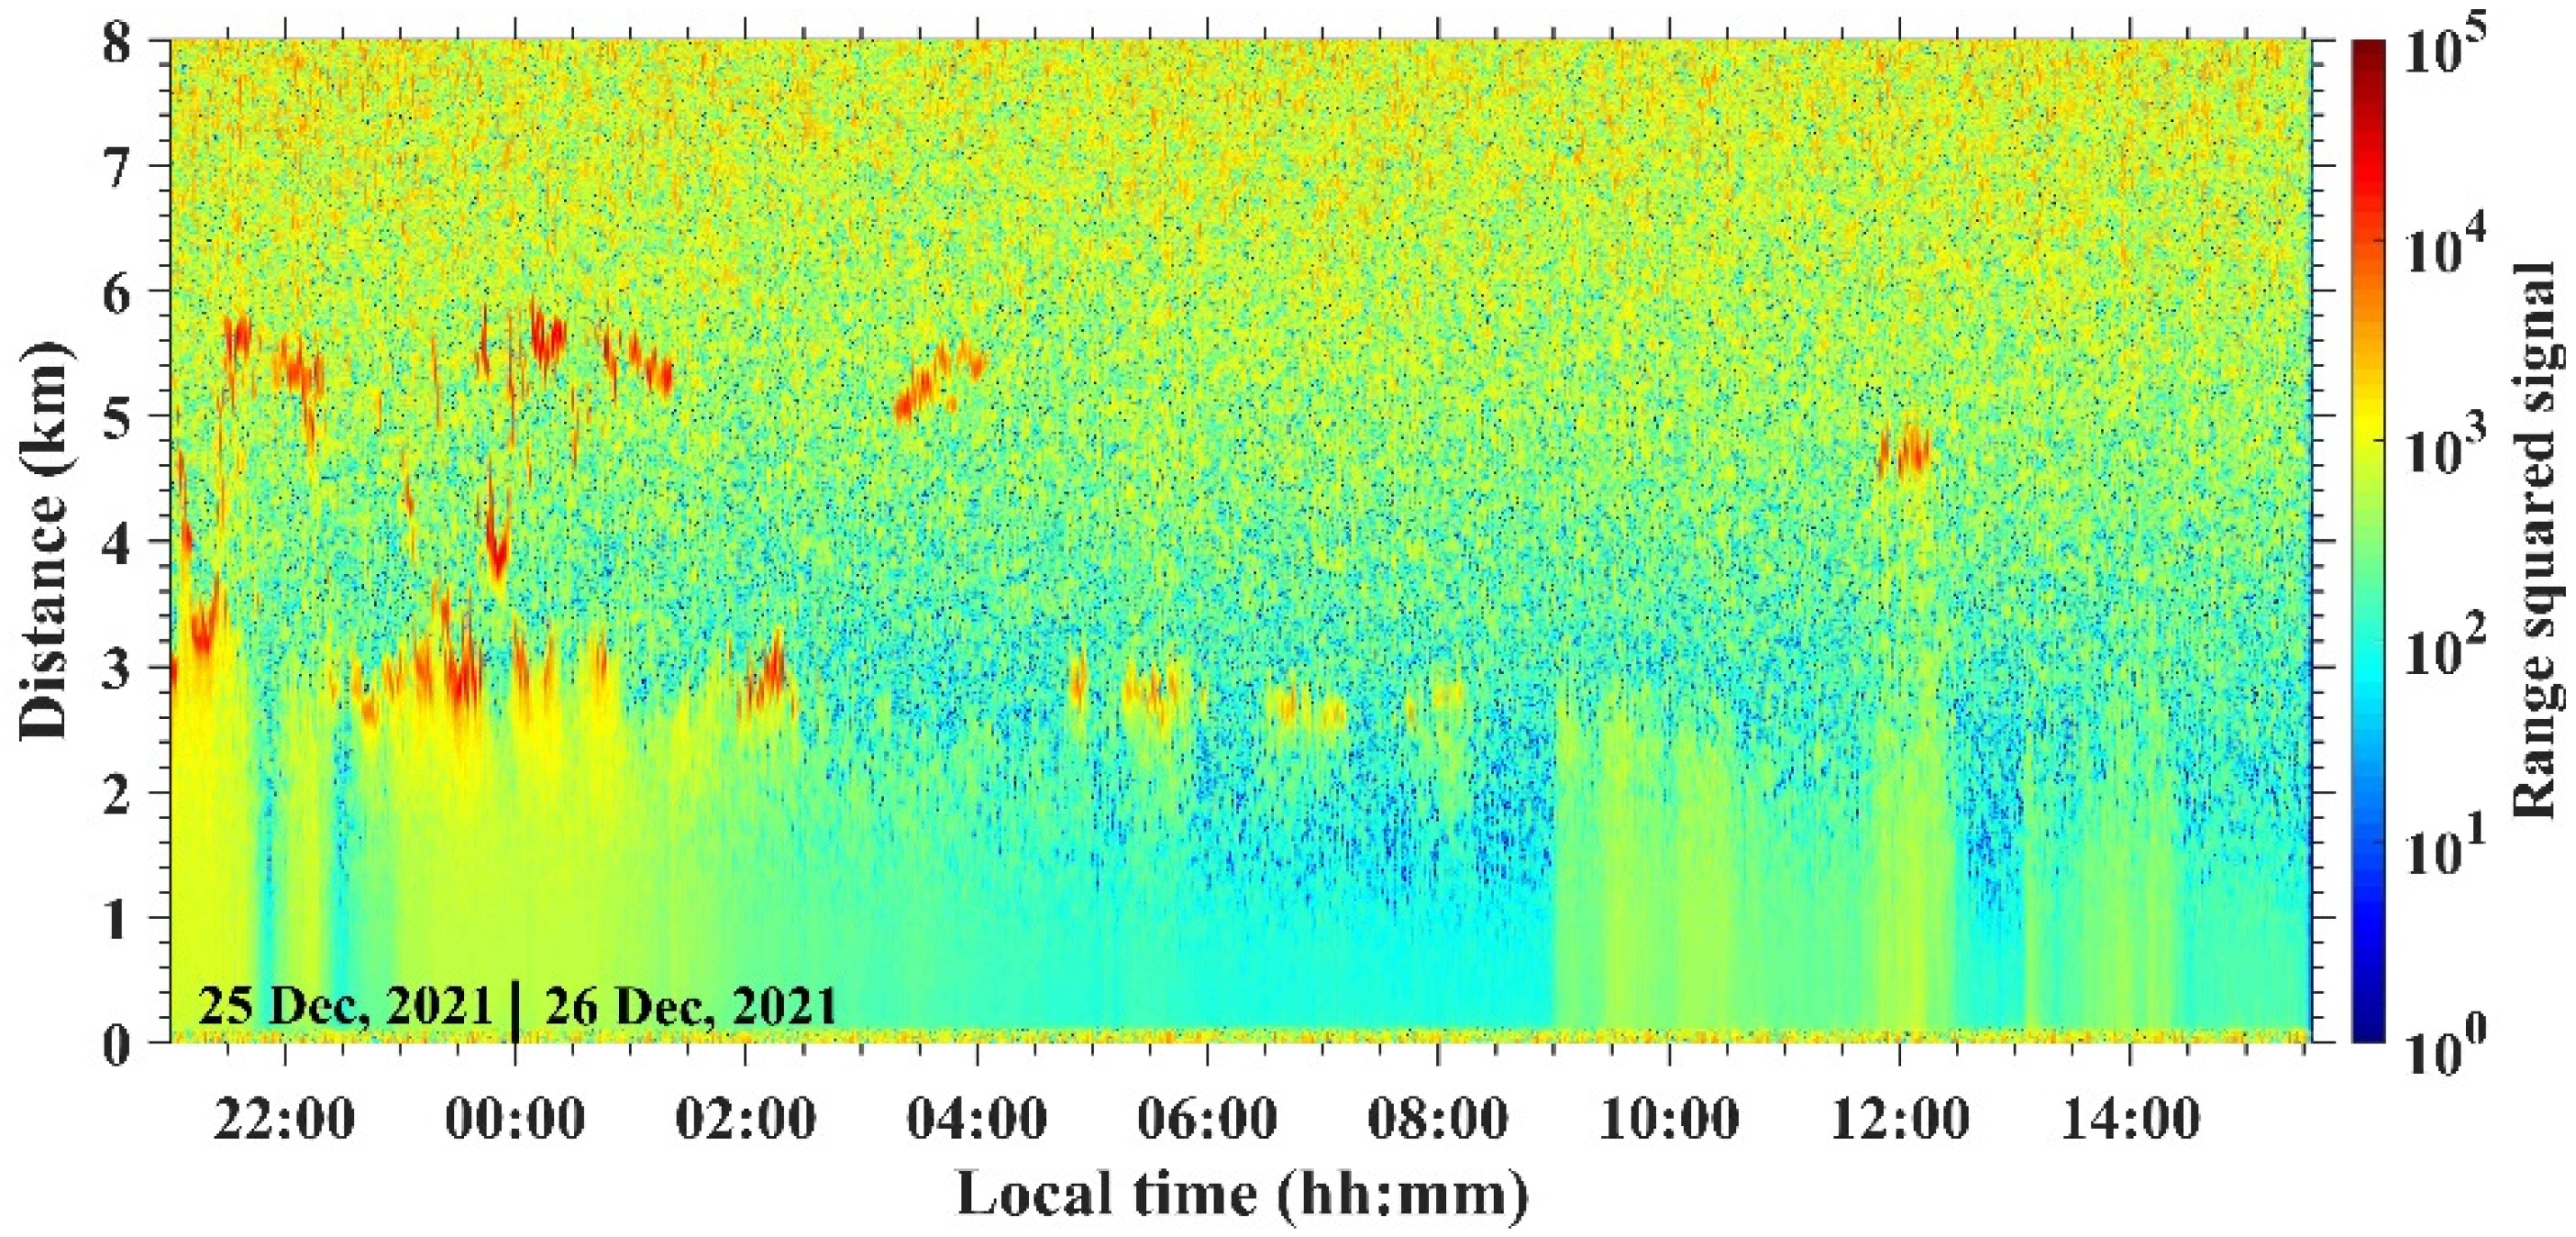
Figure 9 shows the temporal and spatial variations of aerosols and clouds from 25–26 December 2021, covering both day and night, with a total time duration of 18.5 h. Similarly, the spatial resolution was reduced to ~9.8 m for a better SNR. The temporal resolution was set to be 1 min to identify the evolution of the detected aerosols and clouds in a short time scale. The pseudocolor indicated the distance squared signal, i.e., the signal intensity times the square of the distance. Because this parameter can be directly translated to the aerosol and cloud backscattering coefficient under the condition of high atmospheric transmittance, where difference in transmittance is negligible for different distances. In this scenario, the strong backscattered signals would possess high range squared signal values, and therefore the red regions in
Figure 9 indicated the existence of clouds. The evolution of aerosols and clouds saw several cloud clusters at the distance from 2.5 to 6 km during the first 7 h of the measurement. These clouds almost disappeared for the rest of the measurement except for a short duration around the noon of 26 December 2021. The evolution of aerosols and clouds was in good agreement with the weather record of the experiment site (Hongkou, Shanghai), which was cloudy on 25 December, and clear to overcast on 26 December. Thanks to the narrow spectral bandwidths and reasonable FOV, the detrimental background photons in the spectral and spatial domains were well suppressed. Therefore, no significant differences in SNR of the signal could be observed during the whole measurement, indicating its capability for full-time automatic aerosol and cloud monitoring.
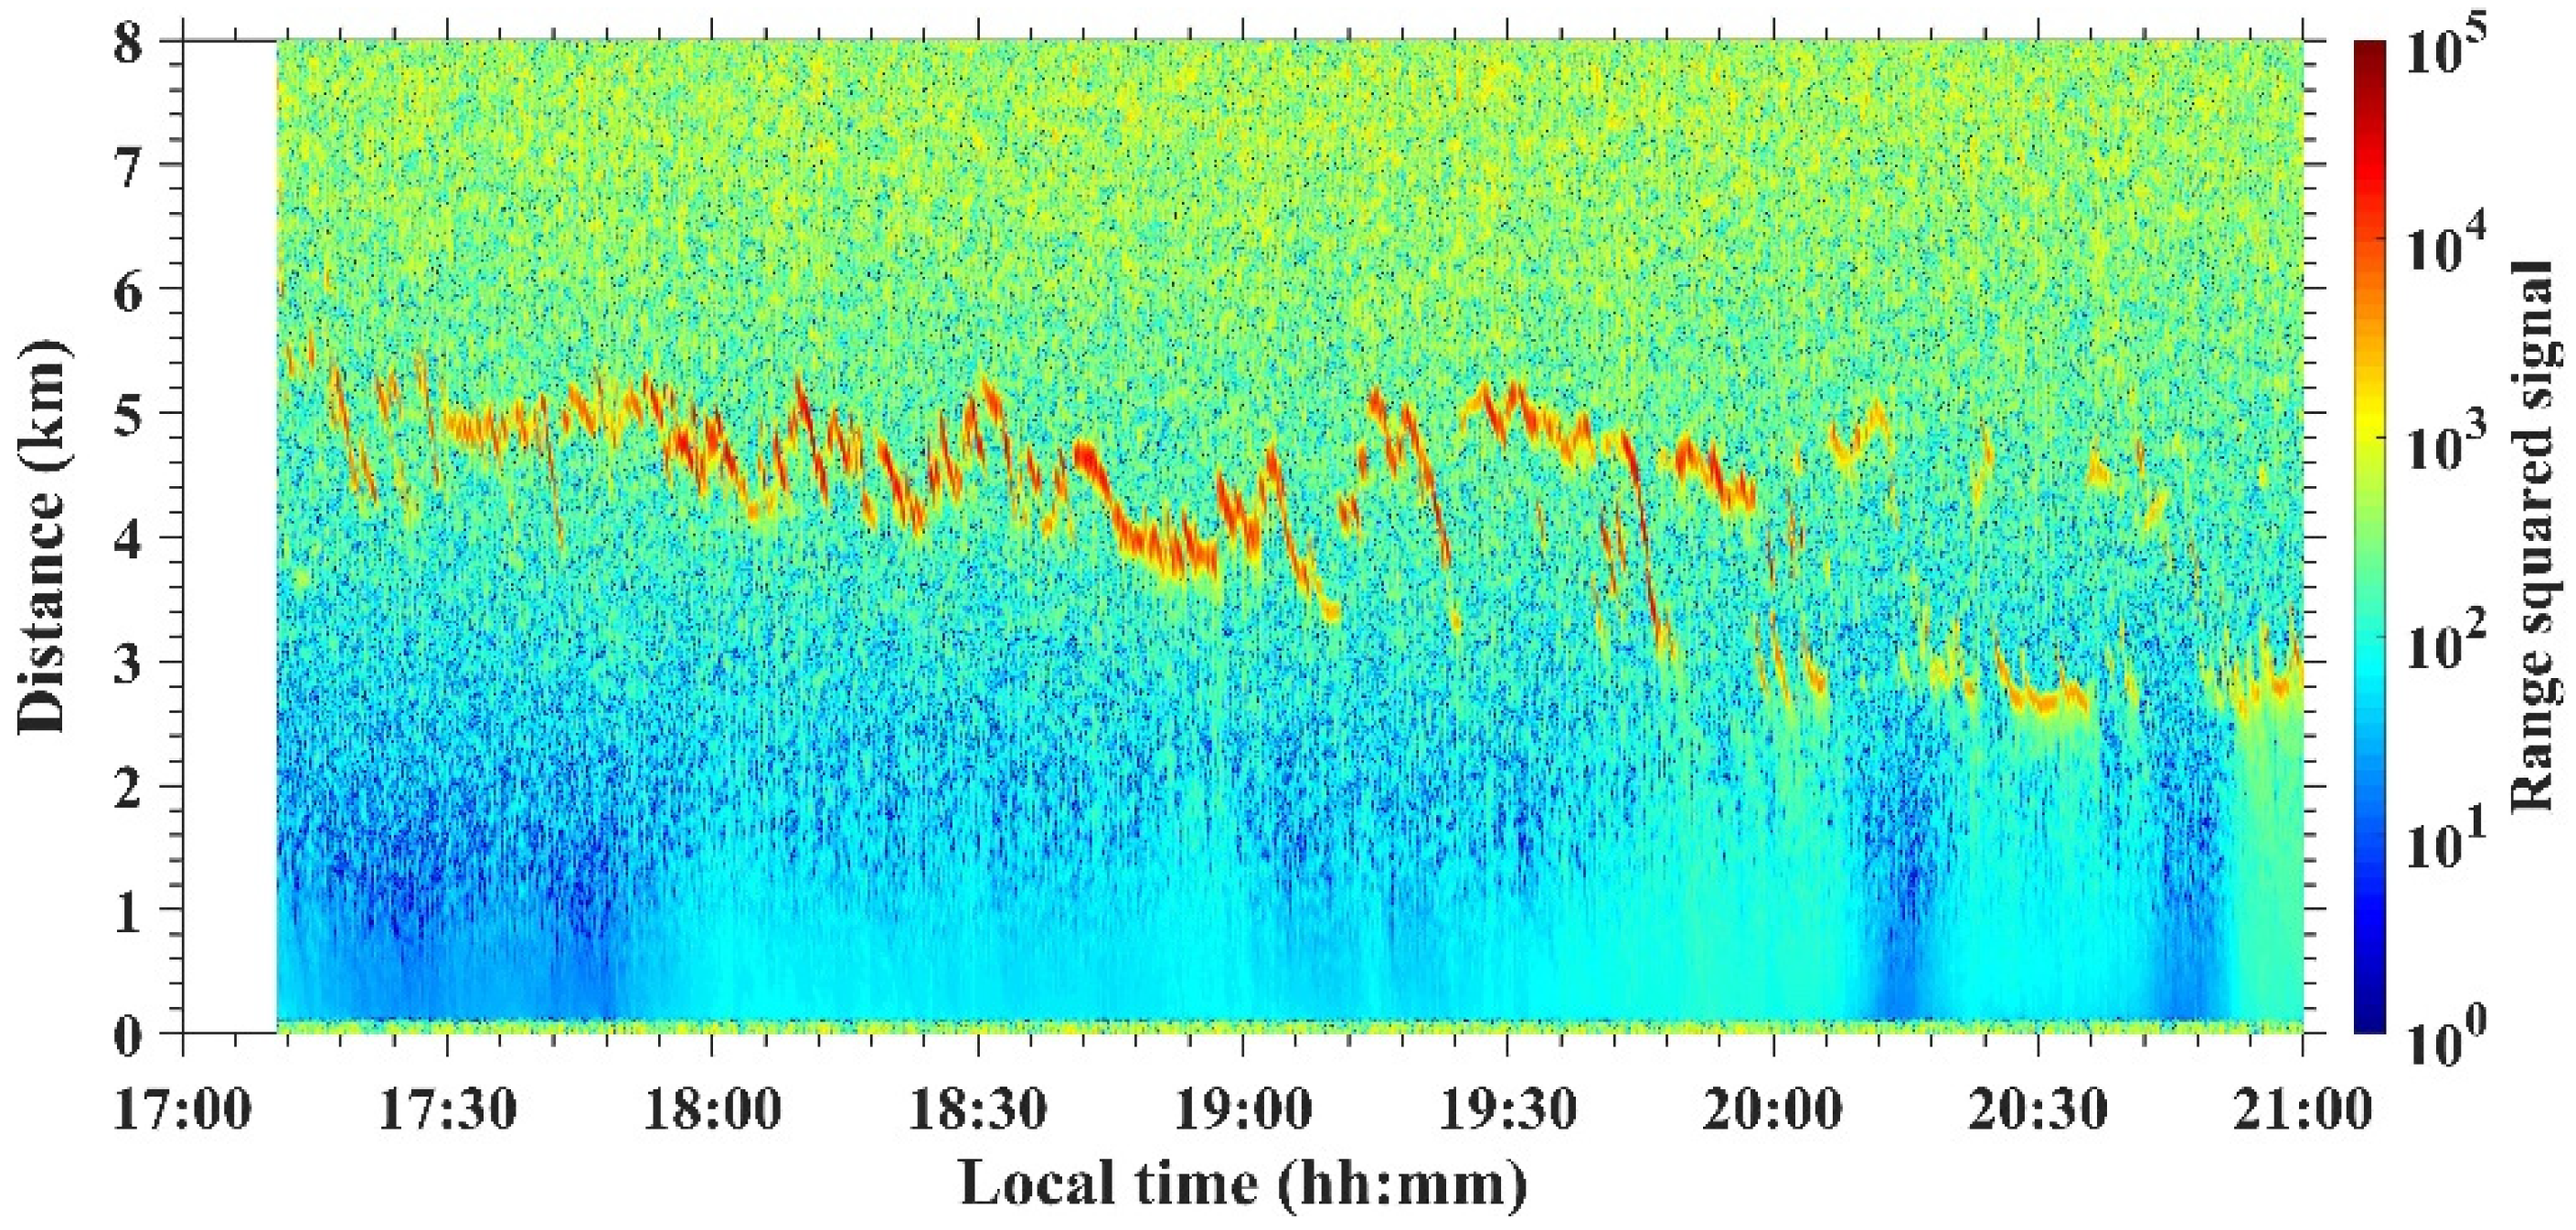
In order to show the fast detection capability of the lidar, a much shorter integral duration of 5 s was selected to reprocess original date from 17:10 to 21:00 on 25 December 2021, and the retrieved range squared signals were depicted in
Figure 10. Fine structures and fast evolution of the cloud boundary could be observed with such a small temporal resolution. It is noteworthy that the near-field signals show quick variability around 22:00 in
Figure 9 and 20:00–20:30, 20:30–21:00 in
Figure 10. These fluctuations were mainly caused by the polarization jitter of the transmitted laser without temperature control and vibration isolation. This polarization instability can be improved by precise controlling the laser temperature and fine fixing the beam delivery fiber.
6. Discussion and Outlook
Compared with the commercial aerosol and cloud lidars working at 532 nm or 905 nm, the performance of our design is not significantly improved, and the reasons are two-fold. First of all, atmospheric scattering at 1550 nm is much weaker than that at visible or near infrared wavelength bands. This makes it difficult for a 1550 nm lidar to calibrate from the backscattered molecular signals. The molecular calibration is even harder for the coherent Doppler lidars, where the backscattered molecular signals are broadened in the spectral domain. By contrast, the wavelength acceptance bandwidth of our lidar is ~0.5 nm, which is defined by the phase-matching condition of the PPLN crystal. Therefore, it still can detect the spectral broadened weak backscattering from the atmospheric molecules even in particle free altitude region as long as the accumulation time can be increased. Apart from the wavelength, the overall PDE of our current system is another factor to constrain the performance of the lidar. However, the upconversion efficiency can be further improved to >90% by reducing the cavity loss and/or increasing the external pump power. As a consequence, the overall PDE of the UPD can be as high as that of an InGaAs detector in free running mode (~15%), but with much lower Pap and shorter dead time. In this scenario, the UPD-based lidar should become a competitive candidate for aerosol and cloud detection in both precision and eye safety.
It is also worth mentioning that the UPD is polarization-sensitive because only linearly-polarized light along the e-axis of the PPLN crystal can meet the phase-matching condition, and thus be effectively upconverted. Therefore, the depolarized components from the aerosols and clouds are undetectable by the lidar in the current design. In order to study the polarization characteristics of the detecting targets, a polarization beam splitter can be introduced to separate the echo signals into two orthogonally polarized channels and detected by two identical UPDs, respectively. In this way, more information can be retrieved from intensity and polarization dependent signals.
7. Conclusions
In summary, we have demonstrated, to the best of knowledge, the first eye-safe aerosol and cloud lidar based on a free-space intracavity UPD. A home-made EDFL at 1550 nm was utilized as the laser source of the lidar. A UPD with bowtie cavity configuration was developed to convert the infrared echo photons into ~631 nm with enlarged optical aperture and acceptance angle, enabling efficient photon counting detection at 1550 nm. The transmitter and receiver of the lidar were finely adjusted, calibrated, and tested, ensuring its good performance in aerosol and cloud monitoring. Reflected signals peaked at ~6.8 km from a hard target were measured with a distance resolution of 0.6 m for an integral duration of 10 s. Atmospheric backscattered signals, with a range of ~6 km, were also detectable for longer integral durations. The evolution of aerosols and clouds were recorded by this lidar in a preliminary experiment with a continuous measuring time of over 18 h. Clear boundary and fine structures of clouds were identified with a spatial resolution of 9.6 m during the measurement, showing its great potential for practical aerosol and cloud monitoring. It is believed that such a lidar design has offered an effective path towards the development of shortwave and midwave infrared lidars, with the most sophisticated visible or near infrared detectors, rendering continuous services for meteorological observation, gas detection and environmental pollution monitoring.
Author Contributions
Conceptualization, T.C. and W.K.; Funding acquisition, T.C. and W.K.; methodology, W.Y., T.C. and W.K.; formal analysis, W.Y., T.C. and W.K.; investigation, W.Y., T.C., W.K. and X.C.; writing—original draft preparation, W.Y.; writing—review and editing, T.C. and W.K.; supervision, G.H. and R.S. All authors have read and agreed to the published version of the manuscript.
Funding
This research was funded in part by the National Natural Science Foundation of China, no. 61875219, the Shanghai Municipal Science and Technology Major Project, no. 2019SHZDZX01, the Innovation Program for Quantum Science and Technology of Ministry of Science and Technology of China, no. 2021ZD0301400, the Key Laboratory Foundation of Chinese Academy of Sciences, no. CXJJ-19S019, the Youth Innovation Promotion Association, Chinese Academy of Sciences, no. 2021234, the Shanghai Rising-Star Program, no. 22QA1410500, the China Postdoctoral Science Foundation, no. 2021M693266, the Shanghai Sailing Program, no. 21YF1455100, and the Innovation Foundation of Shanghai Institute of Technical Physics, Chinese Academy of Sciences, no. CX-308.
Data Availability Statement
Not applicable.
Acknowledgments
The authors acknowledge Hao Liu for his original design of the circuits.
Conflicts of Interest
The authors declare no conflict of interest.
References
- Abbott, T.H.; Cronin, T.W. Aerosol invigoration of atmospheric convection through increases in Humidity. Science 2021, 371, 83–85. [Google Scholar] [CrossRef] [PubMed]
- Li, Z.; Niu, F.; Fan, J.; Liu, Y.; Rosenfeld, D.; Ding, Y. Long-term impacts of aerosols on the vertical development of clouds and precipitation. Nat. Geosci. 2011, 4, 888–894. [Google Scholar] [CrossRef]
- Rosenfeld, D.; Sherwood, S.; Wood, R.; Donner, L. Climate effects of aerosol-cloud interactions. Science 2014, 343, 379–380. [Google Scholar] [CrossRef] [PubMed]
- Jiang, J.H.; Su, H.; Huang, L.; Wang, Y.; Massie, S.; Zhao, B.; Omar, A.; Wang, Z. Contrasting effects on deep convective clouds by different types of aerosols. Nat. Commun. 2018, 9, 3874. [Google Scholar] [CrossRef]
- Alizadeh-Choobari, O.; Gharaylou, M. Aerosol impacts on radiative and microphysical properties of clouds and precipitation formation. Atmos. Res. 2017, 185, 53–64. [Google Scholar] [CrossRef] [Green Version]
- Liu, D.; Yang, Y.; Cheng, Z.; Huang, H.; Zhang, B.; Ling, T.; Shen, Y. Retrieval and analysis of a polarized high spectral-resolution lidar for profiling aerosol optical properties. Opt. Express 2013, 21, 13084–13093. [Google Scholar] [CrossRef]
- Mabuchi, Y.; Manago, N.; Bagtasa, G.; Saitoh, H.; Takeuchi, N.; Yabuki, M.; Shiina, T.; Kuze, H. Multi-wavelength lidar system for the characterization of tropospheric aerosols and clouds. In Proceedings of the IEEE International Geoscience and Remote Sensing Symposium, Munich, Germany, 22–27 July 2012; pp. 2505–2508. [Google Scholar]
- Burton, S.P.; Ferrare, R.A.; Hostetler, C.A.; Hair, J.W.; Rogers, R.R.; Obland, M.D.; Butler, C.F.; Cook, A.L.; Harper, D.B.; Froyd, K.D. Aerosol classification using airborne high spectral resolution lidar measurements—Methodology and examples. Atmos. Meas. Tech. Discuss. 2011, 4, 5631–5688. [Google Scholar] [CrossRef] [Green Version]
- Schmidt, J.; Ansmann, A.; Bühl, J.; Wandinger, U. Strong aerosol–cloud interaction in altocumulus during updraft periods: Lidar observations over central Europe. Atmos. Chem. Phys. 2015, 15, 10687–10700. [Google Scholar] [CrossRef] [Green Version]
- Holmen, L.G.; Rustad, G.; Haakestad, M.W. Eye-safe fiber laser for long-range 3D imaging applications. Appl. Opt. 2018, 57, 6760–6767. [Google Scholar] [CrossRef]
- Aho, A.T.; Viheriälä, J.; Koskinen, M.; Uusitalo, T.; Reuna, J.; Guina, M. High-power 1.5 μm tapered distributed Bragg reflector laser diodes for eye-safe lidar. IEEE Photon. Technol. Lett. 2020, 32, 1249–1252. [Google Scholar] [CrossRef]
- Shangguan, M.; Xia, H.; Dou, X.; Qiu, J.; Yu, C. Development of multifunction micro-pulse lidar at 1.5 micrometer. Eur. Phys. J. Conf. 2020, 237, 07010. [Google Scholar] [CrossRef]
- Hu, P.; Li, H.; You, L.; Wang, H.; Xiao, Y.; Huang, J.; Yang, X.; Zhang, W.; Wang, Z.; Xie, X. Detecting single infrared photons toward optimal system detection efficiency. Opt. Express 2020, 28, 36884–36891. [Google Scholar] [CrossRef] [PubMed]
- Sun, X.; Abshire, J.; Krainak, M.; Lu, W.; Beck, J.; Sullivan, W.; Mitra, P.; Rawlings, D.; Fields, R.; Hinkley, D.; et al. Single photon HgCdTe avalanche photodiode and integrated detector cooler assemblies for space lidar applications. In Proceedings of the SPIE Advanced Photon Counting Techniques XII, Orlando, FL, USA, 14 May 2018; p. 10659. [Google Scholar]
- Fang, Y.; Chen, W.; Ao, T.; Liu, C.; Wang, L.; Gao, X.; Zhang, J.; Pan, J. InGaAs/InP single-photon detectors with 60% detection efficiency at 1550 nm. Rev. Sci. Instrum. 2020, 91, 083102. [Google Scholar] [CrossRef] [PubMed]
- Xia, H.; Shentu, G.; Shangguan, M.; Xia, X.; Jia, X.; Wang, C.; Zhang, J.; Pelc, J.S.; Fejer, M.M.; Zhang, Q.; et al. Long-range micro-pulse aerosol lidar at 1.5 μm with an up-conversion single-photon detector. Opt. Lett. 2015, 40, 1579–1582. [Google Scholar] [CrossRef] [PubMed]
- Xia, H.; Shangguan, M.; Wang, C.; Shentu, G.; Qiu, J.; Zhang, Q.; Dou, X.; Pan, J. Micro-pulse up-conversion Doppler lidar for wind and visibility detection in the atmospheric boundary layer. Opt. Lett. 2016, 41, 5218–5221. [Google Scholar] [CrossRef] [Green Version]
- Huang, K.; Wang, Y.; Fang, J.; Kang, W.; Sun, Y.; Liang, Y.; Hao, Q.; Yan, M.; Zeng, H. Mid-infrared photon counting and resolving via efficient frequency upconversion. Photon. Res. 2021, 9, 259–265. [Google Scholar] [CrossRef]
- Huang, K.; Fang, J.; Yan, M.; Wu, E.; Zeng, H. Wide-field mid-infrared single-photon up-conversion imaging. Nat. Commun. 2022, 13, 1077. [Google Scholar] [CrossRef]
- Junaid, S.; Kumar, S.C.; Mathez, M.; Hermes, M.; Stone, N.; Shepherd, N.; Ebrahim-Zadeh, M.; Tidemand-Lichtenberg, P.; Pedersen, C. Video-rate, mid-infrared hyperspectral upconversion imaging. Optica 2019, 6, 702–708. [Google Scholar] [CrossRef] [Green Version]
- Ashik, A.S.; O’Donnell, C.F.; Kumar, S.C.; Ebrahim-Zadeh, M.; Tidemand-Lichtenberg, P.; Pedersen, C. Mid-infrared upconversion imaging using femtosecond pulses. Photon. Res. 2019, 7, 783–791. [Google Scholar]
- Høgstedt, L.; Fix, A.; Wirth, M.; Pedersen, C.; Tidemand-Lichtenberg, P. Upconversion-based lidar measurements of atmospheric CO2. Opt. Express 2016, 24, 5152–5161. [Google Scholar] [CrossRef] [Green Version]
- Meng, L.; Høgstedt, L.; Tidemand-Lichtenberg, P.; Pedersen, C.; Rodrigo, P.J. GHz-bandwidth up-conversion detector using a unidirectional ring cavity to reduce multilongitudinal mode pump effects. Opt. Express 2017, 25, 14783–14794. [Google Scholar] [CrossRef] [PubMed] [Green Version]
- Meng, L.; Fix, A.; Wirth, M.; Høgstedt, L.; Tidemand-Lichtenberg, P.; Pedersen, C.; Rodrigo, P.J. Upconversion detector for range-resolved DIAL measurement of atmospheric CH4. Opt. Express 2018, 26, 3850–3860. [Google Scholar] [CrossRef] [PubMed] [Green Version]
- Dmitriev, V.G.; Gurzadyan, G.G.; Nikogosyan, D.N. Handbook of Nonlinear Optical Crystals, 3rd ed.; Springer: Berlin, Germany, 1999. [Google Scholar]
- IEC 60825-1; International Electrotechnique Commission. Safety of Laser Products: Geneva, Switzerland, 2007.
- Wang, X.; Song, J.; Sun, H.; Xu, Z.; Qiu, J. Multiphoton-excited upconversion luminescence of Nd: YVO4. Opt. Express 2007, 15, 1384–1389. [Google Scholar] [CrossRef] [PubMed]
| Publisher’s Note: MDPI stays neutral with regard to jurisdictional claims in published maps and institutional affiliations. |
© 2022 by the authors. Licensee MDPI, Basel, Switzerland. This article is an open access article distributed under the terms and conditions of the Creative Commons Attribution (CC BY) license (https://creativecommons.org/licenses/by/4.0/).


 ,
, 


