Article

Attention-Unet-Based Near-Real-Time Precipitation Estimation from Fengyun-4A Satellite Imageries

1
School of Meteorology and Oceanography, National University of Defense Technology, Changsha 410073, China
2
School of Computer, National University of Defense Technology, Changsha 410073, China
*
Author to whom correspondence should be addressed.
Remote Sens. 2022, 14(12), 2925; https://doi.org/10.3390/rs14122925
Submission received: 4 April 2022 / Revised: 9 June 2022 / Accepted: 16 June 2022 / Published: 18 June 2022
(This article belongs to the Topic Advanced Research in Precipitation Measurements)

Abstract

:
Reliable near-real-time precipitation estimation is crucial for scientific research and resistance to natural disasters such as floods. Compared with ground-based precipitation measurements, satellite-based precipitation measurements have great advantages, but precipitation estimation based on satellite is still a challenging issue. In this paper, we propose a deep learning model named Attention-Unet for precipitation estimation. The model utilizes the high temporal, spatial and spectral resolution data of the FY4A satellite to improve the accuracy of precipitation estimation. To evaluate the effectiveness of the proposed model, we compare it with operational near-real-time satellite-based precipitation products and deep learning models which proved to be effective in precipitation estimation. We use classification metrics such as Probability of detection (POD), False Alarm Ratio (FAR), Critical success index (CSI), and regression metrics including Root Mean Square Error (RMSE) and Pearson correlation coefficient (CC) to evaluate the performance of precipitation identification and precipitation amounts estimation, respectively. Furthermore, we select an extreme precipitation event to validate the generalization ability of our proposed model. Statistics and visualizations of the experimental results show the proposed model has better performance than operational precipitation products and baseline deep learning models in both precipitation identification and precipitation amounts estimation. Therefore, the proposed model has the potential to serve as a more accurate and reliable satellite-based precipitation estimation product. This study suggests that applying an appropriate deep learning algorithm may provide an opportunity to improve the quality of satellite-based precipitation products.

Graphical Abstract

1. Introduction

Precipitation plays an important role in the global hydrological cycle. Accurate precipitation estimation is a key factor in the research of weather, climate, hydrology, and ecology [1]. In addition, accurate precipitation estimation can help reduce the loss caused by natural disasters such as floods, which are directly caused by extreme precipitation events [2,3,4]. There are three kinds of common precipitation measurements: rain gauges, ground-based radar observations, and satellite-based precipitation measurements [5,6]. Due to the tough environment and high maintenance costs, rain gauges and ground-based radar observations are sparsely distributed in certain areas such as plateaus, deserts, and poor regions [7,8]. Spatial interpolation of precipitation data is also difficult to reflect the real spatial and temporal distribution of precipitation, which leads to the lack of reliable data in these areas [9]. Rain gauges can provide accurate precipitation data, but due to uneven distribution, they cannot accurately reflect the spatial and temporal characteristics of large-scale precipitation. Ground-based radar observations can detect the spatial distribution of precipitation within a certain range, but the detection signal of radar is easily affected by high mountains and so on, so ground-based radar is more suitable for plains [10].
Owing to the moving orbit of meteorological satellites being above the earth, so compared with rain gauges and ground-based radar, the observation of meteorological satellites is not limited by geographical and natural conditions. Therefore, meteorological satellites are the only viable means to observe precipitation globally [11,12]. Meteorological satellites can observe the development and evolution of cloud systems on a vast scale of time and space, and thus overcome the defect of ground-based observation effectively [13]. The advantages of global coverage and high spatiotemporal resolution of satellite precipitation products are particularly valuable for remote areas that lack precipitation data. In addition, for extreme weather events, meteorological satellites can monitor the entire process of extreme events with a high spatiotemporal resolution, which contributes to some scientific research and helps humans defend against natural disasters.
Most satellite precipitation products estimate precipitation indirectly because the sensors equipped by meteorological satellites detect cloud top temperature or cloud particle information through various spectral bands including infrared bands, visible bands, and passive microwave bands. Infrared data is characterized by high spatiotemporal resolution, so it has a great advantage in monitoring precipitation events. Compared with infrared bands, the passive microwave band is very sensitive to raindrops and can detect information on temperature and humidity under various weather conditions, which is important for precipitation identification and estimation [7,14]. However, for a fixed area of the earth, the sampling frequency of a single satellite is low, and the spatiotemporal range is limited; the spatiotemporal resolution of passive microwave data cannot meet the demands of practical operation [15]. Visible data are only available during the day, but precipitation events may occur at night and day, which limits the use of visible data. In other words, the information offered by a single spectral band does not meet the demands of accurate precipitation retrieval [16,17,18]. In order to improve the accuracy and spatiotemporal resolution of precipitation estimation, more and more researchers are trying to use multi-spectral data. For example, some studies show that the combination of infrared and water vapor channel information can significantly improve the accuracy of precipitation estimation [19,20,21]. Therefore, multi-spectral data fusion is a direction to improve the accuracy of satellite-based precipitation products in the future [13]. In this study, the data used come from the FY4A satellite, which is the most advanced geostationary meteorological satellite around China. The Advanced Geostationary Radiation Imager (AGRI) sensor carried by the FY4A satellite could detect and offer multi-spectral data, which can avoid errors in the fusion process of multiple satellites and provide convenience for the time sustainability and consistency of the study.
In addition to using multi-spectral data, advanced algorithms also can improve the accuracy of satellite-based precipitation products. Therefore, another way to improve the accuracy of satellite precipitation products is by using advanced algorithms which can extract precipitation-related feature information from multi-spectral data [22]. In recent years, deep learning algorithms have gradually expanded from computer science to other fields such as medical and earth science [23]. One of the unique advantages of the deep learning algorithm is that it can extract and utilize relevant feature information from various types of data automatically. Common neural networks include Convolutional Neural Networks [24], Recurrent Neural Networks [25], Generative Adversarial Networks [26], and so on. Each neural network has its strength in dealing with different types of research. For example, LSTM Recurrent Neural Networks are used in short-term Precipitation Forecast studies [27]. Convolutional Neural Networks are used for detecting extreme weather in climate data sets [28]. The Convolutional LSTM network is used in the precipitation Nowcasting study [29]. In 2017, a four-layer fully connected neural network proposed by YUMENG TAO and XIAOGANG GAO was used to study precipitation identification [30].
As for deep learning research on satellite precipitation, more and more neural networks have been applicated in recent years. In 2018, in order to estimate precipitation amount, Tao added a three-layer Auto-Encoder network to the previous network [31]. Experiments show that her new model has a great improvement compared with the PERSIANN-CCS products. In 2019, MOJTABA SADEGHI introduced a ten-layer convolutional neural network to estimate precipitation amount, the results show that compared with the PERSIANN-CCS products, the ten-layer convolutional neural network is more accurate in precipitation identification and has a higher correlation coefficient for precipitation amount estimation [32]. In 2020, Cunguang Wang proposed the infrared precipitation estimation using the CNN(IPEC) network to estimate precipitation amount based on GOES-5 satellite infrared data [33], the experimental results show that the Pearson correlation coefficient increased by 34.9% and relative error decreased by 38.0. In 2019, Negin Hayatbini applied the Conditional Generative Adversarial Nets (CGAN) to research satellite precipitation estimation, experimental results show that CGAN has an overall improvement compared with PERSIANN-CCS products [34]. These studies show that it is the correct direction to apply the deep learning algorithm to estimate satellite-based precipitation.
This study explores the application of the Attention-Unet to estimate precipitation using multiple spectral information of FY4A geostationary satellite. The specific objectives of this paper are to report on:
(1)
Adjust and test Attention-Unet model so that it is capable of extracting useful features from satellite information and support producing accurate precipitation estimation.
(2)
Evaluate the effectiveness of the proposed Attention-Unet model on precipitation identification and precipitation amount estimation by comparing its performance with CMORPH product which is an operational product around the world and FY4A-QPE as FY4A satellite’s operational precipitation estimation product.
(3)
Evaluate the capability of the proposed Attention-Unet model by comparing its performance with other deep learning models including Unet and the PERSIANN-CNN model.
(4)
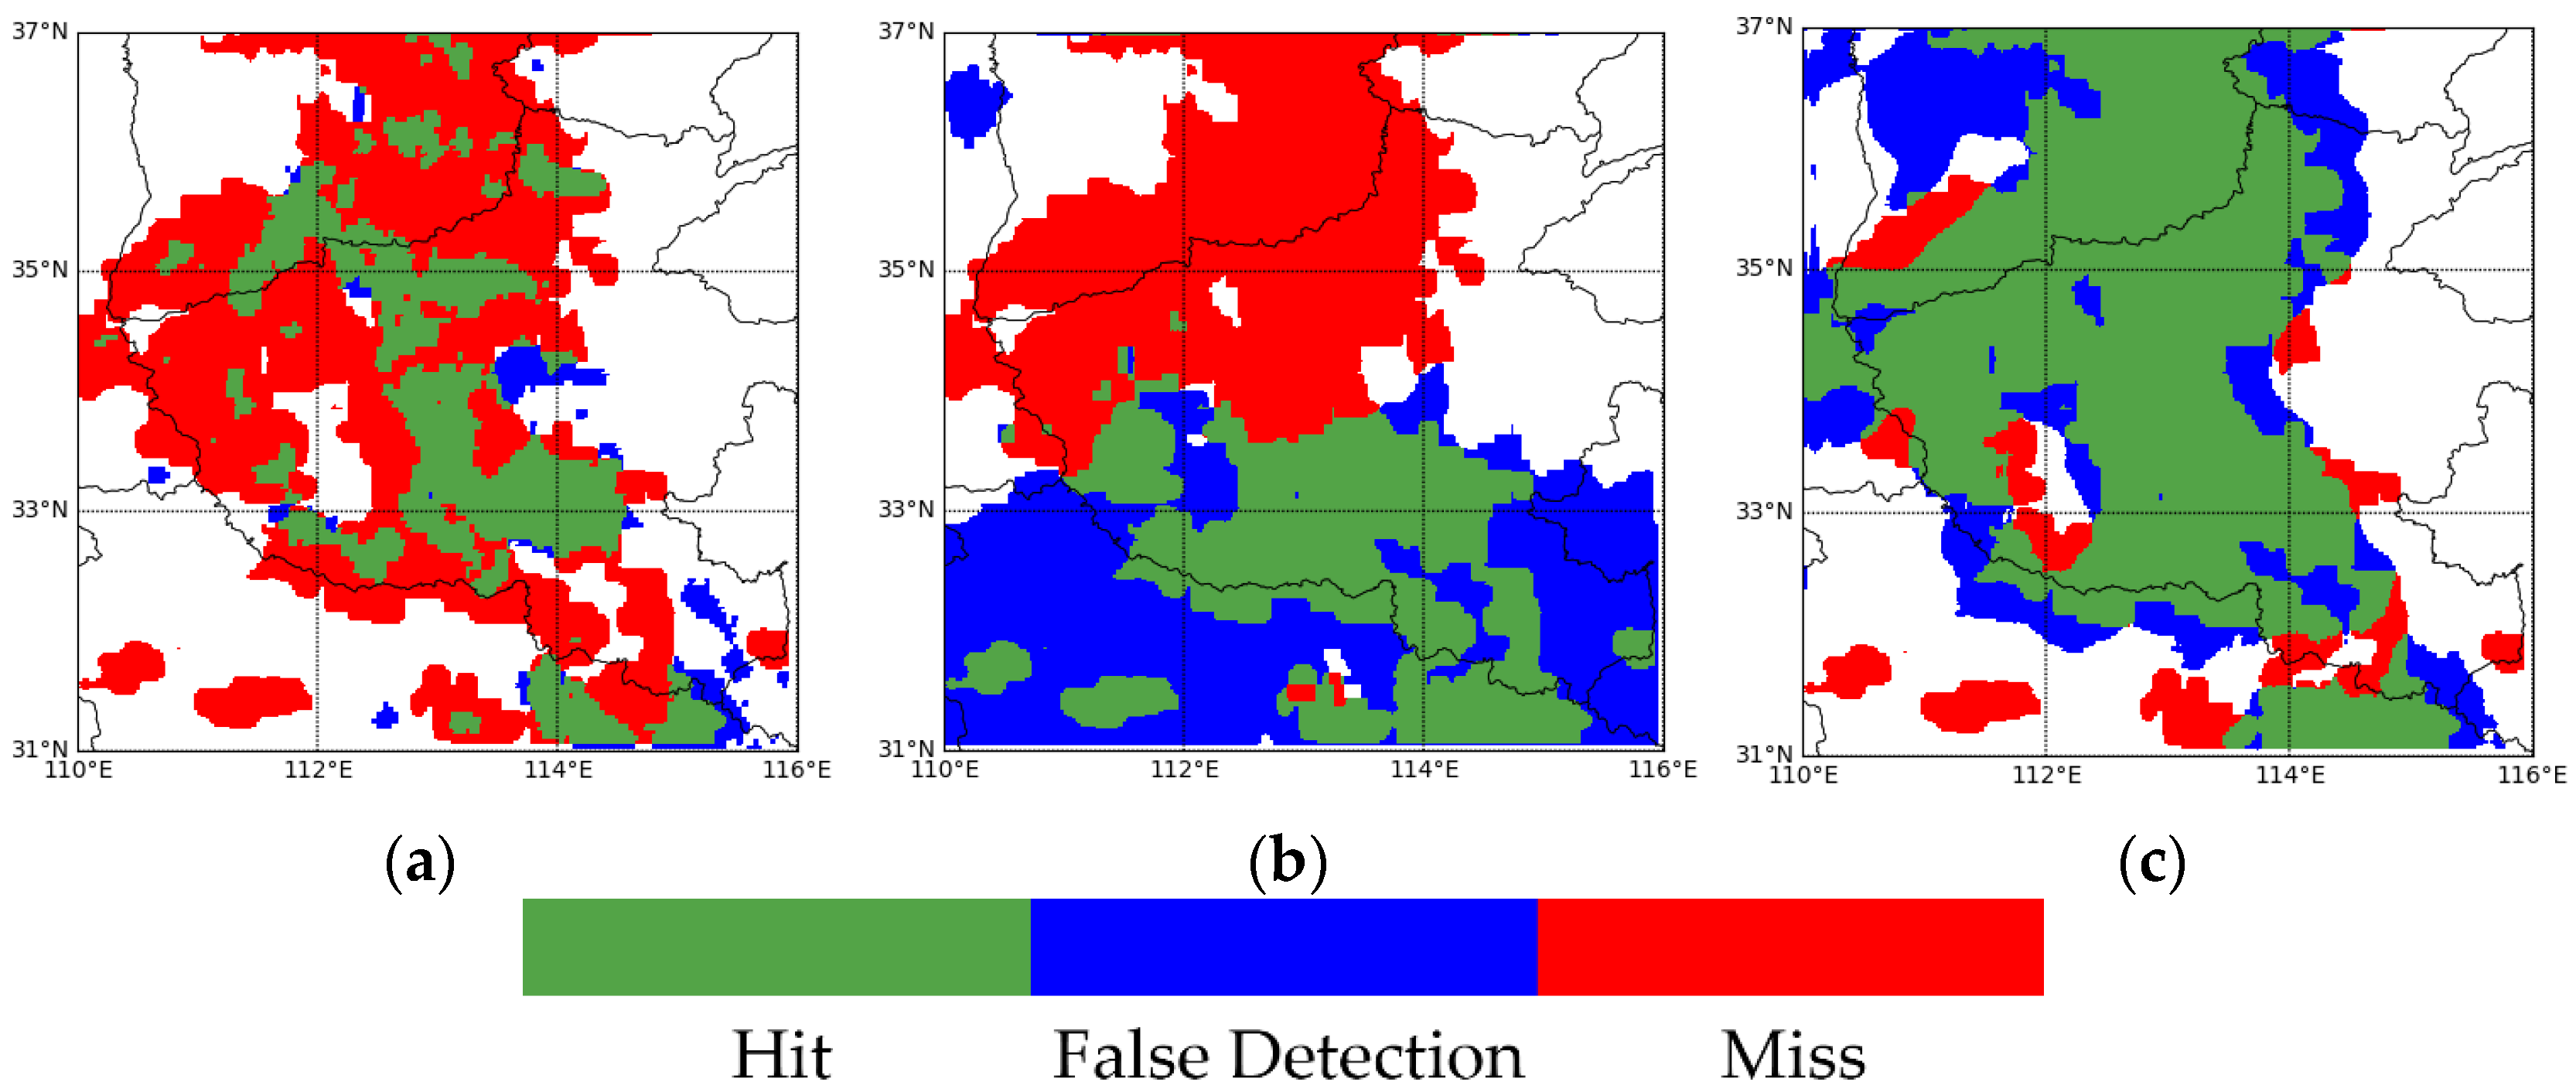
Evaluate the performance of the Attention-Unet model by selecting an extreme precipitation event whose happened location is not calibrated areas, so as to test its potential for future application on the global scale.
This paper is organized as follows. Section 2 describes the materials and methods we have used. Including the study region and the datasets used for this study, an explanation of detailed processes and structures of the Attention-Unet model, and the setup parameter of the experiment. Section 3 presents the results of the proposed model in this study, comparing it with operational satellite-based precipitation products and deep learning models which are successfully applicated in precipitation estimation. Section 4 discusses experimental results and some future research directions. Finally, Section 5 concludes this paper.

2. Materials and Methods

2.1. Data and Study Area

2.1.1. Study Area

The region selected in our study is the southeast coast of China, the specific range is 114°–120° east longitude, 21°–27° north latitude. The selected regions contain land and ocean so as to calibrate the proposed model over both land and ocean. In the future, we want to apply the model to global coverage.

2.1.2. Fengyun 4A Satellite Data

Fengyun-4 series satellites are the new generation of geostationary meteorological satellites developed by China following Fengyun-2. Fengyun-4A is the first satellite of the Fengyun-4 series satellites. The satellite was launched on 11 December 2016 and put into meteorological operation on 1 May 2018. Compared with the Visible and Infrared Spin Scan Radiometer (VISSR, made by China) carried by the FY-2 satellite, the Advanced Geostationary Radiation Imager (AGRI, made by China) carried by the FY-4A satellite has more spectral channels whose channels range from 1 to 14, covering the visible, short-wave infrared, mid-wave infrared and long-wave infrared spectral band, the highest spatial resolution of FY4A data is 500 m [35]. Specific spectral bands and detection objects can be seen in Table 1. In this study, we chose channels 9–14, which mainly include information on infrared (IR) and water vapor (WV). The detected information of channels 9–11 covers the water vapor information of the upper layer, middle layer, and lower layer of the atmosphere. Water vapor is a key factor in the formation of precipitation. The detected information of channels 12–14 mainly covers the infrared information. Infrared information plays an important role in the traditional precipitation retrieval of satellites. Some research indicates that the lower infrared brightness temperature of rain clouds corresponds to the higher precipitation amounts, so the relationship between infrared information and precipitation amounts can be effectively established to accomplish precipitation retrieval [36,37,38].

2.1.3. Precipitation Products
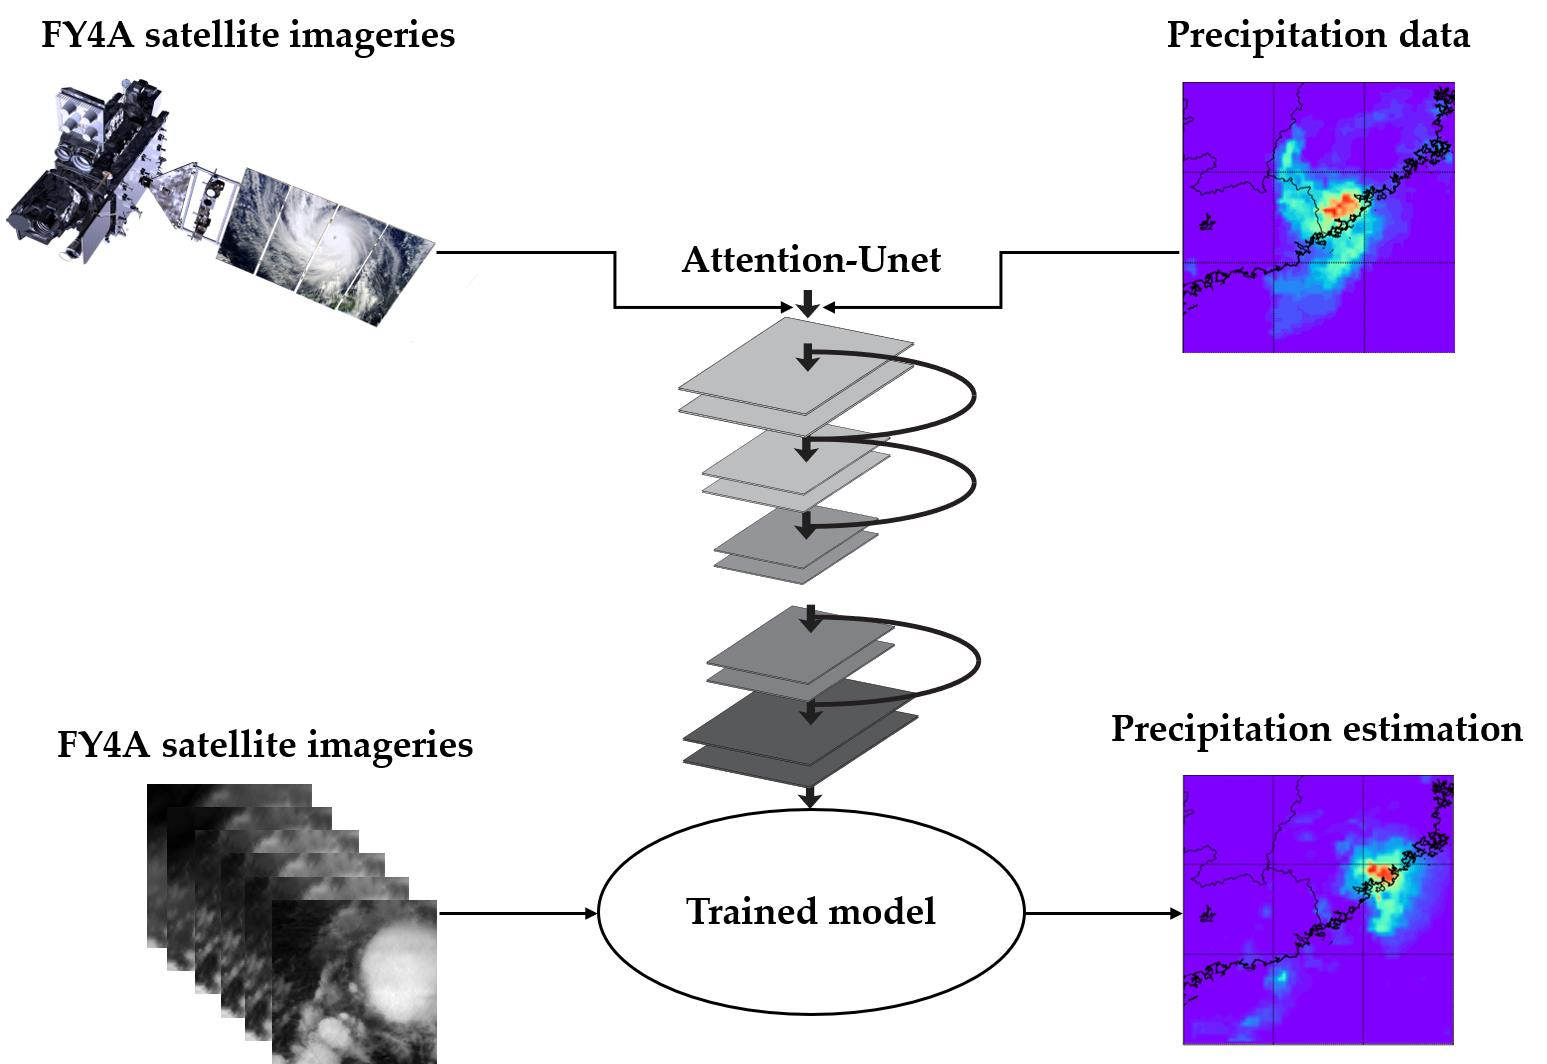
The target precipitation data used in this study is Integrated Multi-satellite Retrievals for Global Precipitation Measurement (IMERG) which is a level-3 precipitation product of GPM. GPM is a satellite precipitation observation project, which is the best precipitation observation project around the world currently [39]. The GPM Core Observatory was launched on 28 February 2014. GPM precipitation products are based on multi-satellite and multi-algorithm. The satellite network of GPM has 10 satellites and may continue to expand in the future. Due to combining satellite network and rainfall gauge data, the accuracy of GPM precipitation data is relatively high among satellite precipitation products. IMERG currently provides three sets of precipitation data: Early run, Late run, and Final run. The IMERG Early run data will be released approximately 4 h after the observation time, it provides relatively fast results for flood analysis and other short-term assimilation applications. The IMERG Late run data will be released approximately 14 h after the observation time, which is suitable for routine and longer applications such as crop forecasting. For IMERG Final run data, satellite precipitation data were calibrated using Global Precipitation Climatology Centre (GPCC) monthly rain gauge data, finally generating the IMERG Final run data. The time delay of the IMERG Final run data is about 3–4 months. Considering rain gauge data calibrating satellite precipitation data, we regard the IMERG Final run data approximately as ground truth. The time resolution of the IMERG Final run data is 30 min and the spatial resolution is 0.1°.
In addition, two operational satellite precipitation estimation products were selected to evaluate our proposed model. The first product is the Climate Prediction Center Morphing technique precipitation product (CMORPH) [40], it is a global precipitation product generated by the National Oceanic and Atmospheric Administration’s Climate Prediction Center, which combines microwave data with infrared cloud top brightness temperature data. The CMORPH precipitation data used in this study with 30 min temporal resolution and 8 km spatial resolution. The second precipitation product is the FY4A Quantitative Precipitation Estimation (FY4A-QPE), which is the level 2 operational product of the FY4A satellite. FY4A-QPE product is generated by AGRI’s precipitation retrieval algorithm using the instantaneous brightness temperature data observed by AGRI in the infrared channel [41]. FY4A-QPE product can be obtained from the official website of the National Satellite Meteorological Centre of China, the temporal resolution of the FY4A-QPE data is about 4.5 min and the spatial resolution is 4 km. Due to the satellite data used in our proposed model and FY4A-QPE product both coming from the FY4A satellite, we can estimate our proposed model more intuitively.

2.2. Methodology

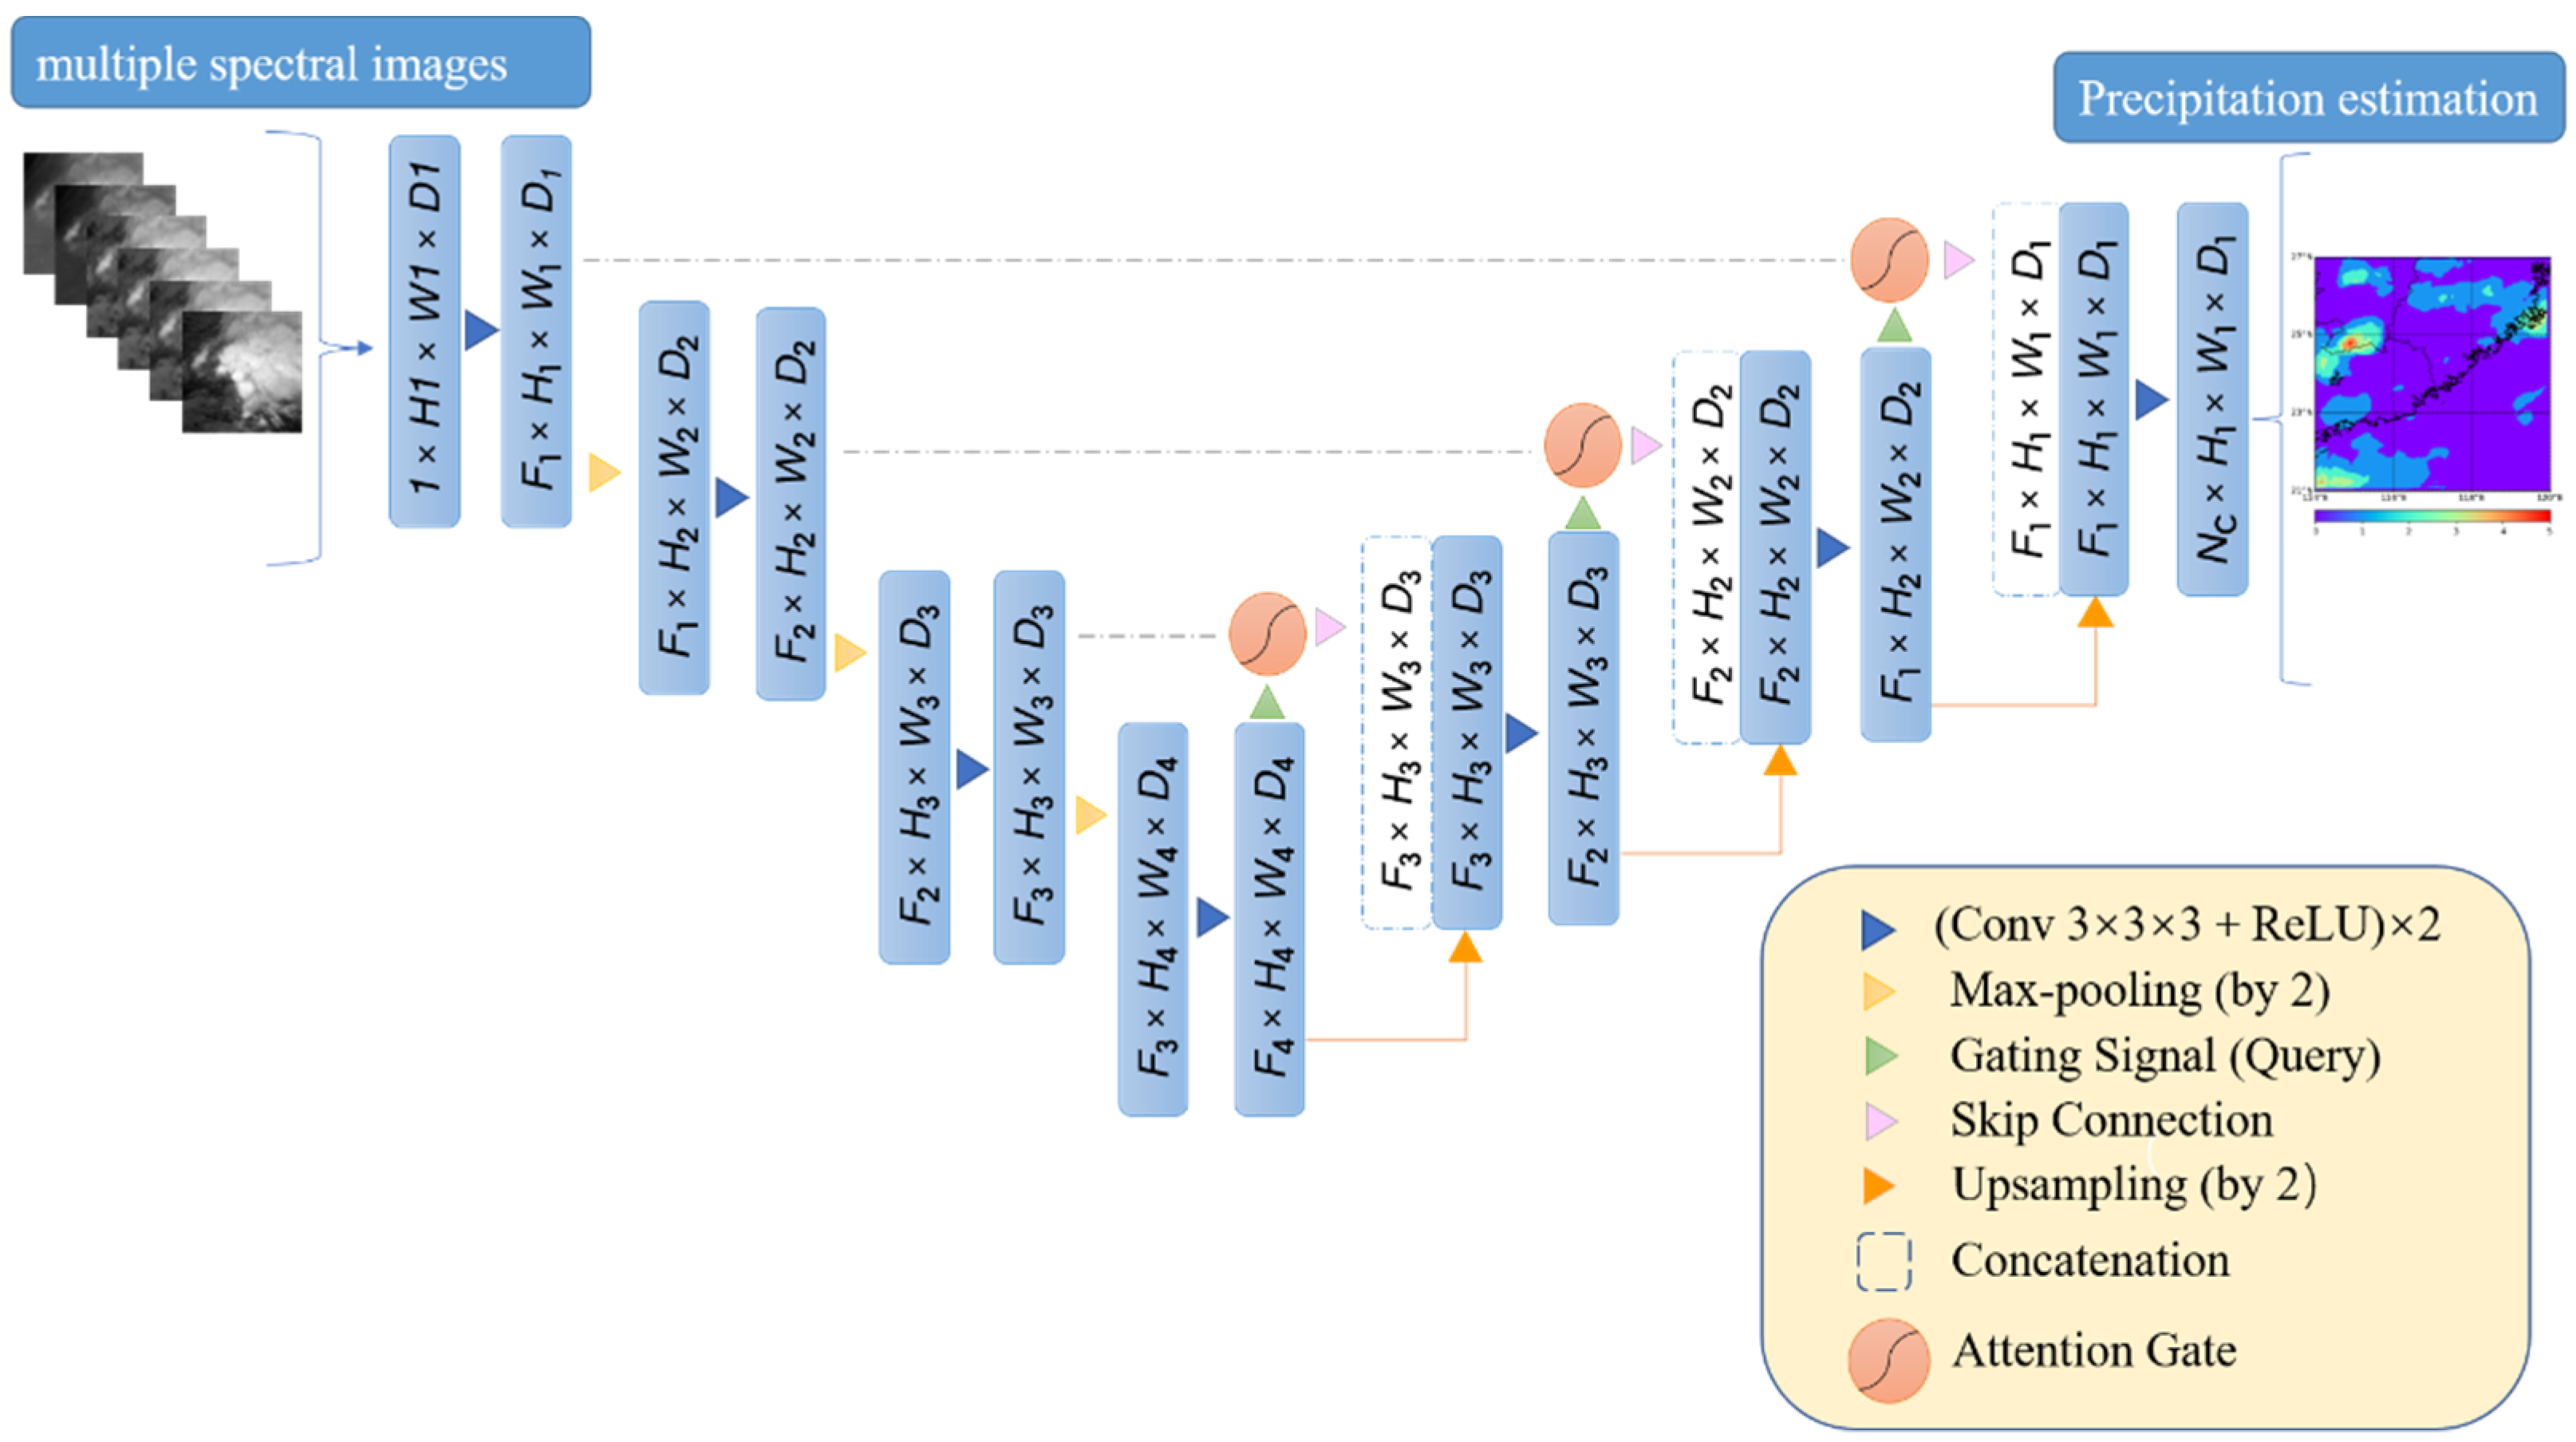
2.2.1. Network Introduction

The deep learning network used in our study is Attention-Unet, which adds Attention Gates in the Decoder module of Unet. The Unet network is famous for its successful application in biomedical segmentation [42], it combines low-resolution information with high-resolution information through skip-connection module connections. Based on the characteristics of Unet, we believe that Unet is suitable for the precipitation estimation of satellite imagery. The specific reasons are as follows: (1) Typical rain clouds are easily distinguished from satellite images and low-resolution information can help identify the principal part of rain clouds. (2) The boundaries of rain clouds in satellite images are blurred and the gradients of boundaries are complex, high-resolution information of satellite images is necessary to obtain an accurate segmentation of rain cloud boundaries.
In 2018, the experiments of Ozan Oktay showed that after incorporating Attention Gates with Unet [43], the model could inhibit the task-independent parts and increase the task-related features during the learning process, and finally the model gets better performance than before.

2.2.2. Network Structure and Parameters

Figure 1 is the structure diagram of Attention-Unet used in our study [43], the model input is six channels of satellite images, and the model output is a precipitation estimation map, both satellite images and precipitation estimation map have the same size which is 300 pixels in width and 300 pixels in height. The spatial resolution of satellite images and precipitation estimation map is 0.02°. The precipitation region and estimated precipitation amounts can be seen in the precipitation estimation map. The Attention-Unet is based on the Unet, the difference between the Attention-Unet and Unet is the decoder module. Different from Unet, in the Attention-Unet the low-dimensional feature information first passes Attention Gate and then gets into the process of Decoder. Specifically, an Attention Gate is used to readjust the output features of Encoder before splicing the features on each resolution of Encoder with the corresponding features in Decoder. The Attention Gate generates a gated signal that controls the importance of features at different spatial locations.

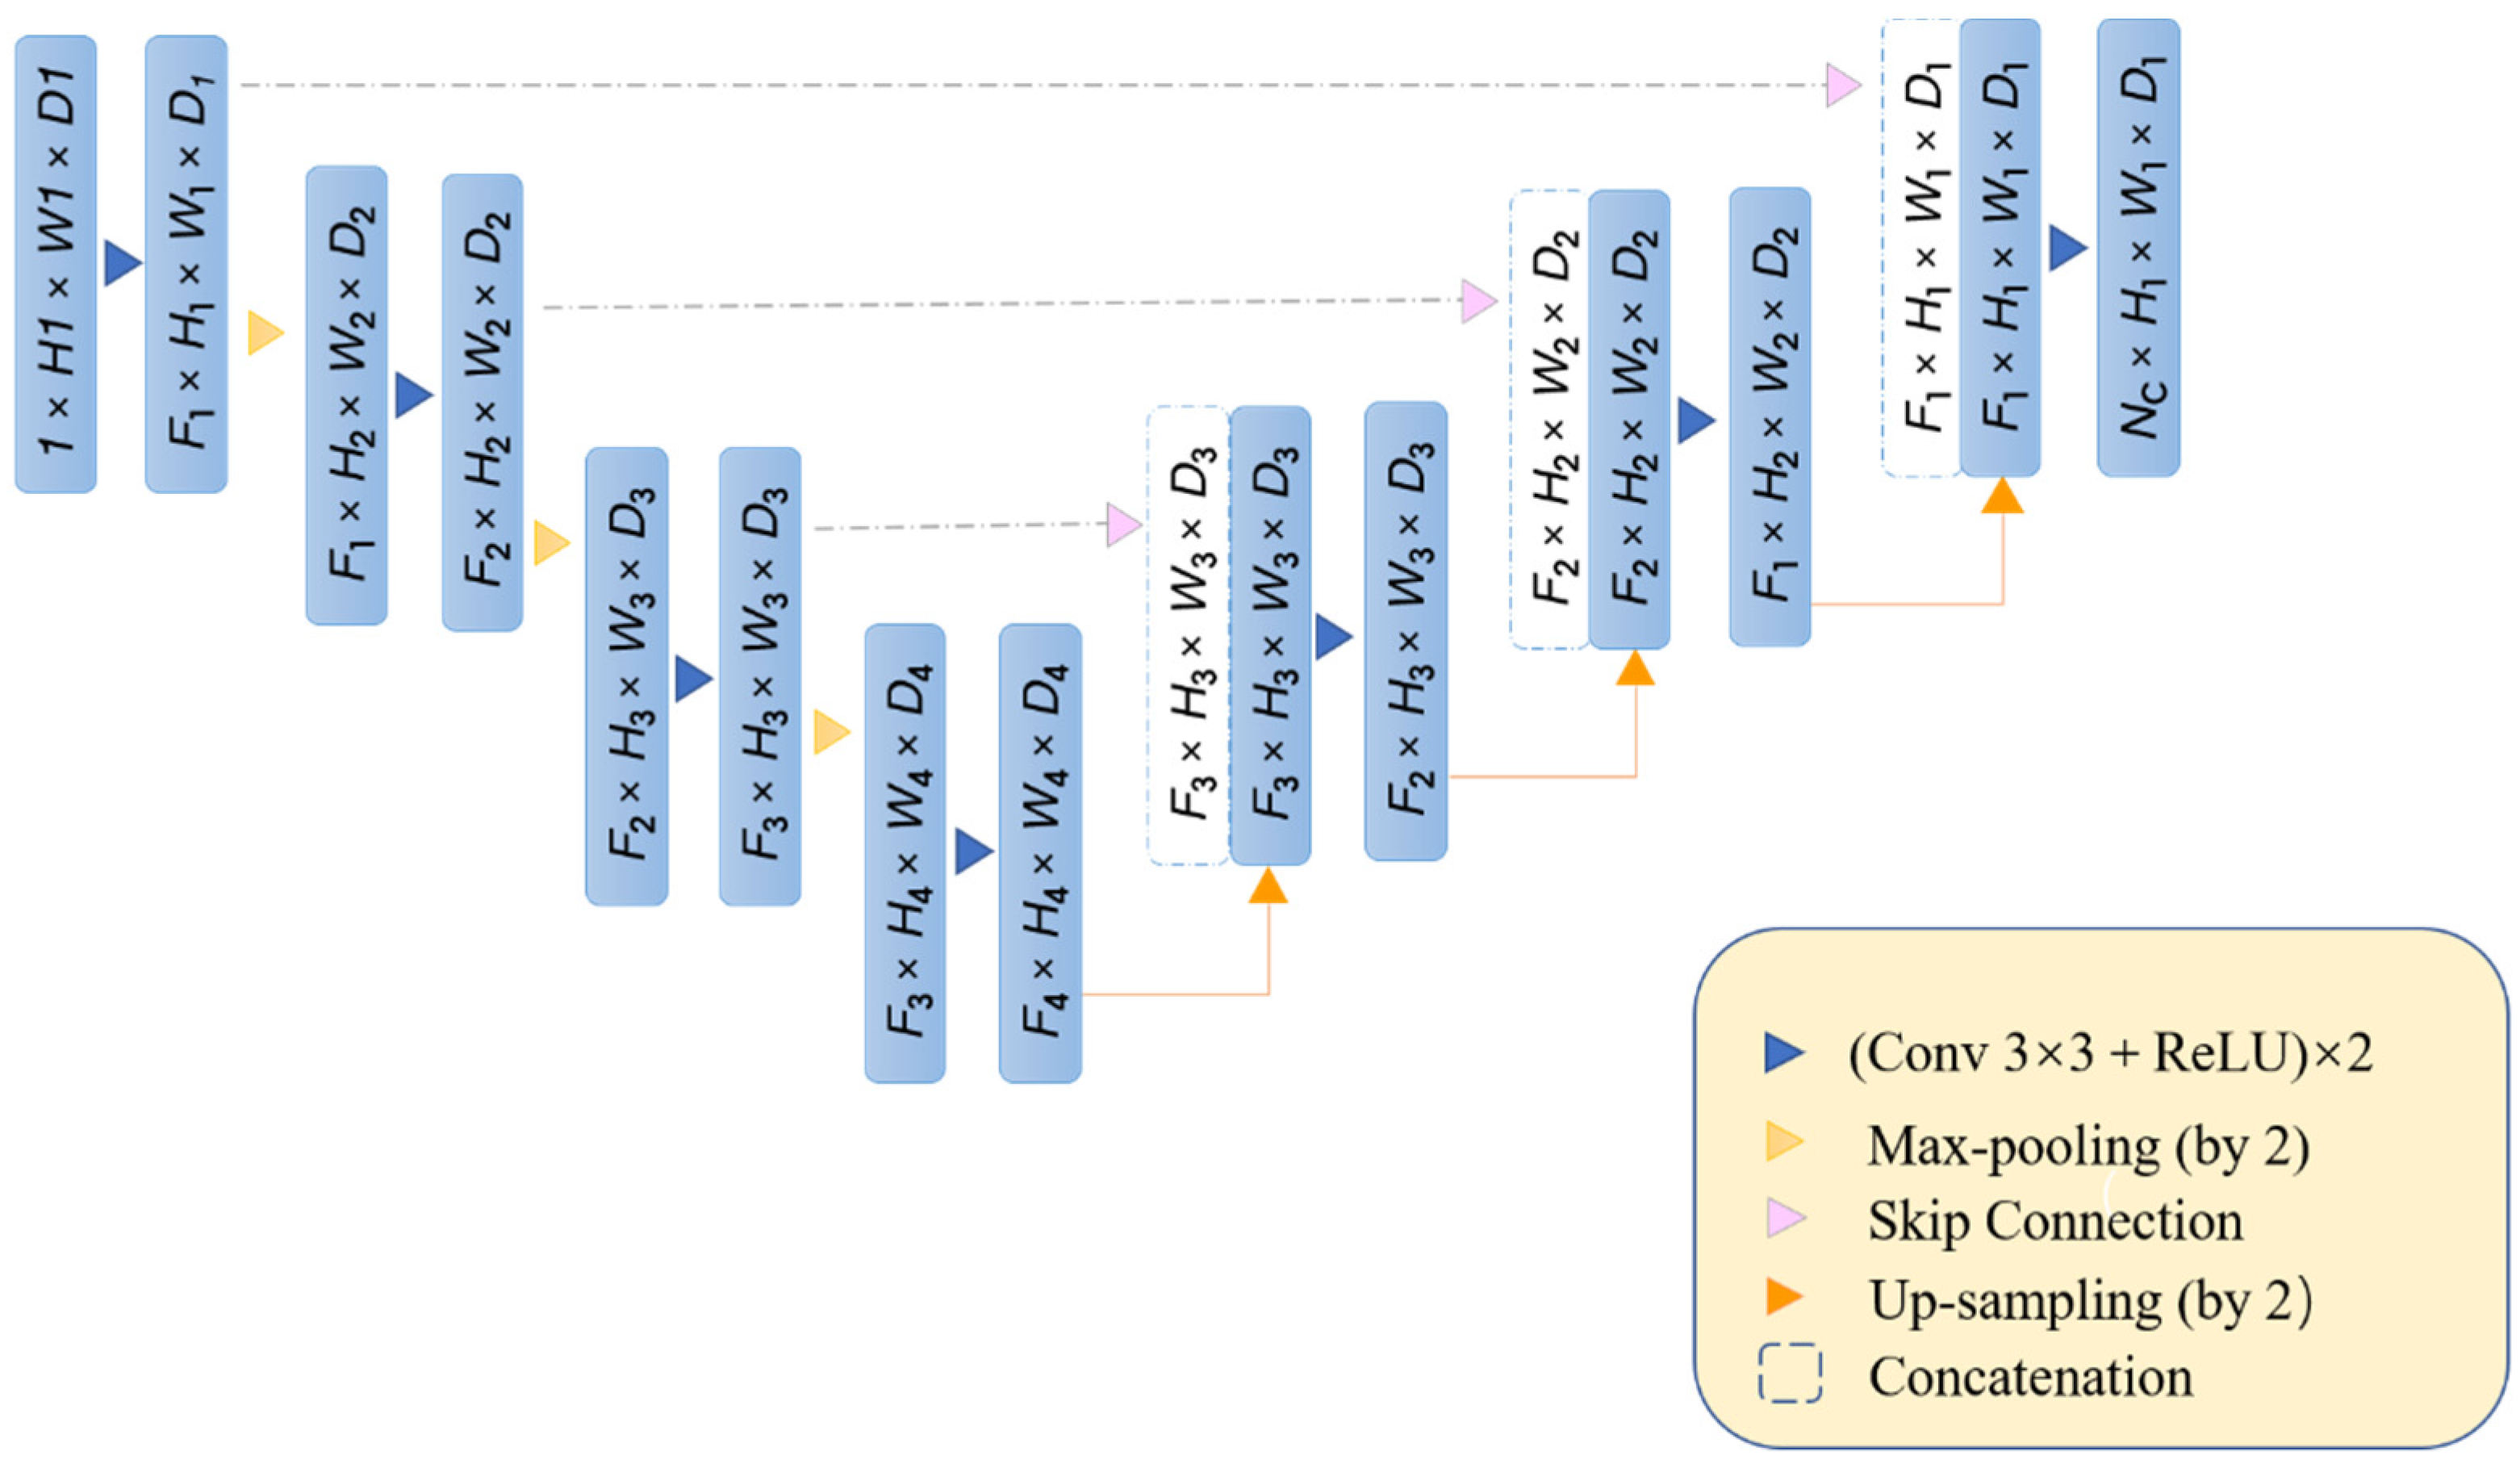
2.2.3. Baseline Models

In addition, two deep learning models are employed as baseline models to compare with the Attention-Unet model.
  • Unet
Unet is developed by Olaf Ronneberger for the application of biomedical segmentation [42]. As shown in Figure 2, the shape of the network resembles the letter ‘U’, so it was named Unet. Unet is made up of the Encoder part and Decoder part. The encoder is responsible for feature extraction, which consists of the convolution layer and pooling layer. For the Decoder part, the key steps are up-sampling and skip-connection. Interpolation is used in the up-sampling process, skip-connection concat the feature information of encoder part with the feature information of up-sampling so as to make the feature map have more low dimensional information of encoder part and enhance the segmentation accuracy. To prove the effectiveness of adding Attention Gate, we selected Unet as the baseline model.
2
PERSIANN-CNN
The PERSIANN-CNN model was developed by MOJTABA SADEGH [32]. As mentioned in the introduction, it uses IR and WV data in a convolutional neural network to detect and estimate the rainfall rate. Mean square error (MSE) was used as the loss function in the PERSIANN-CNN algorithm. The PERSIANN-CNN model uses two convolution layers and two pooling layers to extract data features of WV and IR and then uses a concatenation function to merge the two map features. During the up-sampling stage, a two-dimensional convolutional transpose function and a two-dimensional convolutional function are used two times to output the precipitation estimation data with the same size as the input data. Details of the network structure can be found in their article. Since PERSIANN-CNN shows excellent performance in the precipitation estimation of the GOES satellite, we choose it as the baseline model to evaluate the capability of Attention-Unet.

2.3. Experiment

2.3.1. Data Preprocessing

Before the experiment, we need to preprocess the input data, the main work is as follows: The first work is making the spatial resolution of all used data consistent. The spatial resolution of satellite data is 4 km and the IMERG precipitation data is 0.1° (around 10 km). In order to keep the spatial resolution consistent, we use the bilinear interpolation method to preprocess data and finally both FY4A data and IMERG data with a spatial resolution of 0.02° were obtained. In the evaluation stage, the same method was applicated to FY4A-QPE data and CMORPH data. The second work is time matching. The time resolution of FY4A is about 4.5 min and for IMERG data is 30 min, to make them consistent we only choose the FY4A satellite imageries whose recording time is the same as IMERG data.

2.3.2. Hyperparameters Setting

The initialization weights of the proposed deep learning network obey a normal distribution, then the parameters are optimized using the Adam optimizer [44] to minimize the loss functions for the model. Mean square error was used as the loss function. The initial learning rate is 0.0001, and then the Cosine annealing algorithm is used to adjust the learning rate. The training batch size is 4. The proposed model is trained in the Pytorch framework with a single GPU of NVIDIA Tesla V100-SXM2p.

2.3.3. Evaluation Metrics

We evaluate the performance of precipitation identification and precipitation amounts estimation by two kinds of evaluation metrics, respectively. Classification metrics are used to evaluate precipitation identification performance, including Probability of Detection (POD), False Alarm Ratio (FAR), and Critical Success Index (CSI). In precipitation estimation, if the model or product tends to over-identify the cloud as precipitation, it will lead to a higher POD value and a higher FAR value. Conversely, it will lead to a lower POD value and a lower FAR value, CSI represents the model’s or product’s comprehensive performance of POD and FAR. Regression metrics are used to evaluate precipitation amounts estimation performance, including the Root Mean Square Error (RMSE) and the Pearson correlation coefficient (CC) [45]. The metrics mentioned above are shown in Table 2 and Table 3.

2.3.4. Training Data and Precipitation Threshold Selection

After preprocessing the data, we have a total of 40 months of data from April 2018 to July 2021. Data from June to August 2020 are used as testing data set to evaluate the model. The other data were divided into training data (80%) and validation data (20%). For the precipitation threshold, 0.5 mm per hour is often taken as the threshold of precipitation identification [31]. In our study, the precipitation threshold selected is 0.2 mm per hour, lower threshold means the model’s ability to capture precipitation is more accurate than the common precipitation threshold.

3. Results

In this section, we evaluate the performance of the Attention-Unet model in long-term verification periods and an extreme precipitation event, in comparison with two operational near-real-time satellite-based precipitation products and two baseline deep learning models. The definitions of the metrics used for verification are presented in Section 2. For all metrics, we also present the performance gain or loss with respect to the FY4A-QPE product and the Unet model.

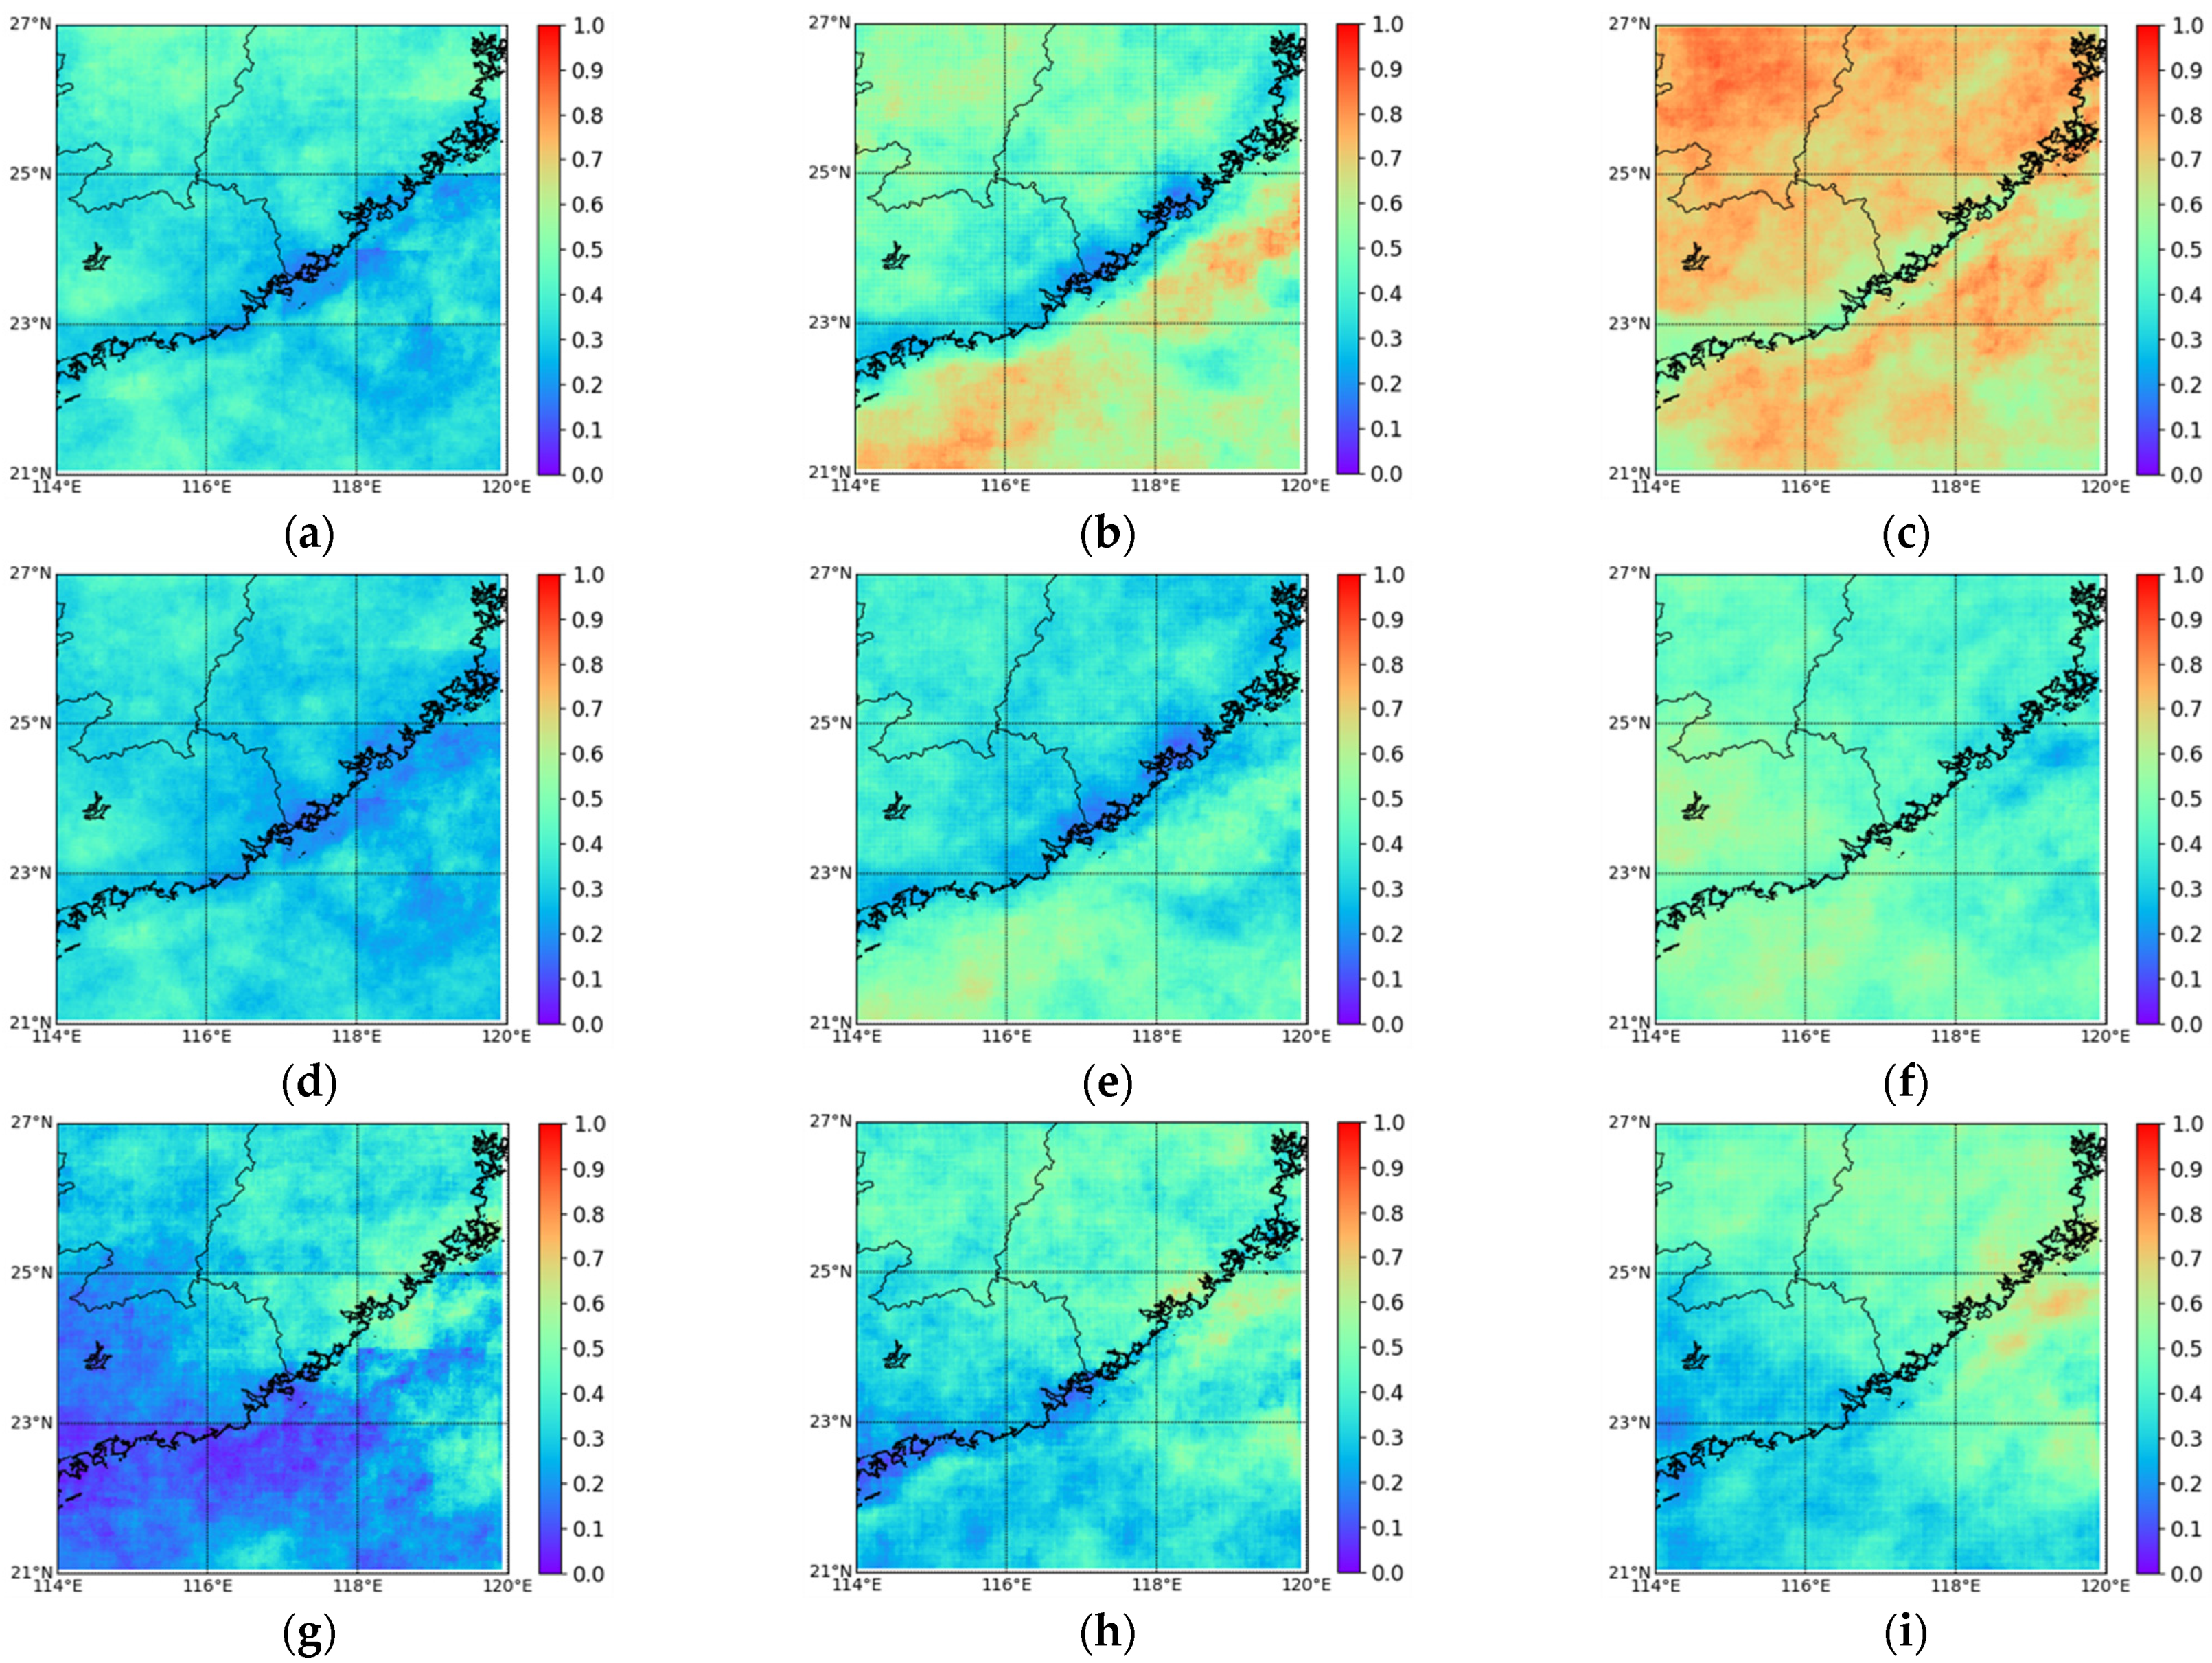
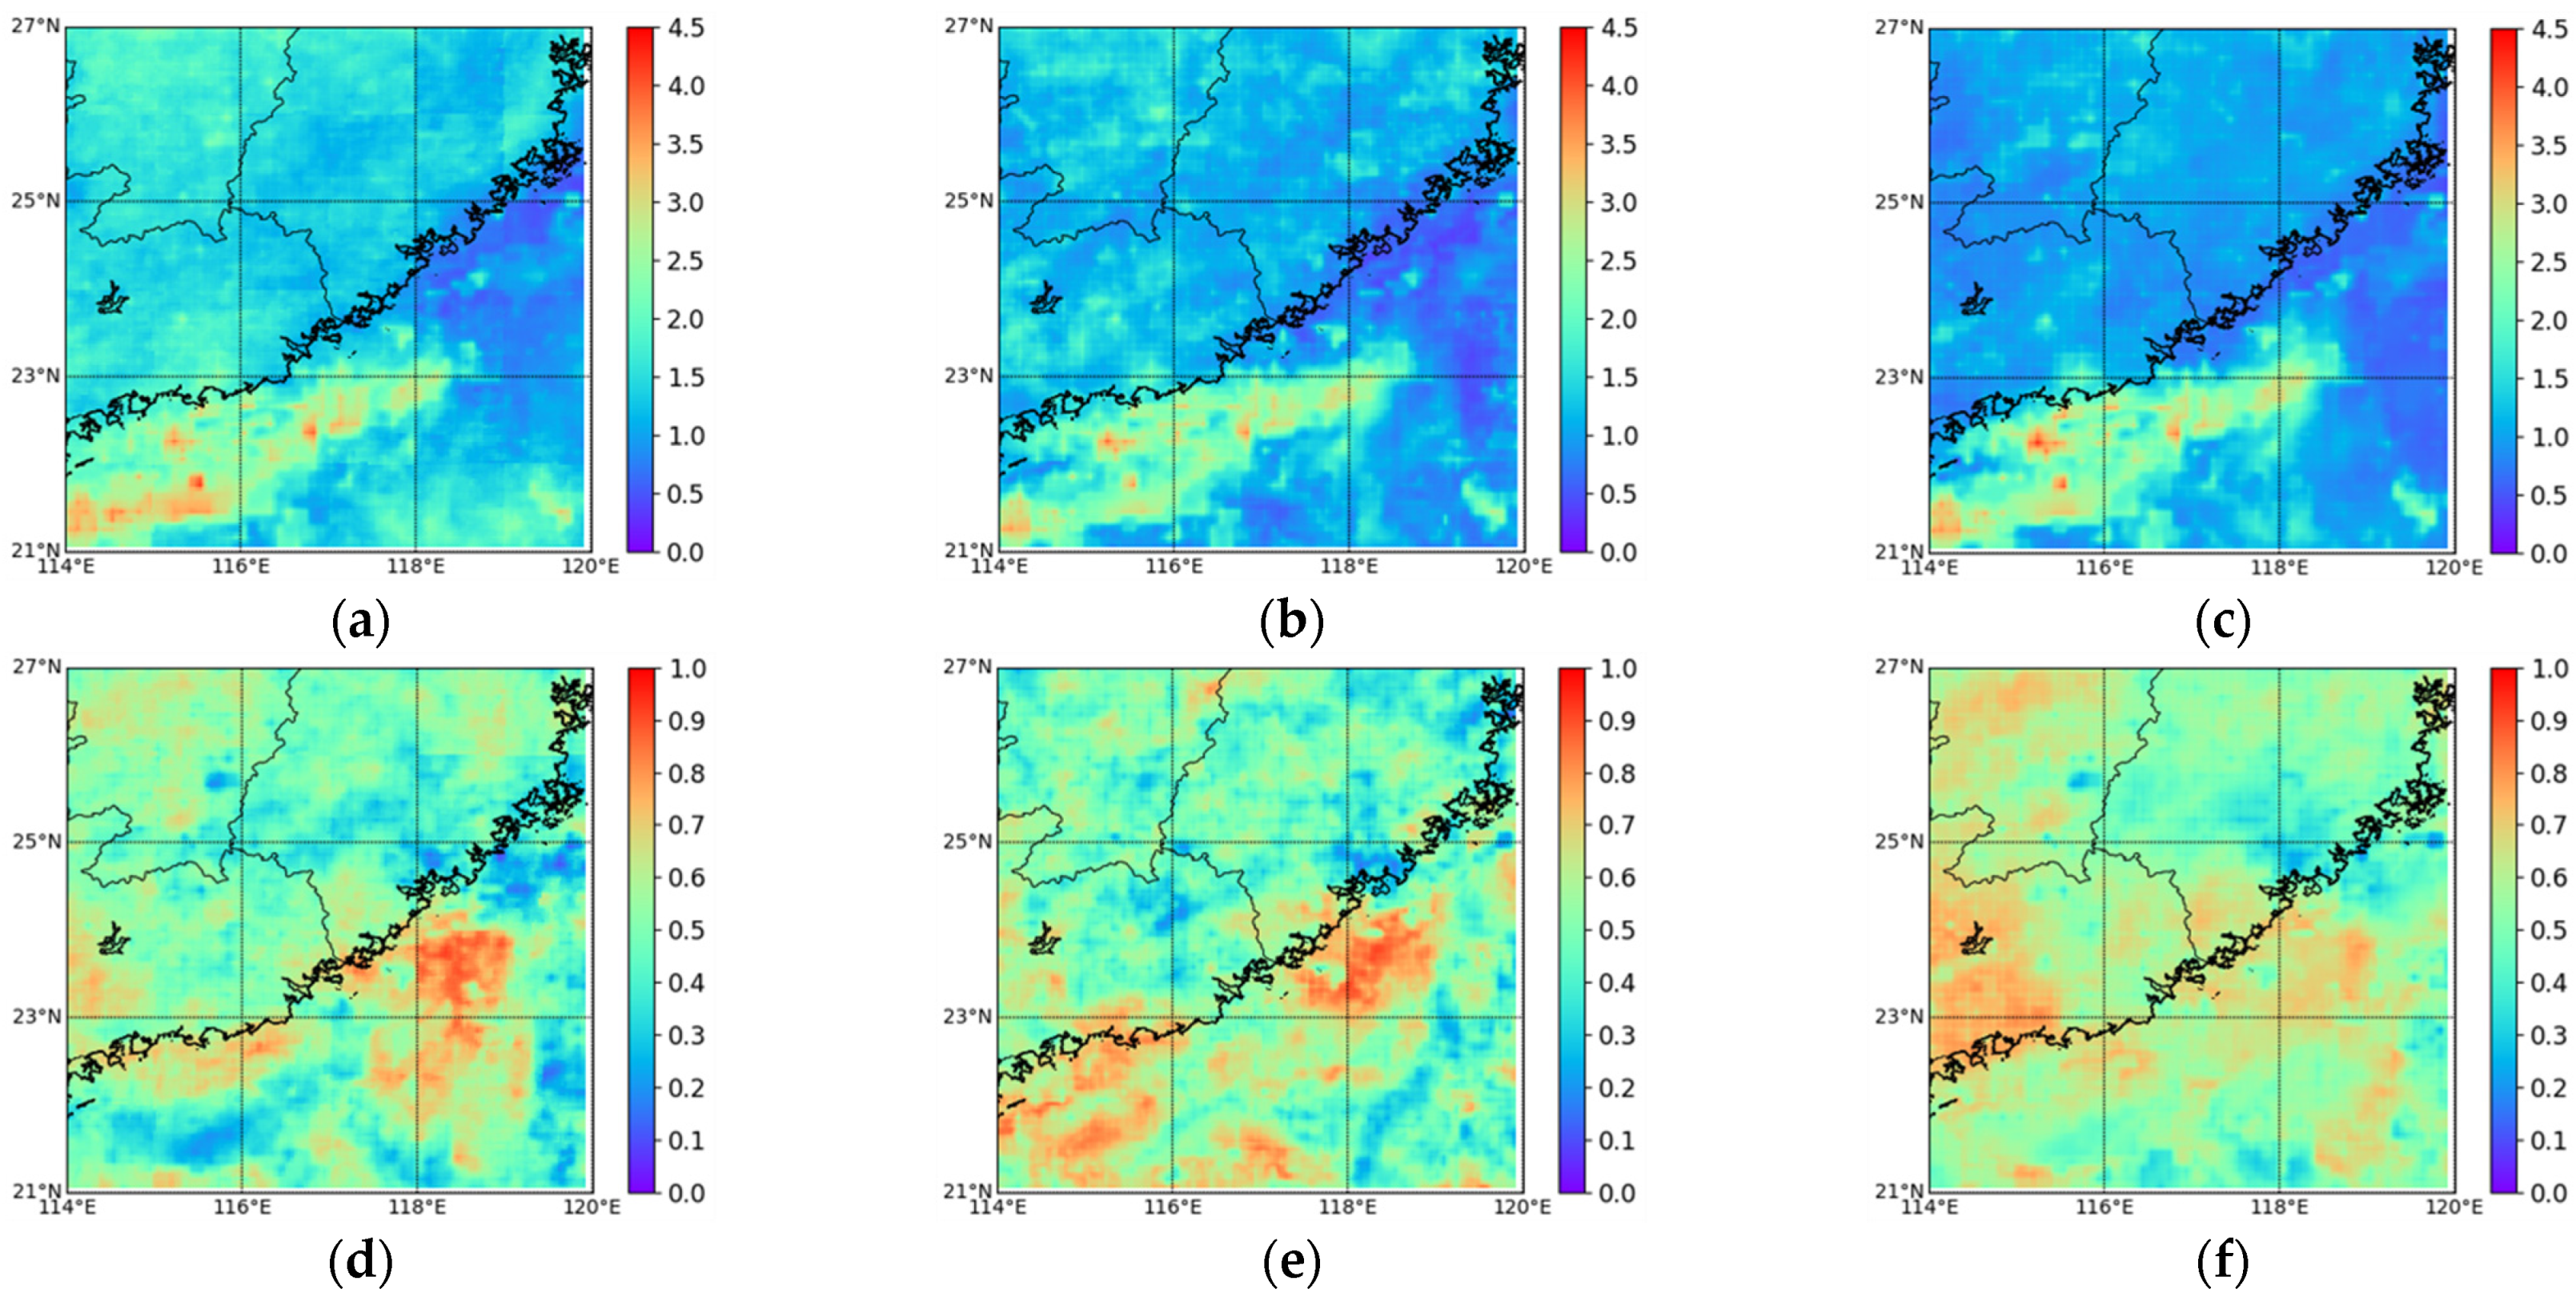
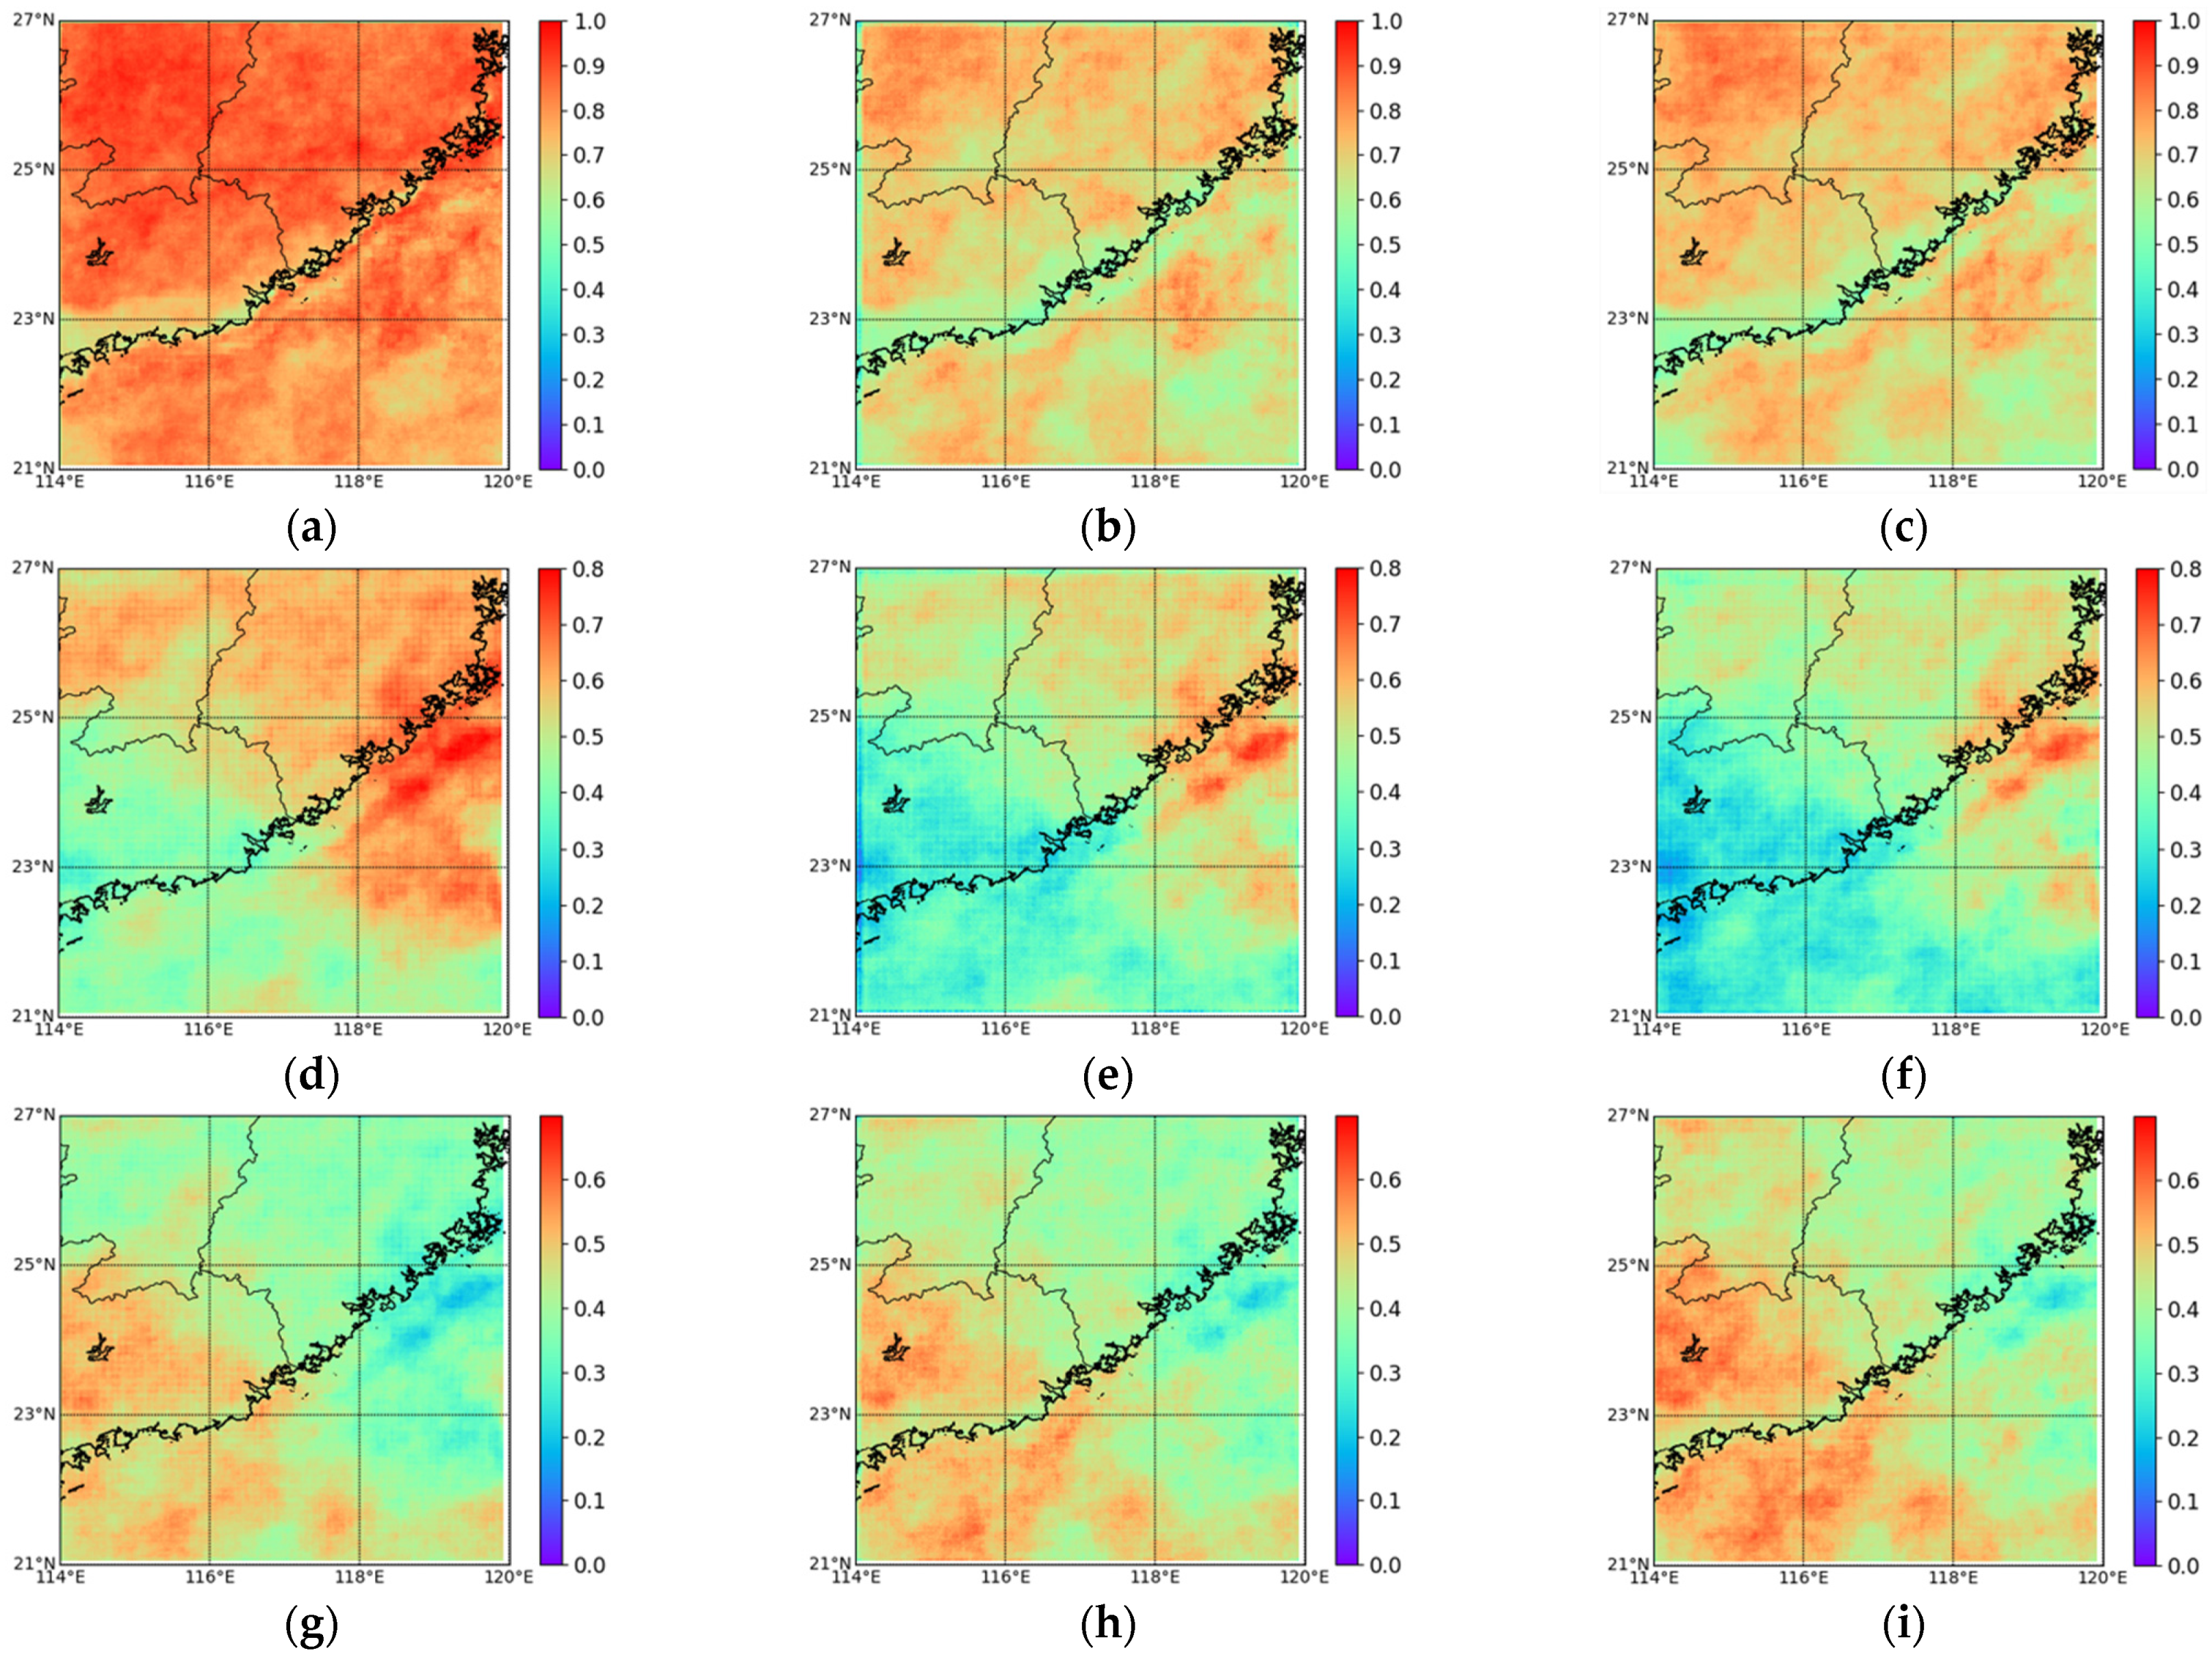
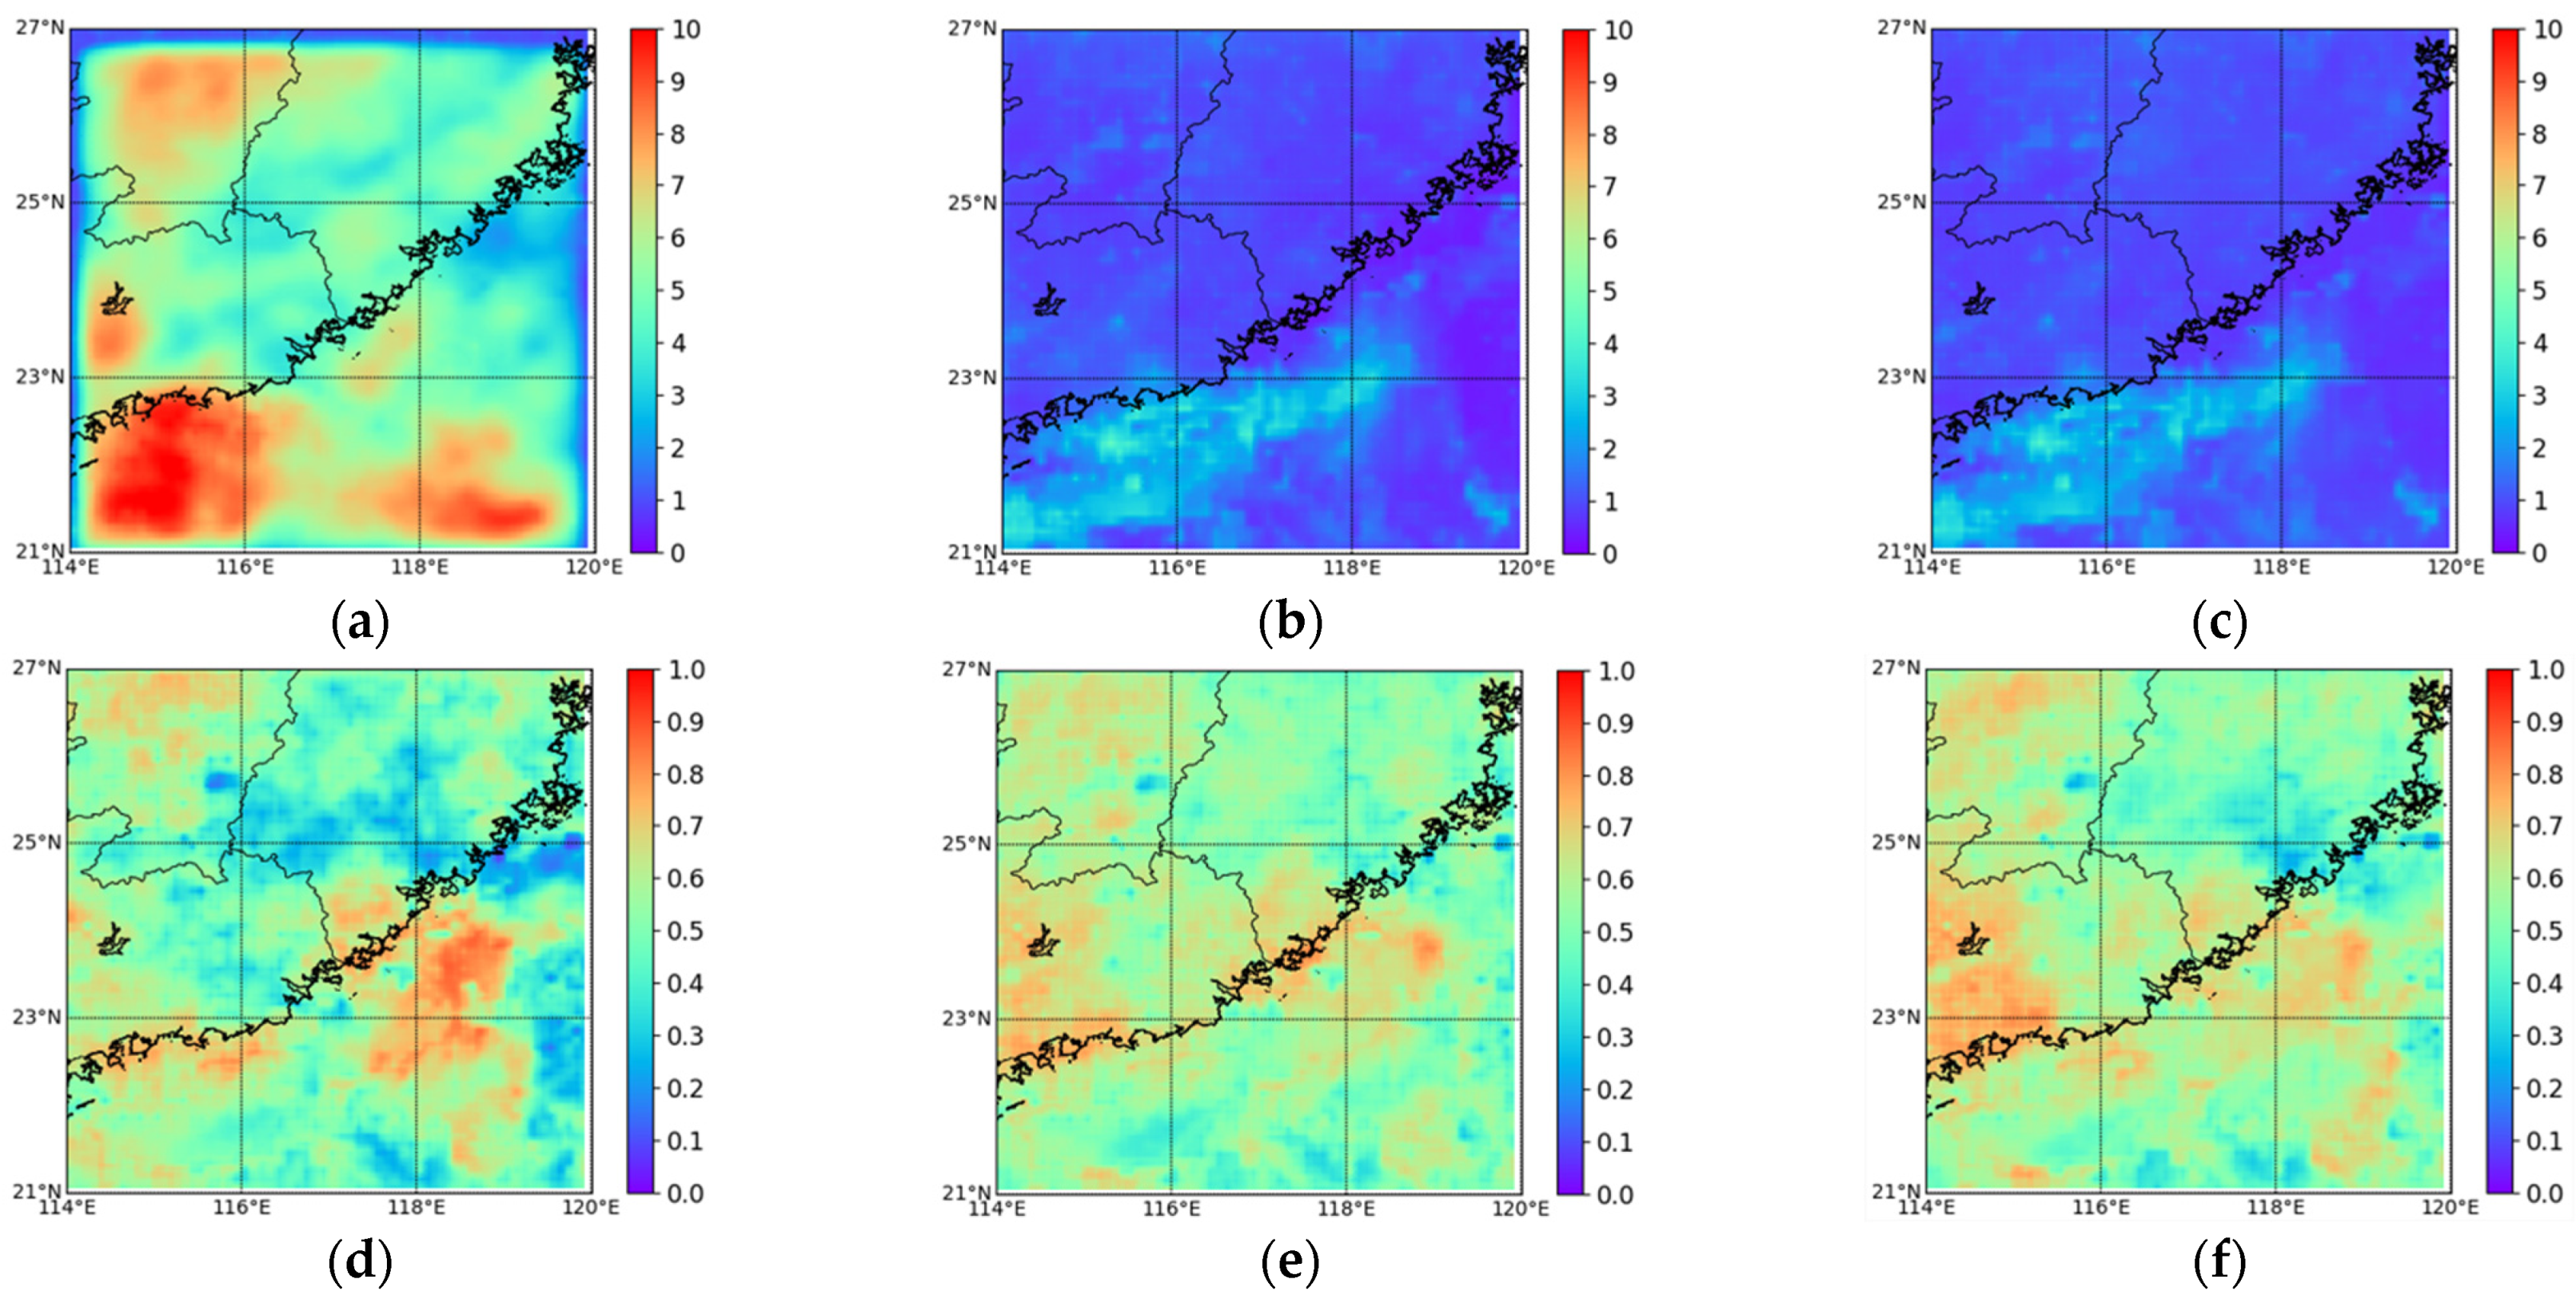
3.1. Comparison with Operational Precipitation Products

Table 4 summarizes the overall precipitation identification performance of the FY4A-QPE product, CMORPH product and the Attention-Unet model over the verification periods (June–August 2020) of the southeastern coast of China (21°–27°N, 114°–120°E). The Attention-Unet model shows the best performance gain (57.22% in CSI) in precipitation identification compared to the other two products (0.283 compared to 0.180 and 0.220). The CMORPH product has a 40.09% performance improvement in POD compared to FY4A-QPE (0.311 compared to 0.222), while the Attention-Unet model has a 113.06% performance improvement in POD compared to FY4A-QPE (0.473 compared to 0.222), it is a great improvement obviously. As the CMORPH product and Attention-Unet model obtain a higher score in CSI and POD, the score of FAR shows lower. The CMORPH product has a 35.48% performance loss in FAR compared to FY4A-QPE (0.569 compared to 0.420), and the Attention-Unet model has a 33.11% performance loss in FAR compared to FY4A-QPE (0.559 compared to 0.420). The overall promising performance demonstrates the superiority of the Attention-Unet model in precipitation identification.
Table 5 provides the overall precipitation estimation performances of FY4A-QPE, CMORPH and the Attention-Unet model over the verification periods of the southeastern coast of China (21°–27°N, 114°–120°E). The Attention-Unet model has significant improvement in all measurements, compared to the FY4A-QPE precipitation product. The Attention-Unet model reduces average RMSE by 23.21% (0.751 compared to 0.978) and the CMORPH Product reduces average RMSE by 14.92% (0.832 compared to 0.978). At the same time, the Attention-Unet model has a 37.04% performance gain in the Pearson’s correlation coefficient (CC), compared to the FY4A-QPE product (0.370 compared to 0.270), The overall performance demonstrates the ability of the Attention-Unet model to estimate precipitation amounts more accurately.
Figure 3 presents the maps of POD, CSI, and FAR of the FY4A-QPE, CMORPH product and Attention-Unet model over the southeastern coast of China (21°–27°N, 114°–120°E) in the verification periods. The warm colors indicate high measurement values, while cold colors indicate low measurement values. High values are desirable for POD and CSI, while low values are desirable for FAR. Compared with the FY4A-QPE product and CMORPH product, the Attention-Unet model shows significant improvement in POD (Figure 3a–c), especially the improvement is uniform. The improvement of the CMORPH product over the FY4A-QPE product is reflected in the ocean area, while the Attention-Unet model is not only the ocean areas but also the land areas. For CSI, Figure 3d–f show that the Attention-Unet model uniformly outperforms FY4A-QPE product and CMORPH product over the land and ocean areas. Compared with the FY4A-QPE product, we find that the CMORPH product has an obvious improvement in the southwest ocean, however, in the southwest land, no significant improvement can be visually distinguished. However, we can find that the Attention-Unet model not only has a significant improvement in the southwest ocean but also the southwest land. This finding demonstrates the model’s ability to extend to different surfaces of the earth. For FAR (Figure 3g–i), the performance of the Attention-Unet model is almost the same as CMORPH, which is consistent with the FAR values presented in Table 4 (0.5686 and 0.5588 for CMORPH and Attention-Unet model, respectively), the score of both CMORPH and Attention-Unet model is lower than FY4A-QPE product. Overall, the Attention-Unet model’s performance improvements are significant and consistent geographically for both land and ocean areas.
Figure 4 presents the maps of RMSE and Pearson correlation coefficient of the FY4A-QPE product, CMORPH product and the Attention-Unet model over the southeastern coast of China (21°–27°N, 114°–120°E) in the verification periods. The warm colors indicate high measurement values, while cold colors indicate low measurement values. High values are desirable for the Pearson correlation coefficient, while low values are desirable for RMSE. Figure 4a–c show that there are some decreases in RMSE throughout the whole map for the Attention-Unet model, compared to the FY4A-QPE product and CMORPH product. In addition, we can find that most decreases are concentrated upon the land. For the Pearson correlation coefficient, Figure 4d–f show that the Attention-Unet model uniformly outperforms FY4A-QPE product and CMORPH product over the map, and an obvious improvement can be observed over the mid-western part of the map, centered around Guangdong province. In summary, compared to the FY4A-QPE product and CMORPH product, a consistent improvement can be found in the RMSE and Pearson correlation coefficient of the Attention-Unet model across the map. The overall performance demonstrates the ability of the Attention-Unet model to estimate precipitation amounts more accurately.
In order to demonstrate the performance of the Attention-Unet model on specific events that happened in uncalibrated areas. We select an extreme precipitation event to test it. In 2021, from July 18 to 21, China’s Henan Province experienced extreme rainfall, which is rare across the history of Henan Province. Figure 5 presents precipitation identification results for the FY4A-QPE product, CMORPH product and the Attention-Unet model in the 0430 UTC 19 July 2021. The green represents hit, the blue represents the false detection, and the red represents miss. The white color indicates that less than 0.1 mm of precipitation was observed at that location during the corresponding period. It is obvious that only small sections of rainfall are correctly identified by the FY4A-QPE product. For the CMORPH product, it is not only missing half of the rainfall areas but also makes plenty of false detections; more pixels with false detection of rainfall are observed in the CMORPH product than in the other two. Compared to the FY4A-QPE product and CMORPH product, the Attention-Unet model can reduce the missing rainy pixels and shows a significant improvement in delineating the precipitation area, represented by green pixels. The overall performance demonstrates that the Attention-Unet model captures the precipitation coverage more effectively and more accurately and means the Attention-Unet model can extract more useful precipitation-related features from satellite information that FY4A-QPE product and CMORPH product fail to extract.
Table 6 provides detailed values of CSI, POD, and FAR for the FY4A-QPE product, CMORPH product and the Attention-Unet model from July 18 to 21, 2021 over the main coverage area of the extreme precipitation event. For CSI, the Attention-Unet model has the best performance compared to the FY4A-QPE Product and CMORPH Product (0.570 compared to 0.420 and 0.161). The CMORPH product has a 43.76% decrease in POD compared to FY4A-QPE (0.257 compared to 0.457), while the Attention-Unet model has a 59.52% increase compared to the FY4A-QPE product (0.729 compared to 0.457), the experimental result shows great superiority of the Attention-Unet Model in POD. In the evaluation of FAR, the FY4A-QPE product has the best performance (0.156), and the CMORPH product has the worst performance (0.698), while the performance of the Attention-Unet model is similar to the FY4A-QPE product (0.265 compared to 0.156). The experimental results show that the FY4A-QPE product seems conservative in precipitation identification, which leads to missing some precipitation pixels, owing to this reason it shows good performance in the evaluation of FAR. The performance of the CMORPH product is consistent with Figure 4, which shows a lot of false detection and missing many precipitation pixels, the lowest score of CSI validates this result. The overall performance of precipitation identification in extreme precipitation events demonstrates that the Attention-Unet model is more balanced and stable compared to the other two precipitation products.
The specific performance for precipitation amounts estimation is displayed in Table 7. As shown in Table 7, the Attention-Unet model has the best performance in all measurements. Firstly, the Attention-Unet model reduces average RMSE by 84.23% (2.519 compared to 15.976), which means a minimum error in precipitation amounts estimates. Secondly, the Attention-Unet model has the highest score in the correlation coefficient (0.616 compared to 0.590 and −0.086), which indicates that the precipitation amounts estimated by the Attention-Unet model have the best correlation with true precipitation amounts.

3.2. Comparison with Baseline Deep Learning Models

Table 8 summarizes the overall precipitation identification performance of Unet, PERSIANN-CNN and Attention-Unet over the verification periods (June–August 2020). For POD and FAR, the Unet model performed best in POD and worst in FAR meanwhile (0.606 in POD and 0.681 in FAR), which means that Unet tended to over-identified cloud-covered areas as precipitation areas. Compared to Unet, PERSIANN-CNN and Attention-Unet are relatively balanced. They performed almost equally in identifying the precipitation area (0.476 and 0.473 in POD), meanwhile, the false alarm rate of Attention-UNet is lower than PERSIANN-CNN (0.559 compared to 0.600), which indicates that Attention-Unet is more balanced and stable. The evaluation score of three deep learning models in CSI validates the result mentioned above. The Attention-Unet model shows best in CSI compared to Unet and PERSIANN-CNN (0.283 compared to 0.267 and 0.274). The overall results demonstrate that Attention-Unet performed better than two baseline deep learning models in delineating precipitation regions.
Table 9 provides the overall precipitation amounts estimation performances of Unet, PERSIANN-CNN and Attention-Unet over the verification periods (June–August 2020). For RMSE, Unet showed relatively high errors and fluctuations in precipitation amounts estimation. The PERSIANN-CNN and the Attention-Unet model performed similarly and both better than Unet. They reduced average RMSE by 75.30% (0.709 compared to 2.871) and 73.84% (0.751 compared to 2.871), respectively. In the evaluation result of CC, the precipitation amounts estimated by three models both showed a relatively high correlation with truth precipitation amounts, among three models Attention-Unet performed best (0.370 compared to 0.357 and 0.368).
Figure 6 presents the maps of POD, FAR and CSI of the Unet, PERSIANN-CNN and the Attention-Unet model over the southeastern coast of China (21°–27°N, 114°–120°E) during the verification periods. The colors and the information corresponding to colors are the same as the description mentioned in Figure 2. Compared with PERSIANN-CNN and Attention-Unet, the Unet shows a higher value in POD (Figure 6a–c) among the whole map, meanwhile, the average FAR of Unet is also much higher than the other two. The color difference in Figure 6b,c indicates that the Attention-Unet model outperforms PERSIANN-CNN in POD over the whole validate areas. Similarly, for Figure 6d–f, more cold color pixels of the Attention-Unet map indicate that Attention-Unet performed better than the other two models in FAR. For CSI, Figure 6g–i show that the Attention-Unet model uniformly outperforms Unet model and PERSIANN-CNN model over the land and ocean areas, which demonstrates that the Attention-Unet model can be applicated better than the other two models on different surfaces of the earth. Overall, the Attention-Unet model performed more balanced and better for both land and ocean areas among the three deep learning models.
Figure 7 presents the maps of RMSE and CC of the Unet, PERSIANN-CNN and the Attention-Unet model over the southeastern coast of China (21°–27°N, 114°–120°E) during the verification periods. The colors and the information corresponding to colors are the same as the description mentioned in Figure 4. For Figure 7a–c, it is obvious that Unet shows a much higher RMSE value than PERSIANN-CNN and Attention-Unet among the whole map except for the edge of validating areas. The PERSIANN-CNN and the Attention-Unet model performed similarly and both better than Unet. They showed relatively high RMSE value in the ocean areas located in the southwest part of the map. For the Pearson correlation coefficient, precipitation amounts estimated by Unet showed a relatively high correlation with true precipitation amounts in the mid-eastern ocean areas, but a low correlation in the land. In contrast to Unet, PERSIANN-CNN and Attention-Unet are more balanced. Precipitation amounts estimated by PERSIANN-CNN and Attention-Unet showed a relatively high correlation with true precipitation amounts in both land and ocean. The color differences of Figure 7e,f indicate that the average CC value of Attention-Unet is higher than PERSIANN-CNN. In addition, more warm color pixels of the Attention-Unet map represent that Attention-Unet performed better in more widely regions. The overall performance demonstrates that the Attention-Unet model can estimate precipitation amounts more accurately.
Figure 8 presents precipitation identification results for the Unet, PERSIANN-CNN and the Attention-Unet model at the 0430 UTC 19 July 2021. It is obvious that Unet can identify almost all precipitation areas correctly, but the number of false detection pixels of Unet is the largest among the three deep learning models. This indicates that Unet has the problem of over-identifying clouds as precipitation and is unable to accurately delineate precipitation areas. Compared to the Unet, PERSIANN-CNN and Attention-UNet performed better, reducing false detection while identifying major precipitation areas. In contrast to PERSIANN-CNN, Attention-Unet has fewer false detection pixels and identifies the edge of precipitation areas sharper, while the PERSIANN-CNN performed ambiguously. The overall performance demonstrates that the Attention-Unet model delineates the precipitation areas more effectively and accurately in extreme precipitation events compared with baseline deep learning models.
Table 10 provides detailed values of POD, FAR and CSI for the Unet, PERSIANN-CNN and the Attention-Unet from July 18 to 21, 2021 over the main coverage area of the extreme precipitation event. The Unet model performed best in POD but worst in FAR (0.889 in POD and 0.451 in FAR), which is consistent with the results shown in Figure 6 and Table 8. PERSIANN-CNN and Attention-Unet are relatively stable and balanced, they performed the same in POD, but the FAR of Attention-Unet is lower than PERSIANN-CNN (0.265 compared to 0.292). For CSI, Attention-Unet has the best performance compared to Unet and PERSIANN-CNN (0.570 compared to 0.540 and 0.558), which denotes that Attention-Unet can delineate precipitation areas more effectively among three deep learning models in extreme precipitation events.
The specific performance of deep learning models for precipitation amounts estimation is displayed in Table 11. Among three deep learning models, Unet performed worst in precipitation amounts estimation (13.274 in RMSE), Attention-Unet performed best and reduce average RMSE by 81.02% compared to Unet Model (2.519 compared to 13.274). In the evaluation of CC, the precipitation amounts estimated by Attention-Unet show the highest consistency and correlation with true precipitation amounts, which is 36.28% higher than Unet (0.616 compared to 0.452). The overall evaluation results show that Attention-Unet performs best in precipitation amounts estimation of the extreme precipitation event.

4. Discussion

In this work, we applicated Attention-Unet to accurately estimate FY4A satellite-based precipitation. Two experiments including a long-term validation period and an extreme precipitation event are selected to evaluate the performance of the model. Our discussions are based on the experiment results.
We use classification metrics and regression metrics to evaluate our proposed model’s effectiveness in precipitation identification and precipitation amounts estimation, respectively. In the comparison of Attention-Unet with operational precipitation products, the Attention-Unet model shows significant improvements in both precipitation identification and precipitation amounts estimation over the study area of the southeastern coast of China. In the precipitation identification, the performance gain in CSI for the Attention-Unet model is 57.22%, compared to the FY4A-QPE product. In precipitation amount estimation, the Attention-Unet model is 23.21% lower in average RMSE and 37.04% higher in Pearson correlation coefficient compared to the FY4A-QPE product. In the evaluation of an extreme precipitation event, even though in uncalibrated areas the Attention-Unet model also shows the best performance compared to the FY4A-QPE product and CMORPH product. In the comparison of Attention-Unet with two baseline deep learning models, Attention-Unet performed more balanced and stable in precipitation identification and precipitation amounts estimation. This result was demonstrated in the experiment of extreme precipitation event, Attention-Unet outperformed in precipitation identification (0.570 in CSI) and precipitation amounts estimation (2.519 in RMSE and 0.616 in CC) among three deep learning models. The contrast of Attention-Unet with Unet indicates that adding Attention Gate on Unet plays an important role in satellite-based precipitation estimation, Attention Unet is more suitable for satellite precipitation estimation. In addition, we find that deep learning models generally performed better than operational satellite precipitation products in our experiments.
The experimental results verify the direction for improving the accuracy of satellite precipitation products mentioned in the introduction. In this study, the FY4A satellite’s multi-spectral data represent the most advanced meteorological satellite data in China and the selected Attention-Unet network is an advanced deep learning methodology that is suitable for satellite precipitation estimation, finally, the experimental results demonstrated the universal superiority of the Attention-Unet model over the operational precipitation products and two baseline deep learning models. The results of our experiments have positive significance for future research on satellite precipitation estimation.
There are also some research opportunities left for futural exploration. Firstly, the instantaneous satellite data and 30 min-cumulative precipitation data may not be the best pairs to build a relationship, we will choose the precipitation data which has a higher temporal resolution for experiments in the future. Secondly, the precipitation estimation model should be conducted over a larger study area with longer training and verification periods to make the model have better stability. Thirdly, we can make full use of data related to precipitation in the future, such as the brightness temperature difference between channel 13 and channel 10 of the FY4A satellite, whose value becomes positive when there is heavy precipitation.

5. Conclusions

In this study, the application of Attention-Unet in detecting and estimating precipitation from the FY4A satellite’s multi-spectral information was explored. Experiments show that the Attention-Unet model can effectively delineate the precipitation area and estimate precipitation amounts. The effectiveness of the Attention-Unet model is fully demonstrated by comparing it with two operational precipitation products and two baseline deep learning models. Experimental results of extreme precipitation events show that the trained Attention-Unet model has a pretty good generalization ability. The current application of advanced deep learning algorithms toward supporting FY4A satellite to develop effective precipitation retrieval algorithms. In the future, we are interested in exploring adding some physical data related to the formation of precipitation to solve the limitation of only considering spectral information and introducing a more advanced deep learning algorithm to improve the performance of satellite-based precipitation estimation. Further experiments are required for the preparation of the model to serve as an operational product.

Author Contributions

Conceptualization, J.G.; methodology, X.W. and F.Z.; data curation, Z.L. and Y.G.; writing—original draft preparation, Y.G.; writing—review and editing, J.G. and Y.G.; funding acquisition, J.G. All authors have read and agreed to the published version of the manuscript.

Funding

This research was funded by the National Natural Science Foundation of China under Grant 41975066 and Grant 42005053, and by the Research Project of National University of Defense Technology under Grant ZK21-46.

Data Availability Statement

The FY4A data and FY4A-QPE data used in this paper was obtained from National Satellite Meteorological Center and are available at http://satellite.nsmc.org.cn/PortalSite/Data/Satellite.aspx with the permission of National Satellite Meteorological Center. The IMERG data used in this paper was obtained from NASA’s GLOBAL PRECIPITATION MEASUREMENT and are available at https://gpm.nasa.gov/data/directory with the permission of NASA’s GLOBAL PRECIPITATION MEASUREMENT. The CMORPH data used in this paper was obtained from University Corporation for Atmospheric Research and are available at https://rda.ucar.edu/datasets/ds502.0/index.html#sfol-wl-/data/ds502.0?g=22016 with the permission of University Corporation for Atmospheric Research (all accessed on 15 June 2022).

Conflicts of Interest

The authors declare no conflict of interest.

References

  1. Hong, Y.; Gochis, D.; Cheng, J.-T.; Hsu, K.-L.; Sorooshian, S. Evaluation of PERSIANN-CCS Rainfall Measurement Using the NAME Event Rain Gauge Network. J. Hydrometeorol. 2007, 8, 469–482. [Google Scholar] [CrossRef] [Green Version]
  2. AghaKouchak, A.; Nakhjiri, N. A near real-time satellite-based global drought climate data record. Environ. Res. Lett. 2012, 7, 044037. [Google Scholar] [CrossRef] [Green Version]
  3. Anderson, J.; Chung, F.; Anderson, M.; Brekke, L.; Easton, D.; Ejeta, M.; Peterson, R.; Snyder, R. Progress on incorporating climate change into management of California’s water resources. Clim. Chang. 2007, 87, 91–108. [Google Scholar] [CrossRef] [Green Version]
  4. Ajami, N.K.; Hornberger, G.M.; Sunding, D.L. Sustainable water resource management under hydrological uncertainty. Water Resour. Res. 2008, 44, W11406. [Google Scholar] [CrossRef] [Green Version]
  5. Guo, H.; Chen, S.; Bao, A.; Behrangi, A.; Hong, Y.; Ndayisaba, F.; Hu, J.; Stepanian, P.M. Early assessment of Integrated Multi-satellite Retrievals for Global Precipitation Measurement over China. Atmos. Res. 2016, 176–177, 121–133. [Google Scholar] [CrossRef]
  6. Yilmaz, K.K.; Hogue, T.S.; Hsu, K.L.; Sorooshian, S.; Gupta, H.V.; Wagener, T. Intercomparison of rain gauge, radar, and satellite-based precipitation estimates with emphasis on hydrologic forecasting. J. Hydrometeorol. 2005, 6, 497–517. [Google Scholar] [CrossRef]
  7. Sun, Q.H.; Miao, C.Y.; Duan, Q.Y.; Ashouri, H.; Sorooshian, S.; Hsu, K.L. A Review of Global Precipitation Data Sets: Data Sources, Estimation, and Intercomparisons. Rev. Geophys. 2018, 56, 79–107. [Google Scholar] [CrossRef] [Green Version]
  8. Xie, P.; Arkin, P.A. Global Precipitation: A 17-Year Monthly Analysis Based on Gauge Observations, Satellite Estimates, and Numerical Model Outputs. Bull. Am. Meteorol. Soc. 1997, 78, 2539–2558. [Google Scholar] [CrossRef]
  9. Castro, L.M.; Gironás, J.; Fernández, B. Spatial estimation of daily precipitation in regions with complex relief and scarce data using terrain orientation. J. Hydrol. 2014, 517, 481–492. [Google Scholar] [CrossRef]
  10. Kühnlein, M.; Appelhans, T.; Thies, B.; Nauß, T. Precipitation Estimates from MSG SEVIRI Daytime, Nighttime, and Twilight Data with Random Forests. J. Appl. Meteorol. Climatol. 2014, 53, 2457–2480. [Google Scholar] [CrossRef] [Green Version]
  11. Tang, G.; Ma, Y.; Long, D.; Zhong, L.; Hong, Y. Evaluation of GPM Day-1 IMERG and TMPA Version-7 legacy products over Mainland China at multiple spatiotemporal scales. J. Hydrol. 2016, 533, 152–167. [Google Scholar] [CrossRef]
  12. Yang, H. Multiscale Hydrologic Remote Sensing Perspectives and Applications, 1st ed.; CRC Press: Boca Raton, FL, USA, 2012. [Google Scholar]
  13. Shaojun, L.; Daxin, C.; Jing, H.; Yexing, G. Progress of the Satellite Remote Sensing Retrieval of Precipitation. Adv. Meteorol. Sci. Technol. 2021, 11, 28–33. [Google Scholar]
  14. Chern, J.; Matsui, T.; Kidd, C.; Mohr, K.; Kummerow, C.; Randel, D. Global Precipitation Estimates from Cross-Track Passive Microwave Observations Using a Physically Based Retrieval Scheme. J. Hydrometeorol. 2016, 17, 383–400. [Google Scholar]
  15. Marzano, F.S.; Palmacci, M.; Cimini, D.; Giuliani, G.; Turk, F.J. Multivariate statistical integration of Satellite infrared and microwave radiometric measurements for rainfall retrieval at the geostationary scale. IEEE Trans. Geosci. Remote Sens. 2004, 42, 1018–1032. [Google Scholar] [CrossRef]
  16. Ba, M.B.; Gruber, A. GOES Multispectral Rainfall Algorithm (GMSRA). J. Appl. Meteorol. 2001, 40, 1500–1514. [Google Scholar] [CrossRef]
  17. Behrangi, A.; Hsu, K.L.; Imam, B.; Sorooshian, S.; Huffman, G.J.; Kuligowski, R.J. PERSIANN-MSA: A Precipitation Estimation Method from Satellite-Based Multispectral Analysis. J. Hydrometeorol. 2009, 10, 1414–1429. [Google Scholar] [CrossRef]
  18. Behrangi, A.; Imam, B.; Hsu, K.L.; Sorooshian, S.; Bellerby, T.J.; Huffman, G.J. REFAME: Rain Estimation Using Forward-Adjusted Advection of Microwave Estimates. J. Hydrometeorol. 2010, 11, 1305–1321. [Google Scholar] [CrossRef] [Green Version]
  19. Sorooshian, S.; Imam, B.; Hsu, K.-L.; Behrangi, A.; Kuligowski, R.J. Evaluating the Utility of Multispectral Information in Delineating the Areal Extent of Precipitation. J. Hydrometeorol. 2009, 10, 684–700. [Google Scholar]
  20. Kohrs, R.A.; Martin, D.W.; Mosher, F.R.; Medaglia, C.M.; Adamo, C. Over-Ocean Validation of the Global Convective Diagnostic. J. Appl. Meteorol. Climatol. 2008, 47, 525–543. [Google Scholar]
  21. Tjemkes, S.A.; van de Berg, L.; Schmetz, J. Warm water vapour pixels over high clouds as observed by METEOSAT. Contrib. Atmos. Phys. 1997, 70, 15–21. [Google Scholar]
  22. Sorooshian, S.; AghaKouchak, A.; Arkin, P.; Eylander, J.; Foufoula-Georgiou, E.; Harmon, R.; Hendrickx, J.M.H.; Imam, B.; Kuligowski, R.; Skahill, B.; et al. Advanced Concepts on Remote Sensing of Precipitation at Multiple Scales. Bull. Am. Meteorol. Soc. 2011, 92, 1353–1357. [Google Scholar] [CrossRef]
  23. Canziani, A.; Paszke, A.; Culurciello, E. An Analysis of Deep Neural Network Models for Practical Applications. arXiv 2016, arXiv:1208.2205. [Google Scholar]
  24. LeCun, Y.; Boser, B.; Denker, J.S.; Henderson, D.; Howard, R.E.; Hubbard, W.; Jackel, L.D. Backpropagation Applied to Handwritten Zip Code Recognition. Neural Comput. 1989, 1, 541–551. [Google Scholar] [CrossRef]
  25. Elman, J. Finding Structure in Time. Cogn. Sci. 1990, 14, 179–211. [Google Scholar] [CrossRef]
  26. Goodfellow, I.; Pouget-Abadie, J.; Mirza, M.; Xu, B.; Warde-Farley, D.; Ozair, S.; Courville, A.; Bengio, Y. Generative Adversarial Nets. In Proceedings of the NIPS’14: Proceedings of the 27th International Conference on Neural Information Processing Systems, Montreal, QC, Canada, 8–13 December 2014; Volume 2. [Google Scholar]
  27. Akbari Asanjan, A.; Yang, T.; Hsu, K.; Sorooshian, S.; Lin, J.; Peng, Q. Short-Term Precipitation Forecast Based on the PERSIANN System and LSTM Recurrent Neural Networks. J. Geophys. Res. Atmos. 2018, 123, 12543–12563. [Google Scholar] [CrossRef]
  28. Liu, Y.; Racah, E.; Prabhat; Correa, J.; Khosrowshahi, A.; Lavers, D.; Kunkel, K.; Wehner, M.; Collins, W. Application of Deep Convolutional Neural Networks for Detecting Extreme Weather in Climate Datasets. arXiv 2016, arXiv:1605.01156. [Google Scholar]
  29. Shi, X.; Chen, Z.; Wang, H.; Yeung, D.-Y. Convolutional LSTM Network A Machine Learning Approach for Precipitation Nowcasting. In Proceedings of the 29th Annual Conference on Neural Information Processing Systems (NIPS), Montreal, QC, Canada, 11–12 December 2015. [Google Scholar]
  30. Gao, X.; Tao, Y.; Ihler, A.; Sorooshian, S.; Hsu, K. Precipitation Identification with Bispectral Satellite Information Using Deep Learning Approaches. J. Hydrometeorol. 2017, 18, 1271–1283. [Google Scholar]
  31. Tao, Y.M.; Hsu, K.; Ihler, A.; Gao, X.G.; Sorooshian, S. A Two-Stage Deep Neural Network Framework for Precipitation Estimation from Bispectral Satellite Information. J. Hydrometeorol. 2018, 19, 393–408. [Google Scholar] [CrossRef]
  32. Sadeghi, M.; Asanjan, A.A.; Faridzad, M.; Nguyen, P.; Hsu, K.; Sorooshian, S.; Braithwaite, D. PERSIANN-CNN: Precipitation Estimation from Remotely Sensed Information Using Artificial Neural Networks–Convolutional Neural Networks. J. Hydrometeorol. 2019, 20, 2273–2289. [Google Scholar] [CrossRef]
  33. Wang, C.; Xu, J.; Tang, G.; Yang, Y.; Hong, Y. Infrared Precipitation Estimation Using Convolutional Neural Network. IEEE Trans. Geosci. Remote Sens. 2020, 58, 8612–8625. [Google Scholar] [CrossRef]
  34. Hayatbini, N.; Kong, B.; Hsu, K.-L.; Nguyen, P.; Sorooshian, S.; Stephens, G.; Fowlkes, C.; Nemani, R. Conditional Generative Adversarial Networks (cGANs) for Near Real-Time Precipitation Estimation from Multispectral GOES-16 Satellite Imageries—PERSIANN-cGAN. Remote Sens. 2019, 11, 2193. [Google Scholar] [CrossRef] [Green Version]
  35. Ganquan, W. The Multiple Channel Scanning Imager of “FY-4” Meteorological Satellite. In Proceedings of the 2004 Academic Conference of Chinese Optical Society, Hangzhou, China, 22 February 2004. [Google Scholar]
  36. Bellerby, T.; Todd, M.; Kniveton, D. Rainfall estimation from a combination of TRMM precipitation radar and GOES multispectral satellite imagery through the use of an artificial neural network. J. Appl. Meteorol. 2000, 39 Pt 1, 2115–2128. [Google Scholar] [CrossRef]
  37. Arkin, P.A.; Meisner, B.N. The Relationship between Large-Scale Convective Rainfall and Cold Cloud over the Western Hemisphere during 1982–1984. Mon. Weather. Rev. 1987, 115, 51–74. [Google Scholar] [CrossRef] [Green Version]
  38. Zeng, X. The Relationship among Precipitation, Cloud-Top Temperature, and Precipitable Water over the Tropics. J. Clim. 1999, 12, 2503. [Google Scholar] [CrossRef]
  39. Lu, X.; Tang, G.; Wei, M.; Yang, L.; Zhang, Y. Evaluation of multi-satellite precipitation products in Xinjiang, China. Int. J. Remote Sens. 2018, 39, 7437–7462. [Google Scholar] [CrossRef]
  40. Joyce, R.J.; Janowiak, J.E.; Arkin, P.A.; Xie, P.P. CMORPH: A method that produces global precipitation estimates from passive microwave and infrared data at high spatial and temporal resolution. J. Hydrometeorol. 2004, 5, 487–503. [Google Scholar] [CrossRef]
  41. Yu-Lu, Z. Evaluation and Verification of FY-4A Satellite Quantitative Precipitation Estimation Product. J. Agric. Catastropholgy 2021, 11, P96–P98. [Google Scholar]
  42. Ronneberger, O.; Fischer, P.; Brox, T. U-Net Convolutional Networks for Biomedical Image Segmentation. In Proceedings of the International Conference on Medical Image Computing and Computer-Assisted Intervention, Munich, Germany, 5–9 October 2015; Springer International Publishing: Munich, Germany, 2015; pp. 234–241. [Google Scholar]
  43. Oktay, O.; Schlemper, J.; Folgoc, L.L.; Lee, M.; Heinrich, M. Attention-unet: Learning Where to Look for the Pancreas. In Proceedings of the 1st Conference on Medical Imaging with Deep Learning (MIDL 2018), Amsterdam, The Netherlands, 21 August 2018. [Google Scholar]
  44. Kingma, D.; Ba, J. Adam: A Method for Stochastic Optimization. arXiv 2014, arXiv:1412.6980. [Google Scholar]
  45. Ghajarnia, N.; Liaghat, A.; Daneshkar Arasteh, P. Comparison and evaluation of high resolution precipitation estimation products in Urmia Basin-Iran. Atmos. Res. 2015, 158–159, 50–65. [Google Scholar] [CrossRef]
Figure 1. Visualized structure of Attention-Unet network.
Remotesensing 14 02925 g001
Figure 2. Visualized structure of Unet network.
Remotesensing 14 02925 g002
Figure 3. POD, CSI, and FAR of CMORPH, FY4A-QPE and Attention-Unet model over the southeastern coast of China during the validation period (June–August 2020). (ac) POD; (df) CSI; and (gi) FAR. (a) POD: FY4A-QPE; (b) POD: CMORPH; (c) POD: Attention-Unet; (d) CSI: FY4A-QPE; (e) CSI: CMORPH; (f) CSI: Attention-Unet; (g) FAR: FY4A-QPE; (h) FAR: CMORPH; (i) FAR: Attention-Unet.
Remotesensing 14 02925 g003
Figure 4. The Pearson correlation coefficient (CC) and Root Mean Square Error (RMSE) values for the CMORPH, FY4A-QPE and Attention-Unet model over the southeastern coast of China during the validation period (June–August 2020). (a) RMSE: FY4A-QPE; (b) RMSE: CMORPH; (c) RMSE: Attention-Unet; (d) CC: FY4A-QPE; (e) CC: CMORPH; (f) CC: Attention-Unet.
Remotesensing 14 02925 g004
Figure 5. Visualization of precipitation identification performance of CMORPH, FY4A-QPE and Attention-Unet model over the Henan province at 0430 UTC 19 July 2021. (a) FY4A-QPE; (b) CMORPH; (c) Attention-Unet.
Remotesensing 14 02925 g005
Figure 6. POD, CSI, and FAR of Unet, PERSIANN-CNN and Attention-Unet model over the southeastern coast of China during the validation period (June–August 2020). (ac) POD; (df) FAR; and (gi) CSI. (a) POD: Unet; (b) POD: PERSIANN-CNN; (c) POD: Attention-Unet; (d) FAR: Unet; (e) FAR: PERSIANN-CNN; (f) FAR: Attention-Unet; (g) CSI: Unet; (h) CSI: PERSIANN-CNN; (i) CSI: Attention-Unet.
Remotesensing 14 02925 g006
Figure 7. The Pearson correlation coefficient (CC) and Root Mean Square Error (RMSE) values of Unet, PERSIANN-CNN and Attention-Unet model over the southeastern coast of China during the validation period (June–August 2020). (ac) RMSE and (df) CC. (a) RMSE: Unet; (b) RMSE: PERSIANN-CNN; (c) RMSE: Attention-Unet; (d) CC: Unet; (e) CC: PERSIANN-CNN; (f) CC: Attention-Unet.
Remotesensing 14 02925 g007
Figure 8. Visualization of precipitation identification performance of Unet, PERSIANN-CNN and Attention-Unet model over the Henan province at 0430 UTC 19 July 2021. (a) Unet; (b) PERSIANN-CNN; (c) Attention-Unet.
Remotesensing 14 02925 g008
Table 1. The setting of FY-4A/AGRI spectral band and main detection objects.
Channels NumberBand
Range/μm
Center
Wavelength/μm
Spatial
Resolution/km
Primary
Probe Object
10.45–0.490.471aerosol
20.55–0.750.650.5fog, clouds
30.75–0.900.8251vegetation
41.36–1.391.3752cirrus
51.58–1.641.612snow
62.10–2.352.2252cirrus, aerosol
73.50–4.003.7252fire point
83.50–4.003.7254earth’s surface
95.80–6.706.254high-layer water vapor
106.90–7.307.14mid-layer water vapor
118.00–9.008.54low layer water vapor
1210.3–11.310.84cloud and surface
temperature
1311.5–12.512.04cloud and Surface
temperature
1413.2–13.813.54cloud-top height
Table 2. Description of classification metrics used. TP denotes the number of true positive events, FN denotes the number of missing events, FP denotes the number of false-positive events, and TN denotes the number of true negative events.
Classification MetricsFormulaRangeOptimum
Probability of detection (POD) T P T P + F N [0, 1]1
False alarm ratio (FAR) F P T P + F P [0, 1]0
Critical success index (CSI) T P T P + F N + F P [0, 1]1
Table 3. Description of regression metrics used. y i is an observation and y ^ i is its estimation.
Verification MeasureFormulaRangeOptimum
Root mean square
error (RMSE)
1 N i = 1 N ( y ^ i y i ) 2 [0, ∞]0
Pearson correlation
coefficient (CC)
1 N Σ i = 1 N ( y ^ i y ^ ¯ ) ( y i y ¯ ) S y ^ S y [−1, 1]1
Table 4. Summary of precipitation identification performances over the verification periods.
Metrics FY4A-QPE
Product
CMORPH
Product
Attention-Unet Model
CSIValue0.1800.2200.283
Performance gain-22.22%57.22%
PODValue0.2220.3110.473
Performance gain-40.09%113.06%
FARValue0.4200.5690.559
Performance gain-−35.48%−33.10%
Table 5. Summary of precipitation estimation performance over the verification periods.
Metrics FY4A-QPE
Product
CMORPH
Product
Attention-Unet Model
Average RMSEValue0.9780.8320.751
Performance gain-14.92%23.21%
CCValue0.2700.2680.370
Performance gain-0.74%37.04%
Table 6. Summary of precipitation identification performances over extreme precipitation events.
Metrics FY4A-QPE
Product
CMORPH
Product
Attention-Unet Model
CSIValue0.4200.1610.570
Performance gain-−61.67%35.71%
PODValue0.4570.2570.729
Performance gain-−43.76%59.52%
FARValue0.1560.6980.265
Performance gain-−347.44%−69.87%
Table 7. Summary of precipitation estimation performance over extreme precipitation events.
Metrics FY4A-QPE
Product
CMORPH
Product
Attention-Unet Model
Average RMSEValue15.9763.8552.519
Performance gain-75.87%84.23%
CCValue0.590−0.0860.616
Performance gain-−85.42%4.41%
Table 8. Summary of precipitation identification performances over the verification periods.
Metrics Unet
Model
PERSIANN-CNN ModelAttention-Unet Model
PODValue0.6060.4760.473
Performance gain-−21.45%−21.95%
FARValue0.6810.6000.559
Performance gain-11.89%17.91%
CSIValue0.2670.2740.283
Performance gain-2.62%5.99%
Table 9. Summary of precipitation estimation performance over the verification periods.
Metrics Unet
Model
PERSIANN-CNN ModelAttention-Unet Model
Average RMSEValue2.8710.7090.751
Performance gain-75.30%73.84%
CCValue0.35700.3680.370
Performance gain-3.08%3.64%
Table 10. Summary of precipitation identification performances over extreme precipitation events.
Metrics Unet
Model
PERSIANN-
CNN Model
Attention-Unet Model
PODValue0.8890.7290.729
Performance gain-−18.00%−18.00%
FARValue0.4150.2920.265
Performance gain-29.64%36.14%
CSIValue0.5400.5580.570
Performance gain-3.33%5.56%
Table 11. Summary of precipitation estimation performance over extreme precipitation event.
Metrics Unet
Model
PERSIANN-
CNN Model
Attention-Unet Model
Average RMSEValue13.2742.9082.519
Performance gain-78.09%81.02%
CCValue0.4520.5270.616
Performance gain-16.59%36.28%
Publisher’s Note: MDPI stays neutral with regard to jurisdictional claims in published maps and institutional affiliations.

