1. Introduction
Modern agriculture and food production systems have to withstand escalating pressure from climate change, land and water availability, and more recently, a pandemic. Sesame (
Sesamumindicum L., 2n = 2x = 26), one of the oldest oil crops, was domesticated about 3500 years ago from
Sesamum indicum subsp.
Malabaricum in the Indian sub-continent and has been cultivated since then in subtropical and temperate regions around the world [
1,
2,
3]. In 2019, mainly in developing countries, more than 6.5 million tons of sesame seeds were produced from nearly 13 million ha [
4]. With good adaptation to drought-prone and marginal environments, it can play an active role in the development of an ecologically and societally resilient, sustainable agriculture. The seeds are being used for an array of products in the food (high-quality oil, tahini paste, cooking and backing) and pharmaceutical industries [
5]. Acknowledged as an important functional food, it is progressively gaining popularity due to the high content in nutritional components with antihypertensive, anticarcinogenic, anti-inflammatory and antioxidative effects [
6,
7,
8]. Immense progress has been made with continually advancing genomics technologies to decipher and understand crop genomes. For sesame, an orphan crop until recently, despite its long history of cultivation, breeding efforts were mostly concentrated on addressing the low yield (400–500 Kg/ha) [
4] that seed shattering, indeterminate growth habit and asynchronous capsule ripening causes [
9,
10,
11,
12,
13]. In the past few years, sesame came across to the “Omics” era, and as with other crops, a substantial amount of genomics data began to amass [
14,
15,
16].
However, the impact of genomics data on crop improvement is still far from satisfactory, and our ability to accurately assess crop status in field scale is lacking compared to the current capacity to generate high-throughput genomics data. Thus, the research bottleneck in plant sciences shifts from genotyping to phenotyping. A phenotype is the composite of an observable expression of a genome for traits in a given environment. Traits could be visible to the naked eye (conventional phenotype), or visible by using technical procedures. Phenomics, the systematic genome-wide study of an organism’s phenotype is an emerging approach that aims to automate and standardize phenotyping [
17,
18,
19]. To mitigate this ‘phenomics bottleneck’, innovations such as trait data recording through sophisticated non-invasive imaging, spectroscopy, satellite image analysis, high-performance computing facilities, phenomics databases, robotics and Artificial Intelligence (AI) have been utilized. The phenomics revolution is here, and the monitoring of thousands of plants in a single day for traits such as plant architecture, photosynthesis ability and biomass productivity made it possible for “speed breeding” to unravel [
20,
21,
22]. Genetic gain is a fundamental concept in breeding and can be enhanced by increasing selection intensity, accuracy and genetic variation and/or reducing the cycle time. Phenotyping contributes both directly and indirectly to these variables [
23], but it comes with a high cost.
Simple active radiometer sensors, on the other hand, may enable phenotyping of field experiments in a rapid and cost-effective way. Remote sensing, through a set of spectral vegetation indices, has been used in breeding trials just recently [
24]. Strong associations have been demonstrated between spectral reflectance indices and attributes of crop growth, and the development of new instruments enhances their monitoring [
25,
26,
27,
28,
29]. Leaf pigments (e.g., carotenoids and anthocyanins) absorb various amounts of light in the visible range of the spectrum. These leaf characteristics influence the reflectance signature of plants. Reflectance measurements made near the crop canopy integrate plant-to-plant variation throughout plant growth cycles, associated with the impacts of senescence or stress conditions (e.g., due to water or nutrient deficits) on the leaf characteristics [
30]. Precise non-destructive biomass estimates in breeding programs, could be useful in selection, particularly if they are quick, cheap and easy to perform [
24].
The Normalized Difference Vegetation Index (NDVI) is one of the most utilized spectral reflectance indices (SRIs) for indirect selection in breeding programs. Cabrera-Bosquet et al. [
28] showed that a spectral vegetation index such as NDVI is a promising tool to screen genotypes. NDVI and other spectral reflectance indices have the potential to differentiate spring wheat genotypes from heading to grain filling stages for crop biomass and grain yield under irrigated conditions [
31]. Ma et al. [
32] reported that NDVI could differentiate between high and low grain yield among soybean (
Glycine max, L., Merr.) genotypes. They concluded that NDVI can be a reliable and fast index. Moreover, the reflectance of red light is a good way to quantify plant chlorophyll content until the canopy approaches closure. Once the canopy closes, red light reflectance remains very low and thus is no longer responsive to changes in plant chlorophyll content. Reflectance in the red-edge region of the spectrum has been shown to be quite sensitive to canopy chlorophyll content over a wide range of biomass conditions and thus the value of the normalized difference red edge index (NDRE). Canopy biomass is best quantified by measuring near-infrared (NIR) reflectance. In a practical sense, NIR reflectance quantifies the size of the photosynthetic factory while red and red-edge reflectance collectively characterize how fast the factory can operate [
33,
34].
Recent advances in precision agriculture technology have led to the development of ground-based active remote sensors (or crop canopy sensors) that calculate a set of reflectance indices such as NDVI, NDRE and NIR. Active sensors have their own source of light energy and allow for the determination of those indices at specific times and locations throughout the growing season without the need for ambient illumination or flight concerns. Crop canopy sensors are relatively small in size and contain an integrated light source. They operate by directing visible (VIS) light (400–700 nm) as well as near-infrared (NIR) (700–1300 nm) light at the plant canopy of interest [
35]. One of the most reliable types of sensors used mainly for scanning crops to make nitrogen (N) fertilizer recommendations, assess forage biomass, estimate yield, estimate crop leaf area and geospatially map agricultural landscapes is the Holland Scientific Crop Circle
TMACS-430 plant canopy reflectance sensor [
36,
37,
38,
39,
40]. The Crop Circle
TM sensor is active and operates under the same principles as that of the GreenSeeker
TM sensor; the principles and physics behind the operation of those sensors are described in detail in Inman et al. [
40]. Τhe Crop Circle
TM sensor generates light with a wavelength of 590 nm in the VIS band and 880 nm in the NIR band. The Crop Circle ACS-430 sensor showed the best results, displaying the greatest range of measured values and the highest sensitivity as a biomass predictor, when used in comparison with other devices in sugarcane [
41,
42,
43].
In many recent studies, SRIs from proximity sensors were used for early wheat selection breeding cycles [
44,
45,
46,
47]. Selection in early breeding generation is challenging because the small-size plots and the large number of lines under evaluation do not allow for an accurate determination of the yield, and for this reason breeders typically rely on visual selection.
Moreover, the phenotyping in each crop/variety is significantly affected by the growth stage; thus, many researchers focus on investigating the optimal growth stage of scanning that could be used in the breeding trials. For wheat, a recent study showed that under dryland conditions, there is a reliable correlation between grain yield and NDVI at the early growing season, the anthesis growth stage and the mid-grain filling growth stage, as well as a poor association under irrigated conditions [
48]. Relative differences in leaf senescence patterns of soybean cultivars have been studied to accurately calculate the observed maturity rate [
49,
50].
Using spectral reflectance indices for sesame phenotyping and yield estimation in a breeding program has only been recorded once before [
51].
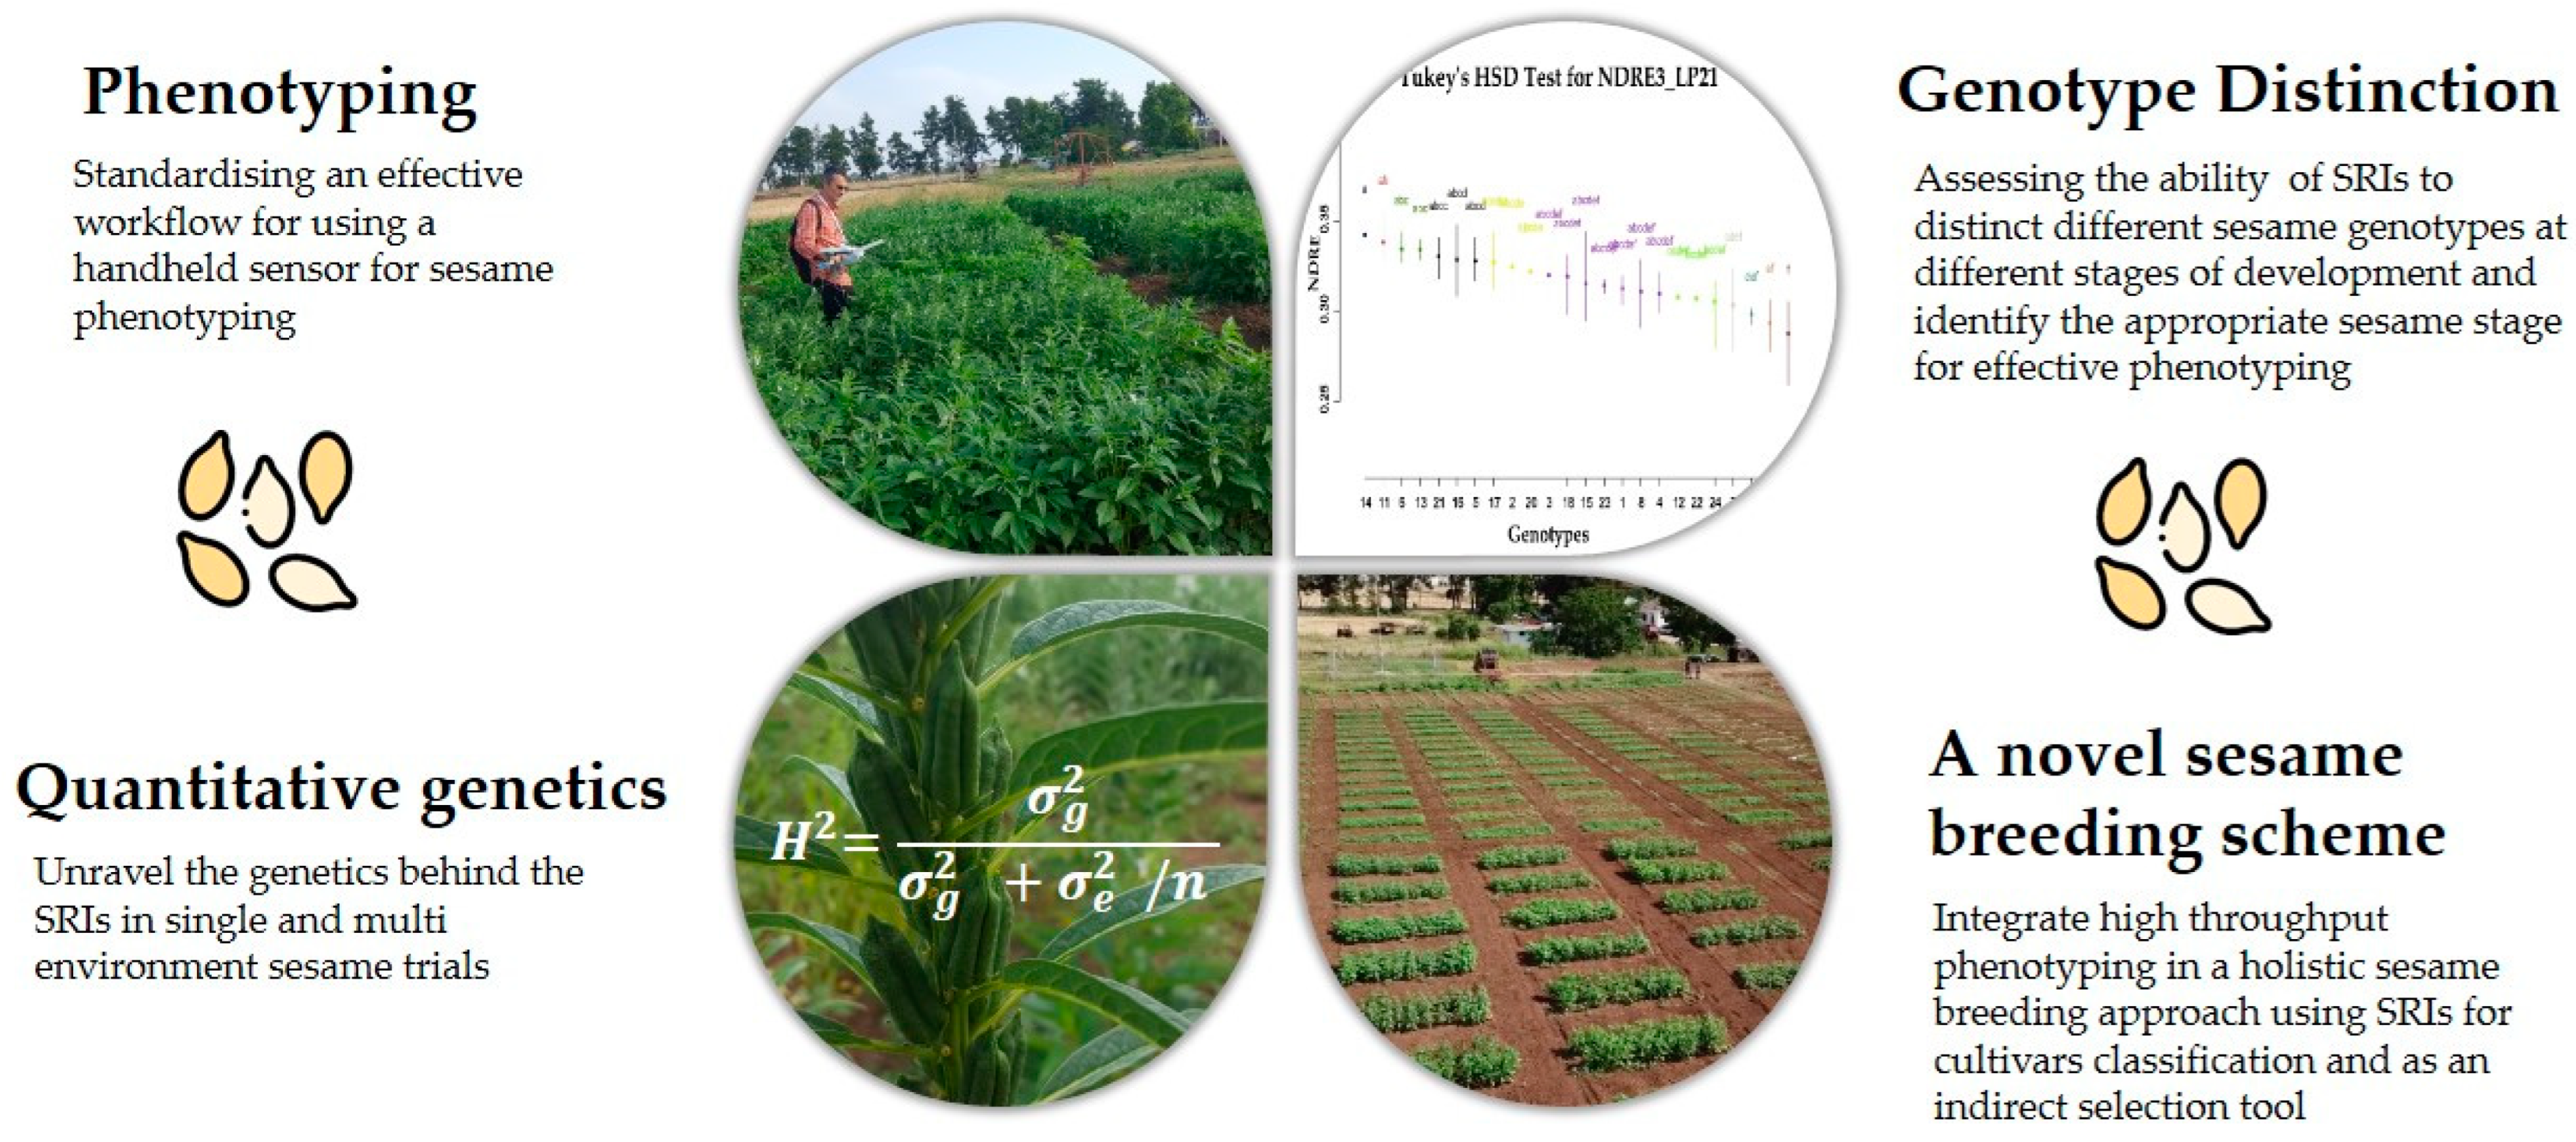
The objectives of this study were to: (1) develop a high-throughput phenotyping workflow to estimate the NDVI and NDRE at the plot-level through the active crop canopy sensor; (2) test the ability of SRIs to distinguish between sesame cultivars throughout the crop growth period; and (3) identify specific stages in the sesame growth cycle that contribute to phenotyping accuracy and functionality.
This article is structured as follows. In
Section 2, we will describe the experimental design and the genetic material that we used, the phenotyping workflow that we established and the statistical analysis that was applied. In
Section 3, we will present the results for the ability of the SRIs to differentiate sesame genotypes at different stages of their development, and we will unravel the genetics behind the SRIs in single and multi-environments sesame trials. In
Section 4, we will discuss if the results of this study showed that we can integrate SRIs and high throughput phenotyping in a sesame breeding scheme. Finally, the article will end with a brief presentation of the conclusions in
Section 4 (
Figure 1).
2. Materials and Methods
2.1. Experimental Conditions
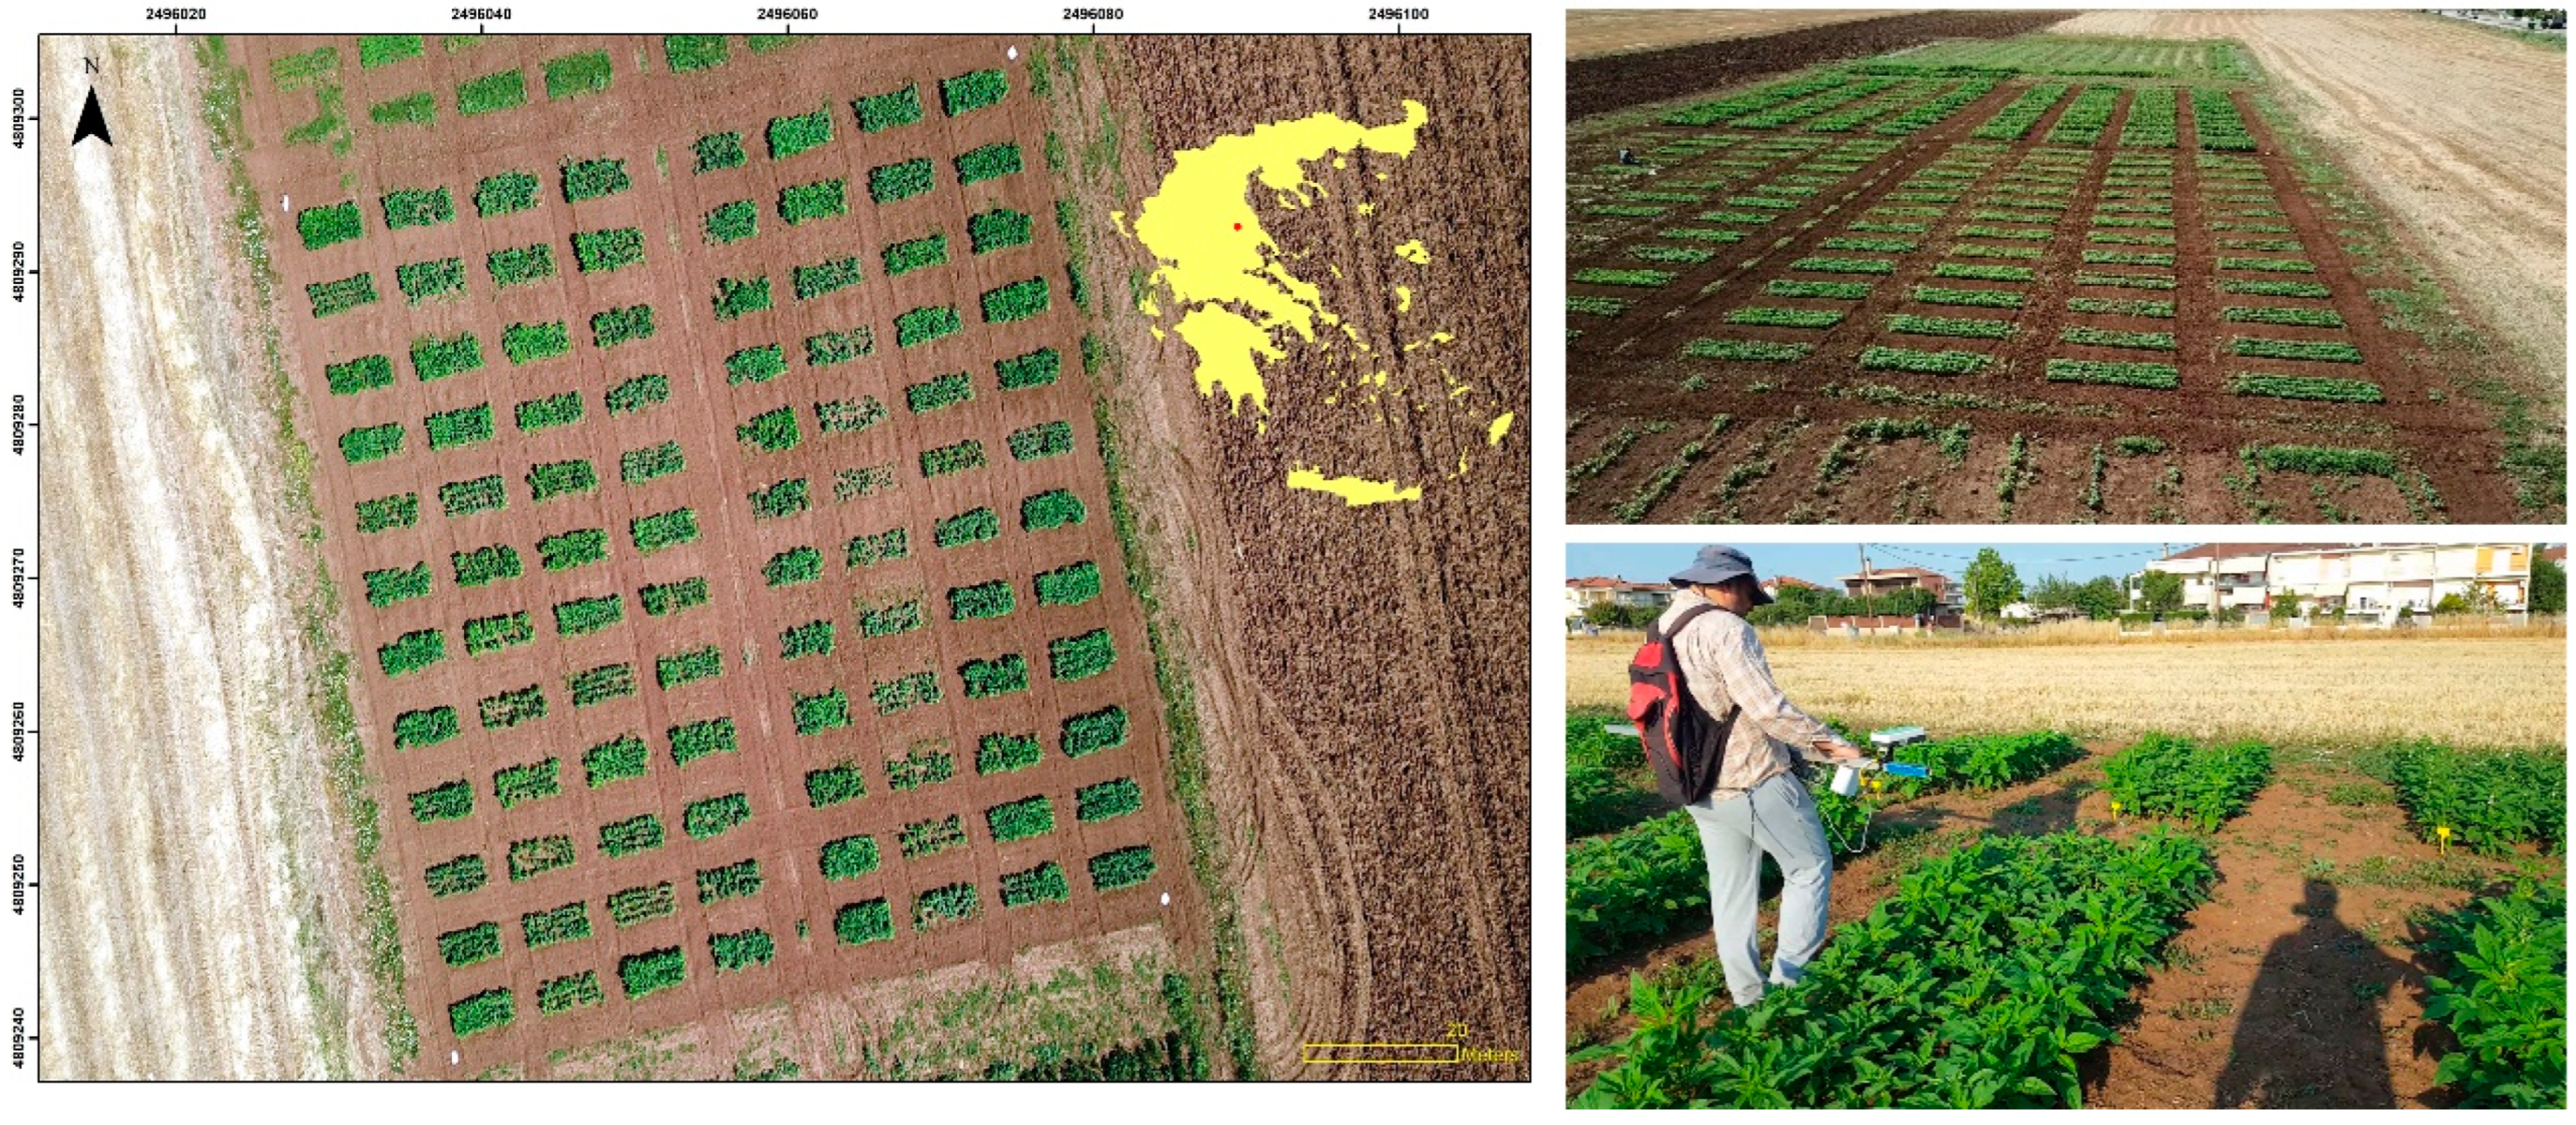
Field experiments were conducted in 2020 and 2021 at the Institute of Industrial and Forage Crops (IIFC) of the Hellenic Agricultural Organization—DIMITRA (ELGO-DIMITRA) in Larissa (x: 2496060, y: 4809270, Projected Coordinate Systems WGS_1984_Web_Mercator), central Greece (
Figure 2). The climate in the region of Larissa is a semi-arid Mediterranean climate and is classified as Csa (temperate climate with a hot-dry summer) by the Köppen–Geiger system [
52].
Soil physicochemical analyses were provided by the accredited under international quality standards (ELOT EN ISO/IEC 17025, 2017) Soil, Water and Plant Analysis lab of IIFC. Both experiments were carried out on a Vertisol [
53] clayey soil (37% sand, 21% silt, 42% clay) with poor organic carbon content (0.36–0.75%) at 30 cm depth. The soil had low carbonate content (1.2%) and electrical conductivity (393 μS/cm), was slightly alkaline in pH (7.4), had high concentrations of K (508 mg/kg), and low Olsen P (18 mg P/kg).
2.2. Experimental Design and Crop Management
To examine the use of a proximity sensor as an in-field phenotyping tool for sesame (Sesamum indicum L.) breeding, four experiments occurred on two planting dates for two consecutive years.
Planting for the full-season crop system (normal planting 2020, NP20) was carried out on 11 May 2020, whereas for the double-crop system (late planting 2020, LP20) on 9 June 2020 and in 2021 on 13/5 and 11/6, respectively (NP21 and LP21). For NP, the dates were chosen in such a way to evaluate sesame’s rotational fit with other summer crops (cotton) in the region. LP could be useful for determining the utility of sesame in a double crop system with winter crops (cereals, legumes, etc.) or to serve as a rescue crop in case of crop failure.
Field preparation consisted of disking, turning the soil with a moldboard plow, and smoothing the surface with a field cultivator 20 days before sowing. Previous cultivation was sesame. Balanced pre-plant fertilization with 100 kg ha−1 in the form (11-15-15) was incorporated in the soil before sowing. Treatments of 24 sesame genotypes were randomly assigned within each of the four blocks to follow a randomized complete block design with 96 total number of plots for each planting date. Each plot consisted of 4 rows 3 m long with 25 cm row spacing and a seeding rate of 40 seeds per meter. Sprinkler irrigation was applied right after sowing. Manual thinning was performed when the plants reached a height of 10–12 cm, so as to reach a plant population density of 200,000 plants ha−1 (on-row plant spacing of 20 cm). In-season N fertilization was performed at the beginning of the sesame reproductive stage (≈50 Days after planting, DAP) by 70 kg ha−1 of nitrogen in the form of nitrate nitrogen (34.5-0-0). Sprinkler irrigation was applied throughout the growing season to sustain plant development. The plots were weeded manually once a week, and phytosanitary actions were performed to keep them free of pests. All the soil and crop management was the same for both planting days (NP and LP) and cropping years (2020, 2021).
2.3. Plant Material
The plant material used in this work included a total of 24 sesame (
Sesamum indicum L.) genotypes. Seventeen of them were second generation “sister lines”, one was a commercial variety from Turkey and six were Greek parental landraces from the IIFC’s gene bank with different eco-geographical origin (
Table 1). The sister lines were selected from the six landraces during IIFC’s sesame breeding project in which single plant selection with honeycomb methodology under low plant density (nil-competition) was the core idea. A field evaluation methodology that is advantageous in relation to the elimination of the masking effects of soil heterogeneity, maximization of phenotypic expression and application of high selection intensity was applied [
54,
55,
56].
2.4. Crop Phenotyping
The canopy reflectance of each plot was measured by a single Crop Circle ACS-430 active canopy sensor interfaced to a GeoScout X data logger (Holland Scientific, Lincoln, NE, USA) from a nadir view 0.5 m above the crop canopy several times in the growing period.
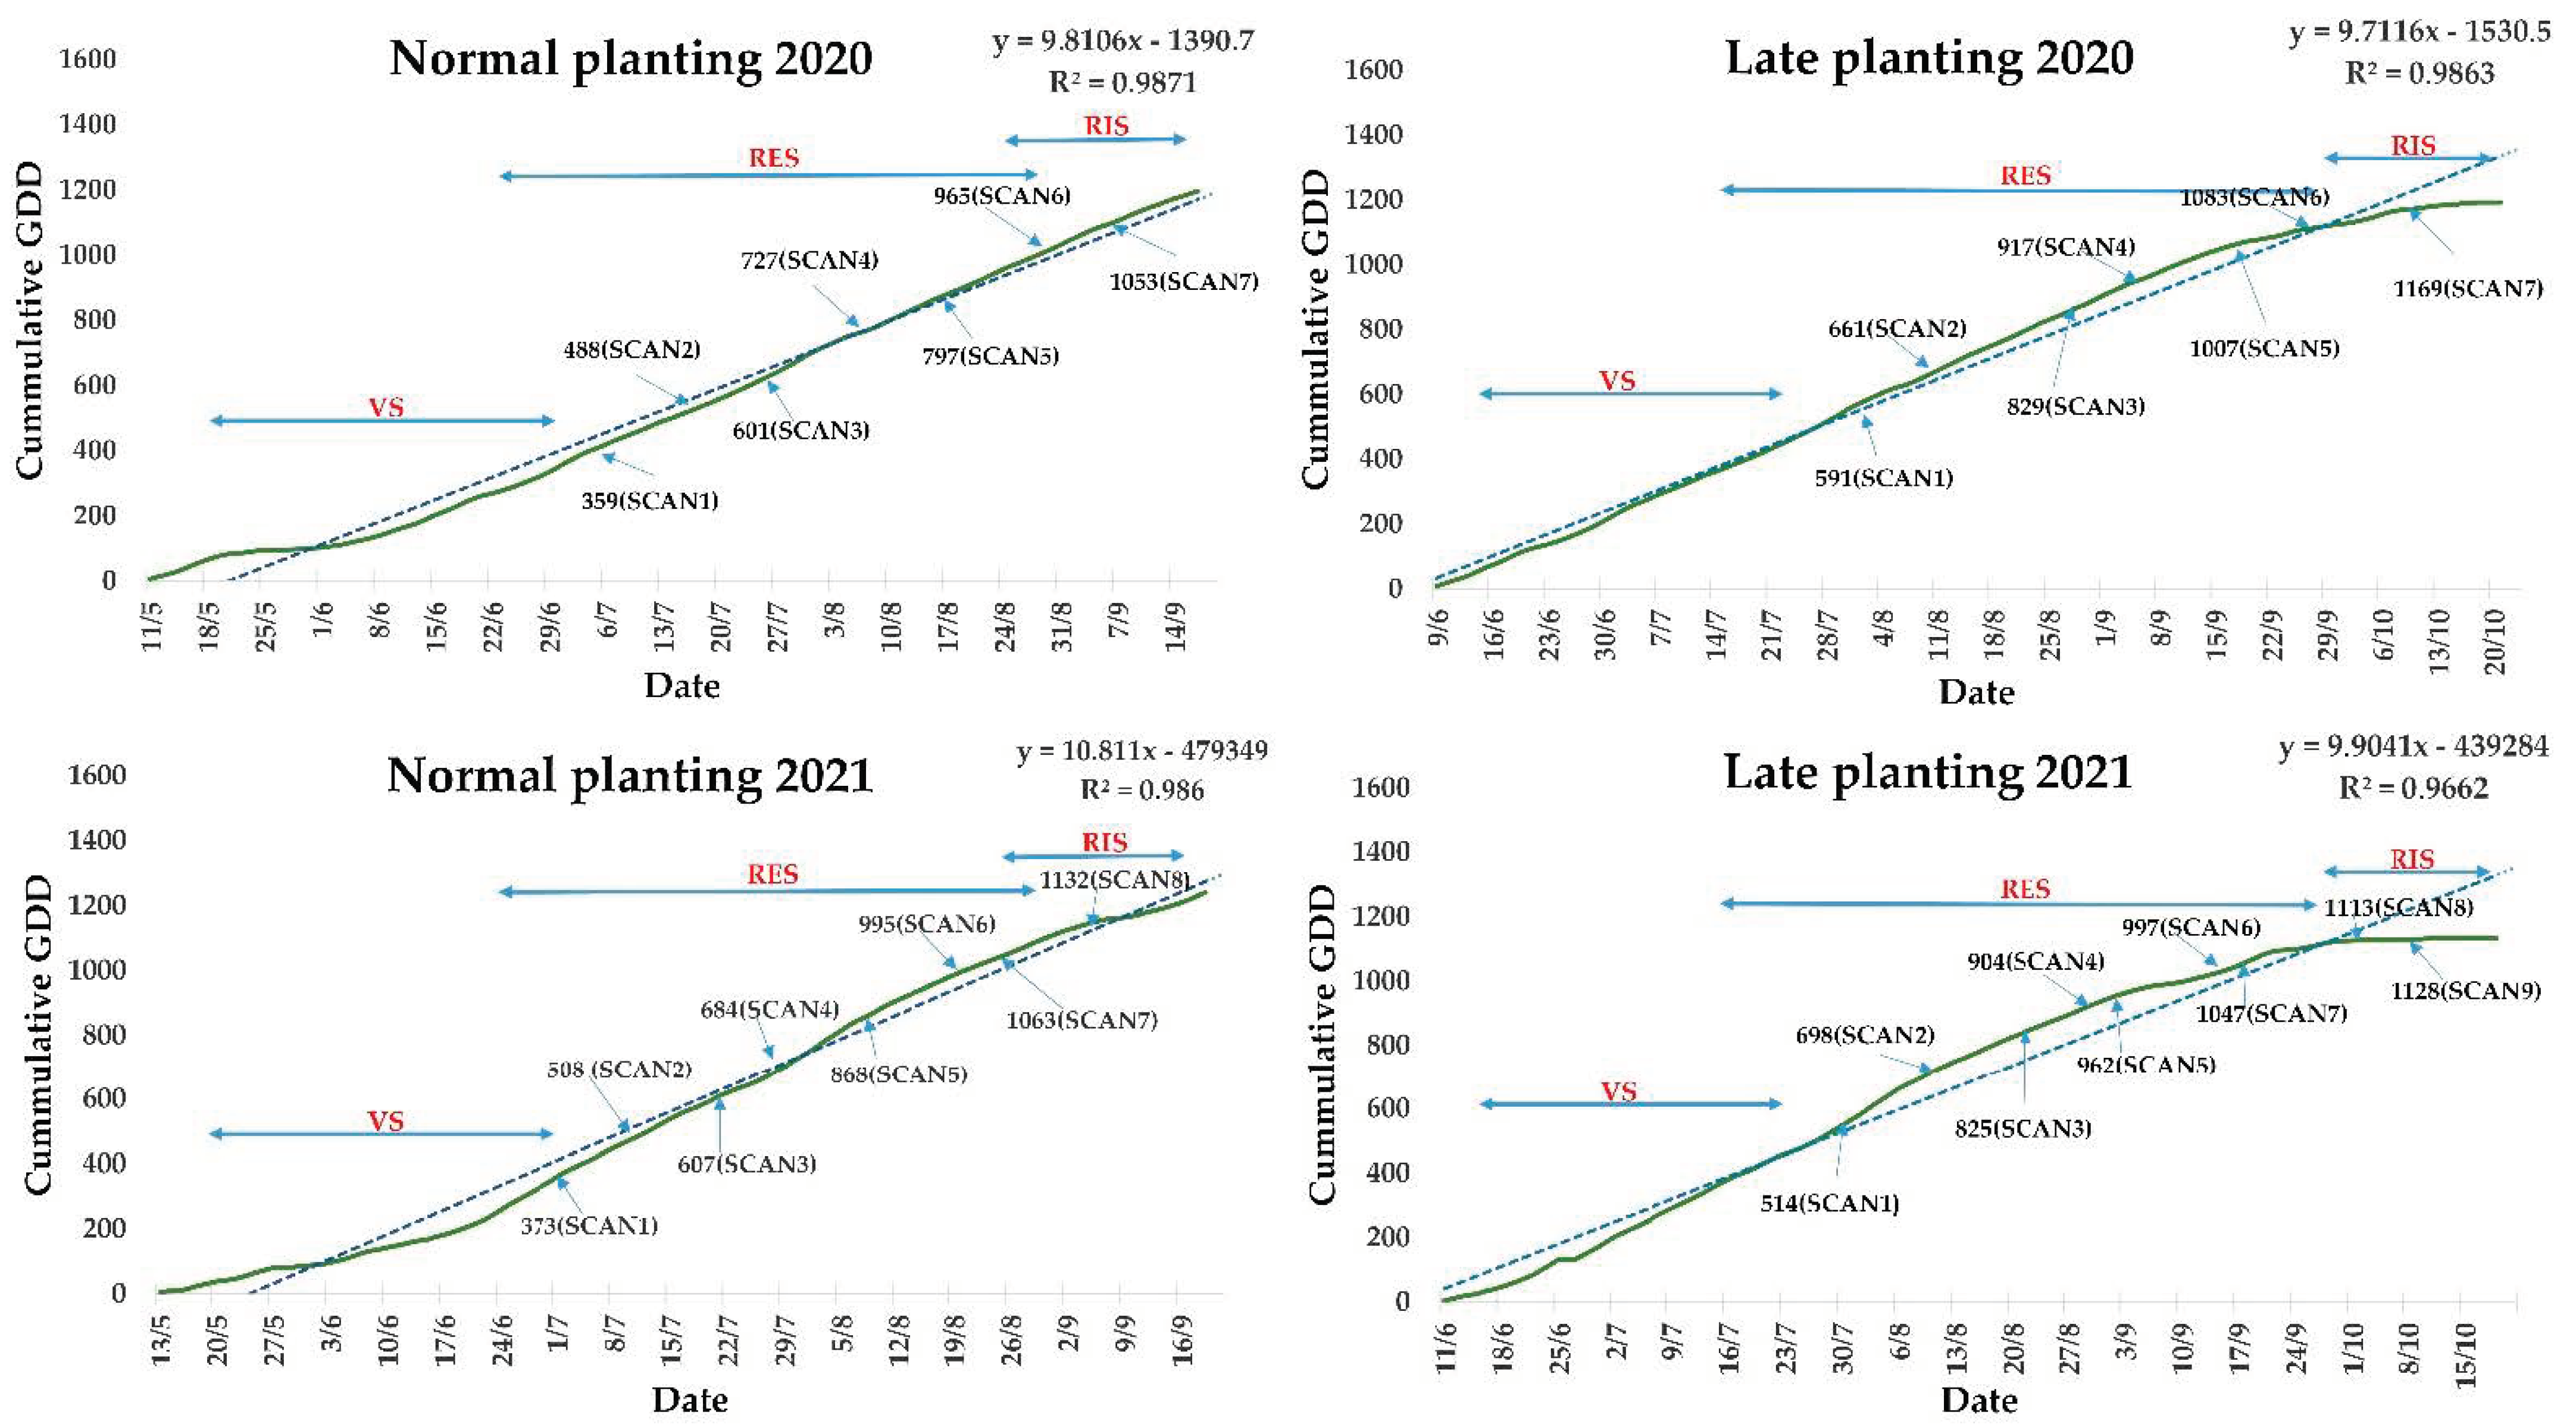
Field scans were performed with the sensor mounted on a portable frame, with an average speed of 4 km h−1 e between 8:00 a.m. and 9:30 a.m. local time, spanning the monitoring period from the early reproductive stage to mid-ripening stage. For each plot, 40–50 data points of canopy reflectance were recorded as the average of more than 4000 sensor readings by plot.
For both planting dates and years, monitoring started when all genotypes were at the reproductive stage. The canopy reflectance was measured at 670 nm (R
RED), 730 nm (R
RED EDGE) and 780 nm (R
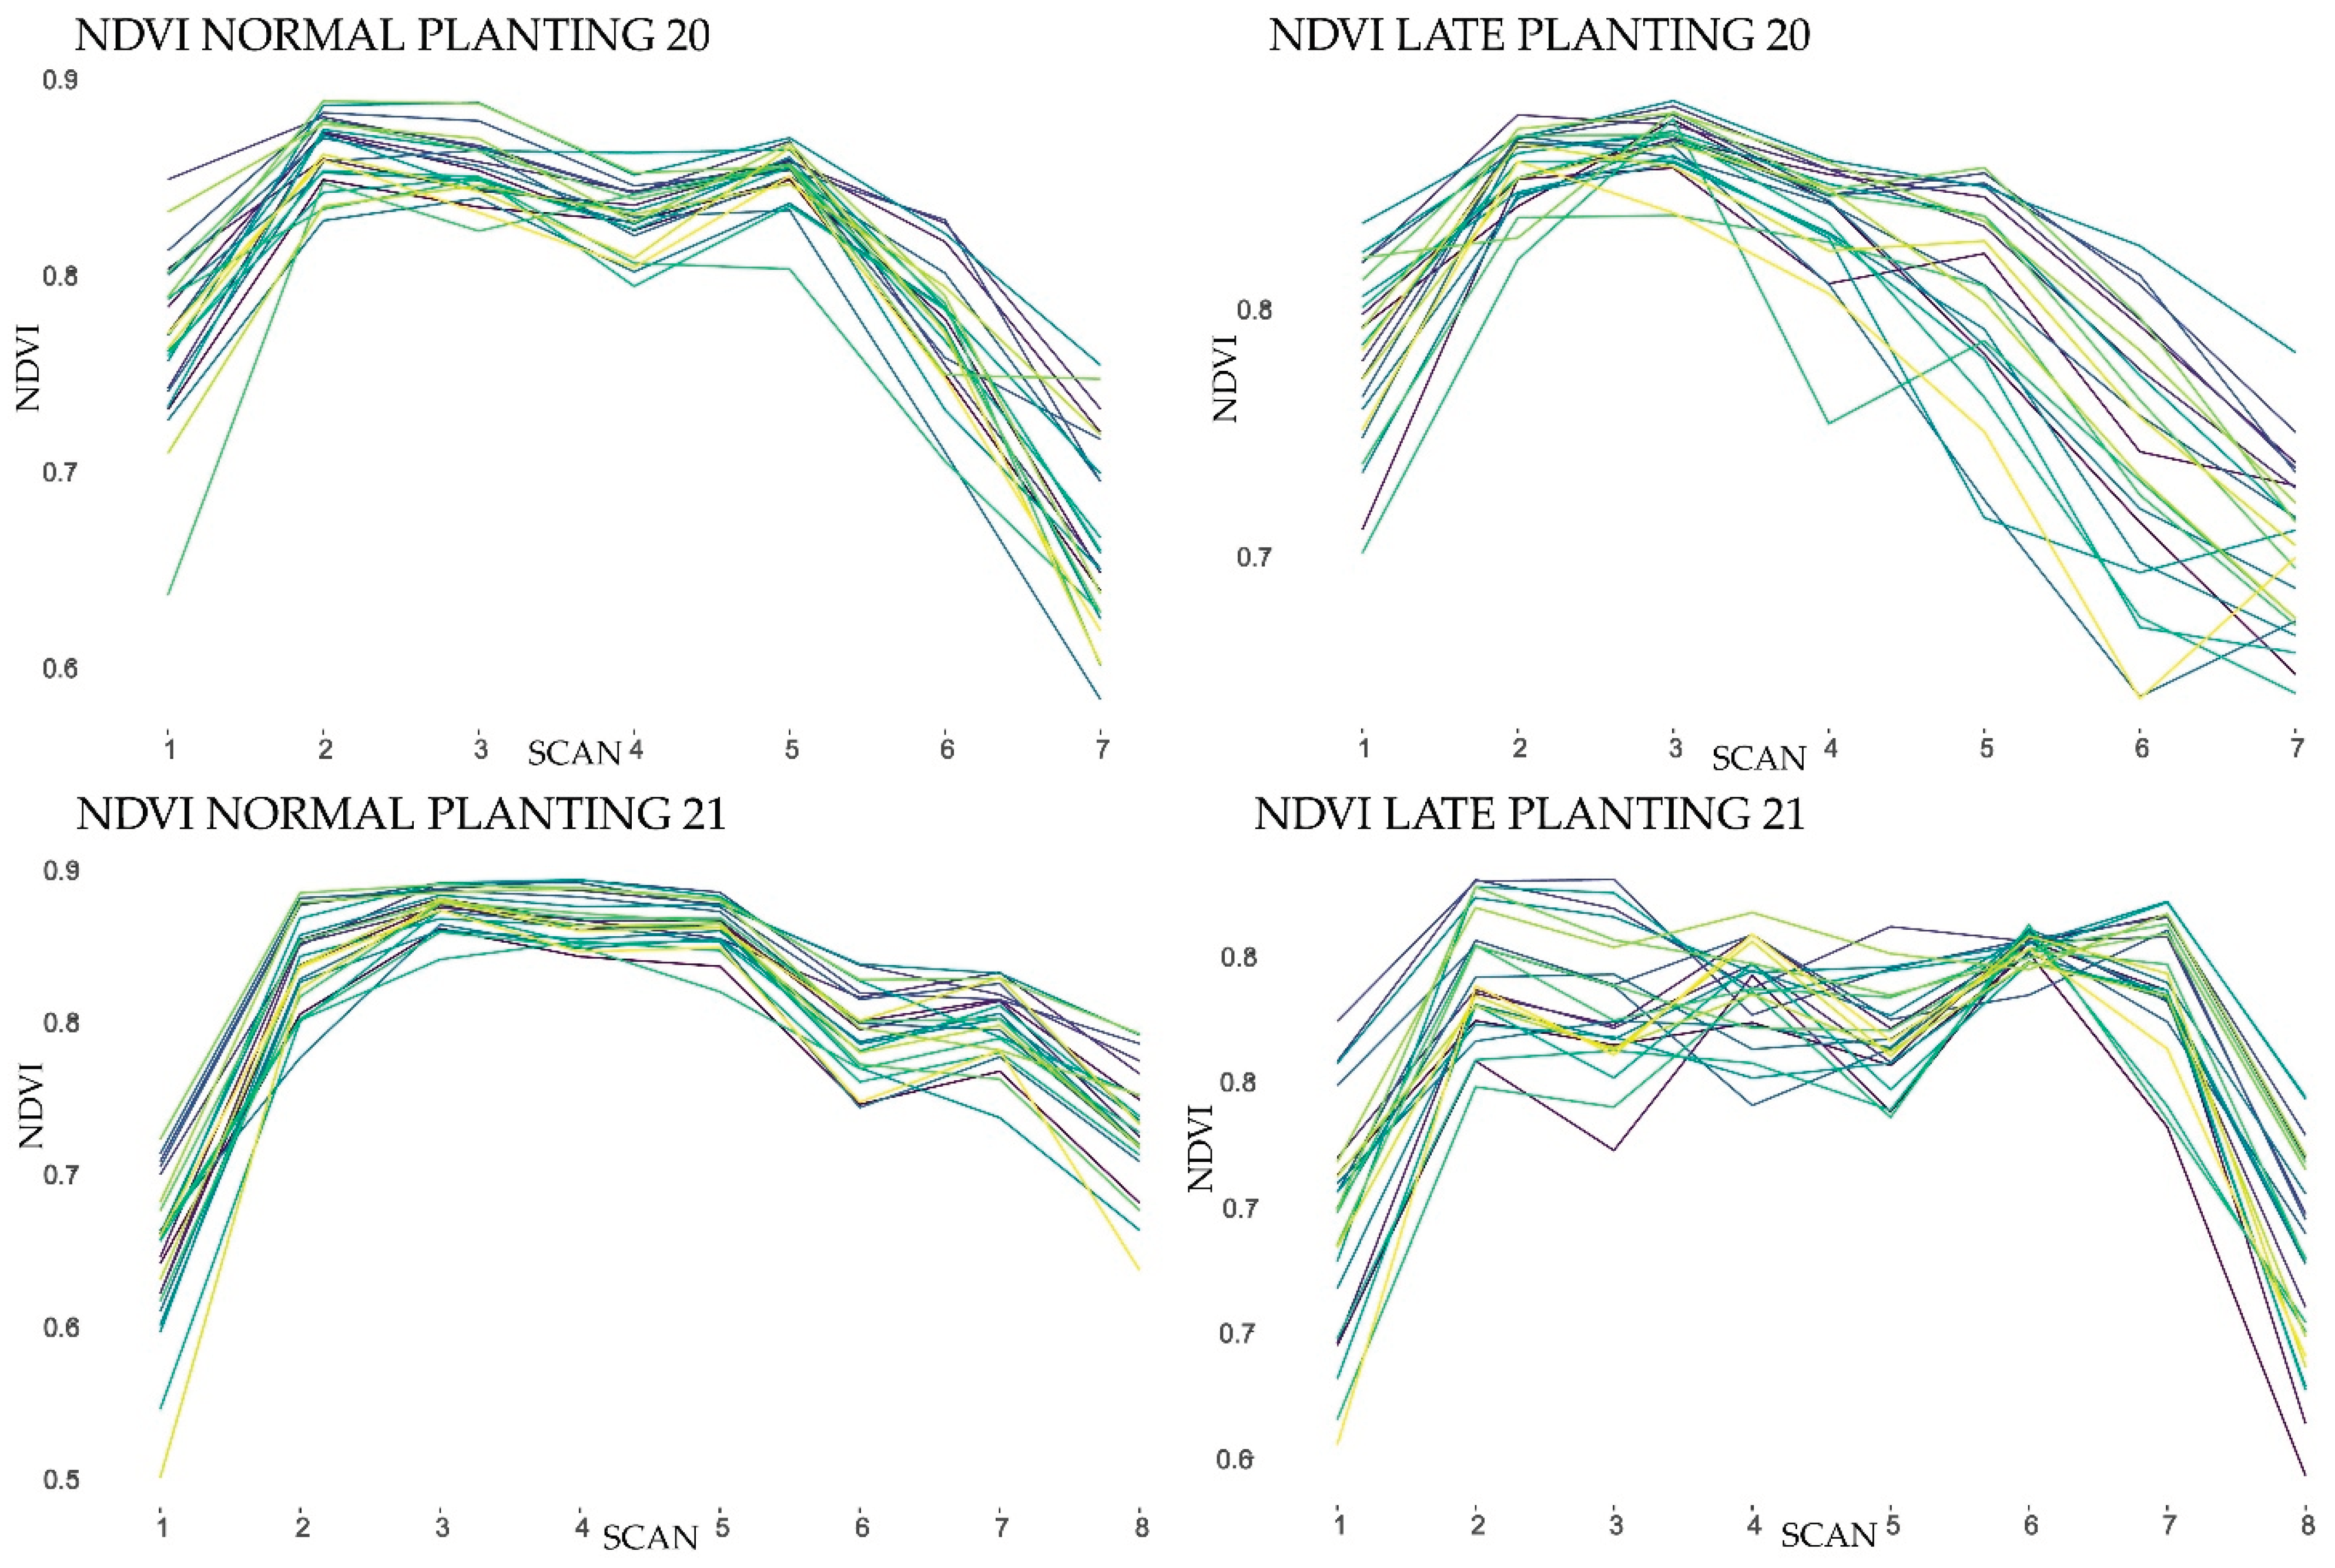
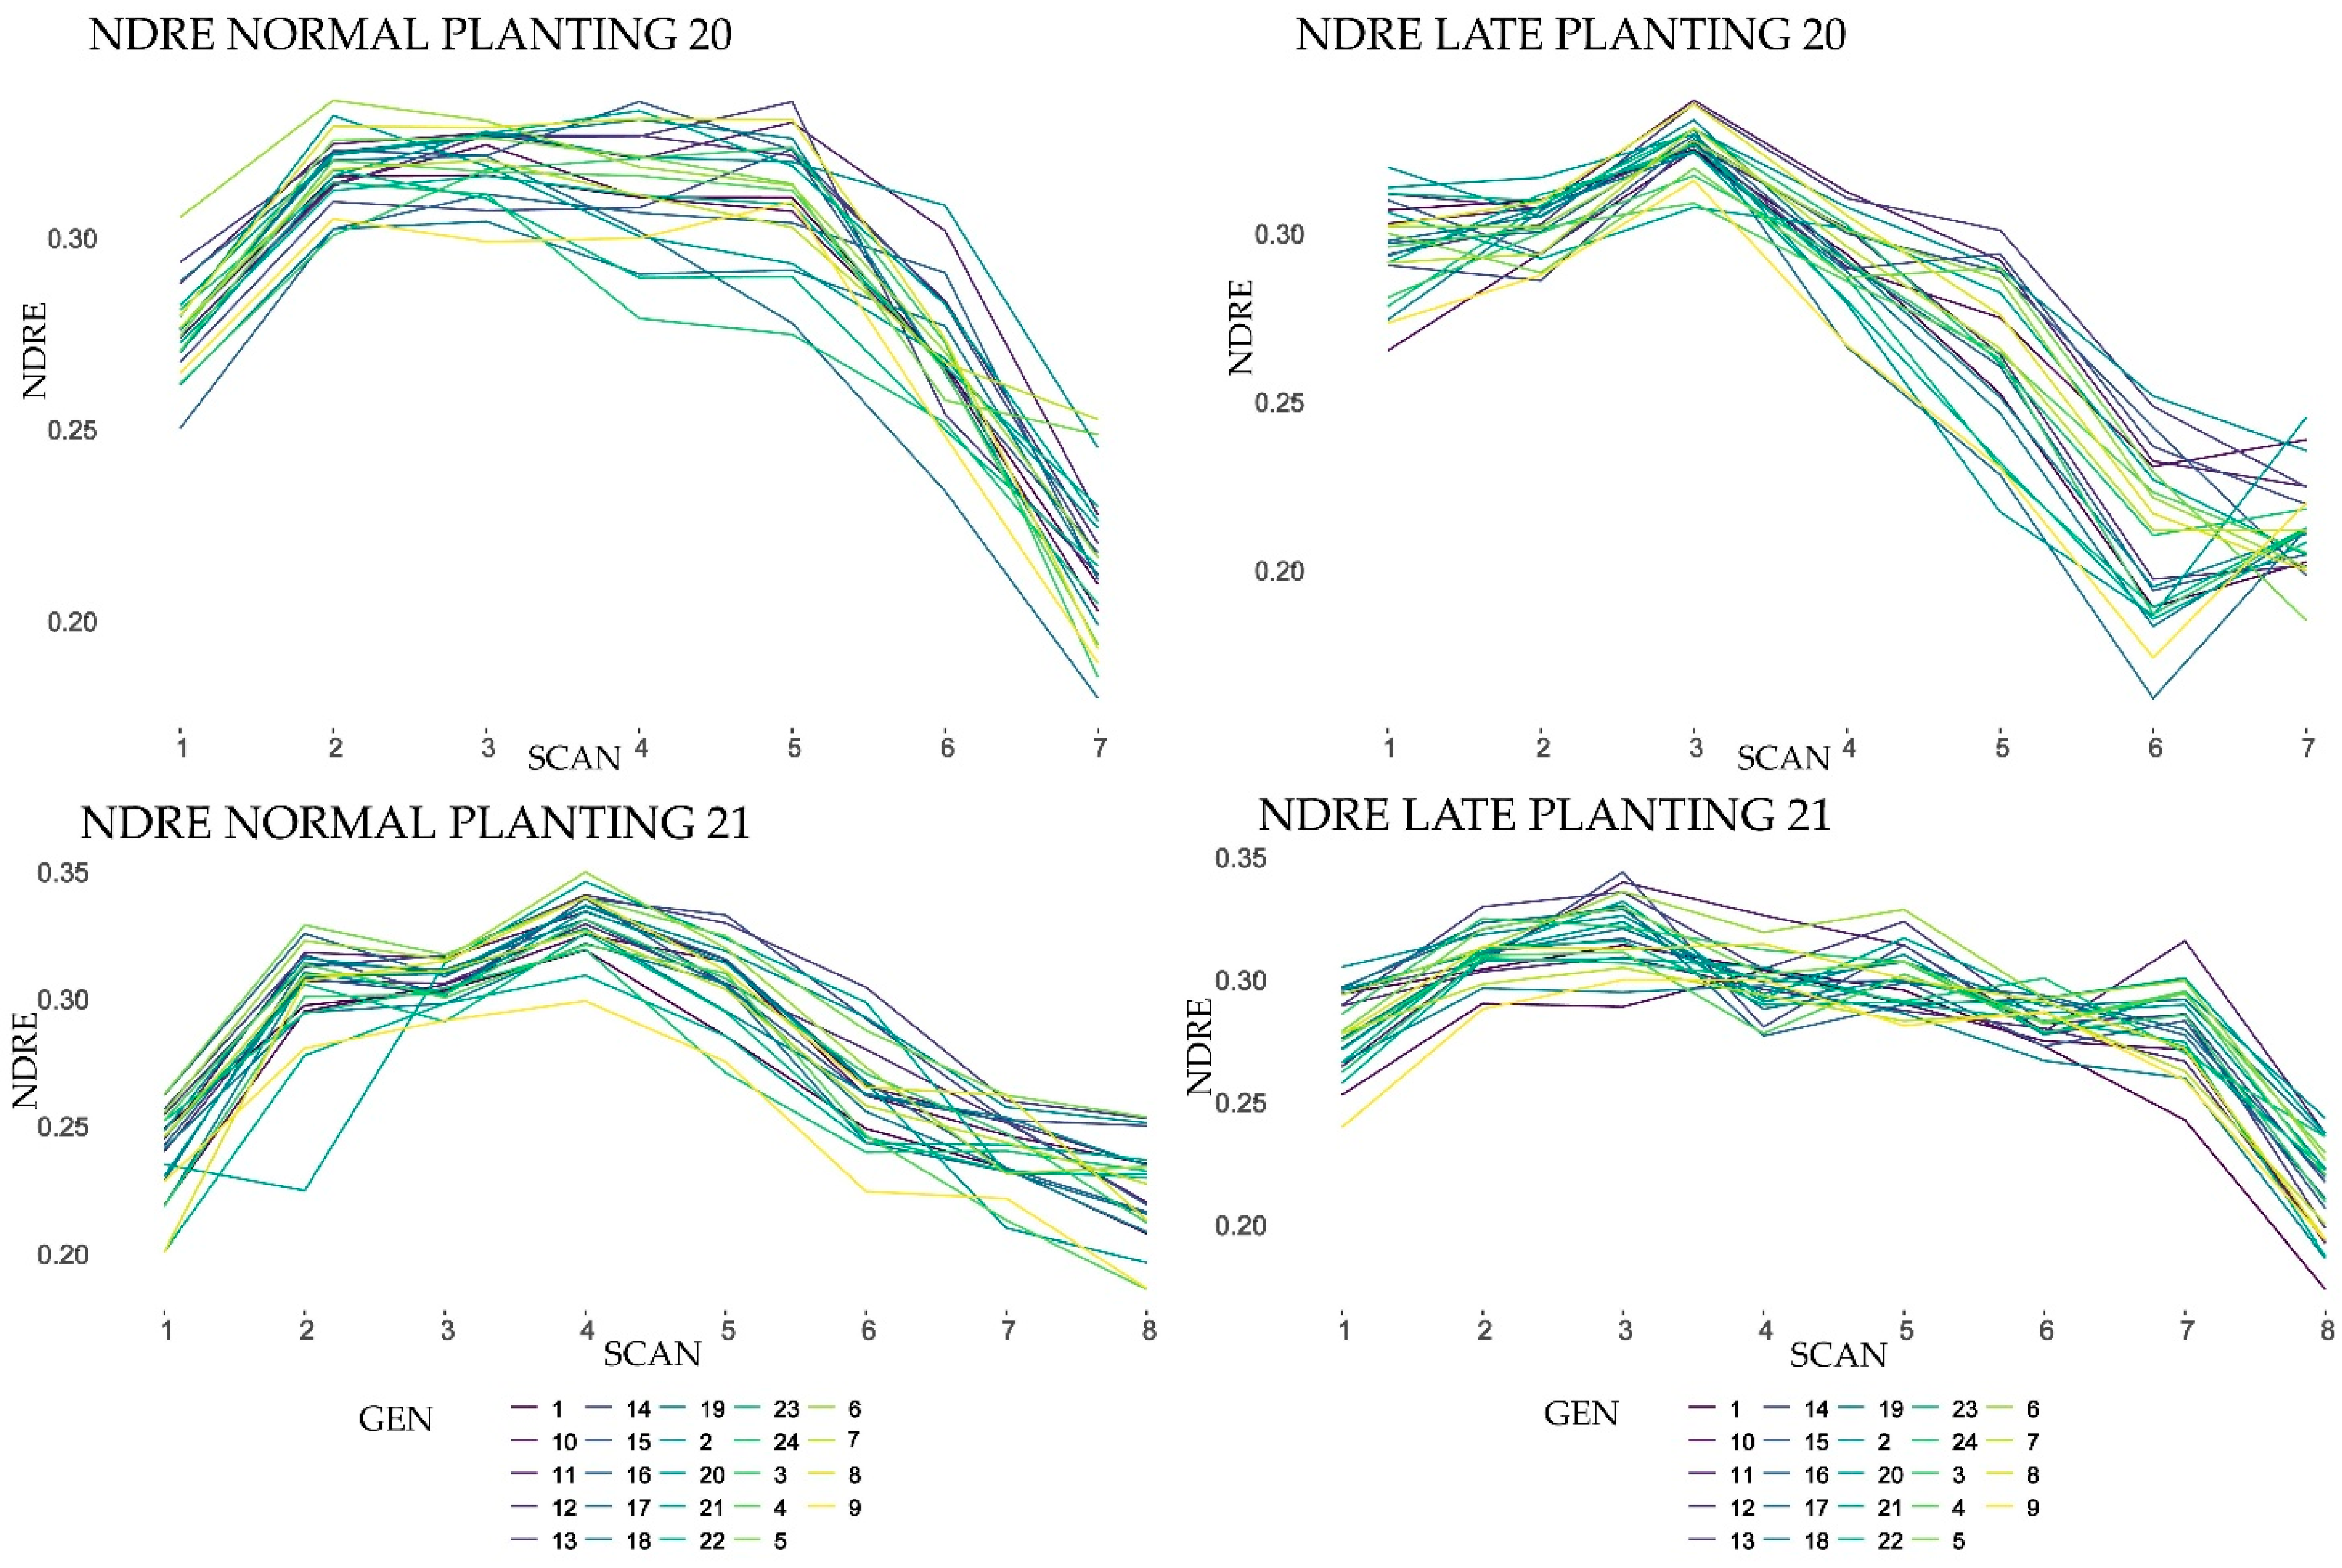
NIR) wavelengths. The spectral reflectance data from the three bands were used to derive two vegetation indices: normalized difference vegetation index (NDVI) (1) and normalized difference red edge (NDRE) (2), which were evaluated as potential tools for genotype classification.
The data points obtained on each day were later processed to get one average value for each plot. The NDVI is related to crop parameters such as leaf area index, biomass and fractional vegetation cover, whereas the NDRE characterizes the chlorophyll/nitrogen status of crop canopies.
The soil plant analysis development (SPAD), an index for chlorophyll content, recorded at the beginning of the reproductive stage with the CCM-200 plus SPAD-meter from five randomly selected plants of each plot.
Seed yield (kg/ha) was assessed at the harvest maturity stage of each cultivar. The two central rows from each plot were harvested by hand, threshed with a Wintersteiger LD 350 laboratory thresher, and the seed produced was weighed.
All the trait measurements were taken from the two central rows in each plot to avoid edge effects.
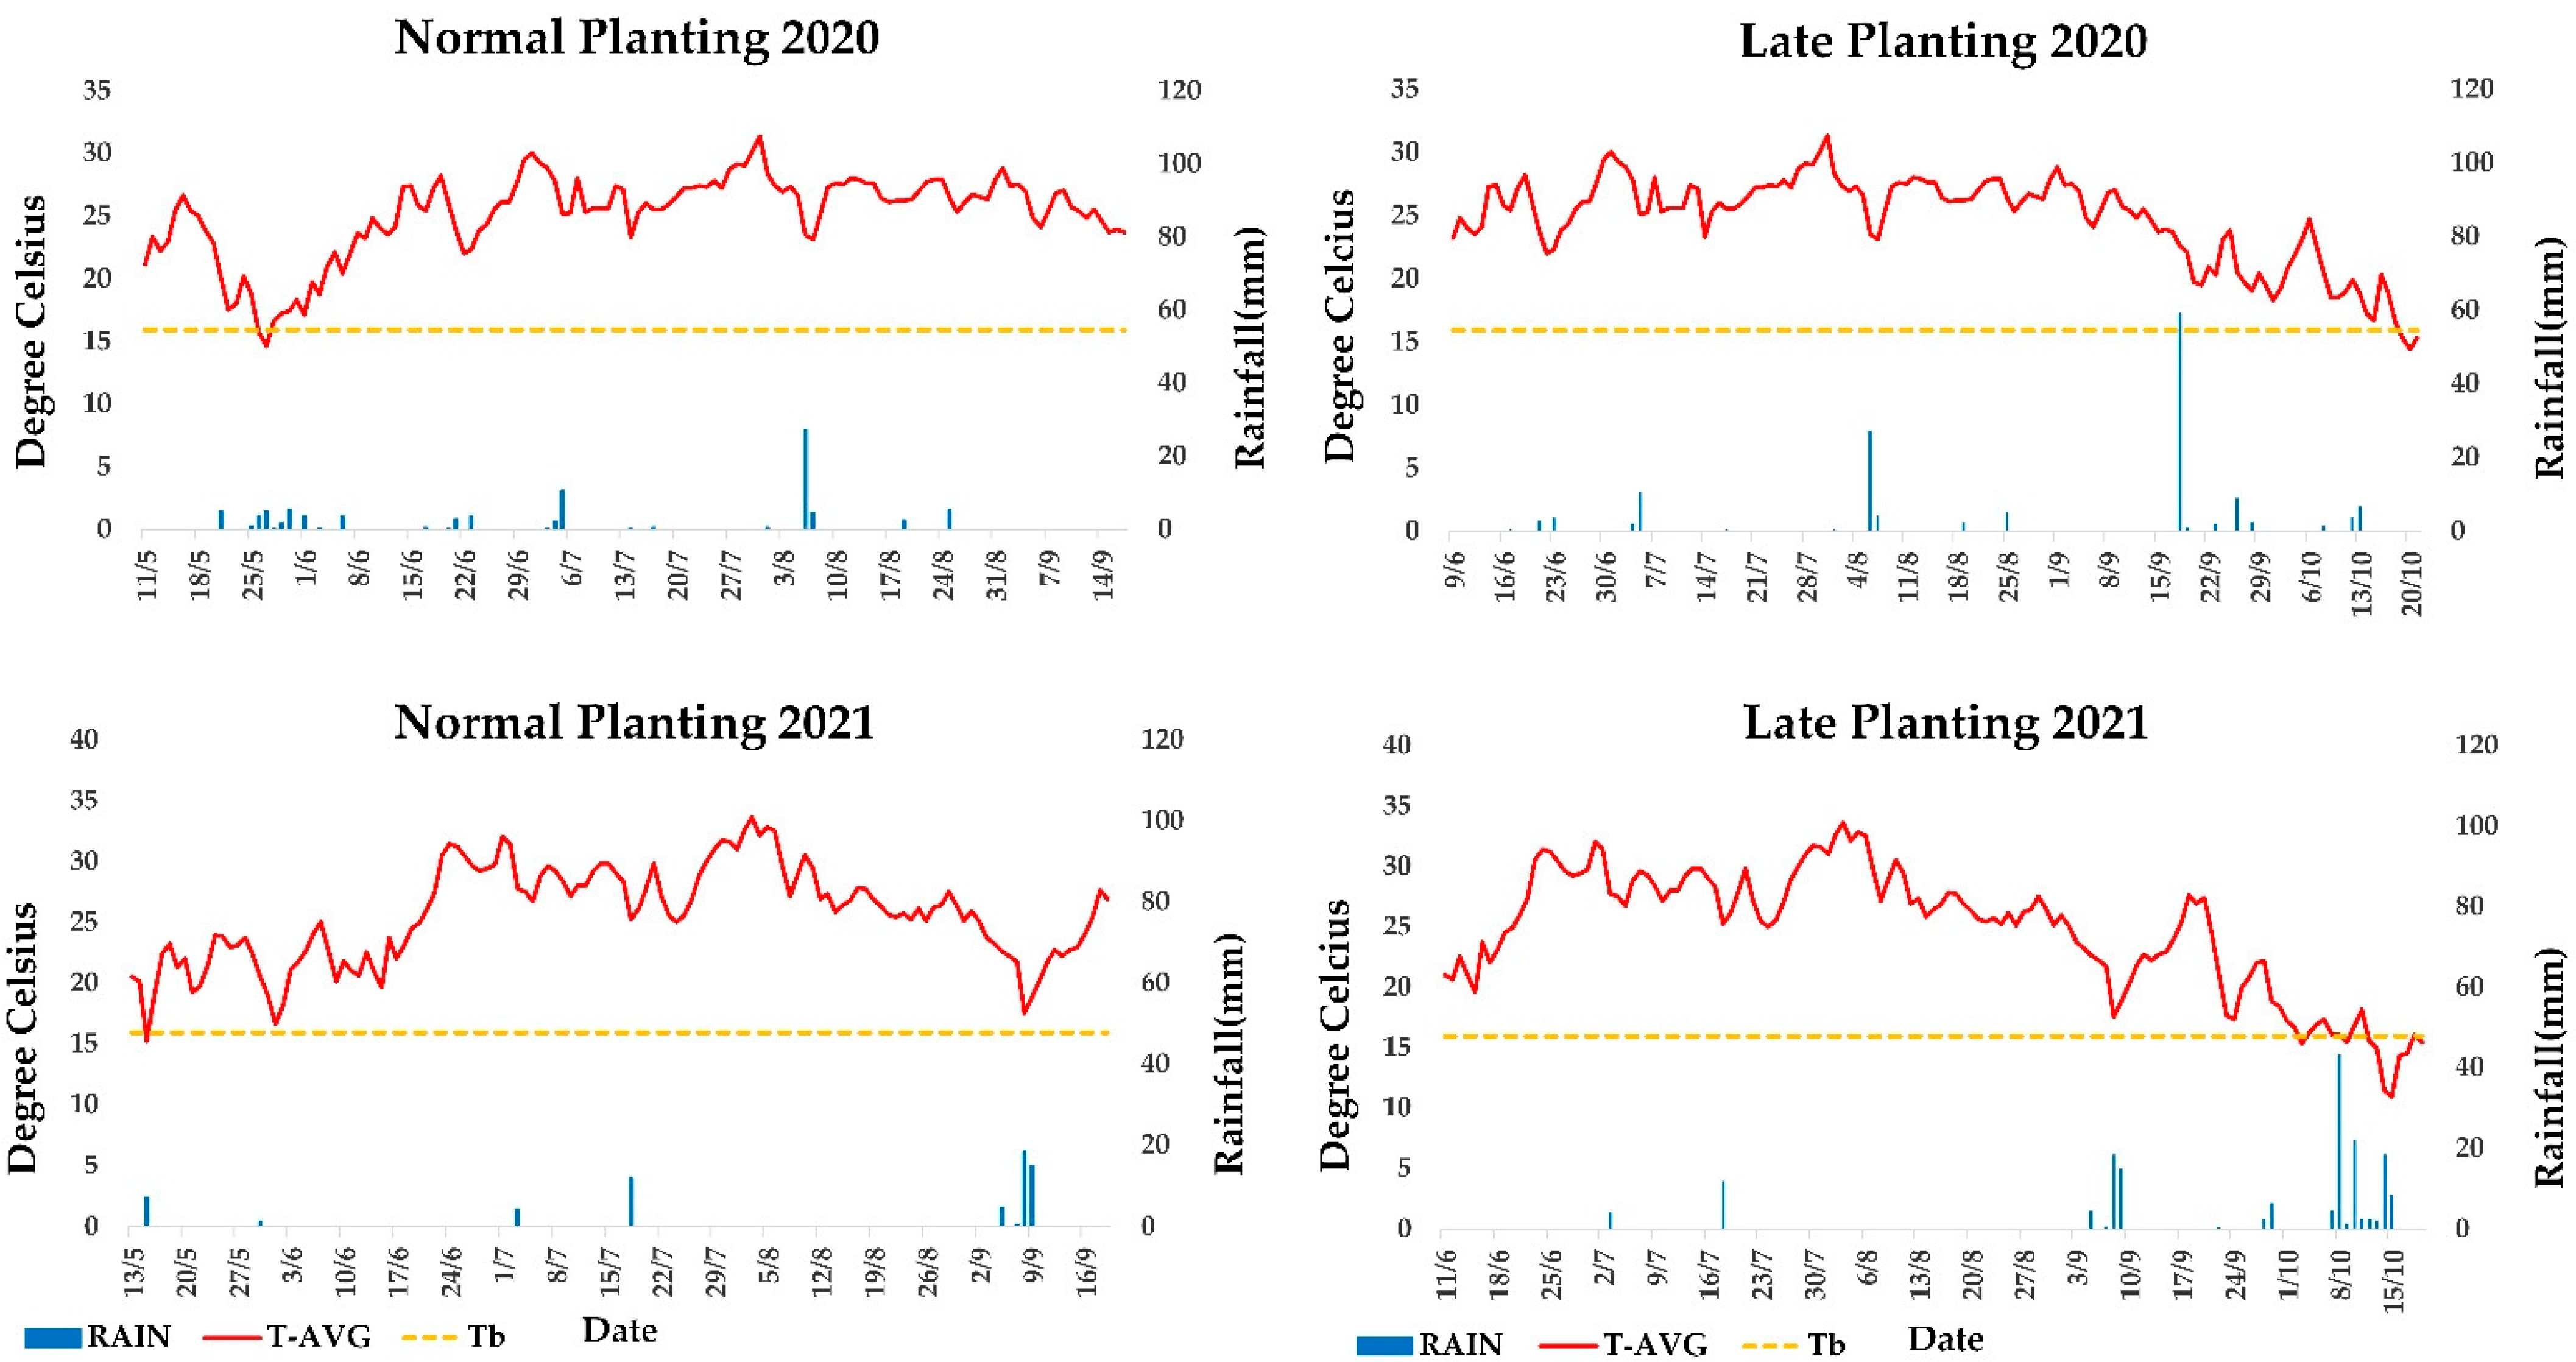
2.5. Growing Degree Days and Weather Parameters
Growing degree day (GDD) values specific for sesame were calculated for each day during the growing season for both planting days. Data on air temperature, precipitation, relative humidity and solar radiation were acquired from the automatic meteorological station that the IIFC operates in collaboration with the National Observatory of Athens (IERSD) in its experimental fields. The following equation was used to calculate daily GDD values (3):
where T
MIN and T
MAX are the daily minimum and maximum temperatures, T
AVG is the daily average temperature, and T
b is the base temperature for sesame. Angus et al. [
57] demonstrated in their study the value of a linear day-degree system for predicting crop phasic development, modeled the response of 44 species to temperature and presented their respective base temperatures. For sesame, it was 15.9 °C, and we used it as Tb [
58]. On days when T
AVG was below T
b, the GDDs for that day were set to 0. Daily GDDs were separately summed to calculate the accumulated GDD value from sowing to harvest.
2.6. Statistical Analysis
The R-program (
www.R-project.org, accessed on 7 February 2022) with the packages Metan and Agricolae were used to perform all the statistical analysis [
59,
60,
61].
An analysis of variance (ANOVA) including the factors sesame line and block was performed on data of separate growing conditions (NP and LP) and cropping years to verify the occurrence of genetic variation among lines for each trait. If significant differences were found, Tukey’s HSD (honestly significant difference) method was used for multiple comparisons (α = 5%). The phenotypic (rp) (5) and genotypic correlation (rg) (4) coefficients between spectral indices and the grain yield were calculated using the following formulas [
62]:
where σ
2g/σ
2p and Covg/Covp refer to the components of genetic and phenotypic variance and covariance, respectively, and X and Y are the two variables.
Broad-sense heritability (H
2) was calculated on a line mean basis for each environment (cropping years, NP, LP) according to Holland [
63]. Broad-sense heritability is the proportion of the phenotypic variance, which is explained by the genetic variance, and was estimated as follows (6):
where σ
2g and σ
2e are the genotypic and residual variance components, respectively, and n is the number of replicated blocks. Relative efficiency of indirect selection (E
r) in SRIs vs. direct selection in yield expressed in percentage, was estimated by the following equation [
64] (7):
where H
SRI and H
Y are the square root of the broad-sense heritability on a line mean basis (H
2) for the SRIs and Yield, respectively, and rg
SRI Y is the genetic correlation between the two criteria. Restricted maximum likelihood with best linear unbiased prediction (REML/BLUP) is a well-known linear mixed model for the estimation of random effects that was used to analyze the SRIs data from every environment (cropping years, NP, LP). The output was
p-values from Likelihood Ratio Test (LRT) of the analyzed SRIs for genotype (GEN) and genotype-vs-environment (GE) as random effects. Broad-sense heritability
(8) on a plot basis over the environments (cropping years, NP, LP) and broad-sense heritability
(9) on an entry mean basis over the environments were also estimated.
where
refer to the variance component relative to GE interaction and e and n are the number of environments and blocks, respectively.
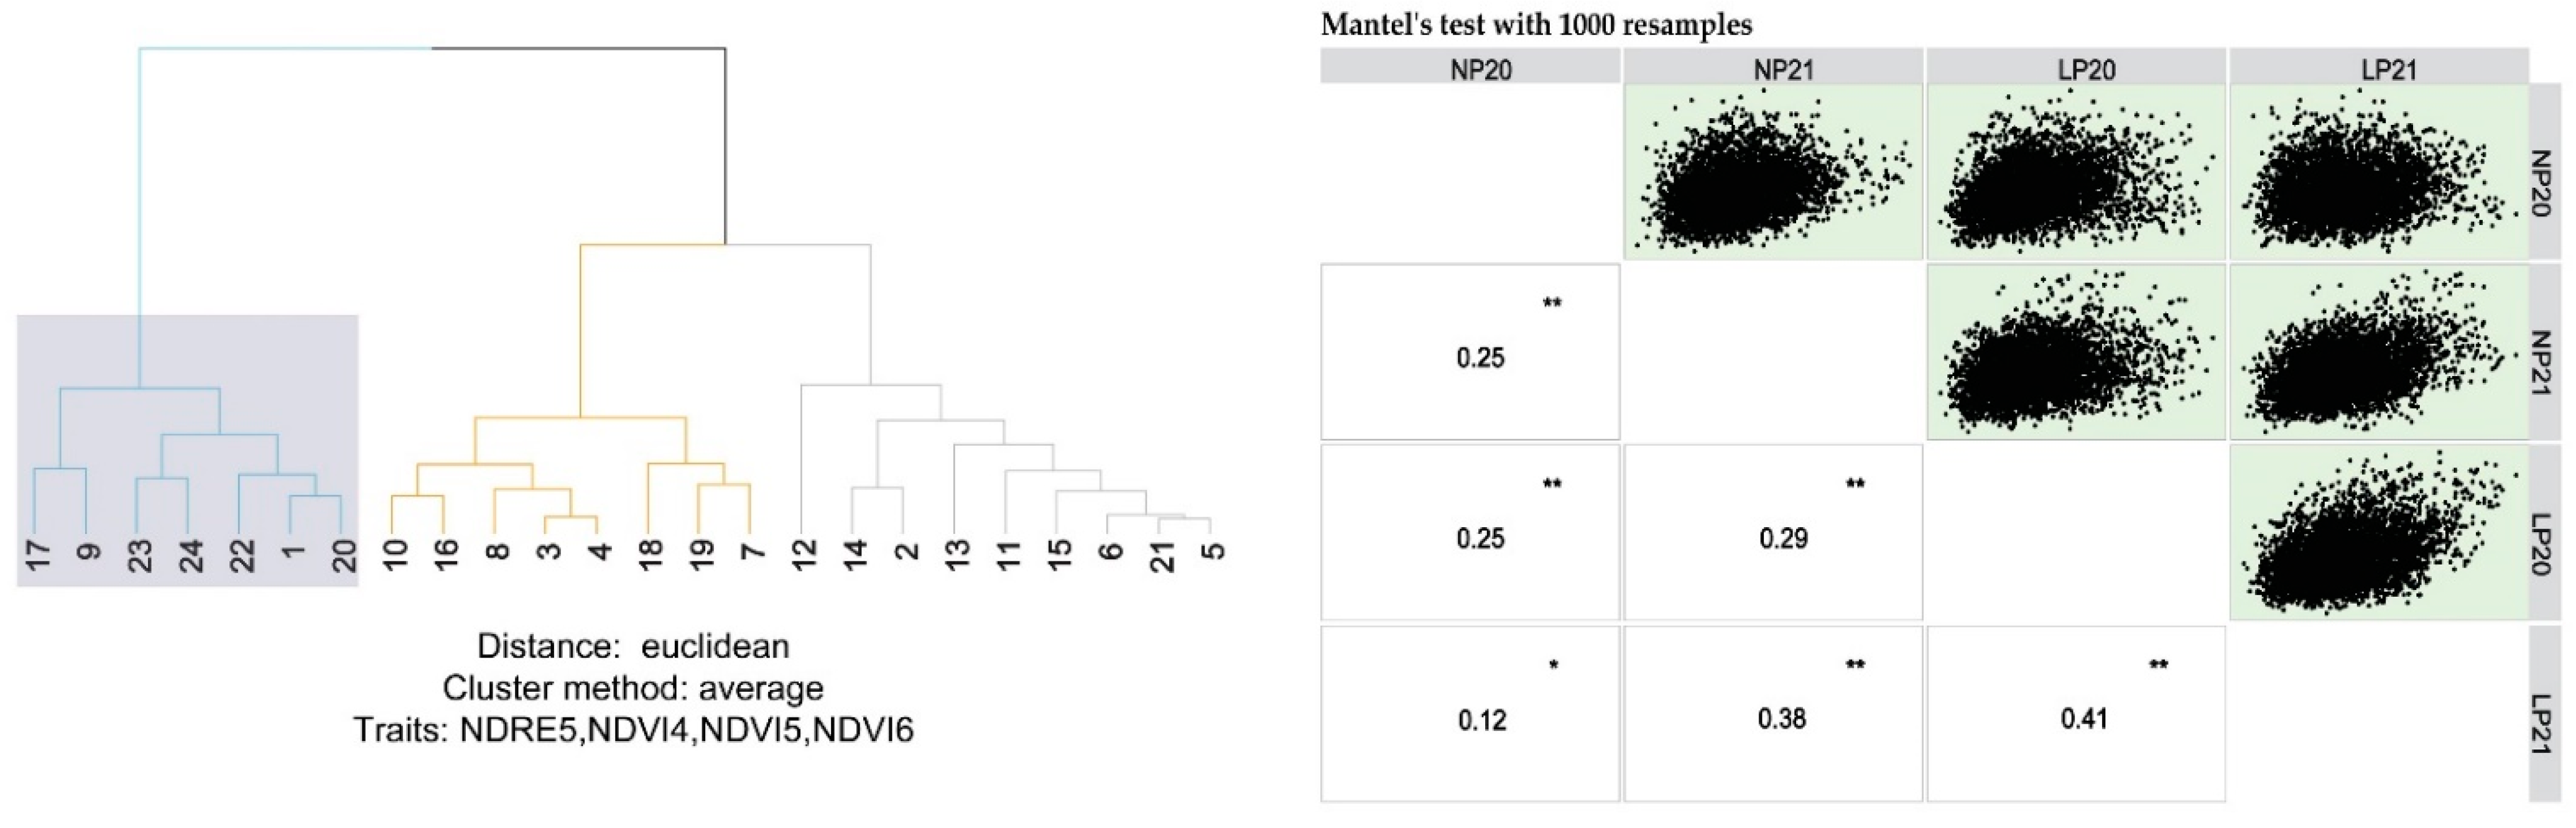
Hierarchical cluster analysis was performed also to compute the Euclidean distances between the genotypes based on the SRIs with the unweighted pair group with arithmetic mean agglomeration method (UPGMA). Mantel’s test was used to check the relationships between the distance matrices when the clustering was performed for separate growing conditions (NP and LP) and cropping years.
4. Discussion
The SRI values of 24 sesame lines and landraces were estimated in this study for the first time using active canopy sensors over the entire growing period and in two different planting dates. Previously, only Dong et al. 2020, in experiments in Texas (USA) [
51], demonstrated ground-based sensing tool usefulness of vegetation indices for characterizing the dry down process of sesame.
The active canopy sensor used in this study distinguished the different genotypes in almost every reflectance monitoring date suggesting that canopy sensors can be used in sesame breeding programs. All the scans produced SRIs with significant variation among genotypes and significant GE interaction.
Both NDVI and NDRE reached about the same accuracy in genotype phenotyping, even under dense biomass conditions (2–5 scans) where “saturation” problems were expected especially for NDVI as has been reported by many researchers for other crops [
65,
66,
67]. At those dense biomass conditions, NDVI demonstrated efficient separation between genotypes probably due to the Crop Circle canopy sensors high properties [
42,
68]. NDRE however acted more precisely in depicting variations among different scan days in regard to NDVI. NDRE produced values (mean from every genotype) at the closed canopy period with differences between consecutive scans up to 13% in regard to 3% differences with NDVI. Therefore, in this study the combination of both indices produced the most accurate sesame phenotyping as suggested by Boiarski et al. [
69].
Generally, genotypic and phenotypic correlations among traits of crop plants are useful in planning, evaluating and setting selection criteria for the desired traits for selection in a breeding program. The genetic correlation between traits describes the intrinsic consistency of genotype response across growing conditions and contributes crucially to assess the predicted efficiency of different phenotypic selection strategies [
70]. The precise estimation of this inherent association requires a genetically diverse population that accounts for sampling error bias in gene frequency [
71]. In our experiment, the 5 landraces and 18 sesame lines derived by them, met the above criterion. Both SRIs significantly correlated with the yield at different monitoring dates throughout growing conditions and cropping years. The highest correlation demonstrated by scans at the end of the sesame reproductive stage and at the beginning of the ripening stage, suggesting the possibility of using these proxy measurements to understand the genetic and physiological basis of yield formation. Overall, these results agree with the findings presented by Dong et al. [
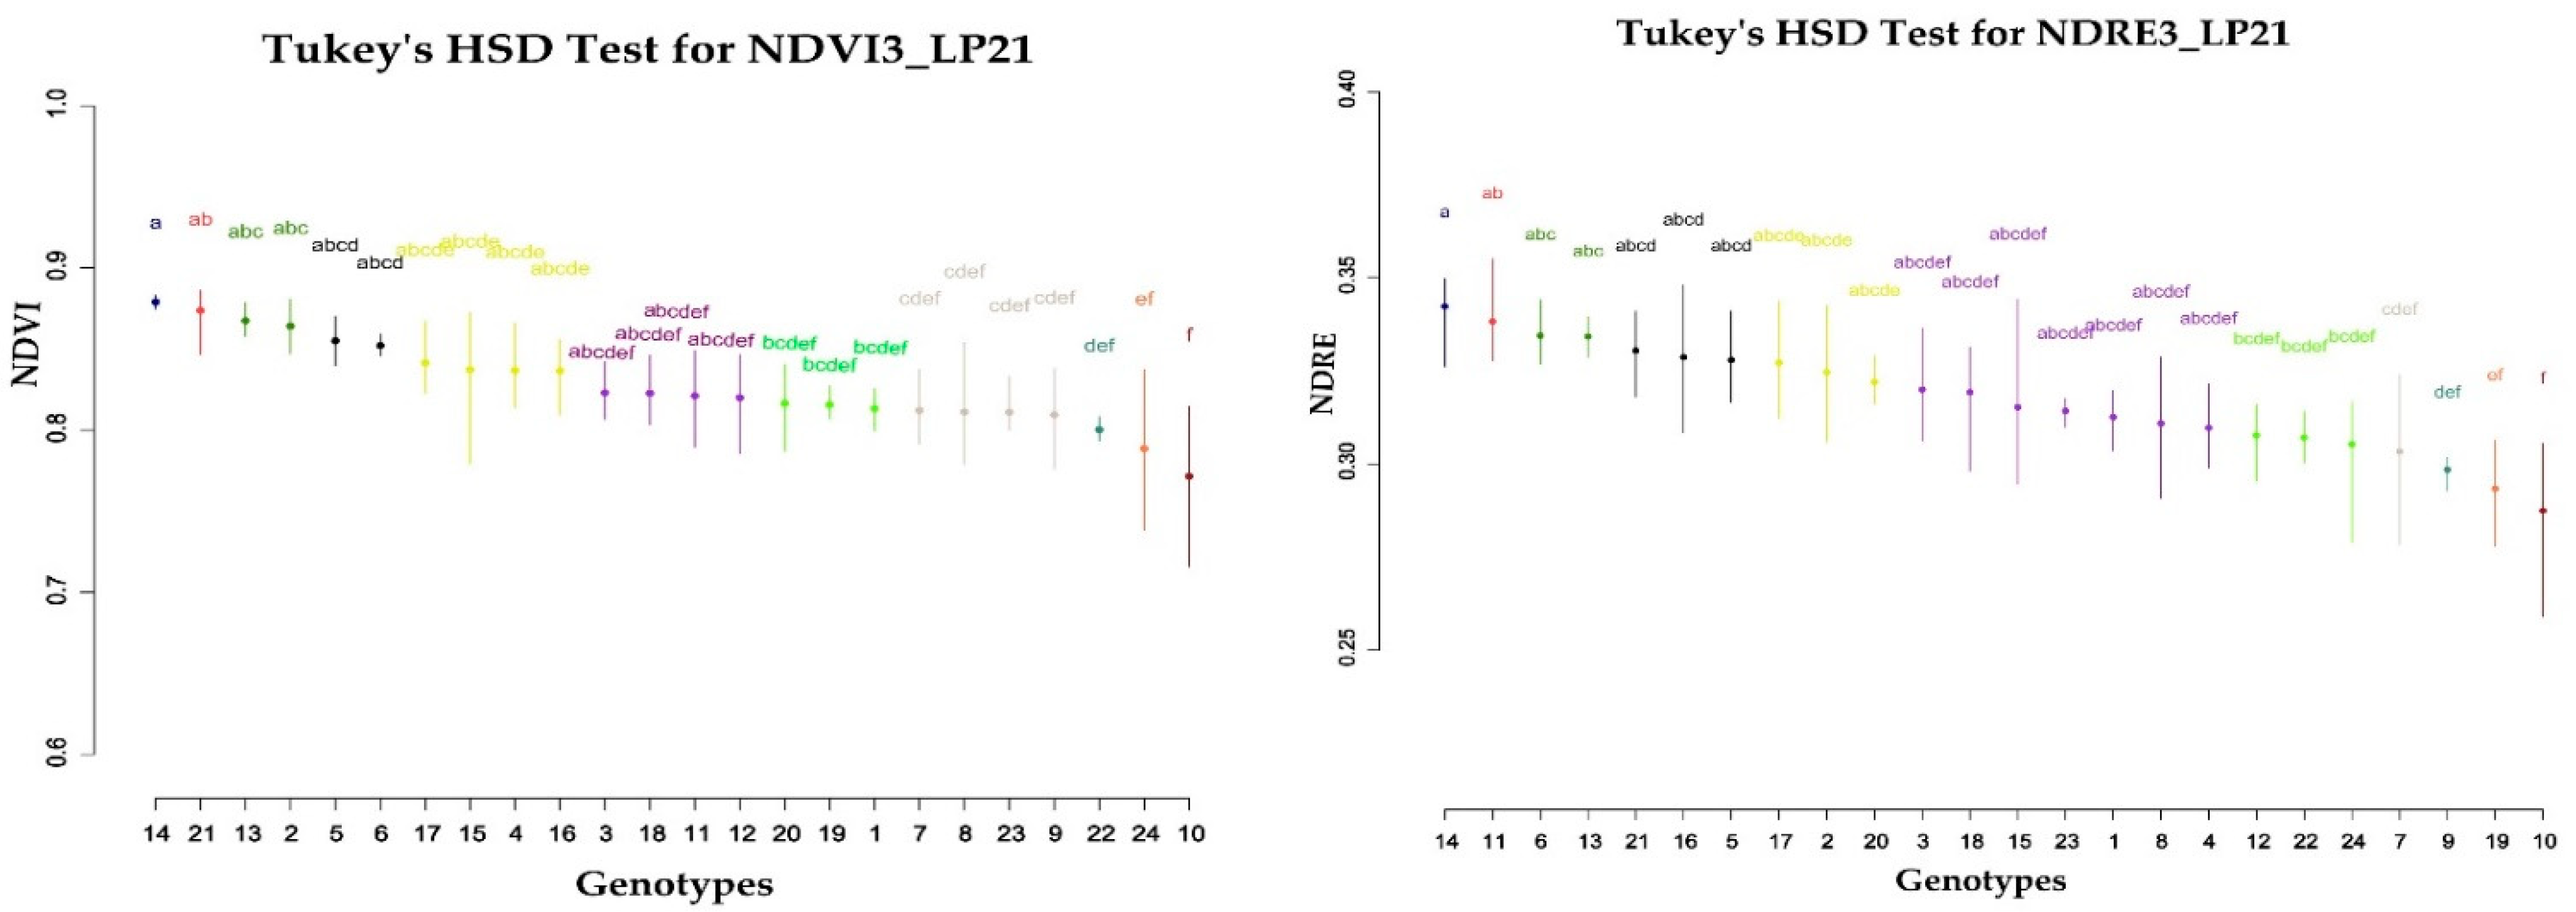
51] where working with 60 sesame genotypes reported that NDVI values during the initial nine days after the end of the ripening stage had a significant relationship with the measured seed yields. However, more research is needed to understand the correlation with yield in the beginning of the ripening stage, when chlorophyll degradation occurs.
At both planting dates and years, genetic correlation coefficients were found to be higher in magnitude than that of phenotypic correlation coefficients in most of the traits, which clearly indicated the presence of inherent association among SRIs and yield. The moderate to strong genetic correlation of SRIs to sesame yield in the late planting conditions indicates the potential use of an indirect selection approach to identify high yielding and stress tolerant genotypes.
The results of this study showed that higher H2 values of vegetation indices were obtained at the end of the reproductive stage and the beginning of the ripening stage. Particularly NDRE5, NDVI5, NDVI6 in 2020 late planting (LP20) displayed values even higher than the yield’s heritability.
Broad sense heritability (H
2) is a parameter that expresses the proportion of the phenotypic variance that can be attributed to variance of all genotypic effects, additivity, dominance and epistasis [
72,
73]. Despite continuous misunderstandings and controversies over its use and application, heritability remains a key issue to the response to selection. Recent reports of substantial heritability for gene expression and new estimation methods using marker data highlight the relevance of heritability in the genomics era [
74]. High heritability and strong phenotypic and genetic correlations between indirect traits and the grain yield are desirable. For the accurate estimation of the relative efficiency (Er) of an alternative indirect selection trait versus direct selection for yield as Falconer proposed and many researchers have followed before [
31,
65,
74,
75,
76], both the genetic correlation between the trait and yield and their heritability values are needed. NDVI5 in LP20 had H
2 0.928, higher than the H
2 value of yield that was 0.847, but the low rg (0.359) between them resulted to 60% less Er for indirect selection. A similar Er value is given by NDRE6 in NP20 with a very low heritability (0.292) and a high rg (0.748). The highest Er value for indirect SRI-based selection, reached 60% in comparison to direct selection for yield. Indirect SRI-based selection produced better results in normal planting for both years when phenotyping was applied at the end of the sesame reproductive stage.
Heritability over the test environments both on a plot basis and on a line mean basis was moderate to high almost for all the phenotyping dates (H2x > 0.20, H2y > 0.70, respectively) for both SRIs, NDVI though demonstrated higher values than NDRE. Nevertheless, SRIs adaptive response was moderate due to their significantly high effect of the genotype with environment interaction. Research in more environments is needed to identify SRIs value for wide adaptation breeding programs.
Cluster analysis highlighted the importance of identifying the monitoring dates for accurate and functional phenotyping. NDVI and NDRE values at the end of growing and the beginning of ripening stages separated the examined genotypes and produced clusters according to their crop growing cycle length. The analysis produced 3 clusters from which the first consists of the short growth cycle genotypes and furthermore it contains the four lowest yielding genotypes. Clusters 2 and 3 contain the medium and late growth cycle genotypes, respectively, clearly suggesting that the spectral reflectance indices could be a functional, economical and easy to use tool for classifying cultivars into groups.
SPAD showed a non-significant distinguishing ability between sesame genotypes in some environments, negative weak or significant correlations with yield and low to moderate heritability. SPAD was the only trait with non-significant GE interaction. The findings of the present study confirmed the superiority of SRIs compared to SPAD measurements as predictors of yield, which is in accordance with similar studies in wheat [
77], but more measures in different stages of the growing period are needed to clarify its contribution to a sesame breeding program.
5. Conclusions
Designing an efficient breeding strategy for improving traits of interest, requires knowledge of quantitative genetic parameters (i.e., variances, heritability, correlated response of traits) and the stability of these parameters across target environments and different genetic backgrounds.
This field study demonstrated the significance of using a ground-based remote sensing tool, such as the simple backpack sensing frame equipped with a Crop Circle sensor, for sesame phenotyping. Both NDVI and NDRE can be used to depict sesame development accurately over the growing season. It was elucidated that in order to use them for accurate genotype differentiation, it is required firstly to identify the monitoring dates with the best phenotyping precision.
Integrating the easily and economically measured spectral reflectance indices in a sesame breeding program can alleviate the costs entailed by a direct selection for yield, a multi-environment selection and the difficulty of applying both of them to early selection stages.
For future research, spectral reflectance in sesame breeding should be studied, not just as a standalone indirect selection criterion, but also as a component in an integrated selection approach. More frequent monitoring of the vegetation indices during the important time window that encompasses the late flowering and the beginning of the ripening stage is recommended to capture detailed changes in sesame canopy features. In addition, combining data from different monitoring days to create a complex SRI index could improve genotype classification and genetic correlation with yield.


 ,
, 


