Article

Comprehensive Validation and Comparison of Three VIIRS Aerosol Products over the Ocean on a Global Scale

1
School of Geographic Information and Tourism, Chuzhou University, Chuzhou 239099, China
2
Hunan Key Laboratory of Remote Sensing of Ecological Environment in Dongting Lake Area, School of Geography and Information Engineering, China University of Geosciences, Wuhan 430074, China
3
Key Laboratory of Regional Ecology and Environmental Change, School of Geography and Information Engineering, China University of Geosciences, Wuhan 430074, China
*
Author to whom correspondence should be addressed.
Remote Sens. 2022, 14(11), 2544; https://doi.org/10.3390/rs14112544
Submission received: 29 April 2022 / Revised: 22 May 2022 / Accepted: 24 May 2022 / Published: 26 May 2022
(This article belongs to the Section Atmospheric Remote Sensing)

Abstract

:
Three parallel Visible/Infrared Imager Radiometer Suite (VIIRS) aerosol products (SOAR, NOAA, and AERDT) provided data since 2012. It is necessary to study the performances and advantages of different products. This study aims to analyze the accuracy and error of these products over the ocean and compare them with each other. The results show that the three VIIRS ocean aerosol retrievals (including total aerosol optical depth (AOD), fine mode fraction, Ångström exponent (AE), and fine AOD (AODF)) correlate well with AErosol RObotic NETwork (AERONET) retrievals (e.g., correlation >0.895 for AOD and >0.825 for AE), which are comparable to the newest moderate-resolution imaging spectro-radiometer (MODIS) retrievals. Overall, the SOAR retrievals with quality filtering have the best validation accuracy of all parameters. Therefore, it is more recommended to use. The differences in the annual AOD spatial patterns of different products are small (bias < 0.016), but their AE spatial patterns are evidently different (bias > 0.315), indicating the large uncertainty of VIIRS AE. Error analysis shows that the scattering angle and wind speed affect aerosol retrieval. Application of the non-spherical dust model may reduce the dependence of retrieval bias on the scattering angle. Overall, this study provides validation support for VIIRS products usage and possible algorithm improvements.

1. Introduction

Aerosols, as an important component of the atmosphere, influence the cloud property, Earth’s radiation balance, and global climate change [1,2,3,4]. Excessive aerosols affect human health and life as pollutants (such as PM2.5) [5]. With the development of remote sensing technology, satellite aerosol observation from space has been widely used in related scientific research [6].
The ocean surface reflectance is stable and low, which is suitable for aerosol measurements using satellites [7,8]. This is because the aerosol signal accounts for a higher proportion of satellite-observed reflectance at a low surface reflectance. For example, Geogdzhayev et al. [9] developed a two-channel aerosol retrieval algorithm over the ocean and applied it to global Advanced Very High-Resolution Radiometer (AVHRR) observations for retrieving aerosol optical depth (AOD) and Ångström exponent (AE). Preliminary validation results of the AOD retrieved by the algorithm show that it correlates well with the AOD measured by the sun photometer [10]. Owing to the good and stable radiation performance of sea-viewing wide field-of-view sensor (SeaWiFS) and moderate-resolution imaging spectro-radiometer (MODIS) sensors, it is reliable to use them to retrieve aerosol properties over the ocean. For example, Sayer et al. [11] developed the Satellite Ocean Aerosol Retrieval (SOAR) algorithm for SeaWiFS. Its validation results show that the correlation of AOD is >0.85, and the correlation of AE is 0.78 when AOD is greater than 0.3. The MODIS operational aerosol product over the ocean also has good validation accuracy of AOD and AE [12]. Although these preliminary validations and comparisons are promising, they are limited compared to a large number of aerosol validations over land. And most studies validated AOD and AE for ocean aerosol products, however, fine mode fraction (FMF) and fine mode AOD (AODF) parameters had only limited comparison (e.g., [13]). These parameters are important and can be used in climate change research [14,15].
As the successor to AVHRR, SeaWiFS, and MODIS, the Visible/Infrared Imager Radiometer Suite (VIIRS) is also used for aerosol retrieval over the ocean. There are currently three parallel VIIRS ocean aerosol products, including the EDR product developed by National Oceanic and Atmospheric Administration (NOAA), the AERDT product developed by the National Aeronautics and Space Administration (NASA) Dark Target (DT) team, and the SOAR product developed by the NASA Deep Blue (DB) team [16,17,18]. Huang et al. [19] validated the AOD and AE of NOAA product using the AErosol RObotic NETwork (AERONET) measurements. Sayer et al. [20] evaluated the AOD, AE, and FMF parameters of the SOAR product. Sawyer et al. [17] evaluated the performance of AERDT AOD and compared it with MODIS operational AOD. Note that the above three VIIRS ocean aerosol products directly retrieve AOD and FMF and can derive AE and AODF. Similar to product validations for other sensors (mentioned above), studies evaluating these four parameters from VIIRS simultaneously are lacking. Comparing the performance of different aerosol products (retrieved from the same or different sensors) and providing usage recommendations is important to data users. For example, Sayer et al. [21] compared MODIS DT, DB, and the merged product of DT and DB over land and provided their usage recommendations. Liu et al. [22] comprehensively evaluated and compared the performance of MODIS DT, DB, and Multiangle Implementation of the Atmospheric Correction AOD products over mainland China. He et al. [23] validated and compared the performance of VIIRS EDR and DB AOD products over land in the Chinese mainland area. However, similar studies over the ocean for all available VIIRS products (Table 1) are limited. Therefore, it is necessary to compare the three different VIIRS aerosol products over the ocean to understand their performances and advantages. This study aims to comprehensively evaluate and compare the accuracy, error, and spatial pattern of AOD, AE, FMF, and AODF retrieved by the three VIIRS ocean aerosol algorithms using consistent validation standards and data.
Section 2 summarizes the data sets used, including the VIIRS, MODIS, and AERONET aerosol products. Section 3 presents the validation and comparison results. Section 4 provides some discussions. Section 5 summarizes this study.

2. Materials and Methods

The VIIRS sensor onboard the S-NPP satellite has 22 channels. Its spatial resolution is approximately 375–750 m and it passes through the equator at approximately 1:30 p.m. local time. Since 2012, it has provided extensive observations of land, atmosphere, and ocean from space. Based on the useful VIIRS data, three different aerosol products were developed. This study uses data from the full year of 2018. For convenience, NOAA denotes NOAA-EDR product or algorithm over the ocean, AERDT denotes AERDT product or algorithm over the ocean, and SOAR denotes SOAR product or algorithm over the ocean. Hereafter, the wavelength of AOD, FMF, and AODF is 550 nm, and the wavelength of AE is 550–870 nm.

2.1. AERDT Aerosol Algorithm and Product

To produce long-term aerosol records from satellites, the NASA Dark Target (DT) team developed the VIIRS DT algorithm to extend the current satellite DT product (e.g., from MODIS DT to AERDT) [17,24]. In general, the VIIRS ocean DT algorithm inherits from that of MODIS. However, because of the difference between the spectral response functions of VIIRS and MODIS sensors, parameters such as atmospheric water vapor, ozone correction coefficients, and Rayleigh optical depth of the VIIRS spectral bands need to be re-derived [25]. The AERDT algorithm takes as input the 750 m resolution TOA reflectance of 6-minute granule data processed by NASA. Then unsuitable pixels (such as clouds, ice, ocean glints, and land) are removed. A 6 × 6 spatial window is used to aggregate pixels to a coarser resolution for a higher signal-to-noise ratio and better retrieval efficiency. In the 6 × 6 box, the algorithm removes the darkest and brightest 25% of pixels in the 0.87 µm band. Additionally, it takes the average of the remaining pixels as the reflectance of the box, which is an approximately 6-km resolution. The box reflectance will be trace gas corrected to obtain the final TOA reflectance used for the aerosol retrieval. The appropriate TOA spectral reflectance (0.55, 0.67, 0.87, 1.24, 1.61, and 2.25 µm) is compared with the spectral reflectance calculated by the look-up table, and the average of the acceptable retrieval solutions is taken to obtain the AOD and FMF, and then the AE is calculated. The spatial resolution of all parameters of the AERDT product is 6 km (Table 1).
Table 1. Summary of the three VIIRS aerosol datasets used in this study.
ProductsFieldParameterDownload
AERDTEffective_Optical_Depth_Average_OceanAODhttps://earthdata.nasa.gov, last access: 23 May 2022.
Optical_Depth_Ratio_Small_Ocean_0p55micronFMF
Angstrom_Exponent_1_OceanAE
Land_Ocean_Quality_FlagQuality flag
NOAAAerosolOpticalDepth_at_550 nmAODhttps://www.avl.class.noaa.gov, last access: 23 May 2022.
SmallModeFractionFMF
AngstromExponentAE
QF1_VIIRSAEROEDRQuality flag
SOARAerosol_Optical_Thickness_550_Ocean_Best_EstimateAODhttps://earthdata.nasa.gov, last access: 23 May 2022.
Fine_Mode_Fraction_550_Ocean_Best_EstimateFMF
Angstrom_Exponent_Ocean_Best_EstimateAE
Solar_Zenith_AngleSolar zenith angle
Viewing_Zenith_AngleSatellite zenith angle
Scattering_AngleScattering angle
Wind_SpeedWind speed

2.2. NOAA Aerosol Algorithm and Product

NOAA’s ocean aerosol algorithm, described in Jackson et al. [16], is very similar to that of the AERDT. They share similar retrieval strategies and aerosol model parameters, but there are some differences. The NOAA algorithm does not retrieve aerosols over large inland lakes. It replaces the 0.55 µm band used by the AERDT algorithm with the 0.746 µm band. Additionally, it reports the retrieval of the optimal solution instead of the average of the acceptable solutions. The upper limit of AOD retrieval of the NOAA algorithm is 2.0, while that of the AERDT algorithm is 5.0. Their pixel aggregation methods are different. NOAA algorithm first retrieves 750 m resolution aerosol properties and then aggregates them to a 6-km coarse resolution (Table 1).

2.3. SOAR Aerosol Algorithm and Product

The SOAR algorithm used by the AERDB product is described in Sayer et al. [18], which differs from the NOAA and AERDT algorithms. It has two retrieval schemes, a full retrieval, and a backup retrieval, depending on whether the ocean surface is turbid. In the open ocean, SOAR uses the full retrieval based on seven bands (0.49, 0.55, 0.67, 0.87, 1.24, 1.61, and 2.25 µm), while on turbid water surfaces it uses the backup retrieval based on the four near-infrared bands (0.87, 1.24, 1.61, and 2.25 µm). SOAR’s aerosol model is based on internal limited mixing of the coarse and fine modes, i.e., limiting FMF to a reasonable range (Table 2 in [18]), rather than the free mixing approach used by AERDT and NOAA algorithms. SOAR uses a non-spherical dust optical model instead of the spherical one used by AERDT and NOAA [26]. The improvement of the dust model has a large impact on the retrieval results, which will be discussed later. In terms of retrieval strategy, SOAR uses the optimal estimation theory, with AOD and FMF as free parameters, and its initial value is determined by the AOD and FMF nodes in the look-up table with the smallest residual error. When the spectral AOD and FMF are determined, then AE is calculated using 550 and 870 nm AOD. SOAR first retrieves aerosol properties at a 750 m resolution and then aggregates them to a 6-km resolution (Table 1).

2.4. MODIS Aerosol Data

MODIS aerosol products (MOD04 and MYD04) over the ocean have been widely validated and used (e.g., [12,27,28]). Therefore, this study used MYD04 data as a comparison to characterize the relative accuracy of VIIRS aerosol products. MYD04 is chosen instead of MOD04 because MYD04 has better validation accuracy and is close to the VIIRS imaging time [29]. MYD04 also records AOD, AE, and FMF properties, but at a 10-km resolution.

2.5. AERONET Data

The uncertainty of direct-solar AOD observations from AERONET is small (~0.01 in visible), so it serves as a ground benchmark to validate satellite retrievals [30,31,32]. The newly released version 3 data applies automated cloud screening and instrument anomaly quality control technique, which greatly speeds up the production of level 2 data [33]. In this study, level 2 AERONET AOD and AE data of version 3 are used. AERONET Spectral Deconvolution Algorithm (SDA) and standard inversion products provide FMF parameters [34,35]. Because of the better temporal sampling of SDA FMF, it is used to compare satellite FMF and AODF retrieval [36]. Note that the uncertainty of the SDA FMF is approximately 0.1 [34].

2.6. Validation Method

All AERONET sun photometers provide AOD at 440, 675, 870, and 1020 nm, some instruments provide other additional wavelengths (e.g., 340, 380, and 500 nm). However, none of them provide 550 nm AOD, instead, 550 nm AOD is the most commonly used by satellite retrieval. Therefore, the quadratic log interpolation method was used to calculate the AERONET 550 nm AOD from the other wavelengths of AOD using Equation (1) [20,30,36]. Then, the 550 and 870 nm AODs are used to calculate the AE, which is for direct comparison with the satellite-retrieved AE. AERONET SDA product only provides 500 nm FMF. For direct comparison with FMF and AODF retrievals from VIIRS, the SDA total and fine mode AOD is interpolated to 550 nm using corresponding AE, and then the 550 nm FMF is calculated using Equation (2) [20]. Since the spatiotemporal sampling of AERONET retrieval and satellite retrieval is inconsistent, they require spatiotemporal matching. In this study, a temporal window of ±30 min is used to calculate the median AERONET retrieval, and a spatial window of ±25 km is used to calculate the median satellite retrieval. Note that only the satellite retrievals with quality filtering are used for comparison. The minimum number of AERONET values allowed within the window is one, and the minimum fraction of valid satellite values is 20% [17,20].
log ( τ λ ) = a 0 + a 1 log ( λ ) + a 2 log ( λ ) 2
where τ λ is the AOD at wavelength λ; a 0 , a 1 , and a 2 are the fitting coefficients, which are commonly calculated by AOD at 440, 500, 675, and 870 nm using each AERONET record.
f 550 = τ 550 f / τ 550 t
where τ 550 f , τ 550 t , and f 550 are fine mode AOD, total AODT, and FMF at 550 nm, respectively.
The metrics used to evaluate VIIRS ocean aerosol products include: (1) the number (N) is the volume of matching pairs. (2) the correlation coefficient (R) is used to characterize the variation consistency between satellite retrieval and sun photometer retrieval. (3) Mean bias (MB) is used to characterize the overall overestimation or underestimation of satellite retrieval. (4) Mean absolute error (MAE) and root mean square error (RMSE) are used to characterize the overall error of satellite retrieval. Note that MAE and RMSE are related to the level of comparison values and RMSE is easily affected by outliers. (5) The expected error is used to characterize the fraction of satellite retrieval that meets the expected accuracy, and it is generally believed that the fraction should be greater than 68% (i.e., one standard deviation). Equations (3)–(5) represent the expected errors for the AOD (EE), AE (EE_AE), and FMF (EE_FMF), respectively. The Global Climate Observing System (GCOS) provides the expected accuracy of AOD for long-term climate change research as Equation (6).
EE = ± ( 0.03 + 10 % × τ AERONET )
EE _ AE = α AERONET ± 0.4
EE _ FMF = f AERONET ± 0.2
GCOS = maximum ( 0.03 ,   10 % × τ AERONET )
where, τ AERONET , α AERONET , and f AERONET is AERONET AOD, AE, and FMF, respectively.

3. Results

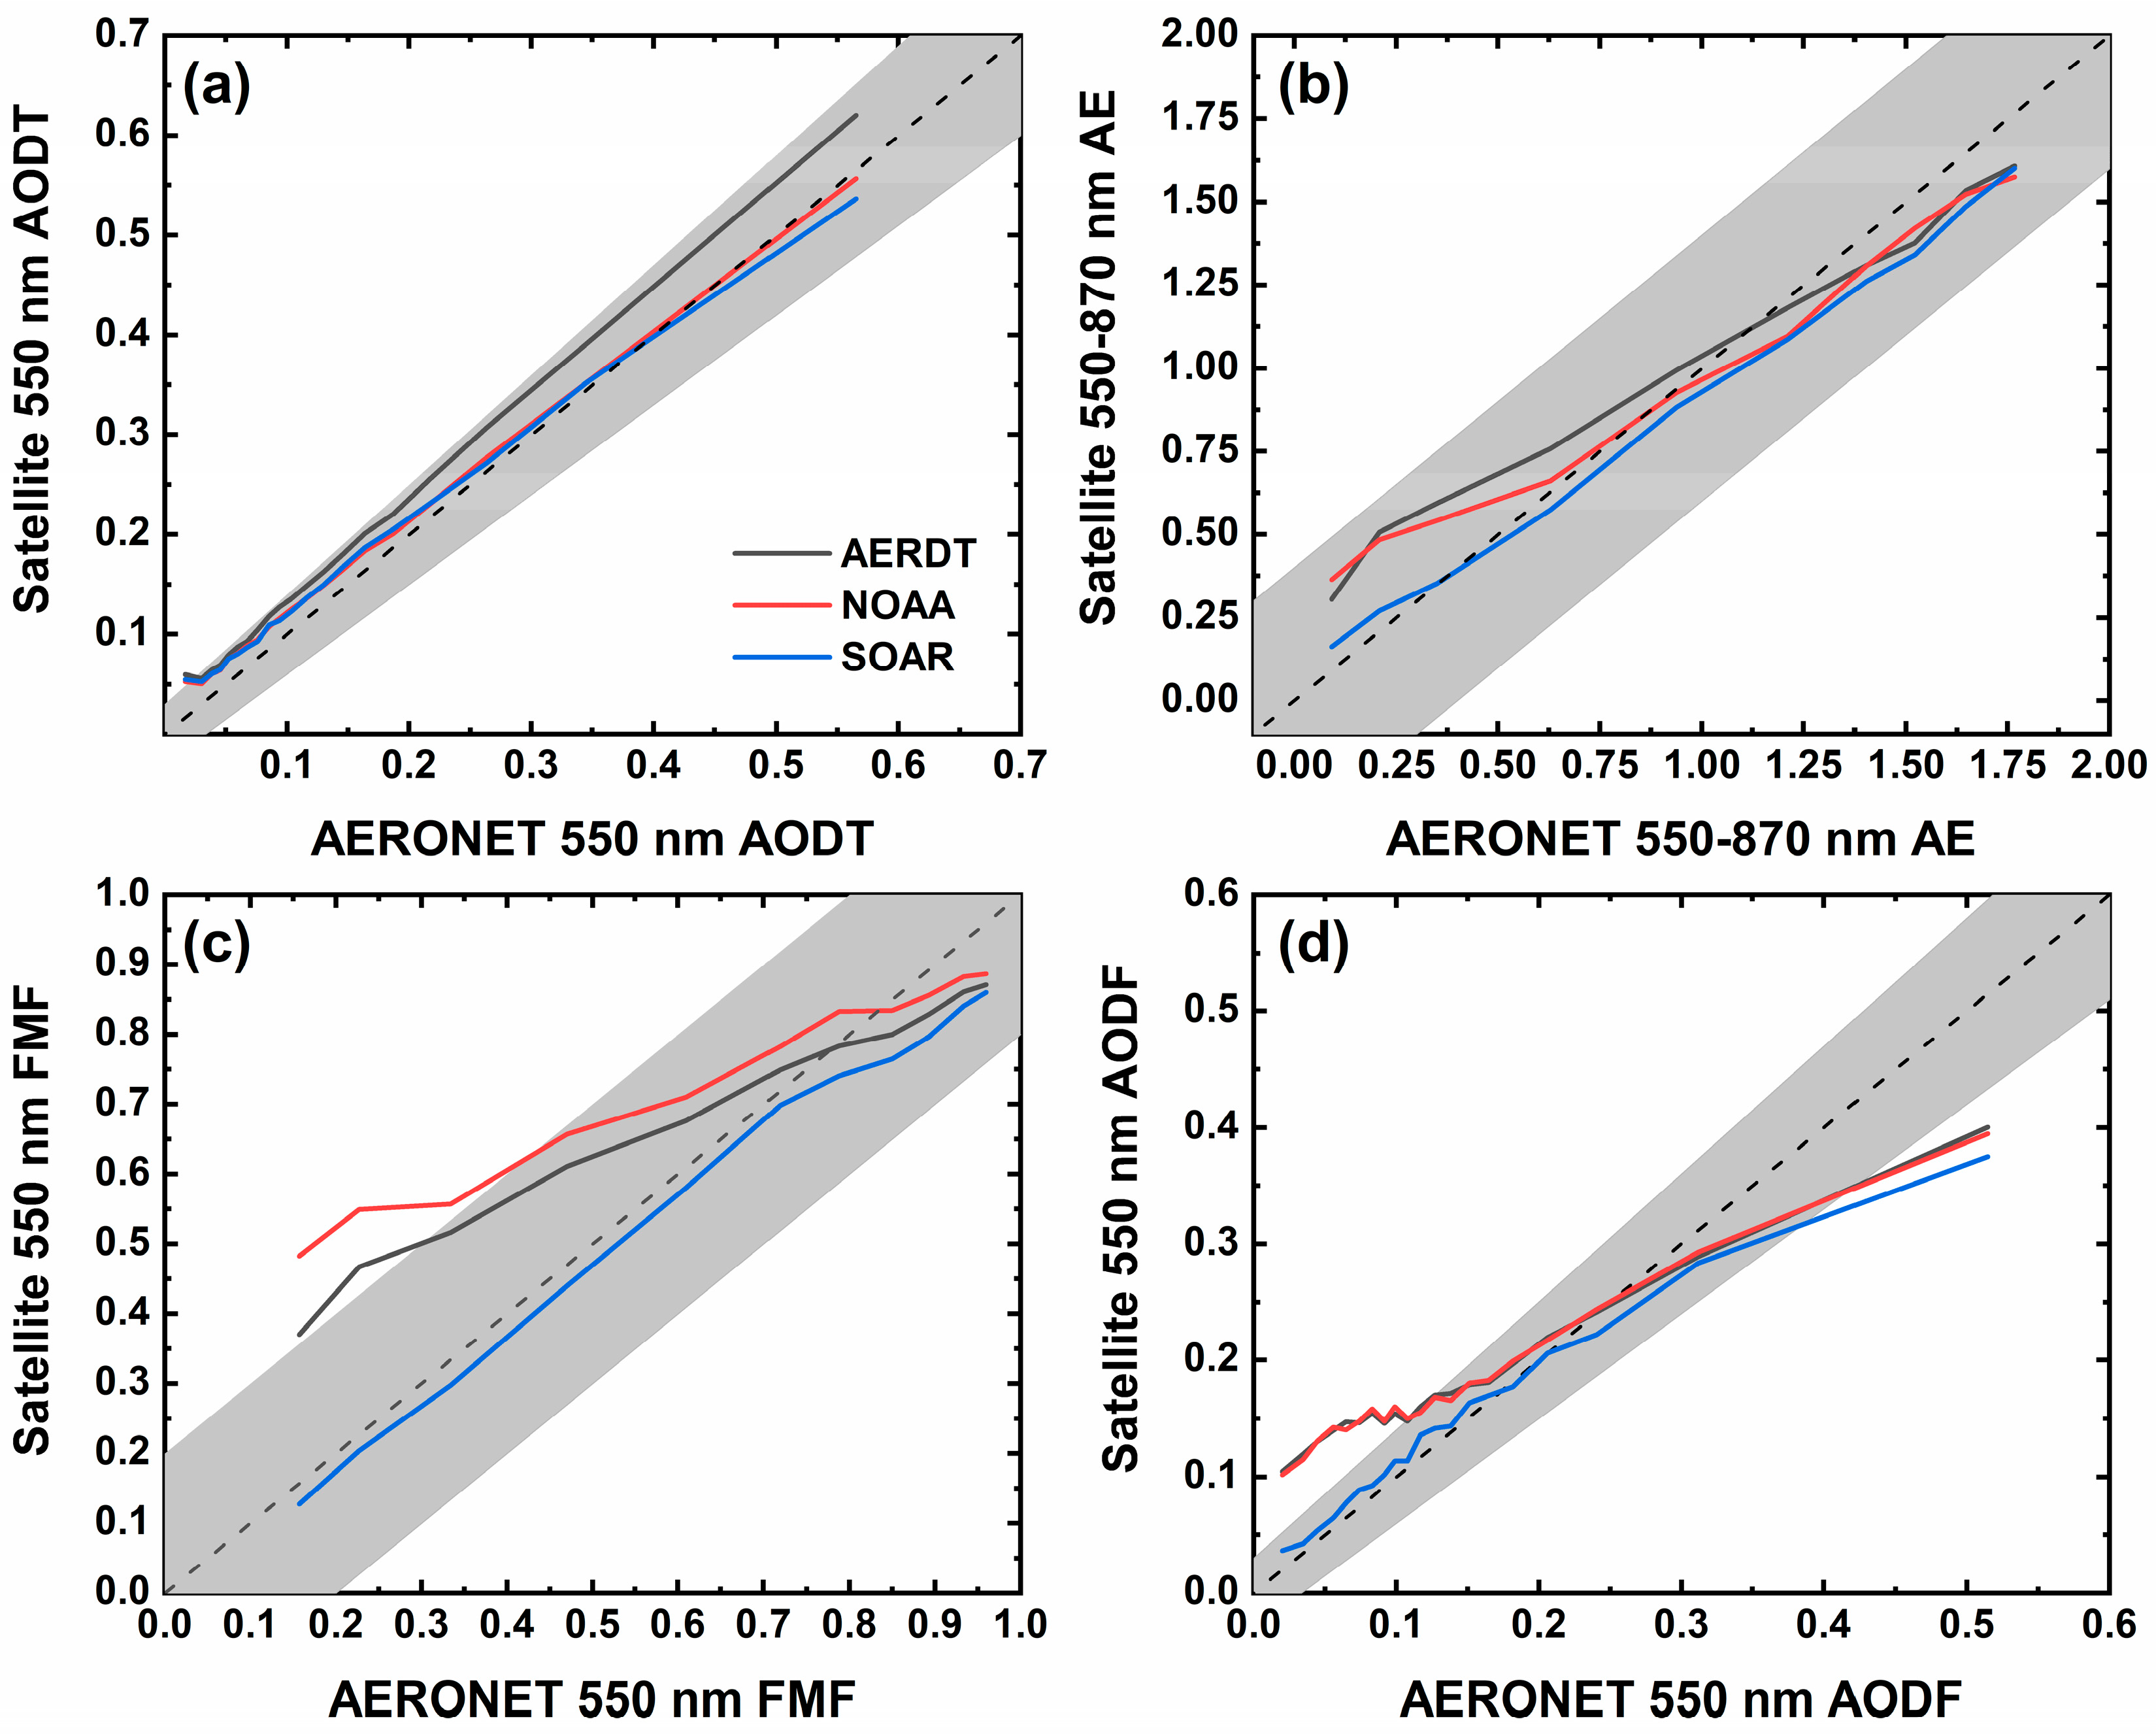
3.1. Overall Comparison Results with AERONET

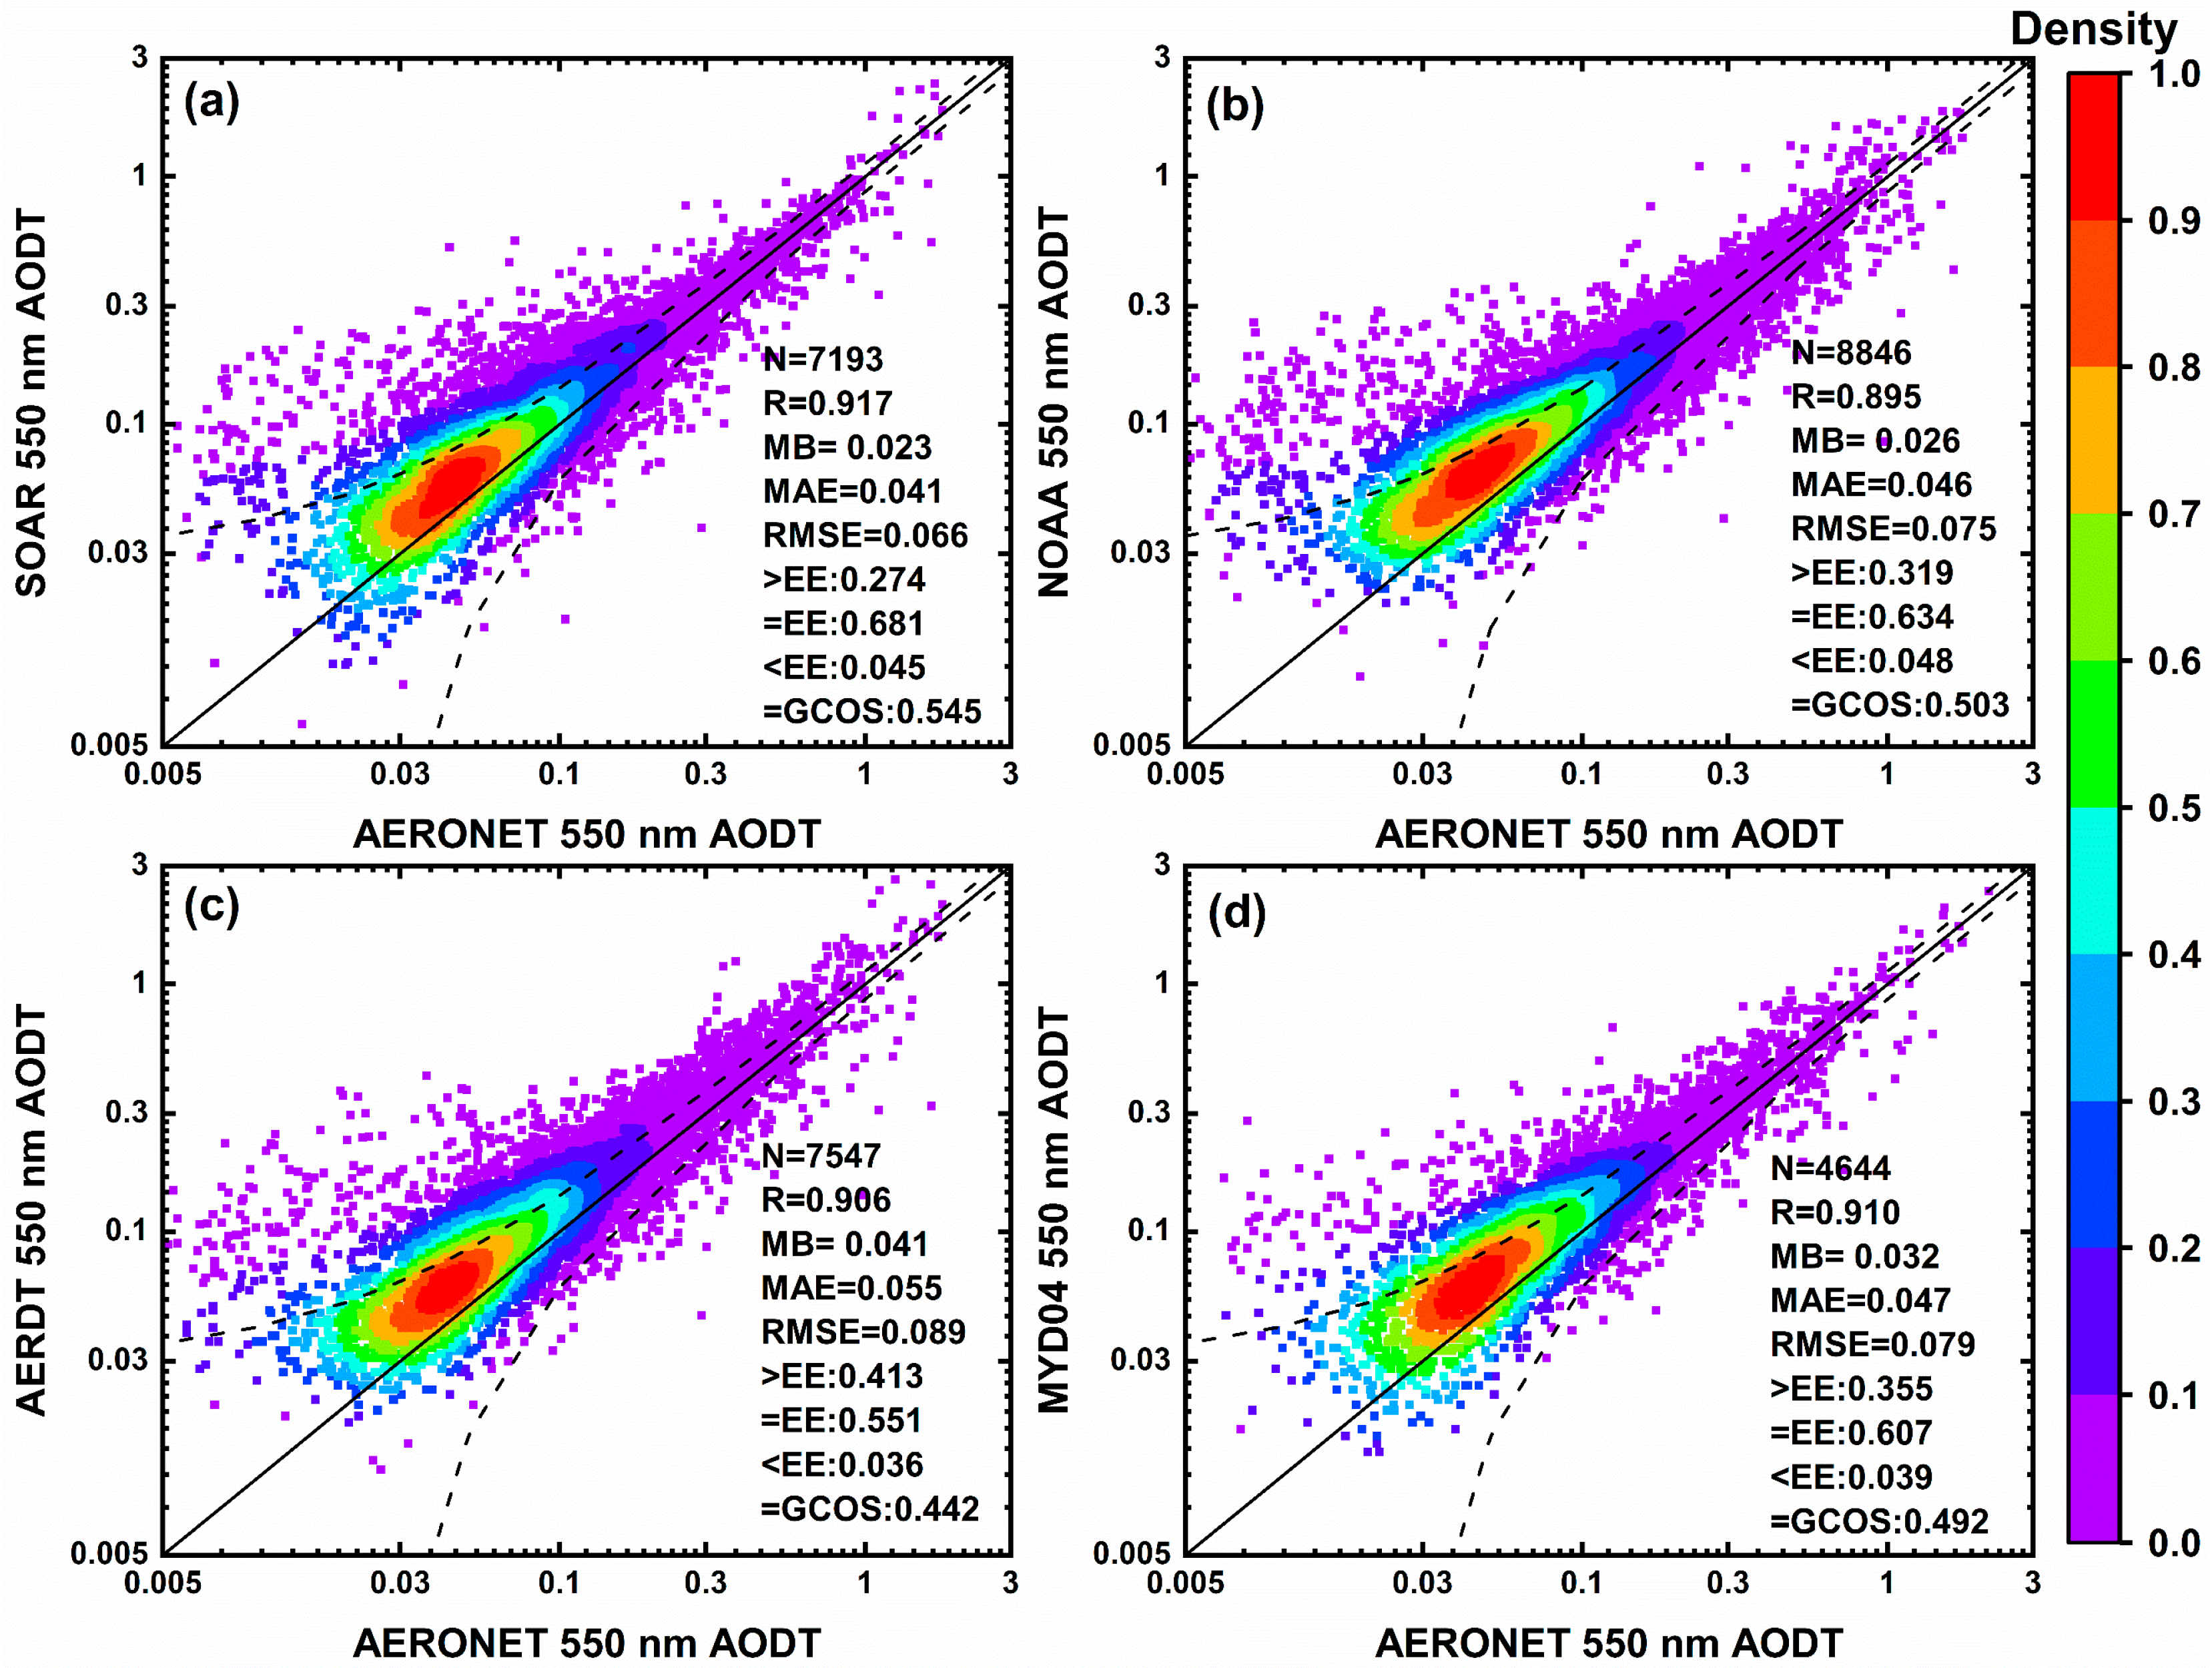
3.1.1. Aerosol Optical Depth

The validation results of the total AOD are shown in Figure 1. SOAR AOD metrics (EE:0.681 and GCOS:0.545) are similar to those of Sayer et al. [20] (EE:0.66 and GCOS:0.49–0.52). The NOAA AOD RMSE (0.075) is slightly larger than the result (0.065) of Huang et al. [19]. The EE of MYD04 AOD in the study of Levy et al. [12] is higher than that of our result (Figure 1d), which is owing to their use of a more relaxed EE formula. The ocean AOD of all products has a good correlation with the AERONET AOD with the R of 0.895–0.917. SOAR AOD has the best performance with smaller errors (MAE and RMSE) and higher EE and GCOS fractions. The fraction of SOAR AOD falling on EE is 0.681, which meets the goal of EE (~0.68). The fraction within EE of NOAA AOD is 0.634. Both of them have better accuracy than MYD04 AOD (EE of 0.607). In contrast, AERDT using the same algorithm as MYD04 has lower accuracy than MYD04 AOD. Overall, except for AERDT AOD, SOAR and NOAA AOD are equal to or better than the MYD04 AOD level.

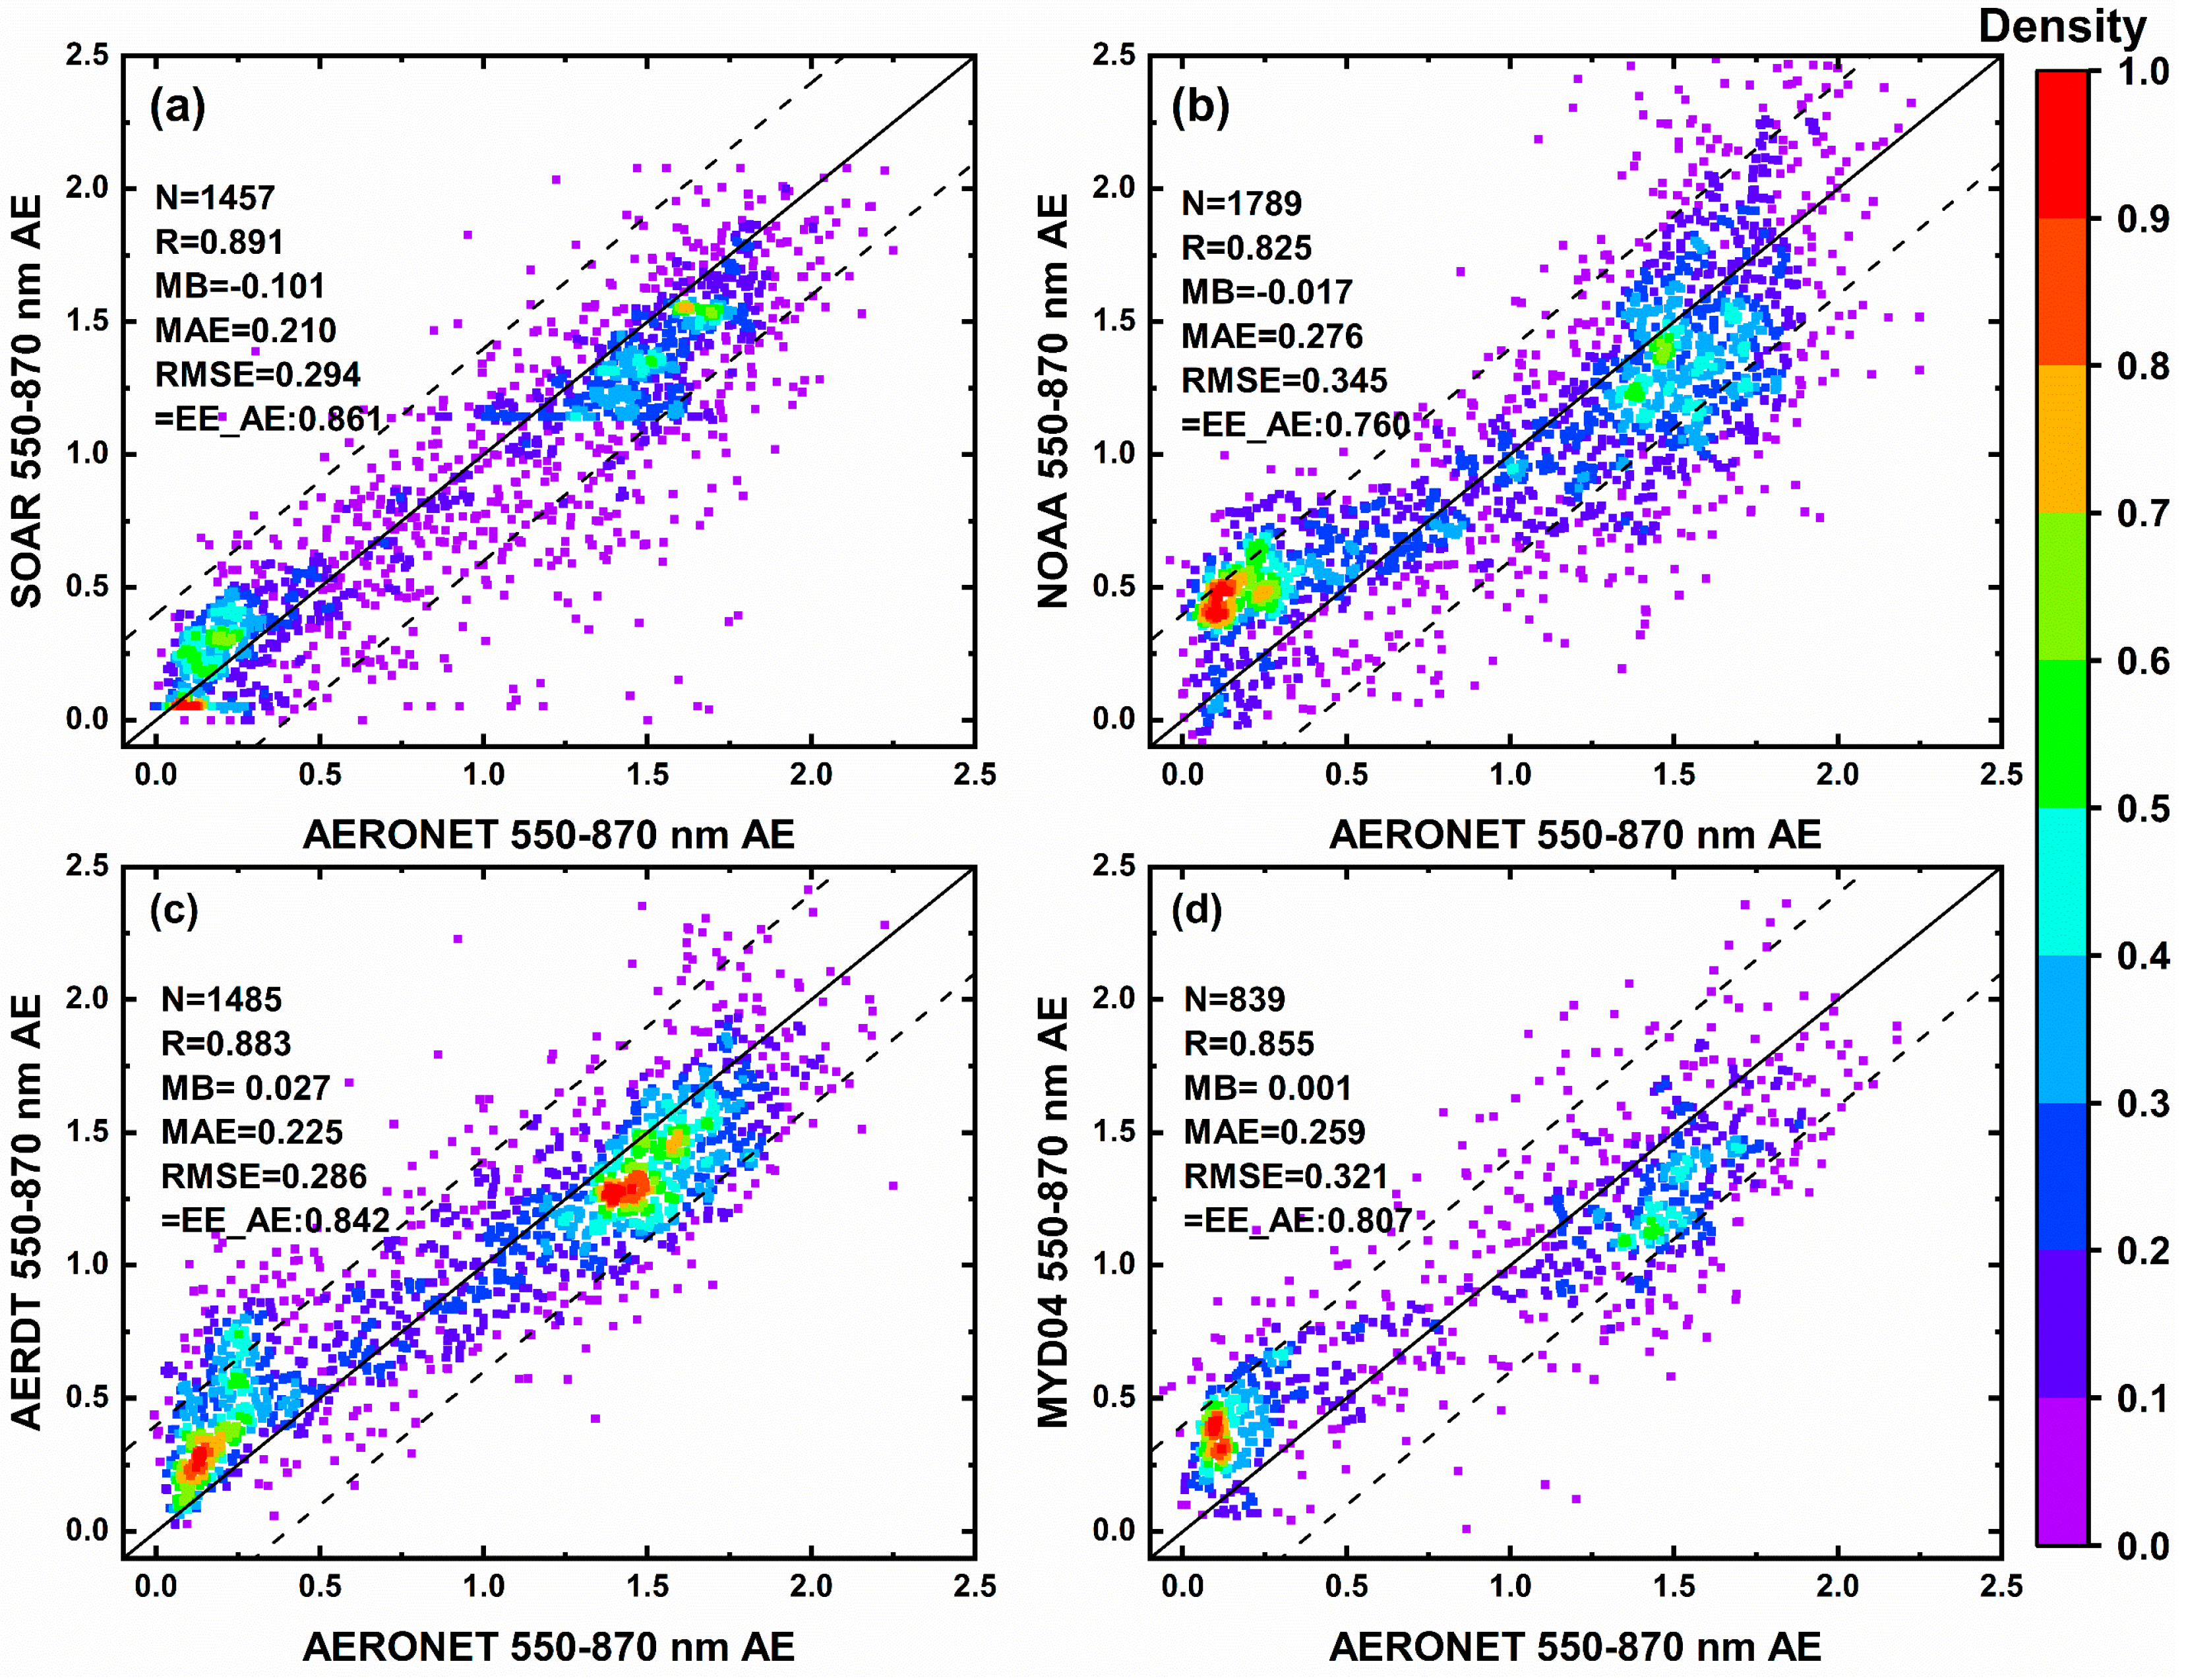
3.1.2. Ångström Exponent

AE utilizes the different responses of two wavelengths to aerosol to characterize the size of aerosol particles. This parameter is useful for distinguishing between fine and coarse dominant aerosol types. Therefore, the AE parameter is also the focus of this study. When the AOD loading is low, there is a non-negligible uncertainty in the calculated AE; therefore, the AE parameters are compared only when the AERONET 550 nm AOD is >0.2.
The validation results of AE are shown in Figure 2. Since only the AE with AOD > 0.2 is compared, validations for SOAR, NOAA, and MYD04 AE are better than previous studies [12,18,19]. Although each product captures the variation in AE, i.e., R > 0.825, they all overestimate low AE and underestimate high AE. The same problem was also found in the previous validation of MODIS AE (e.g., [37]). Zhou et al. [38] proved that using a non-spherical dust model can reduce the overestimation of low AE and FMF. Fortunately, most of their retrievals are within the EE_AE (>0.760), and their RMSEs are all smaller than EE_AE (defined as ±0.4), indicating that their AE retrievals are quantitatively meaningful. From the two metrics of EE_AE and RMSE, the AEs of SOAR and AERDT are better than that of MYD04, while the AE of NOAA is slightly worse than that of MYD04.

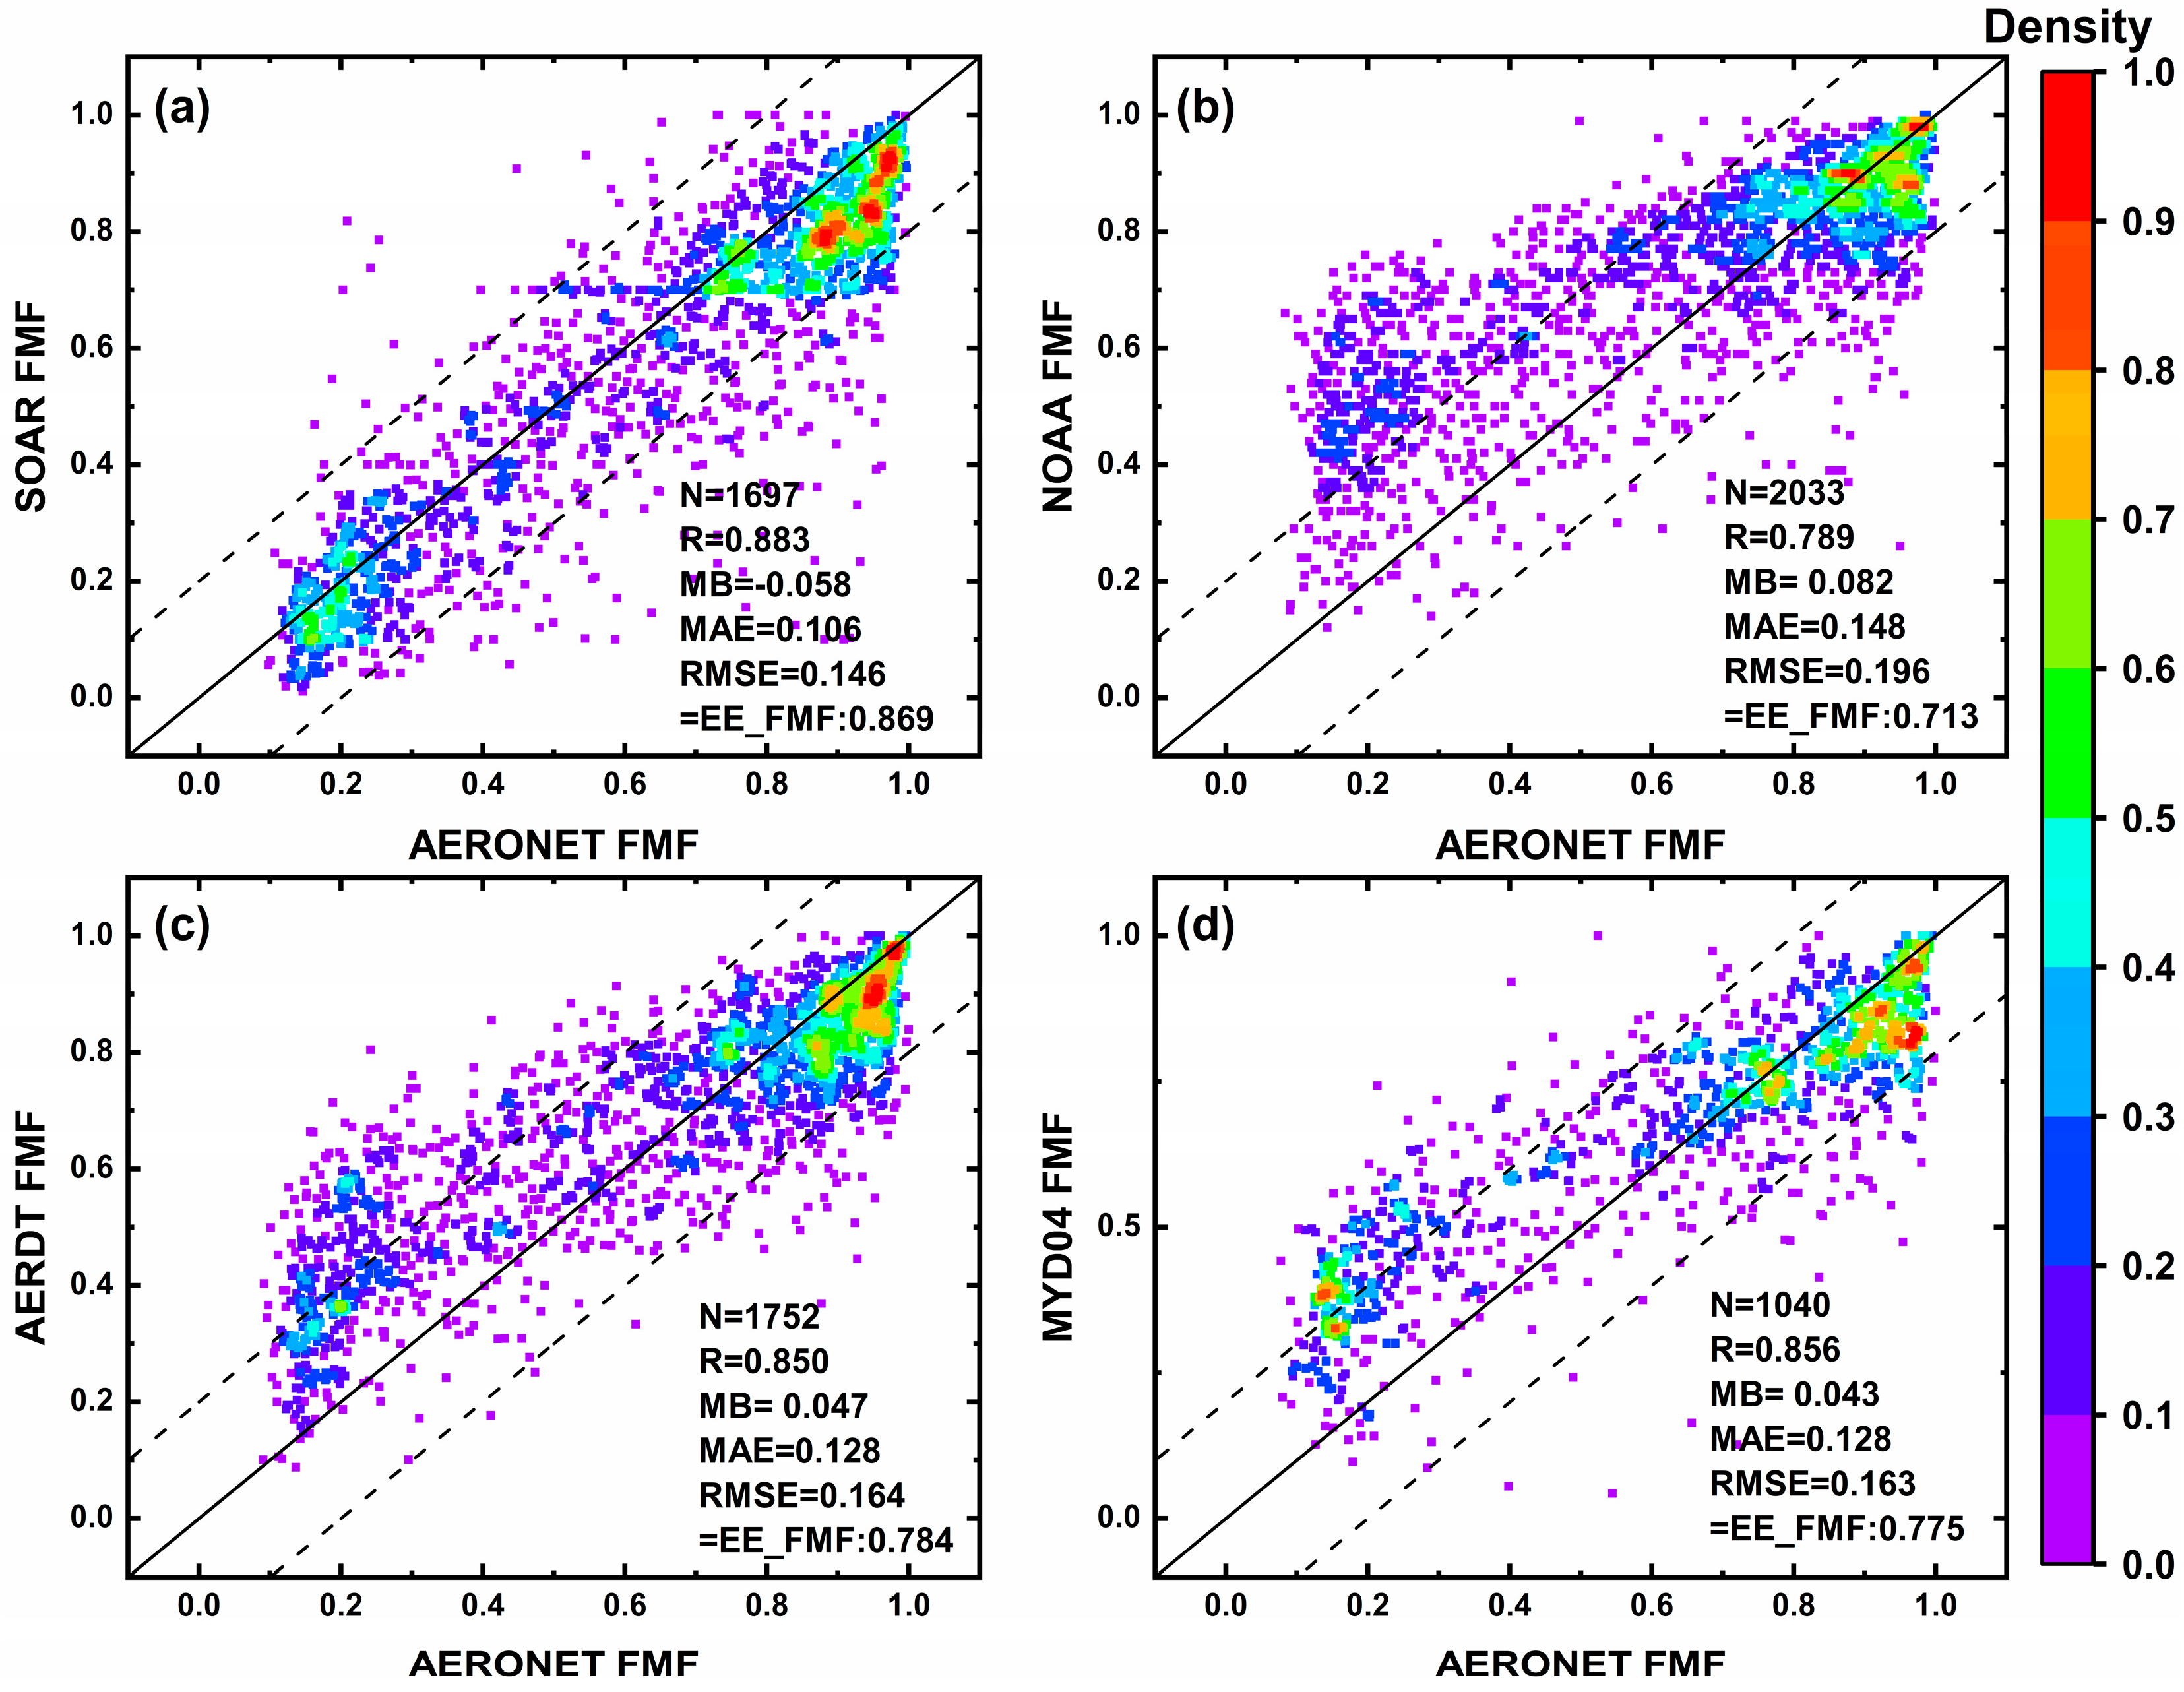
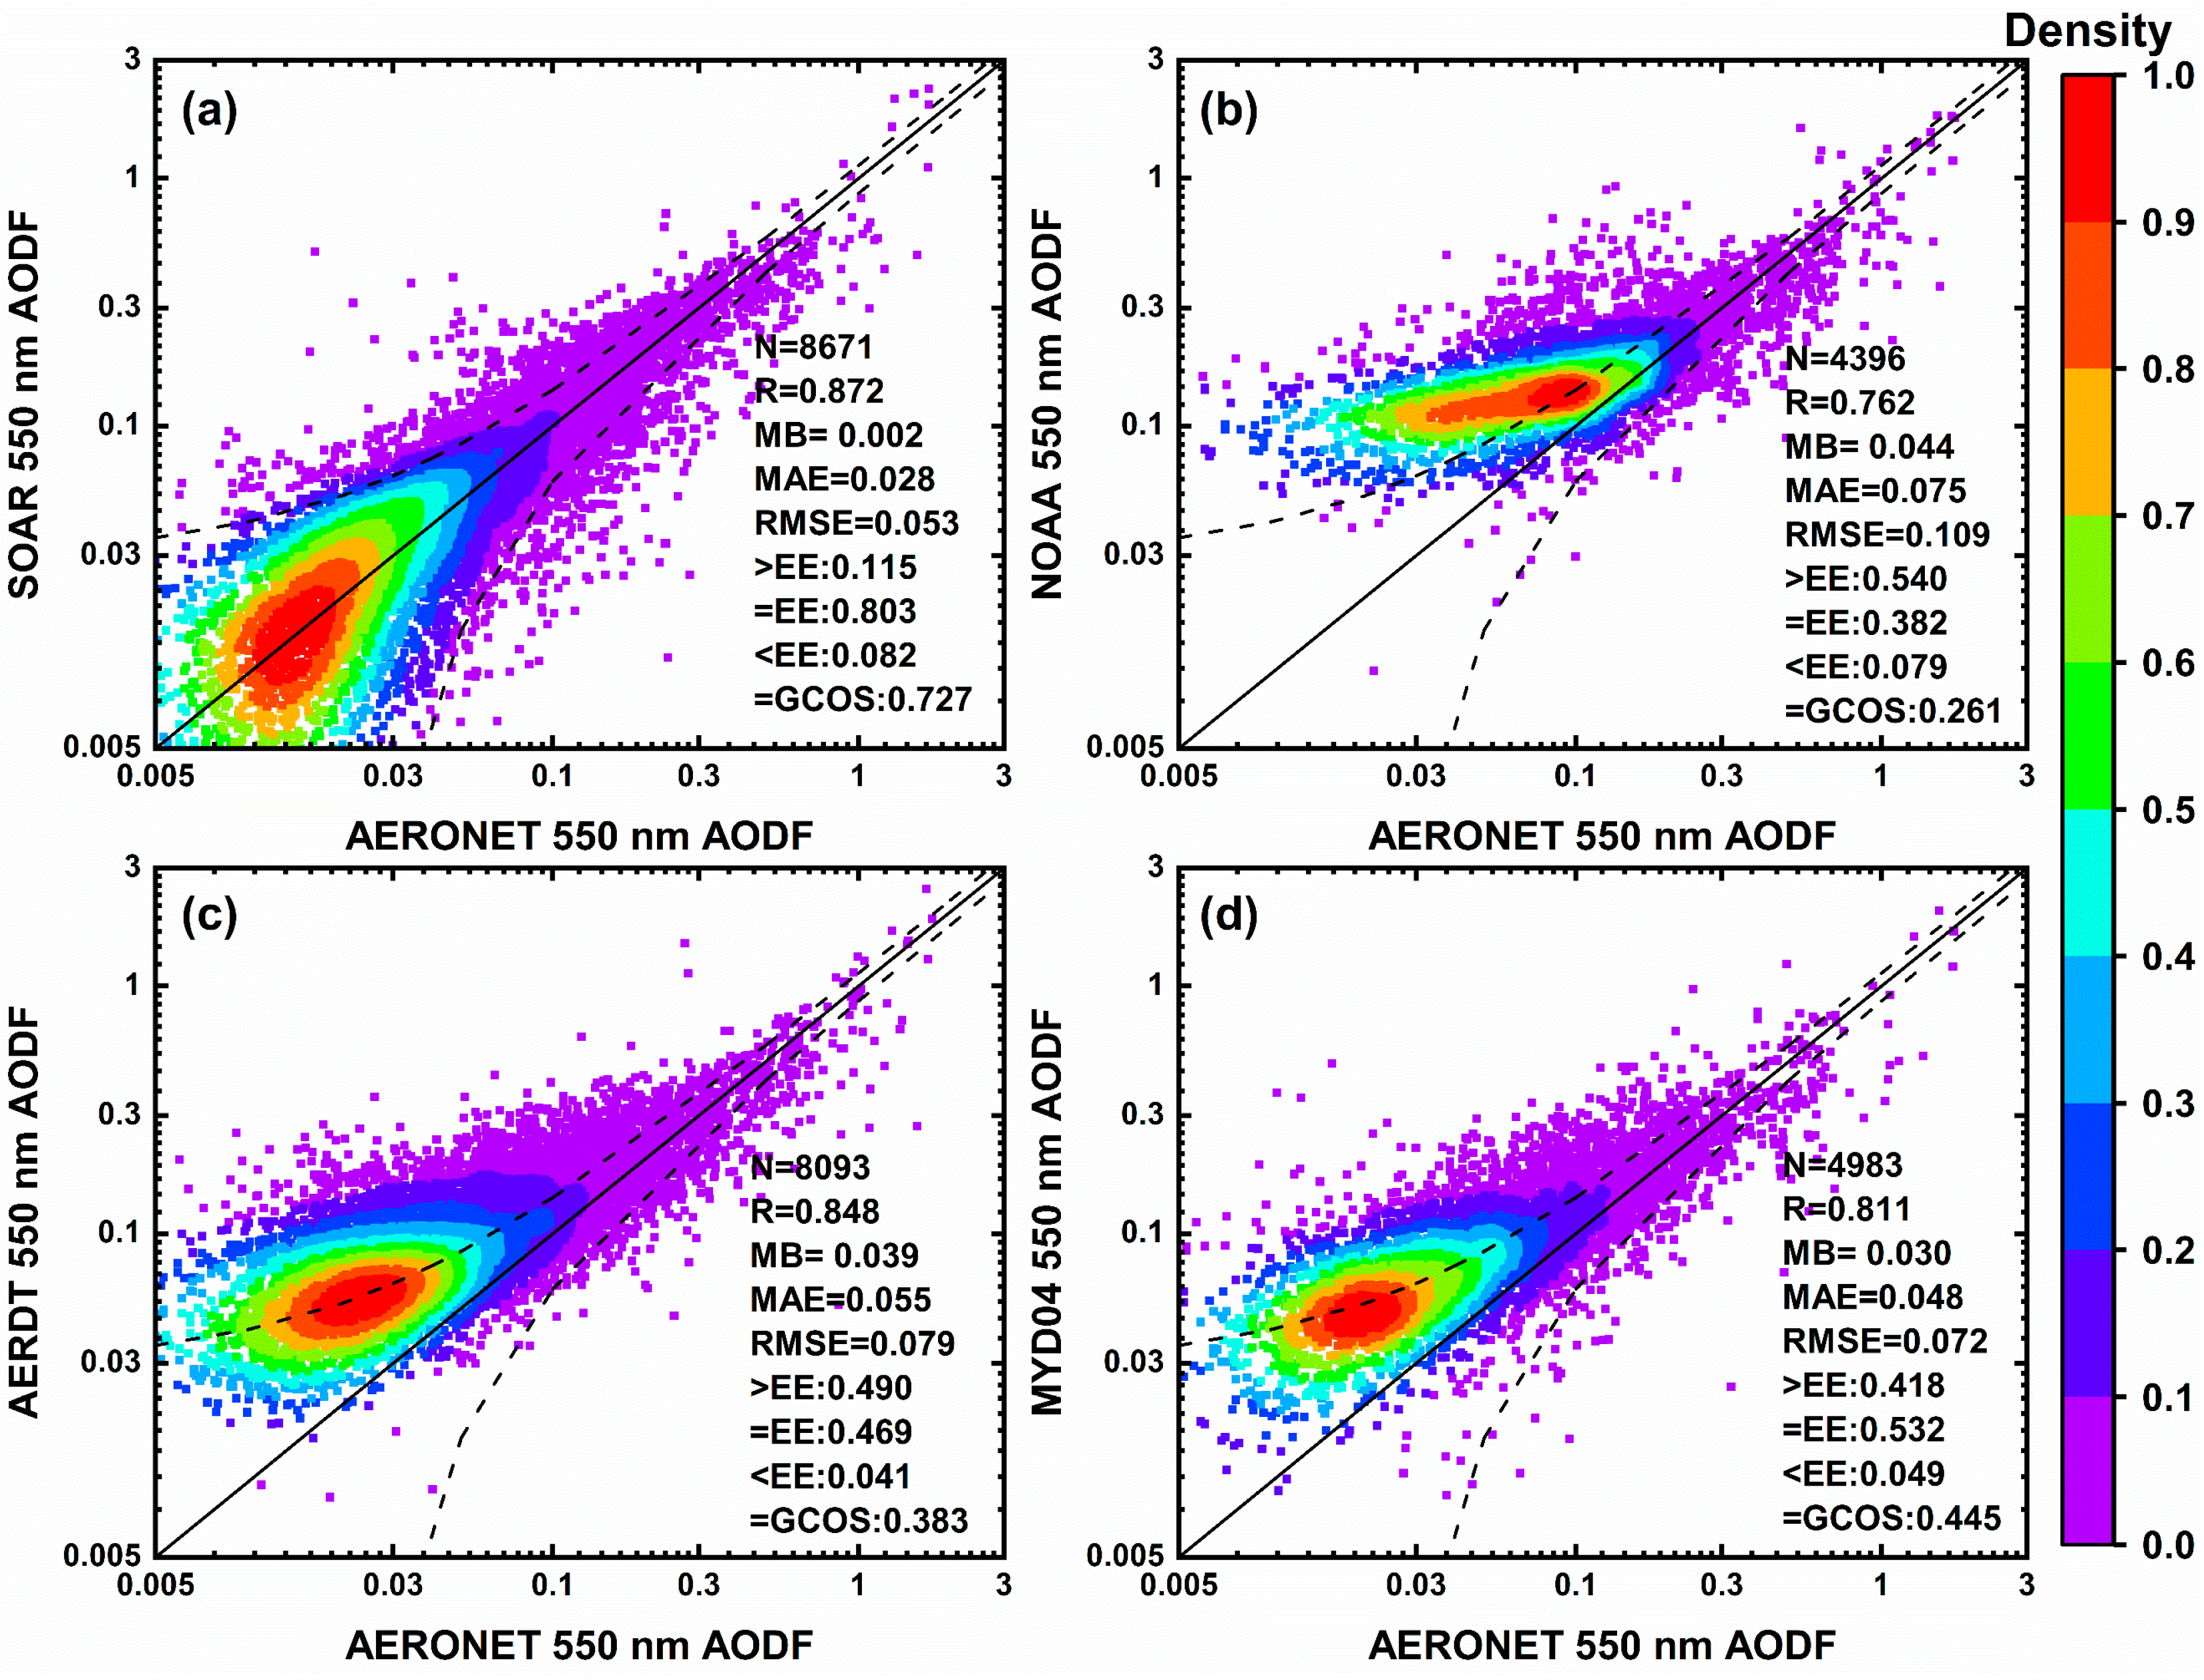
3.1.3. Fine Mode Fraction and AOD

The definitions of VIIRS-retrieved FMF and AERONET-retrieved FMF differ slightly, but they are related and can be compared with each other [13] (Figure 3). The comparative metrics (Figure 3a) of SOAR FMF are similar to previous studies (e.g., [18,20]). Except for NOAA FMF, the performance of SOAR and AERDT FMF is close to or better than that of MYD04 FMF. The SOAR algorithm is better at retrieving low FMF cases, while other algorithms overestimate low FMF. This suggests that NOAA, AERDT, and MYD04 using similar algorithms (spherical dust aerosol model) tend to increase the fraction of fine modes to fit satellite-observed reflectance. Using non-spherical dust models may improve their FMF retrieval [38]. Overall, the FMFs of all algorithms are quantitatively meaningful, i.e., they capture variations in FMF (R > 0.789), and the EE_FMF is >0.713.
A related parameter to FMF is the fine mode AOD (Equation (2)), which can be used to estimate anthropogenic radiative forcing [14,15]. The accuracy of SOAR AODF is very high (e.g., R:0.872, EE:0.803, GCOS:0.727). This indicates that it can be applied to scientific research. Conversely, the scatter plot (Figure 4b–d) and EE metrics show that the NOAA, AERDT, and MYD04 algorithms significantly overestimate AODF. The overestimated total AOD (Figure 1) and FMF (Figure 3) together lead to the overestimation of AODF. Therefore, these algorithms need to be improved in the future.

3.2. Quantitative Comparison

To reduce the impact of sample differences, the same matchups (same site and same time) of all VIIRS retrievals with AERONET retrievals are used to discuss the relative accuracy of different VIIRS products (Figure 5). The AOD accuracy of SOAR and NOAA is similar and they are close to the 1:1 line. While the AERDT systematically overestimates the AOD, it remains within the expected error envelope. AE and FMF comparison results (Figure 5b,c) show similar product differences, i.e., NOAA and AERDT overestimated low parameter values, which is consistent with the overall validation results (Figure 2 and Figure 3). In contrast, the AE and FMF of SOAR are close to the 1:1 line. For the AODF parameter, SOAR underestimates high AODF. Interestingly, the AODFs of AERDT and NOAA almost overlap, they both overestimate the low AODF and underestimate the high AODF. Overall, the comparison results show that SOAR has the best performance on all parameters.

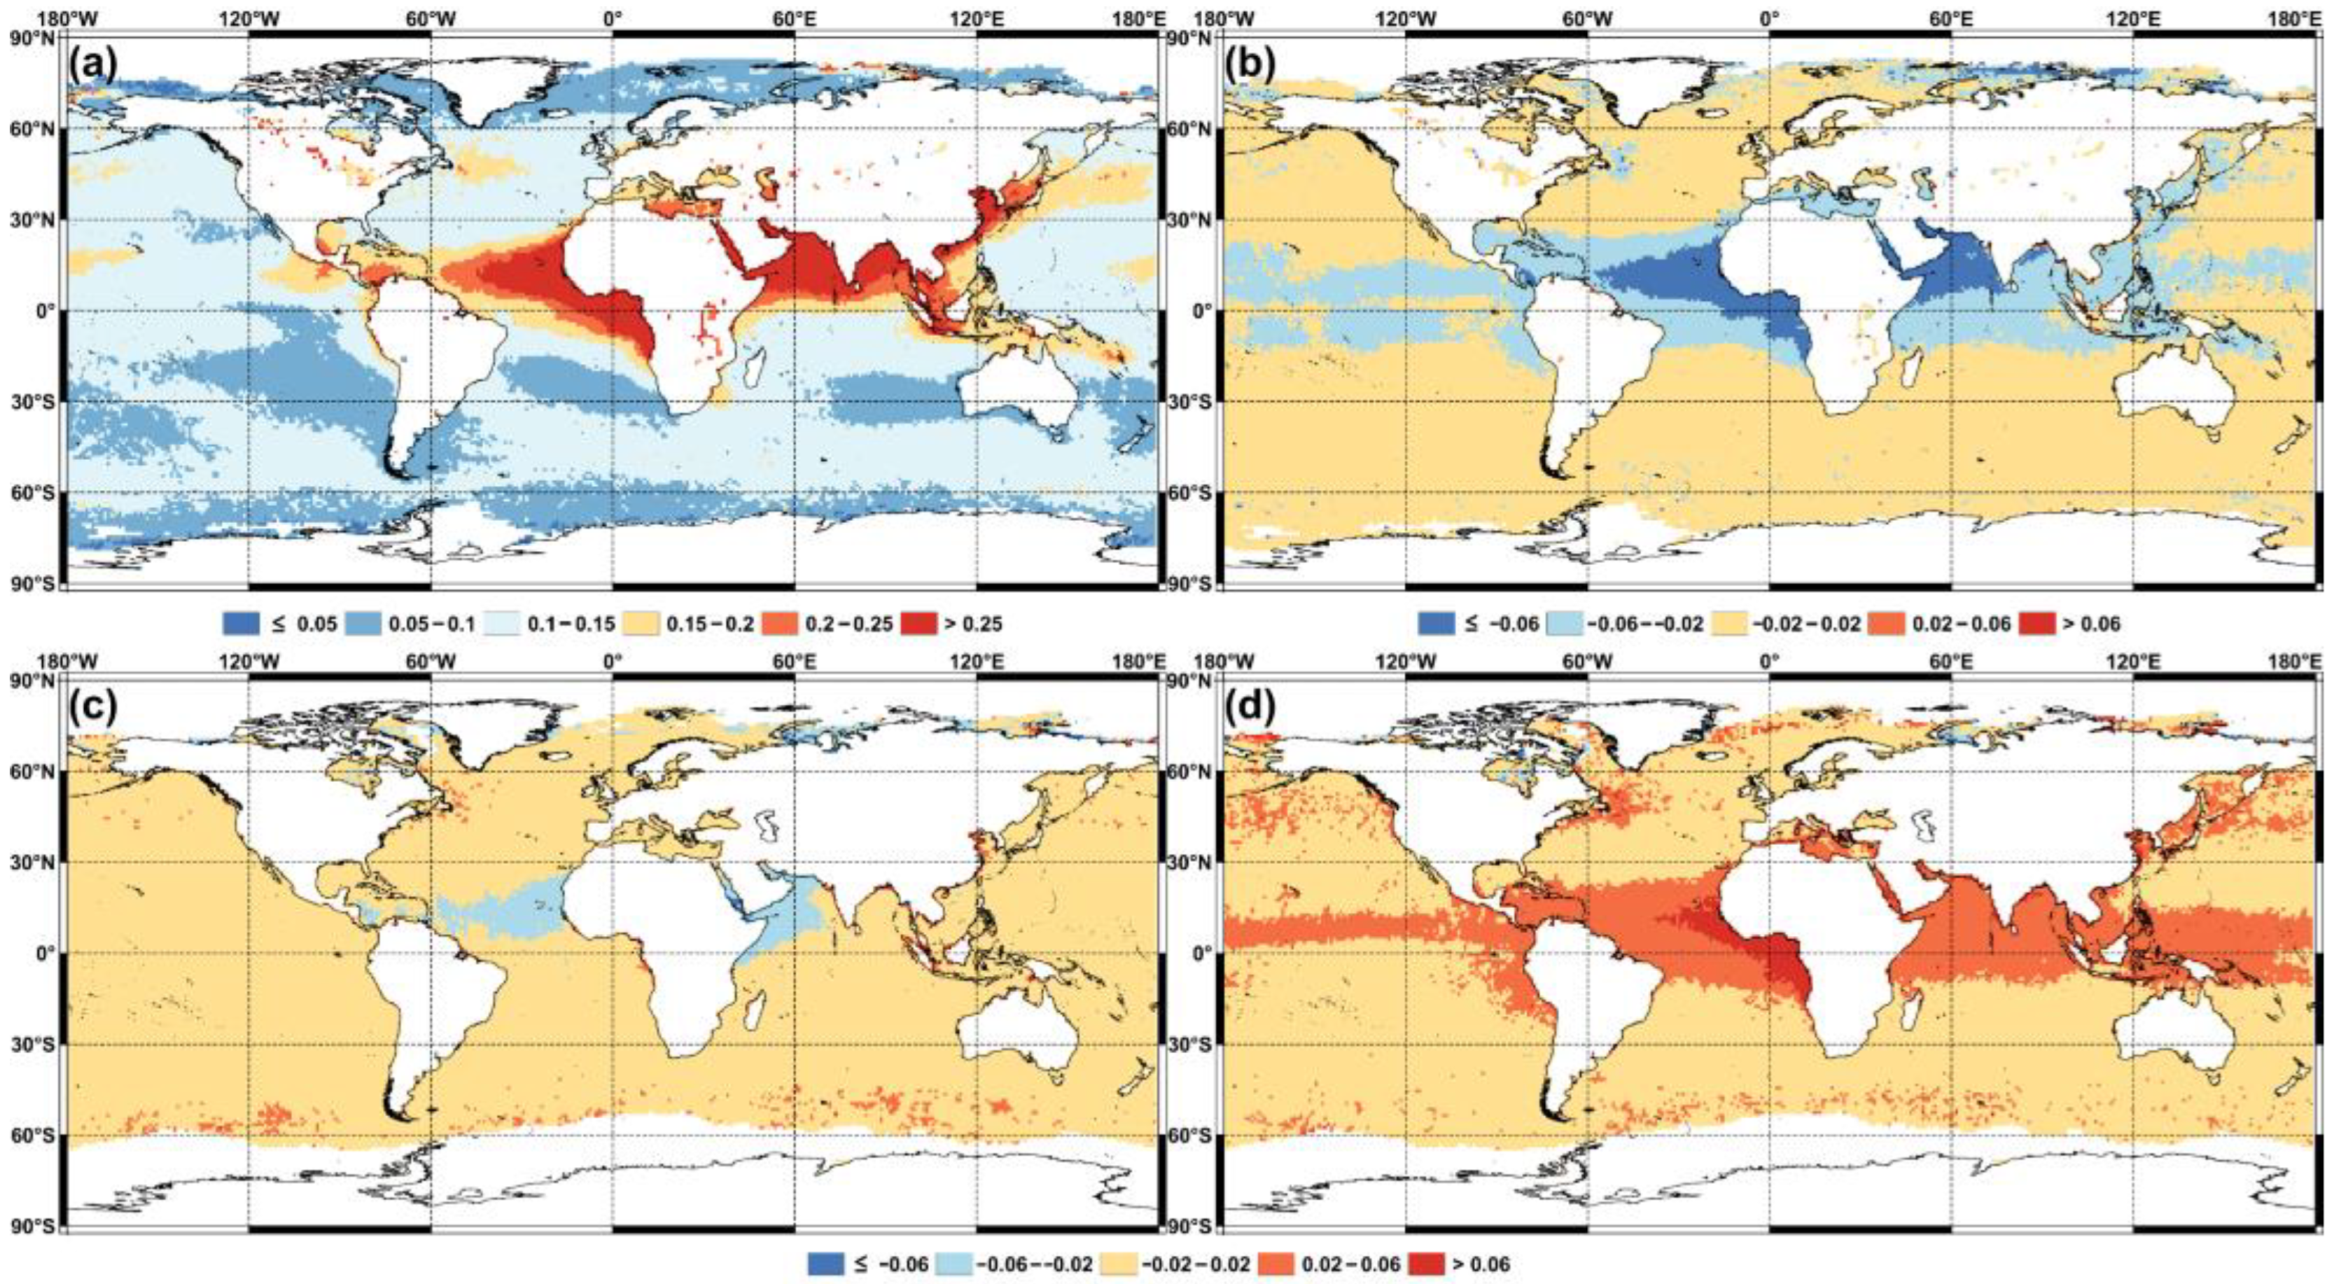
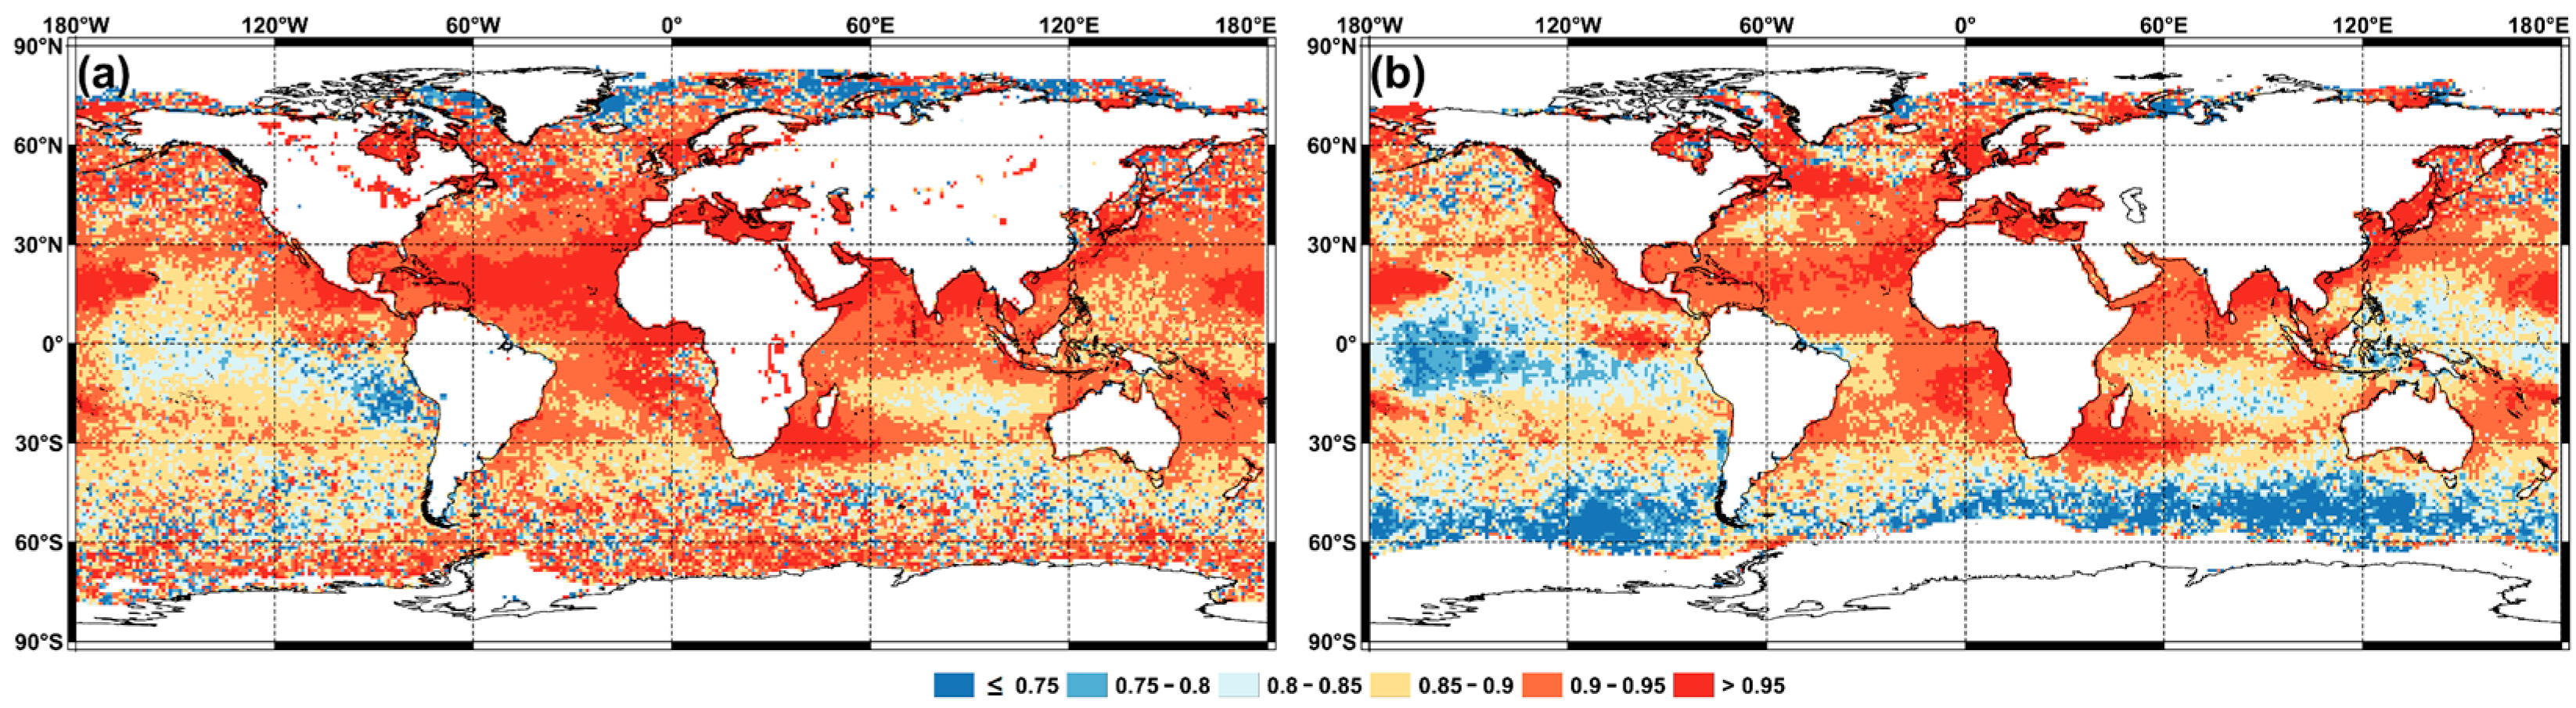
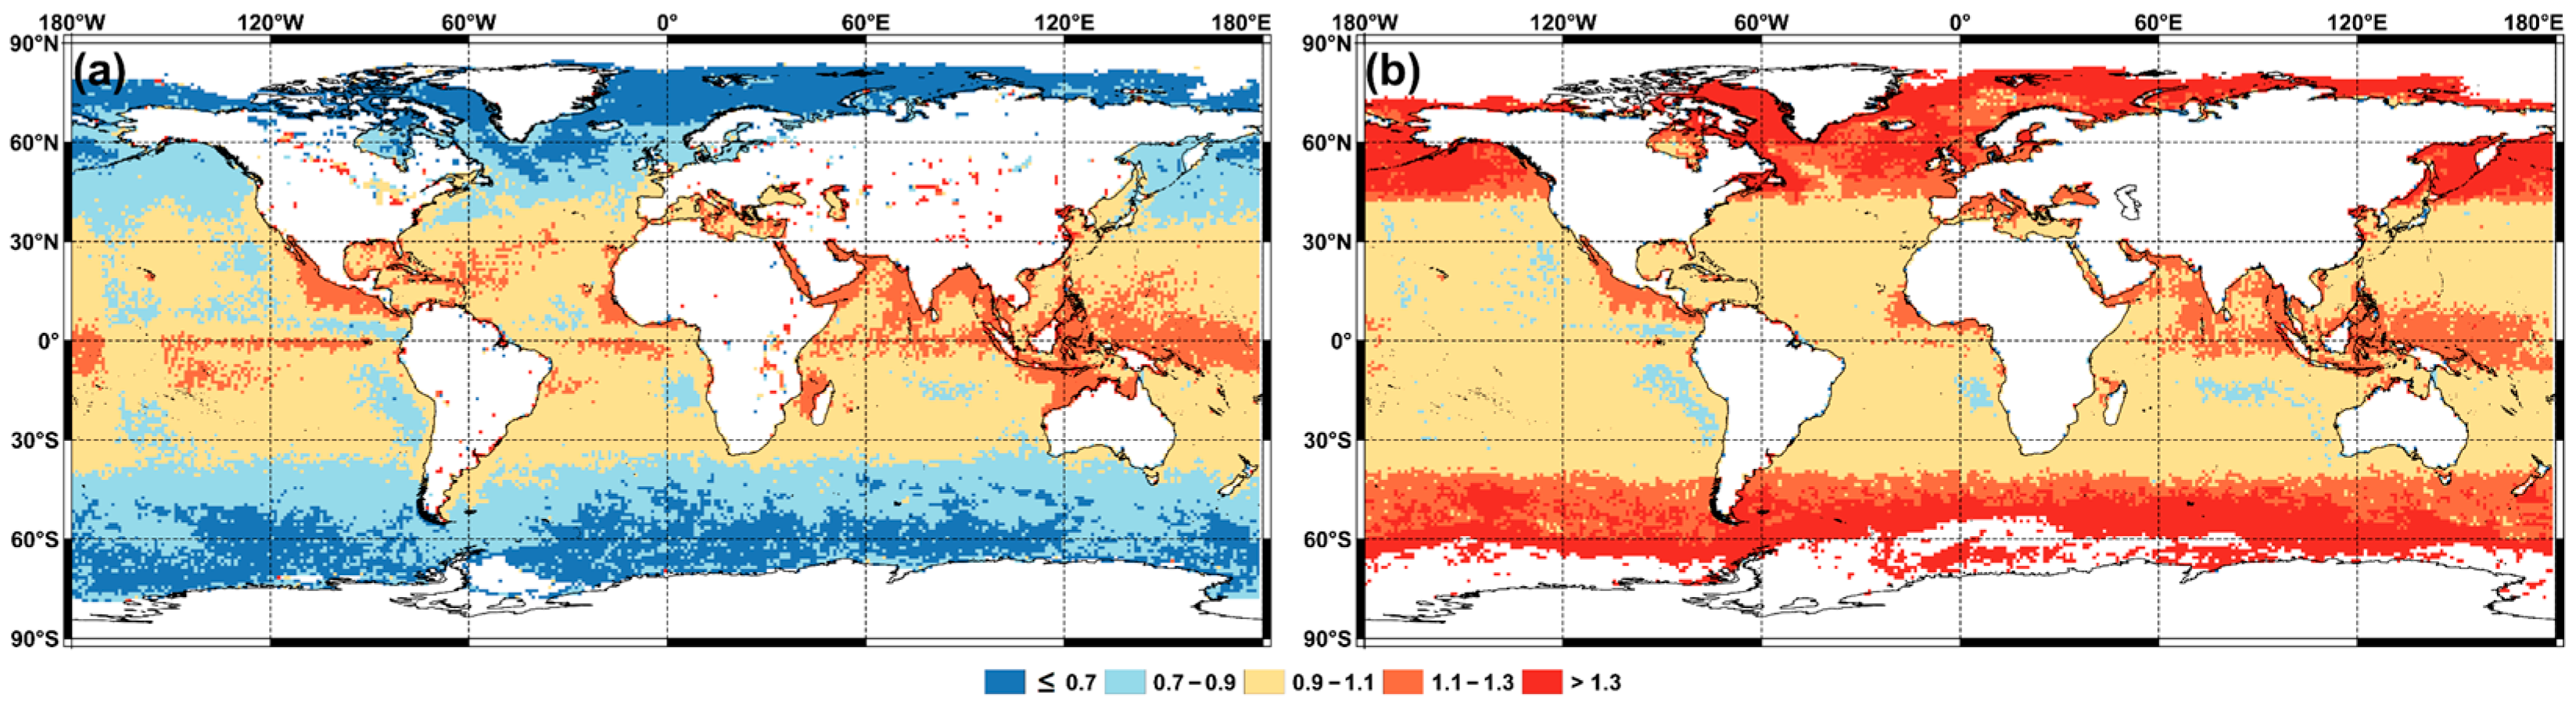
3.3. Pixel-by-Pixel Comparison

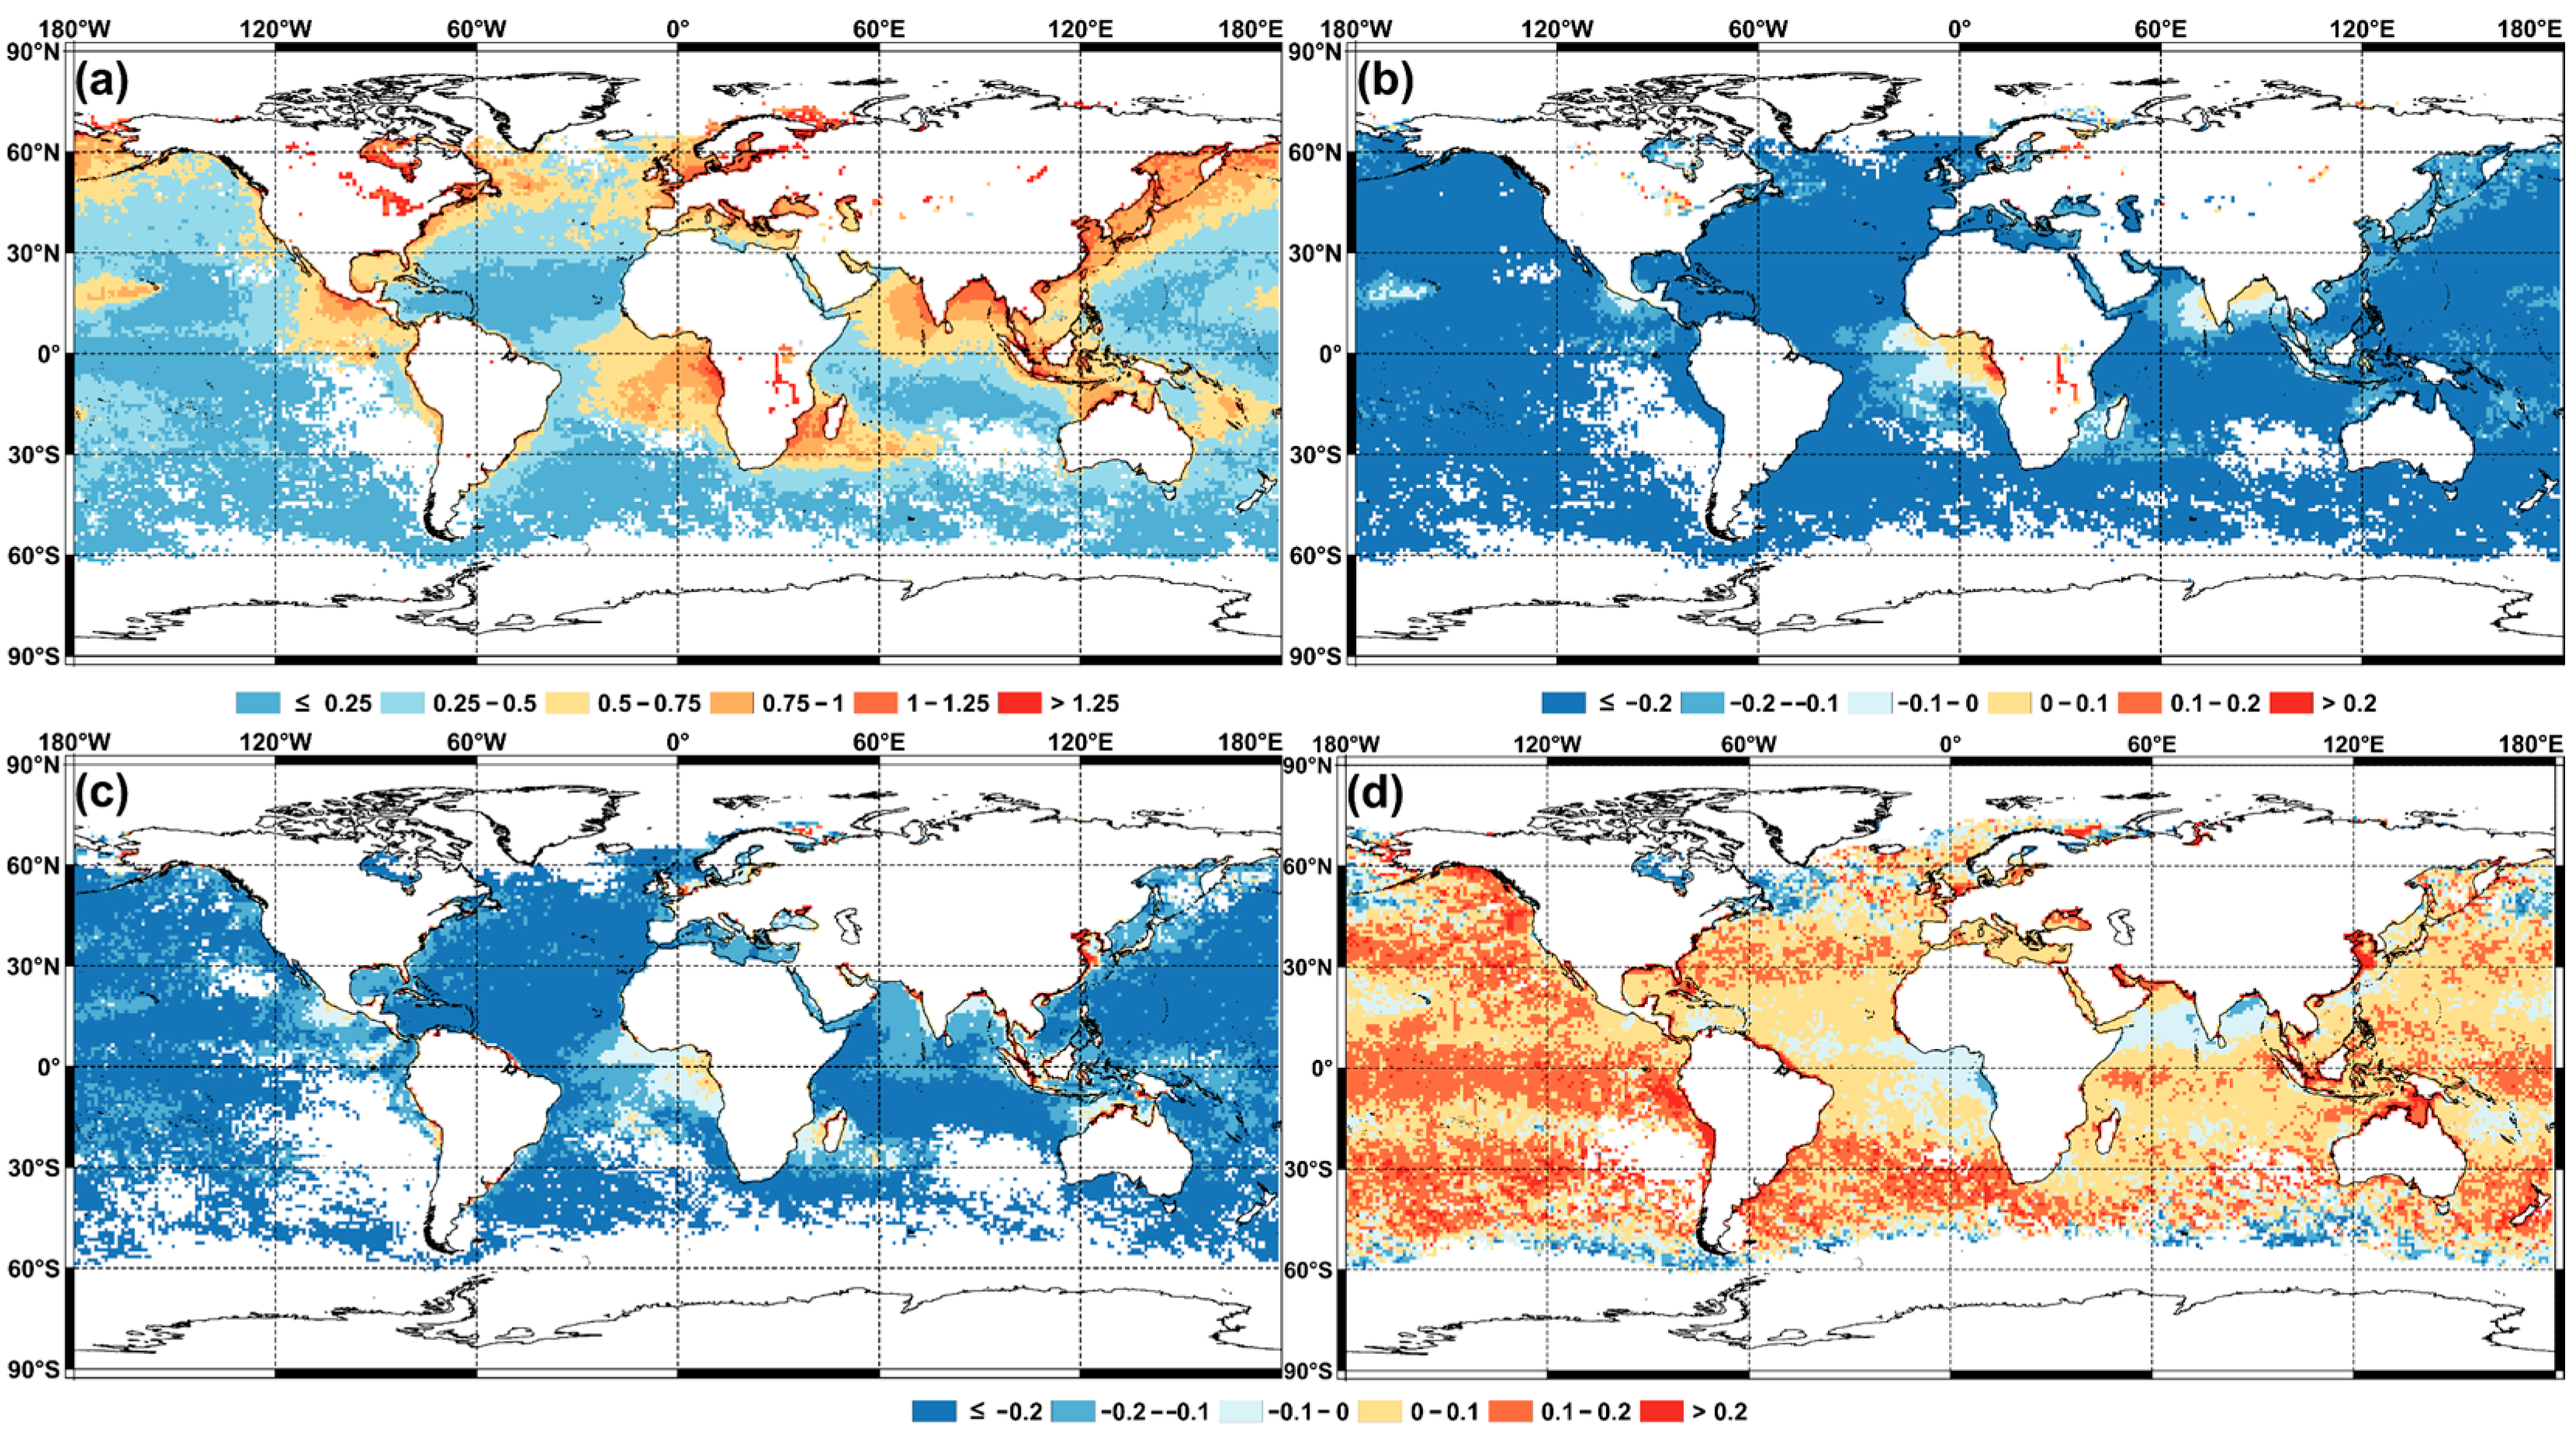
3.3.1. Aerosol Optical Depth

To understand the differences in spatial patterns of different VIIRS total AOD, a pixel-by-pixel comparison is analyzed (Figure 6, Figure 7 and Figure 8). The three VIIRS products were resampled to a daily mean at 1° spatial resolution for pixel-by-pixel matching. As can be seen in Figure 6a, the aerosols around the coast are heavily influenced by the land aerosols, and the AOD is higher than 0.15, while in the open ocean, the AOD is less than 0.15. In general, the AOD spatial patterns of SOAR and NOAA have little difference (MB = 0.001), while the AOD spatial patterns of AERDT and the other two products have larger differences. Their biases (−0.014 for SOAR and AERDT, 0.016 for AERDT and NOAA) are approximately half of the SOAR annual mean (0.028). Figure 7 shows that correlations between different AOD retrievals are high (R > 0.85) in most marine areas, especially in high AOD loading areas (R > 0.9). In regions under low AOD loading, their correlations are slightly reduced, which is understandable because the AOD variations in these regions are small. Figure 8 shows that when the latitude is <±40 degrees, the retrieval frequencies of the three products are similar, and their retrieval frequency ratio is approximately 0.9–1.1. In coastal zones, SOAR had better retrieval frequencies, possibly due to its backup algorithm retrieving a portion of turbid water [18]. With increasing latitude, AERDT has the highest retrieval frequency, followed by SOAR, and NOAA has the lowest retrieval frequency. When all quality AODs instead of high-quality AODs are used to calculate the retrieval frequency (not shown), SOAR outperformed that of AERDT except above 65 degrees north latitude and except above 60 degrees south latitude, NOAA’s retrieval frequency exceeds that of the SOAR, indicating that SOAR and NOAA adopts a stricter quality control approach.

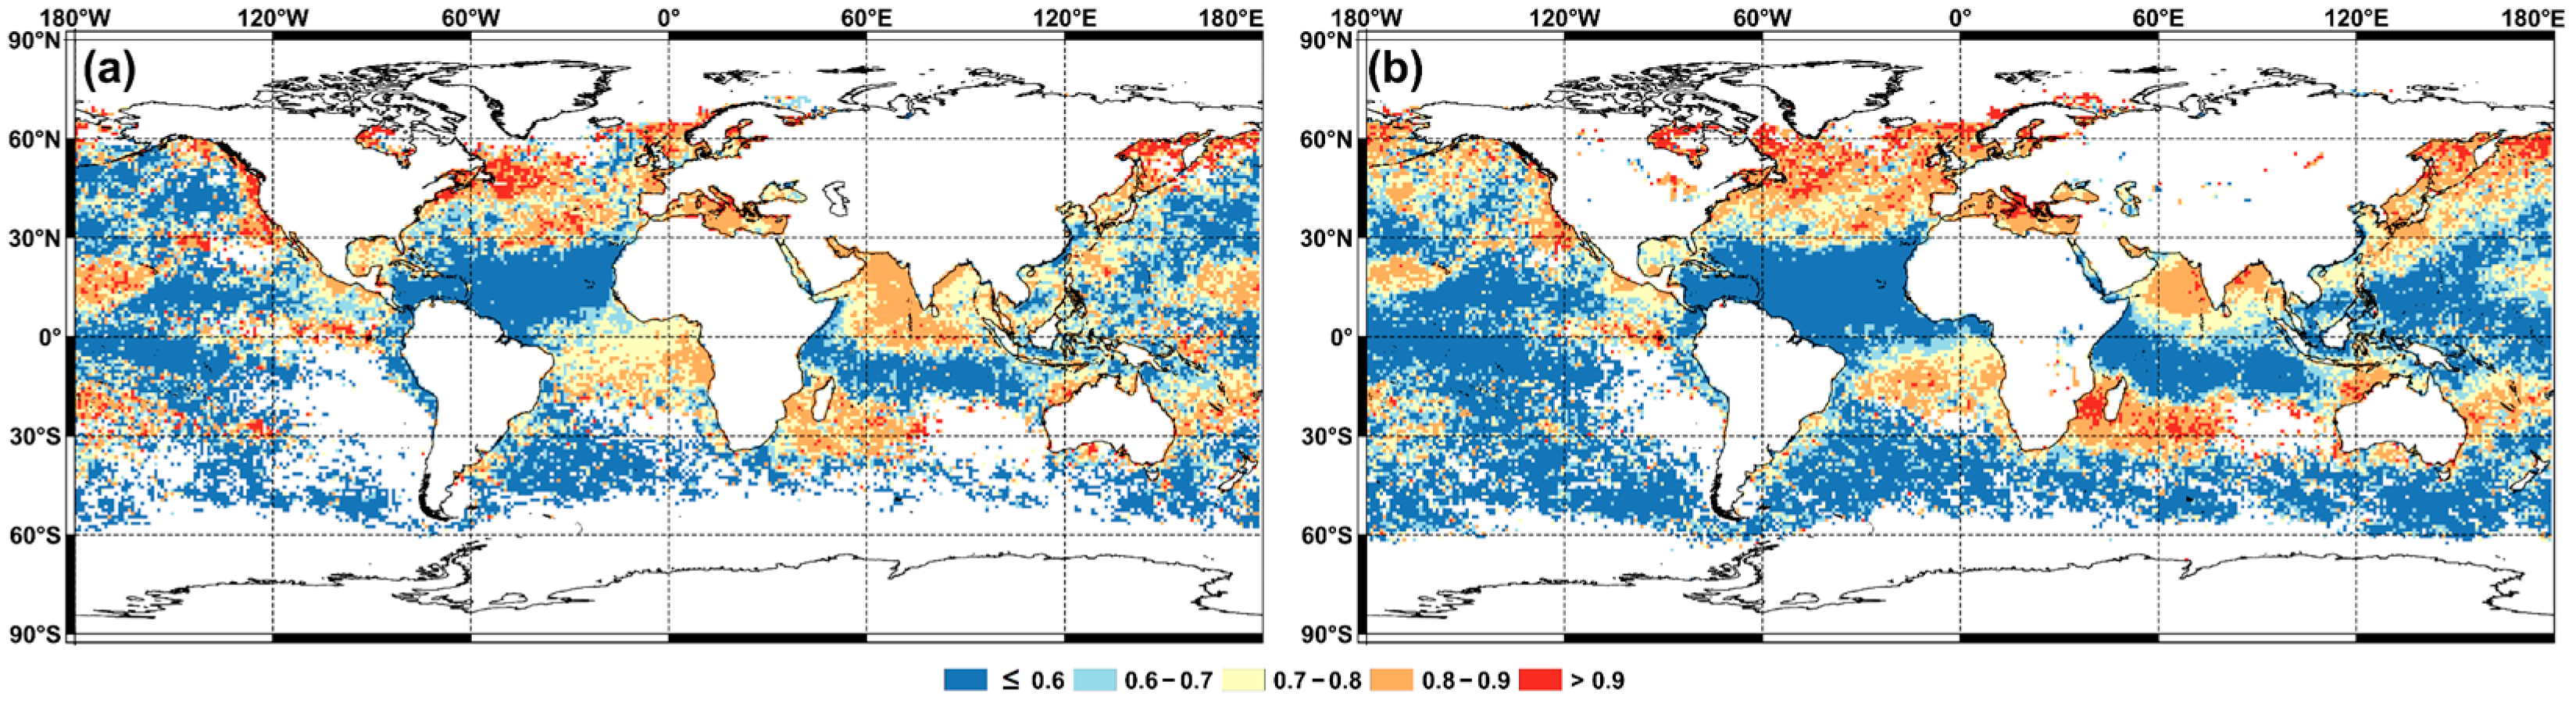
3.3.2. Ångström Exponent

The AE spatial pattern of SOAR is shown in Figure 9a. In the oceans close to the mainland, high AE indicates fine-mode-dominated aerosols in these regions. In most oceans, the MB of SOAR AE and AERDT, and NOAA AE are negative, which is consistent with previous studies [20]. The AE pattern MB (0.062) of AERDT and NOAA is small, which is related to their use of similar algorithms (Section 2.3). This does not mean that they produce more accurate AE retrievals. Because the overall validation result (Figure 5b) shows that compared with AERDT and NOAA algorithms, SOAR AE has a better validation performance, which implies that the spatial pattern of SOAR AE may be more accurate. The correlation coefficients (Figure 10) of SOAR AE and other algorithm AEs are related to the annual mean of AE, that is, in regions with high AE, their correlation coefficients are high, and in regions with low AE, their correlation coefficients are low. This is because the open ocean is rarely polluted by aerosols from the land, and therefore, AE variations are slight. For the AE parameter, the serious differences between different algorithms indicate that the uncertainty of AE retrieved by VIIRS is large, and more validations are needed to improve the algorithm in the future.

3.4. Error Analysis

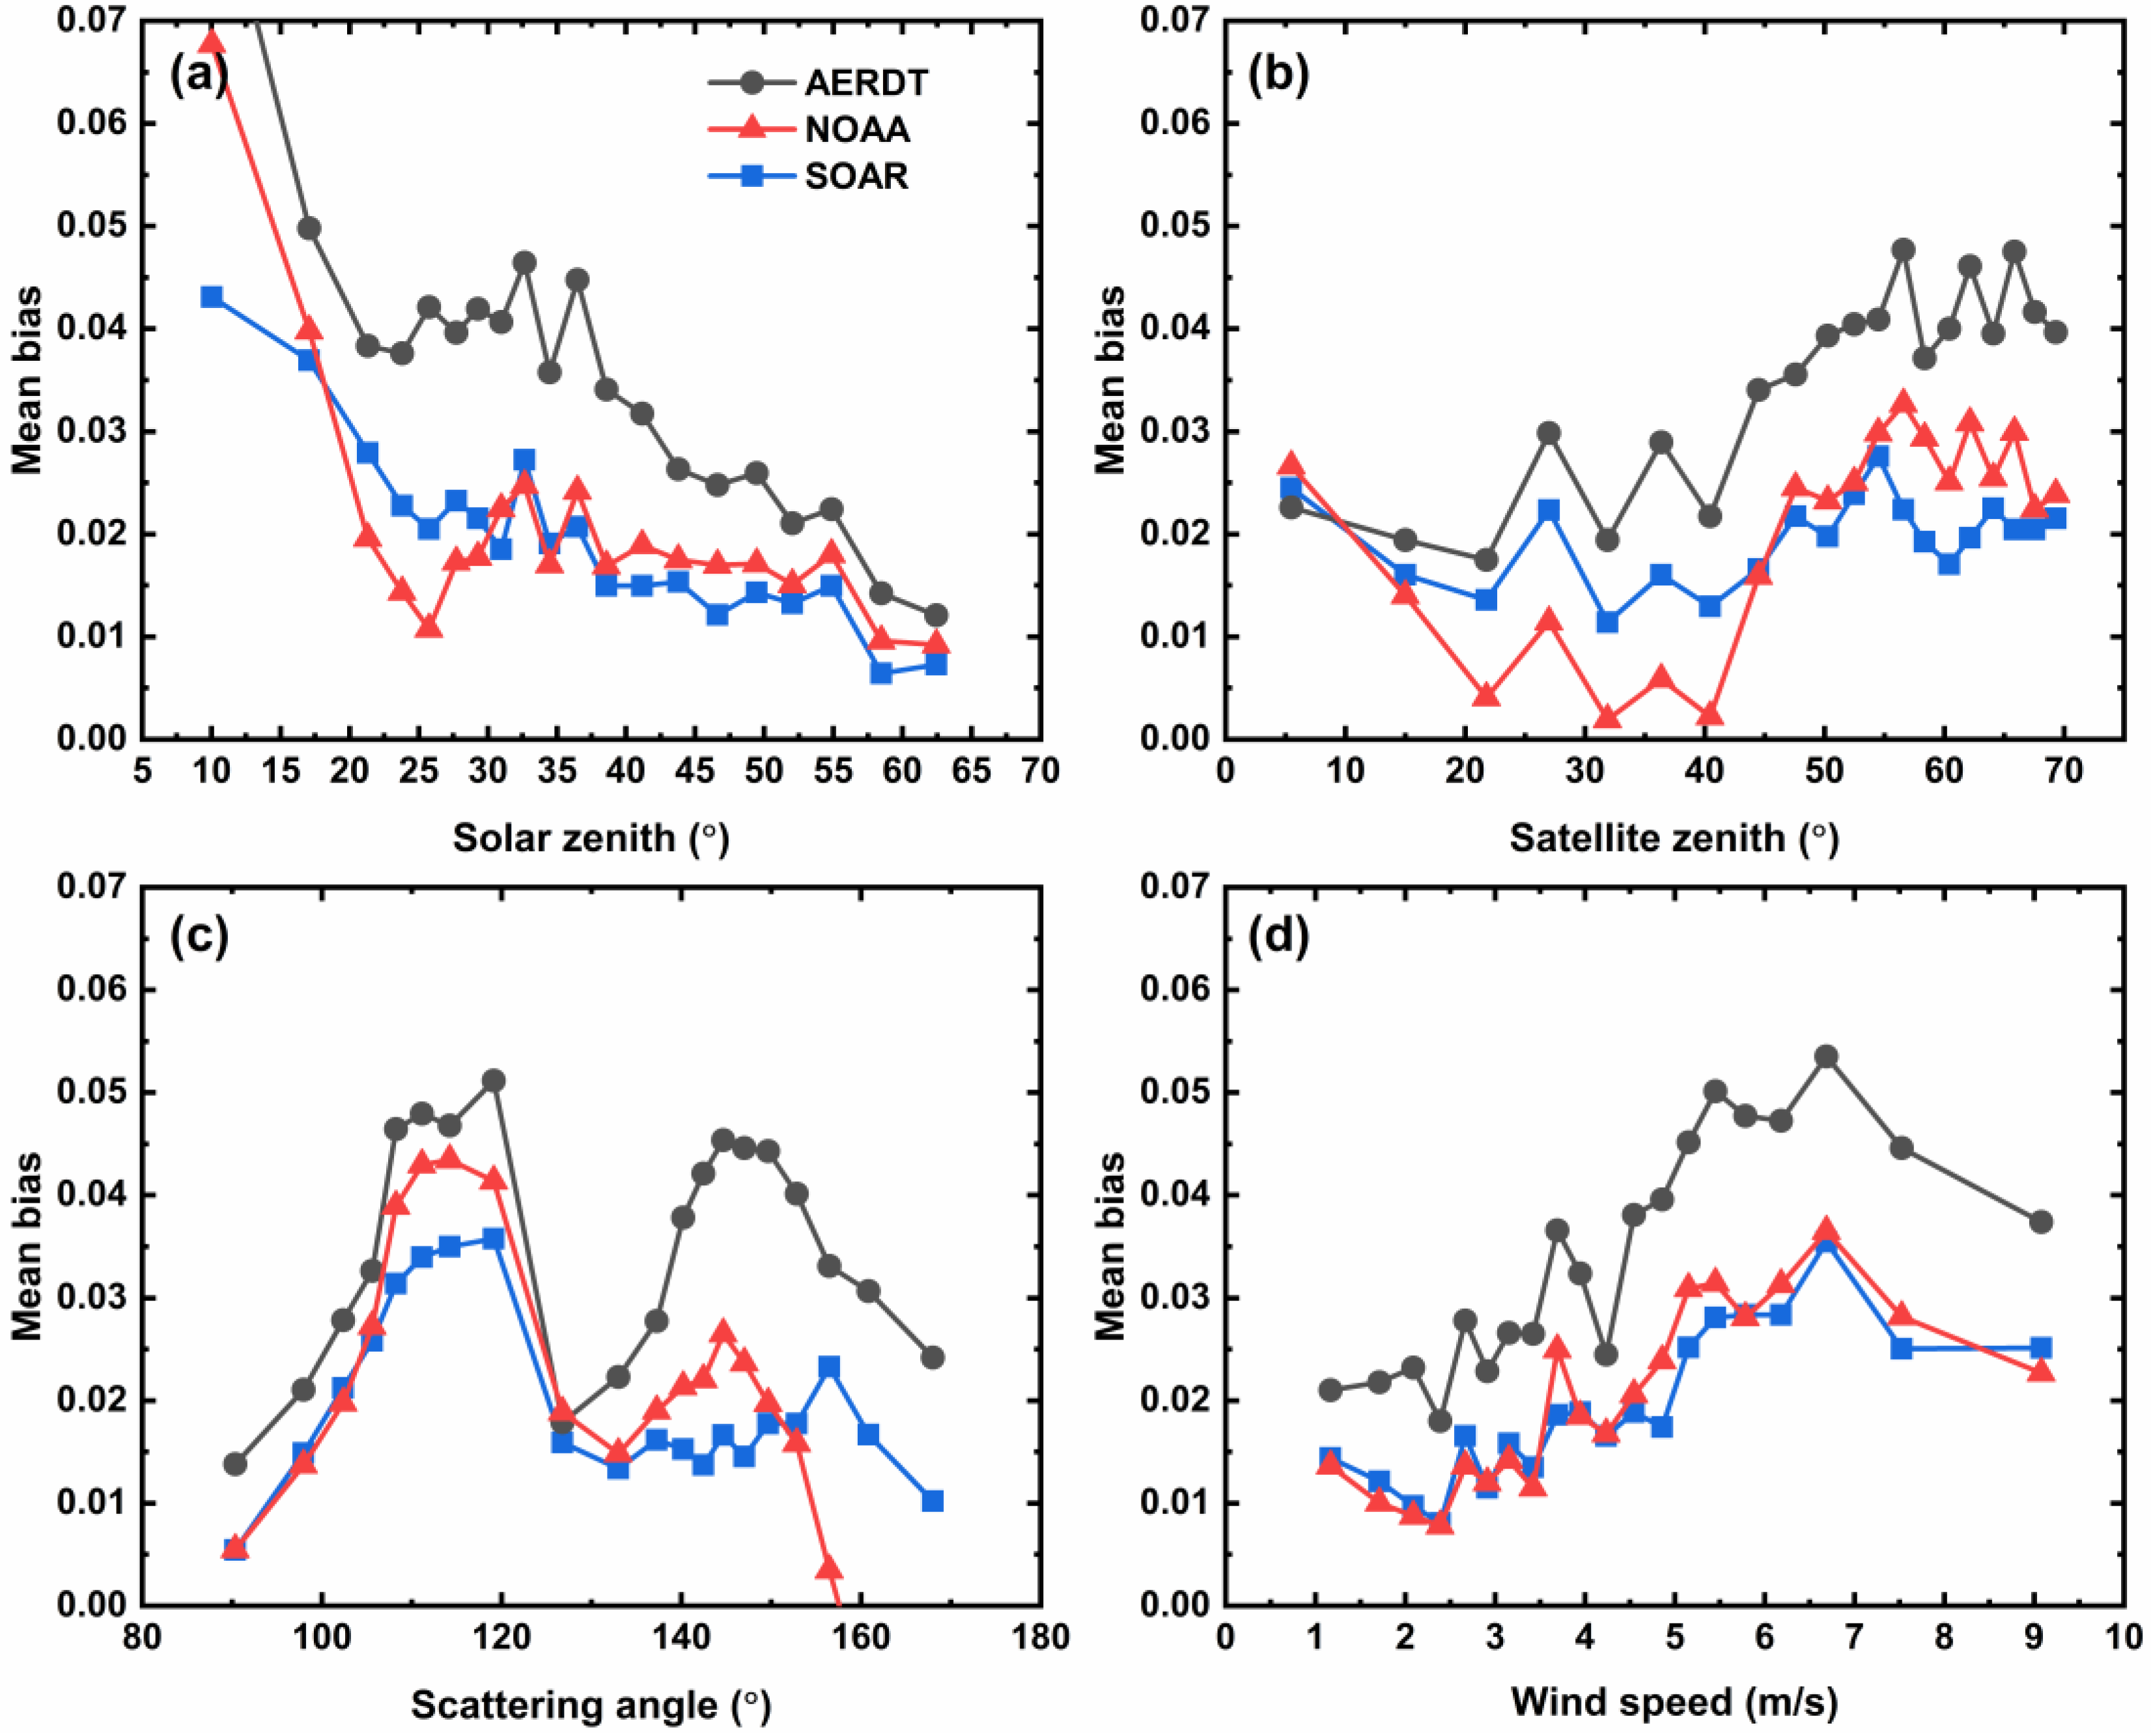
3.4.1. Aerosol Optical Depth

Figure 11 shows the dependence of AOD bias (AODVIIRS-AODAERONET) on imaging angles and sea surface wind speed (Table 1). Almost all AOD biases are positive, indicating a systematic overestimation of AOD. As the solar zenith angle increases, the AOD bias decreases. One potential reason is that low latitudes (usually small solar zenith angles) have high AOD loadings and complex sources (Figure 6a and Figure 9a), while high latitudes (usually large solar zenith angles) have low AOD loadings. This leads to a larger AOD bias for small solar zenith angles. Another potential reason is that the solar zenith angle (3D radiative effect) affects the selection of the non-spherical model and AOD retrieval in the algorithm [39,40]. When the scattering angle is <135°, all VIIRS products show similar AOD bias; however, when the scattering angle is >135°, their AOD bias is very different, suggesting that the scattering angle (>135°) may have a large influence on the ocean AOD retrieval. According to previous studies (e.g., [26,38]), this AOD bias can be attributed to the scattering phase function of the dust aerosol model. The dust model of spherical approximation used by AERDT and NOAA produces scattering phase functions that deviate from the actual shape, while the SOAR using the non-spherical dust model maintains a stable AOD bias when the scattering angle is >135 (Figure 11c). The study by Lee et al. [26] illustrates that improving the dust aerosol model can reduce the dependence of the AOD bias on the scattering angle. However, it is difficult to determine the right non-spherical model at the pixel scale, therefore, most studies are based on several fixed non-spherical models [41]. Figure 11d shows that the sea surface wind speed affects the AOD bias, that is, the greater the wind speed, the greater the bias. Although all VIIRS algorithms account for variations in wind speed, suggesting that none of the algorithms can eliminate the effect of wind speed on retrieval.

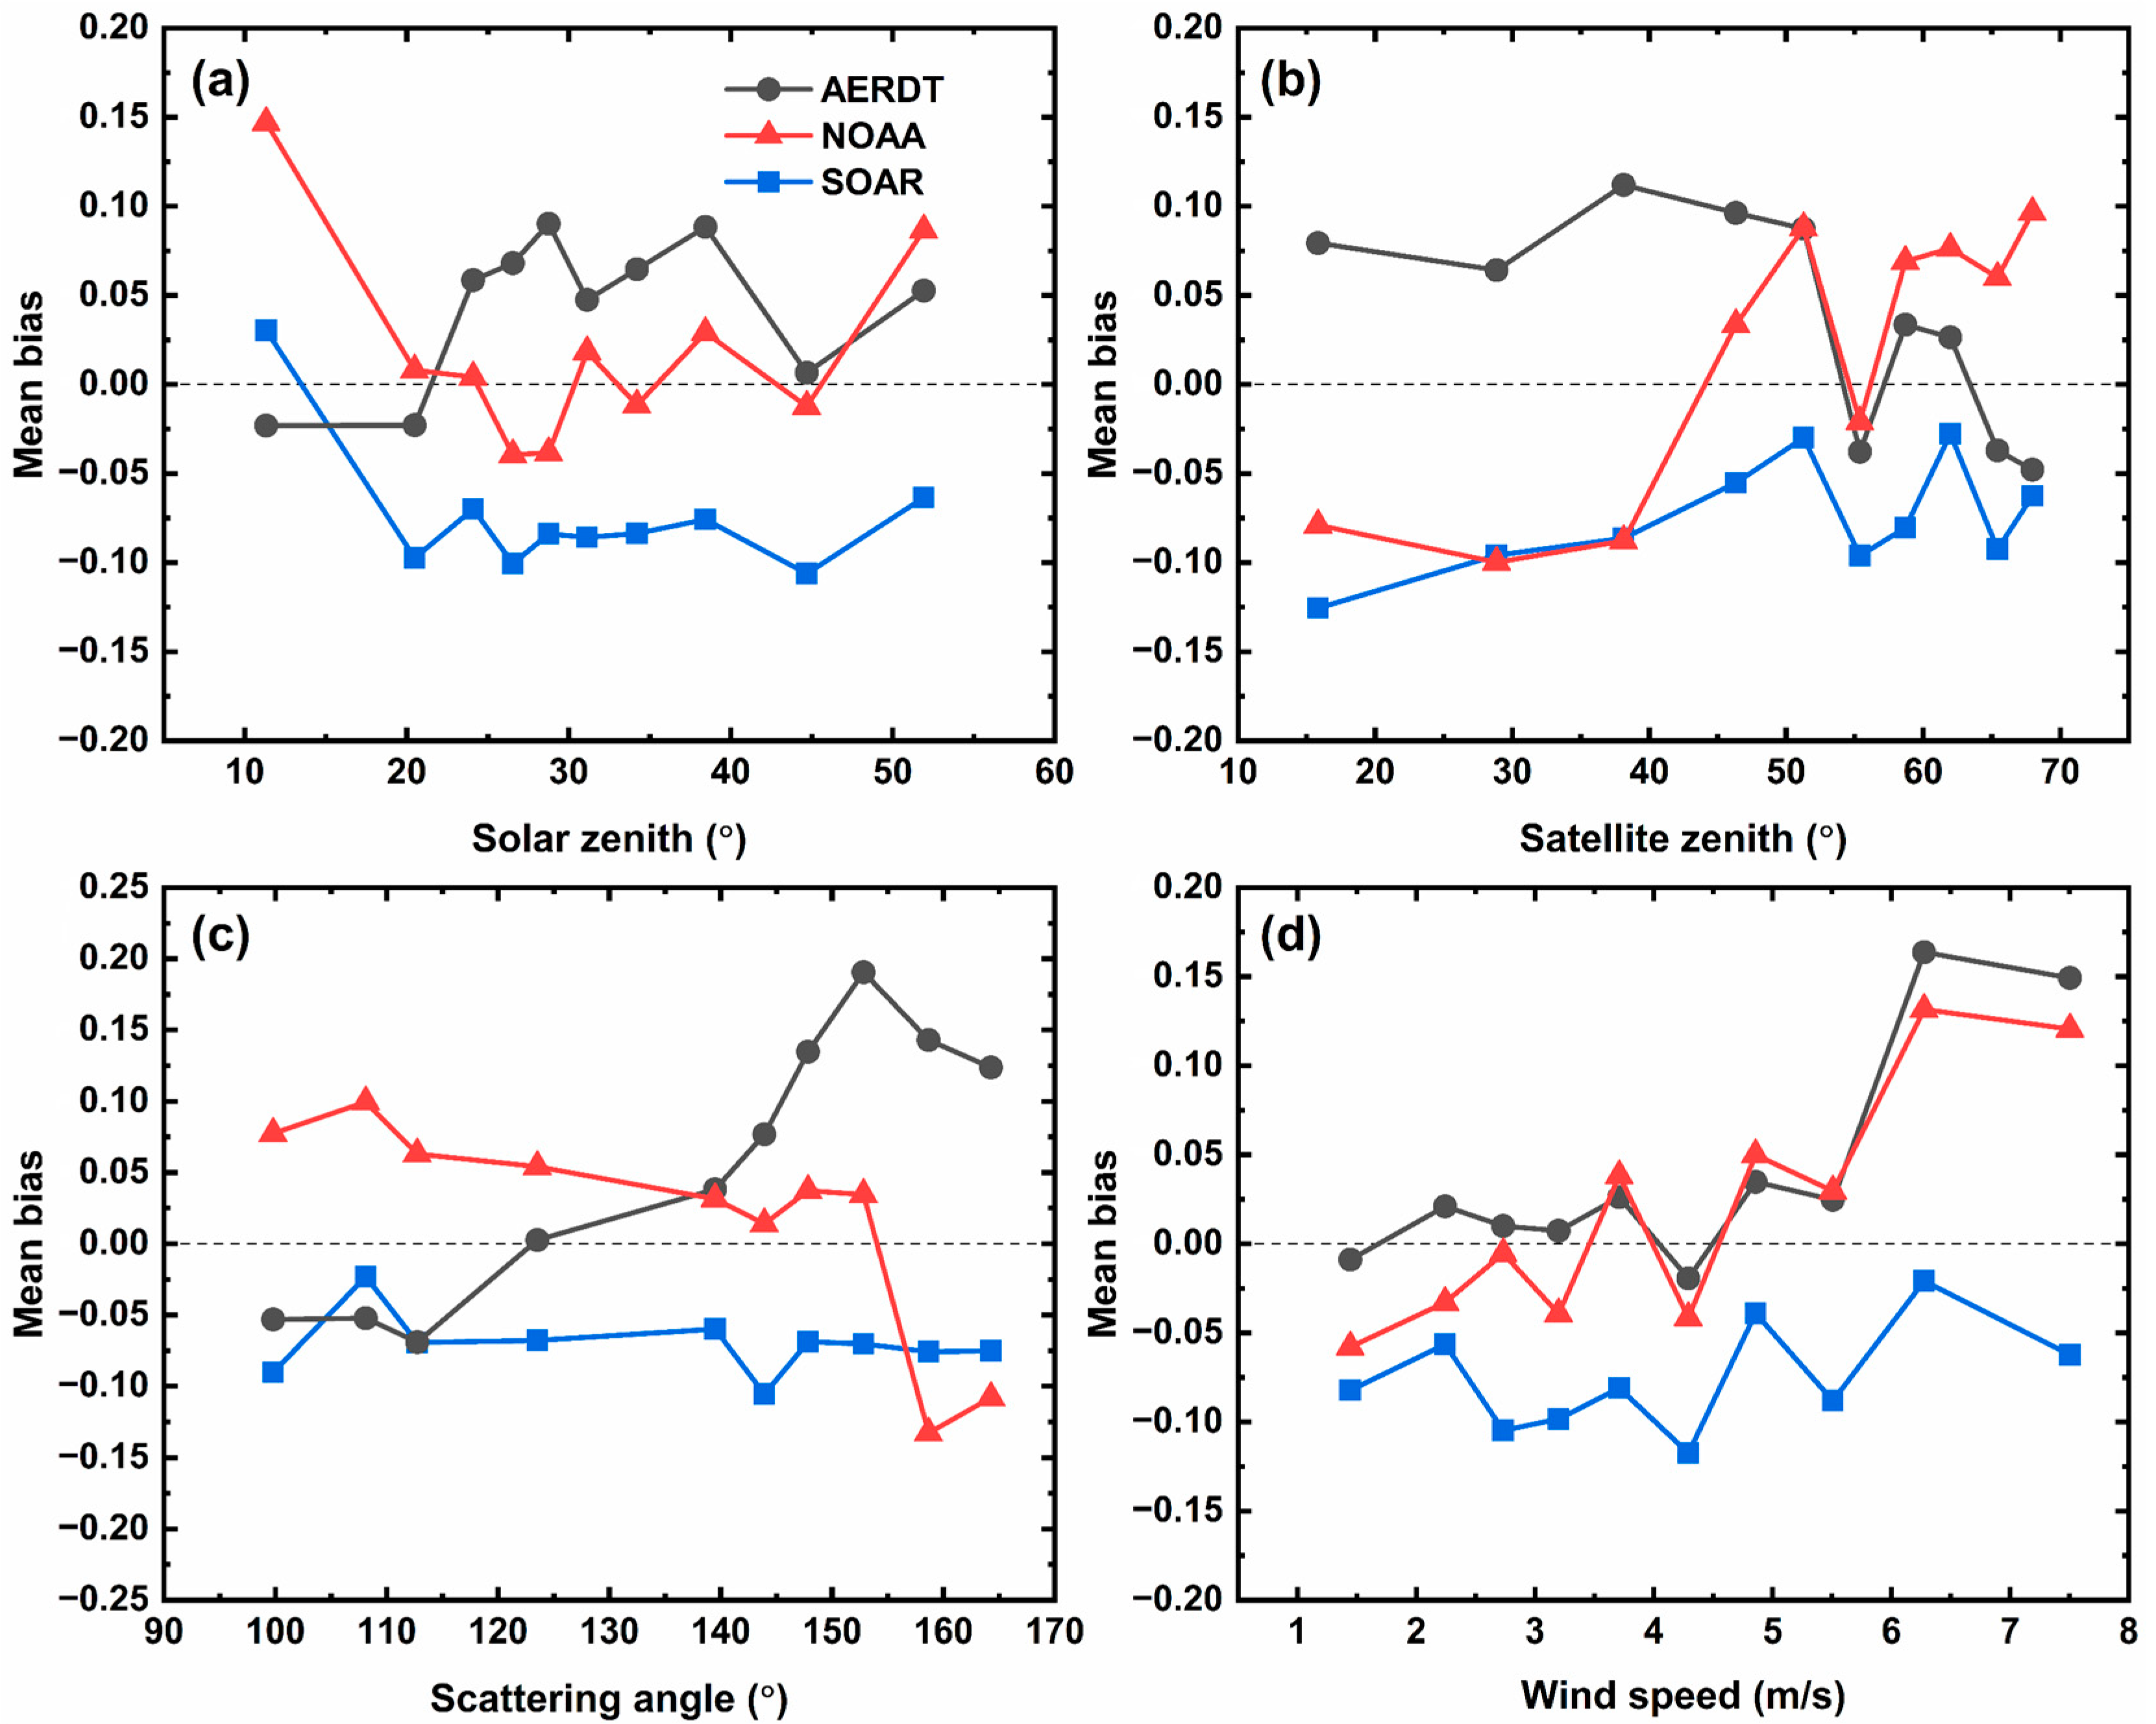
3.4.2. Ångström Exponent

Figure 12 shows the dependence of AE bias. Unlike AOD, the solar zenith angle has little effect on AE bias. However, the AE bias of NOAA and AERDT algorithms shows a dependence on the scattering angle, which is also caused by a scattering phase function that does not match the actual shape of the dust aerosol [38]. The SOAR algorithm uses a non-spherical dust model, so its AE bias does not depend on the scattering angle [26]. Therefore, it is recommended that current algorithms update the non-spherical dust model and aerosol model selection strategy to improve aerosol retrieval. Figure 11d shows that the AE bias of all VIIRS products is positively correlated with sea surface wind speed.

4. Discussion

VIIRS has provided data since 2012 and has three different aerosol algorithms applied to it simultaneously. An issue is whether these products can achieve the accuracy of existing products (such as MODIS) and can be applied scientifically. Another issue is the different performances and advantages of the three VIIRS products. This study uses AERONET ground-based observations to simultaneously validate and compare the total AOD, AE, FMF, and AODF of the three VIIRS aerosol products over the ocean using a consistent approach and data.
The validation results on the global scale show that the VIIRS ocean aerosol retrieval performance is good, reaching and possibly better than that of the MODIS aerosol retrieval in the same period. Liu et al. [42] compared the NOAA ocean AOD and the MODIS Collection 5.1 ocean AOD and also found that their accuracy was comparable. Note that users need to be wary of AERDT’s AOD and NOAA’s FMF and AE, which may not reach the accuracy of MODIS. Sawyer et al. [17] compared AERDT and MODIS AOD over the ocean and also found that the validation accuracy of the AERDT ocean AOD was slightly worse than that of the MODIS. Overall, SOAR shows the best validation accuracy of the aerosol retrievals (including total AOD, AE, FMF, and AODF) in the three products. Especially, the fraction of SOAR AODF better than the GCOS goal (EE goal) is 0.727 (0.803), which suggests that it meets the requirements of scientific research. Notably, we found that all quality retrievals for SOAR do not filter land pixels fully (not shown), so quality filtering for SOAR is recommended. Conversely, NOAA, AERDT, and MODIS significantly overestimate AODF with above EE > 0.418 (Figure 4). This is unavoidable because they overestimate both total AOD and FMF (Figure 1, Figure 3 and Figure 5). Therefore, the AODF of these algorithms should be used with caution for scientific research. There is a small difference in the spatial pattern of AOD between SOAR and NOAA, which is consistent with a previous study [18]. However, the AOD spatial patterns of AERDT versus NOAA and SOAR show larger differences. Since NOAA and SOAR AODs show better validation accuracies, their AOD spatial patterns are more credible. The AE of SOAR is systematically smaller than that of NOAA and AERDT. Although the difference in AE between AERDT and NOAA is small (MB = 0.062), it does not mean that they retrieve more accurate AEs because SOAR shows a better validation of AE (Figure 2 and Figure 5). Therefore, VIIRS AEs require further validation and analysis. The FMFs and AEs retrieved by VIIRS are correlated [13]; therefore, they generally exhibit the same validation characteristics. For example, AERDT and NOAA overestimated low AE and low FMF (Figure 5). Conversely, SOAR performs well under low AE and FMF conditions. Using the non-spherical dust model may improve the retrievals of FMF and AE [38]. Proper selection of dust pixels and limited mixing ratios of coarse and fine modes are also possible directions for improvement [18,43].
Error analysis results show that scattering angle and sea surface wind speed have an impact on AOD and AE biases, suggesting potential points for algorithm improvement. For example, the non-spherical dust model is used in the SOAR algorithm; therefore, its retrieval has a smaller dependence on the scattering angle [26]. Previous studies have shown that simply adding non-spherical models to existing algorithms, while tempting, may not solve the problem. This is because the simple modification does not guarantee that the algorithm can stably select a suitable non-spherical model for the retrieval of dust aerosols, or a spherical model for the retrieval of non-dust aerosols [38,41]. Although all VIIRS algorithms consider the sea surface wind speed parameter, retrieval biases are still dependent on it. Previous studies have also found a similar problem [44,45]. The possible reason is that high wind speeds increase the reflectance of glint and foam, further enlarging the reflectance of the ocean surface [44]. Therefore, the aerosol signal accounts for a smaller proportion of satellite-observed reflectance, leading to greater AOD and AE bias. AOD and AE both have a relatively strong relationship with wind speed, which may be another possible reason why the retrieval bias is dependent on wind speed [46].

5. Conclusions

As the successor to sensors such as MODIS, three algorithm teams have developed different aerosol products to continue long-term MODIS aerosol observations. Over the ocean, all three algorithms can retrieve AOD, AE, FMF, and AODF properties. However, the validation of FMF and AODF is ignored by most studies. They are important and can better determine anthropogenic radiative forcing [1]. The main conclusions of the validation and comparison results in 2018 are: (1) SOAR total AOD retrievals (quality filtering) have a better validation accuracy. After quality and AOD loading filtering, the AE and FMF validation accuracies of the three algorithms are similar, but SOAR may be slightly better. (2) SOAR AODF meets the goal of GCOS (its retrieval stability is also necessary to be studied (e.g., [31])), while the AODF of AERDT and NOAA should be used with caution in the scientific study due to their lower validation accuracy. (3) The differences in AOD spatial patterns of the three VIIRS products are small, but the differences in AE spatial patterns are large. (4) Scattering angle and sea surface wind speed affect the retrieval bias. The suitable non-spherical dust model may reduce the dependence of retrieval bias on the scattering angle. Higher wind speeds result in greater ocean surface reflectance, which results in a reduced sensitivity of satellite-observed reflectivity to aerosol signals. This may explain the dependence of retrieval bias on wind speed. Since this study only used AERONET observation data in 2018 and on coasts and islands, the result may not represent the full view of the performance of these three ocean products. More robust studies will be carried out in the future.

Author Contributions

X.S. and L.F. designed the research; W.L. and X.S. performed the experiments and analyzed the data; W.L. and X.S. wrote the manuscript; L.F., J.W., Y.Z. and M.C. revised the manuscript. All authors have read and agreed to the published version of the manuscript.

Funding

This work was financially supported by the National Natural Science Foundation of China (41975044, 41925007, 41771360, 42101385, and 41801021), Graduate Laboratory Open Fund Project of China University of Geosciences, Wuhan, and College Student Independent Innovation Funding Program of China University of Geosciences, Wuhan.

Data Availability Statement

The MODIS and VIIRS (https://earthdata.nasa.gov, last access: 23 May 2022) and AERONET (https://aeronet.gsfc.nasa.gov, last access: 23 May 2022) data used in this study are freely available from NASA.

Acknowledgments

The authors gratefully acknowledge NASA DB and DT, and NOAA EDR aerosol teams and AERONET PIs for their effort in making the data available.

Conflicts of Interest

The authors declare no conflict of interest.

References

  1. Jia, H.; Ma, X.; Yu, F.; Quaas, J. Significant underestimation of radiative forcing by aerosol–cloud interactions derived from satellite-based methods. Nat. Commun. 2021, 12, 3649. [Google Scholar] [CrossRef] [PubMed]
  2. Russell, P.B.; Livingston, J.M.; Hignett, P.; Kinne, S.; Wong, J.; Chien, A.; Bergstrom, R.; Durkee, P.; Hobbs, P.V. Aerosol-induced radiative flux changes off the United States mid-Atlantic coast: Comparison of values calculated from sunphotometer and in situ data with those measured by airborne pyranometer. J. Geophys. Res. Atmos. 1999, 104, 2289–2307. [Google Scholar] [CrossRef]
  3. Bellouin, N.; Quaas, J.; Gryspeerdt, E.; Kinne, S.; Stier, P.; Watson-Parris, D.; Boucher, O.; Carslaw, K.S.; Christensen, M.; Daniau, A.L.; et al. Bounding Global Aerosol Radiative Forcing of Climate Change. Rev. Geophys. 2020, 58, e2019RG000660. [Google Scholar] [CrossRef] [Green Version]
  4. Bellouin, N.; Quaas, J.; Morcrette, J.J.; Boucher, O. Estimates of aerosol radiative forcing from the MACC re-analysis. Atmos. Chem. Phys. 2013, 13, 2045–2062. [Google Scholar] [CrossRef] [Green Version]
  5. Pope, C.A. Lung Cancer, Cardiopulmonary Mortality, and Long-term Exposure to Fine Particulate Air Pollution. JAMA 2002, 287, 1132. [Google Scholar] [CrossRef] [PubMed] [Green Version]
  6. Kaufman, Y.J.; Tanré, D.; Boucher, O. A satellite view of aerosols in the climate system. Nature 2002, 419, 215–223. [Google Scholar] [CrossRef]
  7. Griggs, M. Measurements of Atmospheric Aerosol Optical Thickness over Water Using ERTS-1 Data. J. Air Pollut. Control Assoc. 1975, 25, 622–626. [Google Scholar] [CrossRef] [Green Version]
  8. King, M.D.; Kaufman, Y.J.; Tanré, D.; Nakajima, T. Remote Sensing of Tropospheric Aerosols from Space: Past, Present, and Future. Bull. Am. Meteorol. Soc. 1999, 80, 2229–2260. [Google Scholar] [CrossRef] [Green Version]
  9. Geogdzhayev, I.V.; Mishchenko, M.I.; Rossow, W.B.; Cairns, B.; Lacis, A.A. Global Two-Channel AVHRR Retrievals of Aerosol Properties over the Ocean for the Period of NOAA-9 Observations and Preliminary Retrievals Using NOAA-7 andNOAA-11 Data. J. Atmos. Sci. 2002, 59, 262–278. [Google Scholar] [CrossRef] [Green Version]
  10. Liu, L.; Mishchenko, M.I.; Geogdzhayev, I.; Smirnov, A.; Sakerin, S.M.; Kabanov, D.M.; Ershov, O.A. Global validation of two-channel AVHRR aerosol optical thickness retrievals over the oceans. J. Quant. Spectrosc. Radiat. Transf. 2004, 88, 97–109. [Google Scholar] [CrossRef]
  11. Sayer, A.M.; Hsu, N.C.; Bettenhausen, C.; Ahmad, Z.; Holben, B.N.; Smirnov, A.; Thomas, G.E.; Zhang, J. SeaWiFS Ocean Aerosol Retrieval (SOAR): Algorithm, validation, and comparison with other data sets. J. Geophys. Res. Atmos. 2012, 117, D03206. [Google Scholar] [CrossRef]
  12. Levy, R.C.; Mattoo, S.; Munchak, L.A.; Remer, L.A.; Sayer, A.M.; Patadia, F.; Hsu, N.C. The Collection 6 MODIS aerosol products over land and ocean. Atmos. Meas. Tech. 2013, 6, 2989–3034. [Google Scholar] [CrossRef] [Green Version]
  13. Kleidman, R.G.; O’Neill, N.T.; Remer, L.A.; Kaufman, Y.J.; Eck, T.F.; Tanré, D.; Dubovik, O.; Holben, B.N. Comparison of Moderate Resolution Imaging Spectroradiometer (MODIS) and Aerosol Robotic Network (AERONET) remote-sensing retrievals of aerosol fine mode fraction over ocean. J. Geophys. Res. Atmos. 2005, 110, D22205. [Google Scholar] [CrossRef]
  14. Kaufman, Y.J.; Boucher, O.; Tanré, D.; Chin, M.; Remer, L.A.; Takemura, T. Aerosol anthropogenic component estimated from satellite data. Geophys. Res. Lett. 2005, 32, L17804. [Google Scholar] [CrossRef]
  15. Bellouin, N.; Boucher, O.; Haywood, J.; Reddy, M.S. Global estimate of aerosol direct radiative forcing from satellite measurements. Nature 2005, 438, 1138–1141. [Google Scholar] [CrossRef]
  16. Jackson, J.M.; Liu, H.; Laszlo, I.; Kondragunta, S.; Remer, L.A.; Huang, J.; Huang, H. Suomi-NPP VIIRS aerosol algorithms and data products. J. Geophys. Res. Atmos. 2013, 118, 12673–12689. [Google Scholar] [CrossRef]
  17. Sawyer, V.; Levy, R.C.; Mattoo, S.; Cureton, G.; Shi, Y.; Remer, L.A. Continuing the MODIS Dark Target Aerosol Time Series with VIIRS. Remote Sens. 2020, 12, 308. [Google Scholar] [CrossRef] [Green Version]
  18. Sayer, A.M.; Hsu, N.C.; Lee, J.; Bettenhausen, C.; Kim, W.V.; Smirnov, A. Satellite Ocean Aerosol Retrieval (SOAR) Algorithm Extension to S-NPP VIIRS as Part of the “Deep Blue” Aerosol Project. J. Geophys. Res. Atmos. 2018, 123, 380–400. [Google Scholar] [CrossRef]
  19. Huang, J.; Kondragunta, S.; Laszlo, I.; Liu, H.; Remer, L.A.; Zhang, H.; Superczynski, S.; Ciren, P.; Holben, B.N.; Petrenko, M. Validation and expected error estimation of Suomi-NPP VIIRS aerosol optical thickness and Ångström exponent with AERONET. J. Geophys. Res. Atmos. 2016, 121, 7139–7160. [Google Scholar] [CrossRef] [Green Version]
  20. Sayer, A.M.; Hsu, N.C.; Lee, J.; Kim, W.V.; Dubovik, O.; Dutcher, S.T.; Huang, D.; Litvinov, P.; Lyapustin, A.; Tackett, J.L.; et al. Validation of SOAR VIIRS Over-Water Aerosol Retrievals and Context within the Global Satellite Aerosol Data Record. J. Geophys. Res. Atmos. 2018, 123, 13496–13526. [Google Scholar] [CrossRef]
  21. Sayer, A.M.; Munchak, L.A.; Hsu, N.C.; Levy, R.C.; Bettenhausen, C.; Jeong, M.J. MODIS Collection 6 aerosol products: Comparison between Aqua’s e-Deep Blue, Dark Target, and “merged” data sets, and usage recommendations. J. Geophys. Res. Atmos. 2014, 119, 13965–13989. [Google Scholar] [CrossRef]
  22. Liu, N.; Zou, B.; Feng, H.; Wang, W.; Tang, Y.; Liang, Y. Evaluation and comparison of multiangle implementation of the atmospheric correction algorithm, Dark Target, and Deep Blue aerosol products over China. Atmos. Chem. Phys. 2019, 19, 8243–8268. [Google Scholar] [CrossRef] [Green Version]
  23. He, L.; Wang, L.; Li, Z.; Jiang, D.; Sun, L.; Liu, D.; Liu, L.; Yao, R.; Zhou, Z.; Wei, J. VIIRS Environmental Data Record and Deep Blue aerosol products: Validation, comparison, and spatiotemporal variations from 2013 to 2018 in China. Atmos. Environ. 2021, 250, 118265. [Google Scholar] [CrossRef]
  24. Levy, R.C.; Munchak, L.A.; Mattoo, S.; Patadia, F.; Remer, L.A.; Holz, R.E. Towards a long-term global aerosol optical depth record: Applying a consistent aerosol retrieval algorithm to MODIS and VIIRS-observed reflectance. Atmos. Meas. Tech. 2015, 8, 4083–4110. [Google Scholar] [CrossRef] [Green Version]
  25. Patadia, F.; Levy, R.C.; Mattoo, S. Correcting for trace gas absorption when retrieving aerosol optical depth from satellite observations of reflected shortwave radiation. Atmos. Meas. Tech. 2018, 11, 3205–3219. [Google Scholar] [CrossRef] [Green Version]
  26. Lee, J.; Hsu, N.C.; Sayer, A.M.; Bettenhausen, C.; Yang, P. AERONET-Based Nonspherical Dust Optical Models and Effects on the VIIRS Deep Blue/SOAR Over Water Aerosol Product. J. Geophys. Res. Atmos. 2017, 122, 10384–10401. [Google Scholar] [CrossRef]
  27. Chen, C.; Dubovik, O.; Fuertes, D.; Litvinov, P.; Lapyonok, T.; Lopatin, A.; Ducos, F.; Derimian, Y.; Herman, M.; Tanré, D.; et al. Validation of GRASP algorithm product from POLDER/PARASOL data and assessment of multi-angular polarimetry potential for aerosol monitoring. Earth Syst. Sci. Data. 2020, 12, 3573–3620. [Google Scholar] [CrossRef]
  28. Wang, Y.; Wang, J.; Levy, R.C.; Shi, Y.R.; Mattoo, S.; Reid, J.S. First Retrieval of AOD at Fine Resolution Over Shallow and Turbid Coastal Waters From MODIS. Geophys. Res. Lett. 2021, 48, e2021GL094344. [Google Scholar] [CrossRef]
  29. Levy, R.C.; Mattoo, S.; Sawyer, V.; Shi, Y.; Colarco, P.R.; Lyapustin, A.I.; Wang, Y.; Remer, L.A. Exploring systematic offsets between aerosol products from the two MODIS sensors. Atmos. Meas. Tech. 2018, 11, 4073–4092. [Google Scholar] [CrossRef] [Green Version]
  30. Eck, T.F.; Holben, B.N.; Reid, J.S.; Dubovik, O.; Smirnov, A.; O’Neill, N.T.; Slutsker, I.; Kinne, S. Wavelength dependence of the optical depth of biomass burning, urban, and desert dust aerosols. J. Geophys. Res. Atmos. 1999, 104, 31333–31349. [Google Scholar] [CrossRef]
  31. Su, X.; Wei, Y.; Wang, L.; Zhang, M.; Jiang, D.; Feng, L. Accuracy, stability, and continuity of AVHRR, SeaWiFS, MODIS, and VIIRS deep blue long-term land aerosol retrieval in Asia. Sci. Total Environ. 2022, 832, 155048. [Google Scholar] [CrossRef] [PubMed]
  32. Su, X.; Wang, L.; Zhang, M.; Qin, W.; Bilal, M. A High-Precision Aerosol Retrieval Algorithm (HiPARA) for Advanced Himawari Imager (AHI) data: Development and verification. Remote Sens. Environ. 2021, 253, 112221. [Google Scholar] [CrossRef]
  33. Giles, D.M.; Sinyuk, A.; Sorokin, M.G.; Schafer, J.S.; Smirnov, A.; Slutsker, I.; Eck, T.F.; Holben, B.N.; Lewis, J.R.; Campbell, J.R.; et al. Advancements in the Aerosol Robotic Network (AERONET) Version 3 database–automated near-real-time quality control algorithm with improved cloud screening for Sun photometer aerosol optical depth (AOD) measurements. Atmos. Meas. Tech. 2019, 12, 169–209. [Google Scholar] [CrossRef] [Green Version]
  34. O’Neill, N.T.; Dubovik, O.; Eck, T.F. Modified Ångström exponent for the characterization of submicrometer aerosols. Appl. Opt. 2001, 40, 2368–2375. [Google Scholar] [CrossRef] [PubMed]
  35. Dubovik, O.; King, M.D. A flexible inversion algorithm for retrieval of aerosol optical properties from Sun and sky radiance measurements. J. Geophys. Res. Atmos. 2000, 105, 20673–20696. [Google Scholar] [CrossRef] [Green Version]
  36. Feng, L.; Su, X.; Wang, L.; Jiang, T.; Zhang, M.; Wu, J.; Qin, W.; Chen, Y. Accuracy and error cause analysis, and recommendations for usage of Himawari-8 aerosol products over Asia and Oceania. Sci. Total Environ. 2021, 796, 148958. [Google Scholar] [CrossRef] [PubMed]
  37. Schutgens, N.A.J.; Nakata, M.; Nakajima, T. Validation and empirical correction of MODIS AOT and AE over ocean. Atmos. Meas. Tech. 2013, 6, 2455–2475. [Google Scholar] [CrossRef] [Green Version]
  38. Zhou, Y.; Levy, R.C.; Remer, L.A.; Mattoo, S.; Espinosa, W.R. Dust Aerosol Retrieval Over the Oceans With the MODIS/VIIRS Dark Target Algorithm: 2. Nonspherical Dust Model. Earth Space Sci. 2020, 7, e2020EA001222. [Google Scholar] [CrossRef]
  39. Kalashnikova, O.V.; Garay, M.J.; Martonchik, J.V.; Diner, D.J. MISR Dark Water aerosol retrievals: Operational algorithm sensitivity to particle non-sphericity. Atmos. Meas. Tech. 2013, 6, 2131–2154. [Google Scholar] [CrossRef] [Green Version]
  40. Wang, Y.; Hioki, S.; Yang, P.; King, M.; Di Girolamo, L.; Fu, D.; Baum, B. Inference of an Optimal Ice Particle Model through Latitudinal Analysis of MISR and MODIS Data. Remote Sens. 2018, 10, 1981. [Google Scholar] [CrossRef] [Green Version]
  41. Wang, Y.; Yang, P.; Hioki, S.; King, M.D.; Baum, B.A.; Di Girolamo, L.; Fu, D. Ice Cloud Optical Thickness, Effective Radius, And Ice Water Path Inferred from Fused MISR and MODIS Measurements Based on a Pixel-Level Optimal Ice Particle Roughness Model. J. Geophys. Res. Atmos. 2019, 124, 12126–12140. [Google Scholar] [CrossRef]
  42. Liu, H.; Remer, L.A.; Huang, J.; Huang, H.; Kondragunta, S.; Laszlo, I.; Oo, M.; Jackson, J.M. Preliminary evaluation of S-NPP VIIRS aerosol optical thickness. J. Geophys. Res. Atmos. 2014, 119, 3942–3962. [Google Scholar] [CrossRef]
  43. Zhou, Y.; Levy, R.C.; Remer, L.A.; Mattoo, S.; Shi, Y.; Wang, C. Dust Aerosol Retrieval Over the Oceans With the MODIS/VIIRS Dark-Target Algorithm: 1. Dust Detection. Earth Space Sci. 2020, 7, e2020EA001221. [Google Scholar] [CrossRef]
  44. Kleidman, R.G.; Smirnov, A.; Levy, R.C.; Mattoo, S.; Tanre, D. Evaluation and Wind Speed Dependence of MODIS Aerosol Retrievals Over Open Ocean. IEEE Trans. Geosci. Remote 2012, 50, 429–435. [Google Scholar] [CrossRef]
  45. Zhang, J.; Reid, J.S. MODIS aerosol product analysis for data assimilation: Assessment of over-ocean level 2 aerosol optical thickness retrievals. J. Geophys. Res. Atmos. 2006, 111, D22207. [Google Scholar] [CrossRef]
  46. Merkulova, L.; Freud, E.; Mårtensson, E.M.; Nilsson, E.D.; Glantz, P. Effect of Wind Speed on Moderate Resolution Imaging Spectroradiometer (MODIS) Aerosol Optical Depth over the North Pacific. Atmosphere 2018, 9, 60. [Google Scholar] [CrossRef] [Green Version]
Figure 1. Total AOD at 550 nm validation results using AERONET measurements. (a) SOAR, (b) NOAA, (c) AERDT, and (d) MYD04 products.
Remotesensing 14 02544 g001
Figure 2. Fine mode fraction at 550 nm validation results using AERONET measurements. (a) SOAR, (b) NOAA, (c) AERDT, and (d) MYD04 products.
Remotesensing 14 02544 g002
Figure 3. VIIRS AE at 550 nm comparison results with that of AERONET. (a) SOAR, (b) NOAA, (c) AERDT, and (d) MYD04 products.
Remotesensing 14 02544 g003
Figure 4. Fine mode AOD (AODF) at 550 nm validation results using AERONET measurements. (a) SOAR, (b) NOAA, (c) AERDT, and (d) MYD04 products.
Remotesensing 14 02544 g004
Figure 5. Comparison results of VIIRS (a) total AOD, (b) AE, (c) FMF, and (d) fine mode AOD parameters with those of AERONET. The dashed black line is 1:1 and the shading is the expected error envelope.
Remotesensing 14 02544 g005
Figure 6. Spatial pattern comparison of three VIIRS products. (a) SOAR mean AOD (0.028) matched AERDT, (b) mean bias (−0.014) of SOAR and AERDT, (c) mean bias (0.001) of SOAR and NOAA, (d) mean bias (0.016) of AERDT and NOAA.
Remotesensing 14 02544 g006
Figure 7. AOD correlation coefficient of (a) SOAR and AERDT, (b) SOAR and NOAA.
Remotesensing 14 02544 g007
Figure 8. AOD retrieval frequency ratio of (a) SOAR and AERDT, (b) SOAR and NOAA.
Remotesensing 14 02544 g008
Figure 9. Spatial pattern comparison of three VIIRS products. (a) SOAR mean AE (0.352) matched AERDT, (b) mean AE bias (−0.315) of SOAR and AERDT, (c) mean AE bias (0.241) of SOAR and NOAA, (d) mean AE bias (0.062) of AERDT and NOAA.
Remotesensing 14 02544 g009
Figure 10. AE correlation coefficient of (a) SOAR and AERDT, (b) SOAR and NOAA.
Remotesensing 14 02544 g010
Figure 11. AOD error (AODVIIRS-AODAERONET) dependence analysis of on (a) solar zenith, (b) satellite zenith, (c) scattering angle, and (d) wind speed.
Remotesensing 14 02544 g011
Figure 12. AE error (AEVIIRS-AEAERONET) dependence analysis of on (a) solar zenith, (b) satellite zenith, (c) scattering angle, and (d) wind speed.
Remotesensing 14 02544 g012
Publisher’s Note: MDPI stays neutral with regard to jurisdictional claims in published maps and institutional affiliations.

