
On the Exploitation of Remote Sensing Technologies for the Monitoring of Coastal and River Delta Regions

 , , ,
, , ,  and
and
Abstract
:
1. Introduction
2. Remote Sensing Technologies for the Monitoring of Coastal and River Delta Regions
2.1. Remote Sensing Technologies for Deriving Land-Use and Land-Cover (LULC) Changes
2.2. Mapping Coastal Wetlands
2.3. Remote Sensing for Coastline Change Extraction
2.4. Ground Deformation Analyses
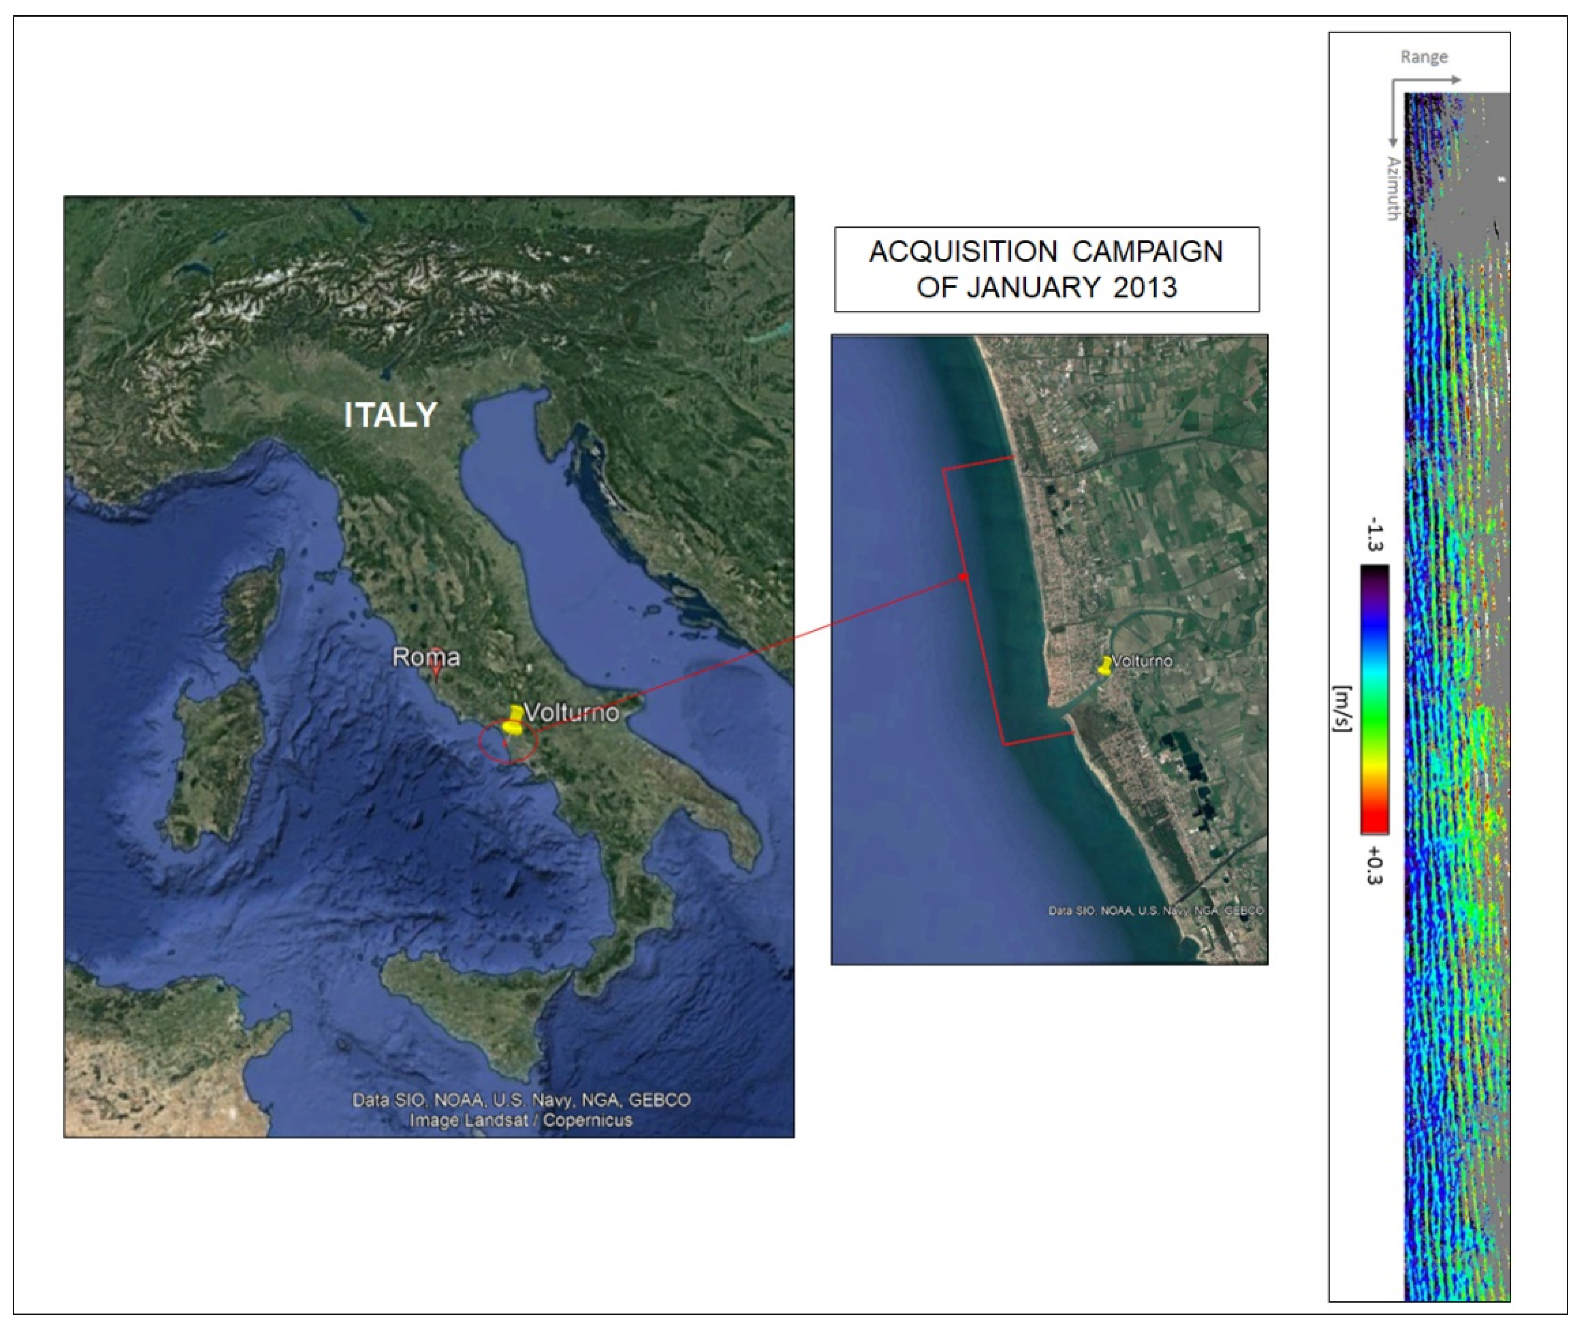
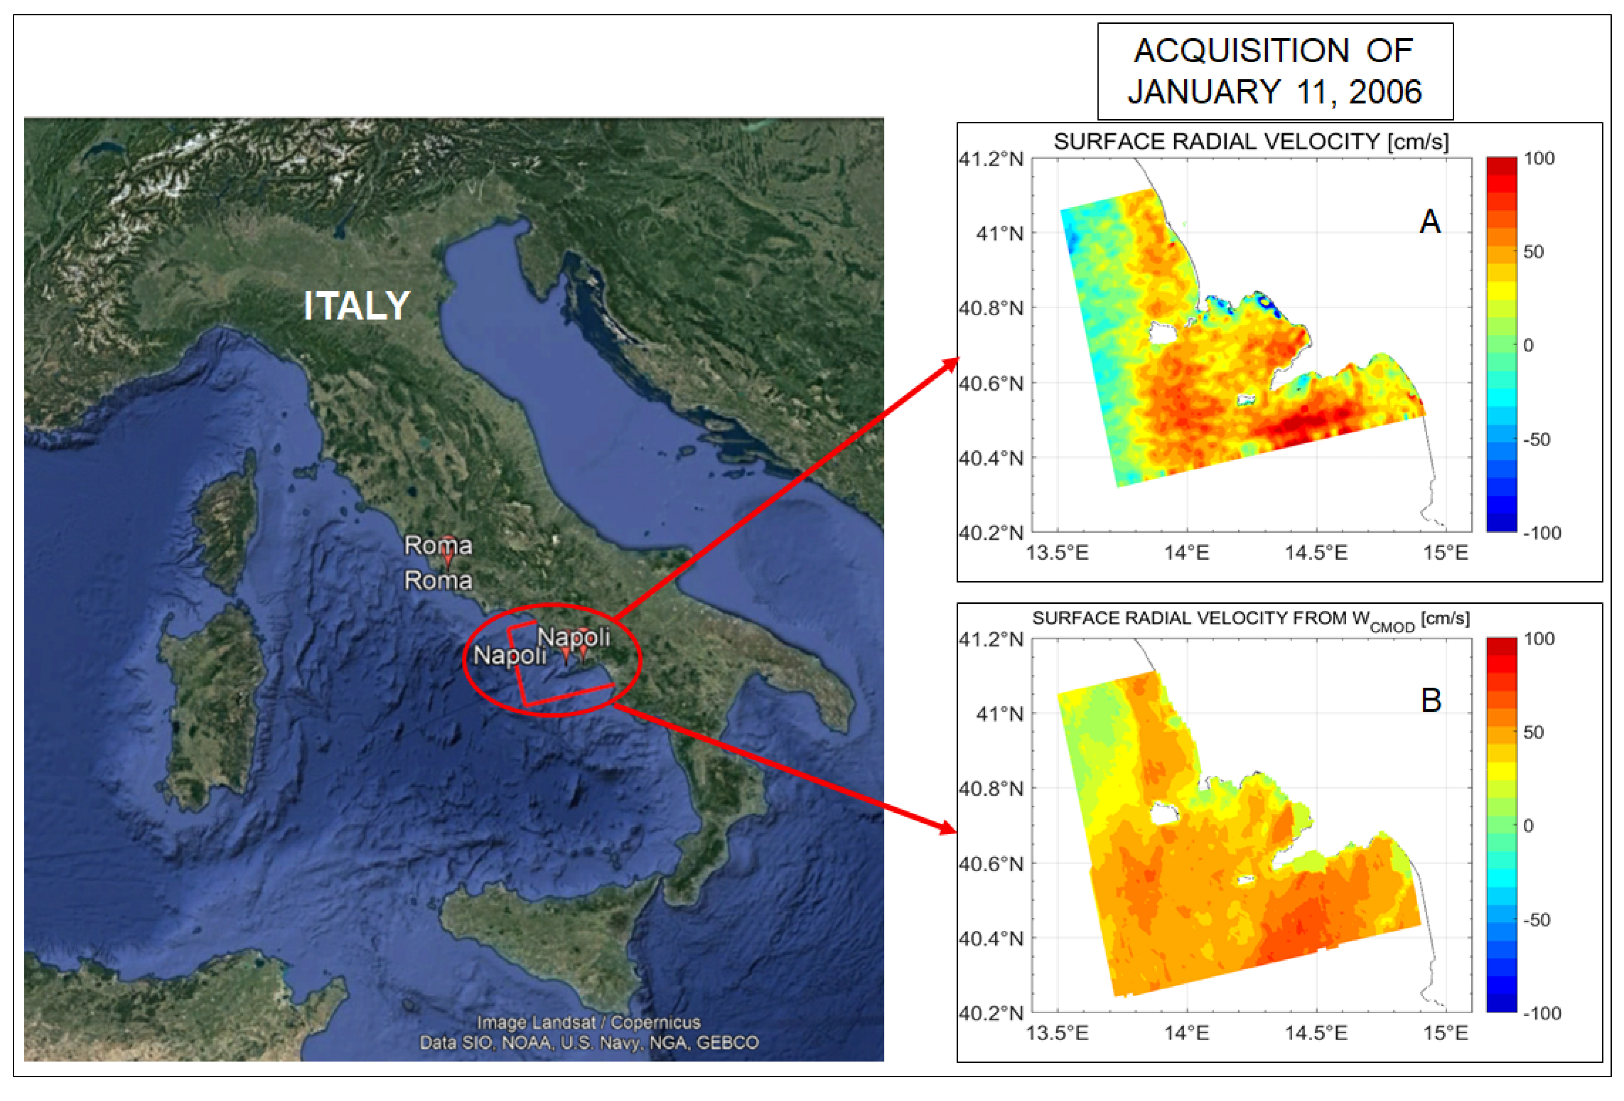
2.5. Sea Surface Monitoring through SAR-Based Approaches
3. Experiments
3.1. Coastal Erosion Risk
3.2. Flood Risk
3.3. Sea Level Rise and Tidal Evolution
3.3.1. Sea Level Rise

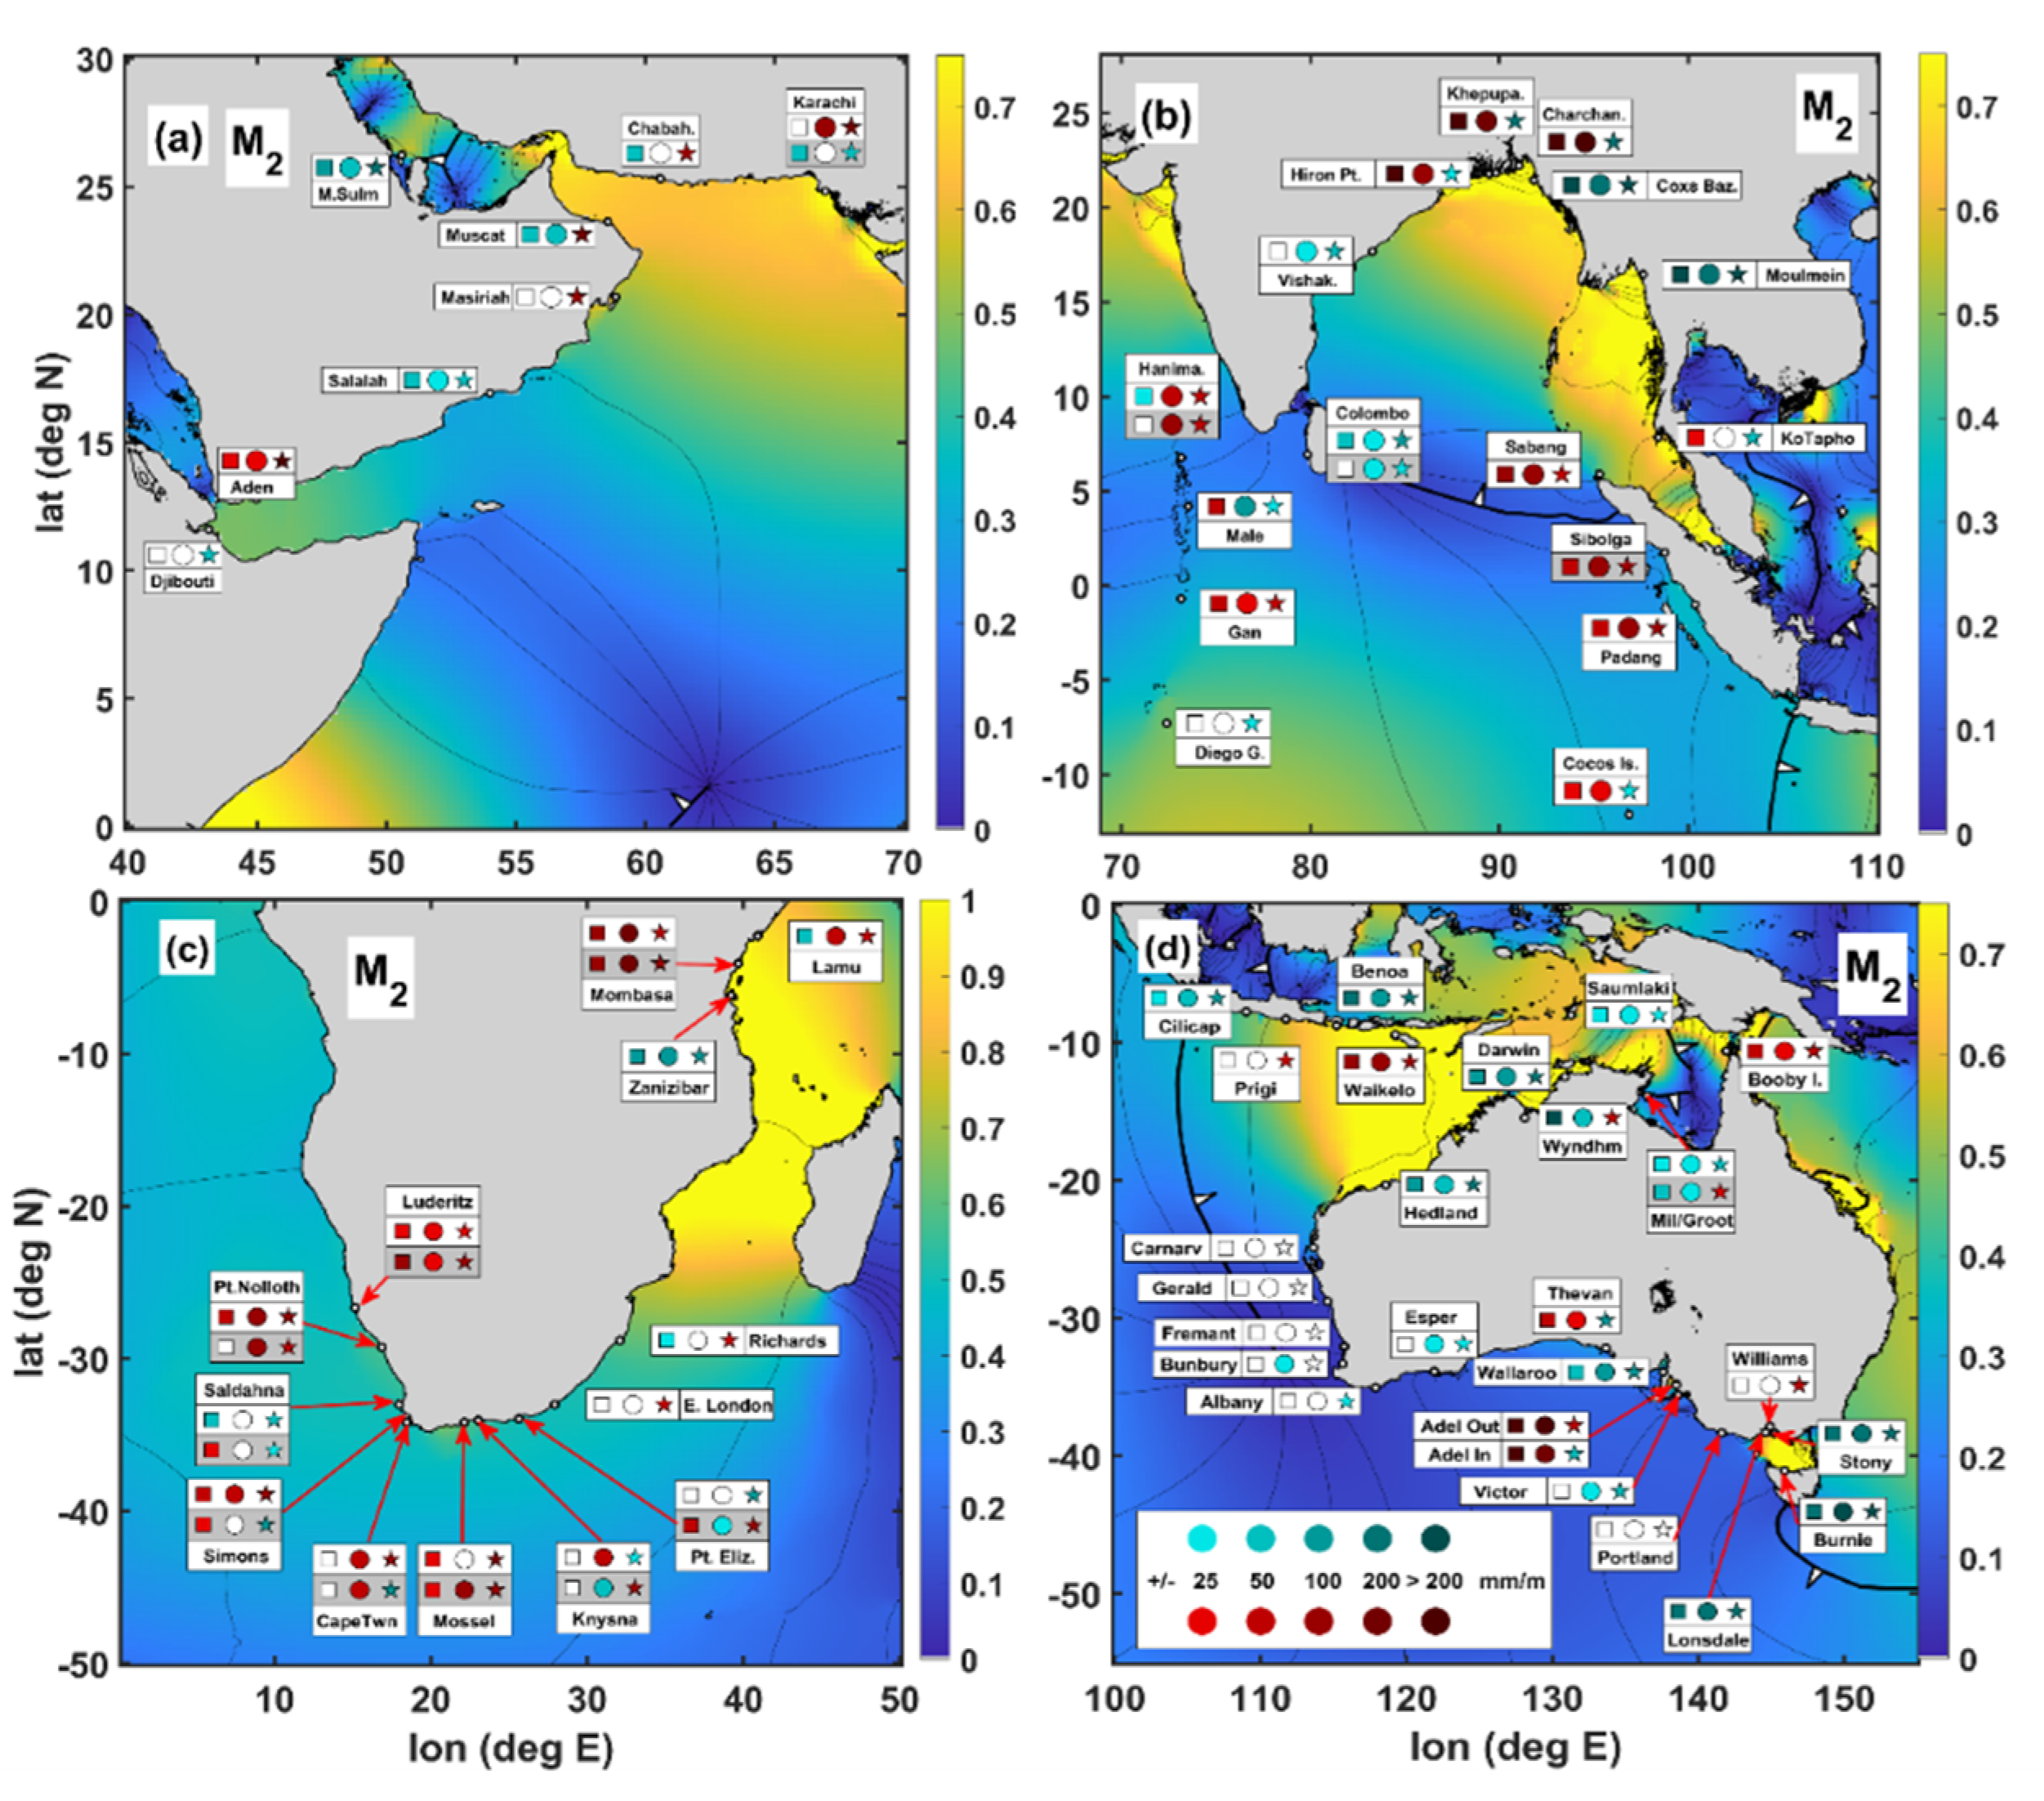
3.3.2. Tidal Evolution
3.3.3. Tidal Anomaly Correlations (TAC)
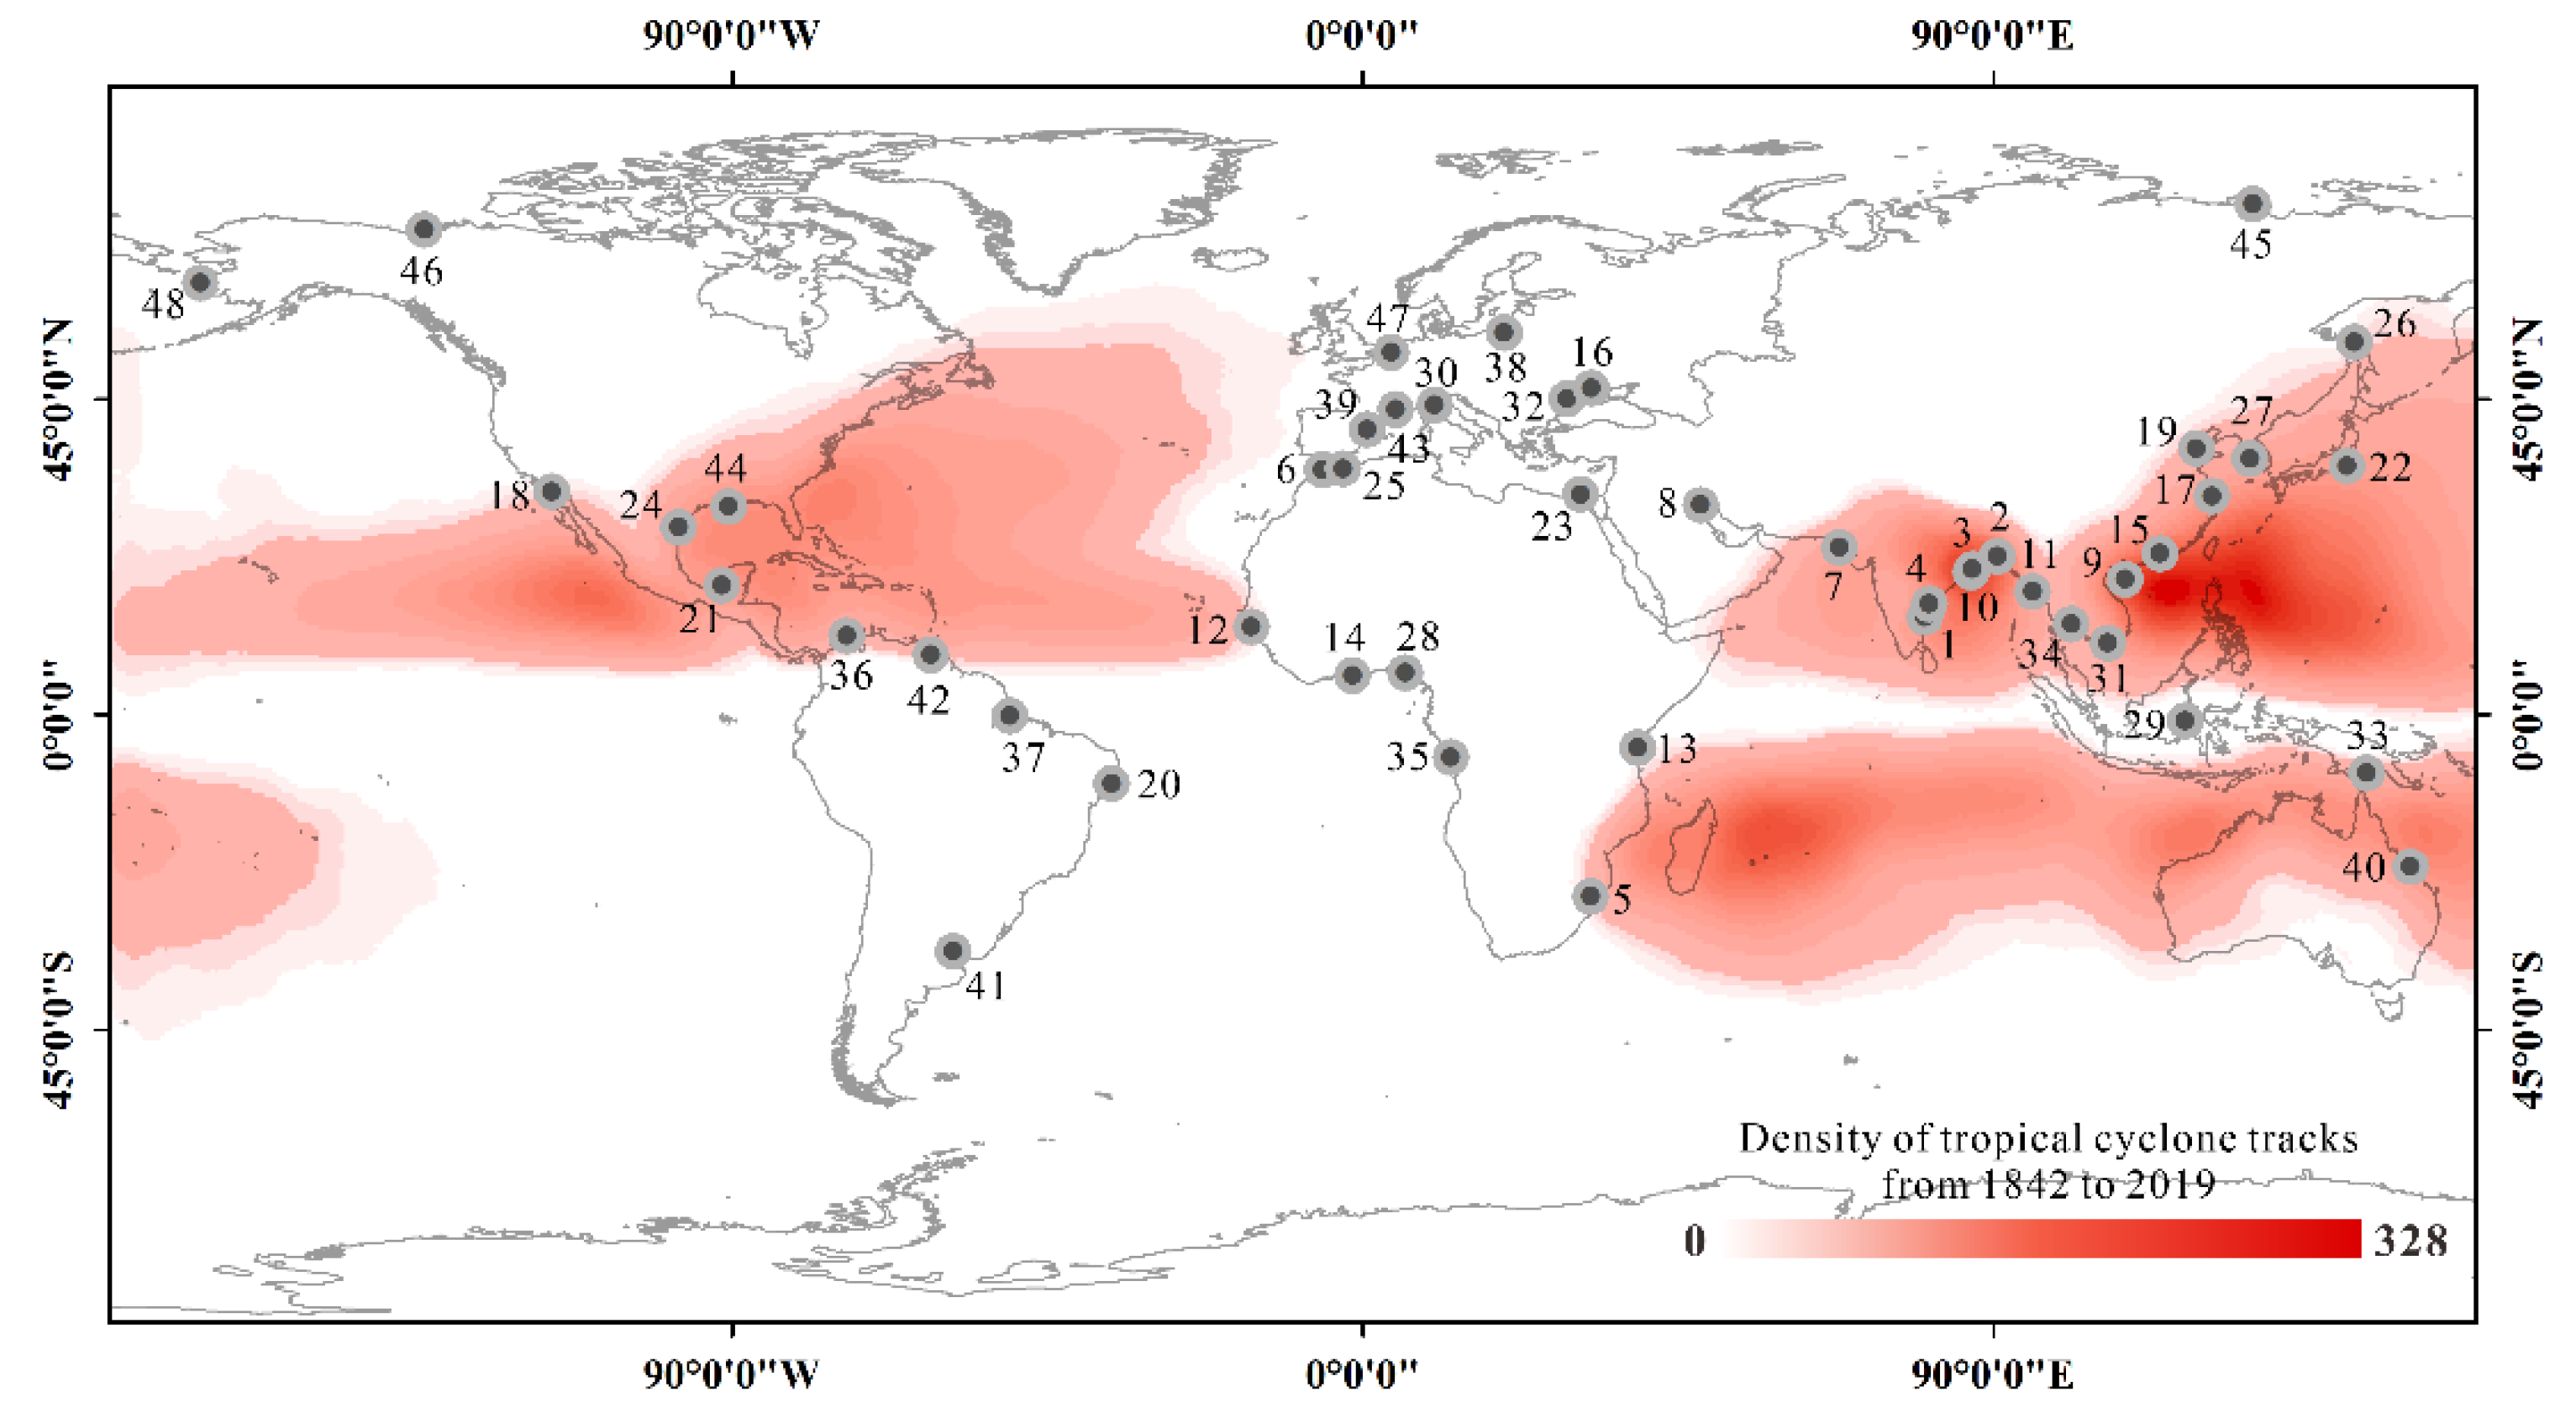
3.4. Storm Surge

| Delta (Country) | Risk Rate of Change Index 1 (Rank) | If the Delta Is in Tropical Regions or Not |
|---|---|---|
| Krishna (India) | 0.28(1) | Yes |
| Ganges-Brahmaputra-Meghna (Bangladesh) | 0.22(2) | Yes |
| Brahmani (India) | 0.22(3) | Yes |
| Godavari (India) | 0.21(4) | Yes |
| Limpopo (Mozambique) | 0.21(5) | Yes |
| Sebou (Morocco) | 0.19(6) | No |
| Indus (Pakistan) | 0.19(7) | Yes |
| Shatt-el-Arab (Iraq) | 0.16(8) | No |
| Hong (Vietnam) | 0.16(9) | Yes |
| Mahanadi (India) | 0.16(10) | Yes |
| Irrawaddy (Myanmar) | 0.15(11) | Yes |
| Senegal (Senegal/Mauritania) | 0.13(12) | Yes |
| Tana (Kenya) | 0.13(13) | No |
| Volta (Ghana) | 0.12(14) | No |
| Pearl (China) | 0.12(15) | Yes |
| Dnieper (Ukraine) | 0.11(16) | No |
| Yangtze (China) | 0.10(17) | Yes |
| Colorado (Mexico) | 0.10(18) | Yes |
| Yellow (China) | 0.097(19) | Yes |
| Sao Francisco (Brazil) | 0.095(20) | No |
| Grijalva (Mexico) | 0.085(21) | Yes |
| Tone (Japan) | 0.083(22) | Yes |
| Nile (Egypt) | 0.082(23) | No |
| Rio Grande (USA/Mexico) | 0.078(24) | Yes |
| Moulouya (Morocco) | 0.076(25) | No |
| Amur (Russia) | 0.069(26) | Yes |
| Han (South Korea) | 0.068(27) | Yes |
| Niger (Nigeria) | 0.067(28) | No |
| Mahakam (Indonesia) | 0.061(29) | No |
| Po (Italy) | 0.060(30) | No |
| Mekong (Vietnam) | 0.057(31) | Yes |
| Danube (Romania) | 0.056(32) | No |
| Fly (Papua New Guinea) | 0.054(33) | Yes |
| Chao Phraya (Thailand) | 0.049(34) | Yes |
| Congo (Democratic Republic of Congo/Angola) | 0.048(35) | No |
| Magdalena (Columbia) | 0.047(36) | Yes |
| Amazon (Brazil) | 0.044(37) | No |
| Vistula (Poland) | 0.043(38) | No |
| Ebro (Spain) | 0.040(39) | No |
| Burdekin (Australia) | 0.040(40) | Yes |
| Parana (Argentina) | 0.036(41) | No |
| Orinoco (Venezuela) | 0.033(42) | Yes |
| Rhone (France) | 0.030(43) | No |
| Mississippi (USA) | 0.025(44) | Yes |
| Lena (Russia) | 0.019(45) | No |
| Mackenzie (Canada) | 0.016(46) | No |
| Rhine (Netherlands) | 0.014(47) | No |
| Yukon (USA) | 0.005(48) | No |
| Delta | Ground Subsidence | Flood Risk | Erosion Risk | Tidal Wetland Decline | Extreme Rainfall | Storm Surge | Urbanization and Over-Population |
|---|---|---|---|---|---|---|---|
| Mississippi Delta | An average subsidence rate of 5.2 ± 0.9 mm/y was measured by GPS [380]. | Significant drowning is inevitable [381]. | The sediment load is insufficient. Upstream dams trap ~50% of the total sediment load [381,382]. | >25% of deltaic wetlands have disappeared [383]. | The largest floods in the last century principally resulted from heavy rainfall in the lower Mississippi Delta [384]. El Niño generates a positive precipitation anomaly over the lower Mississippi Basin [385]. | The Mississippi Deltas are especially susceptible to storm surge [386]. | Urbanization has increased substantially over the past five decades. Population growth has increased in the past decades [387]. |
| Po River Delta | The Po River Delta has experienced serious ground subsidence in the late 19th century [388]. The maximum deformation velocities are in the order of −30 mm/y. It is mainly caused by compaction of highly compressible sediments and heavy extraction of methane water [389]. | Flooding events along with episodes of storm surge have increased, enhanced by climate variations [388]. Disastrous floods occurred in last century [391]. | Severe coastal erosion was triggered by ground subsidence, and promoted by reduced sentiment loads of the rivers. | The natural wetlands were mainly converted to agricultural and urban areas in the last century [390]. | N/A | Climate changes makes the influence of storm surges and flooding more alarming [388]. | Urbanization increased by agriculture settlement in the last century. Agricultural activities were a major driver of wetland loss in last century, and it increased agricultural settlement [390]. |
| Mekong Delta | The ground subsidence rates are around 1–4 cm/y based on InSAR measurements [392]. | Threatened by the increased inundation hazard. | Mekong River Delta experienced dramatic evolution. Coastlines retreated toward land in low-lying areas [393]. | Wetland degradation is caused by resettlement and economic development policies, population growth and urbanization, demand for food and reclaiming for agriculture, construction of canals and dykes, expansion of travel systems [394]. | Extreme rainfall events occurred more frequently in the northern areas, indicating the northern region is facing high risk of flooding [395]. | N/A | Experienced fast pace of urban development [396]. Densely populated. |
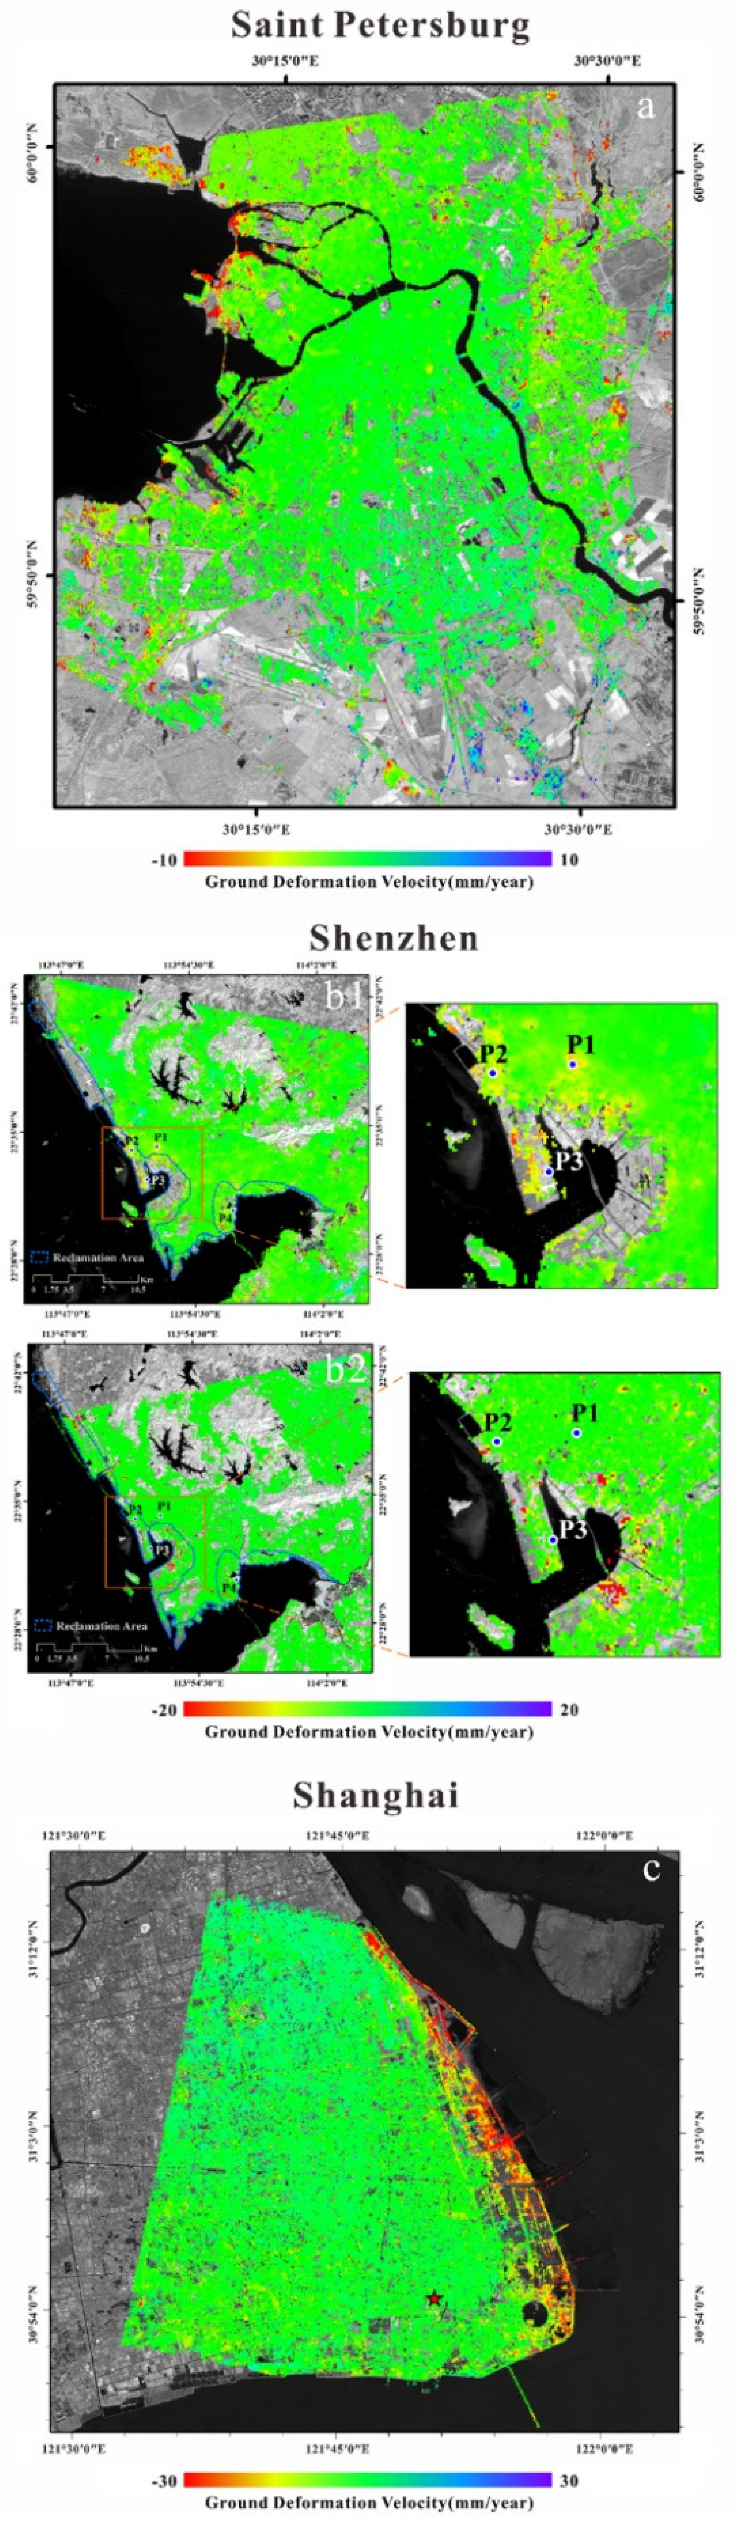
| Yangtze River Delta | Shanghai, a representative megacity situated in deltas, records the greatest ground subsidence in China. Ground subsidence has been also found in the other cities of the delta, including Suzhou, Wuxi, and Changzhou. Over-pumping groundwater and rapid urbanization are the major causes. | The delta is highly sensitive to increasing flood risk. The interaction of sea level rise, land subsidence, and storm surges may lead to more abrupt flood disasters. | The Yangtze River Delta is also facing erosion risk in the context of reduction of sediment load from upstream. | Intensive reclamation has caused degradation and loss of tidal wetland [397]. | The regional yearly extreme precipitation events cause floods [398]. | Yangtze River Delta is with the highest risk of storm surge [399]. | Fast urbanization and expansion. Densely populated. |
| Pearl River Delta | Three regional subsidence bowls has been detected by InSAR and multi-platform SAR imagery [400]. | Flood risks of the middle and lower delta were enhanced with analysis of the historical flood records [401]. | Anthropogenic activities like dredging, sand mining, and sediment disposal increase erosion risk. | Wetland loss has occurred due to rapid urbanization. | Extreme rainfall events increased at a significant pace in the most recent ten years. | Pearl River Delta is with the highest risk of storm surge [399]. | Fast urbanization. Densely populated. |
| Yellow River Delta | The average subsidence rate is −5 mm/y, while the highest subsidence rate of −33 mm/y. | Flood events occur frequently. | Increased coastal erosion due to reduced sediment load [253,402]. | Newly created wetland enlarges by 25 km2 each year [403]. | N/A | The coasts of Yellow River Delta are with the highest risk of storm surge [399]. | Intensive urbanization, oil industry. Densely populated. |
| Ganges-Brahmaputra-Meghna | The reported subsidence rates are variable: A mean of 5.6 mm/y, and median of 2.9 mm/y [258]. | Around 80% of the delta area is floodplain, with floods occurring every six years or so. | Erosion is mainly due to insufficient sediment supply and extreme events. | Large of mangrove areas have been converted into paddy fields and shrimp farms [404]. | Rainfall is dominated by the monsoon season. The delta is highly vulnerable to extreme rainfall events. | Storm surges are a major concern. | Urbanization rate is evident [405]. Highly populated. |
| Nile Delta | Ground subsidence is strongly localized at big cities. | The coastal areas are prone to be flooded. | Significant coast erosion has occurred. | Wetland were converted to agricultural lands [133]. | N/A | N/A | The urban extent has increased. Living more than 50% of the Egyptians. |
3.5. Remote Sensing Investigations of Large Rivers Deltas
3.5.1. The Yangtze River Delta
3.5.2. The Pearl River Delta
3.5.3. The Yellow River Delta
3.5.4. The Mekong Delta
3.5.5. The Ganges–Brahmaputra–Meghna Delta
3.5.6. The Po River Delta and the Venice Lagoon
3.5.7. Saint Petersburg
3.5.8. Nile Delta
3.5.9. Mississippi Delta
3.5.10. The Amazon River Delta
4. Discussion
5. Conclusions
Author Contributions
Funding
Institutional Review Board Statement
Informed Consent Statement
Acknowledgments
Conflicts of Interest
References
- Xu, Y.; Zhang, D.; Shen, S.; Chen, L. Geo-hazards with characteristics and prevention measures along the coastal regions of China. Nat. Hazards 2009, 49, 479–500. [Google Scholar] [CrossRef]
- Gogoberidze, G. Tools for comprehensive estimate of coastal region marine economy potential and its use for coastal planning. J. Coast. Conserv. 2012, 16, 251–260. [Google Scholar] [CrossRef]
- Fedorov, G.; Korneevets, V. Socioeconomic typology of Russia’s coastal regions. Balt. Reg. 2015, 4, 121–134. (In Russian) [Google Scholar] [CrossRef]
- Ayyam, V.; Palanivel, S.; Chandrakasan, S. Climate Change and Its Impact on the Coastal Region. In Coastal Ecosystems of the Tropics—Adaptive Management; Springer: Singapore, 2019; pp. 219–245. [Google Scholar]
- Janekovic, I.; Mihanovic, H.; Vilibic, I.; Tudor, M. Extreme cooling and dense water formation estimates in open and coastal regions of the Adriatic Sea during the winter of 2012. J. Geophys. Res.-Oceans 2014, 119, 3200–3218. [Google Scholar] [CrossRef]
- Barnard, P.L.; Short, A.D.; Harley, M.D.; Splinter, K.D.; Vitousek, S.; Turner, I.L.; Allan, J.; Banno, M.; Bryan, K.R.; Doria, A.; et al. Coastal vulnerability across the Pacific dominated by El Nino/Southern Oscillation. Nat. Geosci. 2015, 8, 801–807. [Google Scholar] [CrossRef]
- Rani, N.N.V.S.; Satyanarayana, A.N.V.; Bhaskaran, P.K. Coastal vulnerability assessment studies over India: A review. Nat. Hazards 2015, 77, 405–428. [Google Scholar] [CrossRef]
- Cid, A.; Menendez, M.; Castanedo, S.; Abascal, A.J.; Mendez, F.J.; Medina, R. Long-term changes in the frequency, intensity and duration of extreme storm surge events in southern Europe. Clim. Dyn. 2016, 46, 1503–1516. [Google Scholar] [CrossRef]
- Forzieri, G.; Feyen, L.; Russo, S.; Vousdoukas, M.; Alfieri, L.; Outten, S.; Migliavacca, M.; Bianchi, A.; Rojas, R.; Cid, A. Multi-hazard assessment in Europe under climate change. Clim. Chang. 2016, 137, 105–119. [Google Scholar] [CrossRef] [Green Version]
- Vitousek, S.; Barnard, P.L.; Fletcher, C.H.; Frazer, N.; Erikson, L.; Storlazzi, C.D. Doubling of coastal flooding frequency within decades due to sea-level rise. Sci. Rep. 2017, 7, 1399. [Google Scholar] [CrossRef]
- Vousdoukas, M.I.; Mentaschi, L.; Voukouvalas, E.; Verlaan, M.; Feyen, L. Extreme sea levels on the rise along Europe’s coasts. Earth’s Future 2017, 5, 304–323. [Google Scholar] [CrossRef]
- Nicholls, R.J.; Hoozemans, F.M.J.; Marchand, M. Increasing flood risk and wetland losses due to global sea-level rise: Regional and global analyses. Glob. Environ. Chang. 1999, 9, S69–S87. [Google Scholar] [CrossRef]
- Arendt, A.A.; Echelmeyer, K.A.; Harrison, W.D.; Lingle, C.S.; Valentine, V.B. Rapid wastage of Alaska glaciers and their contribution to rising sea level. Science 2002, 297, 382–386. [Google Scholar] [CrossRef] [PubMed] [Green Version]
- Lambeck, K.; Esat, T.M.; Potter, E.K. Links between climate and sea levels for the past three million years. Nature 2002, 419, 199–206. [Google Scholar] [CrossRef] [PubMed]
- Morris, J.T.; Sundareshwar, P.V.; Nietch, C.T.; Kjerfve, B.; Cahoon, D.R. Responses of coastal wetlands to rising sea level. Ecology 2002, 83, 2869–2877. [Google Scholar] [CrossRef]
- Lambeck, K.; Antonioli, F.; Purcell, A.; Silenzi, S. Sea-level change along the Italian coast for the past 10,000 yr. Quat. Sci. Rev. 2004, 23, 1567–1598. [Google Scholar] [CrossRef]
- Ericson, J.P.; Vorosmarty, C.J.; Dingman, S.L.; Ward, L.G.; Meybeck, M. Effective sea-level rise and deltas: Causes of change and human dimension implications. Glob. Planet. Chang. 2006, 50, 63–82. [Google Scholar] [CrossRef]
- Rahmstorf, S. A semi-empirical approach to projecting future sea-level rise. Science 2007, 315, 368–370. [Google Scholar] [CrossRef] [Green Version]
- Craft, C.; Clough, J.; Ehman, J.; Joye, S.; Park, R.; Pennings, S.; Guo, H.; Machmuller, M. Forecasting the effects of accelerated sea-level rise on tidal marsh ecosystem services. Front. Ecol. Environ. 2009, 7, 73–78. [Google Scholar] [CrossRef] [Green Version]
- Tol, R.S.J. The economic effects of climate change. J. Econ. Perspect. 2009, 23, 29–51. [Google Scholar] [CrossRef] [Green Version]
- Vermeer, M.; Rahmstorf, S. Global sea level linked to global temperature. Proc. Natl. Acad. Sci. USA 2009, 106, 21527–21532. [Google Scholar] [CrossRef] [Green Version]
- Nicholls, R.J.; Cazenave, A. Sea-Level rise and its impact on coastal zones. Science 2010, 328, 1517–1520. [Google Scholar] [CrossRef] [PubMed]
- Church, J.A.; White, N.J. Sea-Level rise from the late 19th to the early 21st century. Surv. Geophys. 2011, 32, 585–602. [Google Scholar] [CrossRef] [Green Version]
- Jacob, T.; Wahr, J.; Pfeffer, W.T.; Swenson, S. Recent contributions of glaciers and ice caps to sea level rise. Nature 2012, 482, 514–518. [Google Scholar] [CrossRef] [PubMed]
- Neumann, B.; Vafeidis, A.T.; Zimmermann, J.; Nicholls, R.J. Future coastal population growth and exposure to sea-level rise and coastal flooding—A global assessment. PLoS ONE 2015, 10, e0118571. [Google Scholar] [CrossRef] [Green Version]
- DeConto, R.M.; Pollard, D. Contribution of Antarctica to past and future sea-level rise. Nature 2016, 531, 591–597. [Google Scholar] [CrossRef]
- Jay, D.A. Evolution of tidal amplitudes in the eastern Pacific Ocean. Geophys. Res. Lett. 2009, 36, L04603. [Google Scholar] [CrossRef] [Green Version]
- Griffiths, S.D.; Hill, D.F. Tidal Modeling. In Handbook of Sea-Level Research; John Wiley & Sons: Hoboken, NJ, USA, 2015; pp. 438–451. [Google Scholar]
- Devlin, A.T.; Jay, D.A.; Zaron, E.D.; Talke, S.A.; Pan, J.; Lin, H. Tidal variability related to sea level variability in the Pacific Ocean. J. Geophys. Res.-Ocean. 2017, 122, 8445–8463. [Google Scholar] [CrossRef]
- Wei, X. On the evolution of global ocean tides. Geophys. Astrophys. Fluid Dyn. 2021, 115, 184–191. [Google Scholar] [CrossRef]
- Rouault, M.; White, S.A.; Reason, C.J.C.; Lutjeharms, J.R.E.; Jobard, I. Ocean-atmosphere interaction in the Agulhas Current region and a south African extreme weather event. Weather. Forecast. 2002, 17, 655–669. [Google Scholar] [CrossRef]
- Cayan, D.R.; Bromirski, P.D.; Hayhoe, K.; Tyree, M.; Dettinger, M.D.; Flick, R.E. Climate change projections of sea level extremes along the California coast. Clim. Chang. 2008, 87, 57–73. [Google Scholar] [CrossRef]
- Domingues, C.M.; Church, J.A.; White, N.J.; Gleckler, P.J.; Wijffels, S.E.; Barker, P.M.; Dunn, J.R. Improved estimates of upper-ocean warming and multi-decadal sea-level rise. Nature 2008, 453, 1090–1093. [Google Scholar] [CrossRef] [PubMed]
- Wang, S.; McGrath, R.; Hanafin, J.; Lynch, P.; Semmler, T.; Nolan, P. The impact of climate change on storm surges over Irish waters. Ocean Model. 2008, 25, 83–94. [Google Scholar] [CrossRef]
- Oke, P.R.; Griffin, D.A. The cold-core eddy and strong upwelling off the coast of New South Wales in early 2007. Deep. Sea Res. Part II Top. Stud. Oceanogr. 2011, 58, 574–591. [Google Scholar] [CrossRef]
- Bernardes, M.C.; Knoppers, B.A.; Rezende, C.E.; Souza, W.F.L.; Ovalle, A.R.C. Land-sea interface features of four estuaries on the South America Atlantic coast. Braz. J. Biol. 2012, 72, 761–774. [Google Scholar] [CrossRef] [PubMed] [Green Version]
- Fox-Kemper, B.; Hewitt, H.T.; Xiao, C.; Aðalgeirsdóttir, G.D.; Drijfhout, S.S.; Edwards, T.L.G.; Hemer, M.; Kopp, R.E.; Krinner, G.; Mix, A.; et al. Ocean, Cryosphere and Sea Level Change. In Proceedings of the Climate Change 2021: The Physical Science Basis, Contribution of Working Group I to the Sixth Assessment Report of the Intergovernmental Panel on Climate Chang., Geneva, Switzerland, 26 July–6 August 2021. [Google Scholar]
- Garner, G.G.; Hermans, T.; Kopp, R.E.; Slangen, A.B.A.; Edwards, T.L.; Levermann, A.; Nowikci, S.; Palmer, M.D.; Smith, C.; Fox-Kemper, B.; et al. IPCC AR6 Sea-Level Rise Projections. Version 20210809. PO.DAAC, CA, USA. Available online: https://podaac.jpl.nasa.gov/announcements/2021-08-09-Sea-level-projections-from-the-IPCC-6th-Assessment-Report (accessed on 1 December 2021).
- Cai, F.; Su, X.; Liu, J.; Li, B.; Lei, G. Coastal erosion in China under the condition of global climate change and measures for its prevention. Prog. Nat. Sci. 2009, 19, 415–426. [Google Scholar] [CrossRef]
- van Rijn, L.C. Coastal erosion and control. Ocean Coast. Manag. 2011, 54, 867–887. [Google Scholar] [CrossRef]
- Roebeling, P.C.; Costa, L.; Magalhaes-Filho, L.; Tekken, V. Ecosystem service value losses from coastal erosion in Europe: Historical trends and future projections. J. Coast. Conserv. 2013, 17, 389–395. [Google Scholar] [CrossRef]
- Macdonald, D.; Dixon, A.; Newell, A.; Hallaways, A. Groundwater flooding within an urbanised flood plain. J. Flood Risk Manag. 2012, 5, 68–80. [Google Scholar] [CrossRef] [Green Version]
- Kundzewicz, Z.W.; Pinskwar, I.; Brakenridge, G.R. Large floods in Europe, 1985–2009. Hydrol. Sci. J. 2013, 58, 1–7. [Google Scholar] [CrossRef]
- Kvocka, D.; Falconer, R.A.; Bray, M. Flood hazard assessment for extreme flood events. Nat. Hazards 2016, 84, 1569–1599. [Google Scholar] [CrossRef] [Green Version]
- Jabbar, M.T.; Chen, X. Land degradation due to salinization in arid and semi-arid regions with the aid of geo-information techniques. Geo-Spat. Inf. Sci. 2008, 11, 112–120. [Google Scholar] [CrossRef]
- Lv, Z.Z.; Liu, G.M.; Yang, J.S.; Zhang, M.M.; He, L.D.; Shao, H.B.; Yu, S.P. Spatial variability of soil salinity in Bohai Sea coastal wetlands, China: Partition into four management zones. Plant Biosyst. 2013, 147, 1201–1210. [Google Scholar] [CrossRef] [Green Version]
- Wu, J.; Li, P.; Qian, H.; Fang, Y. Assessment of soil salinization based on a low-cost method and its influencing factors in a semi-arid agricultural area, northwest China. Environ. Earth Sci. 2014, 71, 3465–3475. [Google Scholar] [CrossRef]
- Serran, J.N.; Creed, I.F.; Ameli, A.A.; Aldred, D.A. Estimating rates of wetland loss using power-law functions. Wetlands 2018, 38, 109–120. [Google Scholar] [CrossRef]
- Merrifield, M.A.; Merrifield, S.T.; Mitchum, G.T. An anomalous recent acceleration of global sea level rise. J. Clim. 2009, 22, 5772–5781. [Google Scholar] [CrossRef] [Green Version]
- Kopp, R.E.; Kemp, A.C.; Bittermann, K.; Horton, B.P.; Donnelly, J.P.; Gehrels, W.R.; Hay, C.C.; Mitrovica, J.X.; Morrow, E.D.; Rahmstorf, S. Temperature-driven global sea-level variability in the Common Era. Proc. Natl. Acad. Sci. USA 2016, 113, E1434–E1441. [Google Scholar] [CrossRef] [Green Version]
- Hak, D.; Nadaoka, K.; Patrick Bernado, L.; Le Phu, V.; Hong Quan, N.; Quang Toan, T.; Hieu Trung, N.; Van Ni, D.; Pham Dang Tri, V. Spatio-temporal variations of sea level around the Mekong Delta: Their causes and consequences on the coastal environment. Hydrol. Res. Lett. 2016, 10, 60–66. [Google Scholar] [CrossRef] [Green Version]
- Zhao, Q.; Pan, J.; Devlin, A.; Xu, Q.; Tang, M.; Li, Z.; Zamparelli, V.; Falabella, F.; Mastro, P.; Pepe, A. Integrated Analysis of the Combined Risk of Ground Subsidence, Sea Level Rise, and Natural Hazards in Coastal and Delta River Regions. Remote Sens. 2021, 13, 3431. [Google Scholar] [CrossRef]
- Ali, Z.; Barnard, I.; Fox, P.; Duggan, P.; Gray, R.; Allan, P.; Brand, A.; Ste-Mari, R. Description of RADARSAT-2 synthetic aperture radar design. Can. J. Remote Sens. 2004, 30, 246–257. [Google Scholar] [CrossRef]
- Li, D.; Shan, J.; Gong, J. Geospatial Technology for Earth Observation; Springer: New York, NY, USA, 2009. [Google Scholar]
- De Leeuw, J.; Georgiadou, Y.; Kerle, N.; de Gier, A.; Inoue, Y.; Ferwerda, J.; Smies, M.; Narantuya, D. The function of remote sensing in support of environmental policy. Remote Sens. 2010, 2, 1731–1750. [Google Scholar] [CrossRef] [Green Version]
- Guo, H. Understanding global natural disasters and the role of earth observation. Int. J. Digit. Earth 2010, 3, 221–230. [Google Scholar] [CrossRef] [Green Version]
- Li, D.; Tong, Q.; Li, R.; Gong, J.; Zhang, L. Current issues in high-resolution earth observation technology. Sci. China-Earth Sci. 2012, 55, 1043–1051. [Google Scholar] [CrossRef]
- Caltagirone, F.; Capuzi, A.; Coletta, A.; De Luca, G.F.; Scorzafava, E.; Leonardi, R.; Rivola, S.; Fagioli, S.; Angino, G.; L’Abbate, M.; et al. The COSMO-SkyMed dual use earth observation program: Development, qualification, and results of the commissioning of the overall constellation. IEEE J. Sel. Top. Appl. Earth Obs. Remote Sens. 2014, 7, 2754–2762. [Google Scholar] [CrossRef]
- Lulla, K.; Nellis, M.D.; Rundquist, B. Innovations in geospatial technologies: Cubesats for earth observations. Geocarto Int. 2014, 29, 821. [Google Scholar] [CrossRef]
- Guo, H.; Zhang, l.; Zhu, L. Earth observation big data for climate change research. Adv. Clim. Chang. Res. 2015, 6, 108–117. [Google Scholar] [CrossRef]
- Yang, F.; Han, Y.; Xuan, Y. Large-scale earth surface thermal radiative features in space observation. Opt. Commun. 2015, 348, 77–84. [Google Scholar] [CrossRef]
- Tomas, R.; Li, Z. Earth observations for geohazards: Present and future challenges. Remote Sens. 2017, 9, 194. [Google Scholar] [CrossRef] [Green Version]
- Peral, E.; Im, E.; Wye, L.; Lee, S.; Tanelli, S.; Rahmat-Samii, Y.; Horst, S.; Hoffman, J.; Yun, S.-H.; Imken, T.; et al. Radar technologies for earth remote sensing from cubesat platforms. Proc. IEEE 2018, 106, 404–418. [Google Scholar] [CrossRef]
- Leibrand, A.; Sadoff, N.; Maslak, T.; Thomas, A. Using earth observations to help developing countries improve access to reliable, sustainable, and modern energy. Front. Environ. Sci. 2019, 7, 123. [Google Scholar] [CrossRef] [Green Version]
- Dai, K.; Li, Z.; Xu, Q.; Burgmann, R.; Milledge, D.G.; Tomas, R.; Fan, X.; Zhao, C.; Liu, X.; Peng, J.; et al. Entering the era of earth observation-based landslide warning systems: A Novel and exciting framework. IEEE Geosci. Remote Sens. Mag. 2020, 8, 136–153. [Google Scholar] [CrossRef] [Green Version]
- Gomes, V.C.F.; Queiroz, G.R.; Ferreira, K.R. An overview of platforms for big earth observation data management and analysis. Remote Sens. 2020, 12, 1253. [Google Scholar] [CrossRef] [Green Version]
- Platnick, S.; King, M.D.; Ackerman, S.A.; Menzel, W.P.; Baum, B.A.; Riedi, J.C.; Frey, R.A. The MODIS cloud products: Algorithms and examples from Terra. IEEE Trans. Geosci. Remote Sens. 2003, 41, 459–473. [Google Scholar] [CrossRef] [Green Version]
- Ferguson, C.R.; Wood, E.F. Observed land-atmosphere coupling from satellite remote sensing and reanalysis. J. Hydrometeorol. 2011, 12, 1221–1254. [Google Scholar] [CrossRef]
- Kato, S.; Rose, F.G.; Sun-Mack, S.; Miller, W.F.; Chen, Y.; Rutan, D.A.; Stephens, G.L.; Loeb, N.G.; Minnis, P.; Wielicki, B.A.; et al. Improvements of top-of-atmosphere and surface irradiance computations with CALIPSO-, CloudSat-, and MODIS-derived cloud and aerosol properties. J. Geophys. Res. Atmos. 2011, 116. [Google Scholar] [CrossRef]
- Massonnet, D.; Feigl, K.L. Radar interferometry and its application to changes in the earth’s surface. Rev. Geophys. 1998, 36, 441–500. [Google Scholar] [CrossRef] [Green Version]
- Gudmundsson, S.; Sigmundsson, F.; Carstensen, J.M. Three-dimensional surface motion maps estimated from combined interferometric synthetic aperture radar and GPS data. J. Geophys. Res. Solid Earth 2002, 107, 2250. [Google Scholar] [CrossRef]
- Tralli, D.M.; Blom, R.G.; Zlotnicki, V.; Donnellan, A.; Evans, D.L. Satellite remote sensing of earthquake, volcano, flood, landslide and coastal inundation hazards. ISPRS-J. Photogramm. Remote Sens. 2005, 59, 185–198. [Google Scholar] [CrossRef]
- Tronin, A.A. Satellite remote sensing in seismology. A review. Remote Sens. 2010, 2, 124–150. [Google Scholar] [CrossRef] [Green Version]
- Geirsson, H.; LaFemina, P.; Arnadottir, T.; Sturkell, E.; Sigmundsson, F.; Travis, M.; Schmidt, P.; Lund, B.; Hreinsdottir, S.; Bennett, R. Volcano deformation at active plate boundaries: Deep magma accumulation at Hekla volcano and plate boundary deformation in south Iceland. J. Geophys. Res. Solid Earth 2012, 117, B11409. [Google Scholar] [CrossRef]
- Pinel, V.; Poland, M.P.; Hooper, A. Volcanology: Lessons learned from synthetic aperture radar imagery. J. Volcanol. Geotherm. Res. 2014, 289, 81–113. [Google Scholar] [CrossRef]
- Osmanoglu, B.; Sunar, F.; Wdowinski, S.; Cabral-Cano, E. Time series analysis of InSAR data: Methods and trends. ISPRS-J. Photogramm. Remote Sens. 2016, 115, 90–102. [Google Scholar] [CrossRef]
- Esaias, W.E.; Abbott, M.R.; Barton, I.; Brown, O.B.; Campbell, J.W.; Carder, K.L.; Clark, D.K.; Evans, R.H.; Hoge, F.E.; Gordon, H.R.; et al. An overview of MODIS capabilities for ocean science observations. IEEE Trans. Geosci. Remote Sens. 1998, 36, 1250–1265. [Google Scholar] [CrossRef] [Green Version]
- Font, J.; Camps, A.; Borges, A.; Martín-Neira, M.; Boutin, J.; Reul, N.; Kerr, Y.H.; Hahne, A.; Mecklenburg, S. SMOS: The challenging sea surface salinity measurement from space. Proc. IEEE 2009, 98, 649–665. [Google Scholar] [CrossRef] [Green Version]
- Tyler, A.N.; Hunter, P.D.; Spyrakos, E.; Groom, S.; Constantinescu, A.M.; Kitchen, J. Developments in earth observation for the assessment and monitoring of inland, transitional, coastal and shelf-sea waters. Sci. Total Environ. 2016, 572, 1307–1321. [Google Scholar] [CrossRef] [Green Version]
- Straub, D.W.; Welke, R.J. Coping with systems risk: Security planning models for management decision making. MIS Q. 1998, 22, 441–469. [Google Scholar] [CrossRef]
- Comfort, L.K. Risk, security, and disaster management. Annu. Rev. Political Sci. 2005, 8, 335–356. [Google Scholar] [CrossRef] [Green Version]
- Liliana Carreno, M.; Dario Cardona, O.; Barbat, A.H. A disaster risk management performance index. Nat. Hazards 2007, 41, 1–20. [Google Scholar] [CrossRef]
- Voigt, S.; Kemper, T.; Riedlinger, T.; Kiefl, R.; Scholte, K.; Mehl, H. Satellite image analysis for disaster and crisis-management support. IEEE Trans. Geosci. Remote Sens. 2007, 45, 1520–1528. [Google Scholar] [CrossRef]
- Manuj, I.; Mentzer, J.T. Global supply chain risk management strategies. Int. J. Phys. Distrib. Logist. Manag. 2008, 38, 192–223. [Google Scholar] [CrossRef] [Green Version]
- Birkmann, J.; von Teichman, K. Integrating disaster risk reduction and climate change adaptation: Key challenges-scales, knowledge, and norms. Sustain. Sci. 2010, 5, 171–184. [Google Scholar] [CrossRef]
- Kaplan, S.; Garrick, B.J. On the quantitative definition of risk. Risk Anal. 1981, 1, 11–27. [Google Scholar] [CrossRef]
- Alexander, D. From civil defence to civil protection—And back again. Disaster Prev. Manag. 2002, 11, 209–213. [Google Scholar] [CrossRef]
- Haddow, G.D.; Bullock, J.A. Introduction to Emergency Management; Butterworth-Heinemann: Oxford, UK, 2003. [Google Scholar]
- Coppola, D.P. Introduction to International Disaster Management; Elsevier: Amsterdam, The Netherlands, 2006. [Google Scholar]
- Manfre, L.A.; Hirata, E.; Silva, J.B.; Shinohara, E.J.; Giannotti, M.A.; Larocca, A.P.C.; Quintanilha, J.A. An analysis of geospatial technologies for risk and natural disaster management. ISPRS Int. J. Geo-Inf. 2012, 1, 166–185. [Google Scholar] [CrossRef]
- Gill, J.C.; Malamud, B.D. Hazard interactions and interaction networks (cascades) within multi-hazard methodologies. Earth Syst. Dyn. 2016, 7, 659–679. [Google Scholar] [CrossRef] [Green Version]
- Molina, M.; Bayarri, S. A multinational SDI-based system to facilitate disaster risk management in the Andean Community. Comput. Geosci. 2011, 37, 1501–1510. [Google Scholar] [CrossRef] [Green Version]
- Garcia, J.A.; Istomin, E.P.; Slesarev, L.S.; Pena, J.A. Spatial Data Infrastructure for the Management and Risk Assessment of Natural Disasters. In Proceedings of the 6th International Conference on Remote Sensing and Geoinformation of the Environment (RSCy), Paphos, Cyprus, 26–29 March 2018. [Google Scholar]
- Higgins, S.A. Review: Advances in delta-subsidence research using satellite methods. Hydrogeol. J. 2016, 24, 587–600. [Google Scholar] [CrossRef]
- Metternicht, G.; Hurni, L.; Gogu, R. Remote sensing of landslides: An analysis of the potential contribution to geo-spatial systems for hazard assessment in mountainous environments. Remote Sens. Environ. 2005, 98, 284–303. [Google Scholar] [CrossRef]
- Hong, Y.; Adler, R.F.; Huffman, G. An experimental global prediction system for rainfall-triggered landslides using satellite remote sensing and geospatial datasets. IEEE Trans. Geosci. Remote Sens. 2007, 45, 1671–1680. [Google Scholar] [CrossRef]
- Myint, S.W.; Yuan, M.; Cerveny, R.S.; Giri, C. Categorizing natural disaster damage assessment using satellite-based geospatial techniques. Nat. Hazards Earth Syst. Sci. 2008, 8, 707–719. [Google Scholar] [CrossRef] [Green Version]
- Khan, S.I.; Hong, Y.; Wang, J.; Yilmaz, K.K.; Gourley, J.J.; Adler, R.F.; Brakenridge, G.R.; Policelli, F.; Habib, S.; Irwin, D. Satellite remote sensing and hydrologic modeling for flood inundation mapping in Lake Victoria Basin: Implications for hydrologic prediction in Ungauged Basins. IEEE Trans. Geosci. Remote Sens. 2011, 49, 85–95. [Google Scholar] [CrossRef] [Green Version]
- Drusch, M.; Del Bello, U.; Carlier, S.; Colin, O.; Fernandez, V.; Gascon, F.; Hoersch, B.; Isola, C.; Laberinti, P.; Martimort, P.; et al. Sentinel-2: ESA’s optical high-resolution mission for GMES operational services. Remote Sens. Environ. 2012, 120, 25–36. [Google Scholar] [CrossRef]
- Torres, R.; Snoeij, P.; Geudtner, D.; Bibby, D.; Davidson, M.; Attema, E.; Potin, P.; Rommen, B.; Floury, N.; Brown, M.; et al. GMES Sentinel-1 mission. Remote Sens. Environ. 2012, 120, 9–24. [Google Scholar] [CrossRef]
- Novellino, A.; Jordan, C.; Ager, G.; Bateson, L.; Fleming, C.; Confuorto, P. Remote sensing for natural or man-made disasters and environmental changes. In Geological Disaster Monitoring Based on Sensor Networks; Springer: Singapore, 2019; pp. 23–31. [Google Scholar]
- Zhu, Z.; Woodcock, C.E. Continuous change detection and classification of land cover using all available Landsat data. Remote Sens. Environ. 2014, 144, 152–171. [Google Scholar] [CrossRef] [Green Version]
- Zhu, Z. Change detection using landsat time series: A review of frequencies, preprocessing, algorithms, and applications. ISPRS-J. Photogramm. Remote Sens. 2017, 130, 370–384. [Google Scholar] [CrossRef]
- Gao, F.; Hilker, T.; Zhu, X.; Anderson, M.C.; Masek, J.G.; Wang, P.; Yang, Y. Fusing Landsat and MODIS data for vegetation monitoring. IEEE Geosci. Remote Sens. Mag. 2015, 3, 47–60. [Google Scholar] [CrossRef]
- Loveland, T.R.; Irons, J.R. Landsat 8: The plans, the reality, and the legacy. Remote Sens. Environ. 2016, 185, 1–6. [Google Scholar] [CrossRef] [Green Version]
- Li, J.; Roy, D.P. A global analysis of Sentinel-2A, Sentinel-2B and Landsat-8 data revisit intervals and implications for terrestrial monitoring. Remote Sens. 2017, 9, 902. [Google Scholar] [CrossRef] [Green Version]
- Wulder, M.A.; Hilker, T.; White, J.C.; Coops, N.C.; Masek, J.G.; Pflugmacher, D.; Crevier, Y. Virtual constellations for global terrestrial monitoring. Remote Sens. Environ. 2015, 170, 62–76. [Google Scholar] [CrossRef] [Green Version]
- Franceschetti, G.; Lanari, R. Synthetic Aperture Radar Processing; CRC Press: Boca Raton, FL, USA, 1999. [Google Scholar]
- Ferretti, A.; Fumagalli, A.; Novali, F.; Prati, C.; Rocca, F.; Rucci, A. A new algorithm for processing interferometric data-stacks: SqueeSAR. IEEE Trans. Geosci. Remote Sens. 2011, 49, 3460–3470. [Google Scholar] [CrossRef]
- Berardino, P.; Fornaro, G.; Lanari, R.; Sansosti, E. A new algorithm for surface deformation monitoring based on small baseline differential SAR interferograms. IEEE Trans. Geosci. Remote Sens. 2002, 40, 2375–2383. [Google Scholar] [CrossRef] [Green Version]
- Mora, O.; Mallorqui, J.J.; Broquetas, A. Linear and nonlinear terrain deformation maps from a reduced set of interferometric SAR images. IEEE Trans. Geosci. Remote Sens. 2003, 41, 2243–2253. [Google Scholar] [CrossRef]
- Shanker, P.; Zebker, H. Persistent scatterer selection using maximum likelihood estimation. Geophys. Res. Lett. 2007, 34, L22301. [Google Scholar] [CrossRef]
- Hooper, A. A multi-temporal InSAR method incorporating both persistent scatterer and small baseline approaches. Geophys. Res. Lett. 2008, 35, L16302. [Google Scholar] [CrossRef] [Green Version]
- Adam, N.; Rodriguez Gonzalez, F.; Parizzi, A.; Liebhart, W. Wide Area Persistent Scatterer Interferometry. In Proceedings of the IGARSS 2011—2011 IEEE International Geoscience and Remote Sensing Symposium, Vancouver, BC, Canada, 24–29 July 2011; pp. 1481–1484. [Google Scholar]
- Hetland, E.A.; Muse, P.; Simons, M.; Lin, Y.N.; Agram, P.S.; DiCaprio, C.J. Multiscale InSAR Time Series (MInTS) analysis of surface deformation. J. Geophys. Res. Solid Earth 2012, 117, B02404. [Google Scholar] [CrossRef] [Green Version]
- Crosetto, M.; Monserrat, O.; Cuevas-Gonzalez, M.; Devanthery, N.; Crippa, B. Persistent scatterer interferometry: A review. ISPRS-J. Photogramm. Remote Sens. 2016, 115, 78–89. [Google Scholar] [CrossRef] [Green Version]
- Dong, J.; Zhang, L.; Tang, M.; Liao, M.; Xu, Q.; Gong, J.; Ao, M. Mapping landslide surface displacements with time series SAR interferometry by combining persistent and distributed scatterers: A case study of Jiaju landslide in Danba, China. Remote Sens. Environ. 2018, 205, 180–198. [Google Scholar] [CrossRef]
- Even, M.; Schulz, K. InSAR deformation analysis with distributed scatterers: A review complemented by new advances. Remote Sens. 2018, 10, 744. [Google Scholar] [CrossRef] [Green Version]
- Falabella, F.; Serio, C.; Zeni, G.; Pepe, A. On the use of weighted least-squares approaches for differential Interfirometric SAR analyses: The weighted adaptive variable-iength (WAVE) technique. Sensors 2020, 20, 1103. [Google Scholar] [CrossRef] [Green Version]
- Chapron, B.; Collard, F.; Ardhuin, F. Direct measurements of ocean surface velocity from space: Interpretation and validation. J. Geophys. Res. Oceans 2005, 110, C07008. [Google Scholar] [CrossRef]
- Pierdicca, N.; Pulvirenti, L.; Chini, M. Dealing with flood mapping using SAR data in the presence of wind or heavy precipitation. SPIE Remote Sens. 2013, 8891, 88910K. [Google Scholar] [CrossRef]
- Danklmayer, A.; Chandra, M. Precipitation induced signatures in SAR images. In Proceedings of the 2009 3rd European Conference on Antennas and Propagation EuCAP, Berlin, Germany, 23–27 March 2009; pp. 3433–3437. [Google Scholar]
- Klees, R.; Massonnet, D. Deformation measurements using SAR interferometry: Potential and limitations. Geol. En Mijnb. 1998, 77, 161–176. [Google Scholar] [CrossRef]
- Just, D.; Bamler, R. Phase statistics of interferograms with applications to synthetic aperture radar. Appl. Optics 1994, 33, 4361–4368. [Google Scholar] [CrossRef]
- Lee, H.; Liu, J.G. Analysis of topographic decorrelation in SAR interferometry using ratio coherence imagery. IEEE Trans. Geosci. Remote Sens. 2001, 39, 223–232. [Google Scholar] [CrossRef]
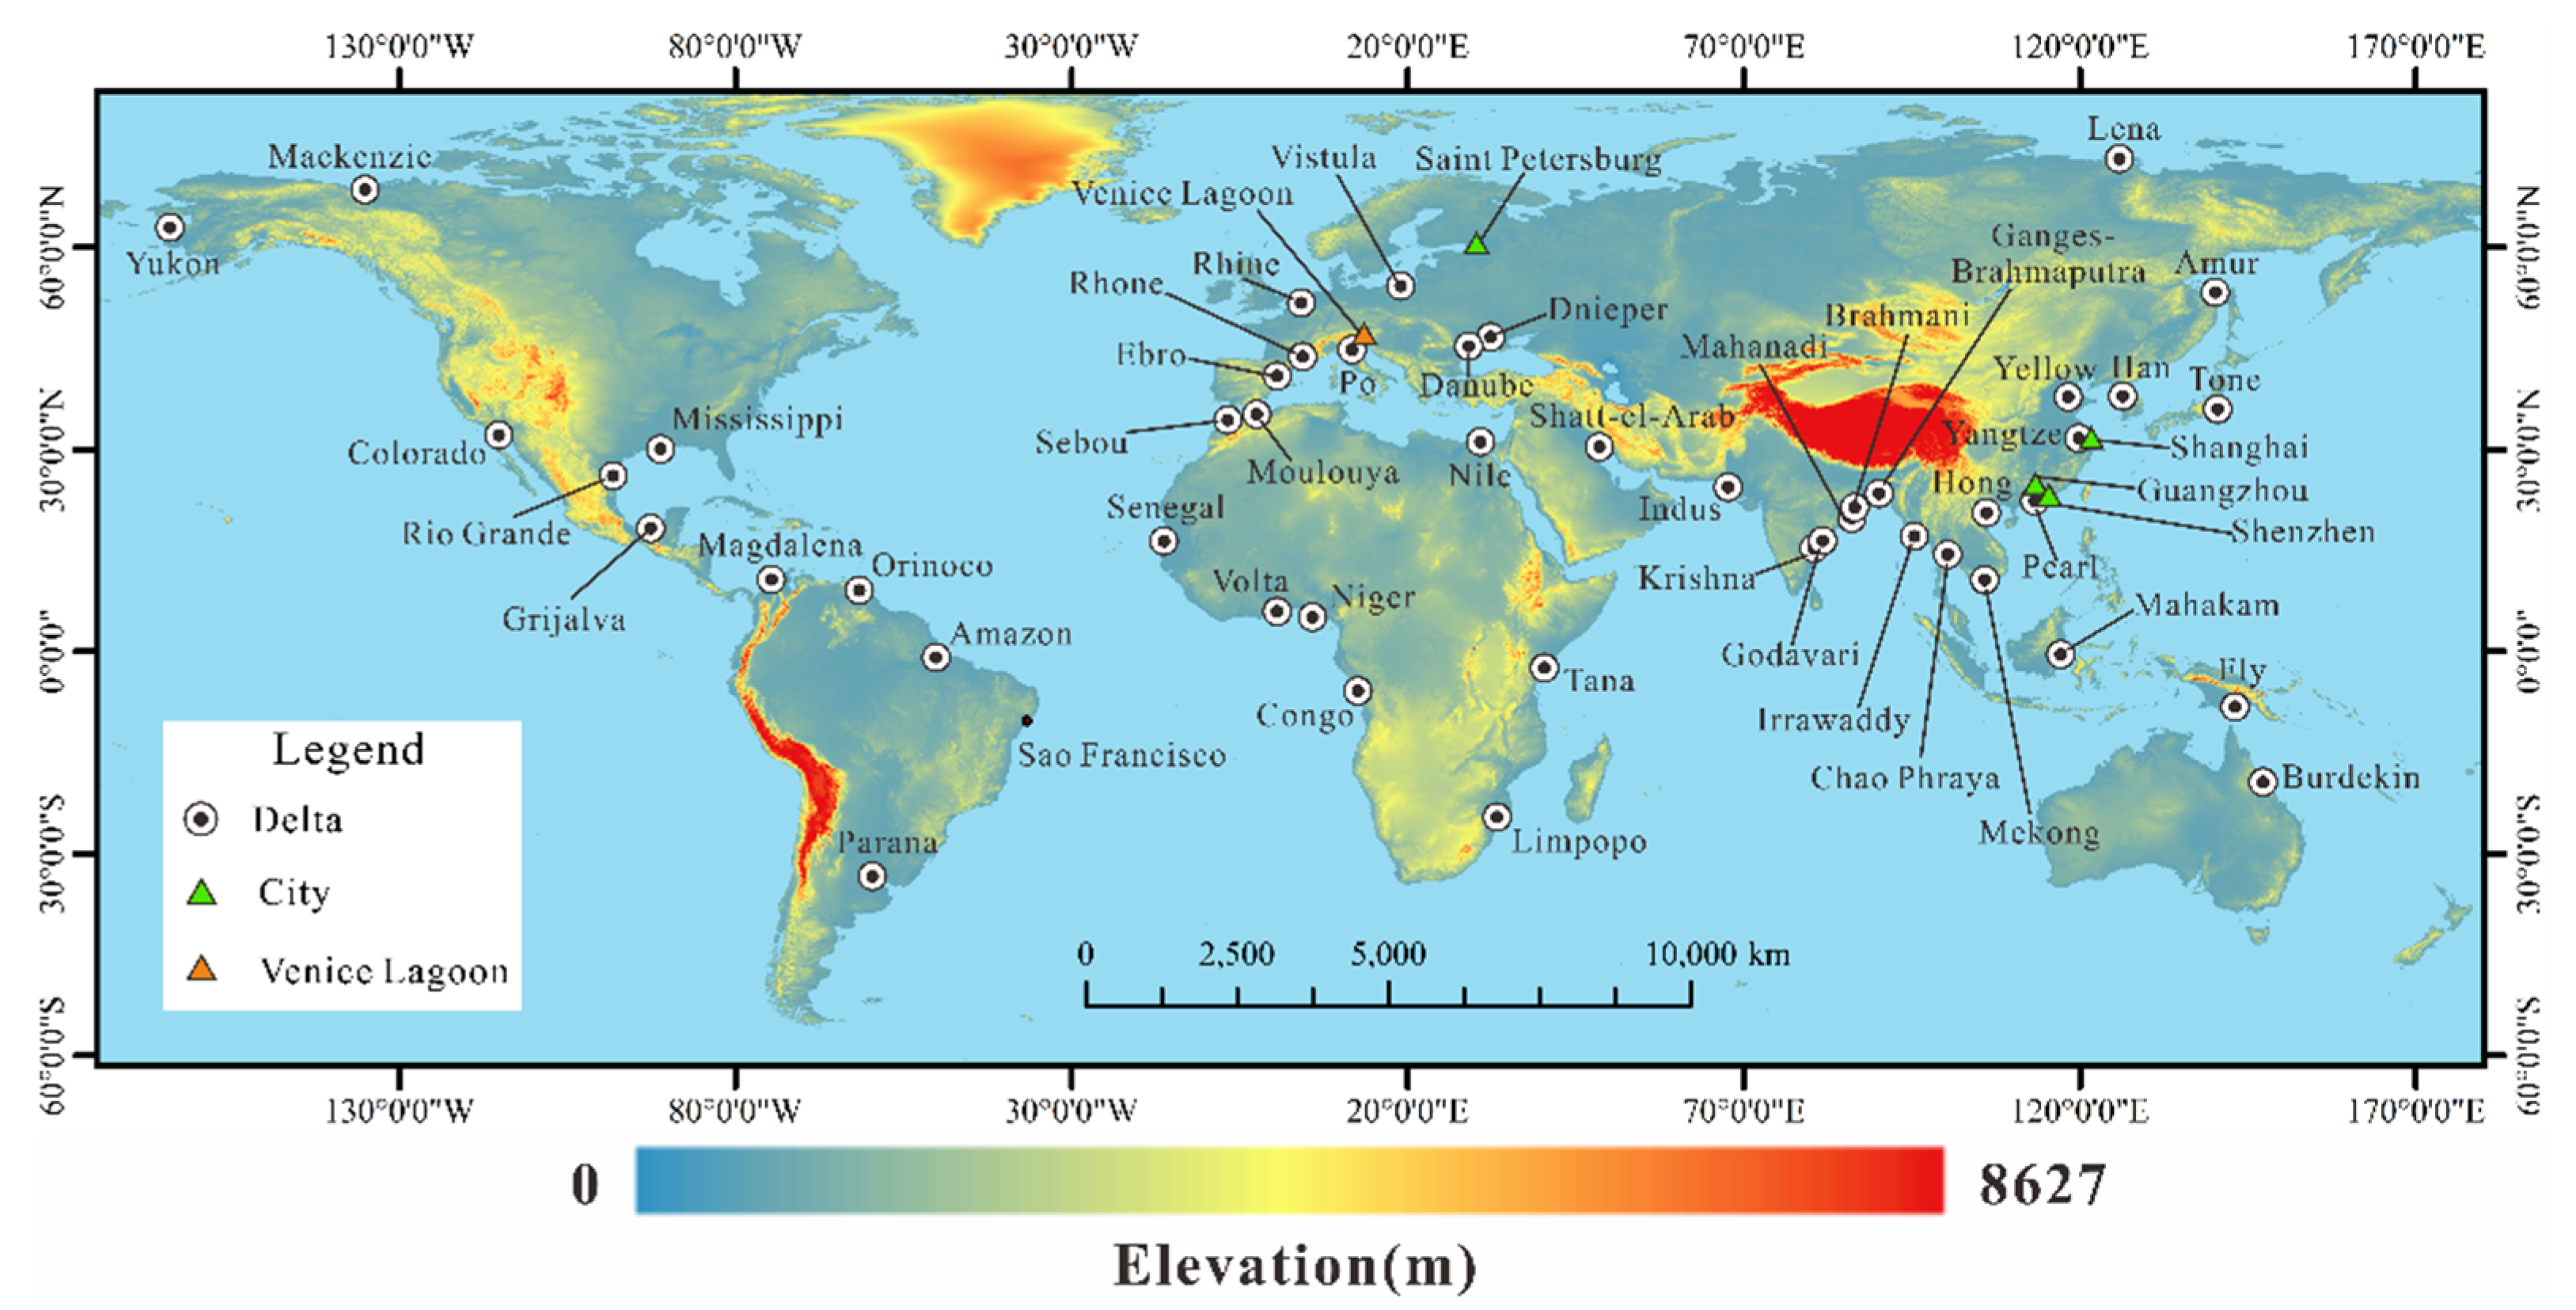
- Tessler, Z.D.; Voeroesmarty, C.J.; Grossberg, M.; Gladkova, I.; Aizenman, H.; Syvitski, J.P.M.; Foufoula-Georgiou, E. Profiling risk and sustainability in coastal deltas of the world. Science 2015, 349, 638–643. [Google Scholar] [CrossRef] [Green Version]
- GEBCO. The GEBCO_2020 Grid—A Continuous Terrain Model of the Global Oceans and Land; British Oceanographic Data Centre, National Oceanography Centre: Liverpool, UK, 2020. [Google Scholar] [CrossRef]
- Zhang, T.; Yang, X.; Hu, S.; Su, F. Extraction of coastline in aquaculture coast from multispectral remote sensing images: Object-Based region growing integrating edge detection. Remote Sens. 2013, 5, 4470–4487. [Google Scholar] [CrossRef] [Green Version]
- Garcia-Rubio, G.; Huntley, D.; Russell, P. Evaluating shoreline identification using optical satellite images. Mar. Geol. 2015, 359, 96–105. [Google Scholar] [CrossRef] [Green Version]
- Pardo-Pascual, J.E.; Sanchez-Garcia, E.; Almonacid-Caballer, J.; Palomar-Vazquez, J.M.; Priego de los Santos, E.; Fernandez-Sarria, A.; Balaguer-Beser, A. Assessing the accuracy of automatically extracted shorelines on microtidal beaches from Landsat 7, Landsat 8 and Sentinel-2 imagery. Remote Sens. 2018, 10, 326. [Google Scholar] [CrossRef] [Green Version]
- Besset, M.; Anthony, E.J.; Bouchette, F. Multi-decadal variations in delta shorelines and their relationship to river sediment supply: An assessment and review. Earth-Sci. Rev. 2019, 193, 199–219. [Google Scholar] [CrossRef] [Green Version]
- Toure, S.; Diop, O.; Kpalma, K.; Maiga, A.S. Shoreline detection using ooptical remote sensing: A review. ISPRS Int. J. Geo-Inf. 2019, 8, 75. [Google Scholar] [CrossRef] [Green Version]
- El-Asmar, H.M.; Hereher, M.E. Change detection of the coastal zone east of the Nile Delta using remote sensing. Environ. Earth Sci. 2011, 62, 769–777. [Google Scholar] [CrossRef]
- Pacheco, A.; Horta, J.; Loureiro, C.; Ferreira, O. Retrieval of nearshore bathymetry from Landsat 8 images: A tool for coastal monitoring in shallow waters. Remote Sens. Environ. 2015, 159, 102–116. [Google Scholar] [CrossRef] [Green Version]
- Sun, N.; Zhu, W.; Cheng, Q. GF-1 and Landsat observed a 40-year wetland spatiotemporal variation and its coupled environmental factors in Yangtze River estuary. Estuar. Coast. Shelf Sci. 2018, 207, 30–39. [Google Scholar] [CrossRef]
- Jiao, L.; Sun, W.; Yang, G.; Ren, G.; Liu, Y. A hierarchical classification framework of satellite multispectral/hyperspectral images for mapping coastal wetlands. Remote Sens. 2019, 11, 2238. [Google Scholar] [CrossRef] [Green Version]
- Hereher, M.E. Mapping coastal erosion at the Nile Delta western promontory using Landsat imagery. Environ. Earth Sci. 2011, 64, 1117–1125. [Google Scholar] [CrossRef]
- Kuenzer, C.; Heimhuber, V.; Huth, J.; Dech, S. Remote Sensing for the Quantification of Land Surface Dynamics in Large River Delta Regions-A Review. Remote Sens. 2019, 11, 1985. [Google Scholar] [CrossRef] [Green Version]
- Seto, K.C.; Woodcock, C.; Song, C.; Huang, X.; Lu, J.; Kaufmann, R. Monitoring land-use change in the Pearl River Delta using Landsat TM. Int. J. Remote Sens. 2002, 23, 1985–2004. [Google Scholar] [CrossRef]
- Gao, F.; De Colstoun, E.B.; Ma, R.; Weng, Q.; Masek, J.G.; Chen, J.; Pan, Y.; Song, C. Mapping impervious surface expansion using medium-resolution satellite image time series: A case study in the Yangtze River Delta, China. Int. J. Remote Sens. 2012, 33, 7609–7628. [Google Scholar] [CrossRef]
- Xian, G.; Homer, C.; Bunde, B.; Danielson, P.; Dewitz, J.; Fry, J.; Pu, R. Quantifying urban land cover change between 2001 and 2006 in the Gulf of Mexico region. Geocarto Int. 2012, 27, 479–497. [Google Scholar] [CrossRef]
- Ottinger, M.; Kuenzer, C.; Liu, G.; Wang, S.; Dech, S. Monitoring land cover dynamics in the Yellow River Delta from 1995 to 2010 based on Landsat 5 TM. Appl. Geogr. 2013, 44, 53–68. [Google Scholar] [CrossRef]
- Sica, Y.V.; Quintana, R.D.; Radeloff, V.C.; Gavier-Pizarro, G.I. Wetland loss due to land use change in the Lower Parana River Delta, Argentina. Sci. Total Environ. 2016, 568, 967–978. [Google Scholar] [CrossRef]
- Zhang, L.; Weng, Q. Annual dynamics of impervious surface in the Pearl River Delta, China, from 1988 to 2013, using time series Landsat imagery. ISPRS-J. Photogramm. Remote Sens. 2016, 113, 86–96. [Google Scholar] [CrossRef]
- Haas, J.; Ban, Y. Urban growth and environmental impacts in Jing-Jin-Ji, the Yangtze, River Delta and the Pearl River Delta. Int. J. Appl. Earth Obs. Geoinf. 2014, 30, 42–55. [Google Scholar] [CrossRef]
- Liu, S.; Li, X.; Chen, D.; Duan, Y.; Ji, H.; Zhang, L.; Chai, Q.; Hu, X. Understanding Land use/Land cover dynamics and impacts of human activities in the Mekong Delta over the last 40 years. Glob. Ecol. Conserv. 2020, 22, e00991. [Google Scholar] [CrossRef]
- Vidal, A.; Rocio Moreno, M. Change detection of isolated housing using a new hybrid approach based on object classification with optical and TerraSAR-X data. Int. J. Remote Sens. 2011, 32, 9621–9635. [Google Scholar] [CrossRef] [Green Version]
- Brisco, B.; Schmitt, A.; Murnaghan, K.; Kaya, S.; Roth, A. SAR polarimetric change detection for flooded vegetation. Int. J. Digit. Earth 2013, 6, 103–114. [Google Scholar] [CrossRef]
- Ulaby, F.T.; Long, D.G. Microwave Radar and Radiometric Remote Sensing; The University of Michigan Press: Ann Arbor, MI, USA, 2014. [Google Scholar]
- Lavalle, M.; Simard, M.; Hensley, S. A temporal decorrelation model for polarimetric radar interferometers. IEEE Trans. Geosci. Remote Sens. 2012, 50, 2880–2888. [Google Scholar] [CrossRef]
- Bouaraba, A.; Younsi, A.; Belhadj-Aissa, A.; Acheroy, M.; Milisavljevic, N.; Closson, D. Robust techniques for coherent change detection using COSMO-SkyMed SAR images. Prog. Electromagn. Res. M 2012, 22, 219–232. [Google Scholar] [CrossRef] [Green Version]
- Zebker, H.A.; Villasenor, J. Decorrelation in interferometric radar echoes. IEEE Trans. Geosci. Remote Sens. 1992, 30, 950–959. [Google Scholar] [CrossRef] [Green Version]
- Shinozuka, M.; Ghanem, R.; Houshmand, B.; Mansouri, B. Damage detection in urban areas by SAR imagery. J. Eng. Mech. 2000, 126, 769–777. [Google Scholar] [CrossRef]
- Sabry, R. A new coherency formalism for change detection and phenomenology in SAR imagery: A field approach. IEEE Geosci. Remote Sens. Lett. 2009, 6, 458–462. [Google Scholar] [CrossRef]
- Carotenuto, V.; De Maio, A.; Clemente, C.; Soraghan, J.J. Invariant rules for multipolarization SAR change detection. IEEE Trans. Geosci. Remote Sens. 2015, 53, 3294–3311. [Google Scholar] [CrossRef] [Green Version]
- Cha, M.; Phillips, R.D.; Wolfe, P.J.; Richmond, C.D. Two-Stage change detection for synthetic aperture radar. IEEE Trans. Geosci. Remote Sens. 2015, 53, 6547–6560. [Google Scholar] [CrossRef] [Green Version]
- Zhang, Q.; Antoniou, M.; Chang, W.; Cherniakov, M. Spatial decorrelation in GNSS-based SAR coherent change detection. IEEE Trans. Geosci. Remote Sens. 2015, 53, 219–228. [Google Scholar] [CrossRef]
- Ciuonzo, D.; Carotenuto, V.; De Maio, A. On multiple covariance equality testing with application to SAR change detection. IEEE Trans. Signal Process. 2017, 65, 5078–5091. [Google Scholar] [CrossRef]
- Mahdavi, S.; Salehi, B.; Granger, J.; Amani, M.; Brisco, B.; Huang, W. Remote sensing for wetland classification: A comprehensive review. GISci. Remote Sens. 2018, 55, 623–658. [Google Scholar] [CrossRef]
- Ozesmi, S.L.; Bauer, M.E. Satellite remote sensing of wetlands. Wetl. Ecol. Manag. 2002, 10, 381–402. [Google Scholar] [CrossRef]
- Ryu, J.-H.; Kim, C.-H.; Lee, Y.-K.; Won, J.-S.; Chun, S.-S.; Lee, S. Detecting the intertidal morphologic change using satellite data. Estuar. Coast. Shelf Sci. 2008, 78, 623–632. [Google Scholar] [CrossRef]
- Li, X.; Damen, M.C.J. Coastline change detection with satellite remote sensing for environmental management of the Pearl River Estuary, China. J. Mar. Syst. 2010, 82, S54–S61. [Google Scholar] [CrossRef]
- Kuenzer, C.; Ottinger, M.; Liu, G.; Sun, B.; Baumhauer, R.; Dech, S. Earth observation-based coastal zone monitoring of the Yellow River Delta: Dynamics in China’s second largest oil producing region over four decades. Appl. Geogr. 2014, 55, 92–107. [Google Scholar] [CrossRef]
- Li, X.; Zhou, Y.; Zhang, L.; Kuang, R. Shoreline change of Chongming Dongtan and response to river sediment load: A remote sensing assessment. J. Hydrol. 2014, 511, 432–442. [Google Scholar] [CrossRef]
- Ghosh, M.K.; Kumar, L.; Roy, C. Monitoring the coastline change of Hatiya Island in Bangladesh using remote sensing techniques. ISPRS-J. Photogramm. Remote Sens. 2015, 101, 137–144. [Google Scholar] [CrossRef]
- Jong-sen, L.; Jurkevich, I. Coastline detection and tracing in SAR images. IEEE Trans. Geosci. Remote Sens. 1990, 28, 662–668. [Google Scholar] [CrossRef] [Green Version]
- Boak, E.H.; Turner, I.L. Shoreline definition and detection: A review. J. Coast. Res. 2005, 21, 688–703. [Google Scholar] [CrossRef] [Green Version]
- Liu, H.; Jezek, K.C. Automated extraction of coastline from satellite imagery by integrating Canny edge detection and locally adaptive thresholding methods. Int. J. Remote Sens. 2004, 25, 937–958. [Google Scholar] [CrossRef]
- Pardo-Pascual, J.E.; Almonacid-Caballer, J.; Ruiz, L.A.; Palomar-Vazquez, J. Automatic extraction of shorelines from Landsat TM and ETM+ multi-temporal images with subpixel precision. Remote Sens. Environ. 2012, 123, 1–11. [Google Scholar] [CrossRef] [Green Version]
- Li, R.; Liu, W.; Yang, L.; Sun, S.; Hu, W.; Zhang, F.; Li, W. DeepUNet: A deep fully convolutional network for pixel-level sea-land segmentation. IEEE J. Sel. Top. Appl. Earth Obs. Remote Sens. 2018, 11, 3954–3962. [Google Scholar] [CrossRef] [Green Version]
- Bishop-Taylor, R.; Sagar, S.; Lymburner, L.; Alam, I.; Sixsmith, J. Sub-Pixel waterline extraction: Characterising accuracy and sensitivity to Indices and spectra. Remote Sens. 2019, 11, 2984. [Google Scholar] [CrossRef] [Green Version]
- Chen, C.; Fu, J.; Zhang, S.; Zhao, X. Coastline information extraction based on the tasseled cap transformation of Landsat-8 OLI images. Estuar. Coast. Shelf Sci. 2019, 217, 281–291. [Google Scholar] [CrossRef]
- Sanchez-Garcia, E.; Balaguer-Beser, A.; Almonacid-Caballer, J.; Eliseu Pardo-Pascual, J. A new adaptive image interpolation method to define the shoreline at sub-pixel level. Remote Sens. 2019, 11, 1880. [Google Scholar] [CrossRef] [Green Version]
- Viana-Borja, S.P.; Ortega-Sanchez, M. Automatic methodology to detect the coastline from Landsat Images with a new water index assessed on three different Spanish Mediterranean Deltas. Remote Sens. 2019, 11, 2186. [Google Scholar] [CrossRef] [Green Version]
- Li, W.; Gong, P. Continuous monitoring of coastline dynamics in western Florida with a 30-year time series of Landsat imagery. Remote Sens. Environ. 2016, 179, 196–209. [Google Scholar] [CrossRef]
- Wang, K. Evolution of Yellow River Delta coastline based on remote sensing from 1976 to 2014, China. Chin. Geogr. Sci. 2019, 29, 181–191. [Google Scholar] [CrossRef] [Green Version]
- Di, K.; Wang, J.; Ma, R.; Li, R. Automatic shoreline extraction from high-resolution IKONOS satellite imagery. In Proceedings of the ASPRS 2003 Annual Conference, Anchorage, AK, USA, 5–9 May 2003. [Google Scholar]
- Sekovski, I.; Stecchi, F.; Mancini, F.; Del Rio, L. Image classification methods applied to shoreline extraction on very high-resolution multispectral imagery. Int. J. Remote Sens. 2014, 35, 3556–3578. [Google Scholar] [CrossRef]
- Dai, C.; Howat, I.M.; Larour, E.; Husby, E. Coastline extraction from repeat high resolution satellite imagery. Remote Sens. Environ. 2019, 229, 260–270. [Google Scholar] [CrossRef]
- Dellepiane, S.; De Laurentiis, R.; Giordano, F. Coastline extraction from SAR images and a method for the evaluation of the coastline precision. Pattern Recognit. Lett. 2004, 25, 1461–1470. [Google Scholar] [CrossRef]
- Morton, R.A.; Bernier, J.C.; Barras, J.A. Evidence of regional subsidence and associated interior wetland loss induced by hydrocarbon production, Gulf Coast region, USA. Environ. Geol. 2006, 50, 261–274. [Google Scholar] [CrossRef]
- Perissin, D.; Wang, Z.; Lin, H. Shanghai subway tunnels and highways monitoring through Cosmo-SkyMed Persistent Scatterers. ISPRS-J. Photogramm. Remote Sens. 2012, 73, 58–67. [Google Scholar] [CrossRef]
- Kim, S.W.; Lee, C.W.; Song, K.Y.; Min, K.D.; Won, J.S. Application of L-band differential SAR interferometry to subsidence rate estimation in reclaimed coastal land. Int. J. Remote Sens. 2005, 26, 1363–1381. [Google Scholar] [CrossRef]
- Gao, G.D.; Wang, X.H.; Bao, X.W. Land reclamation and its impact on tidal dynamics in Jiaozhou Bay, Qingdao, China. Estuar. Coast. Shelf Sci. 2014, 151, 285–294. [Google Scholar] [CrossRef]
- Zhao, Q.; Pepe, A.; Gao, W.; Lu, Z.; Bonano, M.; He, M.L.; Wang, J.; Tang, X. A DInSAR investigation of the ground settlement time evolution of ocean-reclaimed lands in Shanghai. IEEE J. Sel. Top. Appl. Earth Obs. Remote Sens. 2015, 8, 1763–1781. [Google Scholar] [CrossRef]
- Tian, B.; Wu, W.; Yang, Z.; Zhou, Y. Drivers, trends, and potential impacts of long-term coastal reclamation in China from 1985 to 2010. Estuar. Coast. Shelf Sci. 2016, 170, 83–90. [Google Scholar] [CrossRef]
- Zhao, Q.; Ma, G.; Wang, Q.; Yang, T.; Liu, M.; Gao, W.; Falabella, F.; Mastro, P.; Pepe, A. Generation of long-term InSAR ground displacement time-series through a novel multi-sensor data merging technique: The case study of the Shanghai coastal area. ISPRS-J. Photogramm. Remote Sens. 2019, 154, 10–27. [Google Scholar] [CrossRef]
- Gens, R.; VanGenderen, J.L. SAR interferometry—Issues, techniques, applications. Int. J. Remote Sens. 1996, 17, 1803–1835. [Google Scholar] [CrossRef]
- Bamler, R.; Hartl, P. Synthetic aperture radar interferometry. Inverse Probl. 1998, 14, R1. [Google Scholar] [CrossRef]
- Pepe, A.; Calo, F. A review of interferometric synthetic aperture RADAR (InSAR) multi-track approaches for the retrieval of earth’s surface displacements. Appl. Sci. 2017, 7, 1264. [Google Scholar] [CrossRef] [Green Version]
- Hu, J.; Li, Z.W.; Ding, X.L.; Zhu, J.J.; Zhang, L.; Sun, Q. Resolving three-dimensional surface displacements from InSAR measurements: A review. Earth-Sci. Rev. 2014, 133, 1–17. [Google Scholar] [CrossRef]
- Xue, F.; Lv, X.; Dou, F.; Yun, Y. A review of time-series interferometric SAR techniques: A tutorial for surface deformation analysis. IEEE Geosci. Remote Sens. Mag. 2020, 8, 22–42. [Google Scholar] [CrossRef]
- Gabriel, A.K.; Goldstein, R.M.; Zebker, H.A. Mapping small elevation changes over large areas: Differential radar interferometry. J. Geophys. Res. 1989, 94, 9183–9191. [Google Scholar] [CrossRef]
- Tesauro, M.; Berardino, P.; Lanari, R.; Sansosti, E.; Fornaro, G.; Franceschetti, G. Urban subsidence inside the city of Napoli (Italy) observed by satellite radar interferometry. Geophys. Res. Lett. 2000, 27, 1961–1964. [Google Scholar] [CrossRef]
- Lopez-Quiroz, P.; Doin, M.-P.; Tupin, F.; Briole, P.; Nicolas, J.-M. Time series analysis of Mexico City subsidence constrained by radar interferometry. J. Appl. Geophys. 2009, 69, 1–15. [Google Scholar] [CrossRef]
- Zhang, B.; Wang, R.; Deng, Y.; Ma, P.; Lin, H.; Wang, J. Mapping the Yellow River Delta land subsidence with multitemporal SAR interferometry by exploiting both persistent and distributed scatterers. ISPRS-J. Photogramm. Remote Sens. 2019, 148, 157–173. [Google Scholar] [CrossRef]
- Ferretti, A.; Prati, C.; Rocca, F. Permanent scatterers in SAR interferometry. IEEE Trans. Geosci. Remote Sens. 2001, 39, 8–20. [Google Scholar] [CrossRef]
- Ferretti, A.; Prati, C.; Rocca, F. Nonlinear subsidence rate estimation using permanent scatterers in differential SAR interferometry. IEEE Trans. Geosci. Remote Sens. 2000, 38, 2202–2212. [Google Scholar] [CrossRef] [Green Version]
- Werner, C.; Wegmuller, U.; Strozzi, T.; Wiesmann, A. Interferometric Point Target Analysis for Deformation Mapping. In Proceedings of the IGARSS 2003, Toulouse, France, 21–25 July 2003; pp. 4362–4364. [Google Scholar]
- Hooper, A.; Zebker, H.; Segall, P.; Kampes, B. A new method for measuring deformation on volcanoes and other natural terrains using InSAR persistent scatterers. Geophys. Res. Lett. 2004, 31, L23611. [Google Scholar] [CrossRef]
- Kampes, B.M. Radar Interferometry; Springer: Dordrecht, The Netherlands, 2006; Volume 12. [Google Scholar]
- Sadeghi, Z.; Zoej, M.J.V.; Dehghani, M. An improved persistent scatterer interferometry for subsidence monitoring in the Tehran Basin. IEEE J. Sel. Top. Appl. Earth Obs. Remote Sens. 2013, 6, 1571–1577. [Google Scholar] [CrossRef]
- Devanthéry, N.; Crosetto, M.; Monserrat, O.; Cuevas-González, M.; Crippa, B. An approach to persistent scatterer interferometry. Remote Sens. 2014, 6, 6662–6679. [Google Scholar] [CrossRef] [Green Version]
- Foroughnia, F.; Nemati, S.; Maghsoudi, Y.; Perissin, D. An iterative PS-InSAR method for the analysis of large spatio-temporal baseline data stacks for land subsidence estimation. Int. J. Appl. Earth Obs. Geoinf. 2019, 74, 248–258. [Google Scholar] [CrossRef]
- Zhang, L.; Ding, X.; Lu, Z. Modeling PSInSAR time series without phase unwrapping. IEEE Trans. Geosci. Remote Sens. 2011, 49, 547–556. [Google Scholar] [CrossRef]
- Schmidt, D.A.; Bürgmann, R. Time-dependent land uplift and subsidence in the Santa Clara valley, California, from a large interferometric synthetic aperture radar data set. J. Geophys. Res. Solid Earth 2003, 108, 2416. [Google Scholar] [CrossRef] [Green Version]
- Crosetto, M.; Crippa, B.; Biescas, E. Early detection and in-depth analysis of deformation phenomena by radar interferometry. Eng. Geol. 2005, 79, 81–91. [Google Scholar] [CrossRef]
- Biggs, J.; Wright, T.; Lu, Z.; Parsons, B. Multi-interferogram method for measuring interseismic deformation: Denali fault, Alaska. Geophys. J. Int. 2007, 170, 1165–1179. [Google Scholar] [CrossRef] [Green Version]
- Blanco-Sanchez, P.; Mallorqui, J.J.; Duque, S.; Monells, D. The Coherent Pixels Technique (CPT): An advanced DInSAR technique for nonlinear deformation monitoring. Pure Appl. Geophys. 2008, 165, 1167–1193. [Google Scholar] [CrossRef]
- Lauknes, T.R.; Zebker, H.A.; Larsen, Y. InSAR deformation time series using an L-1-norm small-baseline approach. IEEE Trans. Geosci. Remote Sens. 2011, 49, 536–546. [Google Scholar] [CrossRef] [Green Version]
- Goel, K.; Adam, N. An advanced algorithm for deformation estimation in non-urban areas. ISPRS-J. Photogramm. Remote Sens. 2012, 73, 100–110. [Google Scholar] [CrossRef]
- Shirzaei, M. A wavelet-based multitemporal DInSAR algorithm for monitoring ground surface motion. IEEE Geosci. Remote Sens. Lett. 2013, 10, 456–460. [Google Scholar] [CrossRef]
- Verde, S.; Reale, D.; Pauciullo, A.; Fornaro, G. Improved small baseline processing by means of CAESAR eigen-interferograms decomposition. ISPRS-J. Photogramm. Remote Sens. 2018, 139, 1–13. [Google Scholar] [CrossRef]
- Samsonov, S.; d’Oreye, N. Multidimensional time-series analysis of ground deformation from multiple InSAR data sets applied to Virunga Volcanic Province. Geophys. J. Int. 2012, 191, 1095–1108. [Google Scholar] [CrossRef] [Green Version]
- Pepe, A.; Solaro, G.; Calo, F.; Dema, C. A minimum acceleration approach for the retrieval of multiplatform InSAR deformation time series. IEEE J. Sel. Top. Appl. Earth Obs. Remote Sens. 2016, 9, 3883–3898. [Google Scholar] [CrossRef]
- Sowter, A.; Bateson, L.; Strange, P.; Ambrose, K.; Syafiudin, M.F. DInSAR estimation of land motion using intermittent coherence with application to the South Derbyshire and Leicestershire coalfields. Remote Sens. Lett. 2013, 4, 979–987. [Google Scholar] [CrossRef] [Green Version]
- Bateson, L.; Cigna, F.; Boon, D.; Sowter, A. The application of the Intermittent SBAS (ISBAS) InSAR method to the South Wales Coalfield, UK. Int. J. Appl. Earth Obs. Geoinf. 2015, 34, 249–257. [Google Scholar] [CrossRef] [Green Version]
- Pepe, A.; Lanari, R. On the extension of the minimum cost flow algorithm for phase unwrapping of multitemporal differential SAR interferograms. IEEE Trans. Geosci. Remote Sens. 2006, 44, 2374–2383. [Google Scholar] [CrossRef]
- Guarnieri, A.M.; Tebaldini, S. On the exploitation of target statistics for SAR interferometry applications. IEEE Trans. Geosci. Remote Sens. 2008, 46, 3436–3443. [Google Scholar] [CrossRef]
- Pinel-Puyssegur, B.; Michel, R.; Avouac, J.-P. Multi-Link InSAR time series: Enhancement of a wrapped interferometric database. IEEE J. Sel. Top. Appl. Earth Obs. Remote Sens. 2012, 5, 784–794. [Google Scholar] [CrossRef]
- Fornaro, G.; Verde, S.; Reale, D.; Pauciullo, A. CAESAR: An approach based on covariance matrix decomposition to improve multibaseline-multitemporal interferometric SAR processing. IEEE Trans. Geosci. Remote Sens. 2015, 53, 2050–2065. [Google Scholar] [CrossRef]
- Pepe, A.; Yang, Y.; Manzo, M.; Lanari, R. Improved EMCF-SBAS processing chain based on advanced techniques for the noise-filtering and selection of small baseline multi-look DInSAR interferograms. IEEE Trans. Geosci. Remote Sens. 2015, 53, 4394–4417. [Google Scholar] [CrossRef]
- Ansari, H.; De Zan, F.; Bamler, R. Efficient phase estimation for interferogram stacks. IEEE Trans. Geosci. Remote Sens. 2018, 56, 4109–4125. [Google Scholar] [CrossRef]
- Burgmann, R.; Rosen, P.A.; Fielding, E.J. Synthetic aperture radar interferometry to measure Earth’s surface topography and its deformation. Annu. Rev. Earth Planet. Sci. 2000, 28, 169–209. [Google Scholar] [CrossRef]
- Pritchard, M.; Simons, M. An InSAR-based survey of volcanic deformation in the central Andes. Geochem. Geophys. Geosyst. 2004, 5, Q02002. [Google Scholar] [CrossRef] [Green Version]
- Rott, H. Advances in interferometric synthetic aperture radar (InSAR) in earth system science. Prog. Phys. Geogr. Earth Environ. 2009, 33, 769–791. [Google Scholar] [CrossRef]
- Ruch, J.; Pepe, S.; Casu, F.; Acocella, V.; Neri, M.; Solaro, G.; Sansosti, E. How do volcanic rift zones relate to flank instability? Evidence from collapsing rifts at Etna. Geophys. Res. Lett. 2012, 39, L20311. [Google Scholar] [CrossRef]
- Acocella, V.; Neri, M.; Norini, G. An overview of experimental models to understand a complex volcanic instability: Application to Mount Etna, Italy. J. Volcanol. Geotherm. Res. 2013, 251, 98–111. [Google Scholar] [CrossRef]
- Iglesias, R.; Aguasca, A.; Fabregas, X.; Mallorqui, J.J.; Monells, D.; Lopez-Martinez, C.; Pipia, L. Ground-Based polarimetric SAR interferometry for the monitoring of terrain displacement phenomena-part I: Theoretical description. IEEE J. Sel. Top. Appl. Earth Observ. Remote Sens. 2015, 8, 980–993. [Google Scholar] [CrossRef] [Green Version]
- Perissin, D. Interferometric SAR Multitemporal Processing: Techniques and Applications. In Multitemporal Remote Sensing; Springer: Cham, Switzerland, 2016; pp. 145–176. [Google Scholar]
- Deffontaines, B.; Chang, K.-J.; Champenois, J.; Fruneau, B.; Pathier, E.; Hu, J.-C.; Lu, S.-T.; Liu, Y.-C. Active interseismic shallow deformation of the Pingting terraces (Longitudinal Valley-Eastern Taiwan) from UAV high-resolution topographic data combined with InSAR time series. Geomat. Nat. Hazards Risk 2017, 8, 120–136. [Google Scholar] [CrossRef] [Green Version]
- Hong, S.-H.; Wdowinski, S. A review on monitoring the everglades wetlands in the Southern Florida using space-based synthetic aperture radar (SAR) observations. Korean J. Remote Sens. 2017, 33, 377–390. [Google Scholar] [CrossRef]
- Xu, X.; Sandwell, D.T.; Tymofyeyeva, E.; Gonzalez-Ortega, A.; Tong, X. Tectonic and anthropogenic deformation at the Cerro Prieto geothermal step-over revealed by Sentinel-1A InSAR. IEEE Trans. Geosci. Remote Sens. 2017, 55, 5284–5292. [Google Scholar] [CrossRef]
- Gong, H.; Pan, Y.; Zheng, L.; Li, X.; Zhu, L.; Zhang, C.; Huang, Z.; Li, Z.; Wang, H.; Zhou, C. Long-term groundwater storage changes and land subsidence development in the North China Plain (1971–2015). Hydrogeol. J. 2018, 26, 1417–1427. [Google Scholar] [CrossRef] [Green Version]
- Maghsoudi, Y.; van der Meer, F.; Hecker, C.; Perissin, D.; Saepuloh, A. Using PS-InSAR to detect surface deformation in geothermal areas of West Java in Indonesia. Int. J. Appl. Earth Obs. Geoinf. 2018, 64, 386–396. [Google Scholar] [CrossRef]
- Wang, C.; Zhang, Z.; Zhang, H.; Zhang, B.; Tang, Y.; Wu, Q. Active layer thickness retrieval of Qinghai-Tibet permafrost using the TerraSAR-X InSAR technique. IEEE J. Sel. Top. Appl. Earth Obs. Remote Sens. 2018, 11, 4403–4413. [Google Scholar] [CrossRef]
- Gaddes, M.E.; Hooper, A.; Bagnardi, M. Using machine learning to automatically detect volcanic unrest in a time series of interferograms. J. Geophys. Res. Solid Earth 2019, 124, 12304–12322. [Google Scholar] [CrossRef] [Green Version]
- Wang, J.; Yu, W.; Deng, Y.; Wang, R.; Wang, Y.; Zhang, H.; Zheng, M. Demonstration of time-series InSAR processing in Beijing using a small stack of Gaofen-3 differential interferograms. J. Sens. 2019, 2019, 4204580. [Google Scholar] [CrossRef]
- Albino, F.; Biggs, J.; Yu, C.; Li, Z. Automated methods for detecting volcanic deformation using Sentinel-1 InSAR time series illustrated by the 2017–2018 unrest at Agung, Indonesia. J. Geophys. Res. Solid Earth 2020, 125, e2019JB017908. [Google Scholar] [CrossRef] [Green Version]
- Ding, J.; Zhao, Q.; Tang, M.; Calo, F.; Zamparelli, V.; Falabella, F.; Liu, M.; Pepe, A. On the characterization and forecasting of ground displacements of ocean-reclaimed lands. Remote Sens. 2020, 12, 2971. [Google Scholar] [CrossRef]
- Farquharson, J.I.; Amelung, F. Extreme rainfall triggered the 2018 rift eruption at Kilauea Volcano. Nature 2020, 580, 491–495. [Google Scholar] [CrossRef] [PubMed]
- Hoyt, A.M.; Chaussard, E.; Seppalainen, S.S.; Harvey, C.F. Widespread subsidence and carbon emissions across Southeast Asian peatlands. Nat. Geosci. 2020, 13, 435–440. [Google Scholar] [CrossRef]
- Stephens, K.J.; Wauthier, C.; Bussard, R.C.; Higgins, M.; LaFemina, P.C. Assessment of mitigation strategies for tropospheric phase contributions to InSAR time-series datasets over two Nicaraguan Volcanoes. Remote Sens. 2020, 12, 782. [Google Scholar] [CrossRef] [Green Version]
- Xu, X.; Sandwell, D.T.; Smith-Konter, B. Coseismic displacements and surface fractures from Sentinel-1 InSAR: 2019 ridgecrest earthquakes. Seismol. Res. Lett. 2020, 91, 1979–1985. [Google Scholar] [CrossRef]
- Xue, X.; Freymueller, J.; Lu, Z. Modeling the posteruptive deformation at Okmok based on the GPS and InSAR time series: Changes in the shallow magma storage system. J. Geophys. Res. Solid Earth 2020, 125, e2019JB017801. [Google Scholar] [CrossRef]
- Khan, S.D.; Huang, Z.; Karacay, A. Study of ground subsidence in northwest Harris county using GPS, LiDAR, and InSAR techniques. Nat. Hazards 2014, 73, 1143–1173. [Google Scholar] [CrossRef]
- Wang, G.; Zhou, X.; Wang, K.; Ke, X.; Zhang, Y.; Zhao, R.; Bao, Y. GOM20: A stable geodetic reference frame for subsidence, faulting, and sea-level rise studies along the coast of the Gulf of Mexico. Remote Sens. 2020, 12, 350. [Google Scholar] [CrossRef] [Green Version]
- Fiaschi, S.; Wdowinski, S. Local land subsidence in Miami Beach (FL) and Norfolk (VA) and its contribution to flooding hazard in coastal communities along the US Atlantic coast. Ocean Coast. Manag. 2020, 187, 105078. [Google Scholar] [CrossRef]
- Canova, F.; Tolomei, C.; Salvi, S.; Toscani, G.; Seno, S. Land subsidence along the Ionian coast of SE Sicily (Italy), detection and analysis via Small Baseline Subset (SBAS) multitemporal differential SAR interferometry. Earth Surf. Process. Landf. 2012, 37, 273–286. [Google Scholar] [CrossRef]
- Aucelli, P.P.C.; Di Paola, G.; Incontri, P.; Rizzo, A.; Vilardo, G.; Benassai, G.; Buonocore, B.; Pappone, G. Coastal inundation risk assessment due to subsidence and sea level rise in a Mediterranean alluvial plain (Volturno coastal plain—Southern Italy). Estuar. Coast. Shelf Sci. 2017, 198, 597–609. [Google Scholar] [CrossRef]
- Da Lio, C.; Tosi, L. Land subsidence in the Friuli Venezia Giulia coastal plain, Italy: 1992-2010 results from SAR-based interferometry. Sci. Total Environ. 2018, 633, 752–764. [Google Scholar] [CrossRef]
- Tosi, L.; Da Lio, C.; Teatini, P.; Strozzi, T. Land subsidence in coastal environments: Knowledge advance in the Venice Coastland by TerraSAR-X PSI. Remote Sens. 2018, 10, 1191. [Google Scholar] [CrossRef] [Green Version]
- Syvitski, J.P.; Kettner, A.J.; Overeem, I.; Hutton, E.W.; Hannon, M.T.; Brakenridge, G.R.; Day, J.; Vörösmarty, C.; Saito, Y.; Giosan, L. Sinking deltas due to human activities. Nat. Geosci. 2009, 2, 681–686. [Google Scholar] [CrossRef]
- Twilley, R.R.; Bentley, S.J.; Chen, Q.; Edmonds, D.A.; Hagen, S.C.; Lam, N.S.N.; Willson, C.S.; Xu, K.; Braud, D.; Peele, R.H.; et al. Co-evolution of wetland landscapes, flooding, and human settlement in the Mississippi River Delta Plain. Sustain. Sci. 2016, 11, 711–731. [Google Scholar] [CrossRef] [Green Version]
- Higgins, S.; Overeem, I.; Tanaka, A.; Syvitski, J.P.M. Land subsidence at aquaculture facilities in the Yellow River delta, China. Geophys. Res. Lett. 2013, 40, 3898–3902. [Google Scholar] [CrossRef]
- Zhang, J.-Z.; Huang, H.-j.; Bi, H.-b. Land subsidence in the modern Yellow River Delta based on InSAR time series analysis. Nat. Hazards 2015, 75, 2385–2397. [Google Scholar] [CrossRef]
- Wang, H.; Wright, T.J.; Yu, Y.; Lin, H.; Jiang, L.; Li, C.; Qiu, G. InSAR reveals coastal subsidence in the Pearl River Delta, China. Geophys. J. Int. 2012, 191, 1119–1128. [Google Scholar] [CrossRef] [Green Version]
- Brown, S.; Nicholls, R.J. Subsidence and human influences in mega deltas: The case of the Ganges-Brahmaputra-Meghna. Sci. Total Environ. 2015, 527–528, 362–374. [Google Scholar] [CrossRef] [Green Version]
- Hu, J.; Shi, B.; Inyang, H.I.; Chen, J.; Sui, Z. Patterns of subsidence in the lower Yangtze Delta of China: The case of the Suzhou-Wuxi-Changzhou Region. Environ. Monit. Assess. 2009, 153, 61–72. [Google Scholar] [CrossRef] [PubMed]
- Yu, L.; Yang, T.; Zhao, Q.; Liu, M.; Pepe, A. The 2015-2016 ground displacements of the Shanghai coastal area inferred from a combined COSMO-SkyMed/Sentinel-1 DInSAR analysis. Remote Sens. 2017, 9, 1194. [Google Scholar] [CrossRef] [Green Version]
- Wang, Q.; Zhao, Q.; Ding, J.; Fedotov, A.A.; Badenko, V.; Liu, M.; Pepe, A. Investigation of the ground displacement in Saint Petersburg, Russia, using multiple-track differential synthetic aperture radar interferometry. Int. J. Appl. Earth Obs. Geoinf. 2020, 87, 102050. [Google Scholar] [CrossRef]
- Komen, G.J.; Cavaleri, L.; Donelan, M.; Hasselmann, K.; Hasselmann, S.; Janssen, P.A.E.M. Dynamics and Modelling of Ocean Waves; Cambridge University Press: Cambridge, UK, 1994. [Google Scholar] [CrossRef]
- Thompson, T.; Liu, W.; Weissman, D. Synthetic aperture radar observation of ocean roughness from rolls in an unstable marine boundary layer. Geophys. Res. Lett. 1983, 10, 1172–1175. [Google Scholar] [CrossRef]
- Fornaro, G.; Lanari, R.; Sansosti, E.; Franceschetti, G.; Perna, S.; Gois, A.; Moreira, J. Airborne Differential Interferometry: X-Band Experiments. In Proceedings of the IGARSS 2004 IEEE International Geoscience and Remote Sensing Symposium, Anchorage, AK, USA, 20–24 September 2004; Volume 3325, pp. 3329–3332. [Google Scholar]
- Amadori, M.; Zamparelli, V.; De Carolis, G.; Fornaro, G.; Toffolon, M.; Bresciani, M.; Giardino, C.; De Santi, F. Monitoring Lakes Surface Water Velocity with SAR: A Feasibility Study on Lake Garda, Italy. Remote Sens. 2021, 13, 2293. [Google Scholar] [CrossRef]
- Zamparelli, V.; Perna, S.; Fornaro, G. An Improved Topography and Aperture Dependent Motion Compensation Algorithm. In Proceedings of the 2012 IEEE International Geoscience and Remote Sensing Symposium, Munich, Germany, 22–27 July 2012; pp. 5805–5808. [Google Scholar]
- Romeiser, R.; Alpers, W. An improved composite surface model for the radar backscattering cross section of the ocean surface: 2. Model response to surface roughness variations and the radar imaging of underwater bottom topography. J. Geophys. Res. Oceans 1997, 102, 25251–25267. [Google Scholar] [CrossRef]
- Goldstein, R.M.; Zebker, H.A.; Barnett, T.P. Remote sensing of ocean currents. Science 1989, 246, 1282–1285. [Google Scholar] [CrossRef]
- Kudryavtsev, V.; Akimov, D.; Johannessen, J.; Chapron, B. On radar imaging of current features: 1. Model and comparison with observations. J. Geophys. Res.-Oceans 2005, 110, C07016. [Google Scholar] [CrossRef] [Green Version]
- Johannessen, J.A.; Chapron, B.; Collard, F.; Kudryavtsev, V.; Mouche, A.; Akimov, D.; Dagestad, K.F. Direct ocean surface velocity measurements from space: Improved quantitative interpretation of Envisat ASAR observations. Geophys. Res. Lett. 2008, 35, L22608. [Google Scholar] [CrossRef] [Green Version]
- Romeiser, R.; Runge, H.; Suchandt, S.; Kahle, R.; Rossi, C.; Bell, P.S. Quality assessment of surface current fields from TerraSAR-X and TanDEM-X along-track interferometry and doppler centroid analysis. IEEE Trans. Geosci. Remote Sens. 2014, 52, 2759–2772. [Google Scholar] [CrossRef] [Green Version]
- Ardhuin, F.; Chapron, B.; Maes, C.; Romeiser, R.; Gommenginger, C.; Cravatte, S.; Morrow, R.; Donlon, C.; Bourassa, M. Satellite doppler observations for the motions of the oceans. Bull. Am. Meteorol. Soc. 2019, 100, ES215–ES219. [Google Scholar] [CrossRef]
- Mouche, A.A.; Collard, F.; Chapron, B.; Dagestad, K.-F.; Guitton, G.; Johannessen, J.A.; Kerbaol, V.; Hansen, M.W. On the use of doppler shift for sea surface wind retrieval from SAR. IEEE Trans. Geosci. Remote Sens. 2012, 50, 2901–2909. [Google Scholar] [CrossRef]
- Alpers, W.; Mouche, A.; Horstmann, J.; Ivanov, A.; Barabanov, V.; Ieee. Test of an Advanced Algotithm to Retrieve Complex Wind Fields over the Balck Sea from ENVISAT SAR Images. In Proceedings of the IEEE International Geoscience and Remote Sensing Symposium (IGARSS), Melbourne, Australia, 21–26 July 2013; pp. 1262–1265. [Google Scholar]
- Zamparelli, V.; De Santi, F.; Cucco, A.; Zecchetto, S.; De Carolis, G.; Fornaro, G. Surface currents derived from SAR doppler processing: An analysis over the Naples coastal region in South Italy. J. Mar. Sci. Eng. 2020, 8, 203. [Google Scholar] [CrossRef] [Green Version]
- Pramudya, F.S.; Pan, J.; Devlin, A.T. Estimation of significant wave height of near-range traveling ocean waves using Sentinel-1 SAR images. IEEE J. Sel. Top. Appl. Earth Obs. Remote Sens. 2019, 12, 1067–1075. [Google Scholar] [CrossRef]
- Pramudya, F.S.; Pan, J.; Devlin, A.T.; Lin, H. Enhanced Estimation of Significant Wave Height with Dual-Polarization Sentinel-1 SAR Imagery. Remote Sens. 2021, 13, 124. [Google Scholar] [CrossRef]
- Zamparelli, V.; Jackson, C.; Cucco, A.; Fornaro, G.; Zecchetto, S. SAR based sea current estimation in the Naples coastal area. In Proceedings of the 36th IEEE International Geoscience and Remote Sensing Symposium (IGARSS), Beijing, China, 10–15 July 2016; pp. 4665–4668. [Google Scholar]
- Biondi, F.; Addabbo, P.; Clemente, C.; Orlando, D. Measurements of surface river doppler velocities with along-track InSAR using a single antenna. IEEE J. Sel. Top. Appl. Earth Obs. Remote Sens. 2020, 13, 987–997. [Google Scholar] [CrossRef]
- Goldstein, R.M.; Zebker, H.A. Interferometric radar measurement of ocean surface currents. Nature 1987, 328, 707–709. [Google Scholar] [CrossRef]
- Natale, A.; Jackson, G.; Esposito, C.; Fornaro, G.; Lanari, R.; Perna, S. Sea state observation through a three-antenna hybrid XT/AT InSAR configuration: A preliminary study based on the InSAeS4 airborne system. Remote Sens. 2017, 9, 792. [Google Scholar] [CrossRef] [Green Version]
- Yurovsky, Y.Y.; Kudryavtsev, V.N.; Grodsky, S.A.; Chapron, B. Sea surface Ka-band doppler measurements: Analysis and model development. Remote Sens. 2019, 11, 839. [Google Scholar] [CrossRef]
- Cianelli, D.; Uttieri, M.; Buonocore, B.; Falco, P.; Zambardino, G.; Zambianchi, E. Dynamics of a very special Mediterranean coastal area: The Gulf of Naples. Mediterr. Ecosyst. Dyn. Manag. Conserv. 2012, 7, 129–150. [Google Scholar]
- Jackson, G.; Fornaro, G.; Berardino, P.; Esposito, C.; Lanari, R.; Pauciullo, A.; Reale, D.; Zamparelli, V.; Perna, S. Experiments of Sea Surface Currents Estimation with Space and Airborne SAR Systems. In Proceedings of the 2015 IEEE International Geoscience and Remote Sensing Symposium (IGARSS), Milan, Italy, 26–31 July 2015; pp. 373–376. [Google Scholar]
- Son, V.N.; George, A.L. Satellite SAR Remote Sensing of Great Lakes Ice Cover, Part 1. Ice Backscatter Signatures at C Band. J. Great Lakes Res. 2007, 33, 722–735. [Google Scholar] [CrossRef]
- Wu, L.; Wang, L.; Min, L.; Hou, W.; Guo, Z.; Zhao, J.; Li, N. Discrimination of Algal-Bloom Using Spaceborne SAR Observations of Great Lakes in China. Remote Sens. 2018, 10, 767. [Google Scholar] [CrossRef] [Green Version]
- De Santi, F.; Luciani, G.; Bresciani, M.; Giardino, C.; Lovergine, F.P.; Pasquariello, G.; Vaiciute, D.; De Carolis, G. Synergistic Use of Synthetic Aperture Radar and Optical Imagery to Monitor Surface Accumulation of Cyanobacteria in the Curonian Lagoon. J. Mar. Sci. Eng. 2019, 7, 461. [Google Scholar] [CrossRef] [Green Version]
- McKinney, P.; Holt, B.; Matsumoto, K. Small eddies observed in Lake Superior using SAR and sea surface temperature imagery. J. Great Lakes Res. 2012, 38, 786–797. [Google Scholar] [CrossRef]
- Katona, T.; Bartsch, A. Estimation of wind speed over lakes in Central Europe using spaceborne C-band SAR. Eur. J. Remote Sens. 2018, 51, 921–931. [Google Scholar] [CrossRef] [Green Version]
- Perna, S.; Esposito, C.; Amaral, T.; Berardino, P.; Jackson, G.; Moreira, J.; Pauciullo, A.; Vaz Junior, E.; Wimmer, C.; Lanari, R. The InSAeS4 airborne X-band interferometric SAR system: A first assessment on its imaging and topographic mapping capabilities. Remote Sens. 2016, 8, 40. [Google Scholar] [CrossRef] [Green Version]
- Perna, S.; Berardino, P.; Britti, F.; Cirillo, C.; Esposito, C.; Fornaro, G.; Lubeck, D.; Monaldi, G.; Moreira, J.; Pauciullo, A.; et al. Capabilities of the Telaer Airborne SAR System Upgraded to the Multi-Antenna Mode. In Proceedings of the IEEE International Geoscience and Remote Sensing Symposium (IGARSS), Munich, Germany, 22–27 July 2012; pp. 1545–1548. [Google Scholar]
- Williams, A.; Rangel-Buitrago, N.; Pranzini, E.; Anfuso, G. The management of coastal erosion. Ocean Coast. Manag. 2018, 156, 4–20. [Google Scholar] [CrossRef]
- Besset, M.; Gratiot, N.; Anthony, E.J.; Bouchette, F.; Goichot, M.; Marchesiello, P. Mangroves and shoreline erosion in the Mekong River delta, Viet Nam. Estuar. Coast. Shelf Sci. 2019, 226, 106263. [Google Scholar] [CrossRef]
- Ogorodov, S.; Aleksyutina, D.; Baranskaya, A.; Shabanova, N.; Shilova, O. Coastal erosion of the Russian Arctic: An overview. J. Coast. Res. 2020, 95, 599–604. [Google Scholar] [CrossRef]
- Jasechko, S.; Perrone, D.; Seybold, H.; Fan, Y.; Kirchner, J.W. Groundwater level observations in 250,000 coastal US wells reveal scope of potential seawater intrusion. Nat. Commun. 2020, 11, 3229. [Google Scholar] [CrossRef]
- Hinkel, J.; Lincke, D.; Vafeidis, A.T.; Perrette, M.; Nicholls, R.J.; Tol, R.S.J.; Marzeion, B.; Fettweis, X.; Ionescu, C.; Levermann, A. Coastal flood damage and adaptation costs under 21st century sea-level rise. Proc. Natl. Acad. Sci. USA 2014, 111, 3292–3297. [Google Scholar] [CrossRef] [PubMed] [Green Version]
- Kulp, S.A.; Strauss, B.H. New elevation data triple estimates of global vulnerability to sea-level rise and coastal flooding. Nat. Commun. 2019, 10, 4844. [Google Scholar] [CrossRef] [PubMed] [Green Version]
- Hanson, S.; Nicholls, R.; Ranger, N.; Hallegatte, S.; Corfee-Morlot, J.; Herweijer, C.; Chateau, J. A global ranking of port cities with high exposure to climate extremes. Clim. Chang. 2011, 104, 89–111. [Google Scholar] [CrossRef] [Green Version]
- Muis, S.; Verlaan, M.; Winsemius, H.C.; Aerts, J.C.J.H.; Ward, P.J. A global reanalysis of storm surges and extreme sea levels. Nat. Commun. 2016, 7, 11969. [Google Scholar] [CrossRef] [Green Version]
- Hallegatte, S.; Green, C.; Nicholls, R.J.; Corfee-Morlot, J. Future flood losses in major coastal cities. Nat. Clim. Chang. 2013, 3, 802–806. [Google Scholar] [CrossRef]
- Shirzaei, M.; Burgmann, R. Global climate change and local land subsidence exacerbate inundation risk to the San Francisco Bay Area. Sci. Adv. 2018, 4, eaap9234. [Google Scholar] [CrossRef] [Green Version]
- Nico, G.; Pappalepore, M.; Pasquariello, G.; Refice, A.; Samarelli, S. Comparison of SAR amplitude vs. coherence flood detection methods-a GIS application. Int. J. Remote Sens. 2000, 21, 1619–1631. [Google Scholar] [CrossRef]
- Horritt, M.S.; Mason, D.C.; Luckman, A.J. Flood boundary delineation from Synthetic Aperture Radar imagery using a statistical active contour model. Int. J. Remote Sens. 2001, 22, 2489–2507. [Google Scholar] [CrossRef]
- Bates, P.D.; Horritt, M.; Cobby, D.; Mason, D. Flood Inundation Modelling Using LiDAR and SAR Data; John Wiley & Sons: Hoboken, NJ, USA, 2004; pp. 79–106. [Google Scholar]
- Pierdicca, N.; Chini, M.; Pulvirenti, L.; Macina, F. Integrating physical and topographic information into a fuzzy scheme to map flooded area by SAR. Sensors 2008, 8, 4151–4164. [Google Scholar] [CrossRef] [Green Version]
- Martinis, S.; Twele, A.; Voigt, S. Towards operational near real-time flood detection using a split-based automatic thresholding procedure on high resolution TerraSAR-X data. Nat. Hazards Earth Syst. Sci. 2009, 9, 303–314. [Google Scholar] [CrossRef]
- Van Der Knijff, J.M.; Younis, J.; De Roo, A.P.J. Lisflood: A GIS-based distributed model for river basin scale water balance and flood simulation. Int. J. Geogr. Inf. Sci. 2010, 24, 189–212. [Google Scholar] [CrossRef]
- Wang, J.; Gao, W.; Xu, S.; Yu, L. Evaluation of the combined risk of sea level rise, land subsidence, and storm surges on the coastal areas of Shanghai, China. Clim. Chang. 2012, 115, 537–558. [Google Scholar] [CrossRef]
- Zuo, J.; Yang, Y.; Zhang, J.; Chen, M.; Xu, Q. Prediction of china’s submerged coastal areas by sea level rise due to climate change. J. Ocean Univ. China 2013, 12, 327–334. [Google Scholar] [CrossRef]
- Sampson, C.C.; Smith, A.M.; Bates, P.D.; Neal, J.C.; Alfieri, L.; Freer, J.E. A high-resolution global flood hazard model. Water Resour. Res. 2015, 51, 7358–7381. [Google Scholar] [CrossRef] [Green Version]
- Yu, D.; Coulthard, T.J. Evaluating the importance of catchment hydrological parameters for urban surface water flood modelling using a simple hydro-inundation model. J. Hydrol. 2015, 524, 385–400. [Google Scholar] [CrossRef] [Green Version]
- Teng, J.; Jakeman, A.J.; Vaze, J.; Croke, B.F.W.; Dutta, D.; Kim, S. Flood inundation modelling: A review of methods, recent advances and uncertainty analysis. Environ. Model. Softw. 2017, 90, 201–216. [Google Scholar] [CrossRef]
- Wing, O.E.J.; Bates, P.D.; Sampson, C.C.; Smith, A.M.; Johnson, K.A.; Erickson, T.A. Validation of a 30 m resolution flood hazard model of the conterminous United States. Water Resour. Res. 2017, 53, 7968–7986. [Google Scholar] [CrossRef]
- Yin, J.; Zhao, Q.; Yu, D.; Lin, N.; Kubanek, J.; Ma, G.; Liu, M.; Pepe, A. Long-term flood-hazard modeling for coastal areas using InSAR measurements and a hydrodynamic model: The case study of Lingang New City, Shanghai. J. Hydrol. 2019, 571, 593–604. [Google Scholar] [CrossRef] [Green Version]
- Hsu, K.; Ombadi, M.; Nguyen, P.; Tran, H.; Sorooshian, S.; Andreadis, K. Improving Hydrologic Modeling Using Cloud-Free MODIS Flood Maps. J. Hydrometeorol. 2019, 20, 2203–2214. [Google Scholar] [CrossRef] [Green Version]
- Tang, M.; Zhao, Q.; Pepe, A.; Devlin, A.T.; Falabella, F.; Yao, C.; Li, Z. Changes of Chinese Coastal Regions Induced by Land Reclamation as Revealed through TanDEM-X DEM and InSAR Analyses. Remote Sens. 2022, 14, 637. [Google Scholar] [CrossRef]
- Patro, S.; Chatterjee, C.; Singh, R.; Raghuwanshi, N.S. Hydrodynamic modelling of a large flood-prone river system in India with limited data. Hydrol. Process. 2009, 23, 2774–2791. [Google Scholar] [CrossRef]
- Schumann, G.; Bates, P.D.; Horritt, M.S.; Matgen, P.; Pappenberger, F. Progress in integration of remote sensing-derived flood extent and stge data and hydraulic models. Rev. Geophys. 2009, 47, RG4001. [Google Scholar] [CrossRef]
- Neal, J.; Schumann, G.; Bates, P. A subgrid channel model for simulating river hydraulics and floodplain inundation over large and data sparse areas. Water Resour. Res. 2012, 48, W11506. [Google Scholar] [CrossRef]
- Yu, D.; Yin, J.; Wilby, R.L.; Lane, S.N.; Aerts, J.C.J.H.; Lin, N.; Liu, M.; Yuan, H.; Chen, J.; Prudhomme, C.; et al. Disruption of emergency response to vulnerable populations during floods. Nat. Sustain. 2020, 3, 728–736. [Google Scholar] [CrossRef]
- Kuenzer, C.; Guo, H.; Huth, J.; Leinenkugel, P.; Li, X.; Dech, S. Flood mapping and flood dynamics of the Mekong Delta: ENVISAT-ASAR-WSM based time series analyses. Remote Sens. 2013, 5, 687–715. [Google Scholar] [CrossRef] [Green Version]
- Chan, F.K.S.; Adekola, O.A.; Cho Nam, N.; Mitchell, G.; McDonald, A.T. Coastal flood-risk management practice in Tai O, a town in Hong Kong. Environ. Pract. 2013, 15, 201–219. [Google Scholar] [CrossRef]
- Amadio, M.; Mysiak, J.; Carrera, L.; Koks, E. Improving flood damage assessment models in Italy. Nat. Hazards 2016, 82, 2075–2088. [Google Scholar] [CrossRef] [Green Version]
- Kreibich, H.; Piroth, K.; Seifert, I.; Maiwald, H.; Kunert, U.; Schwarz, J.; Merz, B.; Thieken, A.H. Is flow velocity a significant parameter in flood damage modelling? Nat. Hazards Earth Syst. Sci. 2009, 9, 1679–1692. [Google Scholar] [CrossRef]
- Luino, F.; Cirio, C.G.; Biddoccu, M.; Agangi, A.; Giulietto, W.; Godone, F.; Nigrelli, G. Application of a model to the evaluation of flood damage. Geoinformatica 2009, 13, 339–353. [Google Scholar] [CrossRef]
- Merz, B.; Hall, J.; Disse, M.; Schumann, A. Fluvial flood risk management in a changing world. Nat. Hazards Earth Syst. Sci. 2010, 10, 509–527. [Google Scholar] [CrossRef] [Green Version]
- Arrighi, C.; Brugioni, M.; Castelli, F.; Franceschini, S.; Mazzanti, B. Urban micro-scale flood risk estimation with parsimonious hydraulic modelling and census data. Nat. Hazards Earth Syst. Sci. 2013, 13, 1375–1391. [Google Scholar] [CrossRef] [Green Version]
- Brakenridge, G.; Anderson, E.; Nghiem, S. Satellite Microwave Detection and Measurement of River Floods. In Proceedings of the AGU Spring Meeting Abstracts, Baltimore, MD, USA, 1 May 2006; p. H23A-05. [Google Scholar]
- Gianinetto, M.; Villa, P.; Lechi, G. Postflood damage evaluation using landsat TM and ETM plus data integrated with DEM. IEEE Trans. Geosci. Remote Sens. 2006, 44, 236–243. [Google Scholar] [CrossRef]
- Nigro, J.; Slayback, D.; Policelli, F.; Brakenridge, G.R. NASA/DFO MODIS Near Real-Time (NRT) Global Flood Mapping Product Evaluation of Flood and Permanent Water Detection. 2014. Available online: https://floodmap.modaps.eosdis.nasa.gov/documents/NASAGlobalNRTEvaluationSummary_v4.pdf (accessed on 1 March 2021).
- Yan, K.; Di Baldassarre, G.; Solomatine, D.P.; Schumann, G.J.P. A review of low-cost space-borne data for flood modelling: Topography, flood extent and water level. Hydrol. Process. 2015, 29, 3368–3387. [Google Scholar] [CrossRef]
- Rahman, M.S.; Di, L. The state of the art of spaceborne remote sensing in flood management. Nat. Hazards 2017, 85, 1223–1248. [Google Scholar] [CrossRef]
- Brivio, P.A.; Colombo, R.; Maggi, M.; Tomasoni, R. Integration of remote sensing data and GIS for accurate mapping of flooded areas. Int. J. Remote Sens. 2002, 23, 429–441. [Google Scholar] [CrossRef]
- Pulvirenti, L.; Pierdicca, N.; Chini, M.; Guerriero, L. An algorithm for operational flood mapping from Synthetic Aperture Radar (SAR) data using fuzzy logic. Nat. Hazards Earth Syst. Sci. 2011, 11, 529–540. [Google Scholar] [CrossRef] [Green Version]
- Mason, D.C.; Giustarini, L.; Garcia-Pintado, J.; Cloke, H.L. Detection of flooded urban areas in high resolution Synthetic Aperture Radar images using double scattering. Int. J. Appl. Earth Obs. Geoinf. 2014, 28, 150–159. [Google Scholar] [CrossRef] [Green Version]
- Refice, A.; Capolongo, D.; Pasquariello, G.; D’Addabbo, A.; Bovenga, F.; Nutricato, R.; Lovergine, F.P.; Pietranera, L. SAR and InSAR for flood monitoring: Examples with COSMO-SkyMed data. IEEE J. Sel. Top. Appl. Earth Obs. Remote Sens. 2014, 7, 2711–2722. [Google Scholar] [CrossRef]
- Schumann, G.J.P.; Moller, D.K. Microwave remote sensing of flood inundation. Phys. Chem. Earth 2015, 83–84, 84–95. [Google Scholar] [CrossRef]
- Boni, G.; Ferraris, L.; Pulvirenti, L.; Squicciarino, G.; Pierdicca, N.; Candela, L.; Pisani, A.R.; Zoffoli, S.; Onori, R.; Proietti, C.; et al. A prototype system for flood monitoring based on flood forecast combined with COSMO-SkyMed and Sentinel-1 data. IEEE J. Sel. Top. Appl. Earth Obs. Remote Sens. 2016, 9, 2794–2805. [Google Scholar] [CrossRef]
- Clement, M.A.; Kilsby, C.G.; Moore, P. Multi-temporal synthetic aperture radar flood mapping using change detection. J. Flood Risk Manag. 2018, 11, 152–168. [Google Scholar] [CrossRef]
- Hapuarachchi, H.A.P.; Wang, Q.J.; Pagano, T.C. A review of advances in flash flood forecasting. Hydrol. Process. 2011, 25, 2771–2784. [Google Scholar] [CrossRef]
- Borga, M.; Stoffel, M.; Marchi, L.; Marra, F.; Jakob, M. Hydrogeomorphic response to extreme rainfall in headwater systems: Flash floods and debris flows. J. Hydrol. 2014, 518, 194–205. [Google Scholar] [CrossRef]
- Li, W.; Zhao, M.; Scaioni, M.; Hosseini, S.R.; Wang, X.; Yao, D.; Zhang, K.; Gao, J.; Li, X. Extreme rainfall trends of 21 typical urban areas in China during 1998-2015 based on remotely sensed data sets. Environ. Monit. Assess. 2019, 191, 709. [Google Scholar] [CrossRef] [PubMed]
- Thomas, W.; Baier, F.; Erbertseder, T.; Kaästner, M. Analysis of the Algerian severe weather event in November 2001 and its impact on ozone and nitrogen dioxide distributions. Tellus B Chem. Phys. Meteorol. 2011, 55, 993–1006. [Google Scholar] [CrossRef] [Green Version]
- Elkhrachy, I. Flash flood hazard mapping using satellite images and GIS tools: A case study of Najran City, Kingdom of Saudi Arabia (KSA). Egypt. J. Remote Sens. Space Sci. 2015, 18, 261–278. [Google Scholar] [CrossRef] [Green Version]
- Wright, D.B.; Mantilla, R.; Peters-Lidard, C.D. A remote sensing-based tool for assessing rainfall-driven hazards. Environ. Model. Softw. 2017, 90, 34–54. [Google Scholar] [CrossRef] [Green Version]
- Ricciardelli, E.; Di Paola, F.; Gentile, S.; Cersosimo, A.; Cimini, D.; Gallucci, D.; Geraldi, E.; Larosa, S.; Nilo, S.T.; Ripepi, E.; et al. Analysis of Livorno heavy rainfall event: Examples of satellite-based observation techniques in support of numerical weather prediction. Remote Sens. 2018, 10, 1549. [Google Scholar] [CrossRef] [Green Version]
- Krajewski, W.; Smith, J.A. Radar hydrology: Rainfall estimation. Adv. Water Resour. 2002, 25, 1387–1394. [Google Scholar] [CrossRef]
- Peleg, N.; Marra, F.; Fatichi, S.; Paschalis, A.; Molnar, P.; Burlando, P. Spatial variability of extreme rainfall at radar subpixel scale. J. Hydrol. 2018, 556, 922–933. [Google Scholar] [CrossRef] [Green Version]
- Williams, S.J. Sea-level rise implications for coastal regions. J. Coast. Res. 2013, 63, 184–196. [Google Scholar] [CrossRef]
- Devlin, A.T.; Pan, J.; Lin, H. Extended water level trends at long-record tide gauges via moving window averaging and implications for future coastal flooding. J. Geophys. Res. Oceans 2021, 126, e2021JC017730. [Google Scholar] [CrossRef]
- Devlin, A.T.; Jay, D.A.; Talke, S.A.; Zaron, E.D.; Pan, J.; Lin, H. Coupling of sea level and tidal range changes, with implications for future water levels. Sci. Rep. 2017, 7, 17021. [Google Scholar] [CrossRef] [PubMed]
- Devlin, A.T.; Pan, J.; Lin, H. Tidal variability in the Hong Kong region. Ocean Sci. 2019, 15, 853–864. [Google Scholar] [CrossRef] [Green Version]
- Woodworth, P.L. A survey of recent changes in the main components of the ocean tide. Cont. Shelf Res. 2010, 30, 1680–1691. [Google Scholar] [CrossRef] [Green Version]
- Mueller, M.; Arbic, B.K.; Mitrovica, J.X. Secular trends in ocean tides: Observations and model results. J. Geophys. Res. Oceans 2011, 116, C05013. [Google Scholar] [CrossRef] [Green Version]
- Haigh, I.D.; Wijeratne, E.M.S.; MacPherson, L.R.; Pattiaratchi, C.B.; Mason, M.S.; Crompton, R.P.; George, S. Estimating present day extreme water level exceedance probabilities around the coastline of Australia: Tides, extra-tropical storm surges and mean sea level. Clim. Dyn. 2014, 42, 121–138. [Google Scholar] [CrossRef]
- Ray, R.D. Secular changes of the M2 tide in the Gulf of Maine. Cont. Shelf Res. 2006, 26, 422–427. [Google Scholar] [CrossRef] [Green Version]
- Ray, R.D. Secular changes in the solar semidiurnal tide of the western North Atlantic Ocean. Geophys. Res. Lett. 2009, 36, L19601. [Google Scholar] [CrossRef] [Green Version]
- Feng, X.; Tsimplis, M.N. Sea level extremes at the coasts of China. J. Geophys. Res. Oceans 2014, 119, 1593–1608. [Google Scholar] [CrossRef] [Green Version]
- Feng, X.; Tsimplis, M.N.; Woodworth, P.L. Nodal variations and long-term changes in the main tides on the coasts of China. J. Geophys. Res. Oceans 2015, 120, 1215–1232. [Google Scholar] [CrossRef] [Green Version]
- Rasheed, A.S.; Chua, V.P. Secular trends in tidal parameters along the coast of Japan. Atmosphere-Ocean 2014, 52, 155–168. [Google Scholar] [CrossRef]
- Zaron, E.D.; Jay, D.A. An analysis of secular change in tides at open-ocean sites in the Pacific. J. Phys. Oceanogr. 2014, 44, 1704–1726. [Google Scholar] [CrossRef] [Green Version]
- Amin, M. On perturbations of harmonic constants in the Thames Estuary. Geophys. J. R. Astr. Soc. 1983, 73, 587–603. [Google Scholar] [CrossRef] [Green Version]
- Chernetsky, A.S.; Schuttelaars, H.M.; Talke, S.A. The effect of tidal asymmetry and temporal settling lag on sediment trapping in tidal estuaries. Ocean Dyn. 2010, 60, 1219–1241. [Google Scholar] [CrossRef] [Green Version]
- Jay, D.A.; Leffler, K.; Degens, S. Long-Term evolution of columbia river tides. J. Waterw. Port Coast. Ocean. Eng. 2011, 137, 182–191. [Google Scholar] [CrossRef]
- Vellinga, N.E.; Hoitink, A.J.F.; van der Vegt, M.; Zhang, W.; Hoekstra, P. Human impacts on tides overwhelm the effect of sea level rise on extreme water levels in the Rhine-Meuse delta. Coast. Eng. 2014, 90, 40–50. [Google Scholar] [CrossRef]
- Familkhalili, R.; Talke, S.A. The effect of channel deepening on tides and storm surge: A case study of Wilmington, NC. Geophys. Res. Lett. 2016, 43, 9138–9147. [Google Scholar] [CrossRef] [Green Version]
- Arbic, B.K.; Karsten, R.H.; Garrett, C. On Tidal Resonance in the Global Ocean and the Back-Effect of Coastal Tides upon Open-Ocean Tides. Atmosphere-Ocean 2009, 47, 239–266. [Google Scholar] [CrossRef]
- Skiba, A.W.; Zeng, L.; Arbic, B.K.; Mueller, M.; Godwin, W.J. On the resonance and shelf/open-ocean coupling of the global diurnal Tides. J. Phys. Oceanogr. 2013, 43, 1301–1324. [Google Scholar] [CrossRef] [Green Version]
- Colosi, J.A.; Munk, W. Tales of the venerable Honolulu tide gauge. J. Phys. Oceanogr. 2006, 36, 967–996. [Google Scholar] [CrossRef]
- Devlin, A.T.; Jay, D.A.; Talke, S.A.; Zaron, E. Can tidal perturbations associated with sea level variations in the western Pacific Ocean be used to understand future effects of tidal evolution? Ocean Dyn. 2014, 64, 1093–1120. [Google Scholar] [CrossRef] [Green Version]
- Devlin, A.T.; Pan, J.; Lin, H. Extended spectral analysis of tidal variability in the North Atlantic Ocean. J. Geophys. Res. Oceans 2019, 124, 506–526. [Google Scholar] [CrossRef]
- Devlin, A.T.; Pan, J.; Lin, H. Multi-Timescale analysis of tidal variability in the Indian Ocean using ensemble empirical mode decomposition. J. Geophys. Res. Oceans 2020, 125, e2020JC016604. [Google Scholar] [CrossRef]
- Guo, L.; Zhu, C.; Wu, X.; Wan, Y.; Jay, D.A.; Townend, I.; Wang, Z.B.; He, Q. Strong inland propagation of low-frequency long waves in river estuaries. Geophys. Res. Lett. 2020, 47, e2020GL089112. [Google Scholar] [CrossRef]
- Egbert, G.D.; Erofeeva, S.Y. Efficient inverse modeling of barotropic ocean tides. J. Atmos. Ocean. Technol. 2002, 19, 183–204. [Google Scholar] [CrossRef] [Green Version]
- Lumbroso, D.M.; Suckall, N.R.; Nicholls, R.J.; White, K.D. Enhancing resilience to coastal flooding from severe storms in the USA: International lessons. Nat. Hazards Earth Syst. Sci. 2017, 17, 1357–1373. [Google Scholar] [CrossRef] [Green Version]
- Walsh, K.J.; McBride, J.L.; Klotzbach, P.J.; Balachandran, S.; Camargo, S.J.; Holland, G.; Knutson, T.R.; Kossin, J.P.; Lee, T.c.; Sobel, A. Tropical cyclones and climate change. Wiley Interdiscip. Rev. Clim. Chang. 2016, 7, 65–89. [Google Scholar] [CrossRef]
- Balk, D.L.; Deichmann, U.; Yetman, G.; Pozzi, F.; Hay, S.I.; Nelson, A. Determining Global Population Distribution: Methods, Applications and Data. Adv. Parasitol. 2006, 62, 119–156. [Google Scholar] [CrossRef] [Green Version]
- Keim, B.D.; Muller, R.A.; Stone, G.W. Spatiotemporal patterns and return periods of tropical storm and hurricane strikes from Texas to Maine. J. Clim. 2007, 20, 3498–3509. [Google Scholar] [CrossRef]
- Chao, Q.; Chao, J. Statistical features of tropical cyclones affecting China and its key economic zones. Acta Meteorol. Sin. 2012, 26, 758–772. [Google Scholar] [CrossRef]
- Dokka, R.K.; Sella, G.F.; Dixon, T.H. Tectonic control of subsidence and southward displacement of southeast Louisiana with respect to stable North America. Geophys. Res. Lett. 2006, 33, L23308. [Google Scholar] [CrossRef] [Green Version]
- Blum, M.D.; Roberts, H.H. The Mississippi Delta Region: Past, Present, and Future. Annu. Rev. Earth Planet. Sci. 2012, 40, 655–683. [Google Scholar] [CrossRef]
- Blum, M.D.; Roberts, H.H. Drowning of the Mississippi Delta due to insufficient sediment supply and global sea-level rise. Nat. Geosci. 2009, 2, 488–491. [Google Scholar] [CrossRef]
- Couvillion, B.R.; Barras, J.A.; Steyer, G.D.; Sleavin, W.; Fischer, M.; Beck, H.; Trahan, N.; Griffin, B.; Heckman, D. Land Area Change in Coastal Louisiana from 1932 to 2010: U.S. Geological Survey Scientific Investigations Map 3164, scale 1:265,000, 12 p. pamphlet. 2011. Available online: https://pubs.usgs.gov/sim/3164/downloads/SIM3164_Pamphlet.pdf (accessed on 1 December 2021).
- Van der Wiel, K.; Kapnick, S.B.; Vecchi, G.A.; Smith, J.A.; Milly, P.C.D.; Jia, L. 100-Year lower Mississippi floods in a global climate model: Characteristics and future changes. J. Hydrometeorol. 2018, 19, 1547–1563. [Google Scholar] [CrossRef]
- Munoz, S.E.; Dee, S.G. El Nino increases the risk of lower Mississippi River flooding. Sci. Rep. 2017, 7, 1772. [Google Scholar] [CrossRef]
- Siverd, C.G.; Hagen, S.C.; Bilskie, M.V.; Braud, D.H.; Peele, R.H.; Foster-Martinez, M.R.; Twilley, R.R. Coastal Louisiana landscape and storm surge evolution: 1850–2110. Clim. Chang. 2019, 157, 445–468. [Google Scholar] [CrossRef]
- Carstens, D.; Amer, R. Spatio-temporal analysis of urban changes and surface water quality. J. Hydrol. 2019, 569, 720–734. [Google Scholar] [CrossRef]
- Carbognin, L.; Tosi, L. Interaction between climate changes, eustacy and land subsidence in the North Adriatic Region, Italy. Mar. Ecol.-Pubbl. Stn. Zool. Napoli 2002, 23, 38–50. [Google Scholar] [CrossRef]
- Fiaschi, S.; Fabris, M.; Floris, M.; Achilli, V. Estimation of land subsidence in deltaic areas through differential SAR interferometry: The Po River Delta case study (Northeast Italy). Int. J. Remote Sens. 2018, 39, 8724–8745. [Google Scholar] [CrossRef]
- Corbau, C.; Zambello, E.; Rodella, I.; Utizi, K.; Nardin, W.; Simeoni, U. Quantifying the impacts of the human activities on the evolution of Po delta It territory during the last 120 years. J. Environ. Manag. 2019, 232, 702–712. [Google Scholar] [CrossRef] [PubMed]
- Marchetti, M. Environmental changes in the central Po Plain (northern Italy) due to fluvial modifications and anthropogenic activities. Geomorphology 2002, 44, 361–373. [Google Scholar] [CrossRef]
- Erban, L.E.; Gorelick, S.M.; Zebker, H.A. Groundwater extraction, land subsidence, and sea-level rise in the Mekong Delta, Vietnam. Environ. Res. Lett. 2014, 9, 084010. [Google Scholar] [CrossRef]
- Song, Y.; Li, D.; Hou, X. Characteristics of mainland coastline changes in Southeast Asia during the 21st century. J. Coast. Res. 2020, 36, 261–275. [Google Scholar] [CrossRef]
- Hoang Huu, N.; Dargusch, P.; Moss, P.; Da Binh, T. A review of the drivers of 200 years of wetland degradation in the Mekong Delta of Vietnam. Reg. Environ. Chang. 2016, 16, 2303–2315. [Google Scholar] [CrossRef]
- LEE, S.K.; Dang, T.A. Extreme rainfall trends over the Mekong Delta under the impacts of climate change. Int. J. Clim. Change Strateg. Manag. 2020, 12, 639–652. [Google Scholar] [CrossRef]
- Leinenkugel, P.; Esch, T.; Kuenzer, C. Settlement detection and impervious surface estimation in the Mekong Delta using optical and SAR remote sensing data. Remote Sens. Environ. 2011, 115, 3007–3019. [Google Scholar] [CrossRef]
- Chen, L.; Ren, C.; Zhang, B.; Li, L.; Wang, Z.; Song, K. Spatiotemporal dynamics of coastal wetlands and reclamation in the Yangtze Estuary during past 50 years (1960s–2015). Chin. Geogr. Sci. 2018, 28, 386–399. [Google Scholar] [CrossRef] [Green Version]
- Xie, Z.; Du, Y.; Zeng, Y.; Miao, Q. Classification of yearly extreme precipitation events and associated flood risk in the Yangtze-Huaihe River Valley. Sci. China-Earth Sci. 2018, 61, 1341–1356. [Google Scholar] [CrossRef]
- Shi, X.; Han, Z.; Fang, J.; Tan, J.; Guo, Z.; Sun, Z. Assessment and zonation of storm surge hazards in the coastal areas of China. Nat. Hazards 2020, 100, 39–48. [Google Scholar] [CrossRef]
- Ma, P.; Wang, W.; Zhang, B.; Wang, J.; Shi, G.; Huang, G.; Chen, F.; Jiang, L.; Lin, H. Remotely sensing large- and small-scale ground subsidence: A case study of the Guangdong-Hong Kong-Macao Greater Bay Area of China. Remote Sens. Environ. 2019, 232, 111282. [Google Scholar] [CrossRef]
- Zhang, Q.; Gu, X.; Singh, V.P.; Shi, P.; Sun, P. More frequent flooding? Changes in flood frequency in the Pearl River basin, China, since 1951 and over the past 1000 years. Hydrol. Earth Syst. Sci. 2018, 22, 2637–2653. [Google Scholar] [CrossRef] [Green Version]
- Chu, Z. The dramatic changes and anthropogenic causes of erosion and deposition in the lower Yellow (Huanghe) River since 1952. Geomorphology 2014, 216, 171–179. [Google Scholar] [CrossRef]
- Zhao, Y.M. Forestry Development and Natural Conservation of Yellow River Delta; China Forestry Press: Beijing, China, 1997. [Google Scholar]
- Erwin, K.L. Wetlands and global climate change: The role of wetland restoration in a changing world. Wetl. Ecol. Manag. 2009, 17, 71–84. [Google Scholar] [CrossRef]
- McGranahan, G.; Balk, D.; Anderson, B. The rising tide: Assessing the risks of climate change and human settlements in low elevation coastal zones. Environ. Urban. 2007, 19, 17–37. [Google Scholar] [CrossRef]
- Yafeng, S.; Jiwen, Z.; Zhiren, X.; Zixiu, J.; Zixun, J.; Guishan, Y. Prediction and prevention of the impacts of sea level rise on the Yangtze River Delta and its adjacent areas. Sci. China Ser. D Earth Sci. 2000, 43, 412–422. [Google Scholar] [CrossRef]
- Hoitink, A.J.F.; Jay, D.A. Tidal river dynamics: Implications for deltas. Rev. Geophys. 2016, 54, 240–272. [Google Scholar] [CrossRef]
- Ge, Y.; Xu, W.; Gu, Z.-H.; Zhang, Y.-C.; Chen, L. Risk perception and hazard mitigation in the Yangtze River Delta region, China. Nat. Hazards 2011, 56, 633–648. [Google Scholar] [CrossRef]
- Liu, B.; Siu, Y.L.; Mitchell, G.; Xu, W. Exceedance probability of multiple natural hazards: Risk assessment in China’s Yangtze River Delta. Nat. Hazards 2013, 69, 2039–2055. [Google Scholar] [CrossRef]
- Luan, H.L.; Ding, P.X.; Wang, Z.B.; Ge, J.Z.; Yang, S.L. Decadal morphological evolution of the Yangtze Estuary in response to river input changes and estuarine engineering projects. Geomorphology 2016, 265, 12–23. [Google Scholar] [CrossRef]
- Wei, W.; Mei, X.; Dai, Z.; Tang, Z. Recent morphodynamic evolution of the largest uninhibited island in the Yangtze (Changjiang) estuary during 1998–2014: Influence of the anthropogenic interference. Cont. Shelf Res. 2016, 124, 83–94. [Google Scholar] [CrossRef] [Green Version]
- Dong, S.; Samsonov, S.; Yin, H.; Ye, S.; Cao, Y. Time-series analysis of subsidence associated with rapid urbanization in Shanghai, China measured with SBAS InSAR method. Environ. Earth Sci. 2014, 72, 677–691. [Google Scholar] [CrossRef]
- Shen, S. Geological environmental character of Lin-Gang new city and its influences to the construction (In Chinese with English abstract). Shanghai Geol. 2008, 105, 24–28. [Google Scholar]
- Dong, S.; Samsonov, S.; Yin, H.; Huang, L. Two-Dimensional ground deformation monitoring in Shanghai based on SBAS and MSBAS InSAR methods. J. Earth Sci. 2018, 29, 960–968. [Google Scholar] [CrossRef]
- Pepe, A.; Bonano, M.; Zhao, Q.; Yang, T.; Wang, H. The Use of C-/X-Band Time-Gapped SAR Data and Geotechnical Models for the Study of Shanghai’s Ocean-Reclaimed Lands through the SBAS-DInSAR Technique. Remote Sens. 2016, 8, 911. [Google Scholar] [CrossRef] [Green Version]
- Yang, M.; Yang, T.; Zhang, L.; Lin, J.; Qin, X.; Liao, M. Spatio-Temporal characterization of a reclamation settlement in the Shanghai coastal area with time series analyses of X-, C-, and L-Band SAR datasets. Remote Sens. 2018, 10, 329. [Google Scholar] [CrossRef] [Green Version]
- Yu, Q.; Wang, Q.; Yan, X.; Yang, T.; Song, S.; Yao, M.; Zhou, K.; Huang, X. Ground deformation of the Chongming East Shoal Reclamation Area in Shanghai based on SBAS-InSAR and laboratory tests. Remote Sens. 2020, 12, 1016. [Google Scholar] [CrossRef] [Green Version]
- Wang, J.; Yi, S.; Li, M.; Wang, L.; Song, C. Effects of sea level rise, land subsidence, bathymetric change and typhoon tracks on storm flooding in the coastal areas of Shanghai. Sci. Total Environ. 2018, 621, 228–234. [Google Scholar] [CrossRef]
- Yang, S.L.; Xu, K.H.; Milliman, J.D.; Yang, H.F.; Wu, C.S. Decline of Yangtze River water and sediment discharge: Impact from natural and anthropogenic changes. Sci. Rep. 2015, 5, 12581. [Google Scholar] [CrossRef]
- Tian, B.; Zhang, L.; Wang, X.; Zhou, Y.; Zhang, W. Forecasting the effects of sea-level rise at Chongming Dongtan Nature Reserve in the Yangtze Delta, Shanghai, China. Ecol. Eng. 2010, 36, 1383–1388. [Google Scholar] [CrossRef]
- Li, C.X.; Fan, D.D.; Deng, B.; Korotaev, V. The coasts of China and issues of sea level rise. J. Coast. Res. 2004, 43, 36–49. [Google Scholar]
- Weng, Q. Land use change analysis in the Zhujiang Delta of China using satellite remote sensing, GIS and stochastic modelling. J. Environ. Manag. 2002, 64, 273–284. [Google Scholar] [CrossRef] [PubMed] [Green Version]
- Kang, L.; Ma, L.; Liu, Y. Evaluation of farmland losses from sea level rise and storm surges in the Pearl River Delta region under global climate change. J. Geogr. Sci. 2016, 26, 439–456. [Google Scholar] [CrossRef] [Green Version]
- Yang, L.; Scheffran, J.; Qin, H.; You, Q. Climate-related flood risks and urban responses in the Pearl River Delta, China. Reg. Environ. Chang. 2015, 15, 379–391. [Google Scholar] [CrossRef]
- Wang, X.; Wang, X.; Zhai, J.; Li, X.; Huang, H.; Li, C.; Zheng, J.; Sun, H. Improvement to flooding risk assessment of storm surges by residual interpolation in the coastal areas of Guangdong Province, China. Quat. Int. 2017, 453, 1–14. [Google Scholar] [CrossRef]
- Yu, Q.; Lau, A.K.H.; Tsang, K.T.; Fung, J.C.H. Human damage assessments of coastal flooding for Hong Kong and the Pearl River Delta due to climate change-related sea level rise in the twenty-first century. Nat. Hazards 2018, 92, 1011–1038. [Google Scholar] [CrossRef]
- Zhang, J.; Chen, Y. Risk assessment of flood disaster induced by typhoon rainstorms in Guangdong Province, China. Sustainability 2019, 11, 2738. [Google Scholar] [CrossRef] [Green Version]
- Wang, H.; Feng, G.; Xu, B.; Yu, Y.; Li, Z.; Du, Y.; Zhu, J. Deriving spatio-temporal development of ground subsidence due to subway construction and operation in delta regions with PS-InSAR data: A case study in Guangzhou, China. Remote Sens. 2017, 9, 1004. [Google Scholar] [CrossRef] [Green Version]
- Zhao, Q.; Lin, H.; Jiang, L.; Chen, F.; Cheng, S. A study of ground deformation in the Guangzhou urban area with persistent scatterer interferometry. Sensors 2009, 9, 503–518. [Google Scholar] [CrossRef]
- Jiang, L.; Lin, H.; Cheng, S. Monitoring and assessing reclamation settlement in coastal areas with advanced InSAR techniques: Macao city (China) case study. Int. J. Remote Sens. 2011, 32, 3565–3588. [Google Scholar] [CrossRef]
- Zhao, Q.; Lin, H.; Gao, W.; Zebker, H.A.; Chen, A.; Yeung, K. InSAR detection of residual settlement of an ocean reclamation engineering project: A case study of Hong Kong International Airport. J. Oceanogr. 2011, 67, 415–426. [Google Scholar] [CrossRef]
- Xia, J.; Yan, Z.; Zhou, W.; Fong, S.K.; Leong, K.C.; Tang, I.M.; Chang, S.W.; Leong, W.K.; Jin, S. Projection of the Zhujiang (Pearl) River Delta’s potential submerged area due to sea level rise during the 21st century based on CMIP5 simulations. Acta Oceanol. Sin. 2015, 34, 78–84. [Google Scholar] [CrossRef]
- Huang, Z.G.; Zong, Y.Q.; Zhang, W.Q. Coastal inundation due to sea level rise in the Pearl River Delta, China. Nat. Hazards 2004, 33, 247–264. [Google Scholar] [CrossRef] [Green Version]
- Zhang, W.; Yan, Y.; Zheng, J.; Li, L.; Dong, X.; Cai, H. Temporal and spatial variability of annual extreme water level in the Pearl River Delta region, China. Glob. Planet. Chang. 2009, 69, 35–47. [Google Scholar] [CrossRef]
- Kong, D.; Miao, C.; Borthwick, A.G.L.; Duan, Q.; Liu, H.; Sun, Q.; Ye, A.; Di, Z.; Gong, W. Evolution of the Yellow River Delta and its relationship with runoff and sediment load from 1983 to 2011. J. Hydrol. 2015, 520, 157–167. [Google Scholar] [CrossRef] [Green Version]
- Nguyen, T.T.X.; Woodroffe, C.D. Assessing relative vulnerability to sea-level rise in the western part of the Mekong River Delta in Vietnam. Sustain. Sci. 2016, 11, 645–659. [Google Scholar] [CrossRef]
- Arias, M.E.; Cochrane, T.A.; Kummu, M.; Lauri, H.; Holtgrieve, G.W.; Koponen, J.; Piman, T. Impacts of hydropower and climate change on drivers of ecological productivity of Southeast Asia’s most important wetland. Ecol. Model. 2014, 272, 252–263. [Google Scholar] [CrossRef]
- Chea, R.; Grenouillet, G.; Lek, S. Evidence of water quality degradation in lower Mekong Basin revealed by self-organizing map. PLoS ONE 2016, 11, e0145527. [Google Scholar] [CrossRef] [Green Version]
- Dang, T.D.; Cochrane, T.A.; Arias, M.E.; Van, P.D.T.; de Vries, T.T. Hydrological alterations from water infrastructure development in the Mekong floodplains. Hydrol. Process. 2016, 30, 3824–3838. [Google Scholar] [CrossRef]
- Dang, T.D.; Cochrane, T.A.; Arias, M.E. Quantifying suspended sediment dynamics in mega deltas using remote sensing data: A case study of the Mekong floodplains. Int. J. Appl. Earth Obs. Geoinf. 2018, 68, 105–115. [Google Scholar] [CrossRef]
- Bhuiyan, M.J.A.N.; Dutta, D. Assessing impacts of sea level rise on river salinity in the Gorai river network, Bangladesh. Estuar. Coast. Shelf Sci. 2012, 96, 219–227. [Google Scholar] [CrossRef]
- Carbognin, L.; Teatini, P.; Tosi, L.; Strozzi, T.; Tomasin, A. Present Relative Sea Level Rise in the Northern Adriatic Coastal Area. In Coastal and Marine Spatial Planning; Brugnoli, E., Cavarretta, G., Mazzola, S., Trincardi, F., Ravaioli, M., Santoleri, R., Eds.; CNR—Dipartimento Scienze del Sistema Terra e Tecnologie: Roma, Italy, 2011; pp. 1147–1162. [Google Scholar]
- Tosi, L.; Da Lio, C.; Strozzi, T.; Teatini, P. Combining L- and X-Band SAR Interferometry to Assess Ground Displacements in Heterogeneous Coastal Environments: The Po River Delta and Venice Lagoon, Italy. Remote Sens. 2016, 8, 308. [Google Scholar] [CrossRef] [Green Version]
- Antonioli, F.; Anzidei, M.; Amorosi, A.; Lo Presti, V.; Mastronuzzi, G.; Deiana, G.; De Falco, G.; Fontana, A.; Fontolan, G.; Lisco, S.; et al. Sea-level rise and potential drowning of the Italian coastal plains: Flooding risk scenarios for 2100. Quat. Sci. Rev. 2017, 158, 29–43. [Google Scholar] [CrossRef] [Green Version]
- Bondesanf, M.; Castiglioni, G.; Elmis, C.; Gabbianellis, G.; Marocco, R.; Pirazzolift, P.; Tomasin, A. Coastal areas at risk from storm surges and sea-level rise in northeastern Italy. J. Coast. Res. 1995, 11, 1354–1379. [Google Scholar]
- Zanchettin, D.; Traverso, P.; Tomasino, M. Observations on future sea level changes in the Venice lagoon. Hydrobiologia 2007, 577, 41–53. [Google Scholar] [CrossRef]
- Da Lio, C.; Tosi, L. Vulnerability to relative sea-level rise in the Po river delta (Italy). Estuar. Coast. Shelf Sci. 2019, 228, 106379. [Google Scholar] [CrossRef]
- Cavaleri, L.; Bajo, M.; Barbariol, F.; Bastianini, M.; Benetazzo, A.; Bertotti, L.; Chiggiato, J.; Ferrarin, C.; Trincardi, F.; Umgiesser, G.; et al. The 2019 flooding of Venice and its implications for future predictions. Oceanography 2020, 33, 42–49. [Google Scholar] [CrossRef] [Green Version]
- Niroumand-Jadidi, M.; Bovolo, F.; Bruzzone, L.; Gege, P. Physics-based Bathymetry and water quality retrieval using planetscope imagery: Impacts of 2020 COVID-19 lockdown and 2019 extreme flood in the Venice Lagoon. Remote Sens. 2020, 12, 2381. [Google Scholar] [CrossRef]
- Popov, S.K.; Lobov, A.L. Hydrodynamic modeling of floods in Saint Petersburg considering the operating dam. Russ. Meteorol. Hydrol. 2017, 42, 267–274. [Google Scholar] [CrossRef]
- Karatygin, P. Chronicle of Petersburg Floods 1703–1879; Publiching House of Suvorin: St. Petersburg, Russia, 1888. [Google Scholar]
- Lavrov, L.; Sementsov, S. Flood risk in Saint Petersburg, Russia: History and modern times. Proc. Inst. Civ. Eng.-Civ. Eng. 2015, 168, 3–16. [Google Scholar] [CrossRef]
- Shirshova, V. The experience of monitoring the land subsidence in urban areas by radar satellite interferometry on the example of St. Petersburg. Geod. Aerophotosurveying 2020, 64, 399–408. [Google Scholar] [CrossRef]
- Frihy, O.E. Some proposals for coastal management of the Nile delta coast. Ocean Coast. Manag. 1996, 30, 43–59. [Google Scholar] [CrossRef]
- Frihy, O.E.; Dewidar, K.M.; Nasr, S.M.; El Raey, M.M. Change detection of the northeastern Nile delta of Egypt: Shoreline changes, Spit evolution, margin changes of Manzala lagoon and its islands. Int. J. Remote Sens. 1998, 19, 1901–1912. [Google Scholar] [CrossRef]
- Saleh, M.; Becker, M. New estimation of Nile Delta subsidence rates from InSAR and GPS analysis. Environ. Earth Sci. 2018, 78, 6. [Google Scholar] [CrossRef]
- Aly, M.H.; Giardino, J.R.; Klein, A.G.; Zebker, H.A. InSAR study of shoreline change along the Damietta Promontory, Egypt. J. Coast. Res. 2012, 28, 1263–1269. [Google Scholar] [CrossRef]
- Milliman, J.D.; Meade, R.H. World-wide delivery of river sediment to the oceans. J. Geol. 1983, 91, 1–21. [Google Scholar] [CrossRef]
- Jervey, M. Quantitative Geological Modeling of Siliciclastic Rock Sequences and Their Seismic Expression; GeoScienceWorld: McLean, VA, USA, 1988. [Google Scholar] [CrossRef]
- Gagliano, S.M.; Meyer-Arendt, K.J.; Wicker, K.M. Land loss in the Mississippi River deltaic plain. GCAGS Trans. 1981, 31, 295–300. [Google Scholar]
- Britsch, L.D.; Dunbar, J.B. Land Loss Rates: Louisiana Coastal Plain. J. Coast. Res. 1993, 9, 324–338. [Google Scholar]
- Barras, J.A.; Bernier, J.C.; Morton, R.A. Land Area Change in Coastal Louisiana, a Multidecadal Perspective (from 1956 to 2006); U.S. Geological Survey Scientific Investigations Map 3019, scale 1:250,000, 14 p. pamphlet; U.S. Geological Survey: Reston, VA, USA, 2008.
- Morton, R.A.; Bernier, J.C.; Kelso, K.W.; Barras, J.A. Quantifying large-scale historical formation of accommodation in the Mississippi Delta. Earth Surf. Process. Landf. 2010, 35, 1625–1641. [Google Scholar] [CrossRef]
- Walker, N.D.; Wiseman, W.J.; Rouse, L.J.; Babin, A. Effects of river discharge, wind stress, and slope eddies on circulation and the satellite-observed structure of the Mississippi River plume. J. Coast. Res. 2005, 21, 1228–1244. [Google Scholar] [CrossRef]
- Allen, Y.C.; Couvillion, B.R.; Barras, J.A. Using multitemporal remote sensing imagery and inundation measures to improve land change sstimates in coastal wetlands. Estuaries Coasts 2012, 35, 190–200. [Google Scholar] [CrossRef]
- Jung, H.C.; Jasinski, M.; Kim, J.-W.; Shum, C.K.; Bates, P.; Neal, J.; Lee, H.; Alsdorf, D. Calibration of two-dimensional floodplain modeling in the central Atchafalaya Basin Floodway System using SAR interferometry. Water Resour. Res. 2012, 48, W07511. [Google Scholar] [CrossRef] [Green Version]
- Kolker, A.S.; Li, C.; Walker, N.D.; Pilley, C.; Ameen, A.D.; Boxer, G.; Ramatchandirane, C.; Ullah, M.; Williams, K.A. The impacts of the great Mississippi/Atchafalaya River flood on the oceanography of the Atchafalaya Shelf. Cont. Shelf Res. 2014, 86, 17–33. [Google Scholar] [CrossRef]
- Sun, S.; Hu, C.; Garcia-Pineda, O.; Kourafalou, V.; Le Henaff, M.; Androulidakis, Y. Remote sensing assessment of oil spills near a damaged platform in the Gulf of Mexico. Mar. Pollut. Bull. 2018, 136, 141–151. [Google Scholar] [CrossRef]
- Richey, J.E.; Mertes, L.A.; Dunne, T.; Victoria, R.L.; Forsberg, B.R.; Tancredi, A.C.; Oliveira, E. Sources and routing of the Amazon River flood wave. Glob. Biogeochem. Cycles 1989, 3, 191–204. [Google Scholar] [CrossRef]
- Dunne, T.; Mertes, L.A.K.; Meade, R.H.; Richey, J.E.; Forsberg, B.R. Exchanges of sediment between the flood plain and channel of the Amazon River in Brazil. Geol. Soc. Am. Bull. 1998, 110, 450–467. [Google Scholar] [CrossRef]
- Wilson, M.; Bates, P.; Alsdorf, D.; Forsberg, B.; Horritt, M.; Melack, J.; Frappart, F.; Famiglietti, J. Modeling large-scale inundation of Amazonian seasonally flooded wetlands. Geophys. Res. Lett. 2007, 34, L15404. [Google Scholar] [CrossRef] [Green Version]
- Alsdorf, D.; Han, S.-C.; Bates, P.; Melack, J. Seasonal water storage on the Amazon floodplain measured from satellites. Remote Sens. Environ. 2010, 114, 2448–2456. [Google Scholar] [CrossRef]
- Mertes, L.A.; Daniel, D.L.; Melack, J.M.; Nelson, B.; Martinelli, L.A.; Forsberg, B.R. Spatial patterns of hydrology, geomorphology, and vegetation on the floodplain of the Amazon River in Brazil from a remote sensing perspective. Geomorphology 1995, 13, 215–232. [Google Scholar] [CrossRef]
- Trigg, M.A.; Wilson, M.D.; Bates, P.D.; Horritt, M.S.; Alsdorf, D.E.; Forsberg, B.R.; Vega, M.C. Amazon flood wave hydraulics. J. Hydrol. 2009, 374, 92–105. [Google Scholar] [CrossRef]
- Park, E.; Latrubesse, E.M. The hydro-geomorphologic complexity of the lower Amazon River floodplain and hydrological connectivity assessed by remote sensing and field control. Remote Sens. Environ. 2017, 198, 321–332. [Google Scholar] [CrossRef]
- Collischonn, B.; Collischonn, W.; Tucci, C.E.M. Daily hydrological modeling in the Amazon basin using TRMM rainfall estimates. J. Hydrol. 2008, 360, 207–216. [Google Scholar] [CrossRef]
- Peixoto, J.M.A.; Nelson, B.W.; Wittmann, F. Spatial and temporal dynamics of river channel migration and vegetation in central Amazonian white-water floodplains by remote-sensing techniques. Remote Sens. Environ. 2009, 113, 2258–2266. [Google Scholar] [CrossRef]
- Azarderakhsh, M.; Rossow, W.B.; Papa, F.; Norouzi, H.; Khanbilvardi, R. Diagnosing water variations within the Amazon basin using satellite data. J. Geophys. Res. Atmos. 2011, 116, D24107. [Google Scholar] [CrossRef] [Green Version]
- Cao, M.K.; Marshall, S.; Gregson, K. Global carbon exchange and methane emissions from natural wetlands: Application of a process-based model. J. Geophys. Res. Atmos. 1996, 101, 14399–14414. [Google Scholar] [CrossRef] [Green Version]
- Granberg, G.; Mikkela, C.; Sundh, I.; Svensson, B.H.; Nilsson, M. Sources of spatial variation in methane emission from mires in northern Sweden: A mechanistic approach in statistical modeling. Glob. Biogeochem. Cycles 1997, 11, 135–150. [Google Scholar] [CrossRef]
- Potter, C.S. An ecosystem simulation model for methane production and emission from wetlands. Glob. Biogeochem. Cycles 1997, 11, 495–506. [Google Scholar] [CrossRef]
- Walter, B.P.; Heimann, M. A process-based, climate-sensitive model to derive methane emissions from natural wetlands: Application to five wetland sites, sensitivity to model parameters, and climate. Glob. Biogeochem. Cycles 2000, 14, 745–765. [Google Scholar] [CrossRef] [Green Version]
- Bartlett, K.B.; Crill, P.M.; Sebacher, D.I.; Harriss, R.C.; Wilson, J.O.; Melack, J.M. Methane flux from the central Amazonian floodplain. J. Geophys. Res. 1988, 93, 1571–1582. [Google Scholar] [CrossRef]
- Melack, J.M.; Hess, L.L.; Gastil, M.; Forsberg, B.R.; Hamilton, S.K.; Lima, I.B.T.; Novo, E. Regionalization of methane emissions in the Amazon Basin with microwave remote sensing. Glob. Change Biol. 2004, 10, 530–544. [Google Scholar] [CrossRef]
- Frappart, F.; Seyler, F.; Martinez, J.M.; Leon, J.G.; Cazenave, A. Floodplain water storage in the Negro River basin estimated from microwave remote sensing of inundation area and water levels. Remote Sens. Environ. 2005, 99, 387–399. [Google Scholar] [CrossRef] [Green Version]
- Bourrel, L.; Phillips, L.; Moreau, S. The dynamics of floods in the Bolivian Amazon Basin. Hydrol. Process. 2009, 23, 3161–3167. [Google Scholar] [CrossRef]
- Hess, L.L.; Melack, J.M.; Affonso, A.G.; Barbosa, C.; Gastil-Buhl, M.; Novo, E.M.L.M. Wetlands of the lowland Amazon Basin: Extent, vegetative cover, and dual-season inundated area as mapped with JERS-1 synthetic aperture radar. Wetlands 2015, 35, 745–756. [Google Scholar] [CrossRef]
- Kandus, P.; Gail Minotti, P.; Soledad Morandeira, N.; Grimson, R.; Gonzalez Trilla, G.; Belen Gonzalez, E.; San Martin, L.; Patricia Gayol, M. Remote sensing of wetlands in South America: Status and challenges. Int. J. Remote Sens. 2018, 39, 993–1016. [Google Scholar] [CrossRef]
- Jenson, S.K.; Domingue, J.O. Extracting Topographic Structure from Digital Elevation Data for Geographic Information-System Analysis. Photogramm. Eng. Remote Sens. 1988, 54, 1593–1600. [Google Scholar]
- Brauer, M.; Hoek, G.; van Vliet, P.; Meliefste, K.; Fischer, P.; Gehring, U.; Heinrich, J.; Cyrys, J.; Bellander, T.; Lewne, M.; et al. Estimating long-term average particulate air pollution concentrations: Application of traffic indicators and geographic information systems. Epidemiology 2003, 14, 228–239. [Google Scholar] [CrossRef] [PubMed]
- Sieber, R. Public Participation Geographic Information Systems: A Literature Review and Framework. Ann. Assoc. Am. Geogr. 2006, 96, 491–507. [Google Scholar] [CrossRef]


Publisher’s Note: MDPI stays neutral with regard to jurisdictional claims in published maps and institutional affiliations. |
© 2022 by the authors. Licensee MDPI, Basel, Switzerland. This article is an open access article distributed under the terms and conditions of the Creative Commons Attribution (CC BY) license (https://creativecommons.org/licenses/by/4.0/).
Share and Cite
Zhao, Q.; Pan, J.; Devlin, A.T.; Tang, M.; Yao, C.; Zamparelli, V.; Falabella, F.; Pepe, A. On the Exploitation of Remote Sensing Technologies for the Monitoring of Coastal and River Delta Regions. Remote Sens. 2022, 14, 2384. https://doi.org/10.3390/rs14102384
Zhao Q, Pan J, Devlin AT, Tang M, Yao C, Zamparelli V, Falabella F, Pepe A. On the Exploitation of Remote Sensing Technologies for the Monitoring of Coastal and River Delta Regions. Remote Sensing. 2022; 14(10):2384. https://doi.org/10.3390/rs14102384
Chicago/Turabian StyleZhao, Qing, Jiayi Pan, Adam Thomas Devlin, Maochuan Tang, Chengfang Yao, Virginia Zamparelli, Francesco Falabella, and Antonio Pepe. 2022. "On the Exploitation of Remote Sensing Technologies for the Monitoring of Coastal and River Delta Regions" Remote Sensing 14, no. 10: 2384. https://doi.org/10.3390/rs14102384