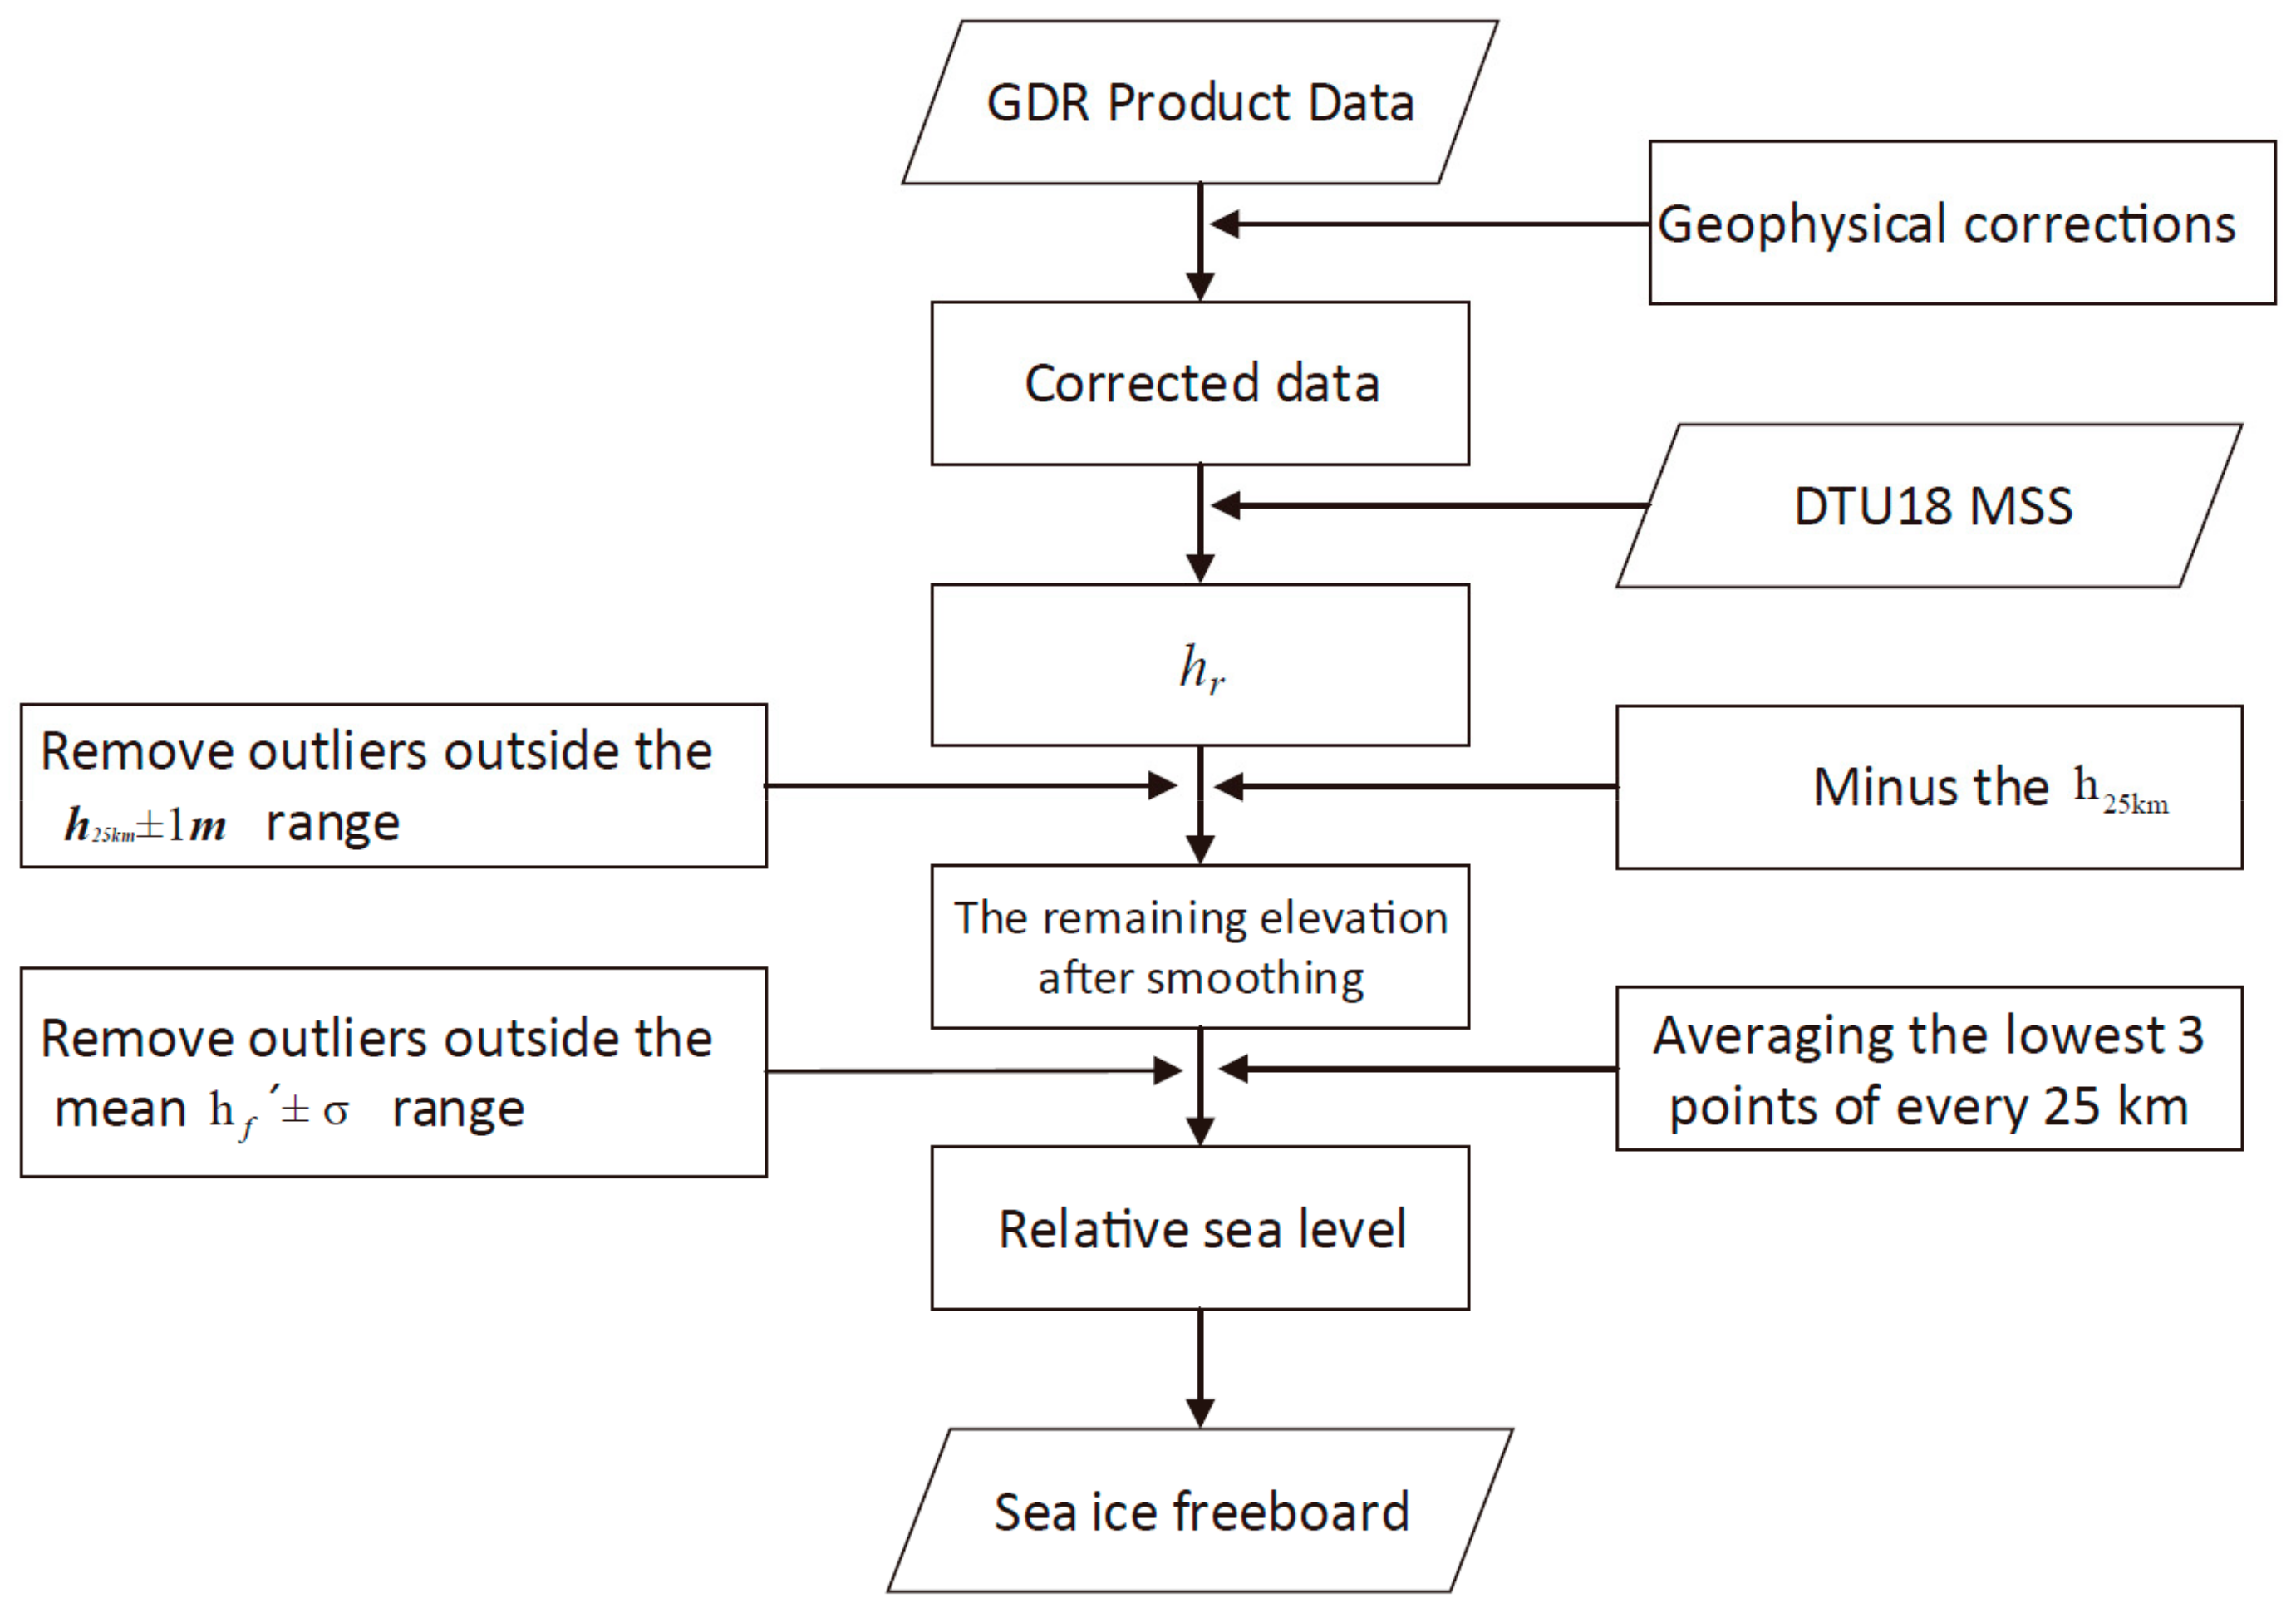
Figure 1.
A flowchart of the freeboard retrieval algorithm.
Figure 1.
A flowchart of the freeboard retrieval algorithm.
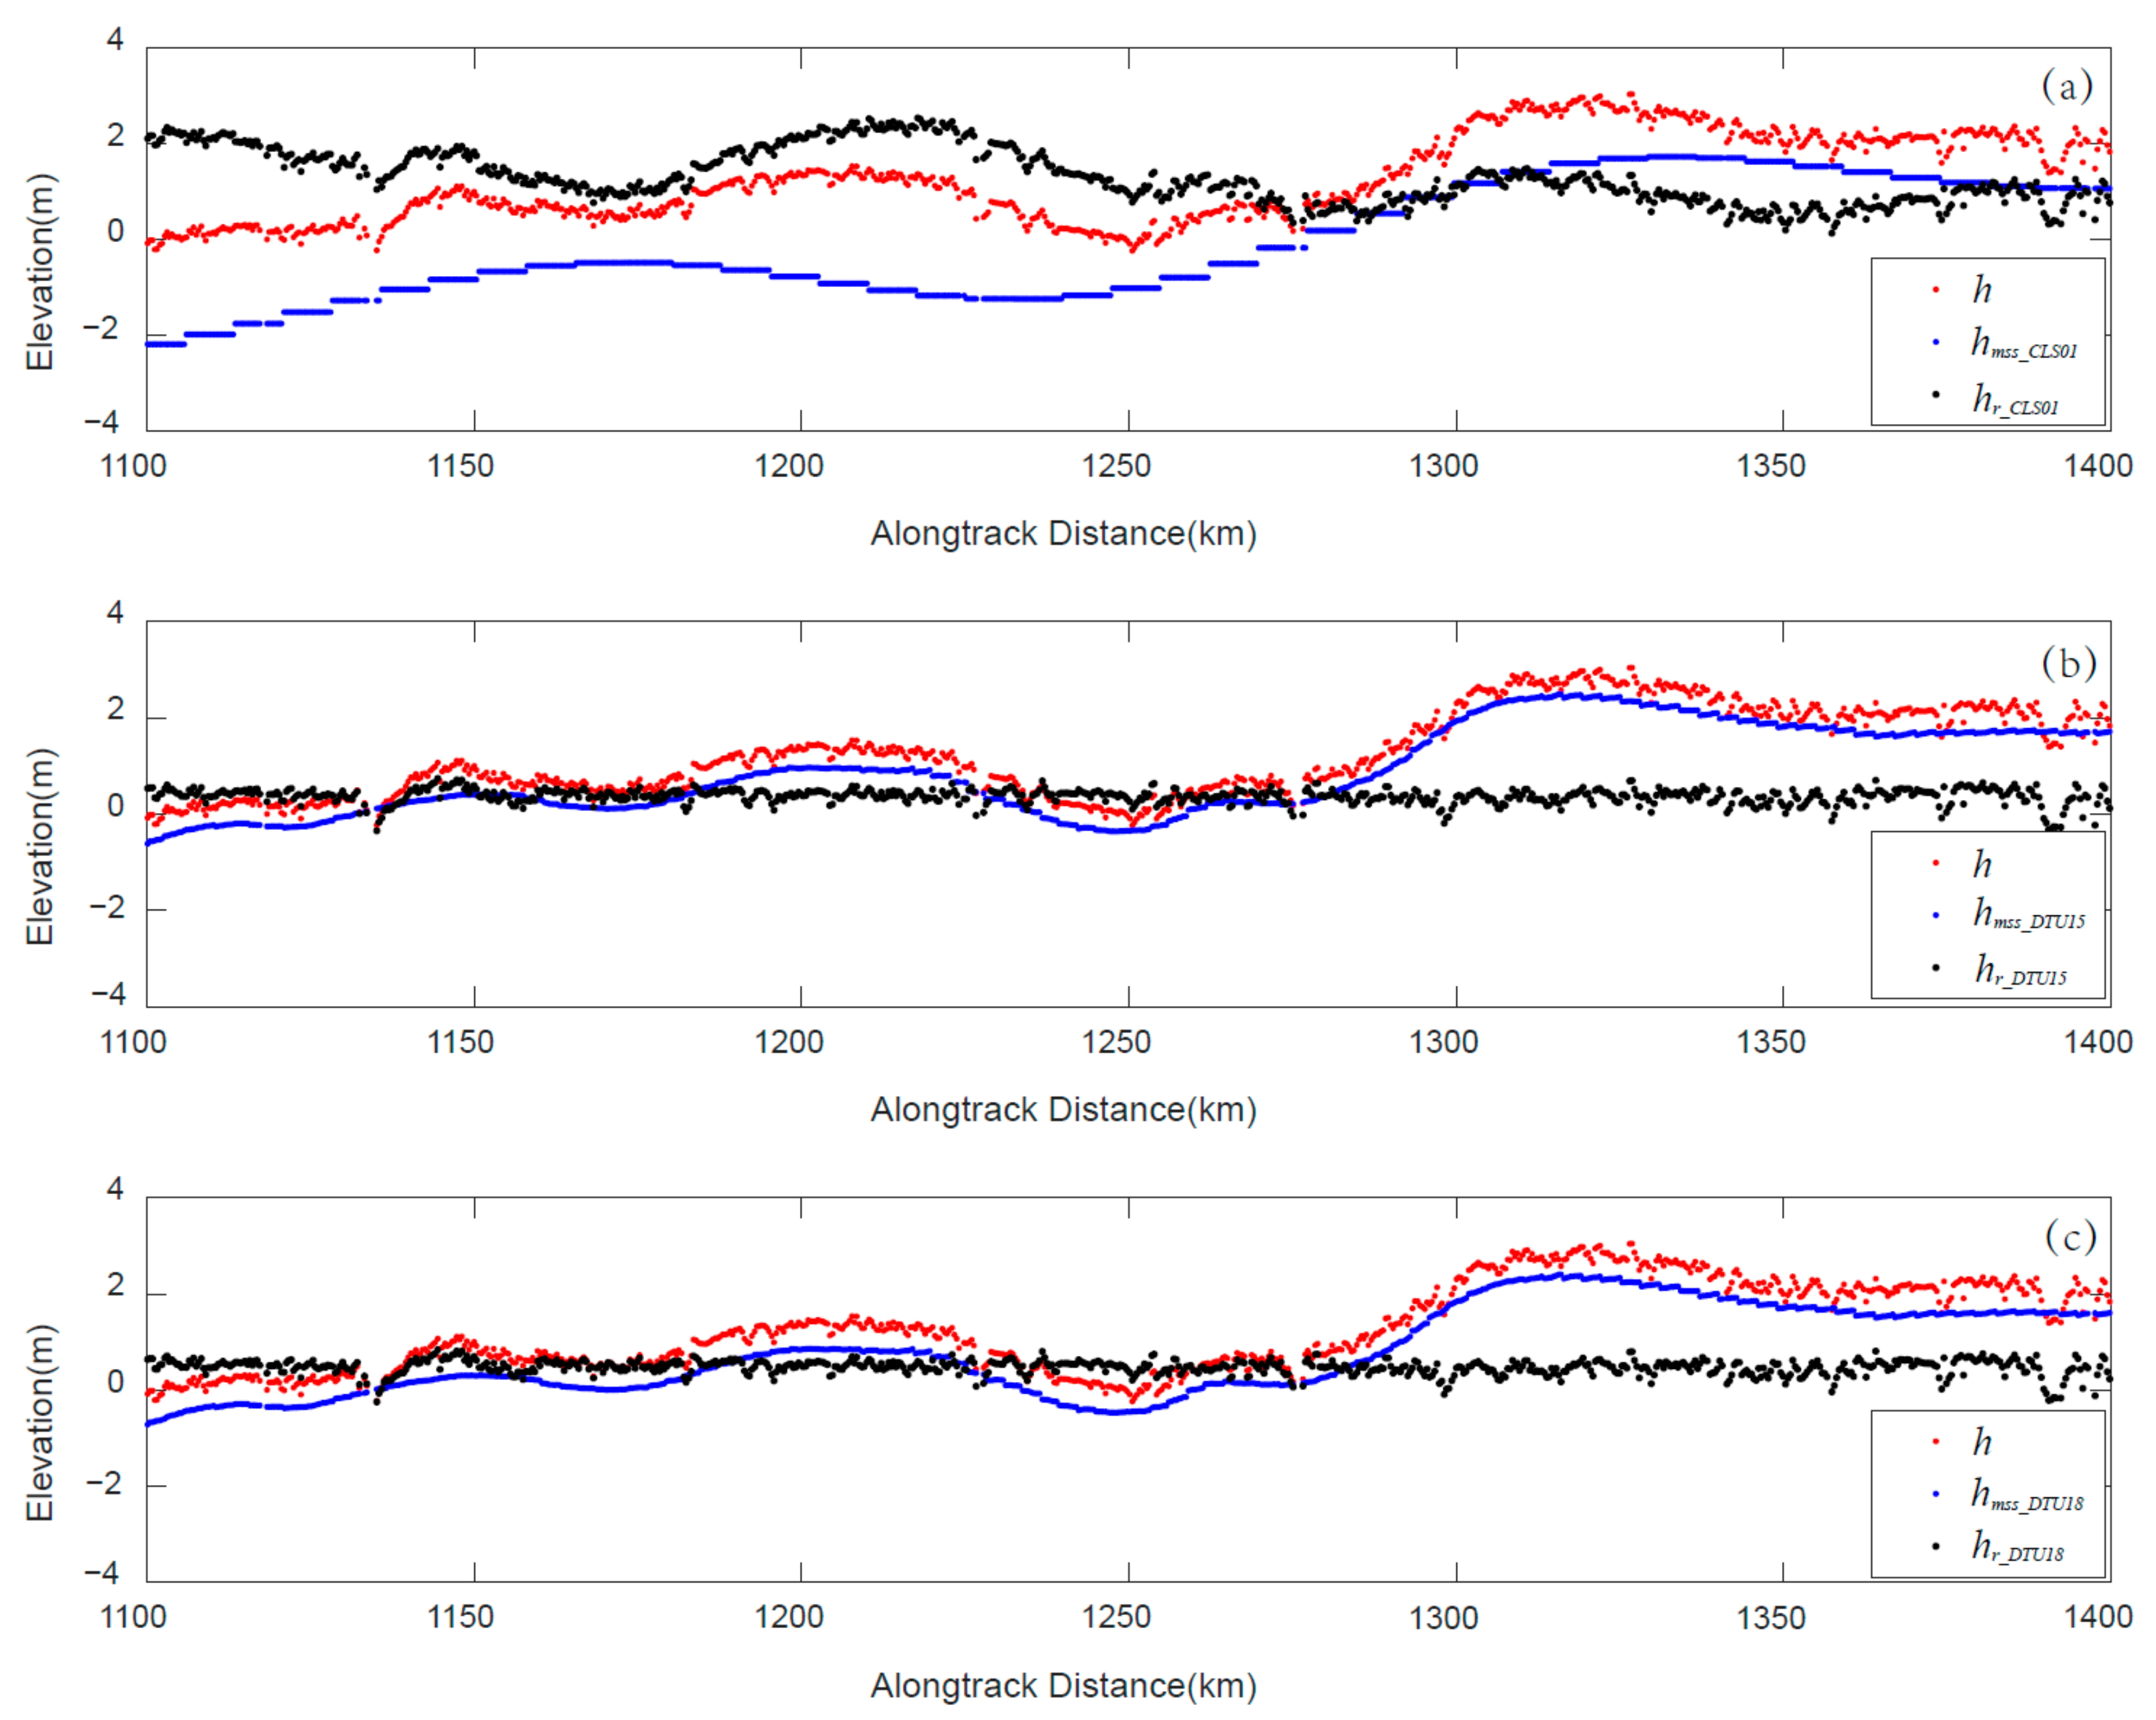
Figure 2.
A sample of Envisat elevation profiles over the Arctic Ocean. The red points in (a–c) represent the reference elevation to the WGS84 ellipsoid. The blue points in (a–c) represent the mean sea surface height from CLS01, DTU15 and DTU18, respectively. The black points in (a–c) represent the relative elevations with CLS01, DTU15 and DTU18, respectively.
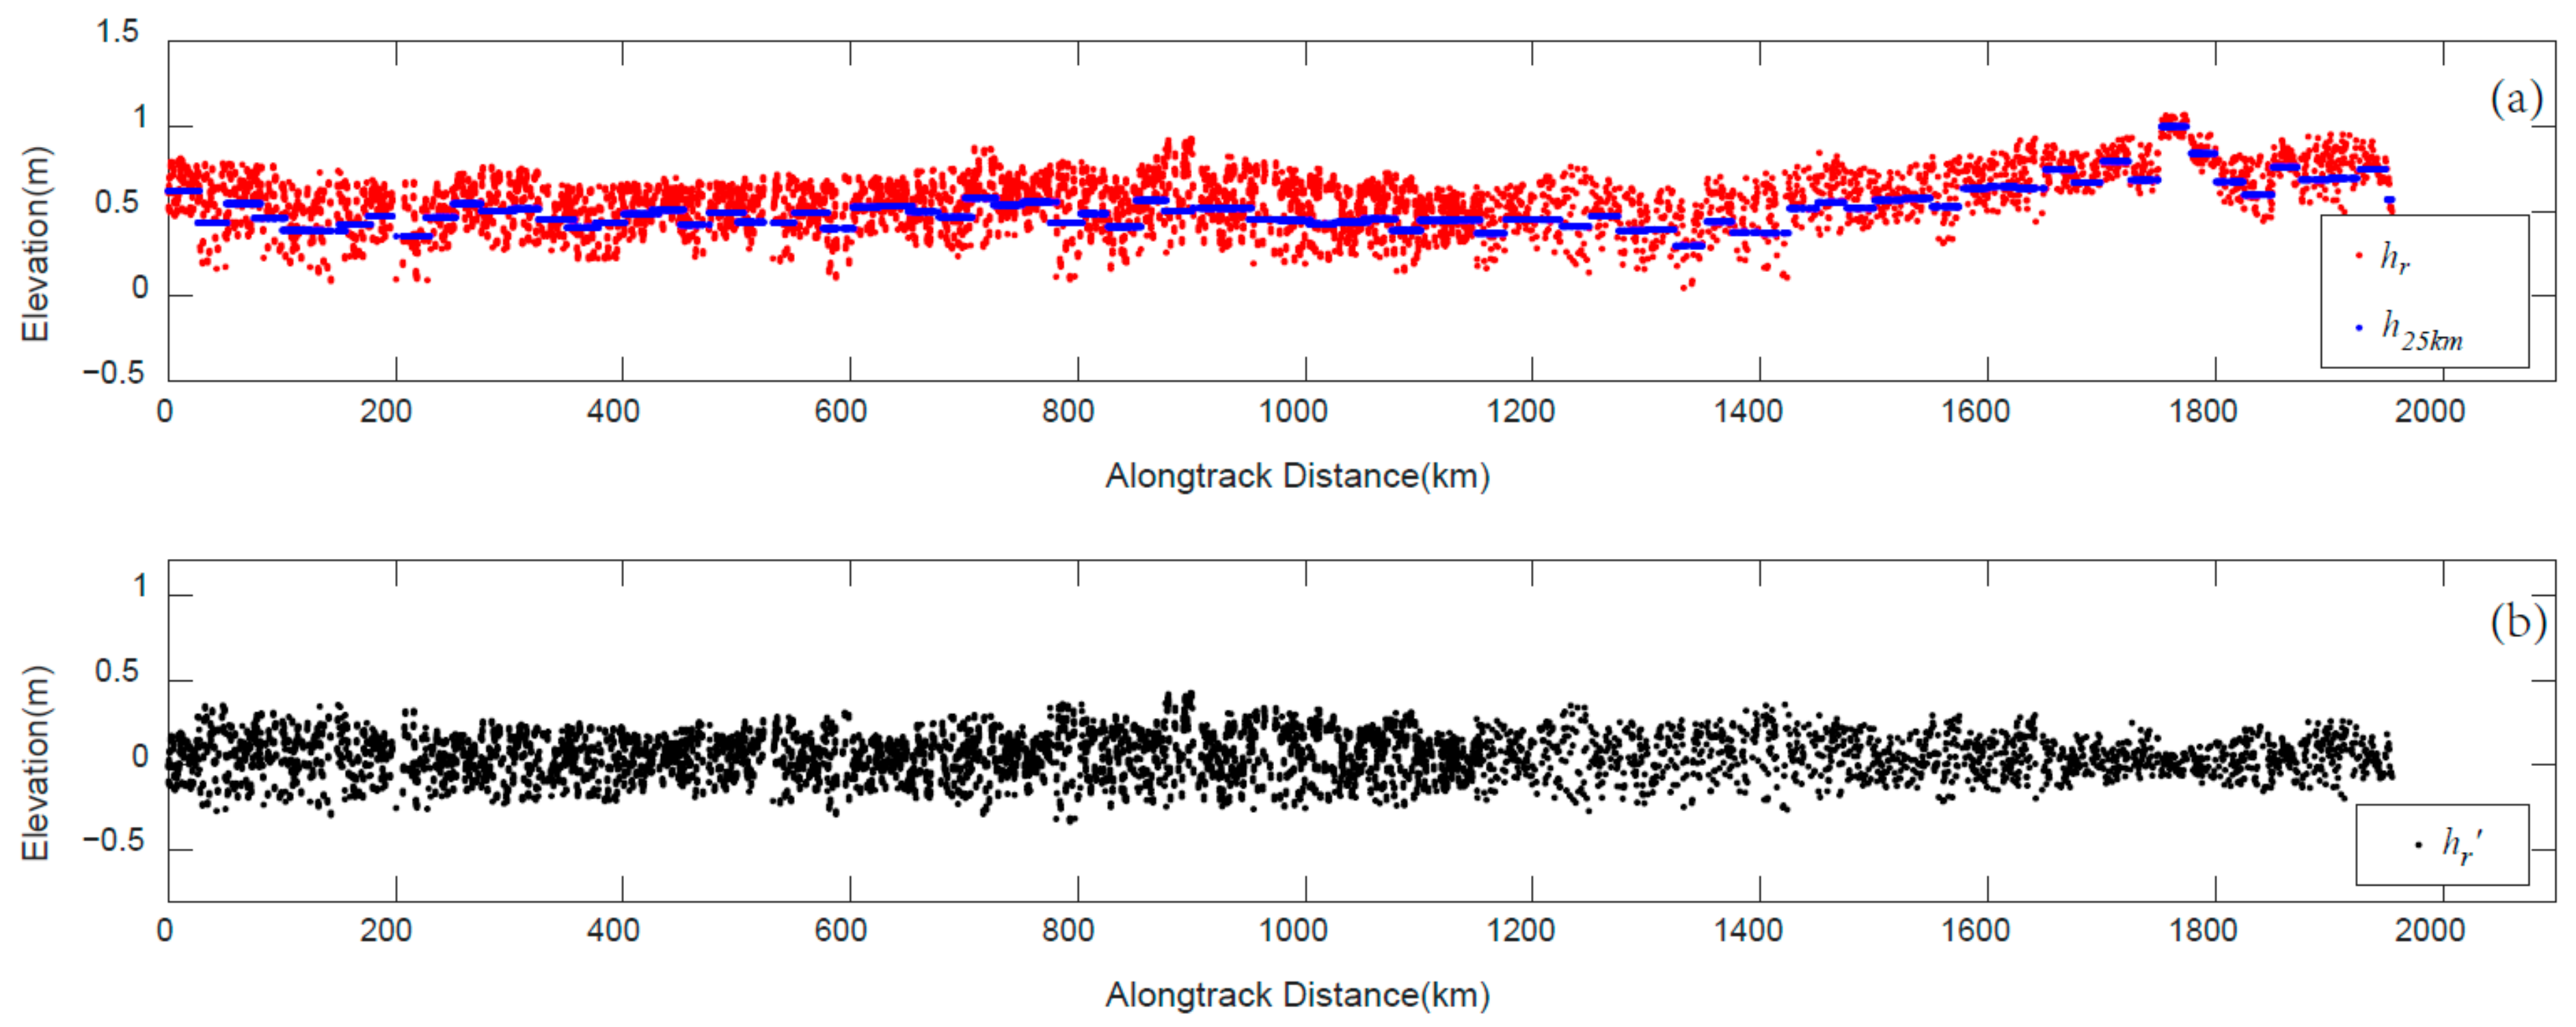
Figure 3.
A sample of Envisat elevation profiles. The red points in (a) are the relative elevation values; the blue points in (a) are values, defined as the 25 km running mean of ; and the black points in (b) are the modified relative elevation values.
Figure 3.
A sample of Envisat elevation profiles. The red points in (a) are the relative elevation values; the blue points in (a) are values, defined as the 25 km running mean of ; and the black points in (b) are the modified relative elevation values.
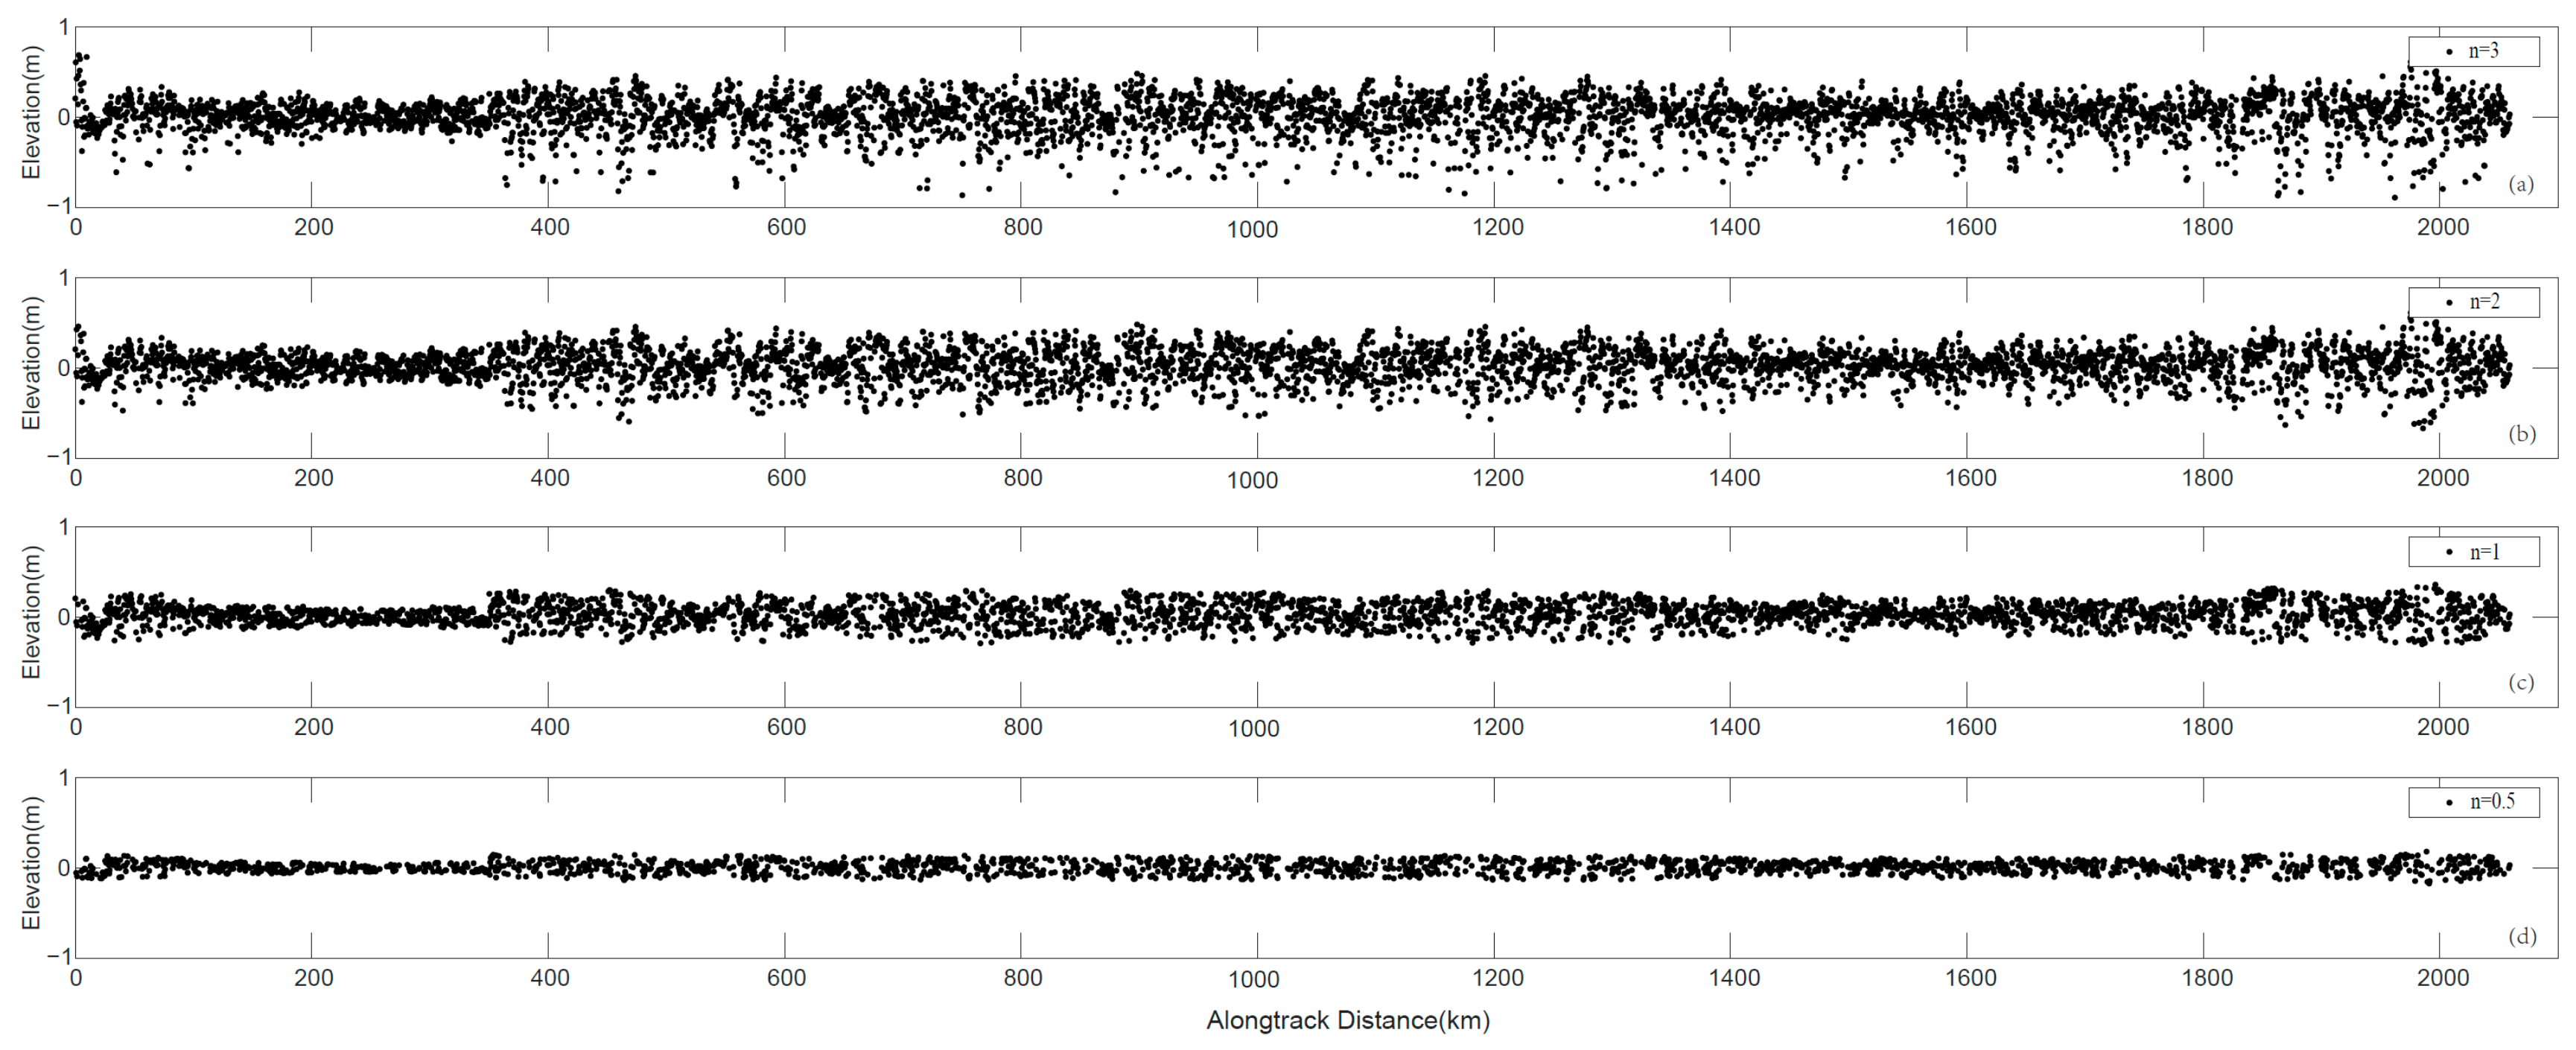
Figure 4.
Outlier elimination results for different multiples of the standard deviation: (a) n = 3, (b) n = 2, (c) n = 1, (d) n = 0.5.
Figure 4.
Outlier elimination results for different multiples of the standard deviation: (a) n = 3, (b) n = 2, (c) n = 1, (d) n = 0.5.
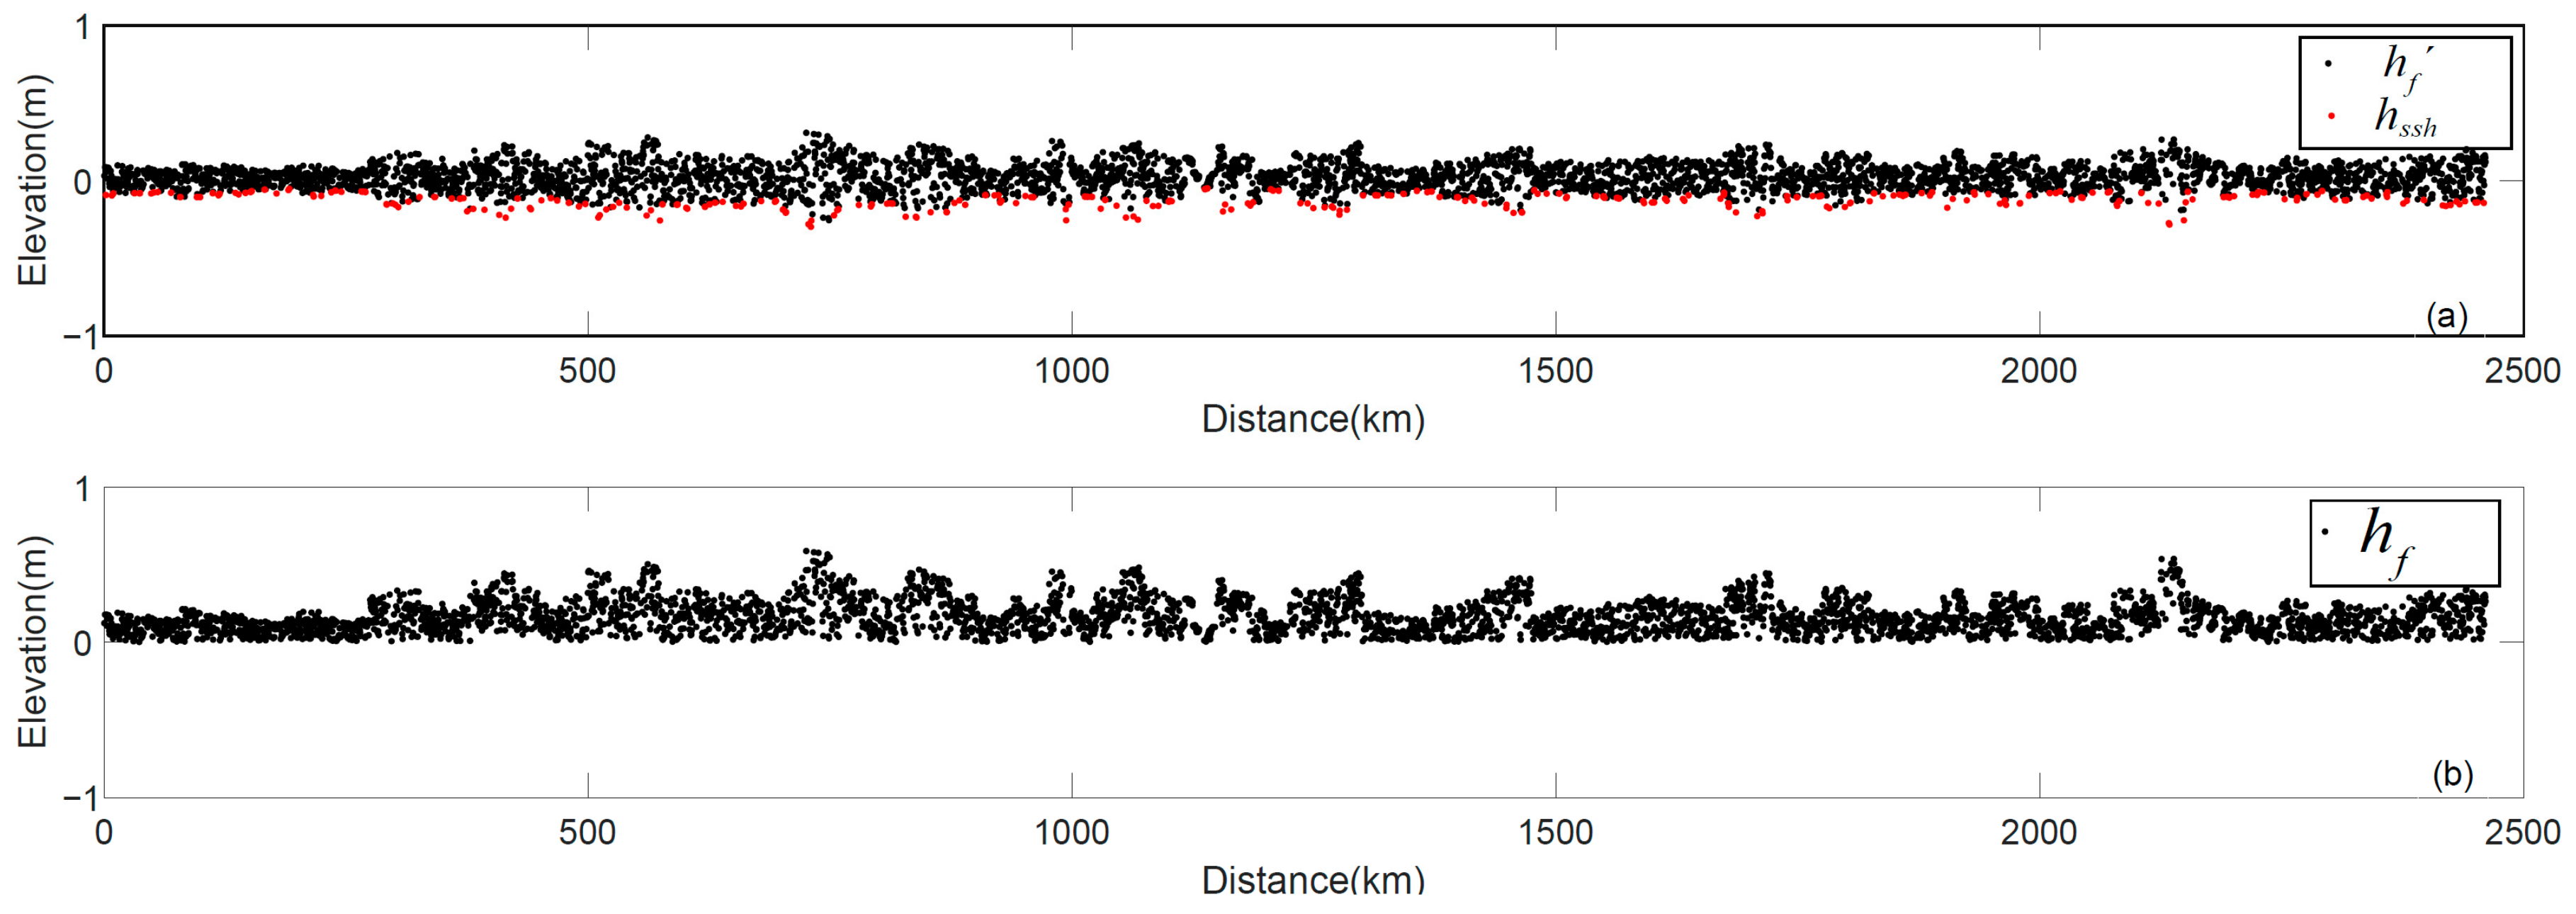
Figure 5.
A sample of sea ice freeboard estimation results from an Envisat profile. The black points in (a) indicate the modified relative elevation (), the red points in (a) indicate the sea level (), and the black points in (b) indicate the retrieved sea ice freeboard ().
Figure 5.
A sample of sea ice freeboard estimation results from an Envisat profile. The black points in (a) indicate the modified relative elevation (), the red points in (a) indicate the sea level (), and the black points in (b) indicate the retrieved sea ice freeboard ().
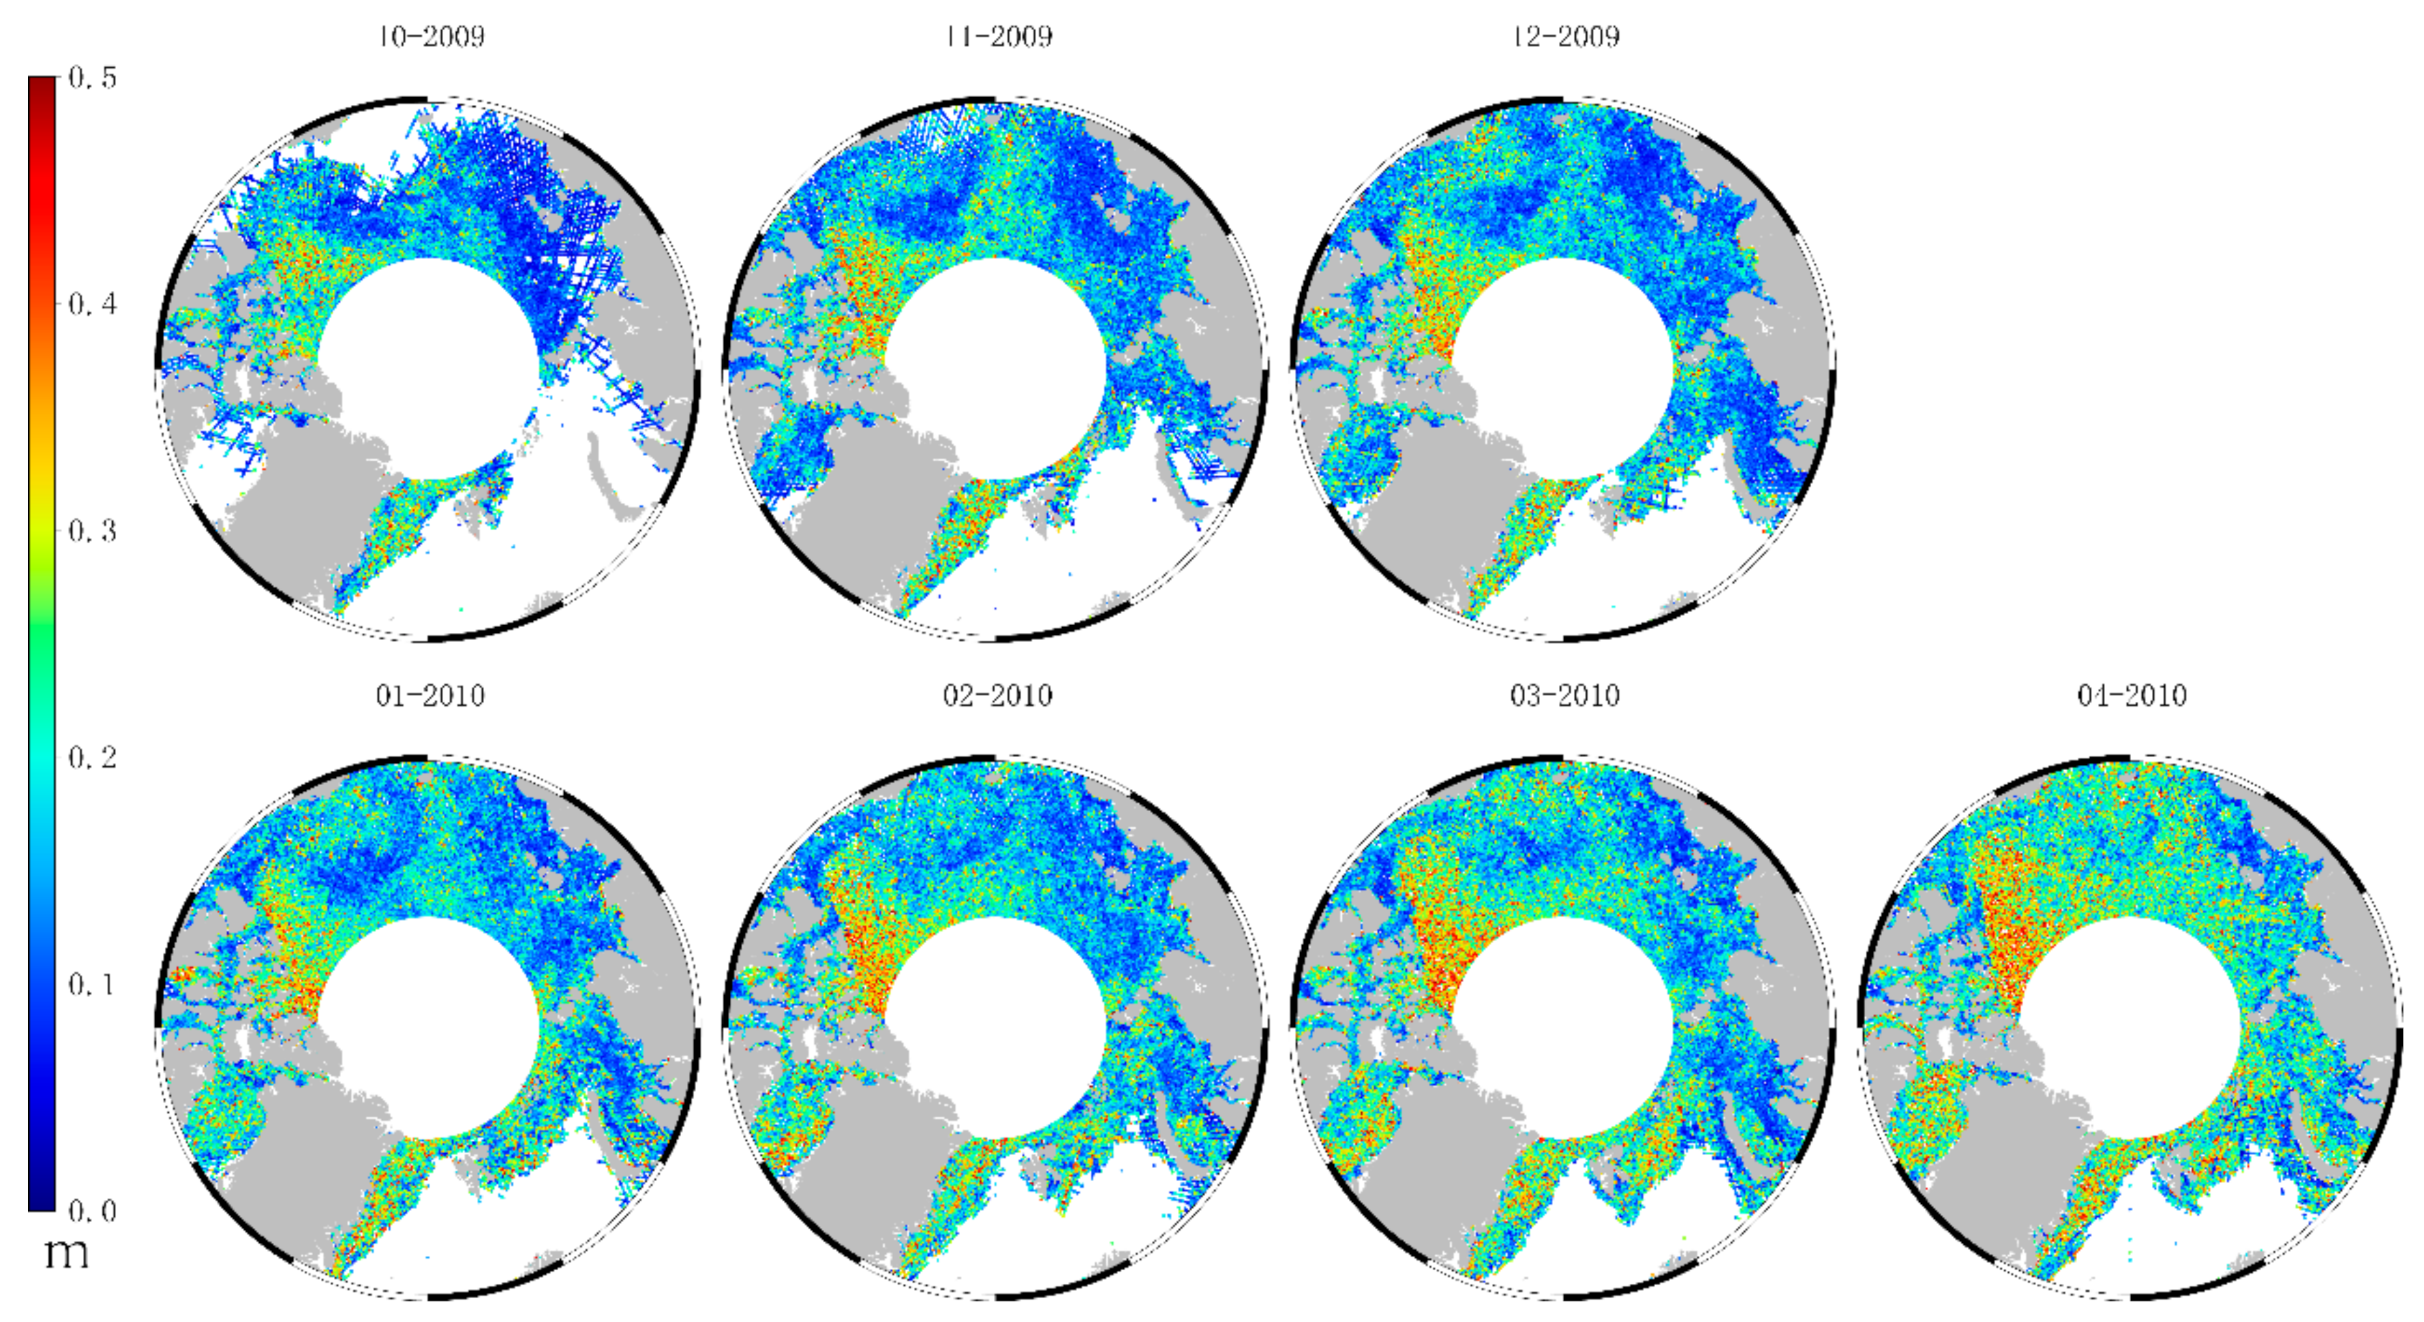
Figure 6.
The sea ice freeboard distribution for the 2009/2010 Arctic sea ice growth season from October to April.
Figure 6.
The sea ice freeboard distribution for the 2009/2010 Arctic sea ice growth season from October to April.
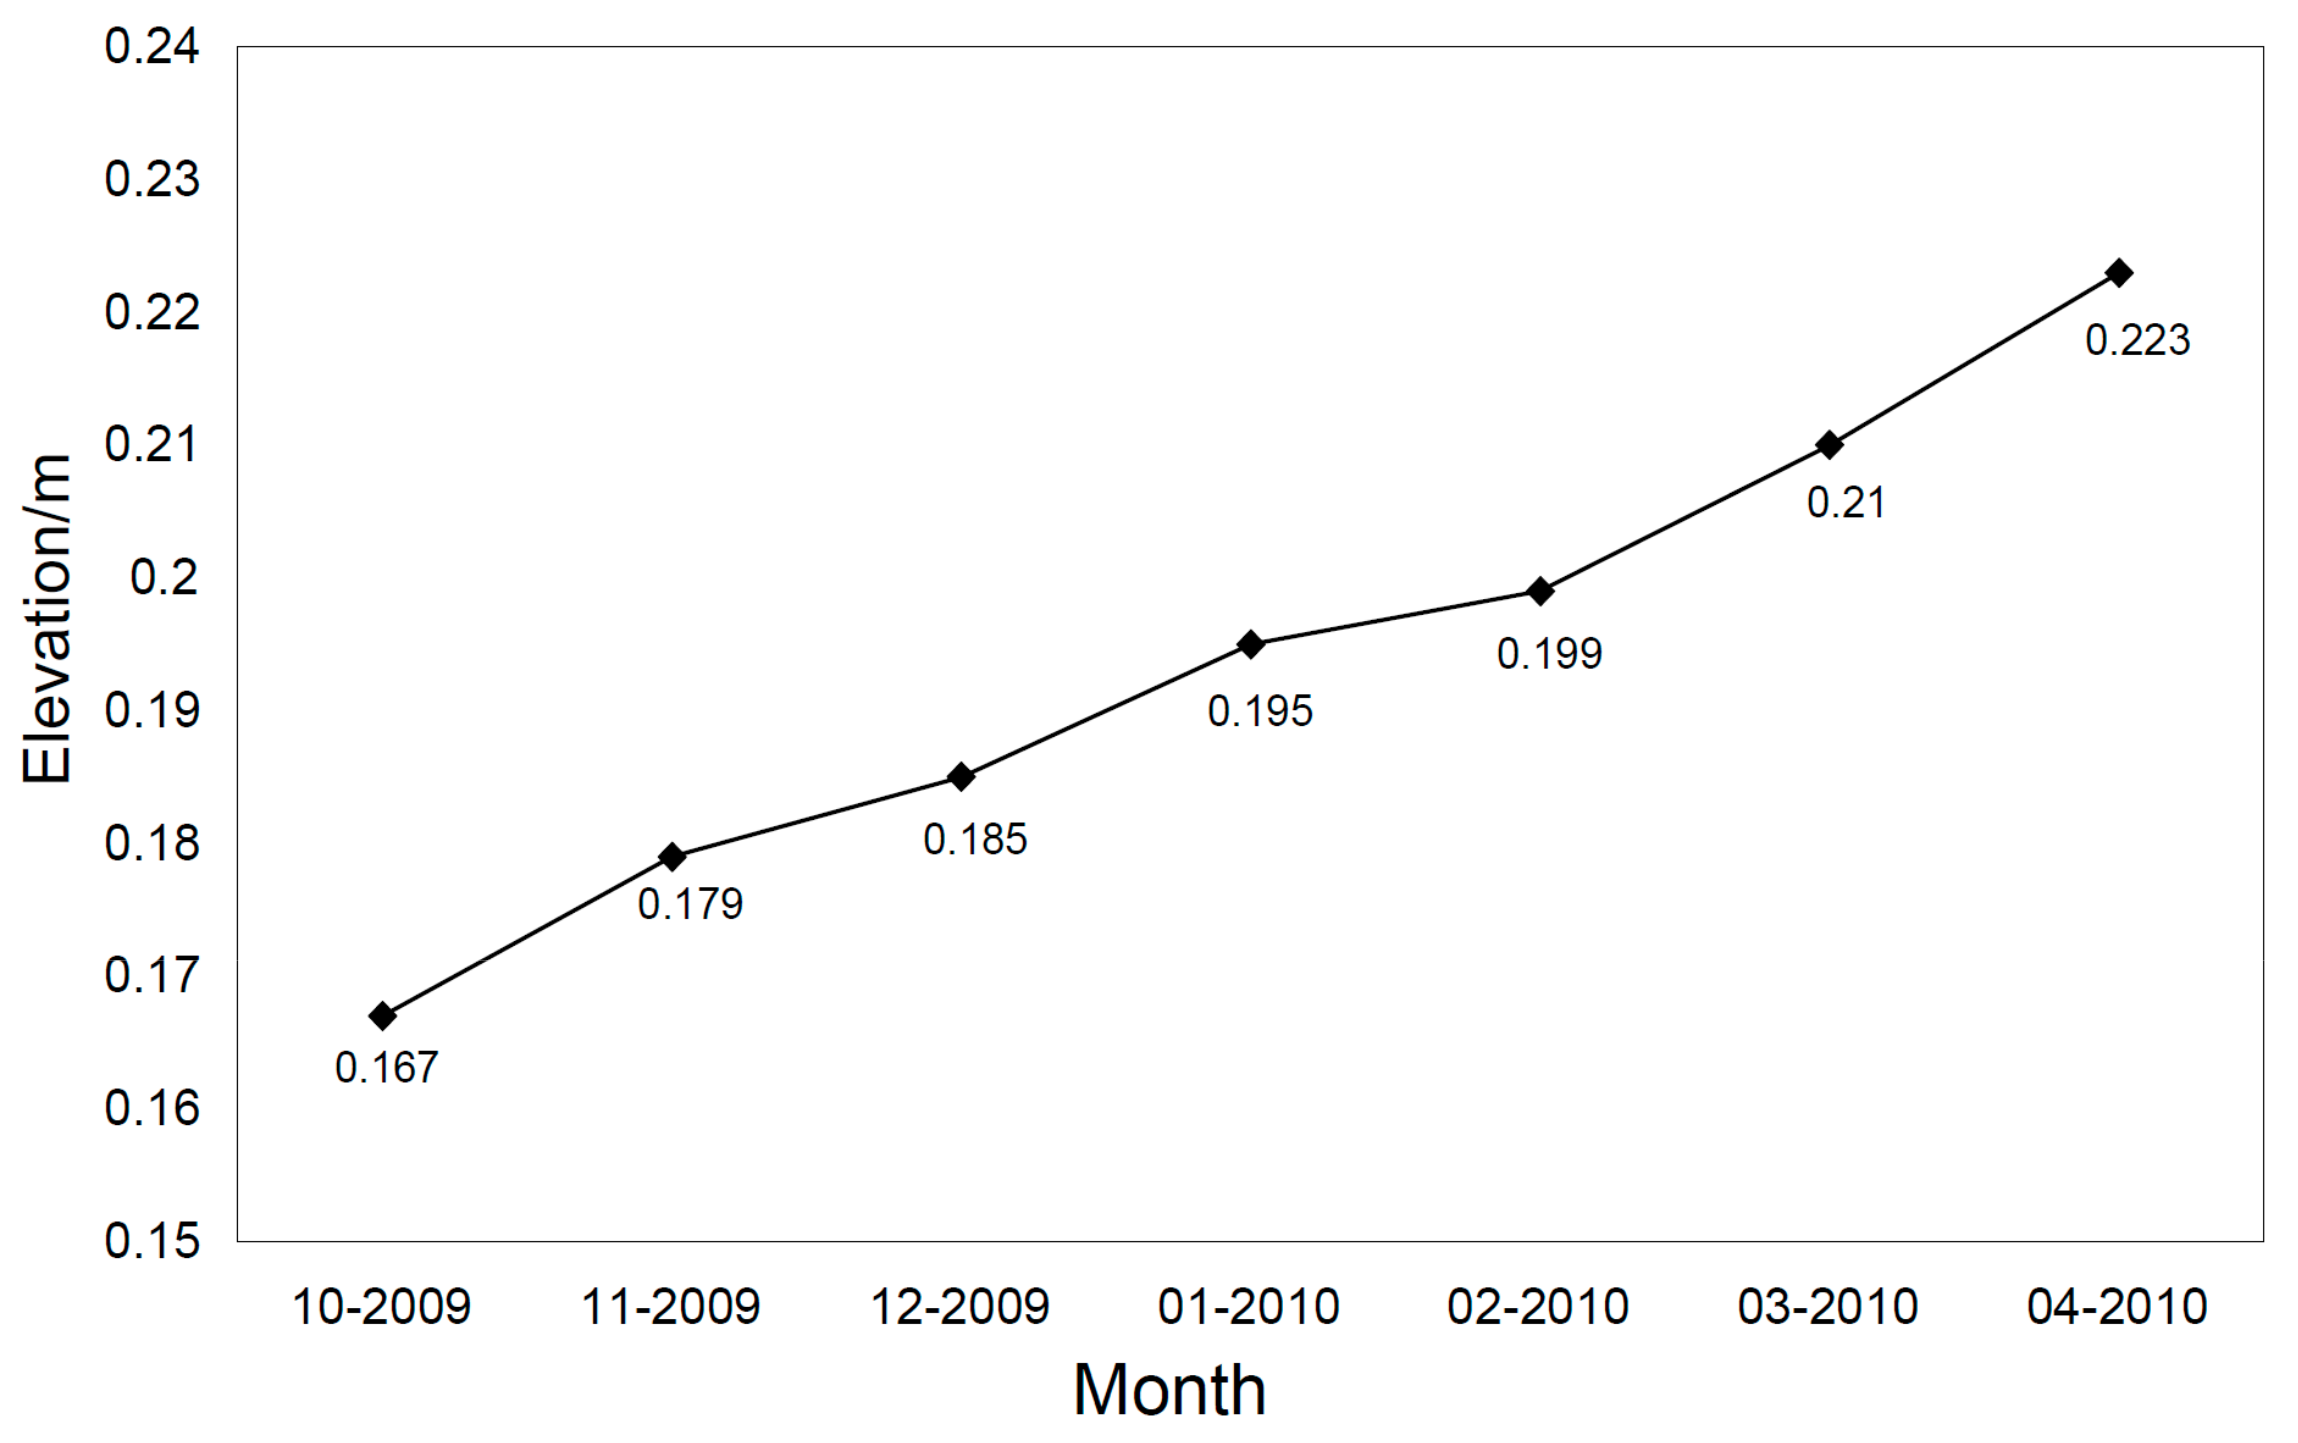
Figure 7.
Mean sea ice freeboard variations in the Arctic Ocean for the 2009/2010 Arctic sea ice growth season from October to April.
Figure 7.
Mean sea ice freeboard variations in the Arctic Ocean for the 2009/2010 Arctic sea ice growth season from October to April.
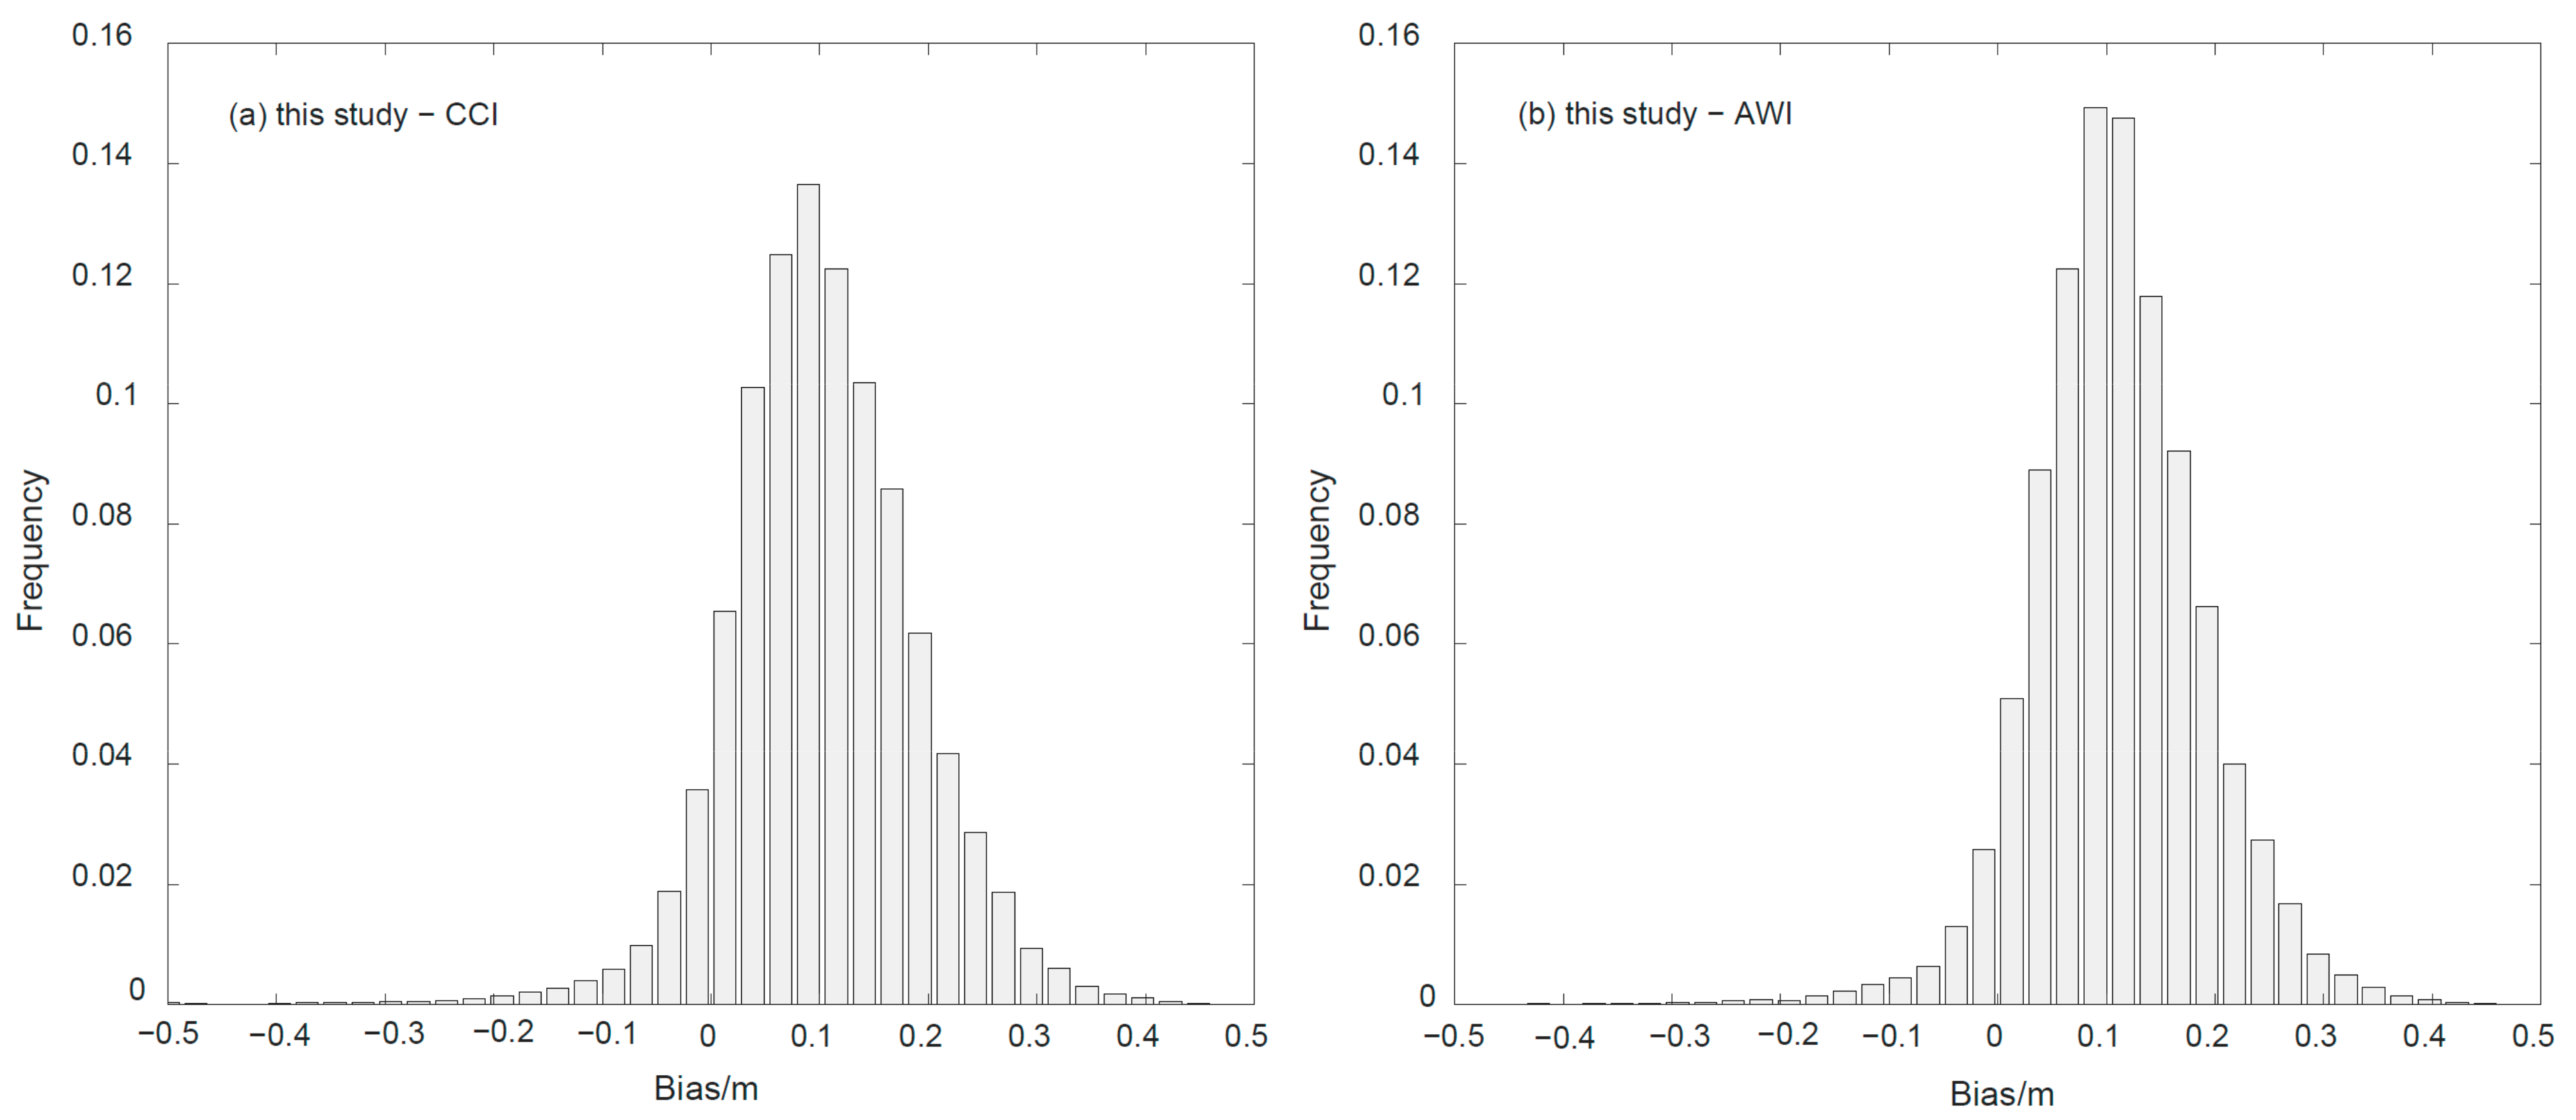
Figure 8.
Histograms of the freeboard bias between this study and the two products, (a) this study and CCI, (b) this study and AWI.
Figure 8.
Histograms of the freeboard bias between this study and the two products, (a) this study and CCI, (b) this study and AWI.
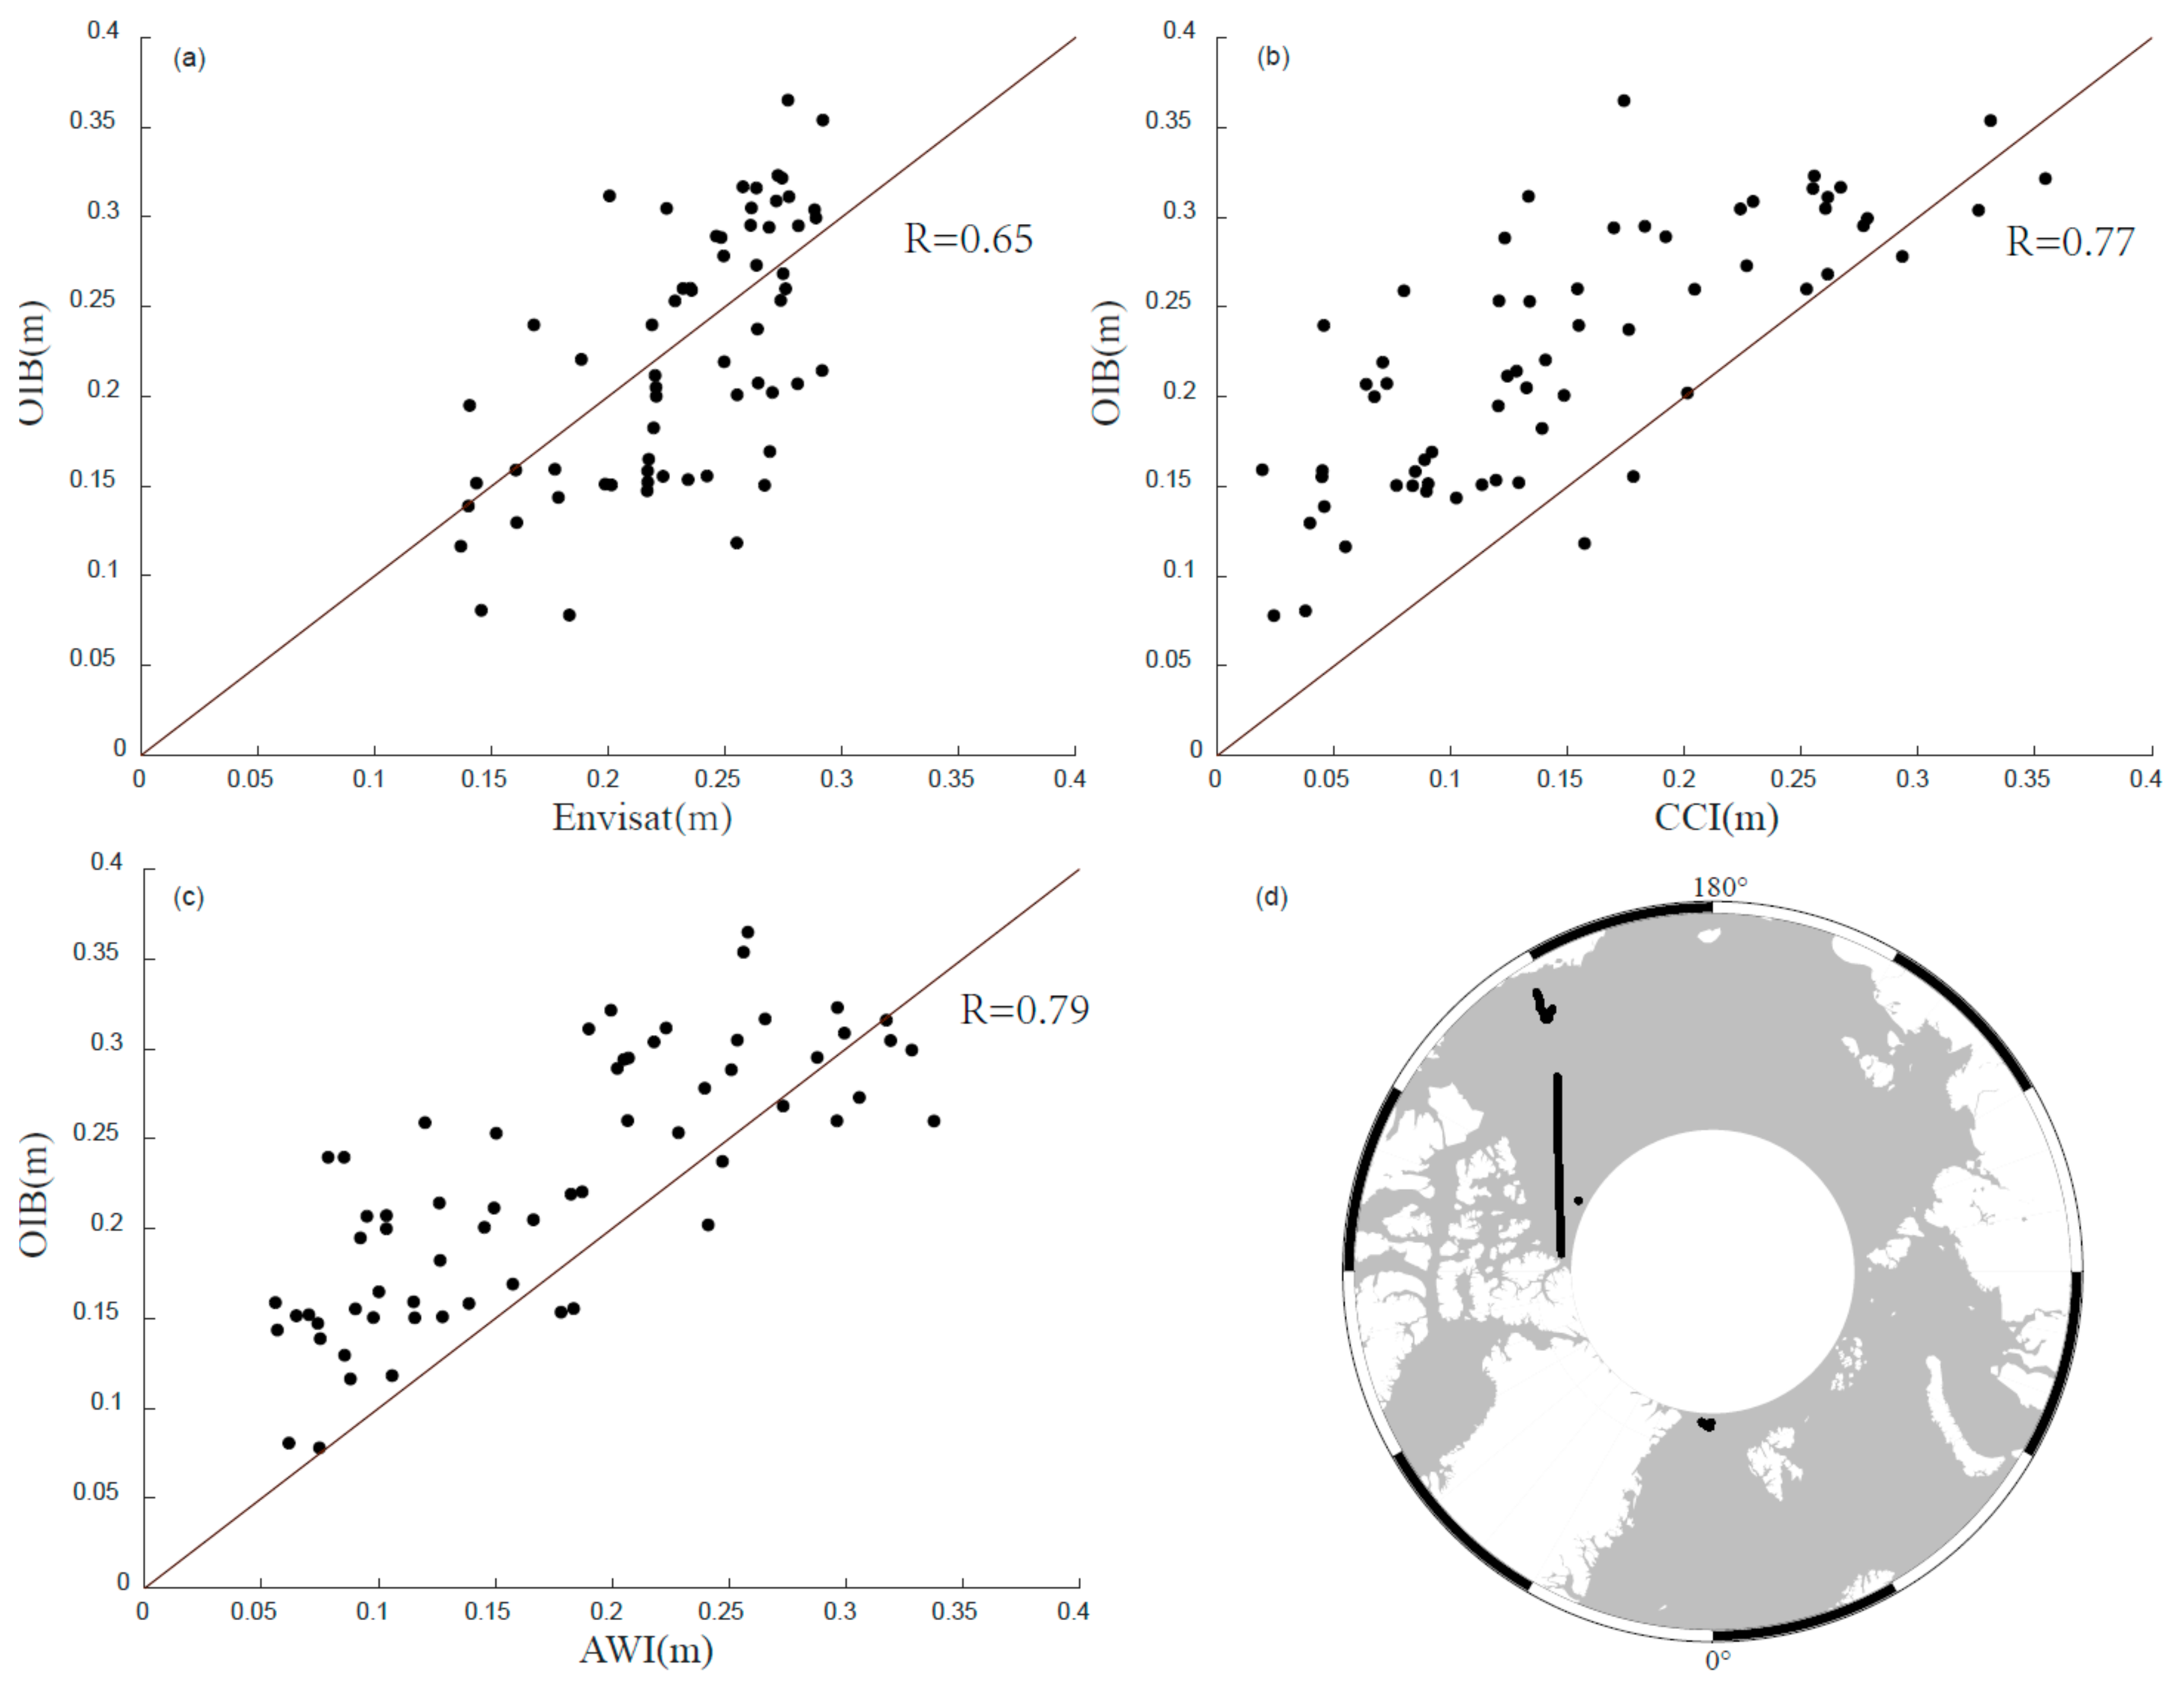
Figure 9.
Scatterplots of the sea ice freeboard from this study and that from the two products versus that from Operation IceBridge (OIB): (a) this study vs. OIB, (b) CCI vs. OIB, (c) AWI vs. OIB. (d) illustrates the OIB tracks (black lines) within the Envisat mission period.
Figure 9.
Scatterplots of the sea ice freeboard from this study and that from the two products versus that from Operation IceBridge (OIB): (a) this study vs. OIB, (b) CCI vs. OIB, (c) AWI vs. OIB. (d) illustrates the OIB tracks (black lines) within the Envisat mission period.
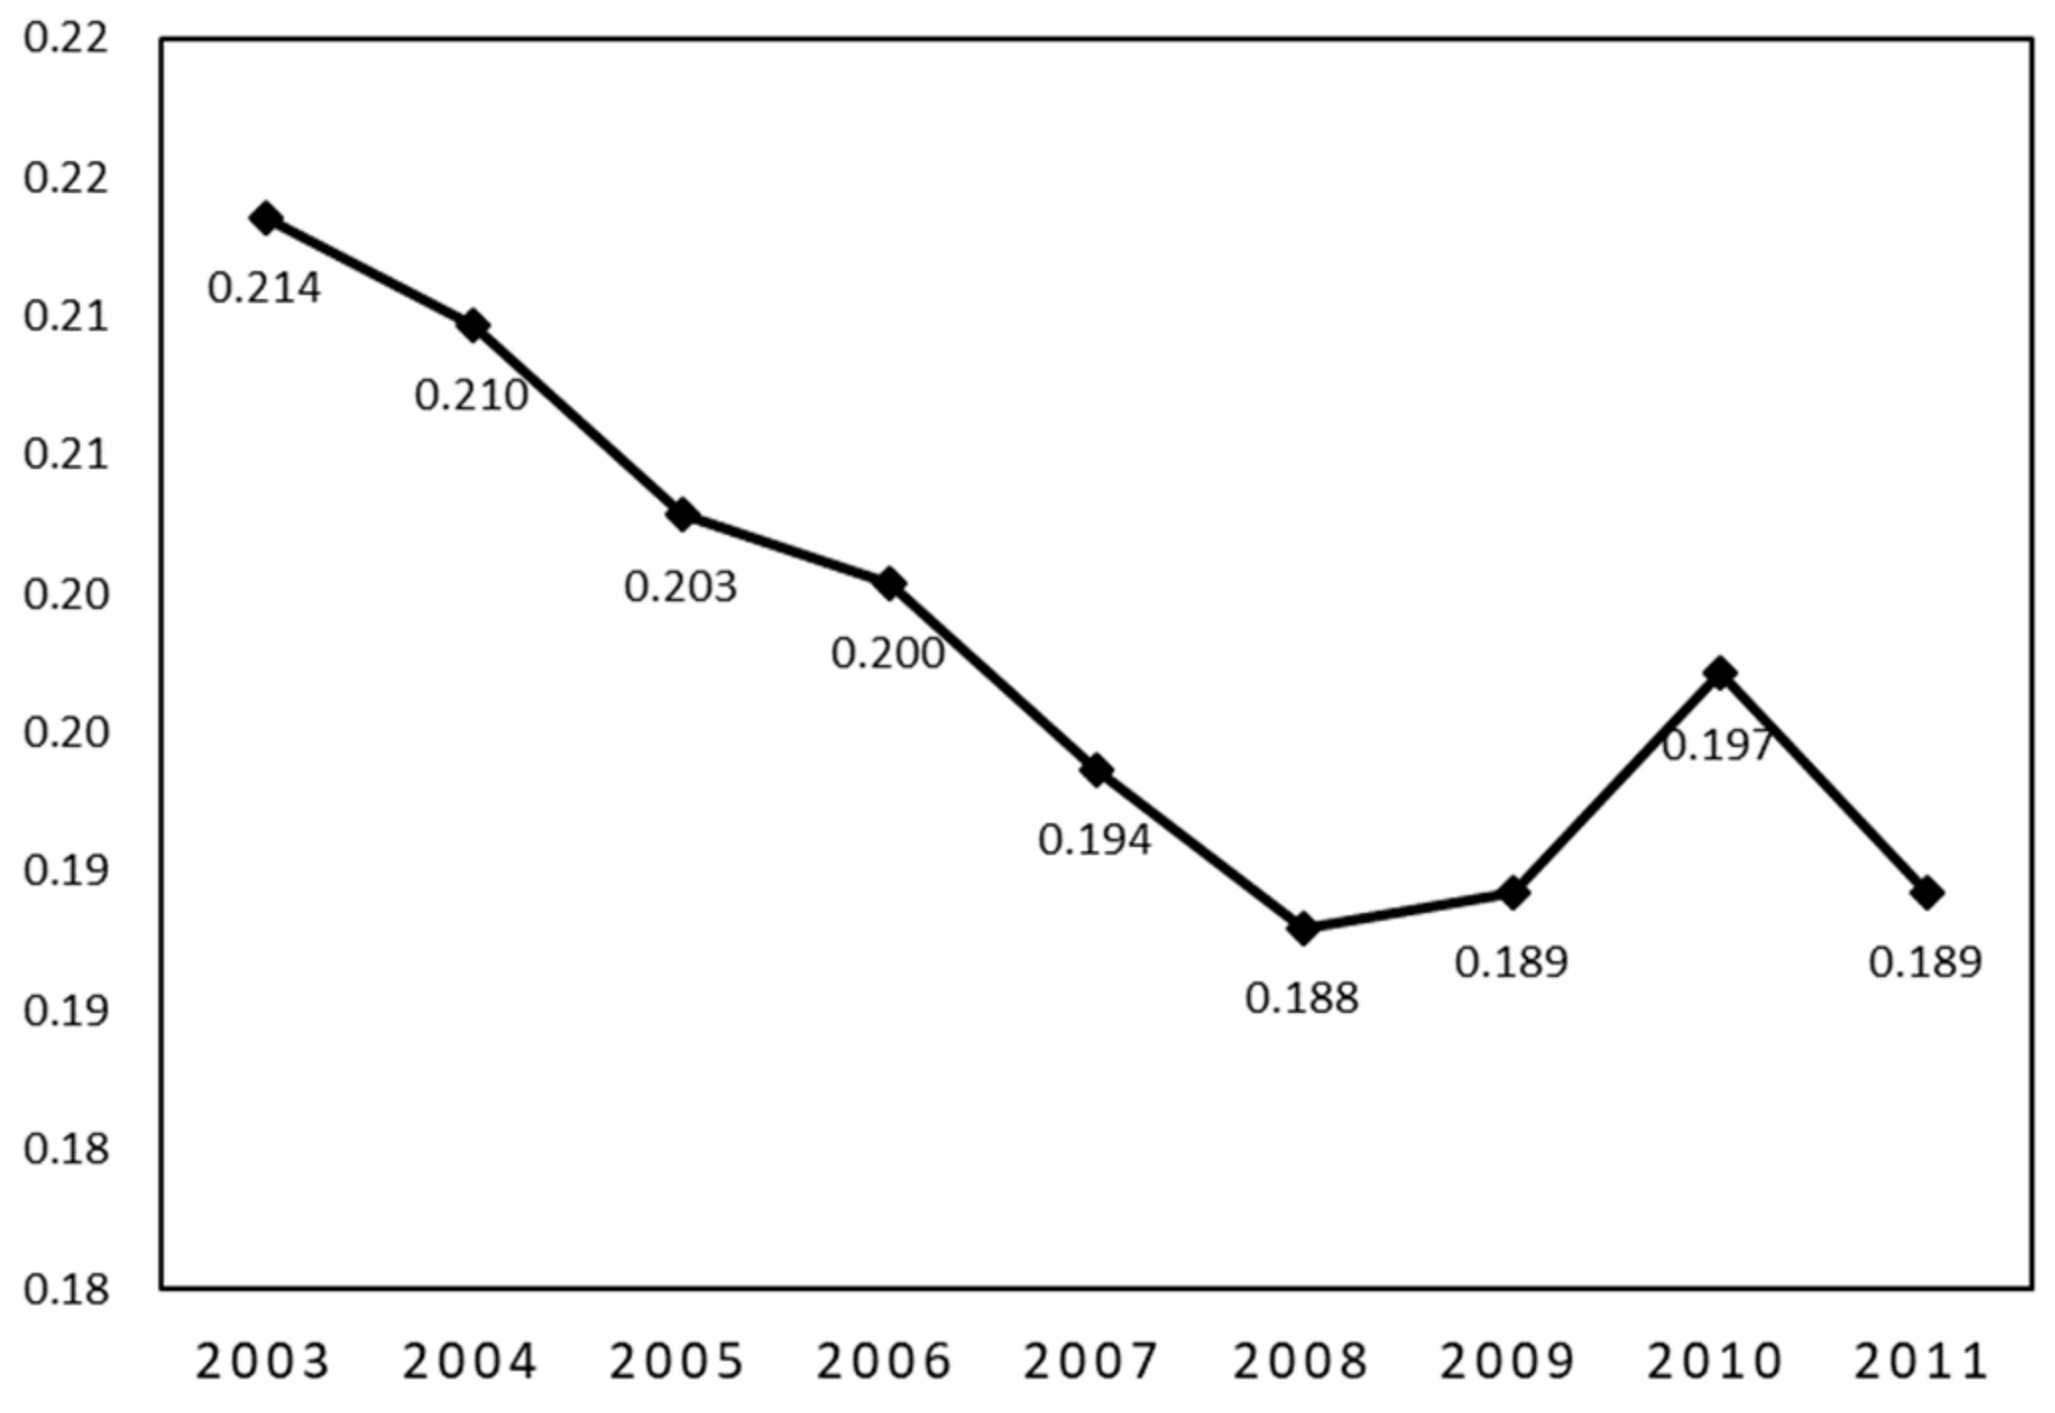
Figure 10.
Annual average sea ice freeboard variations in the Arctic Ocean from 2003 to 2011.
Figure 10.
Annual average sea ice freeboard variations in the Arctic Ocean from 2003 to 2011.
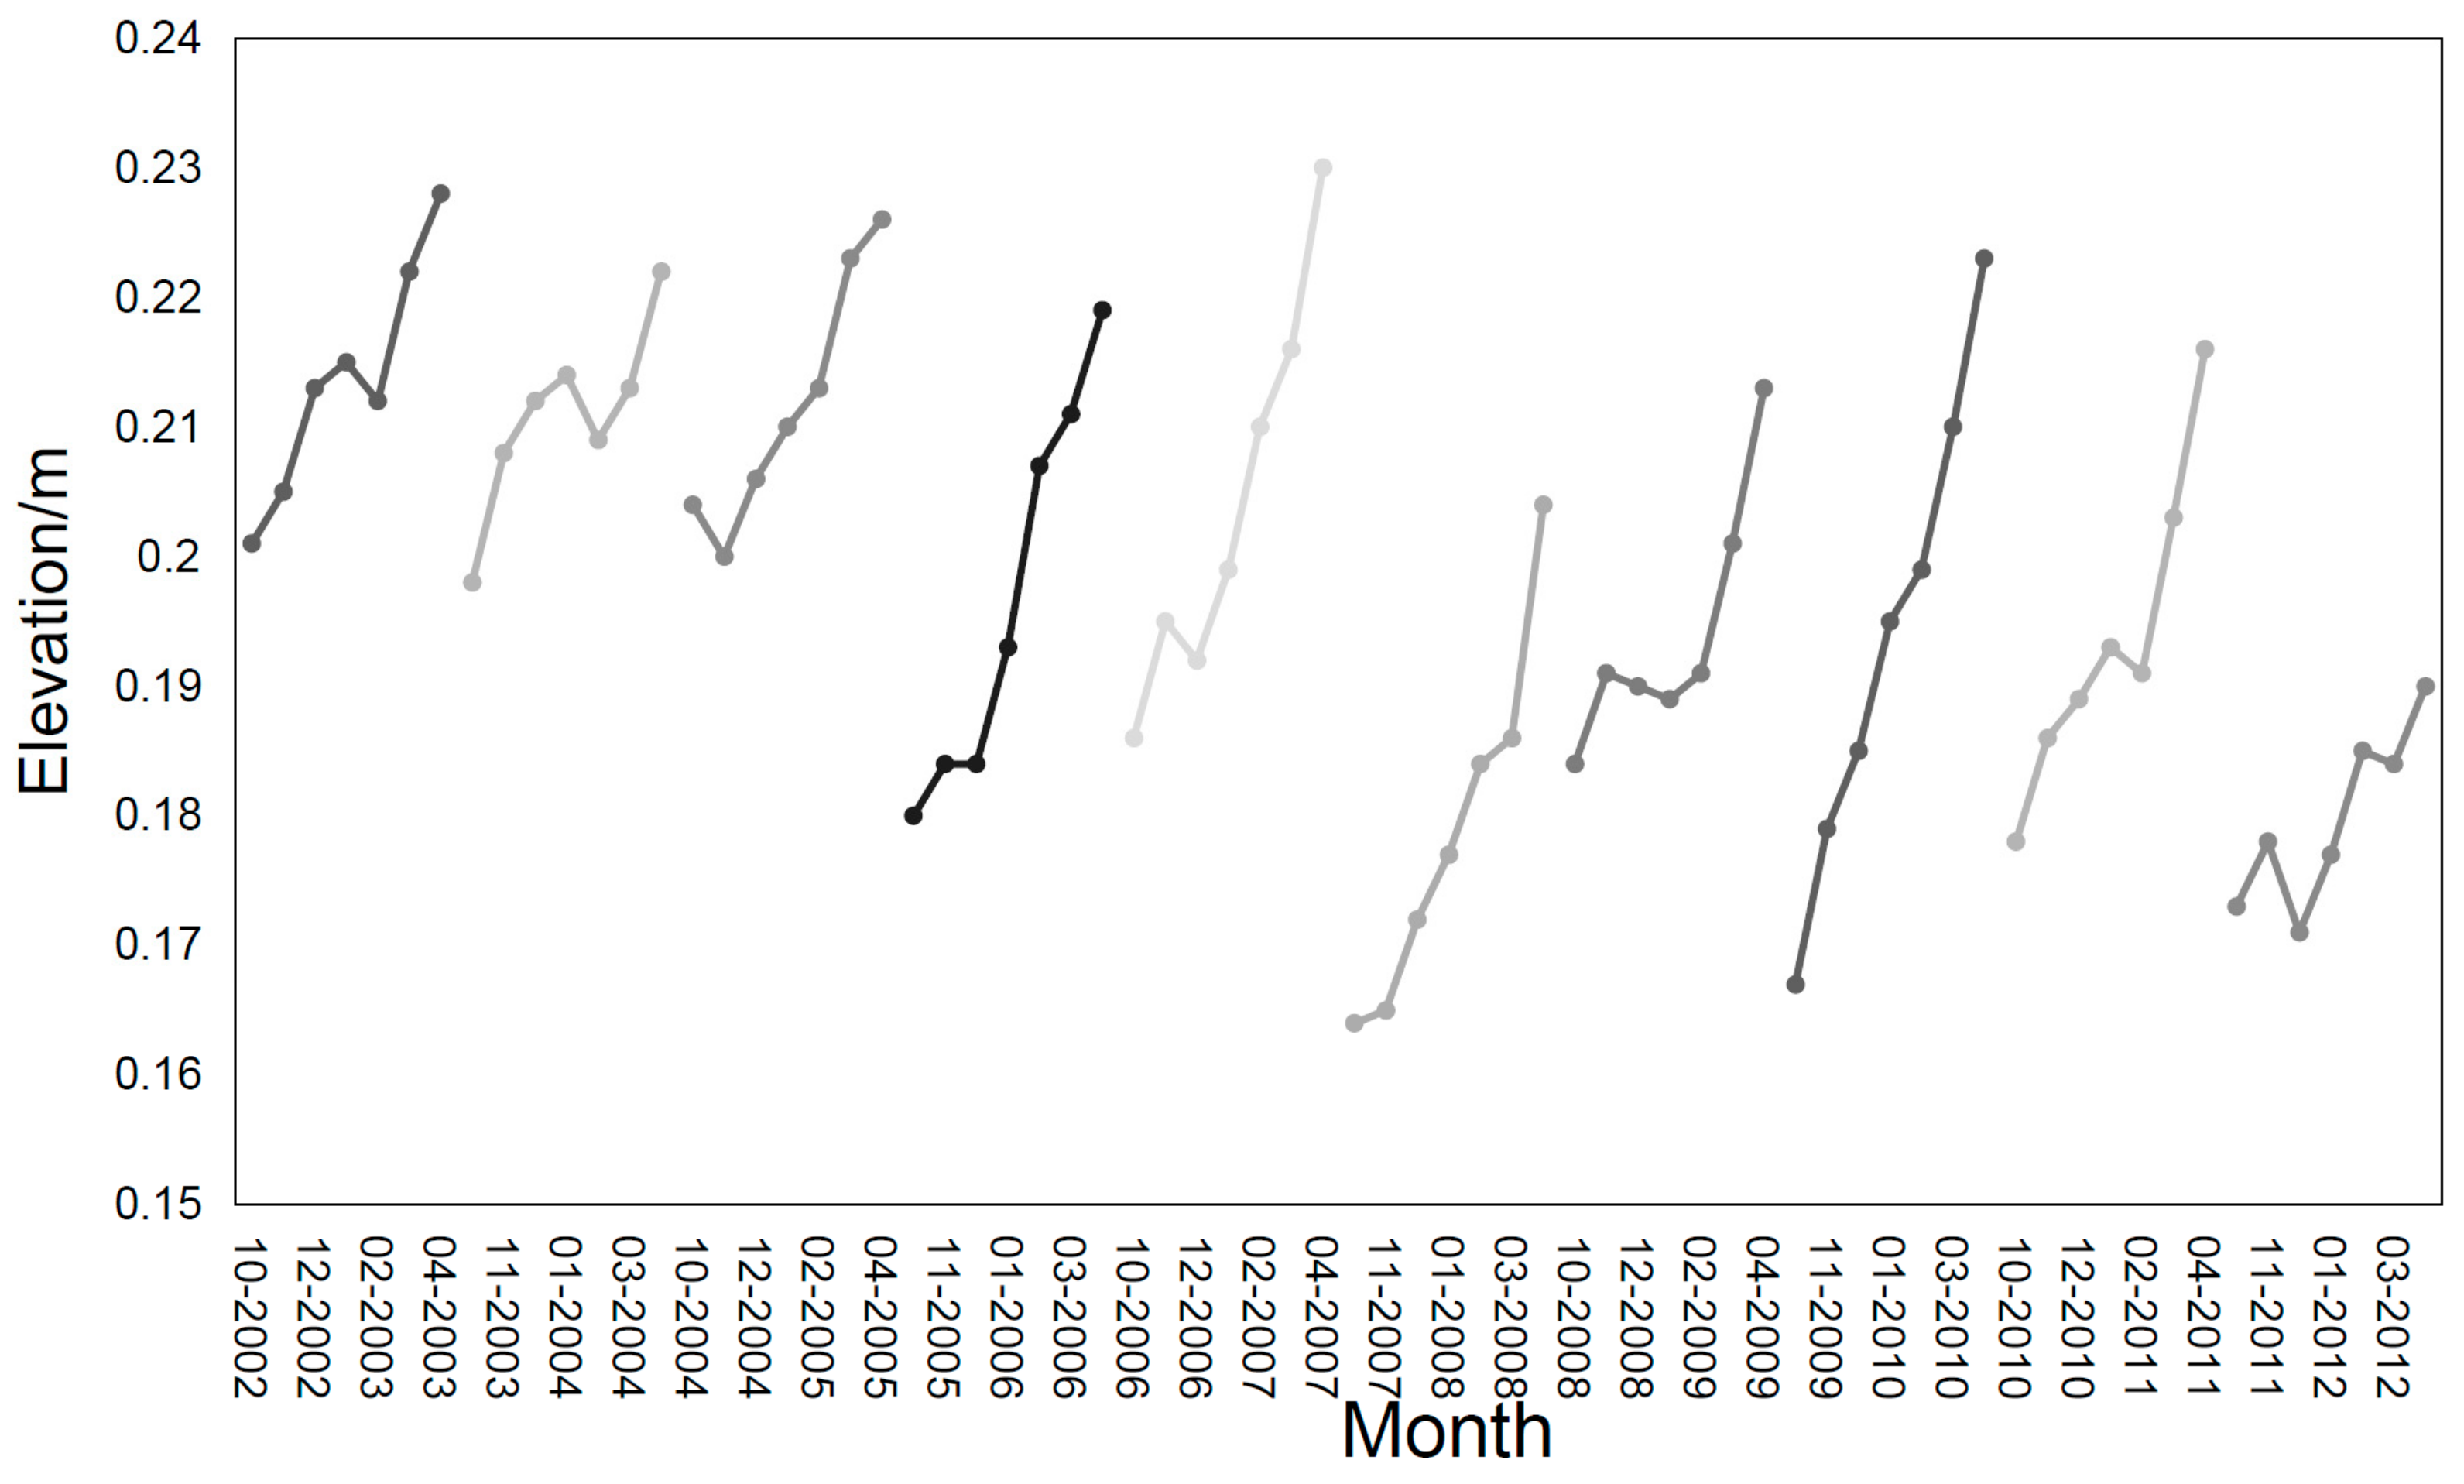
Figure 11.
Monthly average sea ice freeboard variations in the Arctic Ocean from October 2002 to April 2012.
Figure 11.
Monthly average sea ice freeboard variations in the Arctic Ocean from October 2002 to April 2012.
Table 1.
A comparison of three widely used mean sea surface (MSS) models.
Table 1.
A comparison of three widely used mean sea surface (MSS) models.
| | CLS01 | DTU15 | DTU18 |
|---|
| Reference ellipsoid | T/P | T/P | T/P |
| Time period | 1993–1999 | 1991–2015 | 1993–2017 |
| coverage | 80° S–82° N | 90° S–90° N | 90° S–90° N |
| Grid resolution | 2′ × 2′ | 1′ × 1′ | 1′ × 1′ |
| Data sources | ERS-1/2, GEOSAT and T/P | T/P, Jason 1/2, ERS-1/2, Envisat and CryoSat-2 | T/P, Jason 1/2, ERS-1/2, Envisat, CryoSat-2, SARAL/Altika and Sentinel-3A |
Table 2.
Models and data sources used for geophysical corrections in Geophysical Data Record (GDR) data.
Table 2.
Models and data sources used for geophysical corrections in Geophysical Data Record (GDR) data.
| Geophysical Corrections | Models or Sources☐ |
|---|
| Inverse Barometer | ECMWF |
| Sea State Bias | Envisat Ku-band’s significant wave height and the RA-2 wind speed |
| Ionospheric Correction | the DORIS daily TEC maps |
| Ocean Tide | GOT00.2b |
| Polar Tide | IERS Centre |
| Wet Tropospheric Correction | ECMWF |
| Dry Tropospheric Correction | ECMWF |
Table 3.
Rejection rates for different multiples of the standard deviation.
Table 3.
Rejection rates for different multiples of the standard deviation.
| Orbit | Number of the Original Points | n = 3 | n = 2 | n = 1 | n = 0.5 |
|---|
| Number of Points after Elimination | Rejection Rate (%) | Number of Points after Elimination | Rejection Rate (%) | Number of Points after Elimination | Rejection Rate (%) | Number of Points after Elimination | Rejection Rate (%) |
|---|
| 19654 | 5492 | 5269 | 1.40 | 5083 | 4.88 | 3934 | 26.38 | 2239 | 58.10 |
| 19726 | 5655 | 5447 | 1.48 | 5238 | 5.26 | 4121 | 25.47 | 2309 | 58.24 |
| 19780 | 10302 | 9738 | 1.10 | 9328 | 5.26 | 7187 | 27.01 | 3950 | 59.88 |
| 19883 | 5451 | 5226 | 1.12 | 5045 | 4.54 | 3795 | 28.19 | 2115 | 59.98 |
| 19926 | 5602 | 5366 | 1.41 | 5160 | 5.20 | 3999 | 26.53 | 2212 | 59.36 |
Table 4.
Bias between the sea ice freeboards retrieved in this study and that from CCI and AWI.
Table 4.
Bias between the sea ice freeboards retrieved in this study and that from CCI and AWI.
| Month | This Study–CCI | This Study–AWI |
|---|
| Bias/m | RMSE/m | STD/m | Bias/m | RMSE/m | STD/m |
|---|
| October 2010 | 0.12 | 0.15 | 0.09 | | | |
| November 2010 | 0.12 | 0.14 | 0.08 | 0.13 | 0.15 | 0.07 |
| December 2010 | 0.11 | 0.14 | 0.08 | 0.13 | 0.14 | 0.07 |
| January 2011 | 0.11 | 0.13 | 0.08 | 0.12 | 0.14 | 0.07 |
| February 2011 | 0.09 | 0.13 | 0.09 | 0.11 | 0.13 | 0.08 |
| March 2011 | 0.1 | 0.13 | 0.09 | 0.11 | 0.13 | 0.09 |
| April 2011 | 0.09 | 0.14 | 0.10 | 0.11 | 0.14 | 0.09 |
| Overall | 0.11 | 0.14 | 0.09 | 0.12 | 0.14 | 0.08 |
Table 5.
Bias between the freeboard from this study and that from CCI in different freeboard ranges.
Table 5.
Bias between the freeboard from this study and that from CCI in different freeboard ranges.
| Freeboard Range/m | Bias/m | RMSE/m | Number of Points |
|---|
| 0—0.1 | 0.12 | 0.14 | 32,767 |
| 0.1—0.2 | 0.07 | 0.10 | 16,654 |
| 0.2—0.3 | 0.00 | 0.08 | 2055 |
| 0.3—0.4 | −0.10 | 0.13 | 550 |
| 0.4—0.5 | −0.21 | 0.23 | 213 |
| 0.5—0.6 | −0.34 | 0.35 | 58 |
| 0.6—0.7 | −0.45 | 0.46 | 26 |
Table 6.
Bias between the freeboard from this study and that from AWI in different freeboard ranges.
Table 6.
Bias between the freeboard from this study and that from AWI in different freeboard ranges.
| Freeboard Range/m | Bias/m | RMSE/m | Number of Points |
|---|
| 0–0.1 | 0.13 | 0.14 | 32,542 |
| 0.1–0.2 | 0.09 | 0.11 | 12,604 |
| 0.2–0.3 | 0.02 | 0.08 | 1980 |
| 0.3–0.4 | −0.08 | 0.11 | 612 |
| 0.4–0.5 | −0.17 | 0.19 | 181 |
| 0.5–0.6 | −0.32 | 0.34 | 40 |
| 0.6–0.7 | −0.44 | 0.44 | 9 |
Table 7.
Statistics of the comparison of the sea ice freeboard across this study, the two products, and OIB.
Table 7.
Statistics of the comparison of the sea ice freeboard across this study, the two products, and OIB.
| | Mean Bias/m | RMSE/m | Correlation Coefficient |
|---|
| This study vs. OIB | 0.01 | 0.06 | 0.65 |
| CCI vs. OIB | −0.05 | 0.09 | 0.77 |
| AWI vs. OIB | −0.07 | 0.07 | 0.79 |


