Next Issue
Volume 13, May-1
Previous Issue
Volume 13, April-1
 
 
remotesensing-logo

Journal Browser

Journal Browser

Remote Sens., Volume 13, Issue 8 (April-2 2021) – 196 articles

Cover Story (view full-size image): 
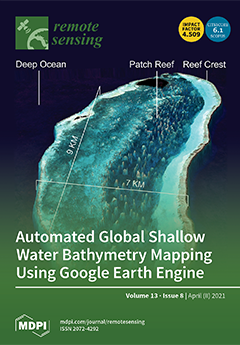
Global shallow water bathymetry maps offer critical information to inform activities such as scientific research, environment protection, and marine transportation. Methods that employ satellite-based bathymetric modeling provide an alternative to conventional shipborne measurements, offering high spatial resolution combined with extensive coverage. In this study, we developed an automated bathymetry mapping approach based on the Sentinel-2 surface reflectance dataset in Google Earth Engine. For this, we designed a new clean water mosaic creation method and a tailored bathymetry estimation algorithm to map bathymetry worldwide. Our global bathymetry maps of shallow coral reef regions are openly available through the Allen Coral Atlas (https://allencoralatlas.org/). View this paper
  • Issues are regarded as officially published after their release is announced to the table of contents alert mailing list.
  • You may sign up for e-mail alerts to receive table of contents of newly released issues.
  • PDF is the official format for papers published in both, html and pdf forms. To view the papers in pdf format, click on the "PDF Full-text" link, and use the free Adobe Reader to open them.
Order results
Result details
Section
Select all
Export citation of selected articles as:
17 pages, 2223 KiB  
Article
Unsupervised Multi-Level Feature Extraction for Improvement of Hyperspectral Classification
by Qiaoqiao Sun, Xuefeng Liu and Salah Bourennane
Remote Sens. 2021, 13(8), 1602; https://doi.org/10.3390/rs13081602 - 20 Apr 2021
Cited by 7 | Viewed by 2323
Abstract
Deep learning models have strong abilities in learning features and they have been successfully applied in hyperspectral images (HSIs). However, the training of most deep learning models requires labeled samples and the collection of labeled samples are labor-consuming in HSI. In addition, single-level [...] Read more.
Deep learning models have strong abilities in learning features and they have been successfully applied in hyperspectral images (HSIs). However, the training of most deep learning models requires labeled samples and the collection of labeled samples are labor-consuming in HSI. In addition, single-level features from a single layer are usually considered, which may result in the loss of some important information. Using multiple networks to obtain multi-level features is a solution, but at the cost of longer training time and computational complexity. To solve these problems, a novel unsupervised multi-level feature extraction framework that is based on a three dimensional convolutional autoencoder (3D-CAE) is proposed in this paper. The designed 3D-CAE is stacked by fully 3D convolutional layers and 3D deconvolutional layers, which allows for the spectral-spatial information of targets to be mined simultaneously. Besides, the 3D-CAE can be trained in an unsupervised way without involving labeled samples. Moreover, the multi-level features are directly obtained from the encoded layers with different scales and resolutions, which is more efficient than using multiple networks to get them. The effectiveness of the proposed multi-level features is verified on two hyperspectral data sets. The results demonstrate that the proposed method has great promise in unsupervised feature learning and can help us to further improve the hyperspectral classification when compared with single-level features. Full article
(This article belongs to the Section AI Remote Sensing)
Show Figures

Graphical abstract

15 pages, 3574 KiB  
Technical Note
The Response of Cloud-Precipitation Recycling in China to Global Warming
by Qi Guo, Xianjie Cao, Jiening Liang, Zhida Zhang, Min Zhang and Lei Zhang
Remote Sens. 2021, 13(8), 1601; https://doi.org/10.3390/rs13081601 - 20 Apr 2021
Cited by 1 | Viewed by 2060
Abstract
Cloud water is an important geophysical quantity that connects the hydrological and radiation characteristics of climate systems and plays an essential role in the global circulation of the atmosphere, water, and energy. However, compared to the contribution of water vapor to precipitation, the [...] Read more.
Cloud water is an important geophysical quantity that connects the hydrological and radiation characteristics of climate systems and plays an essential role in the global circulation of the atmosphere, water, and energy. However, compared to the contribution of water vapor to precipitation, the understanding of cloud-precipitation transformation and its climate feedback mechanism remains limited. Based on precipitation and temperature datasets of the National Meteorological Observatory and MODIS (Moderate Resolution Imaging Spectroradiometer) satellite remote sensing products, the evolution characteristics of cloud water resources in China over the last twenty years of the 21st century were evaluated. Significant decreasing trends of −3.3 and −4.89 g/m2 decade−1 were found for both the liquid and ice water path. In humid areas with high precipitation, the cloud water path decreased fast. In semiarid areas with an annual precipitation ranging from 500–800 mm, the decreasing trend of the cloud water path was the lowest. The cloud-water period was calculated to represent the relative changes in clouds and precipitation. The national average cloud-water period in China is approximately 12.4 h, with obvious seasonal changes. Over the last 20 years, the cloud water path in dry regions decreased more slowly than that in wet regions, and the cloud-precipitation efficiency significantly increased, which narrowed the climate difference between the dry and wet regions. Finally, the mechanism of the cloud-water period evolution in the different regions were examined from the perspectives of the dynamic and thermal contributions, respectively. Due to the overall low upward moisture flux (UMF) in the dry region, the response of the cloud-water period to the lower tropospheric stability (LTS) mainly first increased and then decreased, which was the opposite in the wet region. The increase in cloud-precipitation efficiency in the dry region of Northwest China is accompanied by a continuous decrease in LTS. The different configurations of regional UMF and LTS play a crucial role in the evolution of cloud-precipitation, which can be used as a diagnostic basis to predict changes in the precipitation intensity to a certain extent. Full article
(This article belongs to the Section Atmospheric Remote Sensing)
Show Figures

Graphical abstract

25 pages, 8700 KiB  
Article
A Higher-Order Graph Convolutional Network for Location Recommendation of an Air-Quality-Monitoring Station
by Yu Kang, Jie Chen, Yang Cao and Zhenyi Xu
Remote Sens. 2021, 13(8), 1600; https://doi.org/10.3390/rs13081600 - 20 Apr 2021
Cited by 4 | Viewed by 2490
Abstract
The location recommendation of an air-quality-monitoring station is a prerequisite for inferring the air-quality distribution in urban areas. How to use a limited number of monitoring equipment to accurately infer air quality depends on the location of the monitoring equipment. In this paper, [...] Read more.
The location recommendation of an air-quality-monitoring station is a prerequisite for inferring the air-quality distribution in urban areas. How to use a limited number of monitoring equipment to accurately infer air quality depends on the location of the monitoring equipment. In this paper, our main objective was how to recommend optimal monitoring-station locations based on existing ones to maximize the accuracy of a air-quality inference model for inferring the air-quality distribution of an entire urban area. This task is challenging for the following main reasons: (1) air-quality distribution has spatiotemporal interactions and is affected by many complex external influential factors, such as weather and points of interest (POIs), and (2) how to effectively correlate the air-quality inference model with the monitoring station location recommendation model so that the recommended station can maximize the accuracy of the air-quality inference model. To solve the aforementioned challenges, we formulate the monitoring station location as an urban spatiotemporal graph (USTG) node recommendation problem in which each node represents a region with time-varying air-quality values. We design an effective air-quality inference model-based proposed high-order graph convolution (HGCNInf) that could capture the spatiotemporal interaction of air-quality distribution and could extract external influential factor features. Furthermore, HGCNInf can learn the correlation degree between the nodes in USTG that reflects the spatiotemporal changes in air quality. Based on the correlation degree, we design a greedy algorithm for minimizing information entropy (GMIE) that aims to mark the recommendation priority of unlabeled nodes according to the ability to improve the inference accuracy of HGCNInf through the node incremental learning method. Finally, we recommend the node with the highest priority as the new monitoring station location, which could bring about the greatest accuracy improvement to HGCNInf. Full article
Show Figures

Figure 1

20 pages, 13685 KiB  
Article
Detecting Archaeological Features with Airborne Laser Scanning in the Alpine Tundra of Sápmi, Northern Finland
by Oula Seitsonen and Janne Ikäheimo
Remote Sens. 2021, 13(8), 1599; https://doi.org/10.3390/rs13081599 - 20 Apr 2021
Cited by 9 | Viewed by 3851
Abstract
Open access airborne laser scanning (ALS) data have been available in Finland for over a decade and have been actively applied by the Finnish archaeologists in that time. The low resolution of this laser scanning 2008–2019 dataset (0.5 points/m2), however, has [...] Read more.
Open access airborne laser scanning (ALS) data have been available in Finland for over a decade and have been actively applied by the Finnish archaeologists in that time. The low resolution of this laser scanning 2008–2019 dataset (0.5 points/m2), however, has hindered its usability for archaeological prospection. In the summer of 2020, the situation changed markedly, when the Finnish National Land Survey started a new countrywide ALS survey with a higher resolution of 5 points/m2. In this paper we present the first results of applying this newly available ALS material for archaeological studies. Finnish LIDARK consortium has initiated the development of semi-automated approaches for visualizing, detecting, and analyzing archaeological features with this new dataset. Our first case studies are situated in the Alpine tundra environment of Sápmi in northern Finland, and the assessed archaeological features range from prehistoric sites to indigenous Sámi reindeer herding features and Second Word War-era German military structures. Already the initial analyses of the new ALS-5p data show their huge potential for locating, mapping, and assessing archaeological material. These results also suggest an imminent burst in the number of known archaeological sites, especially in the poorly accessible and little studied northern wilderness areas, when more data become available. Full article
(This article belongs to the Special Issue Remote Sensing Approaches for Archaeology)
Show Figures

Graphical abstract

24 pages, 6964 KiB  
Article
Development of Novel Classification Algorithms for Detection of Floating Plastic Debris in Coastal Waterbodies Using Multispectral Sentinel-2 Remote Sensing Imagery
by Bidroha Basu, Srikanta Sannigrahi, Arunima Sarkar Basu and Francesco Pilla
Remote Sens. 2021, 13(8), 1598; https://doi.org/10.3390/rs13081598 - 20 Apr 2021
Cited by 34 | Viewed by 5850
Abstract
Plastic pollution poses a significant environmental threat to the existence and health of biodiversity and the marine ecosystem. The intrusion of plastic to the food chain is a massive concern for human health. Urbanisation, population growth, and tourism have been identified as major [...] Read more.
Plastic pollution poses a significant environmental threat to the existence and health of biodiversity and the marine ecosystem. The intrusion of plastic to the food chain is a massive concern for human health. Urbanisation, population growth, and tourism have been identified as major contributors to the growing rate of plastic debris, particularly in waterbodies such as rivers, lakes, seas, and oceans. Over the past decade, many studies have focused on identifying the waterbodies near the coastal regions where a high level of accumulated plastics have been found. This research focused on using high-resolution Sentinel-2 satellite remote sensing images to detect floating plastic debris in coastal waterbodies. Accurate detection of plastic debris can help in deploying appropriate measures to reduce plastics in oceans. Two unsupervised (K-means and fuzzy c-means (FCM)) and two supervised (support vector regression (SVR) and semi-supervised fuzzy c-means (SFCM)) classification algorithms were developed to identify floating plastics. The unsupervised classification algorithms consider the remote sensing data as the sole input to develop the models, while the supervised classifications require in situ information on the presence/absence of floating plastics in selected Sentinel-2 grids for modelling. Data from Cyprus and Greece were considered to calibrate the supervised models and to estimate model efficiency. Out of available multiple bands of Sentinel-2 data, a combination of 6 bands of reflectance data (blue, green, red, red edge 2, near infrared, and short wave infrared 1) and two indices (NDVI and FDI) were selected to develop the models, as they were found to be most efficient for detecting floating plastics. The SVR-based supervised classification has an accuracy in the range of 96.9–98.4%, while that for SFCM and FCM clustering are between 35.7 and 64.3% and 69.8 and 82.2%, respectively, and for K-means, the range varies from 69.8 to 81.4%. It needs to be noted that the total number of grids with floating plastics in real-world data considered in this study is 59, which needs to be increased considerably to improve model performance. Training data from other parts of the world needs to be collected to investigate the performance of the classification algorithms at a global scale. Full article
Show Figures

Figure 1

25 pages, 15506 KiB  
Article
Assessing Forest Phenology: A Multi-Scale Comparison of Near-Surface (UAV, Spectral Reflectance Sensor, PhenoCam) and Satellite (MODIS, Sentinel-2) Remote Sensing
by Shangharsha Thapa, Virginia E. Garcia Millan and Lars Eklundh
Remote Sens. 2021, 13(8), 1597; https://doi.org/10.3390/rs13081597 - 20 Apr 2021
Cited by 41 | Viewed by 8982
Abstract
The monitoring of forest phenology based on observations from near-surface sensors such as Unmanned Aerial Vehicles (UAVs), PhenoCams, and Spectral Reflectance Sensors (SRS) over satellite sensors has recently gained significant attention in the field of remote sensing and vegetation phenology. However, exploring different [...] Read more.
The monitoring of forest phenology based on observations from near-surface sensors such as Unmanned Aerial Vehicles (UAVs), PhenoCams, and Spectral Reflectance Sensors (SRS) over satellite sensors has recently gained significant attention in the field of remote sensing and vegetation phenology. However, exploring different aspects of forest phenology based on observations from these sensors and drawing comparatives from the time series of vegetation indices (VIs) still remains a challenge. Accordingly, this research explores the potential of near-surface sensors to track the temporal dynamics of phenology, cross-compare their results against satellite observations (MODIS, Sentinel-2), and validate satellite-derived phenology. A time series of Normalized Difference Vegetation Index (NDVI), Green Chromatic Coordinate (GCC), and Normalized Difference of Green & Red (VIgreen) indices were extracted from both near-surface and satellite sensor platforms. The regression analysis between time series of NDVI data from different sensors shows the high Pearson’s correlation coefficients (r > 0.75). Despite the good correlations, there was a remarkable offset and significant differences in slope during green-up and senescence periods. SRS showed the most distinctive NDVI profile and was different to other sensors. PhenoCamGCC tracked green-up of the canopy better than the other indices, with a well-defined start, end, and peak of the season, and was most closely correlated (r > 0.93) with the satellites, while SRS-based VIgreen accounted for the least correlation (r = 0.58) against Sentinel-2. Phenophase transition dates were estimated and validated against visual inspection of the PhenoCam data. The Start of Spring (SOS) and End of Spring (EOS) could be predicted with an accuracy of <3 days with GCC, while these metrics from VIgreen and NDVI resulted in a slightly higher bias of (3–10) days. The observed agreement between UAVNDVI vs. satelliteNDVI and PhenoCamGCC vs. satelliteGCC suggests that it is feasible to use PhenoCams and UAVs for satellite data validation and upscaling. Thus, a combination of these near-surface vegetation metrics is promising for a holistic understanding of vegetation phenology from canopy perspective and could serve as a good foundation for analysing the interoperability of different sensors for vegetation dynamics and change analysis. Full article
(This article belongs to the Special Issue UAV Photogrammetry for Environmental Monitoring)
Show Figures

Graphical abstract

18 pages, 8804 KiB  
Article
Long Time Series High-Quality and High-Consistency Land Cover Mapping Based on Machine Learning Method at Heihe River Basin
by Bo Zhong, Aixia Yang, Kunsheng Jue and Junjun Wu
Remote Sens. 2021, 13(8), 1596; https://doi.org/10.3390/rs13081596 - 20 Apr 2021
Cited by 9 | Viewed by 3017
Abstract
Long time series of land cover changes (LCCs) are critical in the analysis of long-term climate, environmental, and ecological changes. Although several moderate to fine resolution global land cover datasets have been publicly released and they show strong consistency at the global scale, [...] Read more.
Long time series of land cover changes (LCCs) are critical in the analysis of long-term climate, environmental, and ecological changes. Although several moderate to fine resolution global land cover datasets have been publicly released and they show strong consistency at the global scale, they have large deviations at the regional scale; furthermore, high-quality land cover datasets from before 2000 are not available and the classification consistency among different datasets is not very good. Thus, long time series of land cover datasets with high quality and consistency are in great demand but they are still unavailable, even at the regional scale. The Landsat series of satellite imagery composed of eight successive satellites can be traced back to 1972 and it is, therefore, possible to produce a long time series land cover dataset. In addition, the newly available satellite data have the capability to construct time series satellite images and a time series analysis method such as LCMM can be employed for making high-quality land cover datasets. Therefore, by taking the advantages of the two categories of satellite data, we proposed a new time series land cover mapping method based on machine learning and it, thereafter, is applied to Heihe River Basin (HRB) for verification purposes. Firstly, the high-quality land cover datasets at HRB from 2011–2015, which were retrieved using the LCMM method, are used for quickly and accurately making training samples. Secondly, a strategy for transferring the training samples after 2011 to earlier years is established. Thirdly, the random forest model is employed to train the selected yearly samples and a land cover map for every year is subsequently made. Finally, comprehensive analysis and validation are carried out for evaluation. In this study, a long time series land cover dataset including 1986, 1990, 1995, 2000, 2005, 2010, 2011, 2012, 2013, 2014, and 2015 is finally made and an average precision of about 90% is achieved. It is the longest time series land cover map with 30 m resolution at HRB and the dataset has good time continuity and stability. Full article
Show Figures

Figure 1

18 pages, 8906 KiB  
Article
Estimating Aboveground Biomass Using Sentinel-2 MSI Data and Ensemble Algorithms for Grassland in the Shengjin Lake Wetland, China
by Chunhua Li, Lizhi Zhou and Wenbin Xu
Remote Sens. 2021, 13(8), 1595; https://doi.org/10.3390/rs13081595 - 20 Apr 2021
Cited by 56 | Viewed by 5644
Abstract
Wetland vegetation aboveground biomass (AGB) directly indicates wetland ecosystem health and is critical for water purification, carbon cycle, and biodiversity conservation. Accurate AGB estimation is essential for the monitoring and supervision of ecosystems, especially in seasonal floodplain wetlands. This paper explored the capability [...] Read more.
Wetland vegetation aboveground biomass (AGB) directly indicates wetland ecosystem health and is critical for water purification, carbon cycle, and biodiversity conservation. Accurate AGB estimation is essential for the monitoring and supervision of ecosystems, especially in seasonal floodplain wetlands. This paper explored the capability of spectral and texture features from the Sentinel-2 Multispectral Instrument (MSI) for modeling grassland AGB using random forest (RF) and extreme gradient boosting (XGBoost) algorithms in Shengjin Lake wetland (a Ramsar site). We use five-fold cross-validation to verify the model effectiveness. The results indicated that the RF and XGBoost models had a robust and efficient performance (with root mean square error (RMSE) of 126.571 g·m−2 and R2 of 0.844 for RF, RMSE of 112.425 g·m−2 and R2 of 0.869 for XGBoost), and the XGBoost models, by contrast, performed better. Both traditional and red-edge vegetation indices (VIs) obtained satisfactory results of AGB estimation (RMSE = 127.936 g·m−2, RMSE = 125.879 g·m−2 in XGBoost models, respectively), with the red-edge VIs contributed more to the AGB models. Moreover, we selected eight gray-level co-occurrence matrix (GLCM) textures calculated by four processing window sizes using the mean value of four offsets, and further analyzed the results of three analysis sets. Textures derived from traditional and red-edge bands using a 7 × 7 window size performed better in biomass estimation. This finding suggested that textures derived from the traditional bands were as important as the red-edge bands. The introduction of textures moderately improved the accuracy of modeling AGB, whereas the use of textures alo ne was not satisfactory. This research demonstrated that using the Sentinel-2 MSI and the two ensemble algorithms is an effective method for long-term dynamic monitoring and assessment of grass AGB in seasonal floodplain wetlands, which can support sustainable management and carbon accounting of wetland ecosystems. Full article
(This article belongs to the Section Ecological Remote Sensing)
Show Figures

Figure 1

19 pages, 4788 KiB  
Article
Evaluation of Total Ozone Column from Multiple Satellite Measurements in the Antarctic Using the Brewer Spectrophotometer
by Songkang Kim, Sang-Jong Park, Hana Lee, Dha Hyun Ahn, Yeonjin Jung, Taejin Choi, Bang Yong Lee, Seong-Joong Kim and Ja-Ho Koo
Remote Sens. 2021, 13(8), 1594; https://doi.org/10.3390/rs13081594 - 20 Apr 2021
Cited by 5 | Viewed by 3264
Abstract
The ground-based ozone observation instrument, Brewer spectrophotometer (Brewer), was used to evaluate the quality of the total ozone column (TOC) produced by multiple polar-orbit satellite measurements at three stations in Antarctica (King Sejong, Jang Bogo, and Zhongshan stations). While all satellite TOCs showed [...] Read more.
The ground-based ozone observation instrument, Brewer spectrophotometer (Brewer), was used to evaluate the quality of the total ozone column (TOC) produced by multiple polar-orbit satellite measurements at three stations in Antarctica (King Sejong, Jang Bogo, and Zhongshan stations). While all satellite TOCs showed high correlations with Brewer TOCs (R = ~0.8 to 0.9), there are some TOC differences among satellite data in austral spring, which is mainly attributed to the bias of Atmospheric Infrared Sounder (AIRS) TOC. The quality of satellite TOCs is consistent between Level 2 and 3 data, implying that “which satellite TOC is used” can induce larger uncertainty than “which spatial resolution is used” for the investigation of the Antarctic TOC pattern. Additionally, the quality of satellite TOC is regionally different (e.g., OMI TOC is a little higher at the King Sejong station, but lower at the Zhongshan station than the Brewer TOC). Thus, it seems necessary to consider the difference of multiple satellite data for better assessing the spatiotemporal pattern of Antarctic TOC. Full article
Show Figures

Graphical abstract

33 pages, 5156 KiB  
Article
Presenting a Semi-Automatic, Statistically-Based Approach to Assess the Sharpness Level of Optical Images from Natural Targets via the Edge Method. Case Study: The Landsat 8 OLI–L1T Data
by Luca Cenci, Valerio Pampanoni, Giovanni Laneve, Carla Santella and Valentina Boccia
Remote Sens. 2021, 13(8), 1593; https://doi.org/10.3390/rs13081593 - 20 Apr 2021
Cited by 7 | Viewed by 2925
Abstract
Developing reliable methodologies of data quality assessment is of paramount importance for maximizing the exploitation of Earth observation (EO) products. Among the different factors influencing EO optical image quality, sharpness has a relevant role. When implementing on-orbit approaches of sharpness assessment, such as [...] Read more.
Developing reliable methodologies of data quality assessment is of paramount importance for maximizing the exploitation of Earth observation (EO) products. Among the different factors influencing EO optical image quality, sharpness has a relevant role. When implementing on-orbit approaches of sharpness assessment, such as the edge method, a crucial step that strongly affects the final results is the selection of suitable edges to use for the analysis. Within this context, this paper aims at proposing a semi-automatic, statistically-based edge method (SaSbEM) that exploits edges extracted from natural targets easily and largely available on Earth: agricultural fields. For each image that is analyzed, SaSbEM detects numerous suitable edges (e.g., dozens-hundreds) characterized by specific geometrical and statistical criteria. This guarantees the repeatability and reliability of the analysis. Then, it implements a standard edge method to assess the sharpness level of each edge. Finally, it performs a statistical analysis of the results to have a robust characterization of the image sharpness level and its uncertainty. The method was validated by using Landsat 8 L1T products. Results proved that: SaSbEM is capable of performing a reliable and repeatable sharpness assessment; Landsat 8 L1T data are characterized by very good sharpness performance. Full article
(This article belongs to the Section Environmental Remote Sensing)
Show Figures

Graphical abstract

19 pages, 3917 KiB  
Article
Tree Crowns Cause Border Effects in Area-Based Biomass Estimations from Remote Sensing
by Nikolai Knapp, Andreas Huth and Rico Fischer
Remote Sens. 2021, 13(8), 1592; https://doi.org/10.3390/rs13081592 - 20 Apr 2021
Cited by 14 | Viewed by 2915
Abstract
The estimation of forest biomass by remote sensing is constrained by different uncertainties. An important source of uncertainty is the border effect, as tree crowns are not constrained by plot borders. Lidar remote sensing systems record the canopy height within a certain area, [...] Read more.
The estimation of forest biomass by remote sensing is constrained by different uncertainties. An important source of uncertainty is the border effect, as tree crowns are not constrained by plot borders. Lidar remote sensing systems record the canopy height within a certain area, while the ground-truth is commonly the aboveground biomass of inventory trees geolocated at their stem positions. Hence, tree crowns reaching out of or into the observed area are contributing to the uncertainty in canopy-height–based biomass estimation. In this study, forest inventory data and simulations of a tropical rainforest’s canopy were used to quantify the amount of incoming and outgoing canopy volume and surface at different plot sizes (10, 20, 50, and 100 m). This was performed with a bottom-up approach entirely based on forest inventory data and allometric relationships, from which idealized lidar canopy heights were simulated by representing the forest canopy as a 3D voxel space. In this voxel space, the position of each voxel is known, and it is also known to which tree each voxel belongs and where the stem of this tree is located. This knowledge was used to analyze the role of incoming and outgoing crowns. The contribution of the border effects to the biomass estimation uncertainty was quantified for the case of small-footprint lidar (a simulated canopy height model, CHM) and large-footprint lidar (simulated waveforms with footprint sizes of 23 and 65 m, corresponding to the GEDI and ICESat GLAS sensors). A strong effect of spatial scale was found: e.g., for 20-m plots, on average, 16% of the CHM surface belonged to trees located outside of the plots, while for 100-m plots this incoming CHM fraction was only 3%. The border effects accounted for 40% of the biomass estimation uncertainty at the 20-m scale, but had no contribution at the 100-m scale. For GEDI- and GLAS-based biomass estimates, the contributions of border effects were 23% and 6%, respectively. This study presents a novel approach for disentangling the sources of uncertainty in the remote sensing of forest structures using virtual canopy modeling. Full article
(This article belongs to the Special Issue Remote Sensing Models of Forest Structure, Composition, and Function)
Show Figures

Graphical abstract

17 pages, 8116 KiB  
Article
City-Scale Mapping of Urban Façade Color Using Street-View Imagery
by Teng Zhong, Cheng Ye, Zian Wang, Guoan Tang, Wei Zhang and Yu Ye
Remote Sens. 2021, 13(8), 1591; https://doi.org/10.3390/rs13081591 - 20 Apr 2021
Cited by 22 | Viewed by 4436
Abstract
Precise urban façade color is the foundation of urban color planning. Nevertheless, existing research on urban colors usually relies on manual sampling due to technical limitations, which brings challenges for evaluating urban façade color with the co-existence of city-scale and fine-grained resolution. In [...] Read more.
Precise urban façade color is the foundation of urban color planning. Nevertheless, existing research on urban colors usually relies on manual sampling due to technical limitations, which brings challenges for evaluating urban façade color with the co-existence of city-scale and fine-grained resolution. In this study, we propose a deep learning-based approach for mapping the urban façade color using street-view imagery. The dominant color of the urban façade (DCUF) is adopted as an indicator to describe the urban façade color. A case study in Shenzhen was conducted to measure the urban façade color using Baidu Street View (BSV) panoramas, with city-scale mapping of the urban façade color in both irregular geographical units and regular grids. Shenzhen’s urban façade color has a gray tone with low chroma. The results demonstrate that the proposed method has a high level of accuracy for the extraction of the urban façade color. In short, this study contributes to the development of urban color planning by efficiently analyzing the urban façade color with higher levels of validity across city-scale areas. Insights into the mapping of the urban façade color from the humanistic perspective could facilitate higher quality urban space planning and design. Full article
(This article belongs to the Special Issue Optical Remote Sensing Applications in Urban Areas)
Show Figures

Figure 1

23 pages, 29385 KiB  
Article
Leveraging River Network Topology and Regionalization to Expand SWOT-Derived River Discharge Time Series in the Mississippi River Basin
by Cassandra Nickles and Edward Beighley
Remote Sens. 2021, 13(8), 1590; https://doi.org/10.3390/rs13081590 - 20 Apr 2021
Cited by 3 | Viewed by 2451
Abstract
The upcoming Surface Water and Ocean Topography (SWOT) mission will measure rivers wider than 50–100 m using a 21-day orbit, providing river reach derived discharges that can inform applications like flood forecasting and large-scale hydrologic modelling. However, these discharges will not be uniform [...] Read more.
The upcoming Surface Water and Ocean Topography (SWOT) mission will measure rivers wider than 50–100 m using a 21-day orbit, providing river reach derived discharges that can inform applications like flood forecasting and large-scale hydrologic modelling. However, these discharges will not be uniform in time or coincident with those of neighboring reaches. It is often assumed discharge upstream and downstream of a river location are highly correlated in natural conditions and can be transferred using a scaling factor like the drainage area ratio between locations. Here, the applicability of the drainage area ratio method to integrate, in space and time, SWOT-derived discharges throughout the observable river network of the Mississippi River basin is assessed. In some cases, area ratios ranging from 0.01 to 100 can be used, but cumulative urban area and/or the number of dams/reservoirs between locations decrease the method’s applicability. Though the mean number of SWOT observations for a given reach increases by 83% and the number of peak events captured increases by 100%, expanded SWOT sampled time series distributions often underperform compared to the original SWOT sampled time series for significance tests and quantile results. Alternate expansion methods may be more viable for future work. Full article
Show Figures

Figure 1

26 pages, 39413 KiB  
Article
Top-of-Atmosphere Retrieval of Multiple Crop Traits Using Variational Heteroscedastic Gaussian Processes within a Hybrid Workflow
by José Estévez, Katja Berger, Jorge Vicent, Juan Pablo Rivera-Caicedo, Matthias Wocher and Jochem Verrelst
Remote Sens. 2021, 13(8), 1589; https://doi.org/10.3390/rs13081589 - 20 Apr 2021
Cited by 29 | Viewed by 3796
Abstract
In support of cropland monitoring, operational Copernicus Sentinel-2 (S2) data became available globally and can be explored for the retrieval of important crop traits. Based on a hybrid workflow, retrieval models for six essential biochemical and biophysical crop traits were developed for both [...] Read more.
In support of cropland monitoring, operational Copernicus Sentinel-2 (S2) data became available globally and can be explored for the retrieval of important crop traits. Based on a hybrid workflow, retrieval models for six essential biochemical and biophysical crop traits were developed for both S2 bottom-of-atmosphere (BOA) L2A and S2 top-of-atmosphere (TOA) L1C data. A variational heteroscedastic Gaussian process regression (VHGPR) algorithm was trained with simulations generated by the combined leaf-canopy reflectance model PROSAILat the BOA scale and further combined with the Second Simulation of a Satellite Signal in the Solar Spectrum (6SV) atmosphere model at the TOA scale. Established VHGPR models were then applied to S2 L1C and L2A reflectance data for mapping: leaf chlorophyll content (Cab), leaf water content (Cw), fractional vegetation coverage (FVC), leaf area index (LAI), and upscaled leaf biochemical compounds, i.e., LAI ∗ Cab (laiCab) and LAI ∗ Cw (laiCw). Estimated variables were validated using in situ reference data collected during the Munich-North-Isar field campaigns within growing seasons of maize and winter wheat in the years 2017 and 2018. For leaf biochemicals, retrieval from BOA reflectance slightly outperformed results from TOA reflectance, e.g., obtaining a root mean squared error (RMSE) of 6.5 μμg/cm2 (BOA) vs. 8 μμg/cm2 (TOA) in the case of Cab. For the majority of canopy-level variables, instead, estimation accuracy was higher when using TOA reflectance data, e.g., with an RMSE of 139 g/m2 (BOA) vs. 113 g/m2 (TOA) for laiCw. Derived maps were further compared against reference products obtained from the ESA Sentinel Application Platform (SNAP) Biophysical Processor. Altogether, the consistency between L1C and L2A retrievals confirmed that crop traits can potentially be estimated directly from TOA reflectance data. Successful mapping of canopy-level crop traits including information about prediction confidence suggests that the models can be transferred over spatial and temporal scales and, therefore, can contribute to decision-making processes for cropland management. Full article
(This article belongs to the Special Issue Remote and Proximal Assessment of Plant Traits)
Show Figures

Graphical abstract

18 pages, 2449 KiB  
Article
Multiscale Very High Resolution Topographic Models in Alpine Ecology: Pros and Cons of Airborne LiDAR and Drone-Based Stereo-Photogrammetry Technologies
by Annie S. Guillaume, Kevin Leempoel, Estelle Rochat, Aude Rogivue, Michel Kasser, Felix Gugerli, Christian Parisod and Stéphane Joost
Remote Sens. 2021, 13(8), 1588; https://doi.org/10.3390/rs13081588 - 20 Apr 2021
Cited by 7 | Viewed by 3145
Abstract
The vulnerability of alpine environments to climate change presses an urgent need to accurately model and understand these ecosystems. Popularity in the use of digital elevation models (DEMs) to derive proxy environmental variables has increased over the past decade, particularly as DEMs are [...] Read more.
The vulnerability of alpine environments to climate change presses an urgent need to accurately model and understand these ecosystems. Popularity in the use of digital elevation models (DEMs) to derive proxy environmental variables has increased over the past decade, particularly as DEMs are relatively cheaply acquired at very high resolutions (VHR; <1 m spatial resolution). Here, we implement a multiscale framework and compare DEM-derived variables produced by Light Detection and Ranging (LiDAR) and stereo-photogrammetry (PHOTO) methods, with the aim of assessing their relevance and utility in species distribution modelling (SDM). Using a case study on the arctic-alpine plant, Arabis alpina, in two valleys in the western Swiss Alps, we show that both LiDAR and PHOTO technologies can be relevant for producing DEM-derived variables for use in SDMs. We demonstrate that PHOTO DEMs, up to a spatial resolution of at least 1 m, rivalled the accuracy of LiDAR DEMs, largely owing to the customizability of PHOTO DEMs to the study sites compared to commercially available LiDAR DEMs. We obtained DEMs at spatial resolutions of 6.25 cm–8 m for PHOTO and 50 cm–32 m for LiDAR, where we determined that the optimal spatial resolutions of DEM-derived variables in SDM were between 1 and 32 m, depending on the variable and site characteristics. We found that the reduced extent of PHOTO DEMs altered the calculations of all derived variables, which had particular consequences on their relevance at the site with heterogenous terrain. However, for the homogenous site, SDMs based on PHOTO-derived variables generally had higher predictive powers than those derived from LiDAR at matching resolutions. From our results, we recommend carefully considering the required DEM extent to produce relevant derived variables. We also advocate implementing a multiscale framework to appropriately assess the ecological relevance of derived variables, where we caution against the use of VHR-DEMs finer than 50 cm in such studies. Full article
Show Figures

Graphical abstract

17 pages, 1993 KiB  
Article
Earth Observation as a Facilitator of Climate Change Education in Schools: The Teachers’ Perspectives
by Panagiota Asimakopoulou, Panagiotis Nastos, Emmanuel Vassilakis, Maria Hatzaki and Assimina Antonarakou
Remote Sens. 2021, 13(8), 1587; https://doi.org/10.3390/rs13081587 - 20 Apr 2021
Cited by 6 | Viewed by 3278
Abstract
Climate change education (CCE) fosters the skills and behavioral patterns of students in regards to climate-related challenges and risks. Despite its importance, the integration of CCE in schools is challenging due to the interdisciplinary nature of climate science and the obstacles and demands [...] Read more.
Climate change education (CCE) fosters the skills and behavioral patterns of students in regards to climate-related challenges and risks. Despite its importance, the integration of CCE in schools is challenging due to the interdisciplinary nature of climate science and the obstacles and demands of everyday school reality. Here, we examine the case of satellite Remote Sensing (RS) for Earth Observation (EO) as an innovative tool for facilitating CCE. We focus on Greece, a country that, despite being a hot spot for climate change, shows a low level of CCE integration in schools and awareness for EO-based educational resources. Based on interviews with in-service teachers, our research reveals the following: (a) there is a high interest in how satellites depict environmental phenomena; (b) EO is considered an efficient vehicle for promoting CCE in schools because it illustrates climate change impacts most effectively; (c) local natural disasters, such as intense forest fires and floods, are more familiar to students and, thus, preferable for teaching when compared to global issues, such as the greenhouse effect and sea level rise; and (d) educators are in favor of short, hands-on, EO-based activities (also known as “activity-shots”), as the most useful material format for integrating climate change topics in their everyday teaching practice. Full article
(This article belongs to the Collection Teaching and Learning in Remote Sensing)
Show Figures

Figure 1

26 pages, 21310 KiB  
Article
Land Consumption Monitoring with SAR Data and Multispectral Indices
by Tania Luti, Paolo De Fioravante, Ines Marinosci, Andrea Strollo, Nicola Riitano, Valentina Falanga, Lorella Mariani, Luca Congedo and Michele Munafò
Remote Sens. 2021, 13(8), 1586; https://doi.org/10.3390/rs13081586 - 19 Apr 2021
Cited by 16 | Viewed by 2581
Abstract
Land consumption is the increase in artificial land cover, which is a major issue for environmental sustainability. In Italy, the Italian Institute for Environmental Protection and Research (ISPRA) and National System for Environmental Protection (SNPA) have the institutional duty to monitor land consumption [...] Read more.
Land consumption is the increase in artificial land cover, which is a major issue for environmental sustainability. In Italy, the Italian Institute for Environmental Protection and Research (ISPRA) and National System for Environmental Protection (SNPA) have the institutional duty to monitor land consumption yearly, through the photointerpretation of high-resolution images. This study intends to develop a methodology in order to produce maps of land consumption, by the use of the semi-automatic classification of multitemporal images, to reduce the effort of photointerpretation in detecting real changes. The developed methodology uses vegetation indices calculated over time series of images and decision rules. Three variants of the methodology were applied to detect the changes that occurred in Italy between the years 2018 and 2019, and the results were validated using ISPRA official data. The results show that the produced maps include large commission errors, but thanks to the developed methodology, the area to be photointerpreted was reduced to 7300 km2 (2.4% of Italian surface). The third variant of the methodology provided the highest detection of changes: 70.4% of the changes larger than 100 m2 (the pixel size) and over 84.0% of changes above 500 m2. Omissions are mainly related to single pixel changes, while larger changes are detected by at least one pixel in most of the cases. In conclusion, the developed methodology can improve the detection of land consumption, focusing photointerpretation work over selected areas detected automatically. Full article
(This article belongs to the Section Environmental Remote Sensing)
Show Figures

Graphical abstract

18 pages, 4642 KiB  
Article
Contribution of Snow-Melt Water to the Streamflow over the Three-River Headwater Region, China
by Sisi Li, Mingliang Liu, Jennifer C. Adam, Huawei Pi, Fengge Su, Dongyue Li, Zhaofei Liu and Zhijun Yao
Remote Sens. 2021, 13(8), 1585; https://doi.org/10.3390/rs13081585 - 19 Apr 2021
Cited by 11 | Viewed by 2716
Abstract
Snowmelt water is essential to the water resources management over the Three-River Headwater Region (TRHR), where hydrological processes are influenced by snowmelt runoff and sensitive to climate change. The objectives of this study were to analyse the contribution of snowmelt water to the [...] Read more.
Snowmelt water is essential to the water resources management over the Three-River Headwater Region (TRHR), where hydrological processes are influenced by snowmelt runoff and sensitive to climate change. The objectives of this study were to analyse the contribution of snowmelt water to the total streamflow (fQ,snow) in the TRHR by applying a snowmelt tracking algorithm and Variable Infiltration Capacity (VIC) model. The ratio of snowfall to precipitation, and the variation of the April 1 snow water equivalent (SWE) associated with fQ,snow, were identified to analyse the role of snowpack in the hydrological cycle. Prior to the simulation, the VIC model was validated based on the observed streamflow data to recognize its adequacy in the region. In order to improve the VIC model in snow hydrology simulation, Advanced Scanning Microwave Radiometer E (ASMR-E) SWE product data was used to compare with VIC output SWE to adjust the snow parameters. From 1971 to 2007, the averaged fQ,snow was 19.9% with a significant decreasing trend over entire TRHR (p < 0.05).The influence factor resulted in the rate of change in fQ,snow which were different for each sub-basin TRHR. The decreasing rate of fQ,snow was highest of 0.24%/year for S_Lantsang, which should be due to the increasing streamflow and the decreasing snowmelt water. For the S_Yangtze, the increasing streamflow contributed more than the stable change of snowmelt water to the decreasing fQ,snow with a rate of 0.1%/year. The April 1 SWE with the minimum value appearing after 2000 and the decreased ratio of snowfall to precipitation during the study period, suggested the snow solid water resource over the TRHR was shrinking. Our results imply that the role of snow in the snow-hydrological regime is weakening in the TRHR in terms of water supplement and runoff regulation due to the decreased fQ,snow and snowfall. Full article
(This article belongs to the Special Issue Remote Sensing for Streamflow Simulation)
Show Figures

Figure 1

11 pages, 4155 KiB  
Technical Note
BIM Supported Surveying and Imaging Combination for Heritage Conservation
by Pedro Martín-Lerones, David Olmedo, Ana López-Vidal, Jaime Gómez-García-Bermejo and Eduardo Zalama
Remote Sens. 2021, 13(8), 1584; https://doi.org/10.3390/rs13081584 - 19 Apr 2021
Cited by 17 | Viewed by 2745
Abstract
As the basis for analysis and management of heritage assets, 3D laser scanning and photogrammetric 3D reconstruction have been probed as adequate techniques for point cloud data acquisition. The European Directive 2014/24/EU imposes BIM Level 2 for government centrally procured projects as a [...] Read more.
As the basis for analysis and management of heritage assets, 3D laser scanning and photogrammetric 3D reconstruction have been probed as adequate techniques for point cloud data acquisition. The European Directive 2014/24/EU imposes BIM Level 2 for government centrally procured projects as a collaborative process of producing federated discipline-specific models. Although BIM software resources are intensified and increasingly growing, distinct specifications for heritage (H-BIM) are essential to driving particular processes and tools to efficiency shifting from point clouds to meaningful information ready to be exchanged using non-proprietary formats, such as Industry Foundation Classes (IFC). This paper details a procedure for processing enriched 3D point clouds into the REVIT software package due to its worldwide popularity and how closely it integrates with the BIM concept. The procedure will be additionally supported by a tailored plug-in to make high-quality 3D digital survey datasets usable together with 2D imaging, enhancing the capability to depict contextualized important graphical data to properly planning conservation actions. As a practical example, a 2D/3D enhanced combination is worked to accurately include into a BIM project, the length, orientation, and width of a big crack on the walls of the Castle of Torrelobatón (Spain) as a representative heritage building. Full article
(This article belongs to the Section Engineering Remote Sensing)
Show Figures

Graphical abstract

22 pages, 10181 KiB  
Article
A Neural-Network Based Spatial Resolution Downscaling Method for Soil Moisture: Case Study of Qinghai Province
by Aifeng Lv, Zhilin Zhang and Hongchun Zhu
Remote Sens. 2021, 13(8), 1583; https://doi.org/10.3390/rs13081583 - 19 Apr 2021
Cited by 11 | Viewed by 2400
Abstract
Currently, soil-moisture data extracted from microwave data suffer from poor spatial resolution. To overcome this problem, this study proposes a method to downscale the soil moisture spatial resolution. The proposed method establishes a statistical relationship between low-spatial-resolution input data and soil-moisture data from [...] Read more.
Currently, soil-moisture data extracted from microwave data suffer from poor spatial resolution. To overcome this problem, this study proposes a method to downscale the soil moisture spatial resolution. The proposed method establishes a statistical relationship between low-spatial-resolution input data and soil-moisture data from a land-surface model based on a neural network (NN). This statistical relationship is then applied to high-spatial-resolution input data to obtain high-spatial-resolution soil-moisture data. The input data include passive microwave data (SMAP, AMSR2), active microwave data (ASCAT), MODIS data, and terrain data. The target soil moisture data were collected from CLDAS dataset. The results show that the addition of data such as the land-surface temperature (LST), the normalized difference vegetation index (NDVI), the normalized shortwave-infrared difference bare soil moisture indices (NSDSI), the digital elevation model (DEM), and calculated slope data (SLOPE) to active and passive microwave data improves the retrieval accuracy of the model. Taking the CLDAS soil moisture data as a benchmark, the spatial correlation increases from 0.597 to 0.669, the temporal correlation increases from 0.401 to 0.475, the root mean square error decreases from 0.051 to 0.046, and the mean absolute error decreases from 0.041 to 0.036. Triple collocation was applied in the form of [NN, FY3C, GEOS-5] based on the extracted retrieved soil-moisture data to obtain the error variance and correlation coefficient between each product and the actual soil-moisture data. Therefore, we conclude that NN data, which have the lowest error variance (0.00003) and the highest correlation coefficient (0.811), are the most applicable to Qinghai Province. The high-spatial-resolution data obtained from the NN, CLDAS data, SMAP data, and AMSR2 data were correlated with the ground-station data respectively, and the result of better NN data quality was obtained. This analysis demonstrates that the NN-based method is a promising approach for obtaining high-spatial-resolution soil-moisture data. Full article
(This article belongs to the Special Issue Remote Sensing in Hydrology and Water Resources Management)
Show Figures

Figure 1

23 pages, 7729 KiB  
Article
Morphodynamic Controls for Growth and Evolution of a Rubble Coral Island
by Lara Talavera, Ana Vila-Concejo, Jody M. Webster, Courtney Smith, Stephanie Duce, Thomas E. Fellowes, Tristan Salles, Daniel Harris, Jon Hill, Will Figueira and Jörg Hacker
Remote Sens. 2021, 13(8), 1582; https://doi.org/10.3390/rs13081582 - 19 Apr 2021
Cited by 10 | Viewed by 2668
Abstract
Rubble islands are dynamic sedimentary features present on reef platforms that evolve under a variety of morphodynamic processes and controlling mechanisms. They provide valuable inhabitable land for small island nations, critical habitat for numerous species, and are threatened by climate change. Aiming to [...] Read more.
Rubble islands are dynamic sedimentary features present on reef platforms that evolve under a variety of morphodynamic processes and controlling mechanisms. They provide valuable inhabitable land for small island nations, critical habitat for numerous species, and are threatened by climate change. Aiming to investigate the controlling mechanisms dictating the evolution of One Tree Island (OTI), a rubble island in the Southern Great Barrier Reef, we combined different remotely-sensed data across varying timescales with wave data extracted from satellite altimetry and cyclone activity. Our findings show that (1) OTI had expanded by 7% between 1978 and 2019, (2) significant gross planform decadal adjustments were governed by the amount, intensity, proximity, and relative position of cyclones as well as El Niño Southern Oscillation (ENSO) phases, and (3) the mechanisms of island growth involve rubble spits delivering and redistributing rubble to the island through alongshore sediment transport and wave overtopping. Frequent short-term monitoring of the island and further research coupling variations in the different factors driving island change (i.e., sediment availability, reef-wave interactions, and extreme events) are needed to shed light on the future trajectory of OTI and other rubble islands under a climate change scenario. Full article
(This article belongs to the Special Issue UAV Application for Monitoring Coastal Morphology)
Show Figures

Figure 1

24 pages, 3162 KiB  
Article
New Biomass Estimates for Chaparral-Dominated Southern California Landscapes
by Charlie C. Schrader-Patton and Emma C. Underwood
Remote Sens. 2021, 13(8), 1581; https://doi.org/10.3390/rs13081581 - 19 Apr 2021
Cited by 8 | Viewed by 2985
Abstract
Chaparral shrublands are the dominant wildland vegetation type in Southern California and the most extensive ecosystem in the state. Disturbance by wildfire and climate change have created a dynamic landscape in which biomass mapping is key in tracking the ability of chaparral shrublands [...] Read more.
Chaparral shrublands are the dominant wildland vegetation type in Southern California and the most extensive ecosystem in the state. Disturbance by wildfire and climate change have created a dynamic landscape in which biomass mapping is key in tracking the ability of chaparral shrublands to sequester carbon. Despite this importance, most national and regional scale estimates do not account for shrubland biomass. Employing plot data from several sources, we built a random forest model to predict aboveground live biomass in Southern California using remote sensing data (Landsat Normalized Difference Vegetation Index (NDVI)) and a suite of geophysical variables. By substituting the NDVI and precipitation predictors for any given year, we were able to apply the model to each year from 2000 to 2019. Using a total of 980 field plots, our model had a k-fold cross-validation R2 of 0.51 and an RMSE of 3.9. Validation by vegetation type ranged from R2 = 0.17 (RMSE = 9.7) for Sierran mixed-conifer to R2 = 0.91 (RMSE = 2.3) for sagebrush. Our estimates showed an improvement in accuracy over two other biomass estimates that included shrublands, with an R2 = 0.82 (RMSE = 4.7) compared to R2 = 0.068 (RMSE = 6.7) for a global biomass estimate and R2 = 0.29 (RMSE = 5.9) for a regional biomass estimate. Given the importance of accurate biomass estimates for resource managers, we calculated the mean year 2010 shrubland biomasses for the four national forests that ranged from 3.5 kg/m2 (Los Padres) to 2.3 kg/m2 (Angeles and Cleveland). Finally, we compared our estimates to field-measured biomasses from the literature summarized by shrubland vegetation type and age class. Our model provides a transparent and repeatable method to generate biomass measurements in any year, thereby providing data to track biomass recovery after management actions or disturbances such as fire. Full article
Show Figures

Figure 1

20 pages, 10810 KiB  
Article
Downscaling Land Surface Temperature Based on Non-Linear Geographically Weighted Regressive Model over Urban Areas
by Shumin Wang, Youming Luo, Xia Li, Kaixiang Yang, Qiang Liu, Xiaobo Luo and Xiuhong Li
Remote Sens. 2021, 13(8), 1580; https://doi.org/10.3390/rs13081580 - 19 Apr 2021
Cited by 15 | Viewed by 2732
Abstract
Land surface temperature (LST) is a vital physical parameter in geoscience research and plays a prominent role in surface and atmosphere interaction. Due to technical restrictions, the spatiotemporal resolution of satellite remote sensing LST data is relatively low, which limits the potential applications [...] Read more.
Land surface temperature (LST) is a vital physical parameter in geoscience research and plays a prominent role in surface and atmosphere interaction. Due to technical restrictions, the spatiotemporal resolution of satellite remote sensing LST data is relatively low, which limits the potential applications of these data. An LST downscaling algorithm can effectively alleviate this problem and endow the LST data with more spatial details. Considering the spatial nonstationarity, downscaling algorithms have been gradually developed from least square models to geographical models. The current geographical LST downscaling models only consider the linear relationship between LST and auxiliary parameters, whereas non-linear relationships are neglected. Our study addressed this issue by proposing an LST downscaling algorithm based on a non-linear geographically weighted regressive (NL-GWR) model and selected the optimal combination of parameters to downscale the spatial resolution of a moderate resolution imaging spectroradiometer (MODIS) LST from 1000 m to 100 m. We selected Jinan city in north China and Wuhan city in south China from different seasons as study areas and used Landsat 8 images as reference data to verify the downscaling LST. The results indicated that the NL-GWR model performed well in all the study areas with lower root mean square error (RMSE) and mean absolute error (MAE), rather than the linear model. Full article
(This article belongs to the Special Issue Land Surface Temperature Estimation Using Remote Sensing)
Show Figures

Figure 1

17 pages, 6747 KiB  
Article
Decision-Level and Feature-Level Integration of Remote Sensing and Geospatial Big Data for Urban Land Use Mapping
by Jiadi Yin, Ping Fu, Nicholas A. S. Hamm, Zhichao Li, Nanshan You, Yingli He, Ali Cheshmehzangi and Jinwei Dong
Remote Sens. 2021, 13(8), 1579; https://doi.org/10.3390/rs13081579 - 19 Apr 2021
Cited by 13 | Viewed by 3485
Abstract
Information about urban land use is important for urban planning and sustainable development. The emergence of geospatial big data (GBD), increased the availability of remotely sensed (RS) data and the development of new methods for data integration to provide new opportunities for mapping [...] Read more.
Information about urban land use is important for urban planning and sustainable development. The emergence of geospatial big data (GBD), increased the availability of remotely sensed (RS) data and the development of new methods for data integration to provide new opportunities for mapping types of urban land use. However, the modes of RS and GBD integration are diverse due to the differences in data, study areas, classifiers, etc. In this context, this study aims to summarize the main methods of data integration and evaluate them via a case study of urban land use mapping in Hangzhou, China. We first categorized the RS and GBD integration methods into decision-level integration (DI) and feature-level integration (FI) and analyzed their main differences by reviewing the existing literature. The two methods were then applied for mapping urban land use types in Hangzhou city, based on urban parcels derived from the OpenStreetMap (OSM) road network, 10 m Sentinel-2A images, and points of interest (POI). The corresponding classification results were validated quantitatively and qualitatively using the same testing dataset. Finally, we illustrated the advantages and disadvantages of both approaches via bibliographic evidence and quantitative analysis. The results showed that: (1) The visual comparison indicates a generally better performance of DI-based classification than FI-based classification; (2) DI-based urban land use mapping is easy to implement, while FI-based land use mapping enables the mixture of features; (3) DI-based and FI-based methods can be used together to improve urban land use mapping, as they have different performances when classifying different types of land use. This study provides an improved understanding of urban land use mapping in terms of the RS and GBD integration strategy. Full article
Show Figures

Figure 1

15 pages, 22844 KiB  
Article
Long-Term and Emergency Monitoring of Zhongbao Landslide Using Space-Borne and Ground-Based InSAR
by Ting Xiao, Wei Huang, Yunkai Deng, Weiming Tian and Yonglian Sha
Remote Sens. 2021, 13(8), 1578; https://doi.org/10.3390/rs13081578 - 19 Apr 2021
Cited by 11 | Viewed by 2540
Abstract
This work presents the ideal combination of space-borne and ground-based (GB) Interferometric Synthetic Aperture Radar (InSAR) applications. In the absence of early investigation reporting and specialized monitoring, the Zhongbao landslide unexpectedly occurred on 25 July 2020, forming a barrier lake that caused an [...] Read more.
This work presents the ideal combination of space-borne and ground-based (GB) Interferometric Synthetic Aperture Radar (InSAR) applications. In the absence of early investigation reporting and specialized monitoring, the Zhongbao landslide unexpectedly occurred on 25 July 2020, forming a barrier lake that caused an emergency. As an emergency measure, the GB-InSAR system was installed 1.8 km opposite the landslide to assess real-time cumulative deformation with a monitoring frequency of 3 min. A zone of strong deformation was detected, with 178 mm deformation accumulated within 15 h, and then a successful emergency warning was issued to evacuate on-site personnel. Post-event InSAR analysis of 19 images acquired by the ESA Sentinel-1 from December 2019 to August 2020 revealed that the landslide started in March 2020. However, the deformation time series obtained from satellite InSAR did not show any signs that the landslide had occurred. The results suggest that satellite InSAR is effective for mapping unstable areas but is not qualified for rapid landslide monitoring and timely warning. The GB-InSAR system performs well in monitoring and providing early warning, even with dense vegetation on the landslide. The results show the shortcomings of satellite InSAR and GB-InSAR and a clearer understanding of the necessity of combining multiple monitoring methods. Full article
(This article belongs to the Special Issue Remote Sensing for Landslide Monitoring, Mapping and Modeling)
Show Figures

Figure 1

15 pages, 3913 KiB  
Article
Evaporation Duct Height Nowcasting in China’s Yellow Sea Based on Deep Learning
by Jie Han, Jia-Ji Wu, Qing-Lin Zhu, Hong-Guang Wang, Yu-Feng Zhou, Ming-Bo Jiang, Shou-Bao Zhang and Bo Wang
Remote Sens. 2021, 13(8), 1577; https://doi.org/10.3390/rs13081577 - 19 Apr 2021
Cited by 20 | Viewed by 2675
Abstract
The evaporation duct is a weather phenomenon that often occurs in marine environments and affects the operation of shipborne radar. The most important evaluation parameter is the evaporation duct height (EDH). Forecasting the EDH and adjusting the working parameters and modes of the [...] Read more.
The evaporation duct is a weather phenomenon that often occurs in marine environments and affects the operation of shipborne radar. The most important evaluation parameter is the evaporation duct height (EDH). Forecasting the EDH and adjusting the working parameters and modes of the radar system in advance can greatly improve radar performance. Traditionally, short-term forecast methods have been used to estimate the EDH, which are characterized by low time resolution and poor forecast accuracy. In this study, a novel approach for EDH nowcasting is proposed based on the deep learning network and EDH data measured in the Yellow Sea, China. The factors that affect nowcasting were analyzed. The time resolution and forecast time were 5 min and 0–2 h, respectively. The results show that our proposed method has a higher forecast accuracy than traditional time series forecasting methods and confirm its feasibility and effectiveness. Full article
(This article belongs to the Special Issue Advanced Artificial Intelligence and Deep Learning for Remote Sensing)
Show Figures

Figure 1

26 pages, 9817 KiB  
Article
Detecting Offshore Drilling Rigs with Multitemporal NDWI: A Case Study in the Caspian Sea
by Hui Zhu, Gongxu Jia, Qingling Zhang, Shan Zhang, Xiaoli Lin and Yanmin Shuai
Remote Sens. 2021, 13(8), 1576; https://doi.org/10.3390/rs13081576 - 19 Apr 2021
Cited by 8 | Viewed by 4023
Abstract
Offshore drilling rigs are the foundation of oil and gas exploitation in water areas. Their spatial and temporal distribution, state attributes and other information directly reflect the exploitation level of regional oil and gas resources. Therefore, it is very important to build an [...] Read more.
Offshore drilling rigs are the foundation of oil and gas exploitation in water areas. Their spatial and temporal distribution, state attributes and other information directly reflect the exploitation level of regional oil and gas resources. Therefore, it is very important to build an automatic detecting method for offshore drilling rigs with good performance to accurately capture the temporal and spatial distribution and state of oil and gas exploitation activities. At present, there are two main groups of methods for offshore drilling rigs: invariant feature-based methods and nighttime firelight-based methods. Methods based on invariant location are more subjective in terms of their parameter settings and require intensive computation. Nighttime light-based methods are largely unable to identify offshore drilling rigs without associated waste gas ignition. Furthermore, multiple offshore drilling rigs in close proximity to one another cannot be effectively distinguished with low spatial resolution imagery. To address these shortcomings, we propose a new method for the automatic identification of offshore drilling rigs based on Landsat-7 ETM+ images from 2018 to 2019, taking the Caspian Sea as the research area. We build a nominal annual cloud and cloud shadow-free Normalized Difference Water Index (NDWI) composite by designing an optimal NDWI compositing method based of the influence of cloud and cloud shadow on the NDWI values of water, bare land (island) and offshore drilling rigs. The classification of these objects is simultaneously done during the compositing process, with the following rules: water body (Max_NDWI > 0.55), bare land (island) (Min_NDWI < −0.05) and offshore drilling rig (0 < Mean_NDWI < 0.4). A threshold segmentation and postprocessing were carried out to further refine the results. Using this method, 497 offshore platforms were automatically identified using a nominal annual cloud and cloud shadow-free NDWI composite image and Google Earth Engine. Validation using Sentinel-2 Multispectral Imager (MSI) and Google Earth images demonstrated that the correct rate of offshore drilling rig detection in the Caspian Sea is 90.2%, the missing judgment rate is 5.3% and the wrong judgment rate is 4.5%, proving the performance of the proposed method. This method can be used to identify offshore drilling rigs within a large water surface area relatively quickly, which is of great significance for exploring the exploitation status of offshore oil and gas resources. It can also be extended to finer spatial resolution optical remote sensing images; thus small-size drilling rigs can be effectively detected. Full article
(This article belongs to the Collection Google Earth Engine Applications)
Show Figures

Graphical abstract

19 pages, 3361 KiB  
Article
On the Geopolitics of Fire, Conflict and Land in the Kurdistan Region of Iraq
by Lina Eklund, Abdulhakim M. Abdi, Aiman Shahpurwala and Pinar Dinc
Remote Sens. 2021, 13(8), 1575; https://doi.org/10.3390/rs13081575 - 19 Apr 2021
Cited by 9 | Viewed by 6605
Abstract
There is limited understanding of the geopolitics of fire, conflict, and land, for example, how conflict and fire are related and how conflict impacts the biophysical environment. Since 2014, the natural environment in the Kurdistan Region of Iraq has been negatively affected by [...] Read more.
There is limited understanding of the geopolitics of fire, conflict, and land, for example, how conflict and fire are related and how conflict impacts the biophysical environment. Since 2014, the natural environment in the Kurdistan Region of Iraq has been negatively affected by recurrent conflict that coincided with a sharp increase in the number of reported fires. Against this background, this study explores the spatiotemporal aspects of conflict, fire, and land use and land cover in this region. We combine several satellite-derived products, including land use and land cover, active fire, and precipitation. We apply a partial correlation analysis to understand the relationship between fire, conflict, climate, and land use and land cover. Conflict events and fires have increased since 2014 and have followed a similar temporal pattern, and we show that certain conflicts were particular to certain land use and land cover contexts. For example, the conflict involving the Islamic State was concentrated in southern areas with bare soil/sparse vegetation, and the conflict involving Turkey largely took place in northern mountainous areas characterized by natural vegetation and rugged topography. This dichotomy indicates divergent effects of conflict on the land system. A surprising finding was that fire hotspots had a low positive correlation with the amplitude of distance to conflict while accounting for other variables such as land cover and climate. The high statistical significance of this relationship indicates nonlinearity and implies that a larger range of distances to conflict creates more space for the fires to spread in the surrounding landscape. At the same time, fire hotspots had a weaker but negative correlation to distance from conflict events, which is somewhat expected as areas farther away from conflict locations have lower exposure risk to fires. We discuss the implications of these findings within the geopolitical context of the region and acknowledge the limitations of the study. We conclude with a summary of the main findings and recommendations for future research. Full article
(This article belongs to the Special Issue Remote Sensing of Geopolitics)
Show Figures

Figure 1

15 pages, 4694 KiB  
Article
Comparing Luojia 1-01 and VIIRS Nighttime Light Data in Detecting Urban Spatial Structure Using a Threshold-Based Kernel Density Estimation
by Yuping Wang and Zehao Shen
Remote Sens. 2021, 13(8), 1574; https://doi.org/10.3390/rs13081574 - 19 Apr 2021
Cited by 20 | Viewed by 3439
Abstract
Nighttime light (NTL) data are increasingly used in urban studies and urban planning owing to their strong connection with human activities, although the detection capacity is limited by the spatial resolution of older data. In the present study, we comparedthe results of extractions [...] Read more.
Nighttime light (NTL) data are increasingly used in urban studies and urban planning owing to their strong connection with human activities, although the detection capacity is limited by the spatial resolution of older data. In the present study, we comparedthe results of extractions of urban built-up areas using data obtained from the first professional NTL satellite Luojia 1-01 with a resolution of 130 m and the Visible Infrared Imaging Radiometer Suite (VIIRS). We applied an analyzing framework combing kernel density estimation (KDE) under different search radii and threshold-based extraction to detect the boundary and spatial structure of urban areas. The results showed that: (1) Benefiting from a higher spatial resolution, Luojia 1-01 data was more sensitive in detecting new emerging urban built-up areas, thus better reflected the spatial structure of urban system, and can achieve a higher extraction accuracy than that of VIIRS data; (2) Combining with a proper threshold, KDE improves the extraction accuracy of NTL data by making use of the spatial autocorrelation of nighttime light, thus better detects the scale of the spatial pattern of urban built-up areas; (3) A proper searching radius for KDE is critical for achieving the optimal result, which was 1000 m for Luojia 1-01 and 1600 m for VIIRS in this study. Our findings indicate the usefulness of the KDE method in applying the upcoming high-resolution NTL data such as Luojia 1-01 data in urban spatial analysis and planning. Full article
(This article belongs to the Special Issue Nighttime Lights as a Proxy for Economic Performance of Regions)
Show Figures

Graphical abstract

12 pages, 1739 KiB  
Article
Probing the Fault Complexity of the 2017 Ms 7.0 Jiuzhaigou Earthquake Based on the InSAR Data
by Xiongwei Tang, Rumeng Guo, Jianqiao Xu, Heping Sun, Xiaodong Chen and Jiangcun Zhou
Remote Sens. 2021, 13(8), 1573; https://doi.org/10.3390/rs13081573 - 19 Apr 2021
Cited by 12 | Viewed by 2428
Abstract
On 8 August 2017, a surface wave magnitude (Ms) 7.0 earthquake occurred at the buried faults extending to the north of the Huya fault. Based on the coseismic deformation field obtained from interferometric synthetic aperture radar (InSAR) data and a series of finite [...] Read more.
On 8 August 2017, a surface wave magnitude (Ms) 7.0 earthquake occurred at the buried faults extending to the north of the Huya fault. Based on the coseismic deformation field obtained from interferometric synthetic aperture radar (InSAR) data and a series of finite fault model tests, we propose a brand-new two-fault model composed of a main fault and a secondary fault as the optimal model for the Jiuzhaigou earthquake, in which the secondary fault is at a wide obtuse angle to the northern end of the main fault plane. Results show that the dislocation distribution is dominated by sinistral slip, with a significant shallow slip deficit. The main fault consists of two asperities bounded by an aftershock gap, which may represent a barrier. In addition, most aftershocks are located in stress shadows and appear a complementary pattern with the coseismic high-slip regions. We propose that the aftershocks are attributable to the background tectonic stress, which may be related to the velocity-strengthening zones. Full article
Show Figures

Graphical abstract

Previous Issue
Next Issue
Back to TopTop