Communication

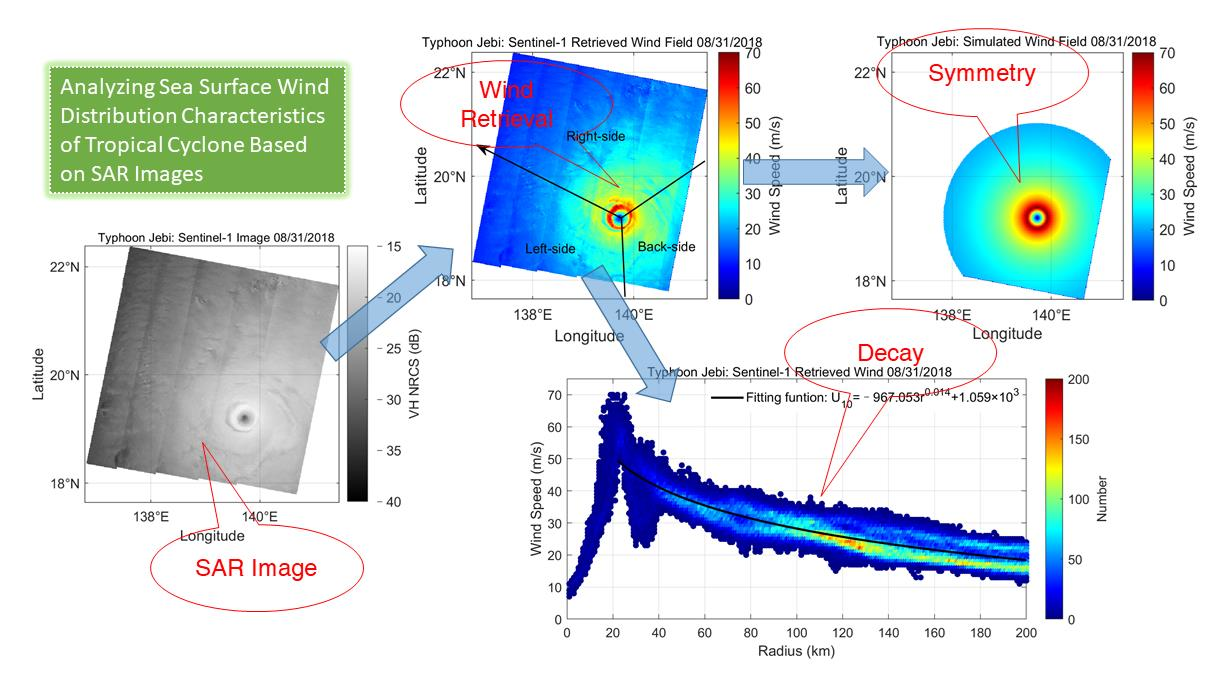
Analyzing Sea Surface Wind Distribution Characteristics of Tropical Cyclone Based on Sentinel-1 SAR Images

1
College of Oceanography and Space Informatics, China University of Petroleum, Qingdao 266580, China
2
Physical Oceanography Laboratory, Ocean University of China, Qingdao 266100, China
*
Author to whom correspondence should be addressed.
Remote Sens. 2021, 13(22), 4501; https://doi.org/10.3390/rs13224501
Submission received: 29 September 2021 / Revised: 1 November 2021 / Accepted: 4 November 2021 / Published: 9 November 2021
(This article belongs to the Special Issue Marine Disaster Monitoring Using Satellites)

Abstract

:
The spaceborne synthetic aperture radar (SAR) cross-polarization signal remains sensitive to sea surface wind speed with high signal-to-noise ratio under tropical cyclone (TC) conditions. It has the capability of observing TC intensity and size information over the ocean with large coverage and high spatial resolution. In this paper, TC wind distribution characteristics were studied based on SAR images. We collected 41 Sentinel-1A/B cross-polarization images covering TC eye, which were acquired between 2016 and 2020. For each case, sea surface wind speeds were retrieved by the modified MS1A model in a spatial resolution of 1 km. After deriving the value and location of maximum wind speed, wind fields were simulated symmetrically within a 200 km radius. Two new methodologies were proposed to calculate the decay index and the symmetry index based on the retrieved and simulated wind fields. Characteristics of the two indices were analyzed with respect to maximum wind. In addition, the maximum and averaged wind speeds of the right, back and left side of the motion direction were compared with TC intensity and storm motion speed. Statistical results indicate that right-side wind speed is the strongest for maximum and average, the wind difference between the left and right side is dependent on storm motion speed.

Graphical Abstract

1. Introduction

As one of the most destructive natural disasters on earth, tropical cyclones (TC) cause tremendous loss of life and property every year [1,2]. Several variables, such as heat, moisture, and momentum fluxes between air and sea, are closely related to the sea surface wind field [3,4,5]. Observing and studying wind distribution characteristics are vitally important for the forecasting of storm surge and TC evolution, as well as the estimation of the “best track” [6,7,8]. In a TC system, wind speed increases from the central minimum value to the maximum value near the eyewall and then decreases with increasing radius. Decay and asymmetry are two key features used to describe storm structures, which are impacted by intensity, storm motion speed and wind shear [9]. In general, TCs have an asymmetric wind field, indicating that the radial wind distribution varies with azimuth direction. The real-time hurricane wind forecast model, developed by incorporating an asymmetric effect into the Holland hurricane model, is statistically more accurate than using a symmetric wind model [10]. In addition, decay is parameterized as an exponent in the power function of the modified Rankine vortex model. The decay value is dependent on TC intensity according to National Oceanic and Atmospheric Administration (NOAA) Hurricane Research Division (HRD) flight-level data of 251 TC cases [11].
With the improvements in active microwave radar technology, the synthetic aperture radar (SAR) is a useful instrument to retrieve TC wind field [12,13,14,15]. The roughness signals become saturated with increasing wind speeds, leading to the ambiguity of wind retrievals by co-polarization (vertical vertical (VV) or horizontal horizontal (HH)) signals [16]. However, the normalized radar cross sections (NRCS) of cross-polarization (vertical horizontal (VH) or horizontal vertical (HV)) increase with increasing wind speeds even at high wind conditions (>25 m/s). The comparison between VV- and VH-polarization NRCS is shown in Figure 1. The VV NRCS is simulated by the CMOD5 model [17]. The VH NRCS is simulated by the modified MS1A (MMS1A) model [18]. In addition, many studies show that cross-polarized NRCS is independent of wind direction, indicating that wind retrieval from cross-polarization SAR images does not need a priori input [19,20,21].
Moreover, advantages of SAR include wide spatial coverage, high spatial resolution and operating under day, night and all-weather conditions, which make up for the deficiency of spaceborne scatterometer and flight observations and contribute to the investigations of TC wind distribution [22,23,24]. Based on SAR retrievals, many studies regarding storm morphology focused on intensity, wind direction, size parameters, decay and asymmetry of wind distribution. For example, Zhang et al. input a set of hurricane morphology parameters and hurricane motion speed to the inflow angle model to derive the hurricane wind direction [8]. According to the asymmetric and symmetric wind fields fitted with SAR retrievals, Zhang et al. proposed a method to compute the asymmetric index and reported that a TC wind field becomes more symmetric when its intensity increases [25]. Gao et al. proposed a symmetric TC wind field model by the fitting function of tropical cyclone fullness (TCF) [7] and maximum wind speed, radial wind curve and the Rankine vortex model [18].
In this paper, new simple methodologies were proposed to calculate TC decay and symmetry indices using SAR images. Wind distribution characteristics were studied based on the combination of best tracks and high-resolution SAR retrievals. The remainder of this paper is organized as follows: Section 2 introduces the Sentinel-1 and best track data used in this work. The calculation methodologies of decay and symmetry indices are described in Section 3. The characteristics of TC wind distribution are analyzed in Section 4. Finally, conclusions and perspectives are given in Section 5.

2. Dataset

The European Space Agency (ESA) Sentinel-1 is a polar-orbiting SAR satellite constellation mission, which was designed for long-term monitoring land and ocean, including two satellites (A and B) launched in the April of 2014 and 2016, respectively. The Sentinel-1 satellite carries a high-resolution C-band SAR instrument operating in four imaging modes: stripmap (SM) mode, interferometric wide swath (IW) mode, extra-wide swath (EW) mode and wave (WV) mode. The EW mode performs with a large width of 410 km and an incident angle ranging from 18.9° to 47.0°, whose images are suitable for TC wind field investigation [12,24,26,27]. The SAR data used in this study are the EW mode dual-polarization (VV + VH) Level-1 Ground Range Detected (GRD) Medium Resolution (MR) products, which were collected from the ESA Copernicus Open Access Hub database (https://scihub.copernicus.eu/, accessed date: 21 April 2021). In our dataset, there were 41 TC cases containing storm eyes observed from 2016 to 2020. To retrieve the wind field, SAR images were resampled from a pixel spacing of 40 m × 40 m to 1 km × 1 km.
In order to investigate the relationship between wind distribution and TC motion vector, we collected 22 best tracks from the NOAA National Hurricane Center (NHC, https://www.nhc.noaa.gov/data/tcr/, accessed date: 24 April 2021) for hurricanes over the Atlantic and Eastern Pacific, and 19 best tracks from the Joint Typhoon Warning Center (JTWC, http://www.metoc.navy.mil/jtwc/, accessed date: 5 July 2021) for typhoons over the Western Pacific. The best tracks include some basic TC information, such as time, intensity and center location. The time difference between best tracks and SAR data is less than 3 h. Figure 2 shows the TC cases’ locations and intensities provided by best tracks. Of note, the intensity is defined as the 1 min sustained wind with the closest time to SAR acquisition and represented by the Saffir–Simpson hurricane wind scale. According to the best track data, the storm with the highest intensity is Typhoon Halong (2019), which reached 160 knots, i.e., 82.2 m/s.

3. Methods

3.1. Wind Field Retrieval and Decay Index

When wind speed exceeds 25 m/s, co-polarized backscattering from the ocean becomes saturated, and thus wind speeds retrieved from co-polarized SAR images have large errors. However, cross-polarized NRCS remains sensitive to high winds and is independent of wind direction. Recent studies suggest that the cross-polarized SAR imagery has the capability of retrieving TC wind speeds over 70 m/s [13,28].
Geophysical model function (GMF) is the formula relating wind speed, wind direction and incident angle to NRCS. In this study, we utilized the MMS1A model for wind retrieval from Sentinel-1 VH-polarization images. This GMF is the modified version of the MS1A model [26], refined with the Sentinel-1 EW mode images and collocated NOAA stepped frequency microwave radiometer (SFMR) wind measurements. After modification, the MMS1A model can be used to retrieve TC wind field at 1 km resolution. Compared with best tracks, the retrieved TC intensities have a bias of –3.91 m/s and a root mean-square error of 7.99 m/s. The comparison between MMS1A and MS1A is presented in [18].
Based on our dataset, Figure 3 shows the MMS1A-retrieved maximum wind speeds and the TC motion speeds provided by best tracks. Different colors stand for the cases observed in different ocean basins. Storm motion speed was calculated using the TC center locations at the two closest times to the SAR acquisition time. In all cases, Typhoon Jebi (2018) had the highest wind speed of 70.72 m/s. Hurricane Gaston (2016), which was in its dissipation stage at the time of SAR sensing, had the fastest storm motion speed of 13.01 m/s. In the following parts of this paper, these two cases will be used as examples to illustrate our methods.
Two examples of SAR images and wind retrievals are shown in Figure 4. Different eyewall shapes can be observed. In general, a storm has different eyewall shapes in different life stages. When the storm intensity is high, the eyewall is symmetric and closed. Meanwhile, if a storm is a minimal hurricane/typhoon, its eyewall is asymmetric or open [29]. TC motion directions are also marked with arrows in Figure 4c,d. According to the storm motion direction, the whole wind field was divided into three sections: the right, back, and left side. Averaged wind speeds were compared between the three sections. In addition, the correlation coefficient between wind speed and radius (Corwr) was computed for all cases. Corwr is an absolute value that represents the dependence of wind on the radius that is between the maximum wind radius (rm) and 200 km.
In order to compute the decay index (DI), we transformed wind retrieval maps to radial wind distributions, with Typhoon Jebi in Figure 5a and Hurricane Gaston in Figure 5b. Based on least-squares approximation, the power function shown in Equation (1) was used to fit the relationship between wind and the radius from rm to 200 km and derive the parameters of a, b, and c. The values of rm, a, b, and c were integrated into Equation (2) to calculate the decay index.
U 10 ( r ) = a r b + c ,   r m r 200
D I = a r m b 200 b 200 r m
in which U10 is the surface wind speed (m/s) at a height of 10 m, and r is the distance from the storm center in kilometers.

3.2. Wind Field Simulation and Symmetry Index

In reality, no storm’s wind field is perfectly symmetric. Thus, the storm symmetry is actually the degree of approximation to a symmetric wind field. In this work, we specified the Pearson correlation coefficient between retrieved and simulated wind fields for the symmetry index (SI) using Equation (3).
S I = cov U 10 R , U 10 S std U 10 R std U 10 S
where U 10 R is the SAR-retrieved wind field, and U 10 S is the simulated wind field. cov U 10 R , U 10 S stands for the covariance of them. std U 10 R and std U 10 S are the standard deviations of U 10 R and U 10 S , respectively. Based on Equation (3), a TC is more symmetric if the SI value is high. The symmetric wind fields, which have same point numbers with retrievals, were simulated according to the wind field model proposed in our previous study [18]:
U 10 ( r ) = U m r m r ,     r < r m a r b ,   r r m ,
a = U m r m b ,
b = log 1 T C F U m 17 ,
T C F = 0.166 U m 0.403 ,
Based on the combination of wind-TCF relationship and the Rankine vortex model, this model can simulate symmetric wind field (r ≤ 200 km) with the inputs of maximum wind (Um) and rm. The Um and rm of the simulated wind field are same as those in retrieved wind field. Completed evaluation suggested that this model has a better performance than pure or modified Rankine vortex models [18]. Figure 6 illustrates the simulations of the two storm examples at a 1 km spatial resolution. The straight borders of storms are the same as those in SAR images.

4. Results

In the evaluation step, we investigated the relationships of all retrieved or calculated parameters: Um, rm, Corwr, DI, SI, and storm motion speed. Many parameters have no dependence on each other. Thus, only those parameters which have obvious relationships are presented in this section.
The characteristics of decay are presented in Figure 7. Figure 7a shows that the decay index has a positive linear correlation with maximum wind. The correlation coefficient is 0.74. This feature coincides with the modified Rankine vortex statistics presented by Mallen et al. [11]. As shown in Figure 7b, if wind speed decreases quickly with an increasing radius, the wind and radius are more linearly dependent. The correlation coefficient of DI and Corwr is 0.72. The relationship between DI and storm motion are not related in general.
As shown in Figure 8, SI values increase with increasing maximum wind speeds. On average, the simulated wind fields of the TCs with high intensities tend to be more similar to SAR retrievals than the TCs with low intensities. This indicates that a strong TC generally has a symmetric wind field. This characteristic coincides with Zhang et al.’s investigation, although they used the asymmetry index (AI) and two different reconstruction models [25]. In their study, the AI values increase with increasing maximum wind speeds (see Figure 6d in [25]). In addition, according to the TC cases in our study, SI is independent of storm motion speed.
The comparison of Um and averaged wind speed (UAvg) in three sections of TC field, along with TC intensities and motion speeds, are illustrated in Figure 9. In order to ensure the comparability of each section, if a section in an image has less than 50% coverage, the image was removed. After removal, there were 22 TC cases left. These cases were then arranged in ascending order of TC intensity, as shown in Figure 9a, and in ascending order of motion speed, as depicted in Figure 9b. According to the comparison, there are 14, 2, and 6 highest Um cases for the right, back, and left side, respectively. There are 14, 3, and 5 highest UAvg cases for the right, back, and left side, respectively. The right side is the strongest section for the maximum and average. The back side is the weakest section. The maximum wind speed in each section increases with increasing TC intensity. The wind difference between the right and left side sections increases with increasing motion speed. In Figure 9b, the wind difference (black dashed trend line) and motion speed (blue line) have an obvious correlation. For the first 19 cases whose motion speeds are not large, the difference between motion speed and averaged wind difference is around 2.5 m/s. Their correlation coefficient is 0.76.

5. Conclusions and Perspectives

Surface wind speed is an important factor in TCs. Wind distribution has some interesting characteristics, which are dependent upon TC intensity and motion speed. Based on high-resolution SAR data and the wind retrieval model, some relationships between wind distribution and TC parameters, such as intensity, size and storm motion speed, can be investigated through various statistical methods, contributing to the study of TC wind field.
In this paper, 1 km wind retrievals of 41 TC cases were used to analyse decay, symmetry and the differences between three wind sections. The results mentioned above indicate that a strong TC generally has the following characteristics: (1) wind speed decreases fast from rm to 200 km radius; and (2) wind field is more symmetric. In addition, wind speed and radius are more linearly dependent, if the wind speed decreases fast from the inner core to the outer region. Among three wind sections, the right side of the TC moving direction is often the strongest section for maximum and averaged wind speed. The averaged wind difference between the left and right side is dependent on TC motion speed. These characteristics may be conducive to detect a TC’s motion situation from limited SAR images.
In the future, efforts will be made to investigate the wind distribution based on more cases observed by passive radiometers. Additionally, the SAR constellation’s continued observations will be utilized for TC wind structure study in the temporal dimension.

Author Contributions

Initiation of the idea: Y.G.; Data processing and model proposing: Y.G.; Writing and editing: all authors contributed; Supervision: J.Z.; Funding acquisition: J.Z., J.S. and C.G. All authors have read and agreed to the published version of the manuscript.

Funding

This research was funded by the National Science Foundation of China under grants 61931025, U20A2099, and 41976017, the Fundamental Research Funds for the Central Universities under grant 20CX06109A, the Qingdao Postdoctoral Foundation Funded Project under grant qdyy20200098.

Institutional Review Board Statement

Not applicable.

Informed Consent Statement

Not applicable.

Data Availability Statement

The Sentinel-1 SAR data were obtained from the Copernicus Open Access Hub database of the European Space Agency (https://scihub.copernicus.eu/, accessed date: 21 April 2021). The hurricane best tracks were obtained from the National Hurricane Center (https://www.nhc.noaa.gov/data/tcr/, accessed date: 24 April 2021). The hurricane best tracks were obtained from the Joint Typhoon Warning Center (http://www.metoc.navy.mil/jtwc/, accessed date: 5 July 2021). All data used in this study are available on request from the author.

Acknowledgments

We thank the European Space Agency for making the Sentinel-1 data publicly available. We thank the National Hurricane Center of the National Oceanic and Atmospheric Administration for hurricane best tracks, and the Joint Typhoon Warning Center for typhoon best tracks.

Conflicts of Interest

The authors declare no conflict of interest.

References

  1. Irish, J.L.; Resio, D.T.; Ratcliff, J.J. The Influence of Storm Size on Hurricane Surge. J. Phys. Oceanogr. 2006, 38, 2003–2013. [Google Scholar] [CrossRef]
  2. Price, C.; Asfur, M.; Yair, Y. Maximum hurricane intensity preceded by increase in lightning frequency. Nat. Geosci. 2009, 2, 329–332. [Google Scholar] [CrossRef]
  3. Wang, Y.; Xu, J. Energy Production, Frictional Dissipation, and Maximum Intensity of a Numerically Simulated Tropical Cyclone. J. Atmos. Sci. 2010, 67, 97–116. [Google Scholar] [CrossRef]
  4. Chan, K.T.F.; Chan, J.C.L. Angular Momentum Transports and Synoptic Flow Patterns Associated with Tropical Cyclone Size Change. Mon. Weather Rev. 2013, 141, 3985–4007. [Google Scholar] [CrossRef]
  5. Kilroy, G.; Smith, R.K.; Montgomery, M.T. Why Do Model Tropical Cyclones Grow Progressively in Size and Decay in Intensity after Reaching Maturity? J. Atmos. Sci. 2016, 73, 487–503. [Google Scholar] [CrossRef]
  6. Landsea, C.W.; Franklin, J.L. Atlantic Hurricane Database Uncertainty and Presentation of a New Database Format. Mon. Weather Rev. 2013, 141, 3576–3592. [Google Scholar] [CrossRef]
  7. Guo, X.; Tan, Z.M. Tropical Cyclone Fullness: A New Concept for Interpreting Storm Intensity. Geophys. Res. Lett. 2017, 44, 4324–4331. [Google Scholar] [CrossRef]
  8. Zhang, G.; Perrie, W.; Li, X.; Zhang, J.A. A Hurricane Morphology and Sea Surface Wind Vector Estimation Model Based on C-Band Cross-Polarization SAR Imagery. IEEE Trans. Geosci. Remote Sens. 2017, 55, 1743–1751. [Google Scholar] [CrossRef]
  9. Croxford, M.; Barnes, G.M. Inner Core Strength of Atlantic Tropical Cyclones. Mon. Weather Rev. 2002, 130, 127–139. [Google Scholar] [CrossRef]
  10. Xie, L.; Bao, S.; Pietrafesa, L.J.; Foley, K.; Fuentes, M. A Real-Time Hurricane Surface Wind Forecasting Model: Formulation and Verification. Mon. Weather Rev. 2006, 134, 1355–1370. [Google Scholar] [CrossRef]
  11. Mallen, K.J.; Montgomery, M.T.; Wang, B. Reexamining the Near-Core Radial Structure of the Tropical Cyclone Primary Circulation: Implications for Vortex Resiliency. J. Atmos. Sci. 2005, 62, 408–425. [Google Scholar] [CrossRef] [Green Version]
  12. Gao, Y.; Guan, C.; Sun, J.; Xie, L. A New Hurricane Wind Direction Retrieval Method for SAR Images without Hurricane Eye. J. Atmos. Ocean. Technol. 2018, 35, 2229–2239. [Google Scholar] [CrossRef]
  13. Mouche, A.; Chapron, B.; Knaff, J.; Zhao, Y.; Zhang, B.; Combot, C. Copolarized and Cross-Polarized SAR Measurements for High-Resolution Description of Major Hurricane Wind Structures: Application to Irma Category 5 Hurricane. J. Geophys. Res. Oceans 2019, 124, 3905–3922. [Google Scholar] [CrossRef]
  14. Ye, X.; Lin, M.; Zheng, Q.; Yuan, X.; Liang, C.; Zhang, B.; Zhang, J. A Typhoon Wind-Field Retrieval Method for the Dual-Polarization SAR Imagery. IEEE Geosci. Remote Sens. Lett. 2019, 16, 1511–1515. [Google Scholar] [CrossRef]
  15. Shao, W.; Hu, Y.; Nunziata, F.; Corcione, V.; Li, X. Cyclone Wind Retrieval Based on X-Band SAR-Derived Wave Parameter Estimation. J. Atmos. Ocean. Technol. 2020, 37, 1907–1924. [Google Scholar] [CrossRef]
  16. Zhou, X.; Yang, X.F.; Li, Z.W.; Yu, Y.; Bi, H.B.; Ma, S.; Li, X.F. Estimation of tropical cyclone parameters and wind fields from SAR images. Sci. China Earth Sci. 2013, 56, 1977–1987. [Google Scholar] [CrossRef]
  17. Hersbach, H.; Stoffelen, A.; de Haan, S. An improved C-band scatterometer ocean geophysical model function: CMOD5. J. Geophys. Res. Oceans 2007, 112, C03006. [Google Scholar] [CrossRef]
  18. Gao, Y.; Zhang, J.; Sun, J.; Guan, C. Application of SAR Data for Tropical Cyclone Intensity Parameters Retrieval and Symmetric Wind Field Model Development. Remote Sens. 2021, 13, 2902. [Google Scholar] [CrossRef]
  19. Vachon, P.W.; Wolfe, J. C-Band Cross-Polarization Wind Speed Retrieval. IEEE Geosci. Remote Sens. Lett. 2011, 8, 456–459. [Google Scholar] [CrossRef]
  20. Zhang, B.; Perrie, W. Recent progress on high wind-speed retrieval from multi-polarization SAR imagery: A review. Int. J. Remote Sens. 2014, 35, 4031–4045. [Google Scholar] [CrossRef]
  21. Shao, W.; Yuan, X.; Sheng, Y.; Sun, J.; Zhou, W.; Zhang, Q. Development of Wind Speed Retrieval from Cross-Polarization Chinese Gaofen-3 Synthetic Aperture Radar in Typhoons. Sensors 2018, 18, 412. [Google Scholar] [CrossRef] [Green Version]
  22. Katsaros, K.B.; Vachon, P.W.; Liu, W.T.; Black, P.G. Microwave Remote Sensing of Tropical Cyclones from Space. J. Oceanogr. 2002, 58, 137–151. [Google Scholar] [CrossRef]
  23. Li, X. The first Sentinel-1 SAR image of a typhoon. Acta Oceanol. Sin. 2015, 34, 1–2. [Google Scholar] [CrossRef]
  24. Zhu, L.; Geng, X.; Xie, T.; Hu, L.; Yan, X.-H. Comparison of the application of co- and cross-polarized sentinel-1 synthetic aperture radar data to tropical cyclone evaluation. Remote Sens. Lett. 2021, 12, 229–238. [Google Scholar] [CrossRef]
  25. Zhang, G.; Perrie, W.; Zhang, B.; Yang, J.; He, Y. Monitoring of tropical cyclone structures in ten years of RADARSAT-2 SAR images. Remote Sens. Environ. 2020, 236, 111449. [Google Scholar] [CrossRef]
  26. Mouche, A.A.; Chapron, B.; Zhang, B.; Husson, R. Combined Co- and Cross-Polarized SAR Measurements Under Extreme Wind Conditions. IEEE Trans. Geosci. Remote Sens. 2017, 55, 6746–6755. [Google Scholar] [CrossRef]
  27. Shao, W.; Li, X.; Hwang, P.; Zhang, B.; Yang, X. Bridging the gap between cyclone wind and wave by C-band SAR measurements. J. Geophys. Res. Oceans 2017, 122, 6714–6724. [Google Scholar] [CrossRef]
  28. Gao, Y.; Sun, J.; Zhang, J.; Guan, C. Extreme Wind Speeds Retrieval Using Sentinel-1 IW Mode SAR Data. Remote Sens. 2021, 13, 1867. [Google Scholar] [CrossRef]
  29. Li, X.; Zhang, J.A.; Yang, X.; Pichel, W.G.; Demaria, M.; Long, D.; Li, Z. Tropical Cyclone Morphology from Spaceborne Synthetic Aperture Radar. Bull. Am. Meteorol. Soc. 2013, 94, 215–230. [Google Scholar] [CrossRef] [Green Version]
Figure 1. The comparison between VV- and VH- polarization NRCS simulated by the CMOD5 model and the MMS1A model in different wind speeds and incident angles of 20 ° , 30 ° , and 40 ° . ϕ is the relative wind direction.
Remotesensing 13 04501 g001
Figure 2. The locations of 41 TC cases investigated in this work and their categories (Saffir–Simpson hurricane wind scale) provided by the best tracks from the NHC and the JTWC.
Remotesensing 13 04501 g002
Figure 3. Maximum wind speeds retrieved by the MMS1A model from the Sentinel-1 EW mode images and TC motion speeds calculated using time and center locations provided by best tracks. Red, blue and green dots stand for the cases observed in the Atlantic, Eastern Pacific and Western Pacific, respectively.
Remotesensing 13 04501 g003
Figure 4. Sentinel-1 SAR images of (a) Typhoon Jebi on 31 August 2018 and (b) Hurricane Gaston on 13 October 2018. Corresponding MMS1A wind retrievals of (c) Typhoon Jebi and (d) Hurricane Gaston. Black arrow represents the storm motion direction computed from best tracks.
Remotesensing 13 04501 g004
Figure 5. Radial wind distributions of (a) Typhoon Jebi; and (b) Hurricane Gaston. The black curve stands for the fitting function of the relationship between wind retrieval and the radius, ranging from rm to 200 km.
Remotesensing 13 04501 g005
Figure 6. Simulated symmetric wind fields within a 200 km radius for (a) Typhoon Jebi and (b) Hurricane Gaston. The spatial resolution is 1 km. Straight borders are same as those in SAR images.
Remotesensing 13 04501 g006
Figure 7. The dependences of decay index on (a) maximum wind speed and (b) correlation coefficient of wind speed and radius. Black curve is the trend line. Red, blue and green dots stand for the cases observed in the Atlantic, Eastern Pacific and Western Pacific, respectively.
Remotesensing 13 04501 g007
Figure 8. The dependence of symmetry index on maximum wind speed, based on 41 TC cases’ wind field simulations and SAR retrievals. Black curve is the trend line. Red, blue and green dots stand for cases observed in the Atlantic, Eastern Pacific and Western Pacific, respectively.
Remotesensing 13 04501 g008
Figure 9. (a) Maximum and averaged surface wind in three TC sections: right side, back side, and left side. Twenty-two TC cases are arranged in ascending order of TC intensity; (b) motion speed and averaged wind difference between the right and left side sections. TC cases are arranged in the ascending order of storm motion speed.
Remotesensing 13 04501 g009
Publisher’s Note: MDPI stays neutral with regard to jurisdictional claims in published maps and institutional affiliations.

