
Synergy of Remote Sensing Data for Exploring Hydrothermal Mineral Resources Using GIS-Based Fuzzy Logic Approach

1
Geology Department, Faculty of Science, South Valley University, Qena 83523, Egypt
2
Remote Sensing Lab., South Valley University, Qena 83523, Egypt
3
Chair of Natural Hazards and Mineral Resources, Geology and Geophysics Department, King Saud University, Riyadh 68953, Saudi Arabia
*
Author to whom correspondence should be addressed.
Remote Sens. 2021, 13(22), 4492; https://doi.org/10.3390/rs13224492
Submission received: 4 September 2021
/
Revised: 2 November 2021
/
Accepted: 3 November 2021
/
Published: 9 November 2021
(This article belongs to the Special Issue Synergy of Remote Sensing and Deep Learning for Mineral Resources and Environment)
Abstract
:The Arabian Nubian Shield (ANS) contains a variety of gold deposits in the form of veins and veinlets formed by hydrothermal fluids. Characterizing potential areas of hydrothermal alteration zones therefore provides a significant tool for prospecting for hydrothermal gold deposits. In this study, we develop a model of exploration for hydrothermal mineral resources in an area located in the ANS, Egypt, using multiple criteria derived from Advanced Spaceborne Thermal Emission and Reflection Radiometer (ASTER), Landsat-Operational Land Imager (OLI), and Sentinel-2 data and field work through GIS-based fuzzy logic approach. The hydrothermal alteration zones (HAZs) map extracted from combining mineral indices, spectral bands, and ratios is consistent with observed argillic alteration zones around the mineralized veins. Combining HAZs and lineament density led to identification of six zones based on their mineralization potential, and provides a tool for successful reconnaissance prospecting for future hydrothermal mineral deposits. The detected zones are labeled as excellent, very high, high, moderate, low, and very low, based on their potential for Au production, and the predictive excellent and very high zones cover about 1.6% of the study area. This model also shows that target prospective zones are quartz veins controlled by NNW-SSE trending fracture/fault zones all crosscutting Precambrian rocks of the ANS. Field observations and petrographic and X-ray diffraction analyses were performed to validate the mineral prospective map and revealed that quartz veins consist of gold–sulfide mineralization (e.g., gold, pyrite, chalcopyrite, and sphalerite). Consistency between the high potential hydrothermal alterations zones (HAZs) and the location of gold mineralization is achieved.
1. Introduction
The mineral exploration process is typically carried out at different scales using various tools such as remote-sensing, geological field work, geophysical exploration, and geochemical surveying (e.g., [1,2]). The remote-sensing approach affords significant tools for characterizing and delineating geological, structural, and lithological features that have helped identify areas of mineralization for many decades [3,4,5,6]. The substantial progress in processing remotely-sensed images has allowed for identifying rocks and minerals based on their spectral properties using multispectral and/or hyperspectral sensors in the visible-near-infrared (VNIR) and the shortwave infrared (SWIR) regions of the electromagnetic spectrum (EMS) [1,2,3,4,5,6,7,8,9,10,11,12,13]. Therefore, the use of remote-sensing has been extended to mineral exploration by careful characterization of fault/fracture zones and/or hydrothermal alteration minerals [1,8,9,14,15,16,17] containing Al-OH, Fe-OH, Mg-OH, Si-OH, and -CO3 radicals [1,18,19]. These key radicals are integral constituents of minerals that form by advanced argillic alteration (e.g., kaolinite and alunite) and phyllic alteration (e.g., sericite, illite), and they have recognized Al-OH absorption in the SWIR [15,20,21,22] at certain wavelength regions, e.g., 2.205, 2.165, and 2.18 µm. Moreover, the propylitic alteration minerals have intense absorption at 2.30, 2.35, and 2.22 µm [23]. These HAZs are arranged based on their intensity around the center of the ores in successive zones [9].
Generating a mineral potential map derived from remote-sensing data through a GIS-based approach has therefore became a fast and accurate tool for identification of target areas for mineral exploration [7,8], particularly during the reconnaissance stage. Since the advent of GIS-based spatial analysis approaches, advances have been achieved in revealing prospective areas of hydrothermal mineral resources [24,25,26]. This is because integration of spatially distributed remote-sensing data using a GIS technique is a significant approach to mineral exploration, as it allows combining multiple datasets through digital overlay methods in order to optimize mineral prospection maps [27]. For example, the GIS-based knowledge-driven method is efficient to produce predictive maps based on expert judgment [8] as each GIS predictive layer is assigned a weight reflecting importance in the modeling process [1,24]. Furthermore, each evidential map representing HAZs and/or fracture/fault zones was given a weight reflecting its significance in the prospective mode. In this approach, the area of the highest weight resulting from summing of multi-criteria would represent the promising areas of mineral resources and ores. Such an approach has been successfully applied for prospecting for gold, massive sulfide, and porphyry copper deposits around the world (e.g., [2,6,10,11,12]) and has proven successful when combined and validated with field, petrographic, and geochemical investigations [1].
Based on the aforementioned information, it is of a great significance to combine the HAZs and extracted fracture/fault zones for prospecting potential areas of hydrothermal mineral resources. Thus, in this study, we focus on combining remote-sensing, geologic, field, and laboratory data sets to delineate the potential areas of hydrothermal mineral resources and develop a comprehensive scheme that would facilitate future exploration for hydrothermal ores in the Eastern Desert (ED) of Egypt.
2. Study Area
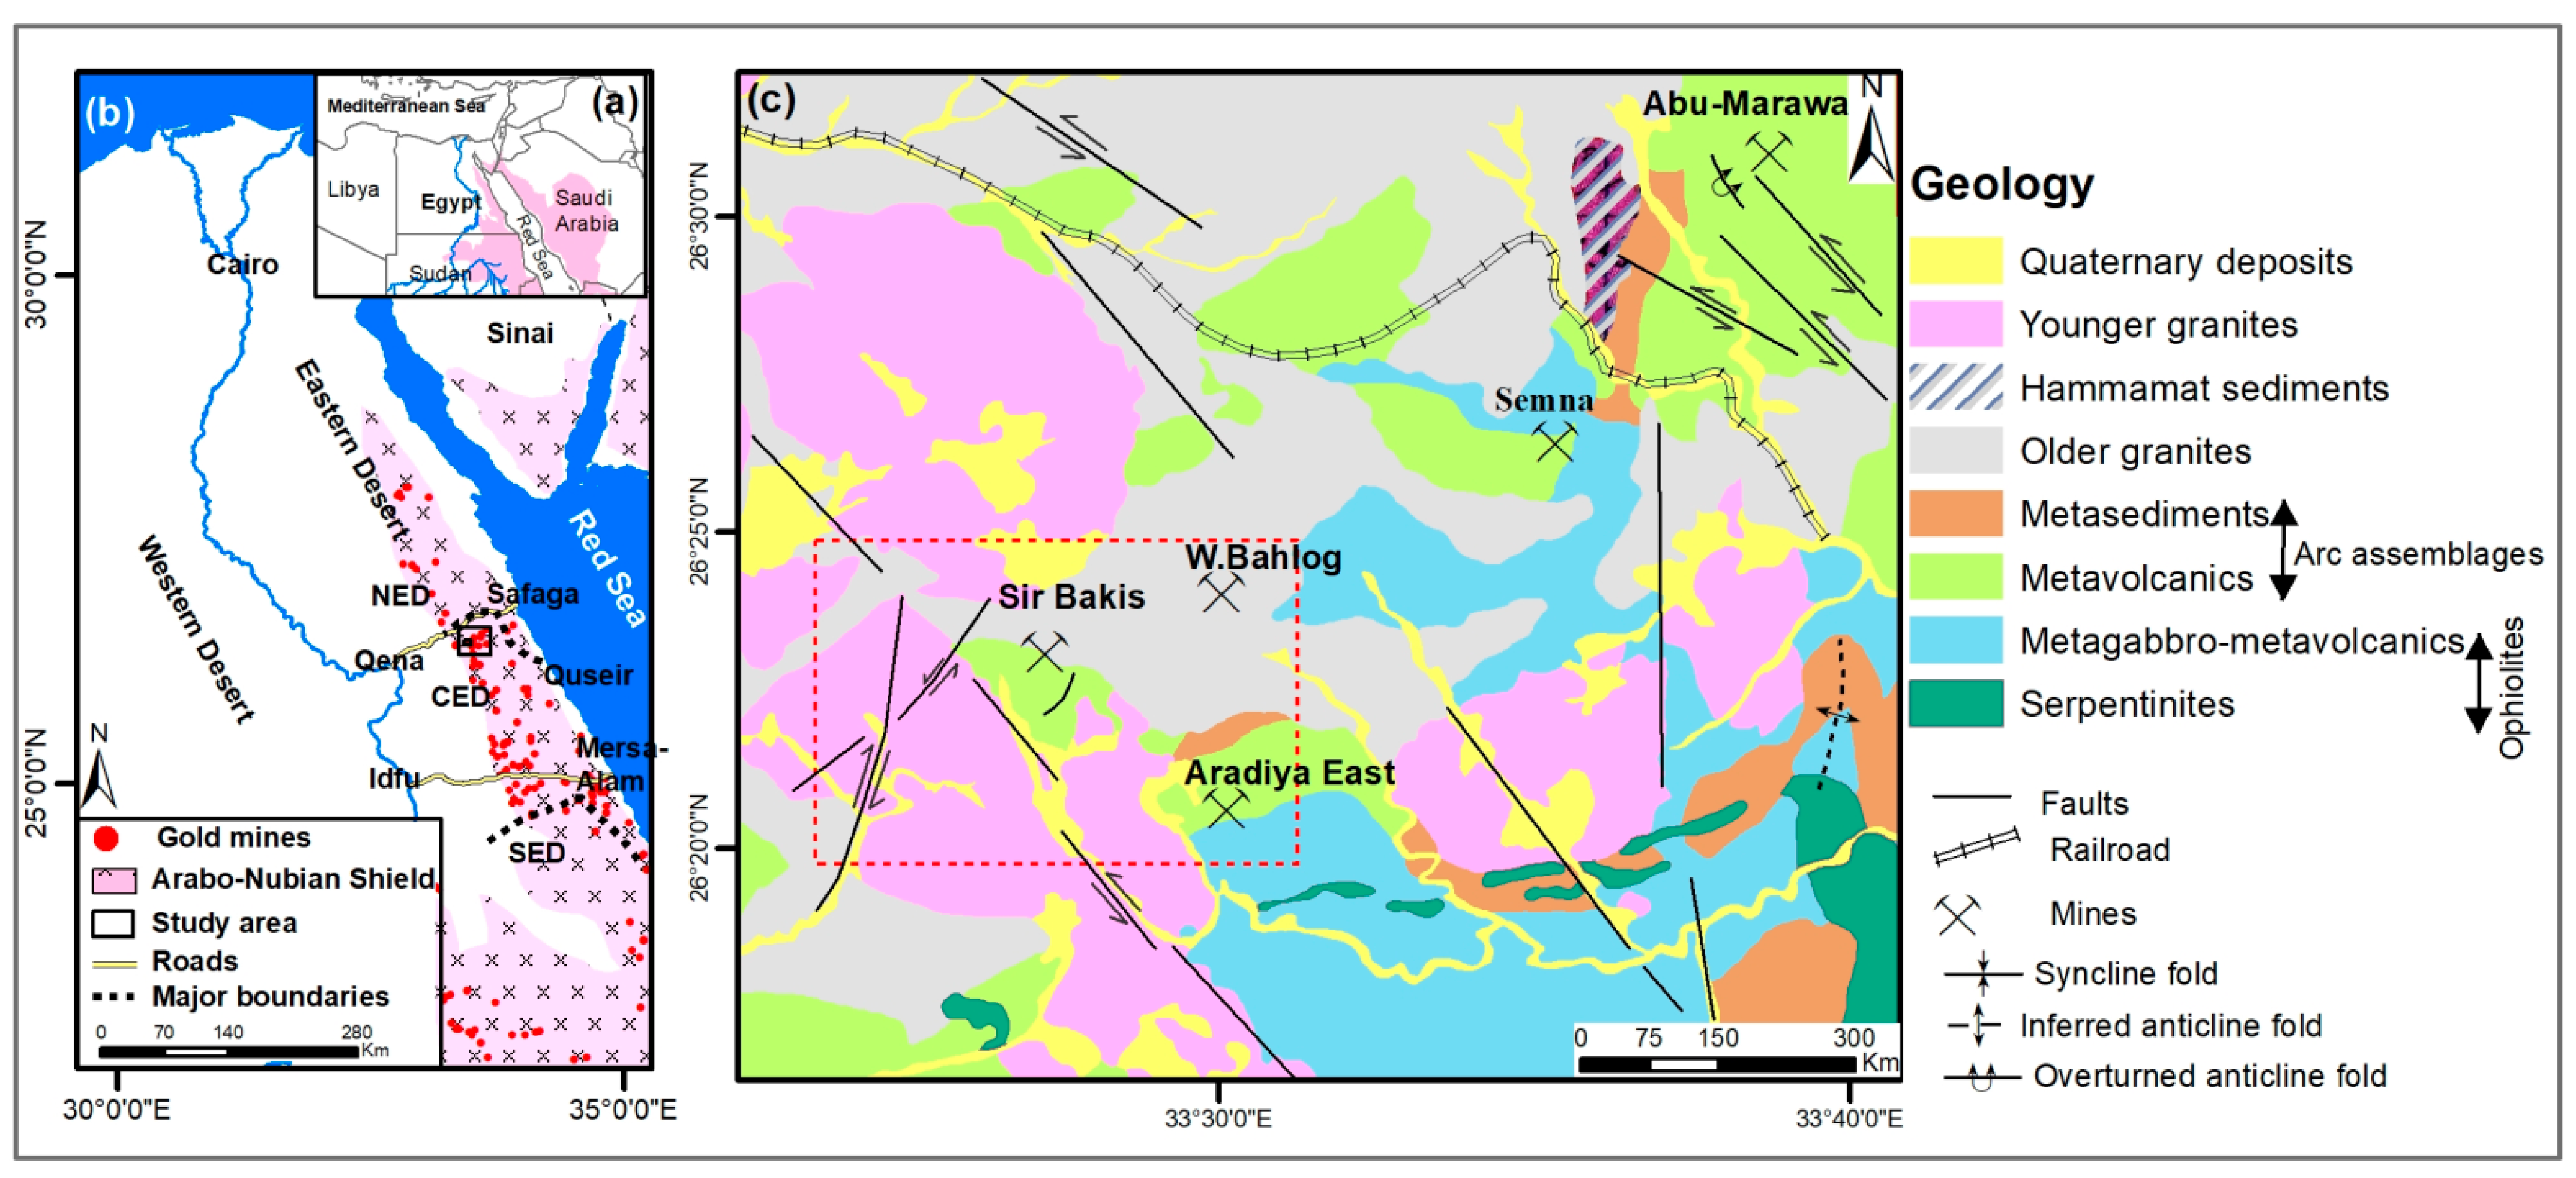
The study encompasses a 119-km2 area bounded by latitudes 26°19′44.38″ and 26°24′50.93″ N, and longitudes 33°23′35.86″ and 33°31′12.33″ E (Figure 1a,b). It is located about 20 km southeast of Qena-Safaga road (at kilometer 85). The study area is part of the Arabian Nubian Shield (ANS) that covers wide areas of Egypt, Saudi Arabia, and Sudan, where “ophiolitic mélange” (serpentinites, metagabbros, mafic metavolcanics), “arc assemblages” intermediate-acidic metavolcanics, and metasediments of the Proterozoic age are exposed. These assemblages are intruded by “syn-tectonic granites” calc-alkalic granodiorites or tonalites (older granites) that are subjected to strike-slip faults, promoting deposition of Hammamat sediments in small elongated basins. The entire sequence is intruded by “late-post tectonic” alkali granites (younger granites) and felsic and mafic dikes that most likely trend NW-SE. Mining at this site was related to the New Kingdom. Most of the gold associated with quartz veins were mined in open-cast and deep mining techniques [28]. In contact with a quartz vein, the granodiorite hydrothermally altered to a sericite quartz rock [28,29]. The fracture/fault zones that cut the study area are NW-SE, NNW-SSE, N-S, NNE-SSW, and NE-SW. The most prominent trends of fracturing occurred along the NW-SE, NE-SW, and N-S directions. Younger granites are cut by several fracture/fault zones in the NNW-SSE, NE-SW, and N-S directions.
3. Analytical Techniques
3.1. Remote Sensing Techniques
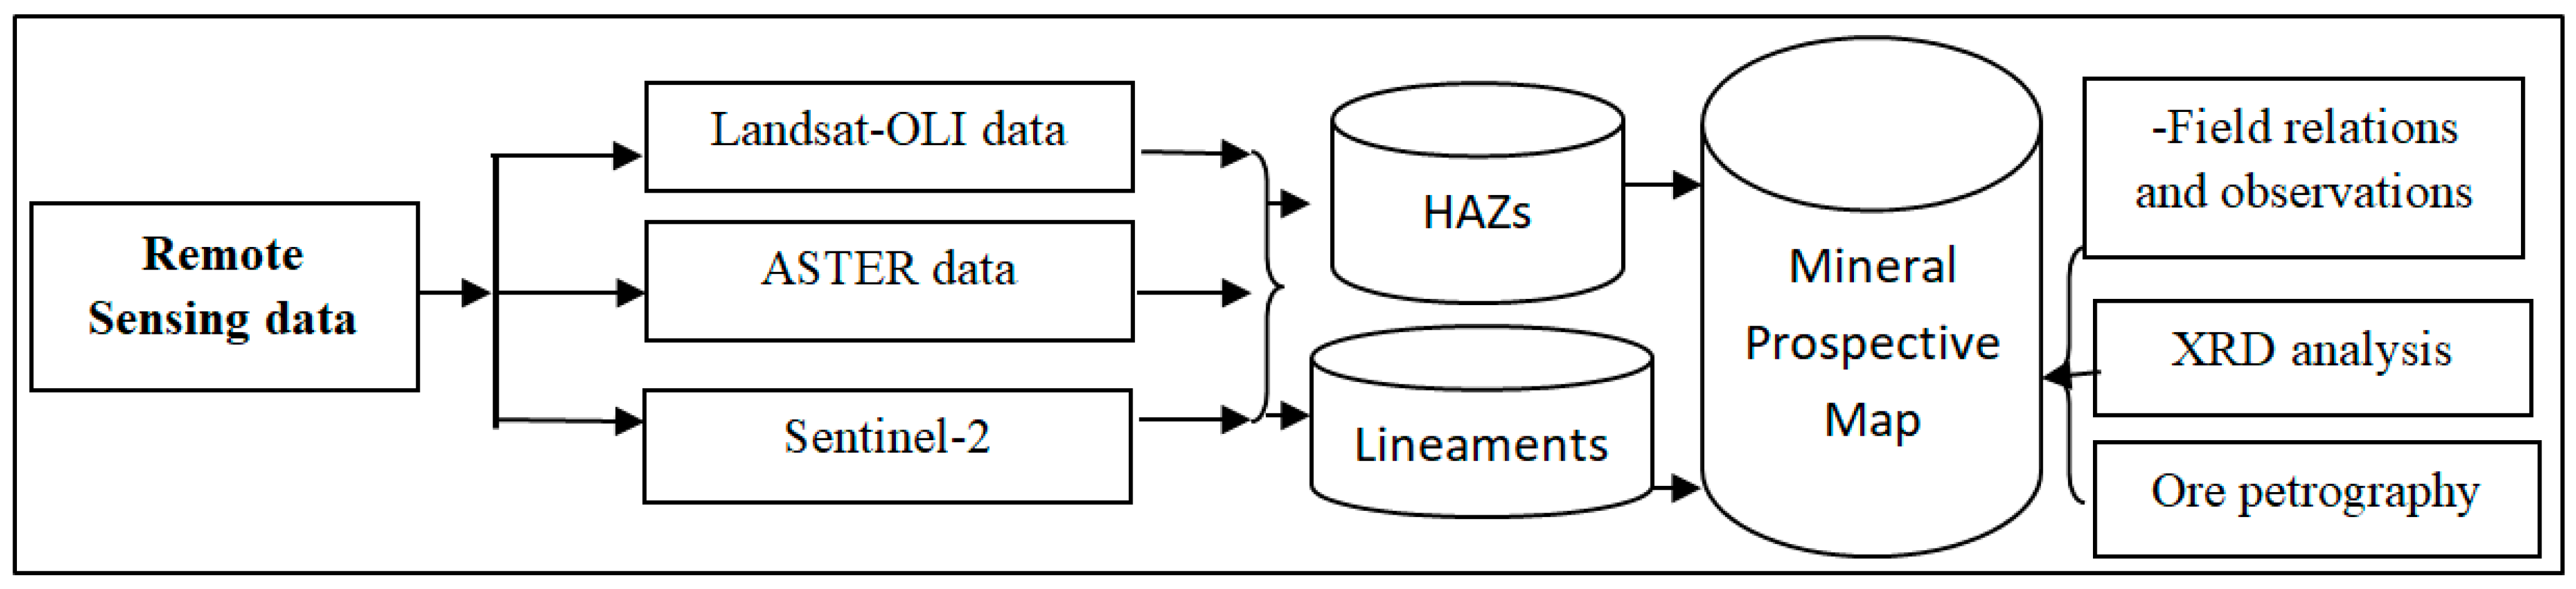
Remote-sensing applications provide significant information on lithologic and structural features controlling mineral resources. Visible/IR and radar remotely-sensed images were employed in this study to characterize gold mineralization and associated alteration zones. Sentinel-2, ASTER, and Landsat 8- OLI data (Figure 2) were all used to identify lithologic, alteration characteristics, and structural trends in the study area to compensate for the others’ shortcomings in covering the area for mineral mapping [18]. Several approaches to image transformation were carried out by ENVI 5 and ArcGIS software package 10.5. False color composite (FCC), band ratios, band math, and mineral indices were also used to highlight areas of strong hydrothermal alteration.
The Landsat-8 (OLI) satellite was launched on 11 February 2013. It provides 11 band including: (1) band 1, Coastal aerosol (0.43–0.45 µm) with a special resolution of 30 m; (2) b2, Blue (0.45–0.51 µm), 30m resolution; (3) b3, Green (0.53–0.59 µm), 30 m; (4) b4, Red (0.64–0.67 µm), 30 m; (5) b5, NIR (0.85–0.88 µm), 30 m; (6) b6, SWIR1 (1.57–1.65 µm), 30 m; (7) b7, SWIR2 (2.11–2.29 µm), 30 m; (8) b8, Panchromatic (0.50–0.68 µm), 15 m; (9) b9, Cirrus (1.36–1.38 µm), 30 m; (10) b10, TIRS1 (10.6–11.19 µm), 100 m; and (11) b11, TIRS2 (11.50–12.51 µm), 100 m (USGS website). Bands 6 and 7 have been successfully applied to characterize areas of hydrothermal alteration in different environments [1,2].
The ASTER sensor onboard the TERRA spacecraft reached its orbit in December 1999. ASTER data recorded 14 channels that display information in the visible and near infrared (VNIR), short wavelength infrared (SWIR), and thermal infrared (TIR) regions of the electromagnetic spectrum (EMS). Three channels are depicted by 15 m pixel dimension in the VNIR part of the EMS and six channels of 30 m cell size in SWIR. Additionally, five bands of 90 m cell size in the region of TIR are recorded. A subset of cloud-free level 1B ASTER (AST_L1B_00310072007083611_20120324003222_21124) is also used in this study. SWIR bands B4 (λ = 1.656 µm), B5 (λ = 2.167 µm), B6 (λ = 2.209 µm), B7 (λ = 2.262 µm), B8 (λ = 2.336 µm), and B9 (λ = 2.400 µm) are utilized to highlight key-hydrothermal minerals. Ratios and mineral indices of ASTER are then utilized to highlight zones of advanced alteration characteristics (rich in iron-oxides and OH-bearing minerals) associated with Au mineralization.
The Sentinel-2A satellite was launched on 23 June 2015, and the earliest observations were captured a few days later [31]. The Sentinel-2 sensors collect data in VNIR, SWIR, and TIR regions. The spatial resolution of these bands is 10–60 m. Sentinel-2 records 13 bands covering the VNIR and SWIR regions. B1 is a coastal band (443 nm) of 60 m spatial resolution, whereas the visible-infrared bands: blue B2 (490 nm), green B3 (560 nm), red B4 (665 nm), and infrared B8 (842 nm) have a 10 m spatial resolution. The SWIR bands (B11: 1610 nm, B12: 2190 nm) both have a spatial resolution of 20 m.
The band ratio, principal component analysis (PCA), and sub-pixel analysis methods were all applied. The band ratio method (e.g., [3,32]) improves the spectral characteristics as it suppresses the effects of topography. Band ratio 3/4 of Sentinel-2 reveals the ferrous iron and 12/11 reveals the ferrous silicates including biotite, chlorite, and amphibole [31]. A PCA in remote sensing techniques is implemented to minimize the dimensionality of the number of original channels and to increase the expanse of information from the initial channels into the minimum number of PCA [33]. Three steps are required to obtain the PCA [34]: (i) calculation of the variance-covariance matrix, (ii) calculation of eigenvectors, and (iii) linear transformation of datasets.
The utilized remotely-sensed scene can be represented in a matrix design. In order to minimize the dimensionality of the primary channels data, the eigenvalues of the covariance matrix were computed. The variance-covariance matrix can be estimated to compute the eigenvalues that refer to the primary data information [33], providing evidence of the relationships between the spectral channels and each PCA.
The knowledge-driven knowledge-based fuzzy logic method through geographic information system (GIS) is tested here to generate a mineral potential map. This kind of overlay multi-criteria decision-making approach has been widely applied in several predictive methods [8,35]. The fuzzy logic approach depends on the fuzzy-set method presented by Zadeh [36], which promotes users to apply their knowledge to design a model for combining multi-criteria to predict the potential areas of mineralization [8,36]. It also allows for the characterization of the degree of membership in a set, denoted by continuous values extended from 0 to 1 without a crisp boundary. The fuzzification process given the fuzzy membership value [37]. Each category is given a membership value; after that the assigned categories can be combined to initiate a mineral prospective map [38].
If X is a combination of all thematic layers Xi (i = 1, 2, 3, … n), each layer has m levels and is denoted as (j = 1, 2, 3, …, m), then the n fuzzy sets Ai (i = 1, 2, 3, …, n) of the evidence layer X can be expressed as
Although the calculated s-shaped membership function () 0.5 < < 1, xij is promising for mineralization, the 1 < < 0.5, xij is not (e.g., [38]).
In this model, a fuzzy set operator is utilized to obtain Ai to generate a fuzzy set of final score of MPM. Therefore, a mineral prospective map (MPM) of the study area, which represents the final score for each category of the evidence [38] were combined using fuzzy overlay approach in GIS using equation:
3.2. Field and Lab Analysis
Several field samples and photographs were collected from various rock units, hydrothermal alteration zones, and mineralized quartz veins. The trends of the fractures and fault systems were measured in 2015 and 2021. Several samples of mineralized quartz veins were polished and examined under reflected polarized microscopy. Moreover, in order to affirm the outcomes of the processing and interpretation of Landsat-OLI, ASTER, and Sentinel-2 data, field samples were collected from the HAZs. X-ray diffraction (XRD) analysis was performed on the powder of these samples in the Laboratories of Sohag University. In addition, series of photographs were taken to document the field relations and observations.
4. Results
4.1. Lithologic Characteristics
Processing and interpretation of satellite images of Landsat-OLI, ASTER, and Sentinel-2 data distinguished the lithological and structural features of the study area, along with characterizing the dikes and veins. The data processing technique utilized herein shows no particular relationships between gold occurrences and specific lithological units, but rather displays a strong relationship between the distributions of auriferous quartz veins/dikes and zones of extensive hydrothermal alteration.
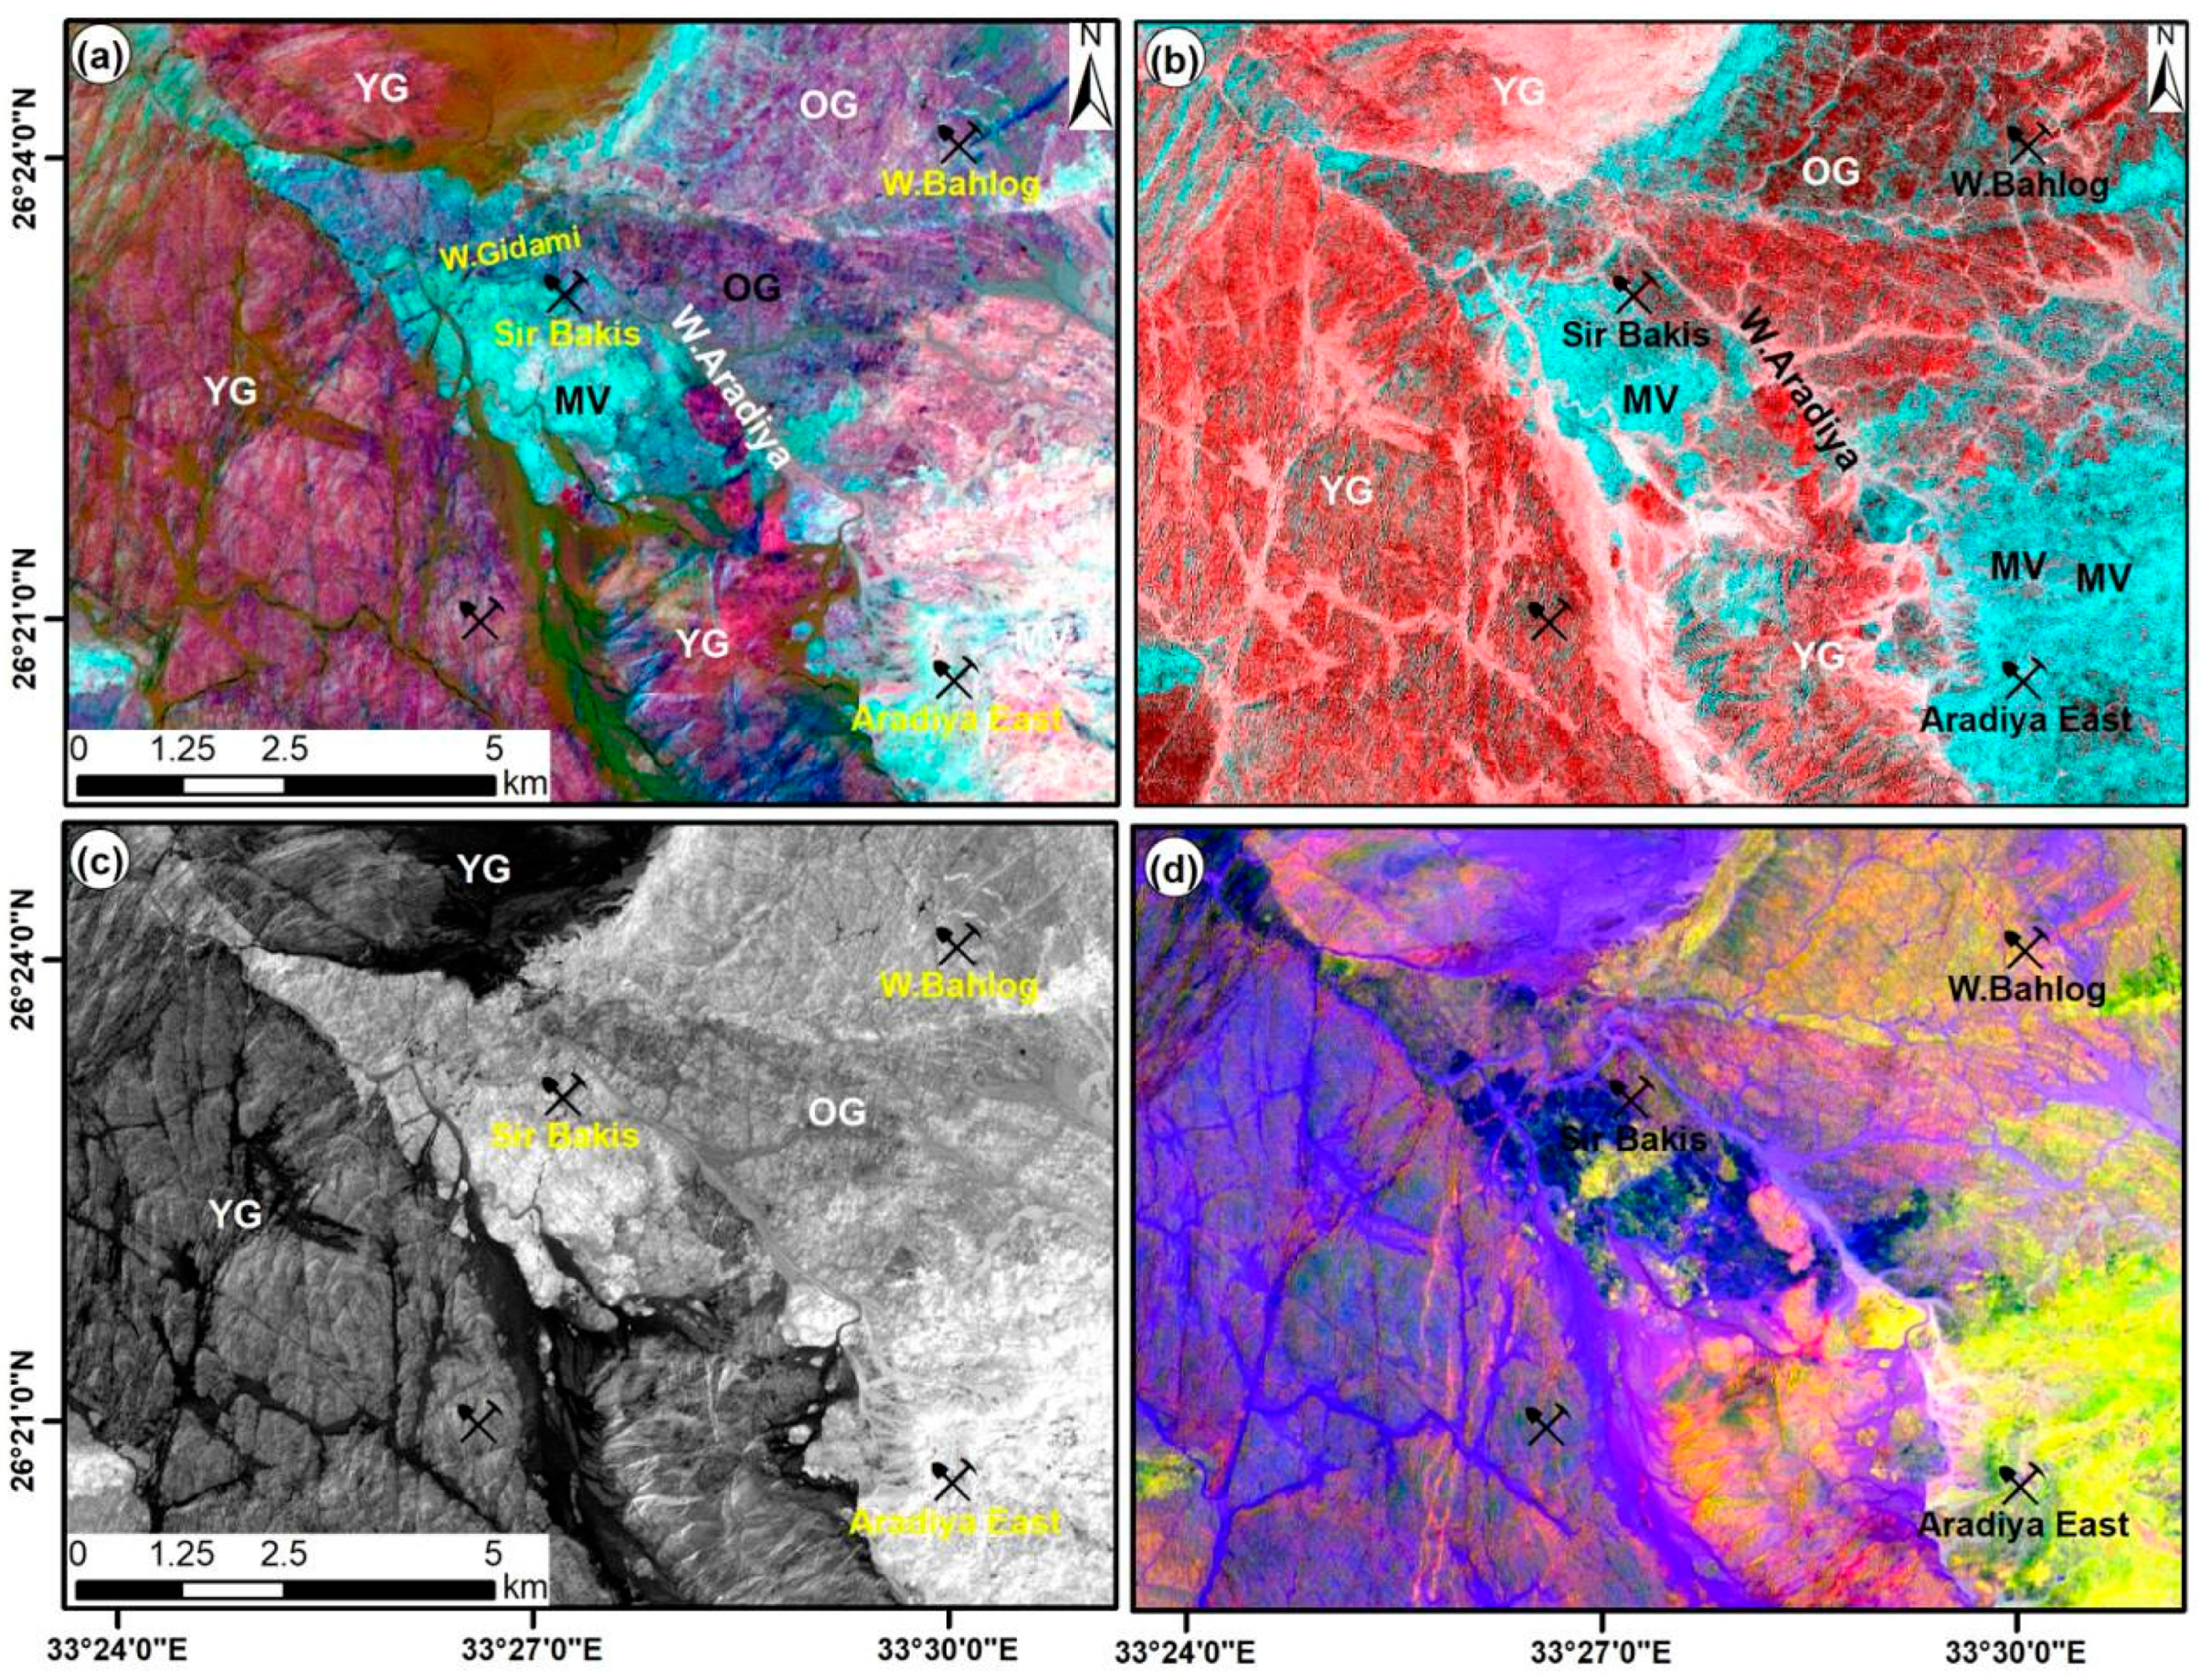
Using Sentinel-2 bands, ratio composite 12/11, 4/8, and 3/4 in R, G, and B (Figure 3a) was generated. In this ratio composite, the younger granites appear in a hue of brownish-red, the older granites in brownish green, and the metavolcanics in cyan; the white color represents altered metavolcanics. Using band ratio 6/1, 6/8A, and (6 + 7)/8A of Sentinel-2 the extraction of hematite + goethite, hematite + jarosite, and the mixture of iron-bearing minerals, respectively [39] successfully discriminated the felsic in red and mafic varieties in cyan (Figure 3b).
Band ratio 3/4 highlights the ferrous iron [39]. Band 3/4 of Sentinel-2 data allows for discrimination between post-tectonic granites and syn-tectonic granites (Figure 3c). Using 11/8A, (12/8A) + (3/4), and band 3 of Sentinel-2 reveals the younger granites in reddish and mafic rocks in greenish colors (Figure 3d). Ferric oxides (Fe3+) are represented by 11/8A and ferrous iron (Fe2+) is represented by (12/8A) + (3/4); [39].
4.2. Hydrothermal Alteration Maps and Mineralization
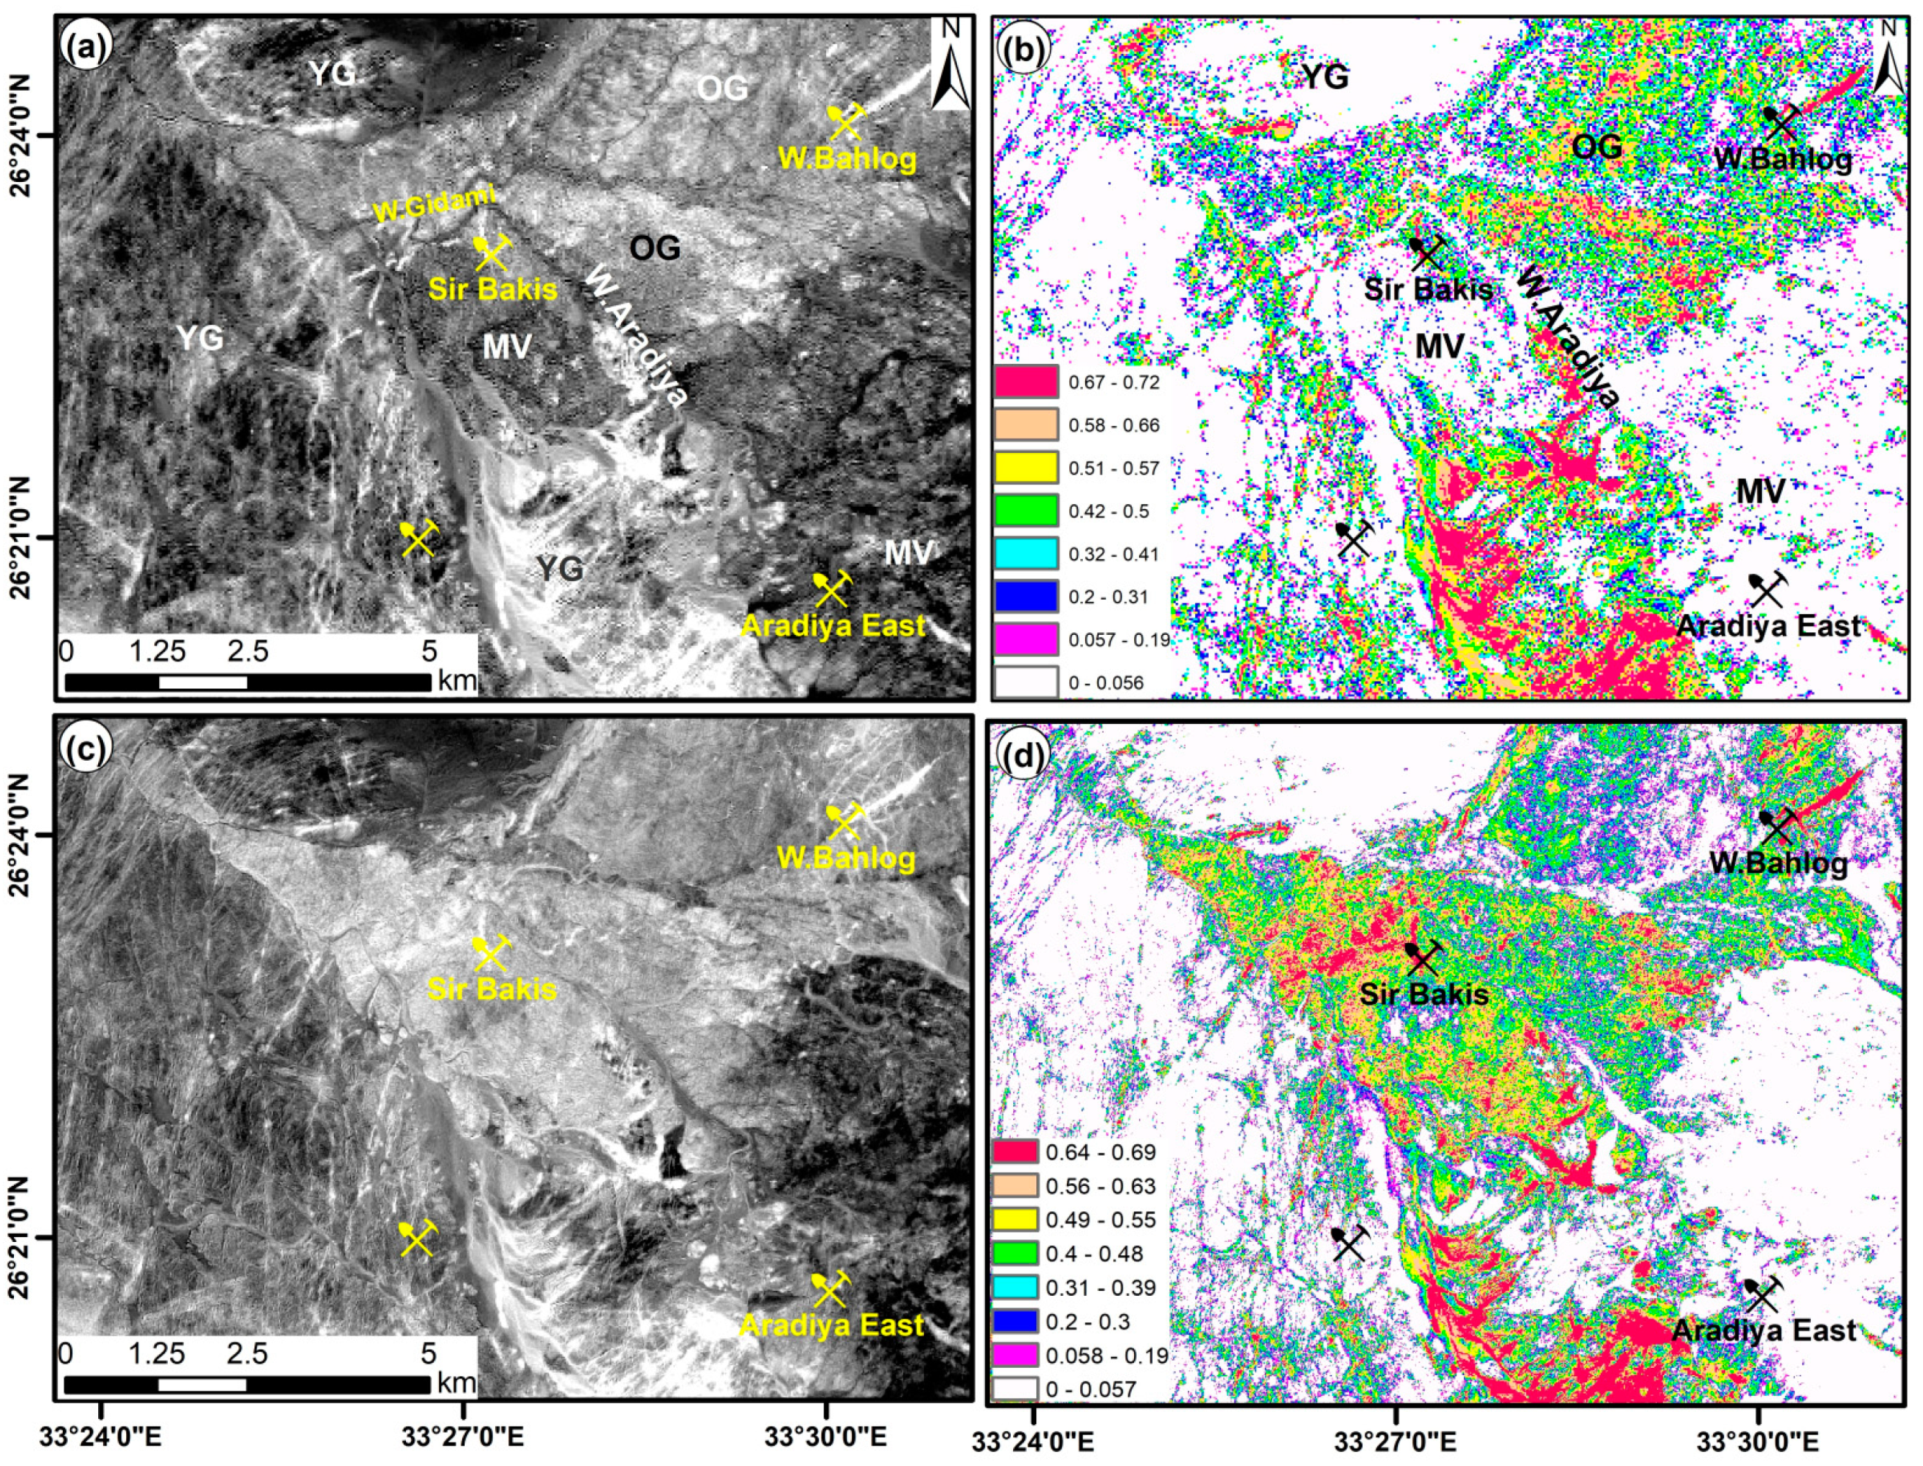
Selected bands, e.g., 2, 5, 6, and 7 of Landsat-8 (image H) are transformed using selective PCA methods [40,41] to reveal hydroxyl-bearing minerals such as clays/carbonates respectively [42,43]. Based on four components of PCA results (Table 1), PC3 was chosen as a good contrast between band 6 (-0.716) and band 7 (0.522). Thus, PC3 (Figure 4a) was negated to highlight the OH-bearing minerals. Subsequently, the classified image (Figure 4b) was categorized into eight groups, the high potential given the high numeric values (0.67–0.72), and the low potential given low numeric values (0.0–0.056).
In order to delineate certain areas of OH-bearing minerals utilizing the PCA technique, bands 2, 3, 4, 8, 11, and 12 of Sentinel-2 data were chosen for PCA transformation. In PC4 (Table 2), the eigenvector reflects a strong negative loading on band 12 (−0.678) and low or positive loading on band 11 (0.681). To highlight areas with an abundance of OH-bearing minerals, and display the contrast between bands 11 and 12, PC4 displays in Figure 4c. Thus, the hydrothermally altered areas appear in white tone (Figure 4c). Areas of high OH-bearing minerals depicting hydrothermal alteration were then extracted using ArcGIS and are shown in red (0.64–0.69), (Figure 4d).
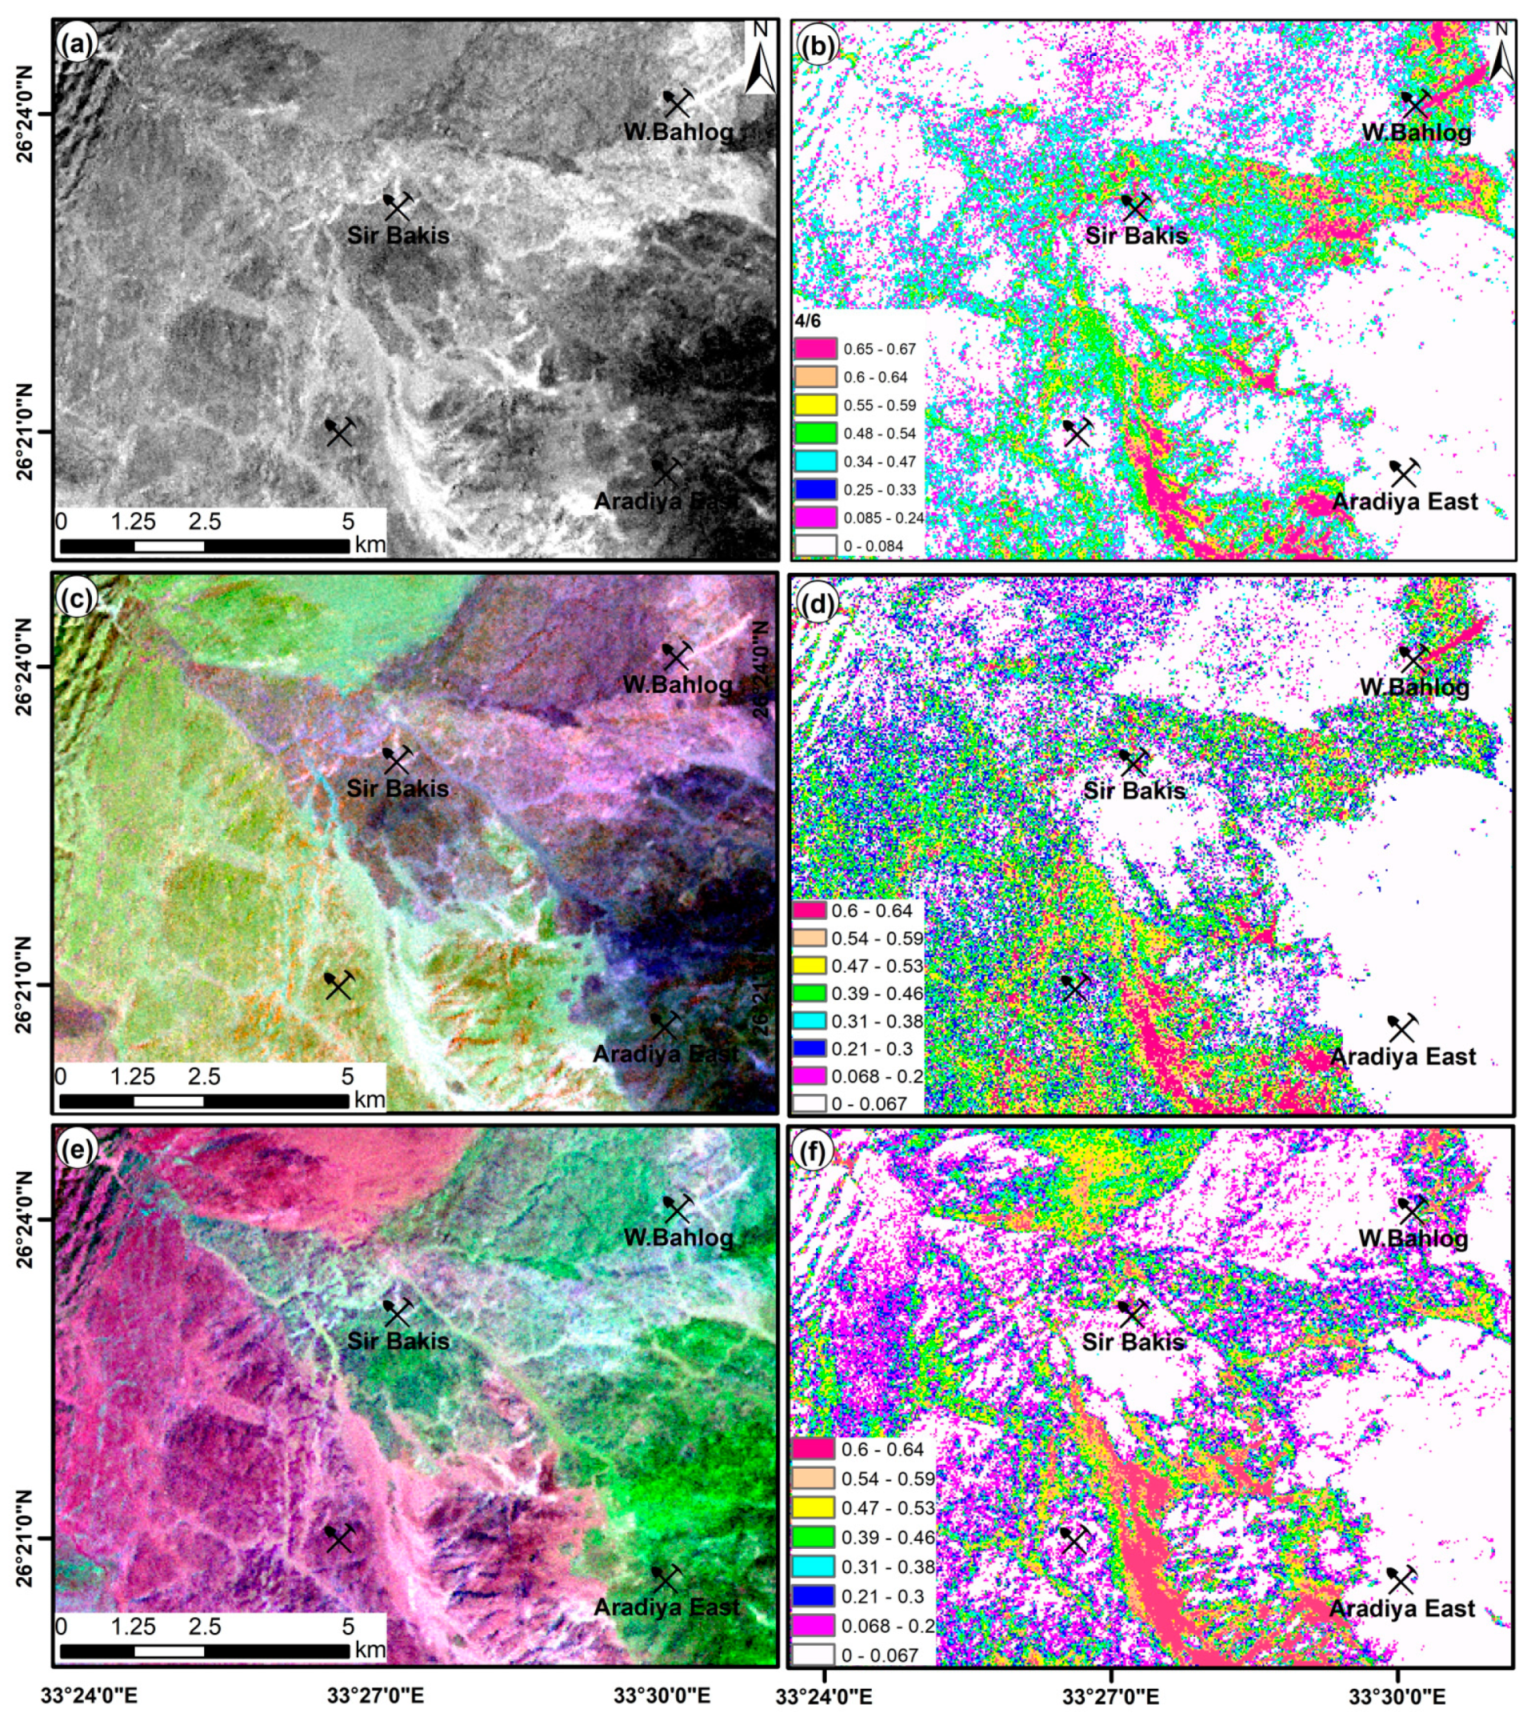
Further analysis using ASTER data was used to probe areas of hydrothermal alteration, a consequence of OH–bearing minerals being delineated by band ratio 4/6 (1.656/2.209 μm) (Figure 5a). Because many minerals such as kaolinite, illite, and montmorillonite have a high absorption signature in band 6 and a high reflectance in band 4, this ratio 4/6 is more appropriate for highlighting these hydrous minerals. In this ratio map (Figure 5a), areas of hydrothermal alteration are highlighted by the white tone, which for the most part, coincides with structural contacts. Extraction of areas of OH–bearing minerals (Figure 5b) using Arc GIS produces Figure 6b, which displays areas of high hydrothermal alteration (0.65–0.67) in red.
Combining band ratios and mineral indices OHI (OH bearing altered minerals index (OHI) = [band 7/band 6] × [band4/band 6], kaolinite index (KAI) = [band 4/band 5] × [band 8/band 6]), and (B4 × 3)/(B5 + B6 + B7) of ASTER data clearly depicts areas rich in Al–OH—bearing minerals in white (Figure 5c). Using SWIR depth = (B4 × 3)/(B5 + B6 + B7) of ASTER data (cf. [13]) enhances the appearance of hydrothermal alteration areas. Using Arc GIS to export areas of Al–OH–bearing minerals marked by a white tone on Figure 5c allowed for extracting the plausible area of hydrothermal alteration in the red colors in the range 0.60–0.64 in Figure 5d.
Band ratios 4/5 and 4/7 of ASTER enhance argillic and sericitic alteration zones, respectively [44]. Moreover, ASTE R– 4/5 band ratio characterizes the advanced argillic alteration (e.g., alunite and dickite) in these images. The combination of band ratios 4/5, 4/7, and 4/6 in R, G, and B of ASTER are therefore used herein to display hydrothermal alteration zones (HAZs) and alkali-granites in pink colors, and the older granites and metavolcanics in greenish hues, with the more mafic rocks represented by darker green colors (Figure 5e). The identification of these combined ratios into eight ranks of hydrothermal alteration is shown in Figure 5f, where the highest rank (0.60–0.64) shown in red represents areas that contain both argillic and sericitic zones of alteration.
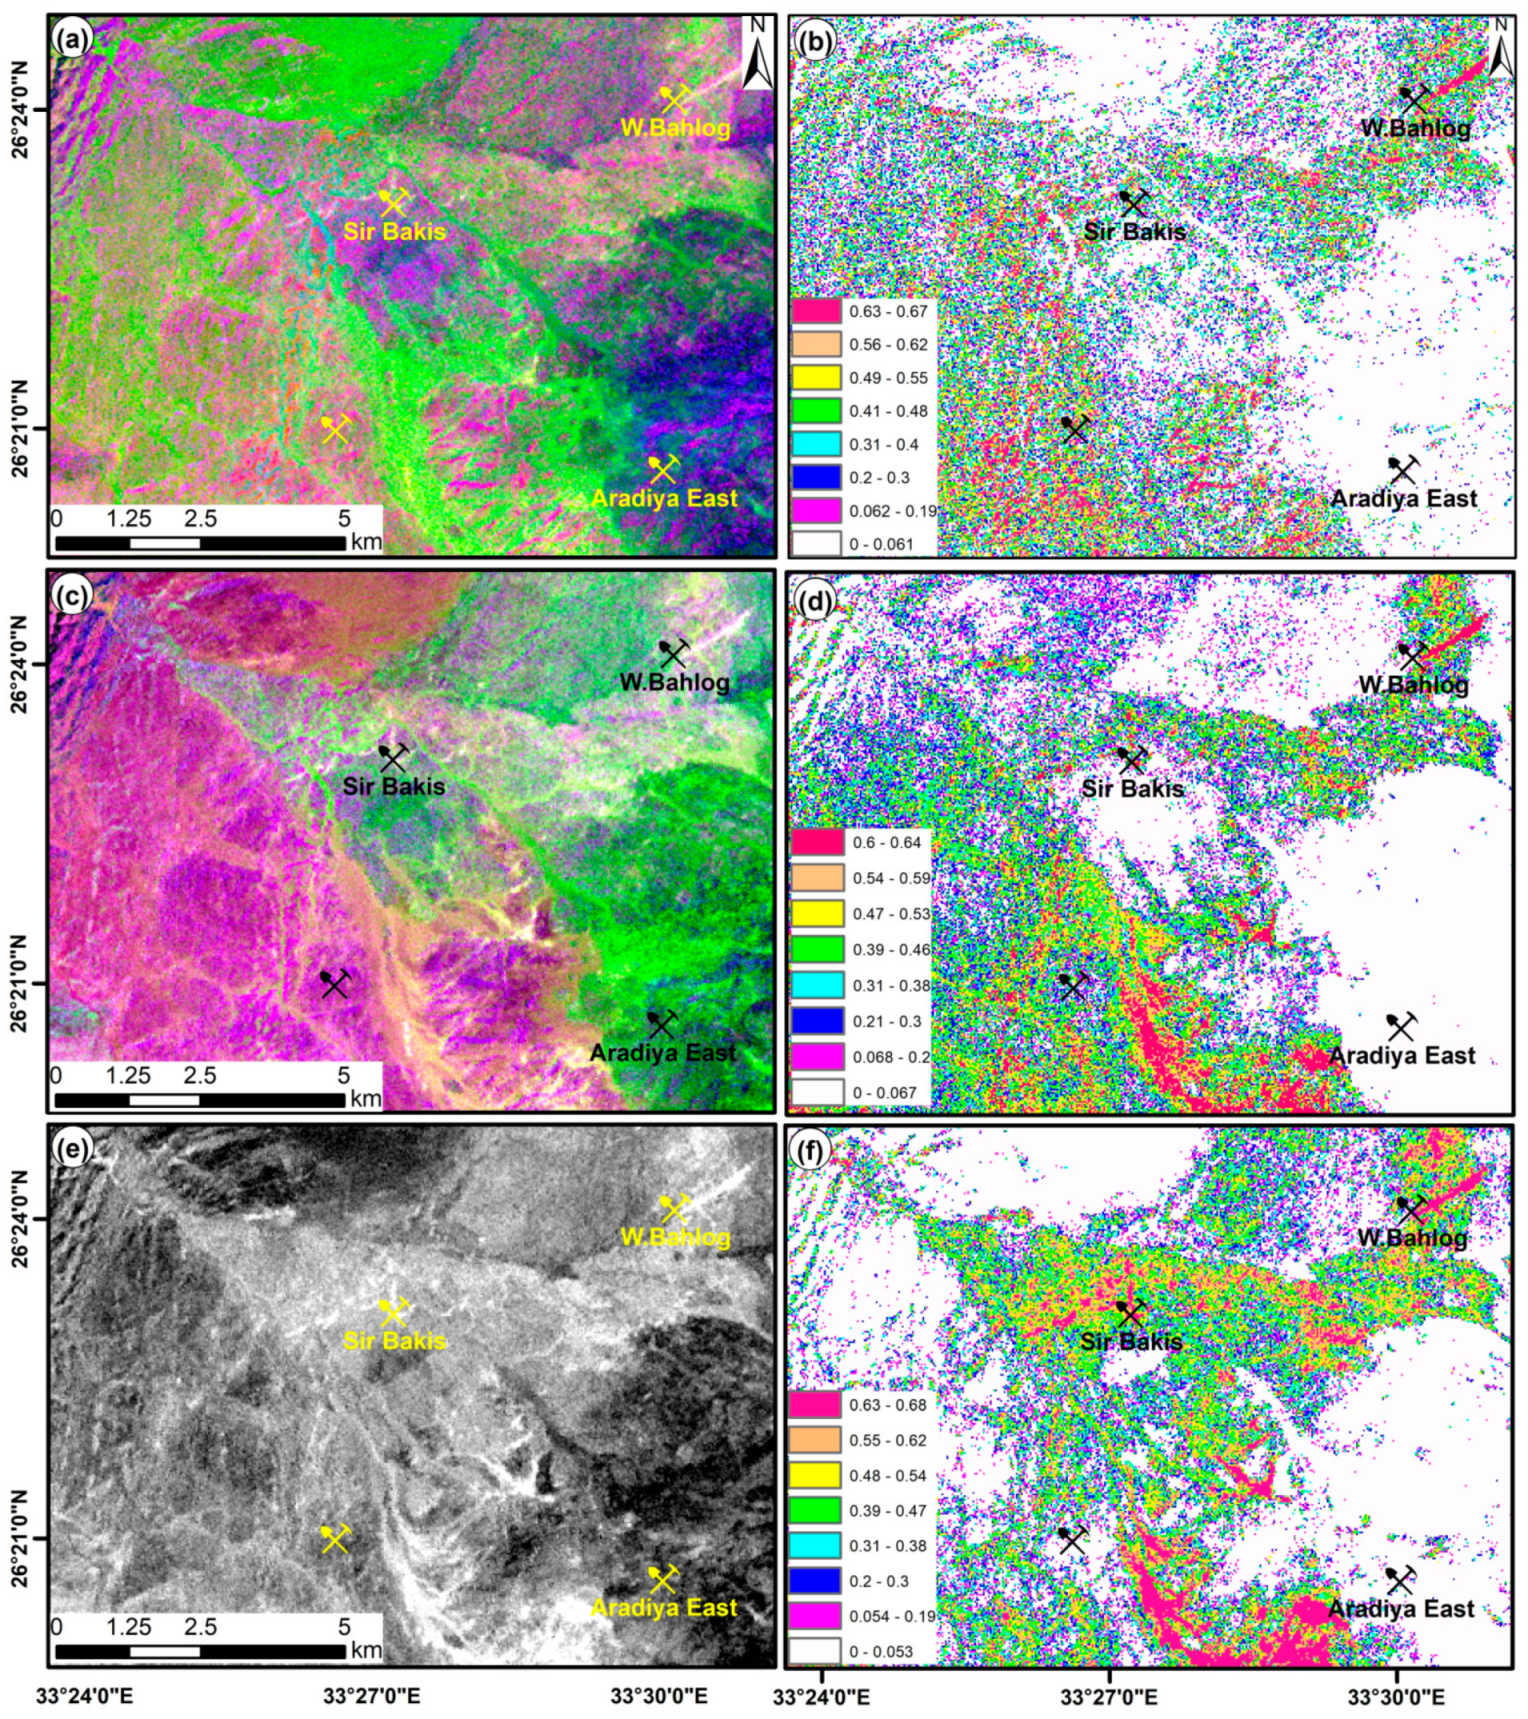
Using ASTER band ratios 5 + 7/6 (argillic-phyllic), 4 + 6/5 (advanced argillic), and 5 + 8/6 + 7 (hydrous silica) in R, G, and B, respectively, allowed discriminating the most altered areas in white (Figure 6a). The argillic-phyllic areas display in red, advanced argillic in green, and areas of hydrous silica in blue. This band composite is classified into eight classes, the prominent areas of hydrothermal alteration marked in red (Figure 6b).
Using OHI, 4/7, and (5 + 7)/6 allowed for displaying the prominent areas of hydrothermal alteration zones (HAZs) in a white tone and alkali-granites in purple colors, the older granites and metavolcanics in greenish hues, with the more mafic rocks displayed by darker green colors (Figure 6c). The areas were reclassified into eight classes, the lowest potentiality marked in white (0.0–0.067) and the high hydrothermal alteration in red (0.60–0.64), (Figure 6d).
The ASTER bands 4, 5, and 6 were employed for PCA for mapping areas of argillic hydrothermal alteration. The achieved eigenvector values of the chosen PCA approach are displayed in Table 3. The investigation of eigenvector loadings showed that PC2 reflects a positive loading of band 4 (0.330) and a negative loading of bands 5 (−0.568) and 6 (−0.754). Displaying PC2 in gray scale (Figure 6e) reveals the areas of hydrothermal alteration in a white tone. Using Arc GIS, the areas of high hydrothermal alteration were extracted in red (rank 4) versus the low hydrothermal alteration marked in light yellow (rank 1) (Figure 6f).
To optimize the extraction of alteration zone indicators, a map combining different sensors (negated PC3 of H-image of bands 2, 5, 6, and 7 of OLI data and PC4 of Sentinel-2; band ratio 4/6 ASTER data; OHI, KAI, and (B4 × 3)/(B5 + B6 + B7); (5 + 7)/6, (4 + 6)/5, and (5 + 8)/(6 + 7); PC2 of selected ASTER bands 4, 5, and 6, and band ratios 4/5, 4/7, and 4/6) was prepared using Arc GIS software packages (Figure 7).
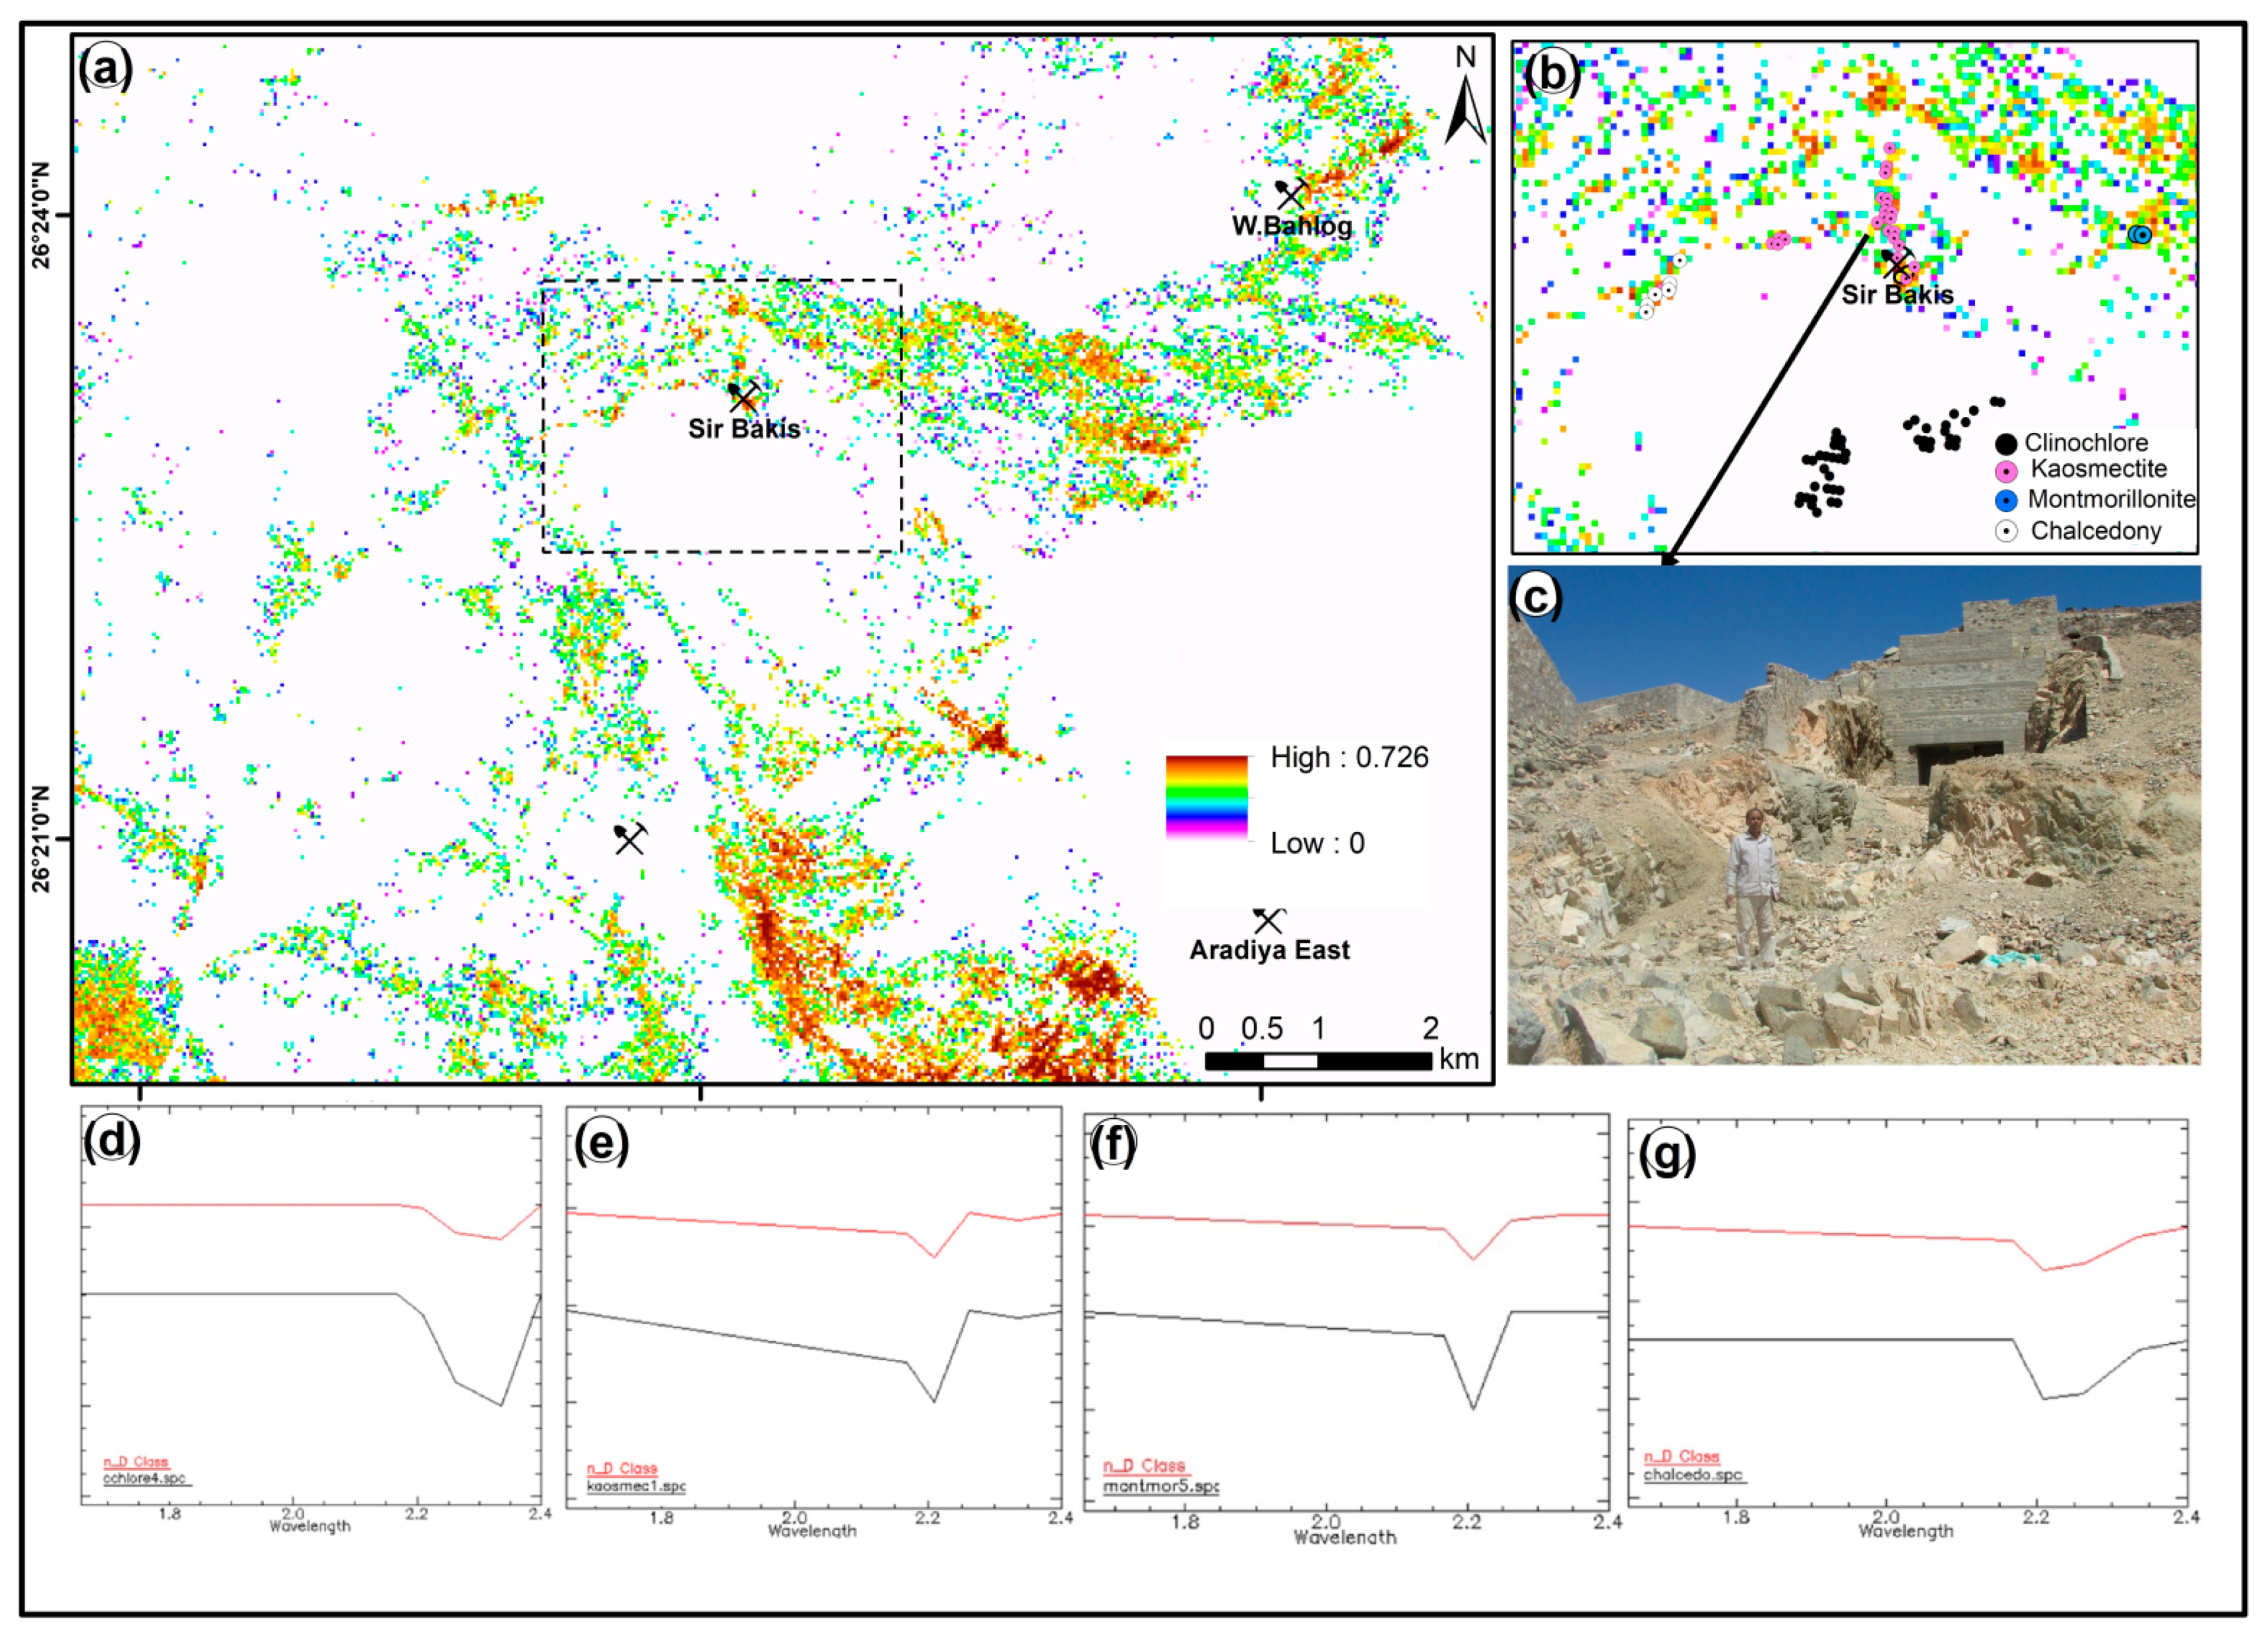
The resulting HAZs map (Figure 7a), considered crucial for prospecting for mineral deposits with hydrothermal alteration zones, shows the very high probability of mineralization with brownish orange (Figure 7a). Within the map area, the zone of high hydrothermal alteration is considered as a priority target for exploration. This zone represents the overlap of the majority of predictive layers and is spatially associated with areas of known mineralization and the adit to the Sir Bakis and Bahlog gold mines (Figure 7b,c). Most of these areas coincide with hydrothermal activities along structural features, e.g., dikes, quartz veins, and/or lithologic contacts.
Mapping the zones of hydrothermal alteration using image transformation techniques combined with knowledge-driven fuzzy logic methods clearly shows that the Al–OH minerals are restricted to fracture zones (Figure 7 and Figure 8). Hydrothermal alteration patterns for the study area (Figure 7) were confirmed in sequential steps after comparing map absorption patterns with absorption patterns for individual alteration endmembers/minerals obtained from the spectral library of the USGS (Figure 7d–g). The obtained spectra indicate the abundance of a group of minerals with an absorption feature near 2.335 μm, which most likely corresponds to CaCO3 or Mg–OH–bearing minerals such as chlorites and talc. Based on the high score of matching spectra with the USGS mineral spectral library, the mineral most likely responsible for absorption at this wavelength is clinochore (cchlore4.spc) with a score of about 0.974 (Figure 7d). Such a chlorite mineral shows a small absorption signature at 2.25 µm and deep negative characteristics at ~2.33 µm, based on the chlorite composition [18,45]. The spatial distribution of this mineral is most likely associated with metavolcanics and zones of low hydrothermal alteration (Figure 7a). The hydrothermal alteration with strong absorption near 2.165 μm and 2.209 μm correlates with the kaolinite–smectite group (kaosmec1.spc; Figure 7e), with a score of about 0.968 for the area near the mine adit, and 0.897 in areas along the quartz vein. Montmorillonite (Figure 7f) with a score of 0.950 is detected in areas of hydrothermal alteration east of Sir Bakis mine. Finally, chalcedony/quartz was identified with a score of about 0.880 in areas of strong hydrothermal alteration to the west of the mine area (Figure 7g).
4.3. Lineaments
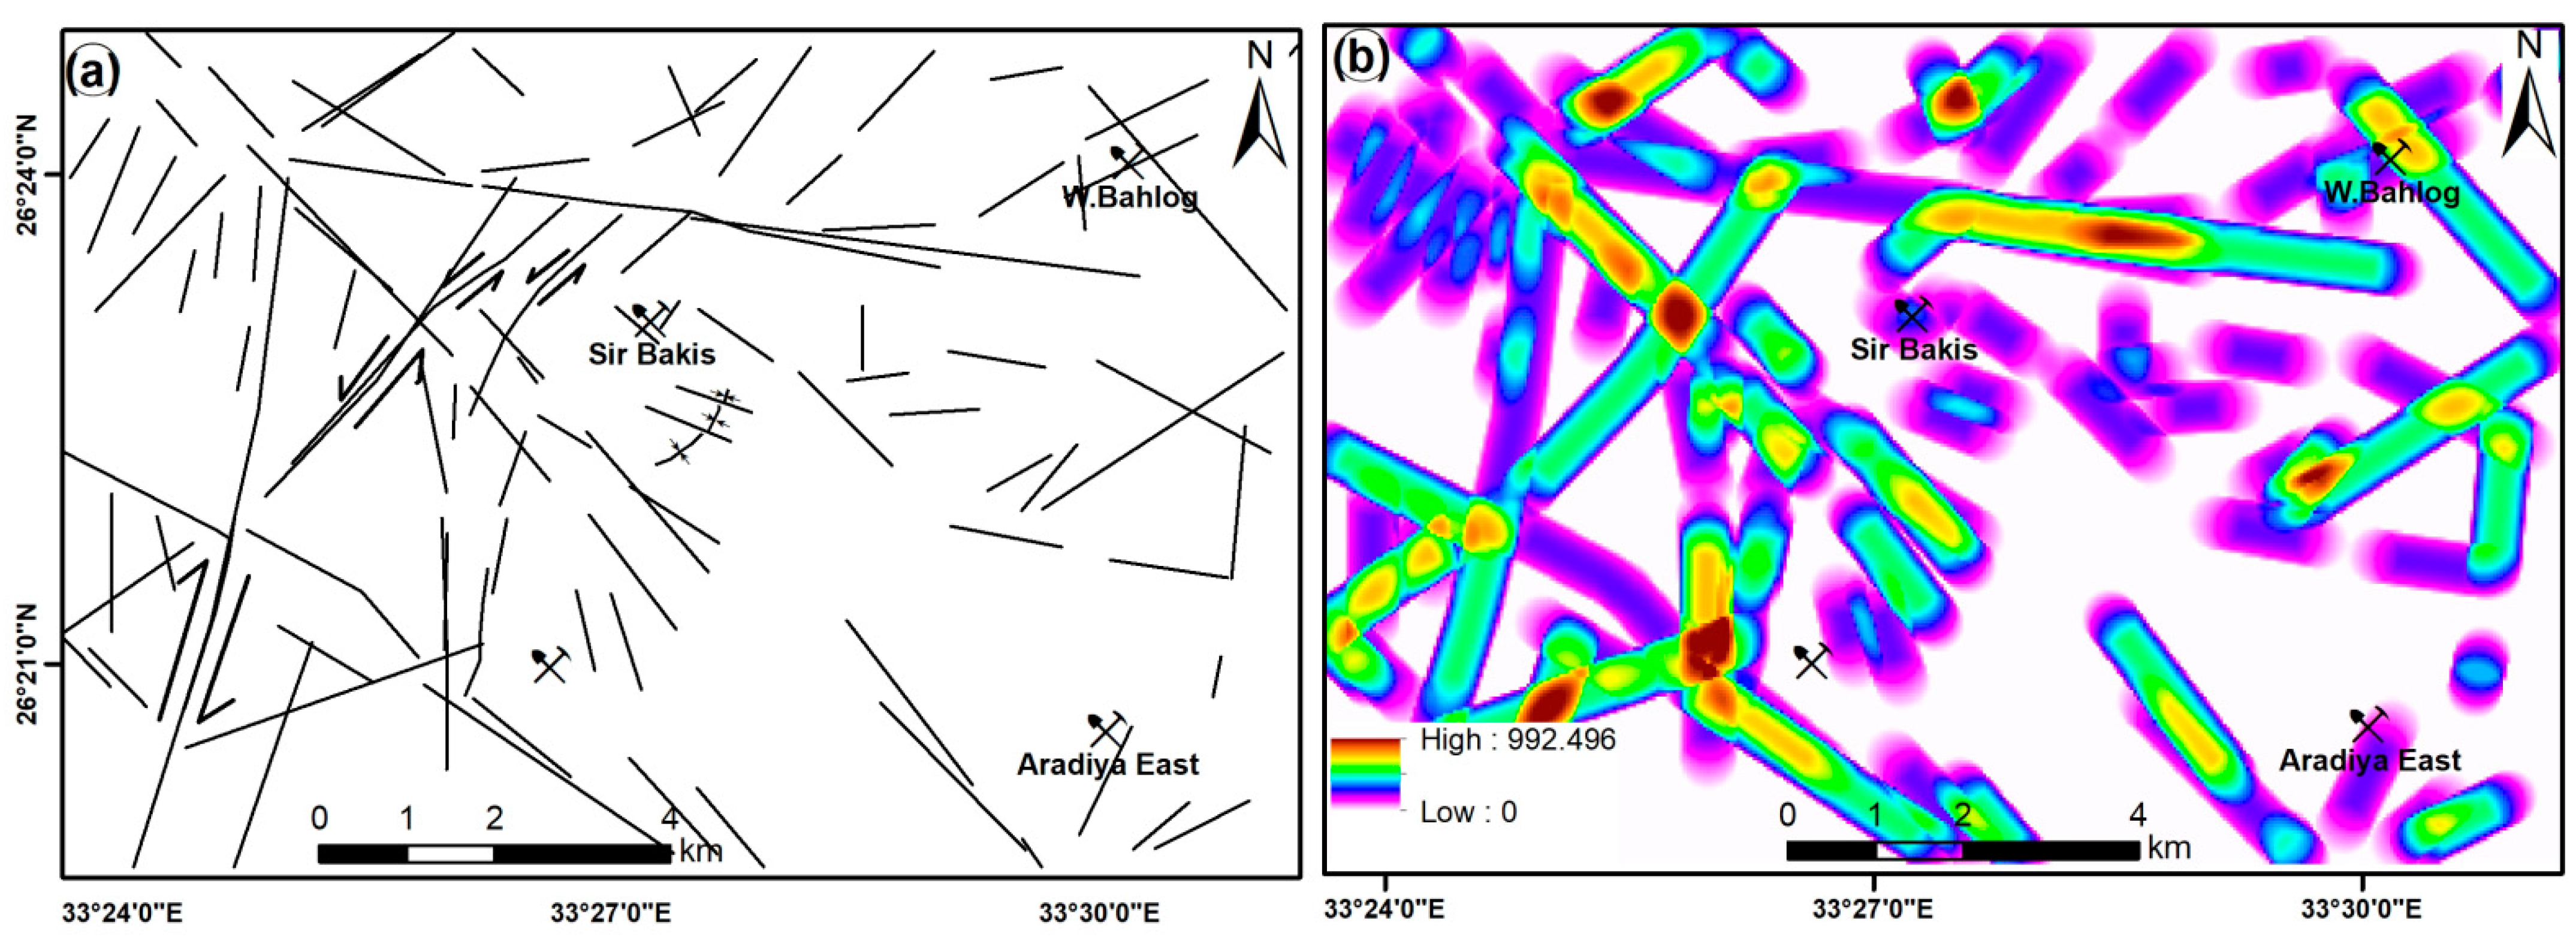
Lineaments are derived from remote-sensing data that are mainly extended in NNW-SSE and NW-SE trends (Figure 8a,b). These trends most likely cut by sinistral NE-SW strike-slip faults and dextral NNE-SSW faults. These extracted lineaments would represent the main conduits for carrying hydrothermal solutions from the source to deposition and represent the best channels for hydrothermal solutions to move through [1,46,47,48]. Therefore, the proximity to these lineaments represents the prominent areas of hydrothermal ore deposits [49,50]. The intersections of lineaments obtained from remote sensing data represent the geologic structures that provide the density map. This map shows clear structural trends in the NNW-SSE, NW-SE, and NE-SW directions (Figure 8a). The areas of high lineament density are marked in brown (Figure 8b).
4.4. Mineral Prospective Map (MPM)
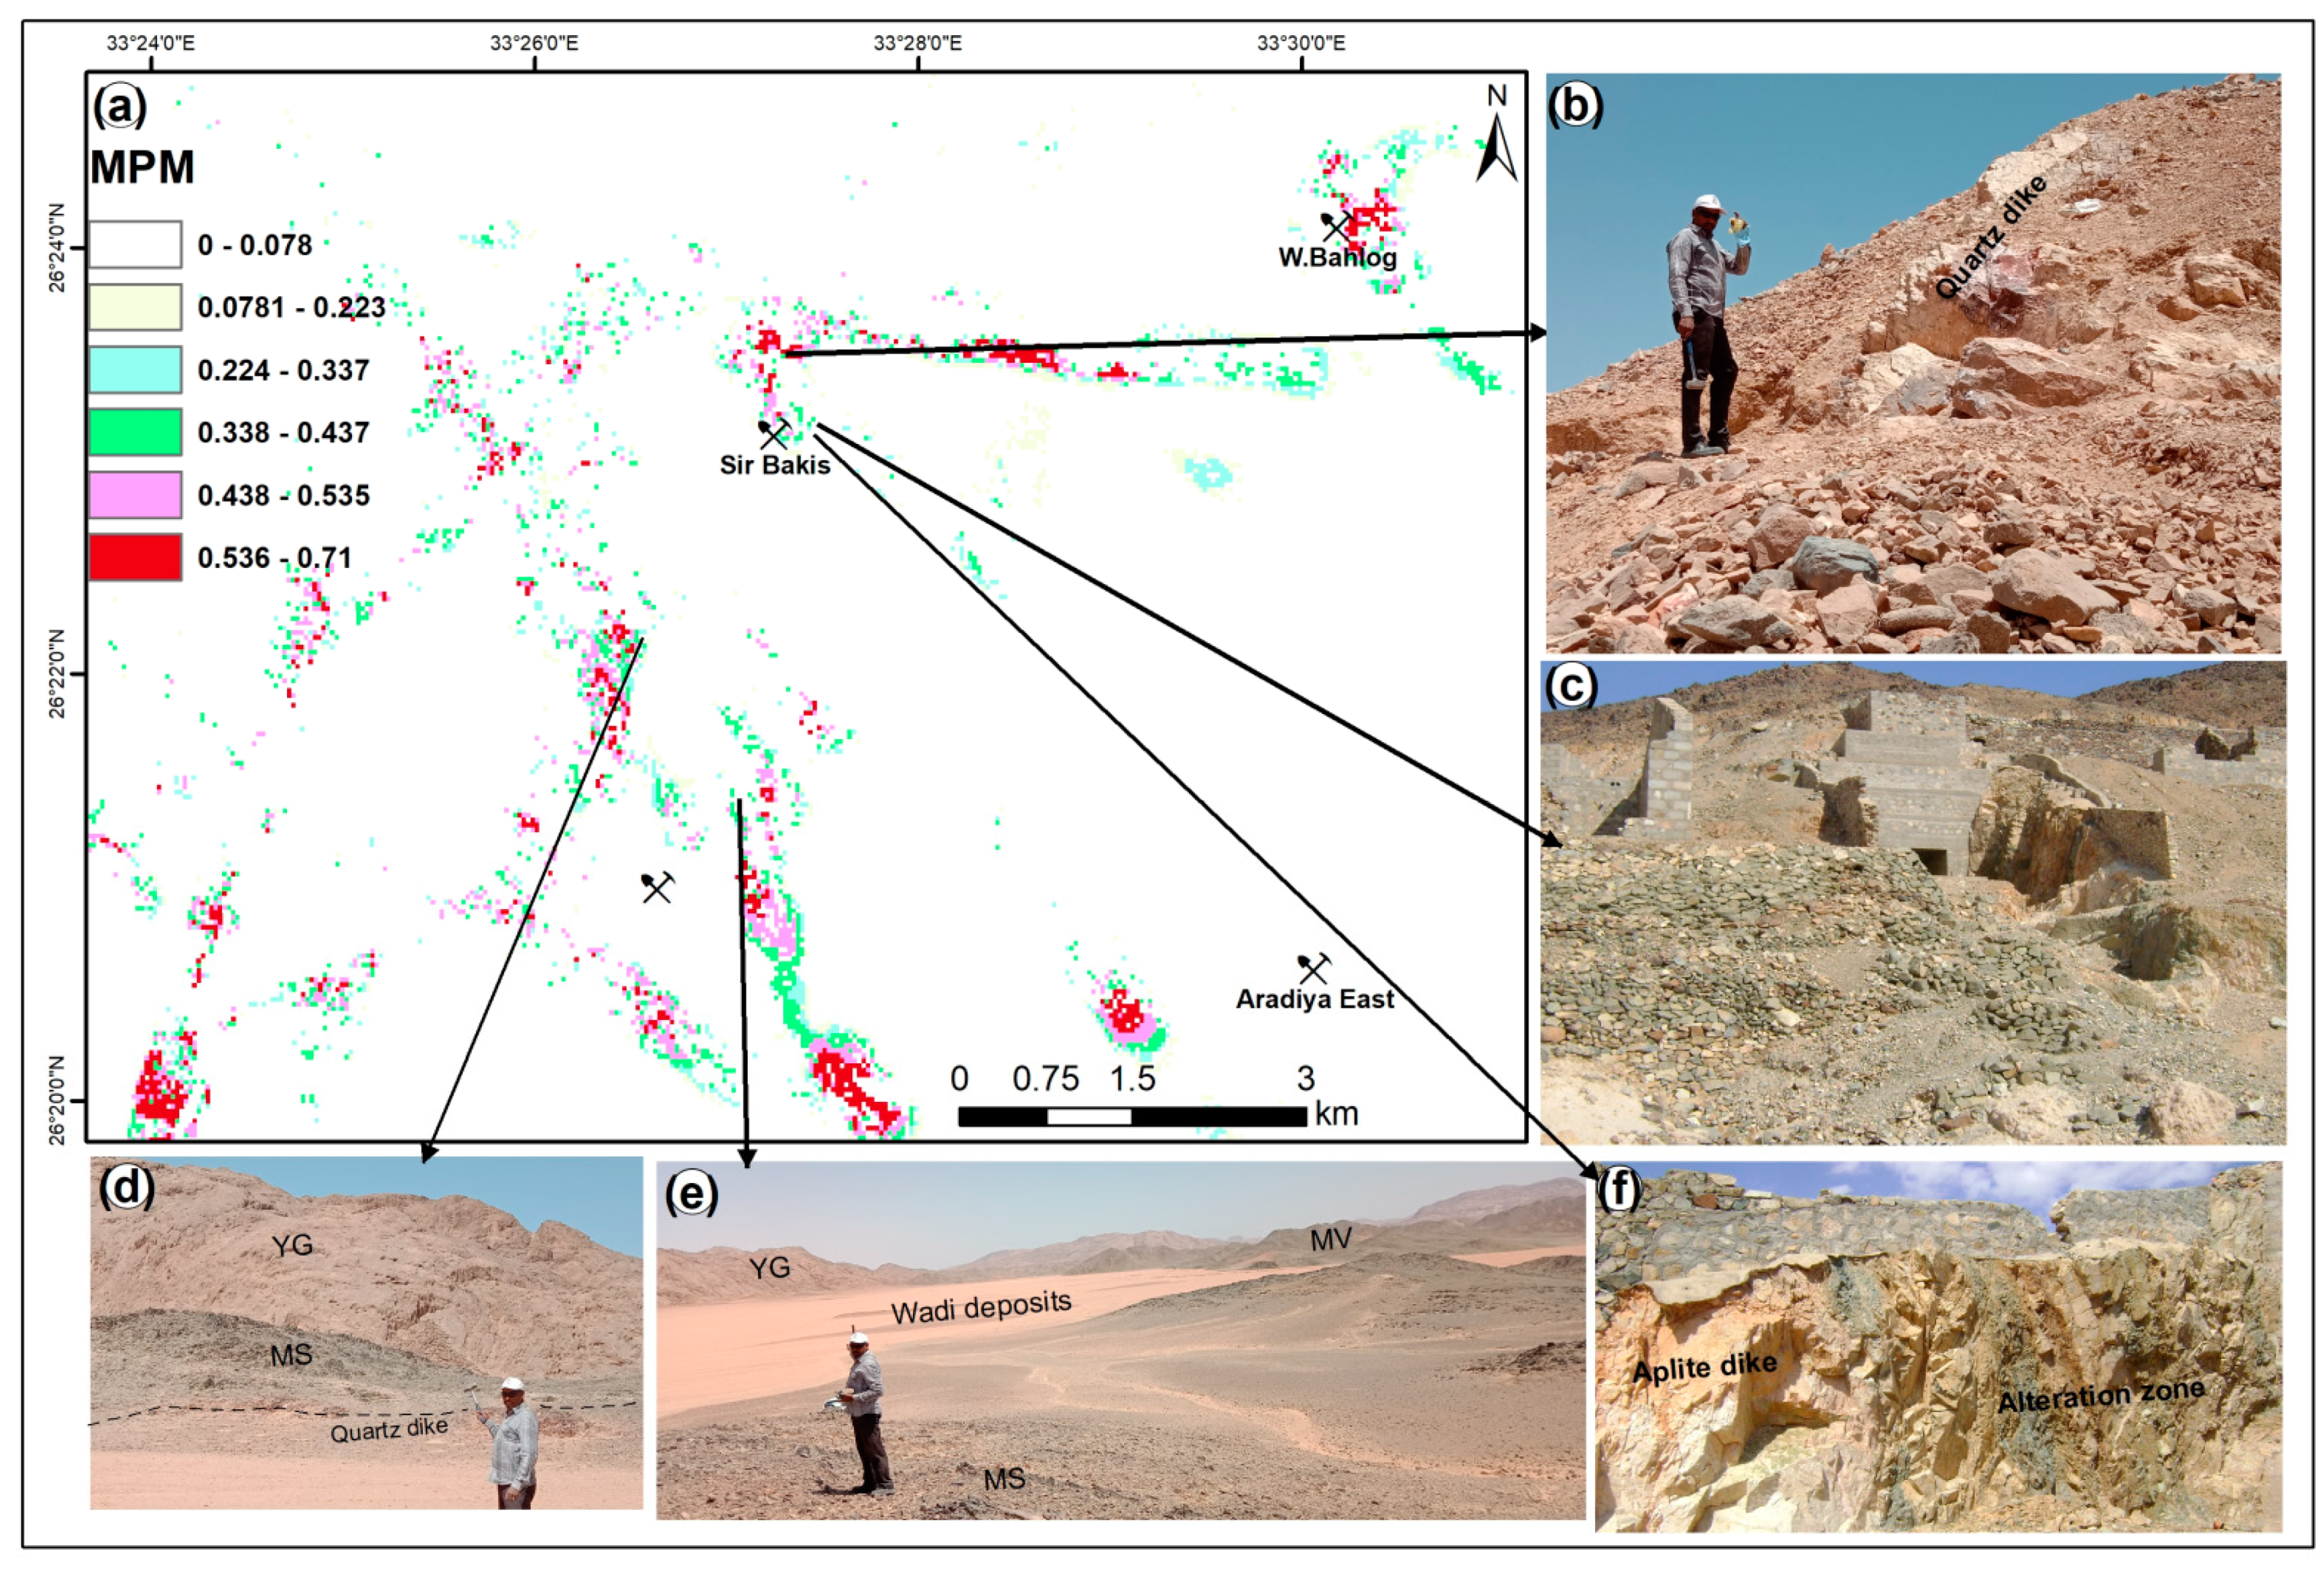
Combining various evidential hydrothermal alteration maps (Figure 7a) and extracted lineaments (Figure 9a,b,d) through a GIS-based fuzzy logic overlay approach revealed the plausible areas of hydrothermal mineral deposits. The mineral prospective map grouped into six classes—very low, low, moderate, good, very good, and excellent—based on their potential for Au production, and cover about 95.32, 1.20, 0.82, 1.05, 1.02, and 0.59% of the study area, respectively (Table 4). The most prospective zone of mineral deposits is indicated by red (0.53–0.71). The output map (Figure 9a) revealed a consistency between the hydrothermal-ore deposits at mines of Sir Bakis (Figure 9a–c,f), Bahlog, and southwest of Aradiya. However, some areas of the high prospective zone were confined to wadi deposits and areas of silicifications (Figure 9d,e).
4.5. Field Validation and Laboratory Analysis
Field relations and observations were conducted in 2015 and on 9 to 10 June 2021, to reveal the lithologic, structural, and hydrothermal characteristics of the rock units and verify the mineral prospective map. The younger granite plutons intruded on the pre-exiting rocks such as metavolcanics, metasediments, and older granites. Quartz dikes/veins, and felsic and mafic dikes cut the entire rock units. Our field results revealed that some of the quartz veins are white, smoky, and often reddish, particularly in mine areas (Figure 10a,b). The mineralized quartz veins often with reddish yellowish and dark brownish colors. The vugs in the quartz are filled by carbonates and iron-oxides (hematite and/or limonite). These veins are extending in NNW-SSE and N-S trends.
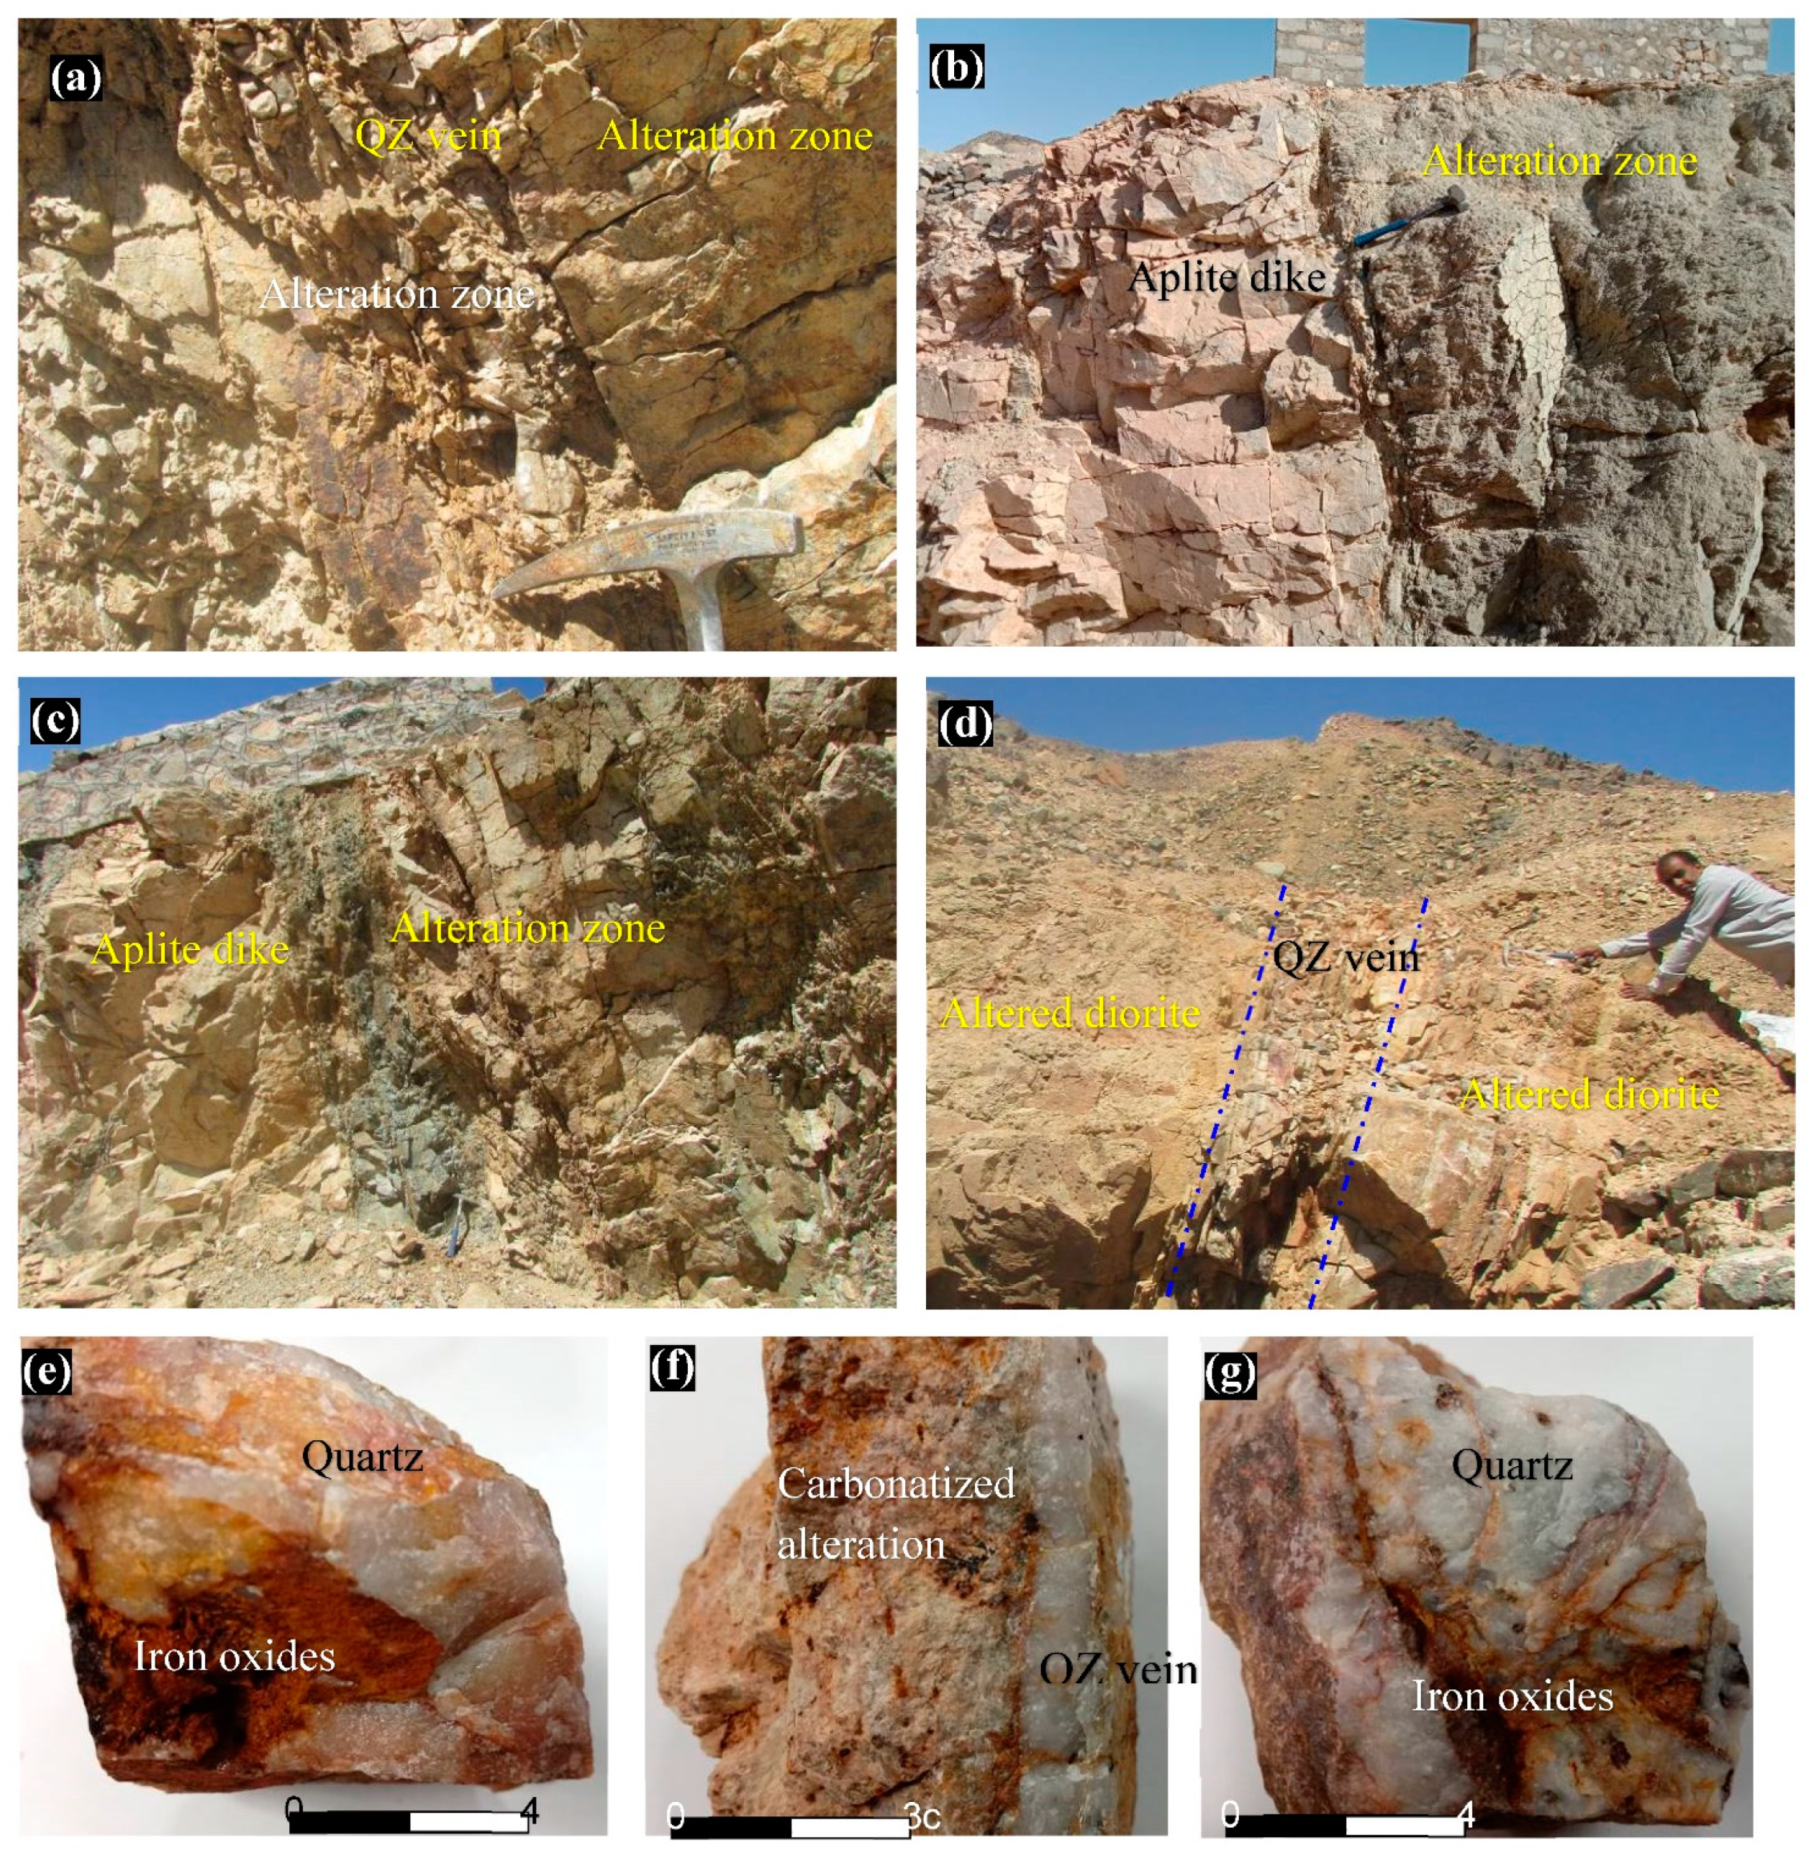
The HAZs at the mine area are commonly associated with aplite and/or quartz dikes or veins (Figure 10a–d). They extend to a few meters in association with aplite (Figure 10a–c) but often less than a meter when associated with quartz veins (Figure 10d). They are characterized by brownish, whitish, reddish, and greenish tint that are related to argillic, carbonatized, and hematitic characteristics and highly sheared rocks. Hematite and limonite were recognized due to the oxidation of sulfides associated with quartz-bearing minerals (Figure 10e–g). Silicified zones occur in W. Gidami, W. Bahlog, W. Aradiya and in the area of the intrusive younger granites. Gold and sulfide mineralization are consistent with highly silicified zones that are associated with the advanced argillic alteration (Figure 10).
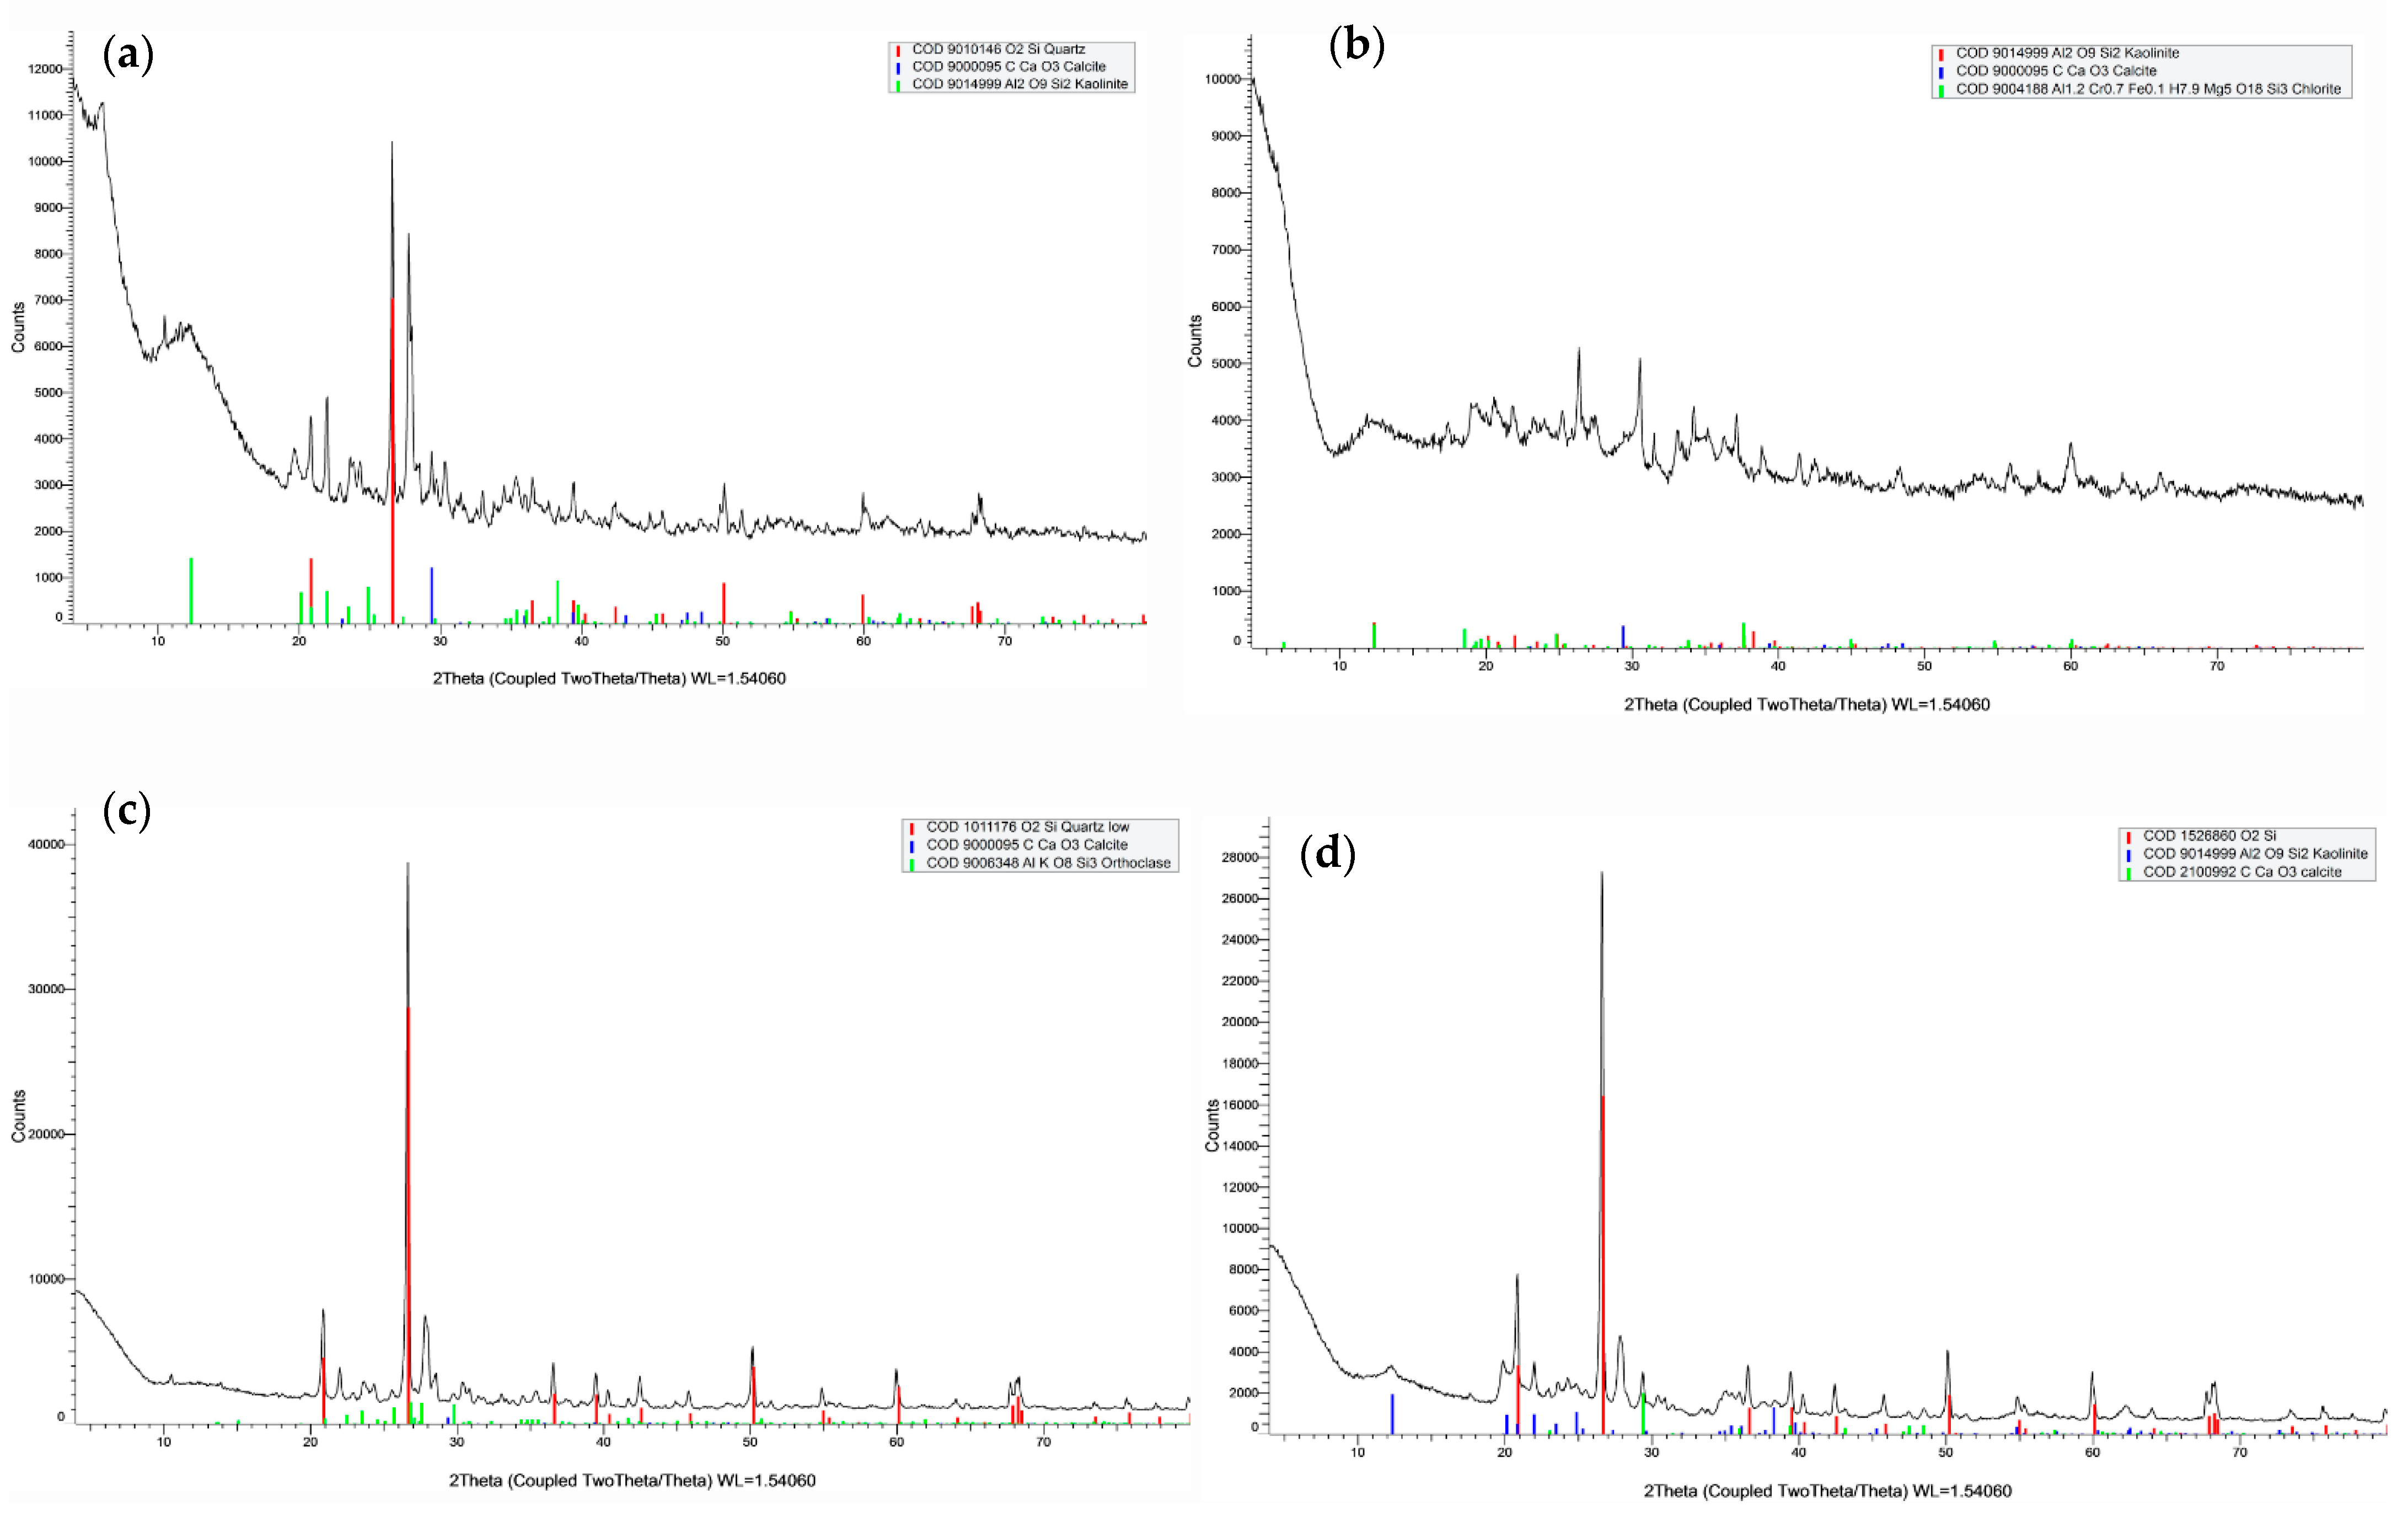
The XRD analysis of four representative samples revealed the mineralogical characteristics of the HAZs. The results revealed the presence of advanced argillic alteration along with carbonates and silicification. Propylitic alteration is represented in the existence of chlorite and calcite in the advanced argillic (kaolinite), silicification (quartz), and K-alterations (orthoclase) (Figure 11).
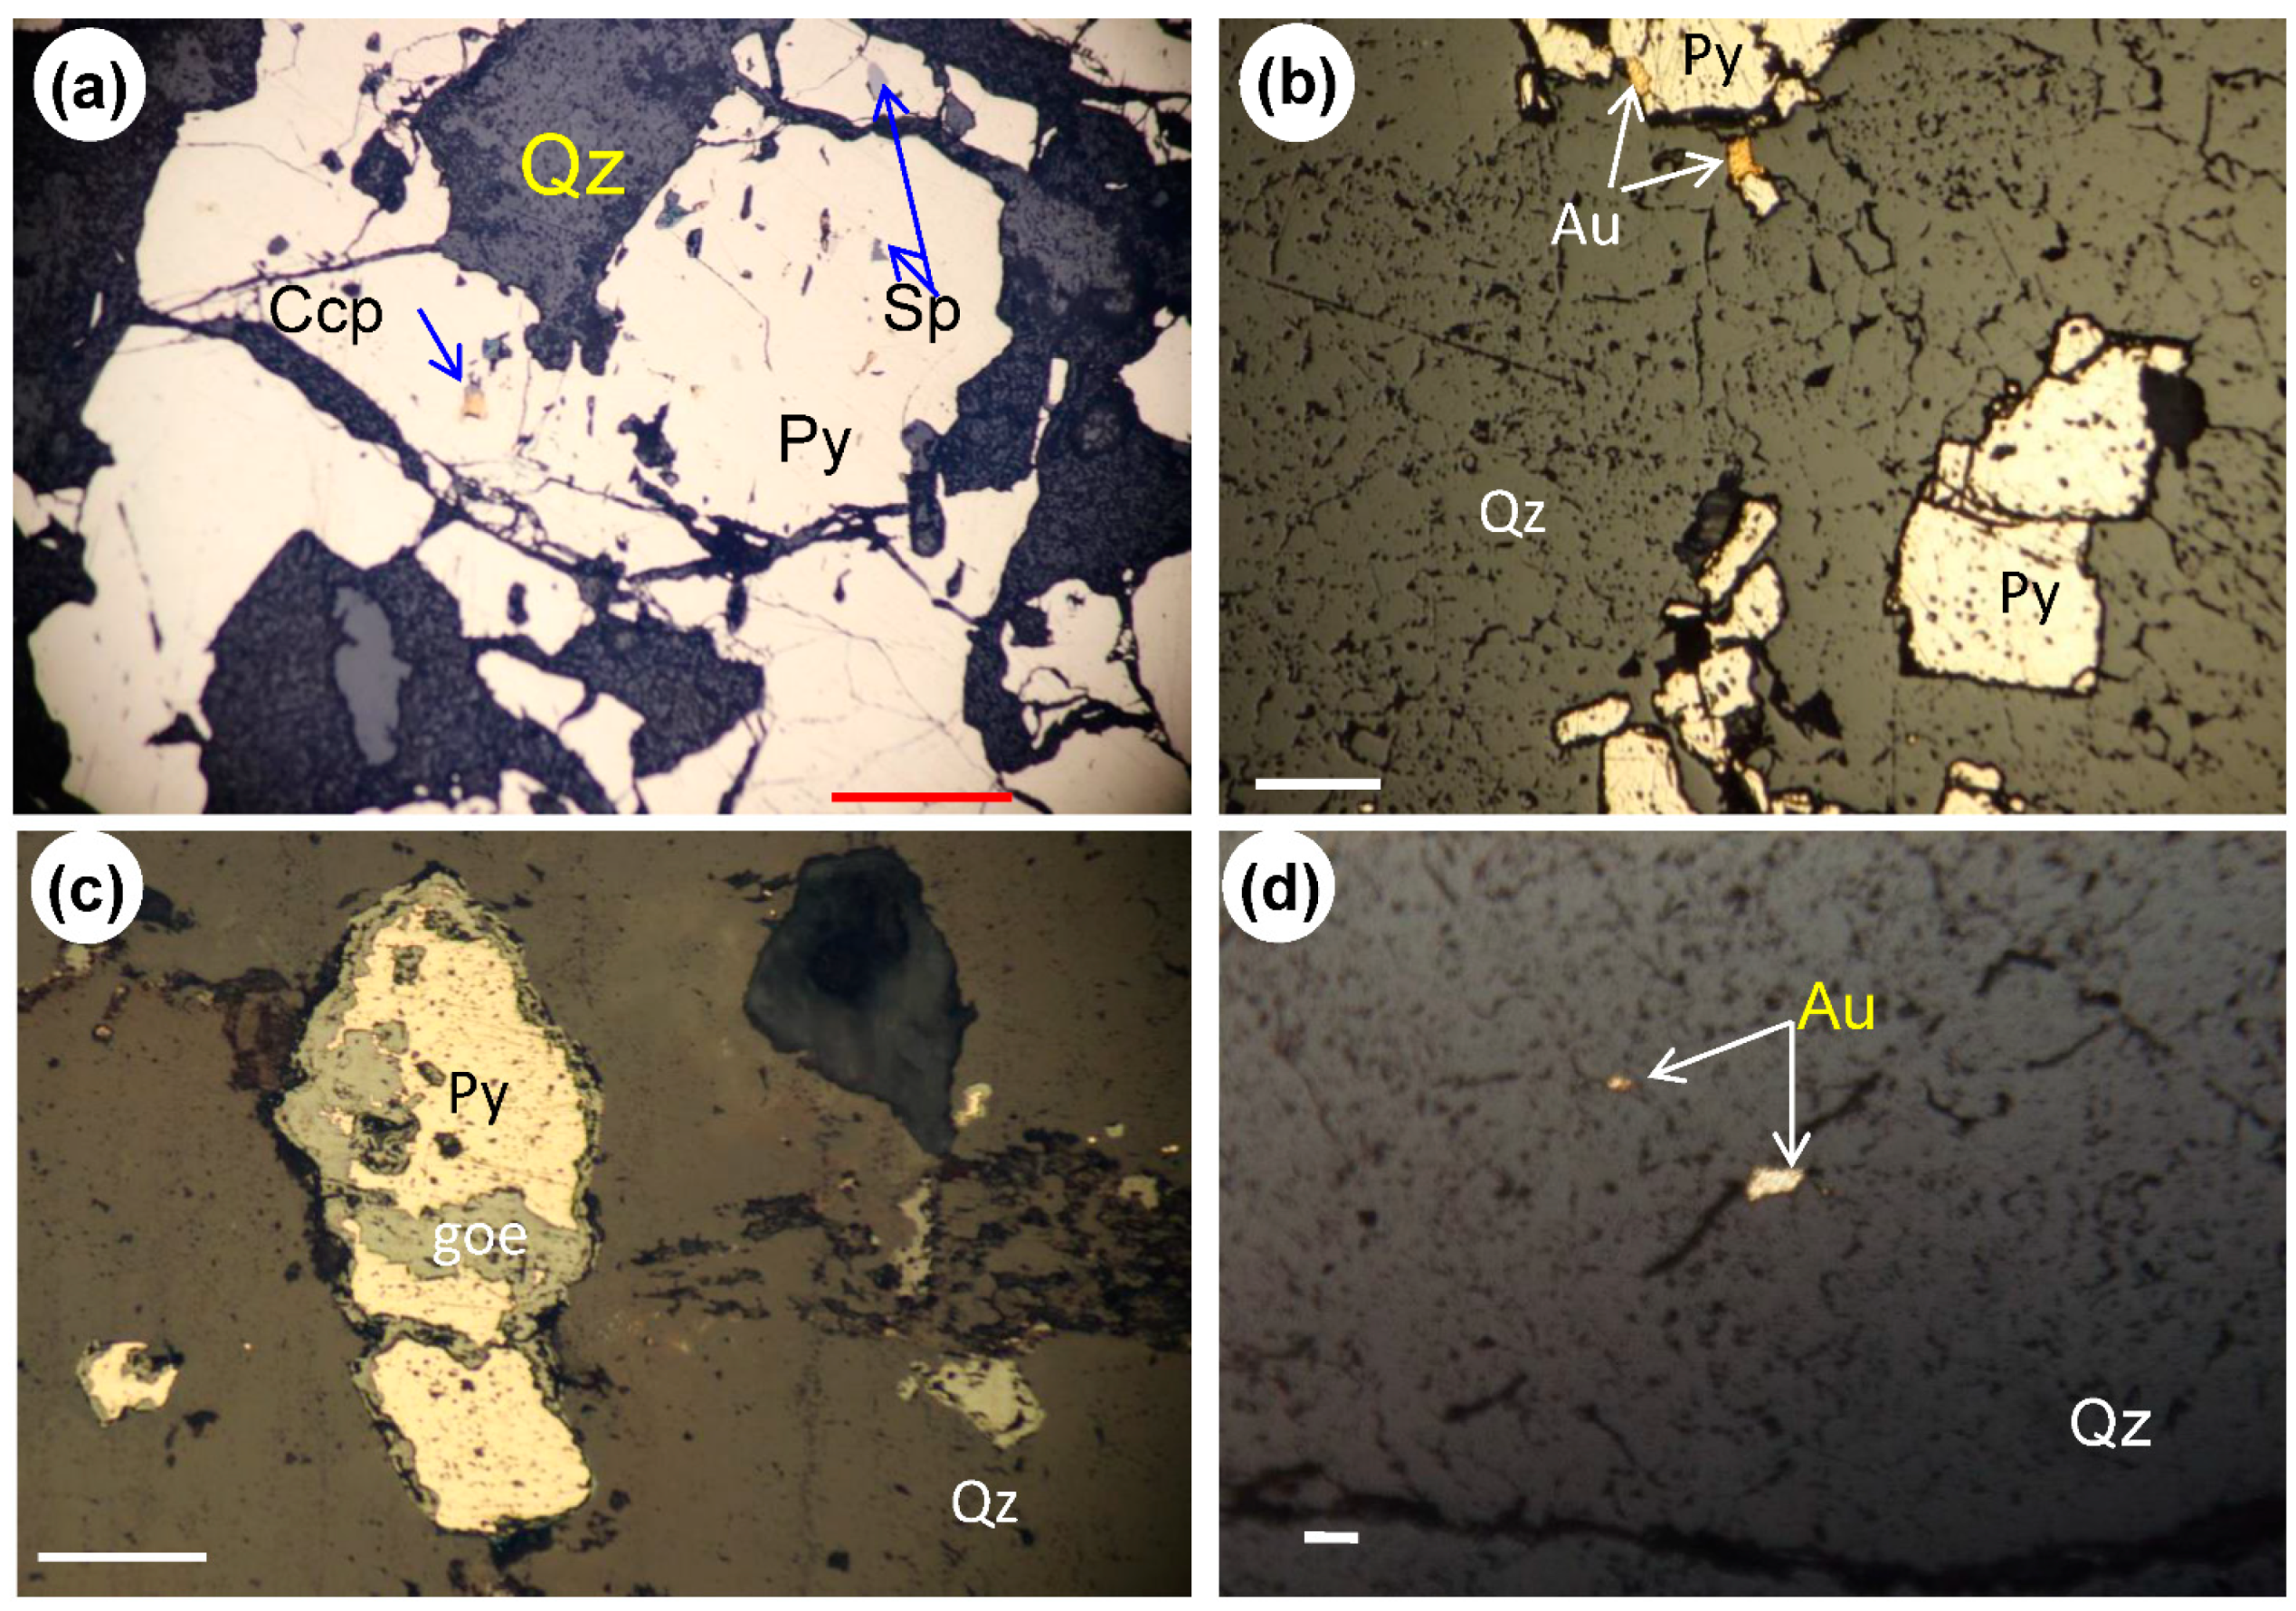
For further validation, the collected samples from Sir Bakis mine revealed the presence of sulfide minerals, e.g., pyrites, chalcopyrite, sphalerite, and gold associated with quartz veins in the area of high hydrothermal alteration. Pyrite represents the main sulfide minerals that display well-developed euhedral to anhedral crystals that commonly include inclusions of chalcopyrite and sphalerite (Figure 12a,b). It is partially replaced along its rims and fractures by goethite (Figure 12c). Gold is associated with pyrite and/or quartz (Figure 12b,d) and filling micro-fractures.
5. Discussion
The discovery of new deposits is one of the most significant issues in mineral explorations. The recognition of surface alteration zones using remote sensing data along with detecting lineaments are significant factors in revealing the hydrothermal mineral resources [51]. Several methods have been successfully employed for this aim including PCA, band ratios, and spectral analysis [1,9,52].
Using Sentinel-2 composite of bands 12, 8, and 3, and band ratio composite 12/11, 4/8 and 3/4 in R, G, and B, and band ratio 6/1, 6/8A and (6 + 7)/8A [39], the younger granites, older granites, and metavolcanics are clearly delineated (Figure 3). This is because in these combinations, band ratio 3/4 characterizes the ferrous iron [39]. Moreover, applying band ratios 11/8A, (12/8A) + (3/4), and band 3 of Sentinel-2 characterized the granitoids and mafic rocks as the ferric oxides (Fe3+) represented by 11/8A and ferrous iron (Fe2+) represented by (12/8A) + (3/4) [39].
The PCA derived from selective bands 2, 5, 6, and 7 of OLI reveal the hydroxyl-bearing minerals such as clays/carbonates, respectively (Figure 4a,b) [40,41,42,43]. The contrast between bands 6 and 7 of Landsat-8 OLI were successfully implemented for characterizing clay minerals that have a high reflectance in band 6 (1.57–1.65 µm) and a low absorption feature in band 7 (2.11–2.29 µm) [9,53]. Likewise, the spectral region of bands 11 (1.565–1.655 µm) and 12 (2.100–2.280 µm) of Sentinel-2 employed for revealing the (Al-OH) alteration and carbonates (muscovite, kaolinite, gypsum, calcite, and dolomite) show spectral absorption characteristics in the 2.1–2.5 µm region [53]. Therefore, the contrast between bands 11 and 12 that represented in PC4 is utilized (Figure 4c,d).
Because of the fine spectral quality of ASTER SWIR data and the fact that many minerals such as kaolinite, illite, and montmorillonite have a high absorption signature in band 6 and a high reflectance in band 4, this ratio 4/6 (1.656/2.209 μm) is more appropriate for highlighting the hydrous minerals (Figure 5a) including argillic and phyllic [54] and covers the spectral region where hydrothermal minerals display reflectance and enhances the clay/mica response [44]. However, using mineral indices OHI, kaolinite index (KAI) [21,22], and (B4 × 3)/ (B5 + B6 + B7) (cf. [13]) of ASTER data clearly depicts areas rich in Al–OH—bearing minerals in white (Figure 5c).
Furthermore, using band ratios 4/5, 4/7, and 4/6 of ASTER data (Figure 5e,f) allowed for characterizing the HAZs, as band ratios 4/5 and 4/7 of ASTER enhance argillic and sericitic alteration zones, respectively [44]. ASTER band ratio 4/5 characterizes the advanced argillic alteration (e.g., alunite and dickite) as the argillic alteration characterized by double absorption signatures at bands 5 (2.16 µm) and 6 (2.20 µm), whereas the phyllic zone presents a single marked absorption at a band 6 (~2.205 µm), [9,54], and the Fe-OH and/or Fe–sericite minerals were recognized in band 7.
For optimum discovery of the Al/Fe-OH minerals, e.g., muscovite, kaolinite, and jarosite [53] and Al–smectite, muscovite, sericite, and illite [3,19,55,56,57], the ratio band depth (5 + 7)/6 was successfully implemented (Figure 6a) with 4+6/5 that reveals the advanced argillic (alunite-kaolinite-pyrophyllite) [19,44], and hydrous silica (5 + 8)/(6 + 7), [19]. This combination successfully revealed the prominent alteration zone at the Sir Bakis and Bohlog mines in white (Figure 6a) that fitted to mineralized quartz veins and silicification zones. The RBD of (5 + 7)/6 depends on bands 5 and 7 being the shoulders of the Al-OH absorption band 6 (2.20 µm), and, with increasing content of (5 + 7)/6, the possibilities of AL-OH minerals increase (Figure 6c) [55]. Furthermore, applying bands 4, 5, and 6 in PCA revealed the areas of hydrothermal alteration. This is because the chosen PC2 indicates positive loading of band 4 (0.357) and a negative loading of bands 5 (−0.531) and 6 (−0.76), and reveals the existence of alunite and kaolinite minerals [52] (Figure 6e).
Combining the results of band ratios, mineral indices, and Landsat-OLI, Sentinel-2, and ASTER data along with lineaments revealed areas of probable mineralization (Figure 7a). This is because combining several prospective layers using GIS-based fuzzy overlay maximized the optimum area of mineral prospectively (Figure 9a). The process of combining multi-criteria considers that each GIS-layer is an evidential map that has prospective and non-prospective pixels [1,2,52]. Therefore, the produced map successfully characterized the plausible areas of hydrothermal mineral resources into six prospective zones—excellent, very high, high, moderate, low, and very low (Figure 9a). The prospective zone of high hydrothermal alteration represents a target priority for hydrothermal mineral resources. Mine areas of Sir Bakis and Bahlog are fitting to zone of high prospectively (Figure 8a and Figure 9a). At Sir Bakis mine, the extracted spectra of kaolinite/smectite, montmorillonite, and chalcedony are consistent with the mineralization zone as the proximity to the interaction of hydrothermal solutions with the surrounding rocks allows for breaking the primary minerals into phyllic and argillic minerals [1,58]. The existence of propylitic minerals such as chlorite, calcite, and iron oxides reveals a possible alteration at low temperature and a fluid rich in H2O, CO2, and S [9,58].
In addition to detecting the hydrothermal alteration zones, processing and analysis of lineaments played a significant role in discovering the plausible areas of mineral prospectively, as these geologic structures allow fluids to circulate through [1,59] and has control over the ore-forming fluid flow [60]. Lineament density reveals the spatial distribution and intensity of fracture/fault zones convergence and intersections. The lineaments that trend NNW-SSW, NW-SE, and NW-SE are consistent with the directions of dikes and veins. Interactions of the hydrothermal solutions that are spreading through the detected lineaments changes the physio-chemical characteristics of the surrounding rocks relative to area of no contact with hot fluids [61]. and the strong HAZs represent the location of ore body and high concentration of mineral deposits [1,2].
6. Conclusions
Multispectral remote sensing data have the aptitude to detect and characterize the absorption signatures of the hydrothermal alteration minerals. ASTER, Sentinel-2, and Landsat-OLI have been implemented in the present study to detect the prospective areas of hydrothermal mineral resources. Evidential layers represent HAZs derived from different multispectral sensors along with lineament density were combined to reveal the prospective areas of HAZs in the CED. Applying remote sensing data successfully delineated the HAZs and characterized the hydrothermal mineral assemblages associated with gold-sulfide mineralization that are consistent with areas of intense hydrothermal alterations that were validated by field and lab analysis. The detected key-hydrothermal alteration minerals are kaolinite, smecktite, silica, calcite, and chlorite that reveal phyllic, argillic, and propylitic alterations.
Author Contributions
M.A. conceived and designed the manuscript; M.A. collected, processed, and analyzed the data, and performed the proposed methods; M.A. interpreted and discussed the results; M.A. and N.A.-A. wrote, edited, and revised the manuscript; M.A. handled the submission steps. All authors have read and agreed to the published version of the manuscript.
Funding
This research received no external funding.
Institutional Review Board Statement
Not applicable.
Informed Consent Statement
Not applicable.
Data Availability Statement
The satellite images used in this study are obtained from http://earthexplorer.usgs.gov and https://www.usgs.gov (USGS GloVis).
Acknowledgments
We thank the editor and the two anonymous reviewers for their contributions to improving the manuscript. The authors would like to thank El-Shazly, A. K. Department of Geology, Marshall University for his constructive comments and editing/reviewing the draft of the manuscript. We also thank Farouk El-Baz, Boston University for his continuous encouragement of this study. The authors would like to extend their sincere appreciation to the Deanship of Scientific Research, King Saud University for support through Vice Deanship of Scientific Research Chairs.
Conflicts of Interest
The authors declare no conflict of interest.
References
- Abdelkareem, M.; Kamal El-Din, G.M.; Osman, I. An integrated approach for mapping mineral resources in the Eastern Desert of Egypt. Int. J. Appl. Earth Obs. Geoinf. 2018, 73, 682–696. [Google Scholar] [CrossRef]
- Shi, X.; Al-Arifi, N.; Abdelkareem, M.; Abdalla, F. Application of remote sensing and GIS techniques for exploring potential areas of hydrothermal mineralization in the central Eastern Desert of Egypt. J. Taibah Univ. Sci. 2020, 14, 1421–1432. [Google Scholar] [CrossRef]
- Rowan, L.C.; Hook, S.J.; Abrams, M.J.; Mars, J.C. Mapping Hydrothermally Altered Rocks at Cuprite, Nevada, Using the Advanced Spaceborne Thermal Emission and Reflection Radiometer (ASTER), a New Satellite-Imaging System. Econ. Geol. 2003, 98, 1019–1027. [Google Scholar] [CrossRef]
- Pazand, K.; Sarvestani, J.F.; Ravasan, M.R.S. Hydrothermal Alteration Mapping Using ASTER Data for Reconnaissance Porphyry Copper Mineralization in the Ahar Area, NW Iran. J. Indian Soc. Remote Sens. 2013, 41, 379–389. [Google Scholar] [CrossRef]
- Pour, A.B.; Hashim, M. The application of ASTER remote sensing data to porphyry copper and epithermal gold deposits. Ore Geol. Rev. 2012, 44, 1–9. [Google Scholar] [CrossRef] [Green Version]
- Safari, M.; Maghsoudi, A.; Pour, A.B. Application of Landsat-8 and ASTER satellite remote sensing data for porphyry copper exploration: A case study from Shahr-e-Babak, Kerman, south of Iran. Geocarto Int. 2018, 33, 1186–1201. [Google Scholar] [CrossRef]
- Panahi, S.; Khakzad, A.; Afzal, P. Application of stepwise weight assessment ratio analysis (SWARA) for copper prospectivity mapping in the Anarak region, central Iran. Arab. J. Geosci. 2017, 10, 484. [Google Scholar] [CrossRef]
- Zhang, N.; Zhou, K. Mineral prospectivity mapping with weights of evidence and fuzzy logic methods. J. Intell. Fuzzy Syst. 2015, 29, 2639–2651. [Google Scholar] [CrossRef] [Green Version]
- Abdelkareem, M.; El-Baz, F. Characterizing hydrothermal alteration zones in Hamama area in the central Eastern Desert of Egypt by remotely sensed data. Geocarto Int. 2018, 33, 1307–1325. [Google Scholar] [CrossRef]
- Rockwell, B.W.; Hofstra, A.H. Identification of quartz and carbonate minerals across northern Nevada using ASTER thermal infrared emissivity data—Implications for geologic mapping and mineral resource investigations in well-studied and frontier areas. Geosphere 2008, 4, 218–246. [Google Scholar] [CrossRef] [Green Version]
- Pour, A.B.; Park, T.Y.S.; Park, Y.; Hong, J.K.; Zoheir, B.; Pradhan, B.; Ayoobi, I.; Hashim, M. Application of Multi-Sensor Satellite Data for Exploration of Zn–Pb Sulfide Mineralization in the Franklinian Basin, North Greenland. Remote. Sens. 2018, 10, 1186. [Google Scholar] [CrossRef] [Green Version]
- Rajendran, S.; Nasir, S. Characterization of ASTER spectral bands for mapping of alteration zones of volcanogenic massive sulphide deposits. Ore Geol. Rev. 2017, 88, 317–335. [Google Scholar] [CrossRef]
- Kurata, K.; Yamaguchi, Y. Integration and Visualization of Mineralogical and Topographical Information Derived from ASTER and DEM Data. Remote Sens. 2019, 11, 162. [Google Scholar] [CrossRef] [Green Version]
- Azizi, H.; Rasouli, A.A.; Babaei, K. Using SWIR bands From ASTER for discrimination of hydrothermal alterated mineral in the northwest of Iran (SE Sanadaj city); a key for exploration of copper and gold mineralization. Res. J. Appl. Sci. 2007, 2, 763–768. [Google Scholar]
- Azizi, H.; Tarverdi, M.A.; Akbarpour, A. Extraction of hydrothermal alterations from ASTER SWIR data from east Zanjan, northern Iran. Adv. Space Res. 2010, 46, 99–109. [Google Scholar] [CrossRef]
- Zhang, X.; Pazner, M.; Duke, N. Lithologic and mineral information extraction for gold exploration using ASTER data in the south Chocolate Mountains (California). ISPRS J. Photogramm. Remote Sens. 2007, 62, 271–282. [Google Scholar] [CrossRef]
- Carrino, T.A.; Crósta, A.P.; Toledo, C.L.B.; Silva, A.M. Hyperspectral remote sensing applied to mineral exploration in southern Peru: A multiple data integration approach in the Chapi Chiara gold prospect. Int. J. Appl. Earth Obs. Geoinf. 2018, 64, 287–300. [Google Scholar] [CrossRef]
- Zhang, T.; Yi, G.; Li, H.; Wang, Z.; Tang, J.; Zhong, K.; Li, Y.; Wang, Q.; Bie, X. Integrating Data of ASTER and Landsat-8 OLI (AO) for Hydrothermal Alteration Mineral Mapping in Duolong Porphyry Cu-Au Deposit, Tibetan Plateau, China. Remote Sens. 2016, 8, 890. [Google Scholar] [CrossRef] [Green Version]
- Bolouki, S.M.; Ramazi, H.R.; Maghsoudi, A.; Pour, A.B.; Sohrabi, G. A Remote Sensing-Based Application of Bayesian Networks for Epithermal Gold Potential Mapping in Ahar-Arasbaran Area, NW Iran. Remote Sens. 2020, 12, 105. [Google Scholar] [CrossRef] [Green Version]
- Crósta, A.P.; De Souza Filho, C.R.; Azevedo, F.; Brodie, C. Targeting key alteration minerals in epithermal deposits in Patagonia, Argentina, using ASTER imagery and principal component analysis. Int. J. Remote Sens. 2003, 24, 4233–4240. [Google Scholar] [CrossRef]
- Ninomiya, Y. A stabilized vegetation index and several mineralogic indices defined for ASTER VNIR and SWIR data. In Proceedings of the 2003 IEEE International Geoscience and Remote Sensing Symposium, Toulouse, France, 21–25 July 2003; pp. 1552–1554. [Google Scholar]
- Ninomiya, Y. Advanced remote lithologic mapping in ophiolite zone with ASTER multispectral thermal infrared data. In Proceedings of the 2003 IEEE International Geoscience and Remote Sensing Symposium, Toulouse, France, 21–25 July 2003; pp. 1561–1563. [Google Scholar]
- Son, Y.S.; Kim, K.E.; Yoon, W.J.; Cho, S.J. Regional mineral mapping of island arc terranes in southeastern Mongolia using multi-spectral remote sensing data. Ore Geol. Rev. 2019, 113, 103106. [Google Scholar] [CrossRef]
- Harris, J.R.; Wilkinson, L.; Heather, K.; Fumerton, S.; Bernier, M.A.; Ayer, J.; Dahn, R. Application of GIS Processing Techniques for Producing Mineral Prospectivity Maps—A Case Study: Mesothermal Au in the Swayze Greenstone Belt, Ontario, Canada. Nat. Resour. Res. 2001, 10, 91–124. [Google Scholar] [CrossRef]
- Joly, A.; Porwal, A.; McCuaig, T.C.; Chudasama, B.; Dentith, M.C.; Aitken, A.R.A. Mineral systems approach applied to GIS-based 2D-prospectivity modelling of geological regions: Insights from Western Australia. Ore Geol. Rev. 2015, 71, 673–702. [Google Scholar] [CrossRef]
- Sun, T.; Chen, F.; Zhong, L.; Liu, W.; Wang, Y. GIS-based mineral prospectivity mapping using machine learning methods: A case study from Tongling ore district, eastern China. Ore Geol. Rev. 2019, 109, 26–49. [Google Scholar] [CrossRef]
- Campos, L.D.; Souza, S.M.d.; Sordi, D.A.d.; Tavares, F.M.; Klein, E.; Lopes, E.C.d.S. Predictive Mapping of Prospectivity in the Gurupi Orogenic Gold Belt, Nort–Northeast Brazil: An Example of District-Scale Mineral System Approach to Exploration Targeting. Nat. Resour. Res. 2017, 26, 509–534. [Google Scholar] [CrossRef]
- Klemm, D.; Klemm, R.; Murr, A. Gold of the Pharaohs—6000 years of gold mining in Egypt and Nubia. J. Afr. Earth Sci. 2001, 33, 643–659. [Google Scholar] [CrossRef]
- Murr, A. Genesis of gold mineralization of Fatria, Gidami, Atalla and Hangaliya, Eastern Desert of Egypt. Münchner Geol. Hefte 1999, 27, 202. [Google Scholar]
- Conoco. Geological Map of Egypt, Scale 1:500,000; The Egyptian General Petroleum Corporation: Cairo, Egypt, 1987. [Google Scholar]
- Van der Werff, H.; Van der Meer, F. Sentinel-2A MSI and Landsat 8 OLI Provide Data Continuity for Geological Remote Sensing. Remote Sens. 2016, 8, 883. [Google Scholar] [CrossRef] [Green Version]
- Abrams, M.J.; Brown, D.; Lepley, L.; Sadowski, R. Remote sensing for porphyry copper deposits in southern Arizona. Econ. Geol. 1983, 78, 591–604. [Google Scholar] [CrossRef]
- Estornell, J.; Martí-Gavilá, J.M.; Sebastiá, M.T.; Mengual, J. Principal component analysis applied to remote sensing. Model. Sci. Educ. Learn. 2013, 6. [Google Scholar] [CrossRef] [Green Version]
- Richards, J.A. Remote Sensing Digital Image Analysis: An Introduction; Springer: Berlin/Heidelberg, Germany, 1986; p. 297. [Google Scholar]
- Kashani, S.B.M.; Abedi, M.; Norouzi, G.H. Fuzzy logic mineral potential mapping for copper exploration using multi-disciplinary geo-datasets, a case study in seridune deposit, Iran. Earth Sci. Inform. 2016, 9, 167–181. [Google Scholar] [CrossRef]
- Zadeh, L.A. Fuzzy sets. Inf. Control 1965, 8, 338–353. [Google Scholar] [CrossRef] [Green Version]
- Hines, J.; Tsoukalas, L.H.; Uhrig, R.E. MATLAB Supplement to Fuzzy and Neural Approaches in Engineering; John Wiley & Sons, Inc.: Hoboken, NJ, USA, 1997. [Google Scholar]
- Ma, Y.; Zhao, J.; Sui, Y.; Liao, S.; Zhang, Z. Application of Knowledge-Driven Methods for Mineral Prospectivity Mapping of Polymetallic Sulfide Deposits in the Southwest Indian Ridge between 46° and 52°E. Minerals 2020, 10, 970. [Google Scholar] [CrossRef]
- Ge, W.; Cheng, Q.; Jing, L.; Wang, F.; Zhao, M.; Ding, H. Assessment of the Capability of Sentinel-2 Imagery for Iron-Bearing Minerals Mapping: A Case Study in the Cuprite Area, Nevada. Remote Sens. 2020, 12, 3028. [Google Scholar] [CrossRef]
- Crosta, A.P.; Moore, J.M. Enhancement of Landsat Themetic Mapper Imagery for Residual Soil Mapping in SW Minas Gerais State, Brazil: A Prospecting Case History in Greenstone Belt Terrain. In Proceedings of the 7th Thematic Conference on Remote Sensing for Exploration Geology, Calgary, AL, Canada, 1 October 1989; pp. 1173–1187. [Google Scholar]
- Crosta, A.P.; Rabelo, A. Assessing of Landsat TM for hydrothermal alteration mapping in central western Brazil. In Proceedings of the Ninth Thematic Conference Geologic Remote Sensing, Pasadena, CA, USA, 8–11 February 1993. [Google Scholar]
- Amuda, O.S.; Adebisi, S.; Jimoda, L.; Alade, A. Challenges and Possible Panacea to 349 the Municipal Solid Wastes Management in Nigeria. J. Sust. Dev. Stud. 2014, 6, 64–70. [Google Scholar]
- Poormirzaee, R.; Oskouei, M.M. Use of spectral analysis for detection of alterations in ETM data, Yazd, Iran. Appl. Geomat. 2010, 2, 147–154. [Google Scholar] [CrossRef] [Green Version]
- Testa, F.J.; Villanueva, C.; Cooke, D.R.; Zhang, L. Lithological and Hydrothermal Alteration Mapping of Epithermal, Porphyry and Tourmaline Breccia Districts in the Argentine Andes Using ASTER Imagery. Remote Sens. 2018, 10, 203. [Google Scholar] [CrossRef] [Green Version]
- Bedini, E. Mineral mapping in the Kap Simpson complex, central East Greenland, using HyMap and ASTER remote sensing data. Adv. Space Res. 2011, 47, 60–73. [Google Scholar] [CrossRef]
- Kerrich, R.; La Tour, T.E.; Willmore, L. Fluid participation in deep fault zones: Evidence from geological, geochemical, and 18O/16O relations. J. Geophys. Res. Solid Earth 1984, 89, 4331–4343. [Google Scholar] [CrossRef]
- Sibson, R.H. Fluid Flow Accompanying Faulting: Field Evidence and Models. Earthq. Predictionpp. 1981, 593–603. [Google Scholar] [CrossRef]
- Kerrich, R.; Watson, J.V.; Reading, H.G.; Watterson, J.; White, S.J.; Reading, H.G.; Watterson, J.; White, S.H. Fluid transport in lineaments. Philos. Trans. R. Soc. Lond. Ser. A Math. Phys. Sci. 1986, 317, 219–251. [Google Scholar]
- Arribas, J.A. Characteristics of high-sulfidation epithermal deposits, and their relation to magmatic fluid. In Magma, Fluid, and Ore Deposits; Jambor, J.L., Ed.; Mineral Assoc Canada Short Course: Quebec, QC, Canada, 1995; pp. 419–454. [Google Scholar]
- Sheldon, H.A.; Ord, A. Evolution of porosity, permeability and fluid pressure in dilatant faults pos” failure: Implications for fluid flow and mineralization. Geofluids 2005, 5, 272–288. [Google Scholar] [CrossRef]
- Sabins, F.F. Remote sensing for mineral exploration. Ore Geol. Rev. 1999, 14, 157–183. [Google Scholar] [CrossRef]
- Al-Arifi, N.; El-Din, G.K.; Abdelkareem, M.; Abdalla, F. Integration of remote-sensing, structural, and geochemical data for characterizing granitoid rocks in Um Naggat pluton, Central Eastern Desert, Egypt. Arab. J. Geosci. 2021, 14, 50. [Google Scholar] [CrossRef]
- Sekandari, M.; Masoumi, I.; Pour, A.B.; Muslim, A.M.; Rahmani, O.; Hashim, M.; Zoheir, B.; Pradhan, B.; Misra, A.; Aminpour, S.M. Application of Landsat-8, Sentinel-2, ASTER and WorldView-3 Spectral Imagery for Exploration of Carbonate-Hosted Pb-Zn Deposits in the Central Iranian Terrane (CIT). Remote Sens. 2020, 12, 1239. [Google Scholar] [CrossRef] [Green Version]
- Yajima, T. ASTER Data Analysis Applied to Mineral Resource Exploration and Geological Mapping; Nagoya University: Nagoya, Japan, 2014; p. 77. [Google Scholar]
- Cudahy, T.J.; Jones, M.; Thomas, M.; Laukamp, C.; Caccetta, M.; Hewson, R.D.; Rodger, A.D.; Verrall, M. Next Generation Mineral Mapping: Queensland Airborne HyMap and Satellite ASTER Surveys, 2006-2008; CSIRO Exploration and Mining: Canberra, Australia, 2008. [Google Scholar]
- Cudahy, T.J. Satellite ASTER Geoscience Product Notes South Australia. Res. Publ. Repos. 2012, 26. [Google Scholar] [CrossRef]
- Hewson, R.; Robson, D.; Mauger, A.; Cudahy, T.; Thomas, M.; Jones, S. Using the Geoscience Australia-CSIRO ASTER maps and airborne geophysics to explore Australian geoscience. J. Spat. Sci. 2015, 60, 207–231. [Google Scholar] [CrossRef]
- Mahdevar, M.R.; Ketabi, P.; Saadatkhah, N.; Rahnamarad, J.; Mohammadi, S.S. Application of ASTER SWIR data on detection of alteration zone in the Sheikhabad area, eastern Iran. Arab. J. Geosci. 2015, 8, 5909–5919. [Google Scholar] [CrossRef]
- Zuo, R.; Zhang, Z.; Zhang, D.; Carranza, E.J.M.; Wang, H. Evaluation of uncertainty in mineral prospectivity mapping due to missing evidence: A case study with skarn-type Fe deposits in Southwestern Fujian Province, China. Ore Geol. Rev. 2015, 71, 502–515. [Google Scholar] [CrossRef]
- Afzal, P.; Khakzad, A.; Moarefvand, P.; Omran, N.R.; Esfandiari, B.; Alghalandis, Y.F. Geochemical anomaly separation by multifractal modeling in Kahang (Gor Gor) porphyry system, Central Iran. J. Geochem. Explor. 2010, 104, 34–46. [Google Scholar] [CrossRef]
- Mathieu, L. Quantifying Hydrothermal Alteration: A Review of Methods. Geosciences 2018, 8, 245. [Google Scholar] [CrossRef] [Green Version]
Figure 1.
Location map (a) Regional geologic map of the ANS in Egypt showing the distribution of gold mines as solid red circles, (b) gold mines at the Eastern desert of Egypt overlain the ANS. The study area appears in black rectangle, (c) Geological map of the area outlined in black in (a) from [30]. The location of the study area is indicated by a dashed red rectangle.

Figure 2.
Flow chart shows the implemented data and methods in the present study to delineate the mineral prospective map.
Figure 2.
Flow chart shows the implemented data and methods in the present study to delineate the mineral prospective map.

Figure 3.
Sentinel-2 (a) band ratio composite 12/11, 4/8 and 3/4 in R, G, and B; (b) (6/1, 6/8A and (6 + 7)/8A [39]; (c) band ratio 3/4; (d) band ratio combination 11/8A, (12/8A) + (3/4), and band 3.
Figure 3.
Sentinel-2 (a) band ratio composite 12/11, 4/8 and 3/4 in R, G, and B; (b) (6/1, 6/8A and (6 + 7)/8A [39]; (c) band ratio 3/4; (d) band ratio combination 11/8A, (12/8A) + (3/4), and band 3.

Figure 4.
(a) Landsat-8 negated PC3; (b) reclassified negated PC3; (c) Sentinel-2 PC4; (d) reclassified PC4 of Sentinel-2.
Figure 4.
(a) Landsat-8 negated PC3; (b) reclassified negated PC3; (c) Sentinel-2 PC4; (d) reclassified PC4 of Sentinel-2.

Figure 5.
(a) Band ratio 4/6 of ASTER data; (b) extracted GIS map showing areas of sericitic+argillic hydrothermal alteration derived from band ratio 4/6; (c) OH-I, KAI, and (B4 × 3)/(B5 + B6 + B7) of ASTER data showing areas of hydrothermal alteration in white; (d) extracted GIS map showing areas of Al-OH-bearing minerals in red; (e) image of band ratios 4/5, 4/7, and 4/6 of ASTER; (f) extracted GIS map of band ratios 4/5, 4/7, and 4/6 showing hydrothermal alteration zones in red.

Figure 6.
ASTER (a) ASTER band ratios 5 + 7/6 (argillic-phyllic), (4 + 6)/5 (advanced argillic), and (5 + 8)/(6 + 7), (hydrous silica) in R, G, and B; (b) reclassification of a; (c) OHI, 4/7, and (5 + 7)/6; (d) reclassification of c; (e) PC2 of ASTER bands 4, 5, and 6; (f) reclassification of “e”.
Figure 6.
ASTER (a) ASTER band ratios 5 + 7/6 (argillic-phyllic), (4 + 6)/5 (advanced argillic), and (5 + 8)/(6 + 7), (hydrous silica) in R, G, and B; (b) reclassification of a; (c) OHI, 4/7, and (5 + 7)/6; (d) reclassification of c; (e) PC2 of ASTER bands 4, 5, and 6; (f) reclassification of “e”.

Figure 7.
(a) Combined alteration zones from Landsat OLI, Sentinel-2, and ASTER data color coded based on intensity of hydrothermal alteration; (b) enlargement of mine areas overlain by extracted spectra showing the distribution of chlorite, kaolinite/ smectite, montmorillonite, and chalcedony as circles in black, green, blue, and white, respectively; (c) field image for the Sir Bakis gold mine; (d–g) extracted absorption spectra for chlorite (d), kaolinite/ smectite (e), montmorillonite (f), and chalcedony (g), all based on spectral signature of ASTER SWIR data. The red curves represent the extracted spectra; black curves are the USGS reference spectra.

Figure 8.
(a) Lineaments derived from remote sensing data; (b) lineament density map.

Figure 9.
(a) Mineral prospective map; (b) quartz dike cuts older granites, surrounds with argillic alteration and extends ~N-S; (c) Sir Bakis mine; (d) silicified zone cuts metasediments (MS) and younger granite (YG); (e) wadi deposits surrounded by younger granites (YG), metavolcanics (MV), and metasediments (MS); (f) Aplite dike and associated argillic alterations.

Figure 10.
Field photographs: (a) quartz vein in argillic-silica alteration zone, photo looking NW, dipping ~60 E; (b) aplite and altered diorites, photo looking ~N-S; (c) aplite and alteration zone, photo looking ~NW; (d) quartz vein surrounded by altered rocks; (e) quartz with vugs filled by iron-oxides; (f) quartz vein surrounded by iron-oxides and carbonates along wall; Mn displays in dendritic shape; (g) massive quartz with reddish veins and vugs.

Figure 11.
XRD charts of the hydrothermal alteration zones show presence of (a) quartz, calcite and kaolinite, (b) kaolinite, calcite and chlorite, (c) quartz, calcite and orthoclase, and (d) quartz, kaolinite and calcite.
Figure 11.
XRD charts of the hydrothermal alteration zones show presence of (a) quartz, calcite and kaolinite, (b) kaolinite, calcite and chlorite, (c) quartz, calcite and orthoclase, and (d) quartz, kaolinite and calcite.

Figure 12.
Photomicrograph of mineralized quartz vein of Sir Bakis mine in reflected light (//N); (a) inclusions of chalcopyrite and sphalerite in pyrites; quartz vein (Sr#1), scale 0.3 mm; (b) gold associated with pyrite in mineralized quartz vein (scale 0.15 mm; Sr–30); (c): pyrite (py) may replace by geothite (goe) in quartz (Qz) vein, 0.2 mm; (d) gold inclusions in quartz (Sr6: 0.1 mm).


Table 1.
PCA analysis of selected Landsat-8 OLI bands.
| Eigenvector | Band 2 | Band 5 | Band 6 | Band 7 | Eigenvalue % |
|---|---|---|---|---|---|
| PC1 | 0.143 | 0.552 | 0.627 | 0.532 | 96.540 |
| PC2 | 0.178 | 0.737 | −0.151 | −0.635 | 2.560 |
| PC3 | 0.417 | 0.203 | −0.716 | 0.522 | 0.592 |
| PC4 | 0.880 | −0.334 | 0.268 | −0.206 | 0.308 |
Table 2.
PCA analysis of Sentinel-2 data.
| Eigenvector | Band 2 | Band 3 | Band 4 | Band 8 | Band 11 | Band 12 | Eigenvalue |
|---|---|---|---|---|---|---|---|
| PC1 | −0.434 | −0.433 | −0.430 | −0.429 | −0.356 | −0.358 | 91.698 |
| PC2 | 0.259 | 0.256 | 0.249 | 0.245 | −0.611 | −0.610 | 8.220 |
| PC3 | 0.586 | 0.324 | −0.308 | −0.620 | −0.184 | 0.195 | 0.076 |
| PC4 | 0.167 | 0.103 | −0.136 | −0.136 | 0.681 | −0.678 | 0.004 |
| PC5 | 0.470 | −0.424 | −0.569 | 0.523 | −0.030 | 0.030 | 0.001 |
| PC6 | 0.390 | −0.672 | 0.562 | −0.281 | 0.032 | −0.031 | 0.000 |
Table 3.
PCA analysis of selected bands of ASTER data.
| Eigenvector | Band 4 | Band 5 | Band 6 | Eigenvalue % |
|---|---|---|---|---|
| PC1 | 0.943 | 0.226 | 0.242 | 99.34 |
| PC2 | 0.330 | −0.568 | −0.754 | 0.59 |
| PC3 | 0.033 | −0.791 | 0.611 | 0.07 |
Table 4.
Mineral prospective map.
| Prospective Zone | Rank | Area % |
|---|---|---|
| Very low | 0 to 0.086 | 95.32 |
| Low | 0.087 to 0.24 | 1.20 |
| Moderate | 0.25 to 0.36 | 0.82 |
| Good | 0.37 to 0.46 | 1.05 |
| Very good | 0.47 to 0.55 | 1.02 |
| Excellent | 0.56 to 0.71 | 0.59 |
Publisher’s Note: MDPI stays neutral with regard to jurisdictional claims in published maps and institutional affiliations. |
© 2021 by the authors. Licensee MDPI, Basel, Switzerland. This article is an open access article distributed under the terms and conditions of the Creative Commons Attribution (CC BY) license (https://creativecommons.org/licenses/by/4.0/).
Share and Cite
MDPI and ACS Style
Abdelkareem, M.; Al-Arifi, N. Synergy of Remote Sensing Data for Exploring Hydrothermal Mineral Resources Using GIS-Based Fuzzy Logic Approach. Remote Sens. 2021, 13, 4492. https://doi.org/10.3390/rs13224492
AMA Style
Abdelkareem M, Al-Arifi N. Synergy of Remote Sensing Data for Exploring Hydrothermal Mineral Resources Using GIS-Based Fuzzy Logic Approach. Remote Sensing. 2021; 13(22):4492. https://doi.org/10.3390/rs13224492
Chicago/Turabian StyleAbdelkareem, Mohamed, and Nassir Al-Arifi. 2021. "Synergy of Remote Sensing Data for Exploring Hydrothermal Mineral Resources Using GIS-Based Fuzzy Logic Approach" Remote Sensing 13, no. 22: 4492. https://doi.org/10.3390/rs13224492
Note that from the first issue of 2016, this journal uses article numbers instead of page numbers. See further details here.