Article

Clouds’ Microphysical Properties and Their Relationship with Lightning Activity in Northeast Brazil

by
Lizandro Pereira de Abreu
1,2,*,
Weber Andrade Gonçalves
2,3,
Enrique Vieira Mattos
4,
Pedro Rodrigues Mutti
2,3,
Daniele Torres Rodrigues
2,5 and
Marcos Paulo Araújo da Silva
6
1
Instituto Federal do Piauí (IFPI), Campus Corrente, Rua 06, S/N, Nova Corrente, Corrente 64980-000, Brazil
2
Programa de Pós-Graduação em Ciências Climáticas, Universidade Federal do Rio Grande do Norte (UFRN), Av. Senador Salgado Filho 3000, Lagoa Nova, Natal 59078-970, Brazil
3
Departamento de Ciências Atmosféricas e Climáticas, Universidade Federal do Rio Grande do Norte (UFRN), Av. Senador Salgado Filho 3000, Lagoa Nova, Natal 59078-970, Brazil
4
Instituto de Recursos Naturais, Universidade Federal de Itajubá (UNIFEI), Av. BPS, 1303, Itajubá 37500-903, Brazil
5
Departamento de Estatística, Universidade Federal do Piauí (UFPI), Av. Campus Universitário Ministro Petrônio Portella, Ininga, Teresina 64049-550, Brazil
6
CommSensLab-UPC, Department of Signal Theory and Communications (TSC), Universitat Politècnica de Catalunya (UPC), Campus Nord, E-08034 Barcelona, Spain
*
Author to whom correspondence should be addressed.
Remote Sens. 2021, 13(21), 4491; https://doi.org/10.3390/rs13214491
Submission received: 31 August 2021 / Revised: 9 October 2021 / Accepted: 10 October 2021 / Published: 8 November 2021
(This article belongs to the Special Issue Satellite Microwave Remote Sensing for Severe Storms Detection)

Abstract

:
The Northeast region of Brazil (NEB) has a high rate of deaths from lightning strikes (18% of the country’s total). The region has states, such as Piauí, with high mortality rates (1.8 deaths per million), much higher than the national rate (0.8) and the NEB rate (0.5). In this sense, the present work analyzes the microphysical characteristics of clouds with and without the occurrence of total lightning. For this purpose, data from the Lightning Imaging Sensor (LIS), TRMM Microwave Imager (TMI) and Precipitation Radar (PR), aboard the Tropical Rainfall Measuring Mission (TRMM) satellite from 1998 to 2013 were used. The TRMM data were analyzed to establish a relationship between the occurrence of lightning and the clouds’ microphysical characteristics, comparing them as a function of lightning occurrence classes, spatial location and atmospheric profiles. A higher lightning occurrence is associated with higher values of ice water path (>38.9 kg m−2), rain water path (>2 kg m−2), convective precipitation (>5 mm h−1) and surface precipitation (>7 mm h−1), in addition to slightly higher freezing level height values. Reflectivity observations (>36 dBZ) demonstrated typical convective profile curves, with higher values associated with classes with higher lightning densities (class with more than 6.8 flash km−2 year−1).

Graphical Abstract

1. Introduction

Northeast Brazil (NEB) is a predominantly semiarid region, where society and agricultural productivity can be significantly impacted by climate variability [1,2,3]. Thus, meteorological systems that cause intense precipitation are extremely important to fill reservoirs that provide water during the dry period [4,5]. However, some of these systems, especially those composed of clouds with extensive vertical development, high amounts of ice and strong updrafts, have the potential to produce electrical charges inside the clouds and, consequently, lightning [6,7,8].
The major problems that lightning can cause to society (blackouts, fires, accidents related to transport such as planes and ships, damage to telecommunications systems, deaths of humans and animals) combined with the destructive characteristics of lightning, make it the target of numerous studies developed by the global academic community [7,9,10,11,12,13,14]. Although scientific knowledge about lightning has evolved significantly in recent decades, the ability to represent its spatial and temporal variability, in addition to its relationship with other environmental and microphysical variables, remains a key challenge.
Lightning provides a direct and accurate indication of convective activity in clouds, which makes its integration with remote sensing cloud observation systems very useful for the diagnosis and prognosis of storm strength [15]. Several papers were published deepening knowledge about the relationship between lightning and the characteristics of precipitation systems, in different locations around the globe, such as China [16], Bangladesh [17], Kolkata-India [18], France [19] and Brazil [7,20,21]. Some studies have indicated that although the relationship between precipitation regime and lightning is highly dependent, a more robust relationship can be found between lightning and microphysics [22].
As demonstrated through previous studies [20,22,23,24,25,26,27], the electrical charges generated inside clouds, and consequent separation of charges and lightning generation, are intrinsically related to clouds’ thermodynamic, dynamic and microphysical processes.
The study of the microphysics of a cloud is based on the analysis of the hydrometeors that compose it, how they are classified and how they change over time, because these particles—liquid or solid (ice)—vary greatly in size and shape, so the growth of the cloud particles, as well as any transformation of their phase, is determined considering the physics of condensation, collision–coalescence and nucleation. These various physical processes operate in a peculiarly dynamic and complex environment [28,29]. Knowledge of the microphysical structure of the convection-forming cloud is essential to predict a severe meteorological event. In this sense, the study of lightning activity provides a way to evaluate convection [18].
Searching for polarimetric and multi-Doppler radar-based lightning rate parameterizations inferred from microphysical (graupel volume, graupel mass, 35 dBZ volume) and kinematic (upstream volume, maximum velocity of updraft) parameters, Carey et al. [30] found that for low flash rates, relations based on kinematic parameters have larger errors compared to those based on microphysical ones, and the flash rate parameterization based on graupel volume has the best overall performance.
The mapping of lightning and cloud properties through orbital data in the 1990s [31,32,33] made it possible to derive more empirical relationships. These relationships are based on several parameters, including the convective mass flow and convective precipitation rate [34], Ice Water Path (IWP) [35], updraft intensity [36], updraft volume [37] and precipitation mass [38].
Researchers have documented that large ice particles develop in cumulonimbus clouds as a result of robust mixed-phase processes modulated by convective updrafts. Thus vertical flows of ice particles and the proportionality between ice charge generation rates and lightning rates, indicate a linear to the slightly nonlinear relationship between lightning rate and IWP [25].
Other research has indicated that the relationship between IWP and lightning density is relatively invariant between the terrestrial, oceanic and coastal regimes [39], having a high correlation with lightning density (R > 0.97). This prompted authors to include lightning data in algorithms for the recovery of frozen water content [35]. This was later corroborated when it was observed that categories with higher lightning rates tend to have higher reflectivity (i.e., larger ice particles), 85.5 GHz colder brightness temperature (higher IWP), and higher surface reflectivity (larger Surface Precipitation-SP) [39].
Investigating adapted lightning parameterizations to predict flash rates for storms in Colorado USA, Basarab et al. [40] updated several flash rate parameterization schemes based on the relationship between total lightning flash rate and bulk storm parameters. The authors developed a successful scheme that predicts flash rate based on radar-derived mixed-phase 35 dBZ echo volume, which indicates the amount of ice necessary to sustain frequent lightning discharges. Results agreed with recent findings by Hayashi et al. [41] for 10 isolated thunderstorm cases over the Kanto Plain, Japan.
Cloud ice dynamics also are associated with the amount of lightning, a fact documented by Deierling et al. [38] in studying ice flow in 11 storms. The authors found a high correlation between precipitable and non-precipitable ice masses (R = 0.9 and 0.8, respectively). Finney et al. [42] proposed a new parameterization of chemical transport models using lightning data.
For South America, Morales Rodriguez [43] indicated that the partition of the cloud, which is composed of ice and super-cooled water droplets, in the mixed region controls the storm’s efficiency in producing lightning. Mattos and Machado [44] performed a comparison between high-frequency microwave channels and lightning data. The results indicated the existence of a strong relationship between the IWP and particle size with the lightning occurrence, with Pearson correlation coefficients of 0.86 and 0.96, respectively. Determination of the difference in polarization at 85 GHz showed potential as a technique for identifying regions of more intense convection associated with ice particles, preferentially oriented vertically.
Establishing the relation between lightning occurrence and the effective diameter of ice particles, Mattos and Machado [44] concluded that the occurrences of cloud-to-ground lightning are observed in association with the categories that contained the largest sizes of ice particles, being more significant for sizes larger than 0.92 mm, gradually increasing up to the size of 1.85 mm. This factor can be associated with the observed dependence of the amount of charge transferred by a collision between the ice particles as a function of the size and speed of impact between them [8,43,45,46].
When verifying the effect of aerosols on electrical activity over China, Zhao et al. [47] concluded that an increase in aerosol loading delayed the formation of warm cloud rain and increased convection intensity due to the cloud droplet size, where many smaller droplets were transported to the freezing region by currents within the cloud, forming more ice particles and more hail. The particles participated in the electrification process, resulting in storms with intense electrical activity.
Chatterjee and Das [18] also described significant differences for several cloud microphysical parameters, in situations with and without lightning in the region of Kolkata, India. On that occasion, cloud top temperature, effective droplet size, radar reflectivity and rain attenuation were evaluated. For the Gansu region in China, it is possible to use CG lightning quantification to estimate the Convective Precipitation-CP, where the average precipitation intensity is equal to 1.69 times the natural logarithm of the amount of CG lightning, minus 0.27, where obtaining r = 0.86 [16]. For South America, more specifically for the La Plata Basin region, Rasmussen and Houze [48] concluded, from a case study, that a storm had 663 lightning strikes and a large percentage of convective rain (94%).
Studies have shown that clouds evolve into storm clouds in terms of microphysical characteristics that produce the first intra-cloud (IC) and CG lightning. For example, Mattos et al. [24] reached this conclusion from the observation of 46 compact (<20 km) and isolated storms during the spring/summer of 2011–2012 in the Southeast region of Brazil, where fundamental parameters in the cloud vertical structure produced the initial electrification and lightning activity. The results also indicated that clouds with heavy lightning have a predominance of ice particles vertically oriented by a strong electric field.
However, the results found in previous studies were restricted to the Southeast region of Brazil, so in a pioneering study of NEB, Abreu et al. [7] reported maximum values of 44.57 flash km−2 year−1, with the states of Piauí, Maranhão and Bahia having the points with the highest lightning densities, occurring mainly during the summer and autumn in the southern hemisphere.
In this context, this study is unprecedented in the sense of investigating the possible relationship between lightning and microphysical properties in NEB, which has the largest number of states [49] and accounts for 18% of annual deaths associated with this phenomenon in Brazil [10]. Thus, the main objective of this study was to analyze the behavior of the microphysical properties of clouds in situations of occurrence and non-occurrence of lightning in the Northeast region of Brazil, as well as the spatial distribution of these characteristics in the region.

2. Materials and Methods

2.1. Study Region

The Northeast region of Brazil (NEB), represented in Figure 1, is located approximately between the geographic coordinates 01° S and 18° S; 34° W and 49° W. NEB comprises nine Brazilian states: Maranhão (MA), Piauí (PI), Ceará (CE), Rio Grande do Norte (RN), Paraíba (PB), Pernambuco (PE), Sergipe (SE), Alagoas (AL) and Bahia (BA). The region has a total area of 1,554,291 km2 and population of more than 53 million inhabitants [49].
NEB is a region with high climatic variability due to a set of physiographic factors and atmospheric systems that act at different scales. Despite its location, it does not present a typical rainfall distribution in equatorial areas [50,51,52].
A division was described by Rodrigues et al. [53], who after performing cluster analysis with daily precipitation data proposed the subdivision into five regions: (a) north of NEB; (b) most of the Brazilian semiarid region; (c) east of NEB; (d) southwest of NEB and (e) southeast of NEB. It is necessary to clarify that, unlike previous articles, Rodrigues et al. (2020) subdivided NEB according to daily rainfall accumulation instead of according to monthly or annual accumulation, as other authors have previously carried out.
Due to its large territorial extension, NEB is influenced by several atmospheric systems related to the production of lightning, the main systems being the Intertropical Convergence Zone (ITCZ) [54,55]; Upper tropospheric cyclonic vortices (UTCV) [56,57]; Mesoscale Convective Systems (MCS) [58,59]; Frontal Zones (FZ) [60,61] and Easterly Wave Disturbances (EWD) [62,63]. These systems can occur in different seasons of the year, in addition to influencing different sub-regions in NEB.

2.2. Data

2.2.1. LIS Data

The LIS is an instrument used to detect the distribution and spatial and temporal variability of total lightning (intra-cloud and cloud-to-ground), by measuring the amount, rate and radiant energy of lightning during the day and night. Two LIS sensors were built in the 1990s. The first was installed on the TRMM satellite, while the spare was installed on the International Space Station (ISS). The first operated successfully for over 17 years [64].
The LIS sensor is a lightning detector that groups various events in space and time. The LIS has a charge-coupled device (CCD) that detects lightning emissions in the 777.4 nm channel (neutral oxygen line) that exceed a threshold at the cloud top at a rate of 2 milliseconds. Pixels that exceed the radiance threshold are called events; contiguous events in a single frame are called groups; in turn, groups coherent in time and space are aggregated and called flashes. The temporal and spatial thresholds are 330 ms and 5.5 km, respectively [7,31,65,66,67,68]. As described by Christian et al. [67] the LIS has a spatial resolution of approximately 5 km, with an array size of 128 × 128 pixels and detection efficiency of 90% of all events.
The LIS data used in this study were obtained through NASA’s digital platform, consisting of data from each orbit from January 1998 to December 2013. Data after this period are not included in the analyses, since the TRMM started its trajectory decommissioning in 2014, with multiple instrument interruptions, possibly introducing errors [9]. The complete dataset is available for download from the NASA Earth Observing System (EOSDIS) Global Hydrology Resource Center (GHRC): https://lightning.nsstc.nasa.gov/lisib/lissearch.html (accessed on 7 November 2018).

2.2.2. 2A-Clim and 2A25 TRMM Products

Data from products 2A-Clim (from the TRMM Microwave Imager–TMI) and 2A25 (from the Precipitation Radar–PR) were used, both associated with the TRMM satellite, which refers to the surface precipitation and vertical profiles of hydrometeors provided by the STORM platform, https://storm.pps.eosdis.nasa.gov/storm/ (accessed on 7 November 2018). By applying the Goddard Profiling Algorithm 2014 (GPROF2014) to the TMI brightness temperature data, it is possible to obtain information about the vertical structure of clouds, and the amount of ice and/or water particles [69]. Table 1 describes the parameters of this product used in this study. To ensure PR, TMI and LIS data reliability, only data in the period from January 1998 to December 2013 were used.
The TMI sensor is a passive microwave multichannel radiometer that operated at five frequencies, four with double polarization (10.65; 19.35; 37 and 85.5 GHz) and one with single-polarization (21.3 GHz). The antenna beam focused on the Earth’s surface with a tilt angle of 52.8°, which allowed for a conical-shaped sweep and allowed coverage of 720 km (878 km after boost). This antenna rotated around an axis in a nadir position at a speed of 31.6 rpm, but only the front 130° of the circle described by the antenna was used to collect the data [70]. In the present work, four parameters originating from this sensor were evaluated: Ice Water Path (IWP), Rain Water Path (RWP), Convective Precipitation (CP) and Surface Precipitation (SP).
PR provides the data for product 2A25. This sensor was the first rain radar to be placed in orbit, and its main objectives were: (i) to elucidate the three-dimensional structure of precipitation, particularly the vertical distribution; (ii) to obtain quantitative measurements of precipitation over land and ocean; and (iii) to improve the overall accuracy of the TRMM precipitation measurement by using combined data from active (PR) and passive (TMI and VIRS) sensors [33].
This instrument is an active 13.8 GHz radar, recording energy reflected from atmospheric and surface targets, having an electronic sweep endowed with a bandwidth of 215 km pre-boost and 247 km post-boost [71]. The sensor produces an estimate of the vertical precipitation rate profile for each radar beam, and this estimate is given in each of its resolution cells, also using the radar database installed on the Earth’s surface for comparison purposes [72]. From this sensor, two parameters were used: Freezing Level Height (FH) and Reflectivity (dBZ), both extracted from the 2A25 product.

2.3. Methodological Procedures

2.3.1. Cloud Microphysical Characteristics

To assess the relationship between the occurrence of lightning and the microphysical characteristics of clouds, we used a method similar to that of Chatterjee and Das [18]. The TRMM product database (2A-CLIM and 2A25) was submitted to a spatiotemporal filter, where the lightning identification data (LIS) were related to the microphysical data. The orbits in which no lightning was recorded were selected and a cutout was applied to the study area. Therefore, the pixels on the NEB in which there was no lightning record formed the database called “No Lightning Occurrence”.
Then, the orbits in which lightning was identified (according to the LIS) were submitted to a new location filter (latitude and longitude) being captured only data of pixels that coincided with the lightning occurrence (forming the database called “Lightning Occurrence”). For this purpose, pixel data were captured within a distance of 0.04° (approximately 4 km) from the centroid of lightning location. This value was chosen because it is similar to the resolution of the 2A-CLIM and 2A25 products.
After filtering, two separate databases were obtained, one with the microphysics information of the clouds when lightning occurred and the other when there was no lightning. The first database had a total of 4945 orbits, while the second one had 23,691 orbits. The comparison method used is similar to that adopted by Mattos and Machado [44] and Wang et al. [39]. This information was then represented in histograms and evaluated according to the Student t-test, to obtain knowledge about the differences between the means of the distributions, a method also used by Rodrigues et al. [53].
As specified by Albrecht et al. [9] in their supplementary document, the vast majority of the NEB is located under the same view time of TRMM, so there is no region-dependent bias in the number of observations.

2.3.2. Quantile Technique and Analysis of Variance (ANOVA)

The quantile technique was applied to the total distribution of lightning density data, similar to that applied by Abreu et al. [7]. These data were previously standardized as a function of the LIS view time, as described by Albrecht et al. [9]. For this, the sample was divided into tertiles (33.33% percentiles) and thus the division into four sub-regions was obtained, with one corresponding to the region with a density equal to zero and the other three corresponding to the tertiles of the frequency distribution.
Quantiles are points taken at regular intervals from a data series, dividing them into subsets of equal size. The main quantiles are quartiles (series divided into four equal parts), percentiles (series divided into 100 equal parts) and deciles (series divided into 10 equal parts) [51,73,74].
Oliveira et al. [51] corroborated the finding of Wilks [74], standing that the quantile technique has a big advantage over the techniques traditionally used since they use normalization by mean and standard deviation, which are largely dependent on the hypothesis that the distribution is normal, which does not always happen in atmospheric parameter series.
To verify whether there was a statistical difference in terms of lightning density between the microphysical parameters of each NEB sub-region, an analysis of variance (ANOVA) was used. This technique tests, through the sum of squares of differences, the differences between two pairs of means. The idea is to derive the total variability of information into components, according to the statistical model used by Chambers et al. [75], represented by Equation (1).
y i j = μ + t i + ε i j i = 1 , 2 , , a   j = 1 , 2 , , r
where μ : effect common to all treatments; t i : effect of each sub-region; ε i j :   random error; a: number of sub-regions; and r: number of observations within each sub-region.
The ANOVA result determines whether the distribution of the studied parameter of at least one sub-region differs from the others, but does not indicate between which sub-regions the difference is significant. Thus, when the hypothesis of equality of means of ANOVA was rejected, the Tukey multiple comparisons test was performed [76,77]. The test statistic is given by Equation (2).
T α = q α a , N a M e a n   S q u a r e   E r r o r r
where q α a , N a is the tabulated value, as a function of the number of sub-regions a and the number of the residual degrees of freedom N a , at the level of significance . The M e a n   S q u a r e   E r r o r (MSE) is defined by Equation (3).
M S E = r i = 1 a y ¯ i . y ¯ .. 2 = 1 r i = 1 a y i . 2 y .. 2 N / a 1
where y ¯ i . is the average of each microphysical parameter in each sub-region; y ¯ ..   is the average of each microphysical parameter; y i . is the sum of each microphysical parameter in each sub-region; and y .. is the sum of each microphysical parameter and N is the total number of observations.
For the ANOVA and Tukey test results to be valid, it is necessary for the residuals of the ANOVA model to have a normal distribution, constant variance and independence. These assumptions were confirmed, respectively, through the Shapiro–Wilk [78], Levene [79] and Ljung–Box [80] tests and the result was plotted for pairwise comparison of the sub-regions. A method similar to that used by Rodrigues [81] was used to compare clusters generated for precipitation extremes in NEB.
To improve the analysis, the error bar of data referring to tertiles was also produced. Error bars are graphical representations of data variability, used to indicate uncertainty in a reported measurement. Error bars can be represented by standard deviation, standard error or confidence interval. In this study, error bars were represented by the standard error. The standard error is a measure of the variation of a sample mean relative to the population mean. To obtain an estimate of the standard error, simply divide the standard deviation by the square root of the sample size [82].

2.3.3. Spatial Distribution of Clouds’ Microphysical Properties

In order to identify spatial and seasonal patterns, the spatialization of the clouds’ microphysical characteristics was performed. For this purpose, the database called “Lightning Occurrence” was used, and the data were divided by season: summer (DJF), autumn (MAM), winter (JJA) and spring (SON) for the Southern Hemisphere.
After dividing into seasons, a 0.04° × 0.04° grid (approximately 4 km) was constructed and then averaged for all records within each pixel. These values, in turn, were graphically represented by maps constructed with the aid of geographic information systems.

2.3.4. Vertical Reflectivity Profiles (Z)

In this step, the relationship between the vertical structure of clouds and lightning frequency was evaluated. The vertical structure was analyzed using the values of the parameter correct Z factor of the 2A25 product. The data for this product consist of vertical reflectivity profiles with 80 levels (one every 250 m), with Z values ranging between 0 and 80 dBZ. Each LIS lightning record was combined with the 2A25 reflectivity profiles. For this, the vertical Z profiles that occurred at a distance of 4 km from the lightning (native resolution of the product) were analyzed.
The average profile was calculated considering the maximum reflectivity (Zmax) for each of the 80 levels, a method also used by Palharini and Vila [83]. The data were then divided according to the tertiles generated previously and comparative profiles were created between these sub-regions. Similar methods were used by Mattos et al. [84] when comparing different classes of lightning density; in addition to other researchers aimed at understanding the composition of clouds [39,43,85,86].
Two limits were used to determine the phases of thunderclouds. The first limit separates the warm and mixed phases and is equivalent to the 0 °C isotherm. It was determined from the values of the 2a25 TRMM product, which determines the freezing level height, by adopting the average value of approximately 4.8 km. The second limit, which separates the mixed and glacial phases, was set to −40 °C [24,41,84]. The corresponding altitude was determined from the Tropical Standard Atmosphere developed by the International Civil Aviation Organization–ICAO [87,88,89], by adopting the average value of approximately 8.8 km.

3. Results

3.1. Relationship between Clouds’ Microphysical Properties and Lightning Occurrence

The analysis of microphysical parameters considered the Ice Water Path (IWP), Convective Precipitation (CP), Freezing Level Height (FH), Rain Water Path (RWP) and Surface Precipitation (SP) for the categories with and without lightning. Figure 2a shows that the IWP has a sharp decrease for the curve without lightning, showing values close to zero. For clouds that produced lightning, the behavior also shows a reduction of values, but it presents a less accentuated reduction and higher IWP values (>1 kg m−2) compared to the previous distribution. For data distribution without lightning, the 75% percentile has values lower than 0.1 kg m−2, while for lightning-generating clouds this percentile corresponds to values lower than 1.5 kg m−2. The means of the two distributions were compared as a function of the Student t-test results, and at 99% confidence, it was possible to state that the means of the two distributions are different.
The FH distribution shows that the two curves are close to the normal distribution, with the graphical representation of data associated with lightning being more leptokurtic (less flattened, data less dispersed) in comparison with the distribution of data when no lightning occurred (Figure 2b). It should also be noted that the FH average for lightning strikes is slightly higher and significantly different from the average for the other database (no lightning), according to the Student t-test at 99% confidence.
The RWP distributions showed decreasing values with the increase in water mass per m2, but the distribution of data without lightning showed a more accentuated drop (Figure 2c). After being submitted to the Student t-test at 99% confidence, the means of the distributions showed a significant difference. The amount of total liquid water in the atmospheric column can be subdivided into two fractions. The first corresponds to the liquid water associated with the cloud and the second fraction corresponds to the precipitating liquid water, thus associated with rain (here shown as RWP), which can vary independently. In this sense, the general behavior of the frequency distribution for RWP is very similar to the representation of surface precipitation rate measurements [90].
The SP and CP distributions are similar. Both distributions show a rapid reduction in frequencies as precipitation rates increase, and for data without lightning, they show more marked reductions (Figure 2d,e). For SP, when using the 75% percentile as a reference, the distribution with lightning registers 7.25 mm h−1, while for the one without lightning the value is only 0.25 mm h−1, 29 times smaller. For CP, using the same reference (P75%), a value 21 times lower was recorded for the distribution without lightning (0.25 versus 5.25 mm h−1). For both variables, according to the Student t-test, it can be stated that the means of the distributions are different, with 99% confidence.

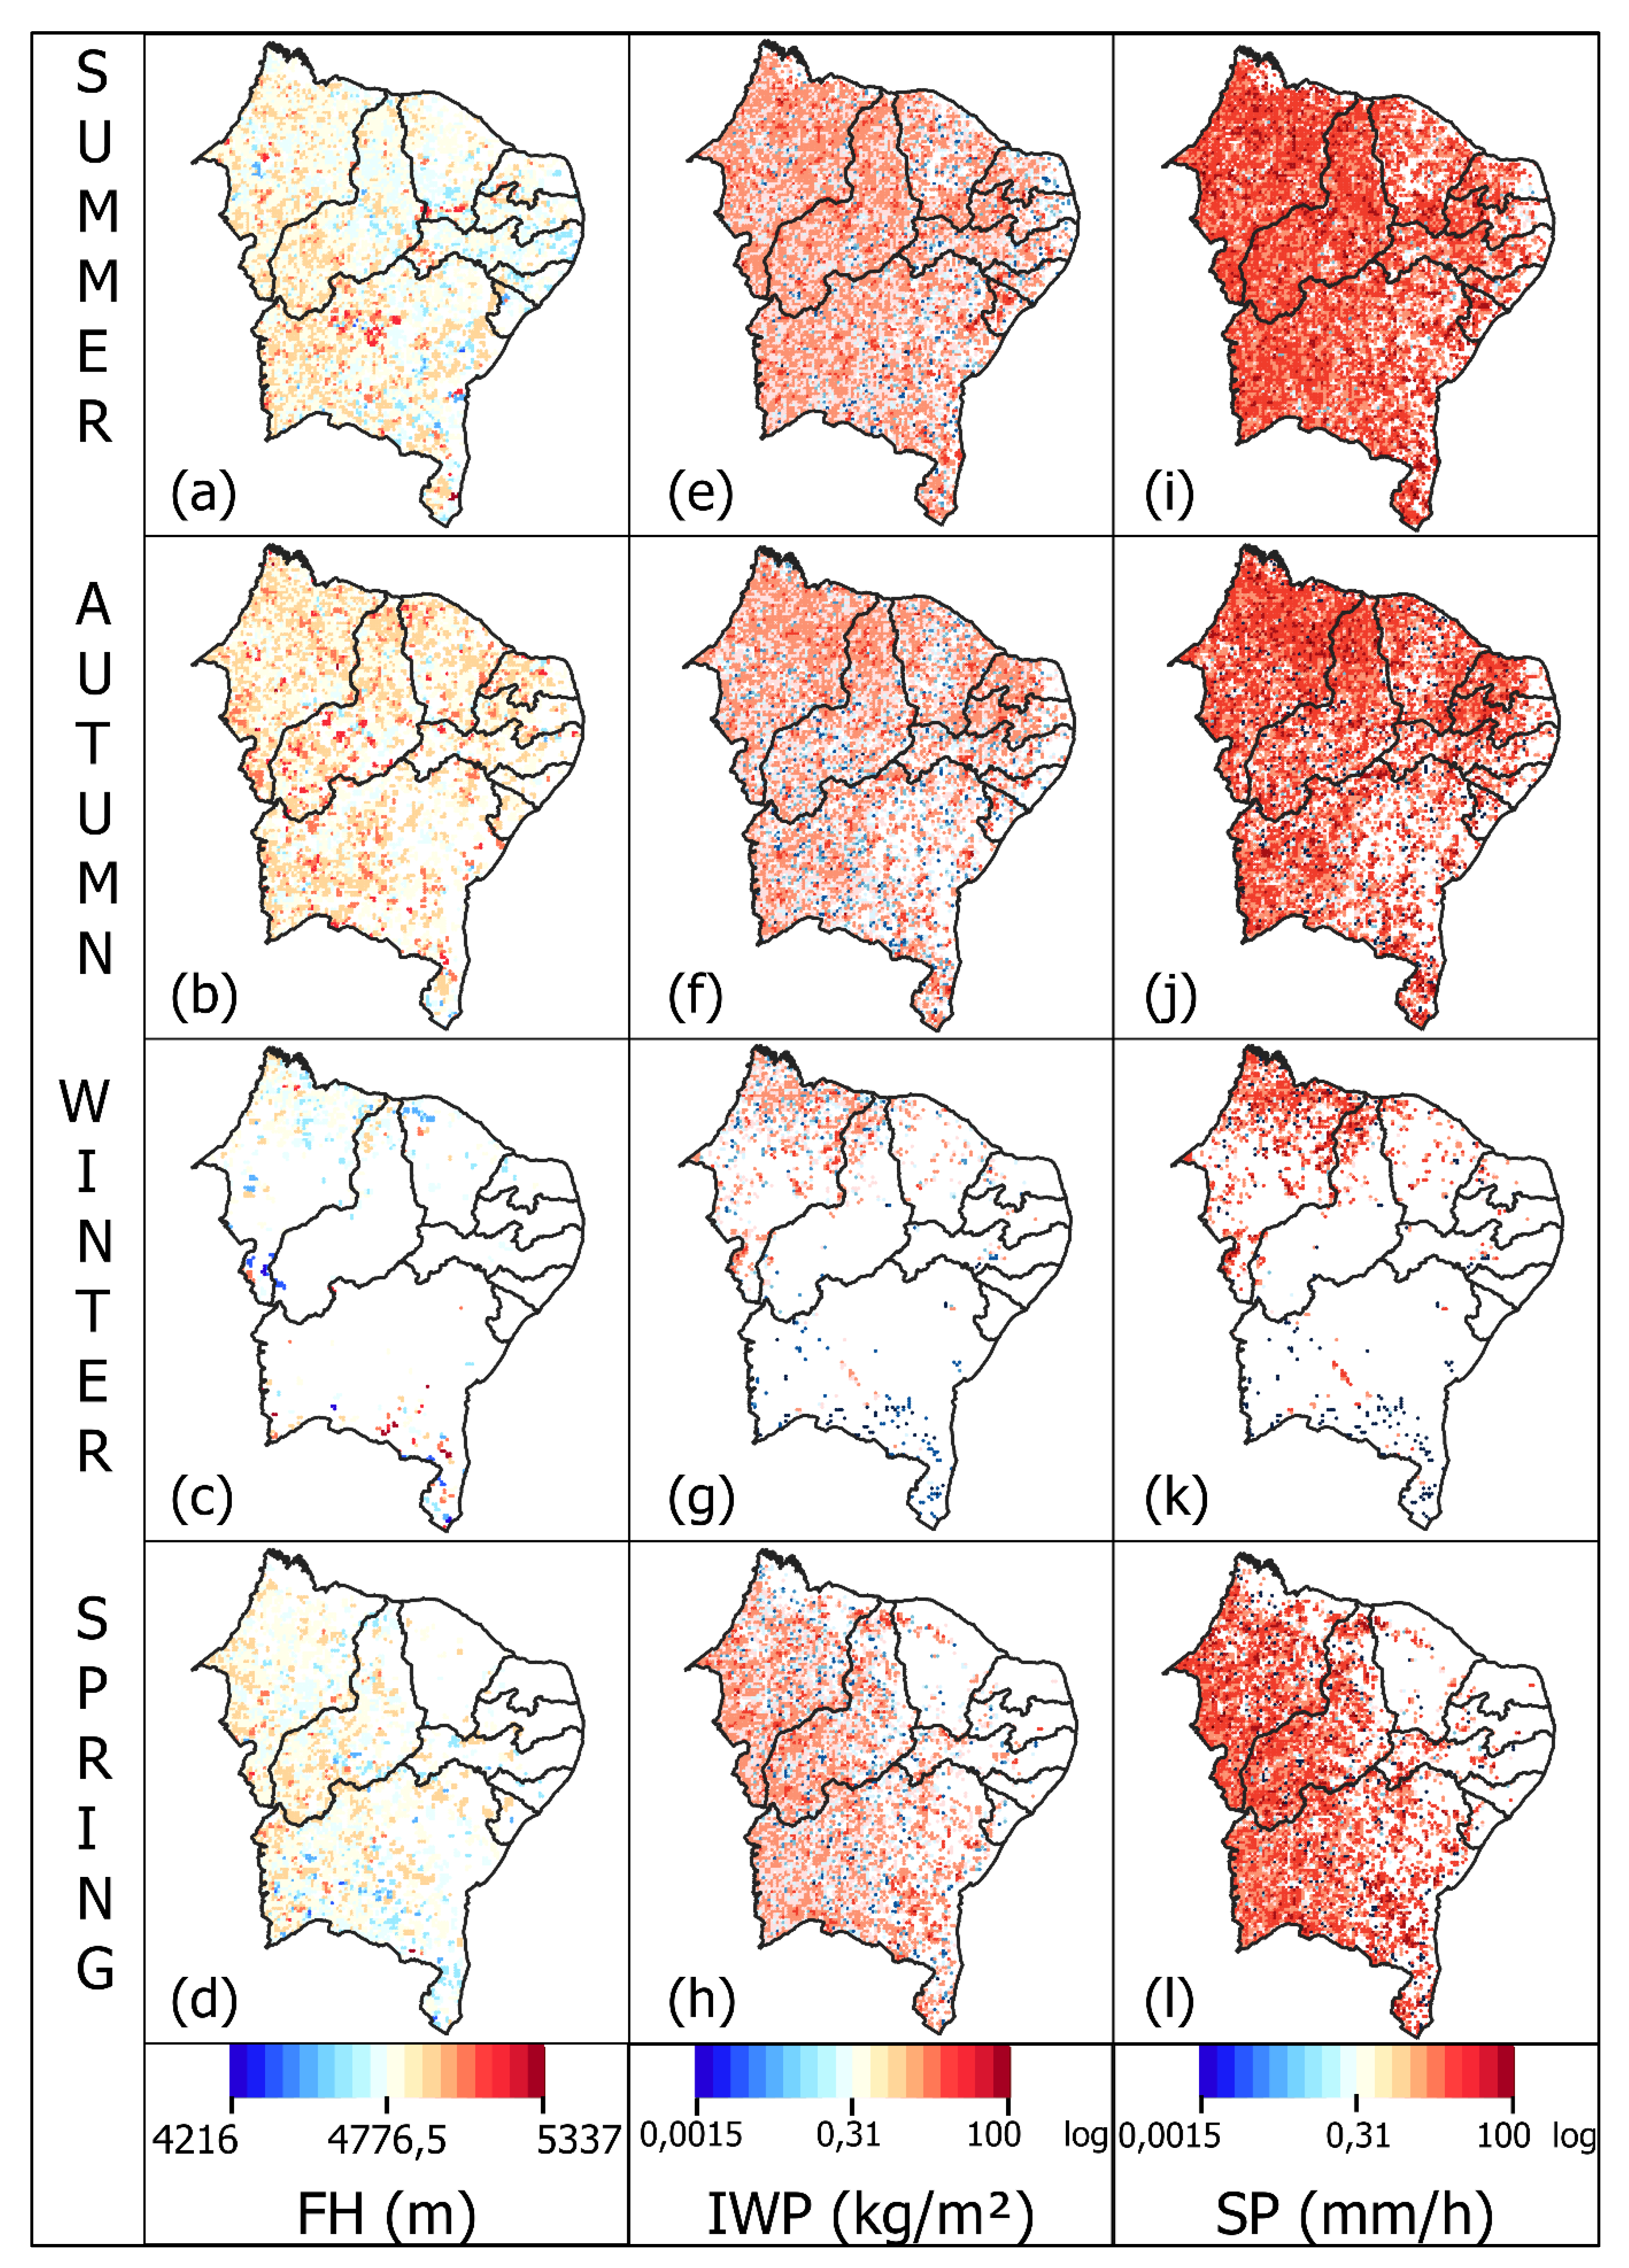
3.2. Spatial and Seasonal Distribution of Microphysical Characteristics

With the spatialization of the cloud microphysical parameters, it was possible to assess the variation that exists throughout the different territories of NEB, as well as the seasonal variations. Since they present the most distinct behavior among the other characteristics, the discussion is centered on the FH, IWP and SP parameters.
For the spatial distribution of FH (Figure 3a–d), the season that obtained the highest values was autumn (4896 m on average), followed by summer (4835 m), spring (4821 m) and winter (4776 m). The two seasons with the highest (lowest) values coincide with those with the greatest (least) lightning occurrences in the region, as established by Abreu et al. [7].
Regarding spatial variation, it was possible to verify the influence of large-scale systems, associated with the highest FH occurrence, as can be seen in the region and occurrence periods of the ITCZ and South Atlantic Convergence Zone (SACZ), systems previously indicated as convection boosters and consequently of electrical activity [7,9,55,91,92,93].
For the summer, it is also possible to highlight the high-level diffluence that occurs in the region, to the detriment of UTCV occurrence, in the NEB coast and adjacent oceanic region, and the Upper Bolivia system, which forms near the country of the same name [55,56,57,94]. Regions with high FH also coincide with those highlighted by Palharini and Vila [83] as places with the highest occurrence of convection, both shallow and deep.
Regarding the IWP variable (Figure 3e–h), the highest values (>0.3 kg m−2) represent the vast majority of the distribution, confirming the close relationship between the lightning rate and the amount of ice, as previously described. Some regions, such as the central-north and south of Piauí and Maranhão, are noteworthy for having a maximum amount of ice (values close to 40 kg m−2) especially during autumn and spring since they coincide with the lightning hotspots of NEB pointed out by Abreu et al. [7]. The lowest values occur mainly during the austral winter, a season characterized by rare and even absent precipitation in most of NEB.
For the SP parameter (Figure 3i–l), it was possible to observe lightning occurrences associated with high precipitation rates in all seasons of the year, especially during spring (up to 59 mm h−1) and summer (up to 53 mm h−1). The large-scale atmospheric systems mentioned above, which operate at this time of year, also have a marked interaction for this parameter, as can be confirmed from their regions of influence

3.3. Microphysical Properties as a Function of Lightning Tertiles

After the application of the tertiles technique, the study area was divided into four sub-regions as a function of lightning density: (T1) less than 0.1 flash.km−2 year−1; (T2) between 0.1 and 2.8 flash.km−2 year−1; (T3) between 2.8 and 6.8 flash.km−2 year−1; and (T4) above 6.8 flash.km−2 year−1 (Figure 4).
The results showed that the lowest lightning density values (T1) are concentrated in the eastern coastal strip of NEB, extending from the state of Rio Grande do Norte to the Bahia coast.
The results obtained from the microphysical characteristics existing in each of the regions were summarized through the construction of graphs that represent the mean and error bar of the distribution (Figure 5). The ANOVA results were statistically significant (p-values < 0.05) for all five parameters evaluated in this study, indicating the existence of a difference between the means obtained in at least two of the sub-regions presented. The p-values obtained from the Tukey test, performed after ANOVA, are shown in Figure 6.
For the FH parameter, which describes the height of the 0 °C isotherm, the values ranged between 4200 and 5415, and the average values of the sub-regions increased as the lightning density increased. Therefore, T4 was the largest and T1 the smallest (Figure 5a). These results are in accordance with what was proposed by Petersen and Rutledge [25] and Zipser and Lutz [86], by associating strong ascending currents close to the 0 °C isotherm, with the consequent change in the mixed-phase of clouds and greater generation of electrical charges.
The Tukey test for the variable showed there is no significant difference between T1 and T2, but the other sub-regions are distinct from each other (Figure 6a). These results are consistent with those of [95] for the entire tropical range, who reported slight variations for FH in NEB, mainly varying as a function of latitude.
The IWP values (Figure 5b) were highest in the T4 sub-region, followed by the T3 sub-region. This fact corroborates the importance of this variable for charge generation in storm clouds and the consequent lightning occurrence, since the highest (smallest) densities occurred in the sub-region with the highest (smallest) amount of ice, reinforcing the close relationship between ice content and cloud electrification [14,20,27,35,37,84,96]. The Tukey multiple comparison test (Figure 6b), indicated that the IWC of the T4 sub-region is statistically different from the others (p-value < 0.1) and no significant difference between T1 and T2, and between T1 and T3.
The remaining three parameters (SP, CP and RWP) showed similar behavior with the average surface precipitation rates and convective precipitation, in addition to integrated rainwater content for each sub-region, increasing as the lightning density increases (Figure 5c–e). Thus, sub-region T1 (T4) obtained the smallest (largest) quantity. As for the Tukey test, it indicated no statistically significant differences between the means of T1 and T2 for any of the variables. However, the other regions are distinct from each other for the three parameters described (Figure 6c–e). Good relationships between lightning and CP were also reported for the European continent [97], for the global tropical region [98] and for China [16].

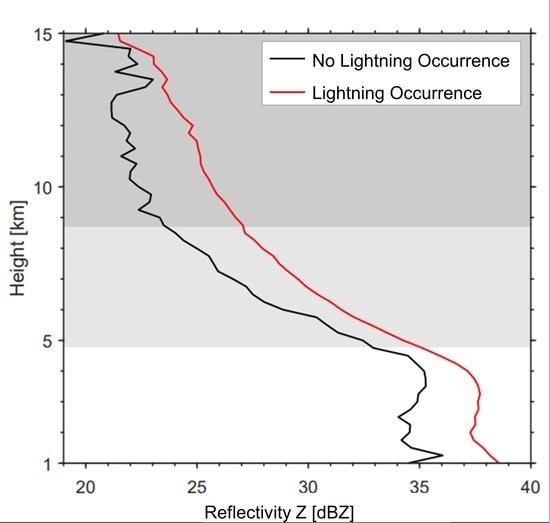
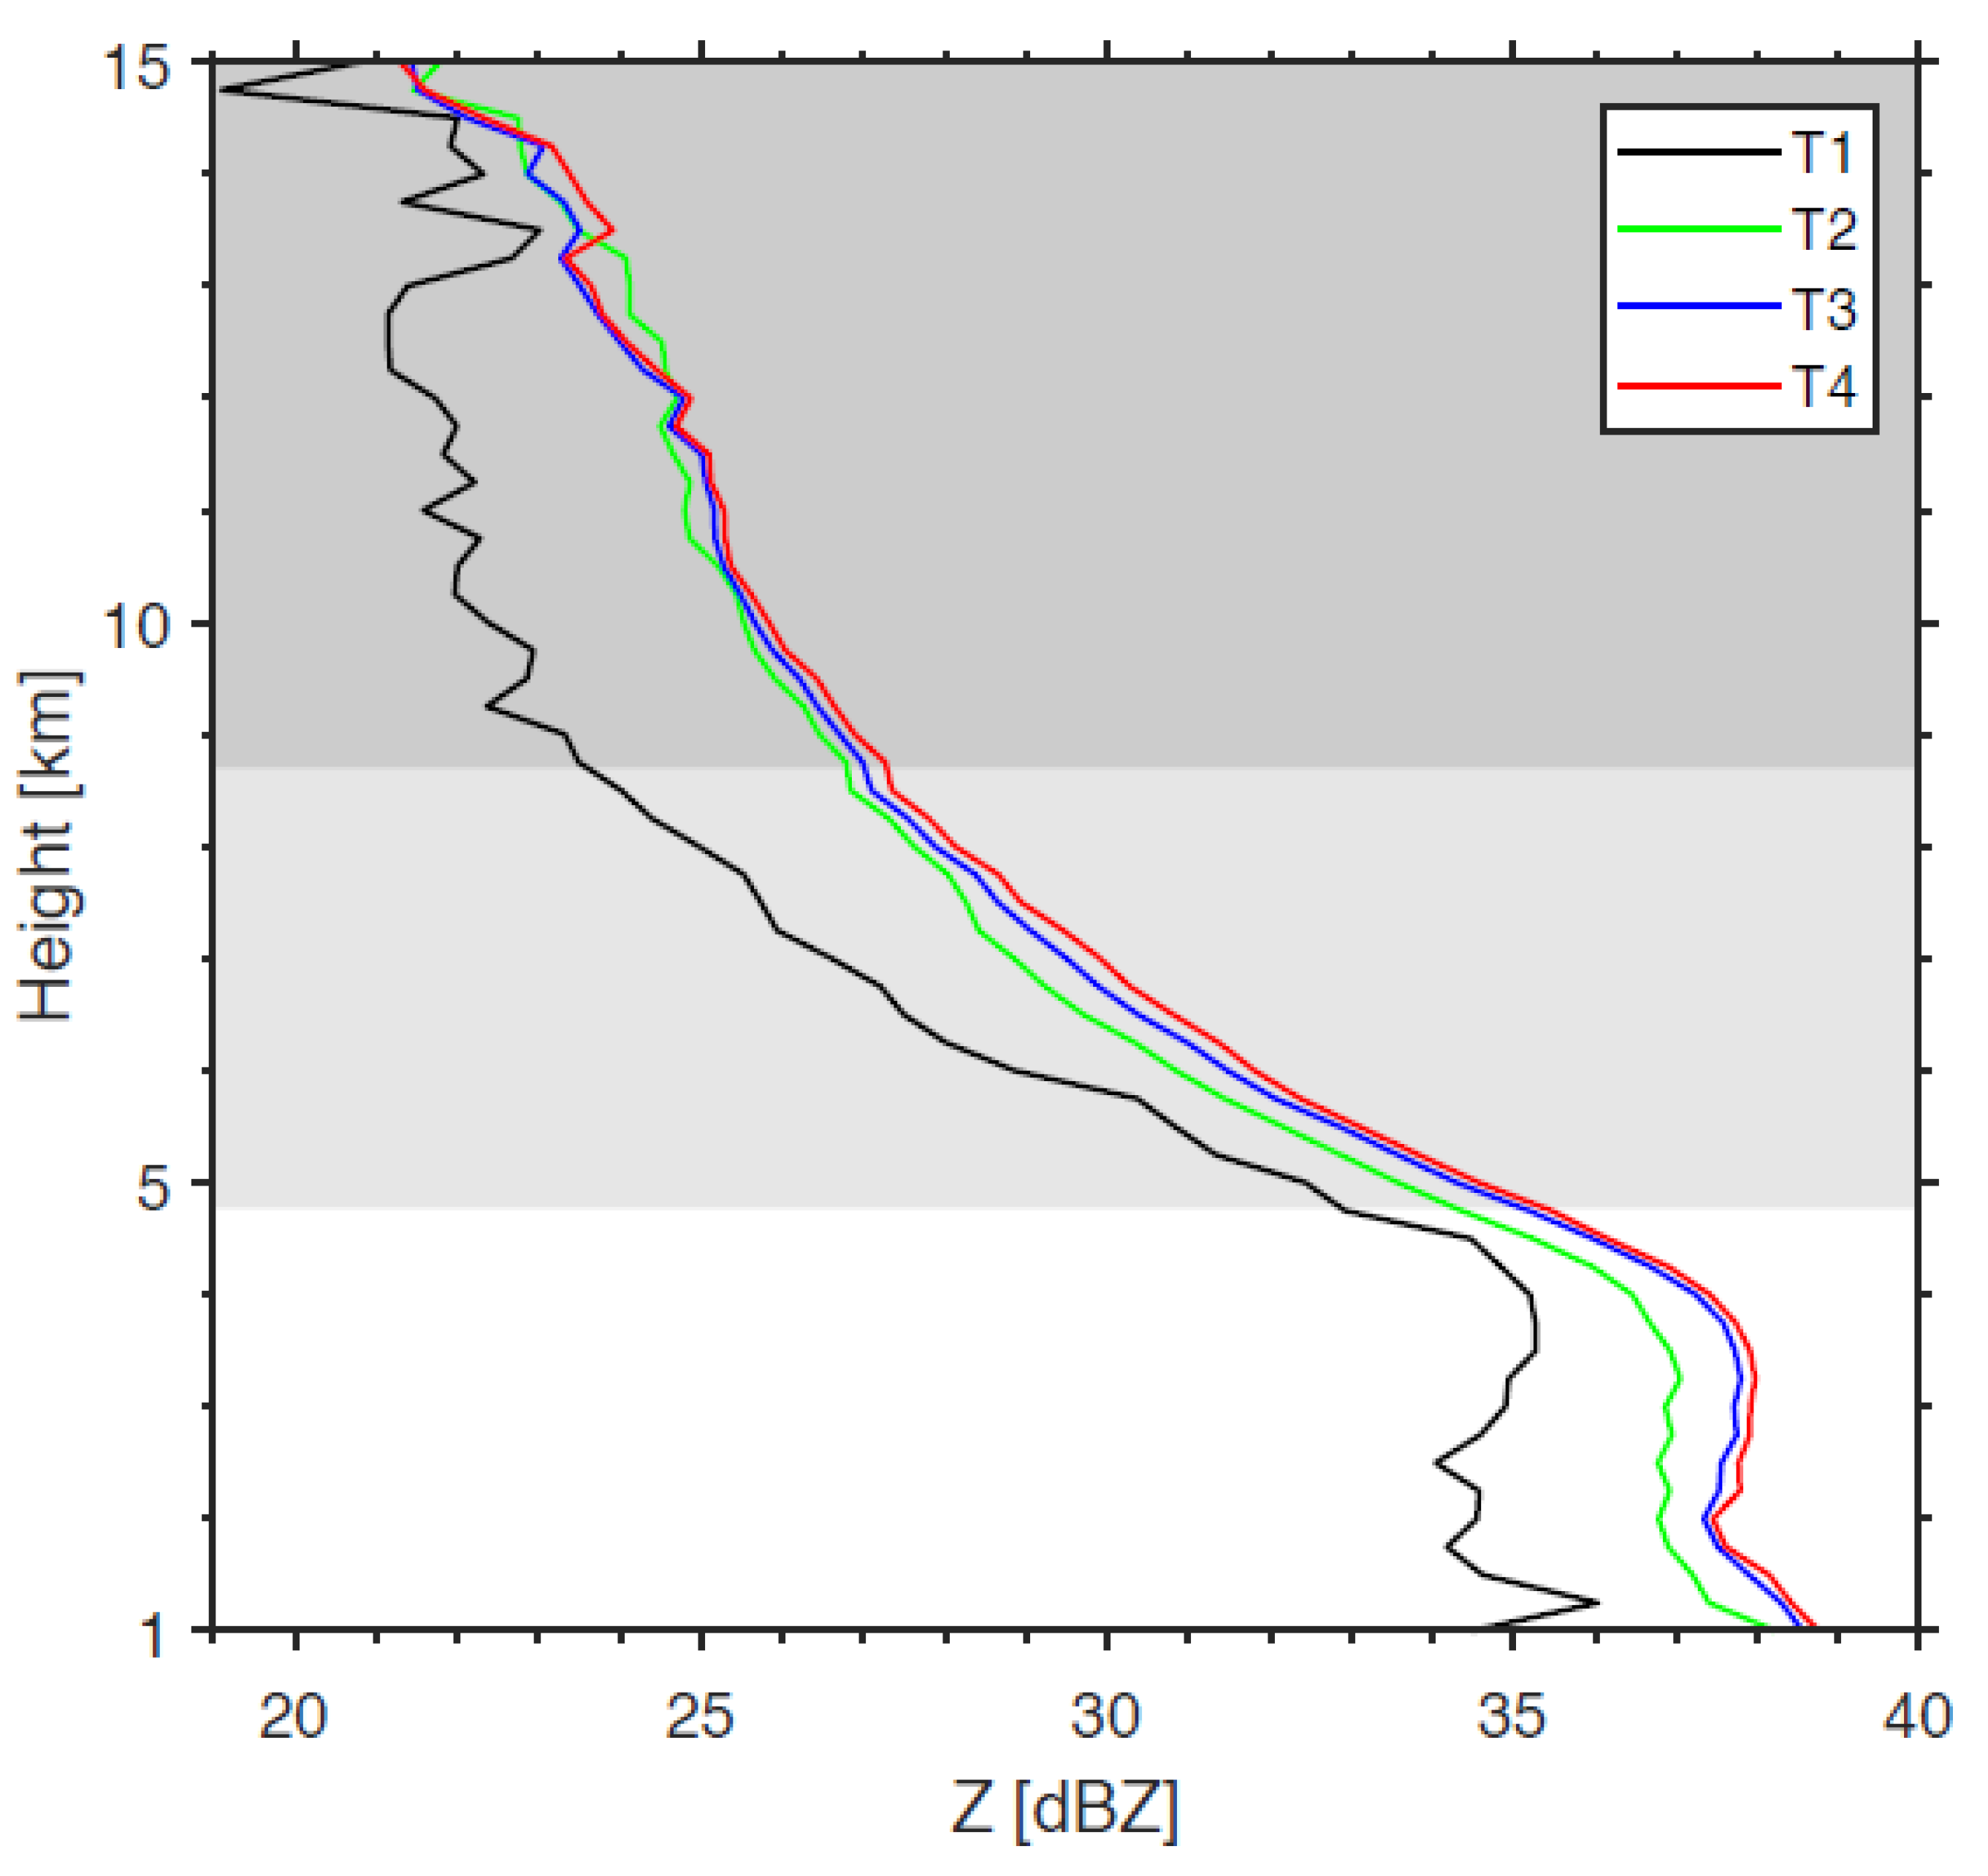
3.4. Vertical Structure of Clouds as a Function of Lightning Frequency

As lightning frequency increases, the Z profile along the entire column achieves higher reflectivity values (Figure 7). The T4 sub-region has the highest reflectivity values, with maximums of approximately 39 dBZ close to the surface, while the minimum occurs at the upper limit of the troposphere, with values close to 21 dBZ.
At the other extreme, the T1 region, with little or no electrical activity recorded during the TRMM orbits in the studied period, has maximum values of approximately 36 dBZ near the surface, and minimum values of 19 dBZ also at the upper limit of the troposphere.

4. Discussion

4.1. Relationship between Clouds’ Microphysical Properties and Lightning Occurrence

The distinct behavior of IWP distributions supports the hypothesis of a strong correlation between the generation of electrical charges, and consequent lightning production, with the frozen water particle mass inside the storm clouds [99]. Steiner and Smith [100] established the relationship of ice particles and convective clouds, finding that the existence of high-density ice particles is indicative of convective precipitation, and graupel can be considered as particles that mark the boundary between convective and stratiform precipitation. The growth of high-density graupel particles requires updrafts on the order of 2–3 m s−1, which corroborates commonly held classifications.
With regard to the order of magnitude of the FH values found, they are consistent with a previous survey carried out with radar data obtained by the TRMM and compared to that obtained from temperature data from the National Centers for Environmental Prediction (NCEP) [95], where the average values for regions in NEB vary between 4500 and 5000 m. It should be noted that since the currents within these clouds vary, the FH tends to vary accordingly, showing a slight increase (decrease) along with the updrafts (downdrafts).
When storm clouds present intense updrafts, with velocities greater than 6 m s−1 near the FH, the elevation of this is forced, bringing changes in the microphysics of the cloud’s mixed phase, with more electrical charges generated and consequently more lightning strikes [20,25,86,101].
It is noteworthy that the curves of FH found in this study for the two situations (with and without lightning) are very close since a large number of lightning strikes occur during the maturation phase [24]. However, even so, the values are higher when lightning strikes in NEB.
The SP results obtained in this work are compatible with the relationships already established in the literature between the variable and the occurrence of lightning. A strong correlation coefficient between CG lightning incidence was recorded in the Gansu region of China, with r = 0.86 [16]. The authors indicated the precipitation estimate from CG lightning, especially in regions without radar coverage. For the same area, Abreu et al. [7] demonstrated a close relationship between lightning density and precipitation estimated by Xavier et al. [102] in different scenarios, such as for the entire NEB, for clusters developed from the lightning density and for classes of different altitudes.
Regarding the CP values, the results are in agreement with those of Takayabu [103], who found a good correlation (r = 0.55) between rain-yields per flash and convective rain, for the entire range of coverage of the LIS and PR (tropics). The study indicated that large amounts of convective rain are fundamentally associated with intense updrafts, capable of sustaining vigorous lightning activity.

4.2. Microphysical Properties as a Function of Lightning Tertiles

The lowest lightning density values are concentrated in the eastern coastal strip of NEB, extending from the state of Rio Grande do Norte to the Bahia coast due to warm clouds predominance and lower convective activity in the region [83]. These clouds are not vertically extensive, without sufficient ice and strong updrafts, fundamental conditions for the formation and occurrence of lightning [6].
Further from the coast (increase in longitude), the increase in lightning density becomes noticeable and with this, the upper tertiles are more represented. A noteworthy feature in this area is the Planalto da Borborema region, extending through the states of RN, PB and PE, with a large representation of the highest tertile, in addition to Chapada Diamantina in Bahia and the Serra Geral do Goiás, a fact that may be related to topography [7,104,105].
For this region (T4), it is possible to associate the high lightning density with large and mesoscale systems. For the northern portion of NEB, it is possible to associate the occurrence of lightning with the area of influence of the ITCZ [9,106,107], which has deep convective and electrically charged clouds. For the more interior portions of the continent, MCS occurrence increases, which is very characteristic in the region, especially during the austral summer [59,108].
Results found in this work agree with the results documented through cluster analysis by Abreu et al. [7]. The data differ spatially in some regions, a fact that can be explained by the techniques used since cluster analysis takes into account the quantity of lightning and the geographic location to perform the grouping of points, while the percentile technique uses only the quantitative lightning density.
Regarding the microphysical characteristics existing in each of the regions, when looking for the relationship between CG lightning density and SP in six regions of the south-central United States, Sheridan et al. [109] found a highly variable relationship, with a correlation coefficient ranging from 0.12 (Baton Rouge) to 0.60 (Dallas). However, the authors highlighted the Gulf of Mexico’s influence on regions with lower correlation indices and generally concluded that on the daily time scale, there is a defined linear correlation between the total number of CG lightning discharges occurring in a region and mean SP.
Other researchers have reported a positive correlation between lightning density and SP, such as Dewan et al. [17], who found a strong positive correlation on the monthly scale (r = 0.734) and in the pre-monsoon season (r = 0.701), and moderate correlation during the monsoon (r = 0.455). For CP, the authors described a slightly higher correlation during the monsoon (r = 0.587) compared to the pre-monsoon season (r = 0.532).

4.3. Vertical Structure of Clouds as a Function of Lightning Frequency

Since the reflectivity has sixth power dependence on the particle diameter [110,111], the lightning profiles have a well-developed warm and mixed-phase, with a predominance of large liquid and ice water particles, respectively.
For this region, the possibility of occurrence of clouds with shallow convection, as described by Palharini and Vila [83], is noteworthy. In other parts of the globe, the significant difference in electrification between deep clouds and warm clouds has already been described, where regions with deeper convection are associated with a greater generation of electrical charges and consequently more frequent lightning occurrence [112].
These results are very similar to those found by Wang et al. [39] for convective pixels in the TRMM coverage region. The authors used five years of data from the LIS, TMI and PR instruments and also found the tendency of an increase in the reflectivity peak when there was an increase in the flash rate (FR) in the four categories used in the study (FR = 0, 0 < FR ≤ 1 flash min−1, 1 < FR ≤ 2 flash min−1 and FR > 2 flash min−1).
The results of this study are consistent in profile behavior and in order of magnitude with those reported by Katsanos et al. [113] for the central-eastern Mediterranean region. The authors observed a distinction between vertical reflectivity profiles for different classes of lightning occurrence, with the highest (smallest) Z indices being associated with the pixels with the highest (lowest) incidence of the phenomenon. The findings of this study are also consistent with those of Anselmo [46] and Morales Rodriguez [43]. The latter found lower reflectivity values for convective profiles of pixels located in adjacent maritime and oceanic regions, in comparison with the continental interiors of South America, using PR/TRMM data associated with lightning information obtained from the Sferics Timing And Ranging NETwork (STARNET).
Mattos et al. [84] also showed similar behavior in the São Paulo Metropolitan Region, with the distinction between the reflectivity of lightning classes, but with a different order of magnitude than in NEB, with classes with reflectivity greater than 50 dBZ. This difference must be associated with the different atmospheric systems operating in the region, where the SCM stands out.
The behavior of vertical reflectivity profiles found in this study is also consistent with findings for convective conditions and/or lightning occurrence in other places around the globe, such as in the states of Oklahoma and Kansas, USA [86], in Henan province, China [114] and for several representative regions in tropical and subtropical areas [115].

5. Conclusions

This study evaluated, in pioneering fashion, the behavior of microphysical properties as a function of occurrence and non-occurrence of lightning in the Northeast region of Brazil, as well as the spatial distribution of these characteristics in the region. The use of information from the TRMM satellite proved to be a fundamental alternative for regions such as NEB, where there is a large territorial extent and no effective coverage by ground radar and lightning location systems.
The evaluated cloud microphysical parameters showed that clouds with lightning have characteristics quite different from those without electrical discharges. Electrified clouds tend to have a greater amount of ice (IWP), have a slight rise in the height of the freezing level (FH), and have higher values of SP, CP and RWP.
Large-scale atmospheric systems such as ITCZ and SACZ have a strong influence on the spatial distribution of the microphysical characteristics evaluated in this study. Smaller-scale systems such as UTCV and Upper Bolivia also influence these parameters by facilitating convection, especially during the Southern Hemisphere summer.
The tertile technique proved to be of great importance for spatial division of NEB into lightning occurrence classes, since the application of ANOVA, followed by the Tukey test showed a significant difference between most regions (treatments) for the respective variables measured.
The analysis of clouds’ vertical structure through the vertical reflectivity profiles showed the existence of differences between coastal and inland regions, in addition to highlighting the relationship between higher reflectivity associated with higher lightning densities.
New perspectives for use of lightning measured by the Geostationary Lightning Mapper-GLM sensor onboard the GOES satellite [116] were created from these results, with the possibility of using data from the continuous monitoring of the area studied. Thus, future works can observe a storm throughout its life cycle, with better temporal resolution. In general, the assessment of convective initiation and lightning initiation situations can help to improve the understanding of atmospheric patterns that precede lightning occurrence and to reduce its harmful effects.

Author Contributions

All authors contributed to this paper: conceptualization, L.P.d.A., W.A.G., E.V.M. and D.T.R.; methodology, L.P.d.A., W.A.G., E.V.M. and D.T.R.; software, L.P.d.A., D.T.R., P.R.M. and M.P.A.d.S.; writing—original draft preparation, L.P.d.A.; writing—review and editing, W.A.G., E.V.M., D.T.R., P.R.M. and M.P.A.d.S.; visualization, L.P.d.A., W.A.G., E.V.M., D.T.R., P.R.M. and M.P.A.d.S.; supervision, W.A.G. and E.V.M.; funding acquisition, L.P.d.A., W.A.G., E.V.M., D.T.R., P.R.M. and M.P.A.d.S. All authors have read and agreed to the published version of the manuscript.

Funding

This study was financed in part by the Coordenação de Aperfeiçoamento de Pessoal de Nível Superior—Brasil (CAPES)—Finance Code 001.

Institutional Review Board Statement

Not applicable.

Informed Consent Statement

Not applicable.

Data Availability Statement

The data used in this manuscript are available by writing to the corresponding authors.

Acknowledgments

We are grateful to the National Aeronautics and Space Administration (NASA) Global Hydrology Center (GHC) for providing lightning climatology data and cloud microphysics data through the storm platform. Lizandro Abreu is grateful to the Instituto Federal do Piauí (IFPI). We acknowledge funding from the Coordenação de Aperfeiçoamento de Pessoal de Nível Superior—Brasil (CAPES).

Conflicts of Interest

The authors declare no conflict of interest.

References

  1. Cunha, A.P.M.; Alvalá, R.C.; Nobre, C.A.; Carvalho, M.A. Monitoring vegetative drought dynamics in the Brazilian semiarid region. Agric. For. Meteorol. 2015, 214–215, 494–505. [Google Scholar] [CrossRef]
  2. Huang, J.; Ji, M.; Xie, Y.; Wang, S.; He, Y.; Ran, J. Global semi-arid climate change over last 60 years. Clim. Dyn. 2016, 46, 1131–1150. [Google Scholar] [CrossRef] [Green Version]
  3. Mutti, P.R.; Lúcio, P.S.; Dubreuil, V.; Bezerra, B.G. NDVI time series stochastic models for the forecast of vegetation dynamics over desertification hotspots. Int. J. Remote Sens. 2020, 41, 2759–2788. [Google Scholar] [CrossRef]
  4. Gomes, R.; Lima, K.C. Influence of the modes of climate variability in the Tropical Pacific and Atlantic on accumulated rainfall and reservoir water volumes in the Northeast Brazil. Int. J. Climatol. 2021. [Google Scholar] [CrossRef]
  5. Medeiros, F.J.; Lima, K.C.; Caetano, D.A.; Silva, F.J.O. Impact of the Internnual Variability of Precipitation on the Reservoirs of the Semiarid Northeast Brazil Region. Anuário do Instituto de Geociências 2018, 41, 731–741. [Google Scholar] [CrossRef]
  6. Reynolds, S.E.; Brook, M.; Gourley, M.F. Thunderstorm Charge Separation. J. Meteorol. 1957, 14, 426–436. [Google Scholar] [CrossRef] [Green Version]
  7. De Abreu, L.P.; Gonçalves, W.A.; Mattos, E.V.; Albrecht, R.I. Assessment of the total lightning flash rate density (FRD) in northeast Brazil (NEB) based on TRMM orbital data from 1998 to 2013. Int. J. Appl. Earth Obs. Geoinf. 2020, 93, 102195. [Google Scholar] [CrossRef]
  8. Zipser, E.J.; Cecil, D.J.; Liu, C.; Nesbitt, S.W.; Yorty, D.P. Where are the most: Intense thunderstorms on Earth? Bull. Am. Meteorol. Soc. 2006, 87, 1057–1071. [Google Scholar] [CrossRef] [Green Version]
  9. Albrecht, R.I.; Goodman, S.J.; Buechler, D.E.; Blakeslee, R.J.; Christian, H.J. Where Are the Lightning Hotspots on Earth? Bull. Am. Meteorol. Soc. 2016, 97, 2051–2068. [Google Scholar] [CrossRef]
  10. Cardoso, I.; Pinto, O.; Pinto, I.R.C.A.; Holle, R. Lightning casualty demographics in Brazil and their implications for safety rules. Atmos. Res. 2014, 135–136, 374–379. [Google Scholar] [CrossRef]
  11. Christian, H.J.; Blakeslee, R.J.; Goodman, S.J. The detection of lightning from geostationary orbit. J. Geophys. Res. 1989, 94, 13329. [Google Scholar] [CrossRef]
  12. Lima, K.C.; Gomes, R.G. Detecção de descargas elétricas atmosféricas em sistemas convectivos com dados do SIMEPAR. Revista Brasileira de Geofísica 2009, 27, 5–16. [Google Scholar] [CrossRef] [Green Version]
  13. Naccarato, K.P. Estudo de Relâmpagos no Brasil com base na Análise de Desempenho do Sistema de Localização de Tempestades; Instituto Nacional de Pesquisas Espaciais: São José dos Campos, Brazil, 2001. [Google Scholar]
  14. Williams, E.R. The tripole structure of thunderstorms. J. Geophys. Res. 1989, 94, 13151. [Google Scholar] [CrossRef]
  15. Formenton, M.; Panegrossi, G.; Casella, D.; Dietrich, S.; Mugnai, A.; Sanò, P.; Di Paola, F.; Betz, H.D.; Price, C.; Yair, Y. Using a cloud electrification model to study relationships between lightning activity and cloud microphysical structure. Nat. Hazards Earth Syst. Sci. 2013, 13, 1085–1104. [Google Scholar] [CrossRef]
  16. Zhou, Y.; Qie, X.; Soula, S. A study of the relationship between cloud-to-ground lightning and precipitation in the convective weather system in China. Ann. Geophys. 2002, 20, 107–113. [Google Scholar] [CrossRef] [Green Version]
  17. Dewan, A.; Ongee, E.T.; Rahman, M.M.; Mahmood, R.; Yamane, Y. Spatial and temporal analysis of a 17-year lightning climatology over Bangladesh with LIS data. Theor. Appl. Climatol. 2018, 134, 347–362. [Google Scholar] [CrossRef]
  18. Chatterjee, C.; Das, S. On the association between lightning and precipitation microphysics. J. Atmos. Sol. Terr. Phys. 2020, 207, 105350. [Google Scholar] [CrossRef]
  19. Soula, S.; Chauzy, S. Some aspects of the correlation between lightning and rain activities in thunderstorms. Atmos. Res. 2000, 56, 355–373. [Google Scholar] [CrossRef]
  20. Albrecht, R.I.; Morales, C.A.; Silva Dias, M.A.F. Electrification of precipitating systems over the Amazon: Physical processes of thunderstorm development. J. Geophys. Res. Atmos. 2011, 116, 1–27. [Google Scholar] [CrossRef] [Green Version]
  21. Petersen, W.A.; Fu, R.; Chen, M.; Blakeslee, R. Intraseasonal forcing of convection and lightning activity in the southern Amazon as a function of cross-equatorial flow. J. Clim. 2006, 19, 3180–3196. [Google Scholar] [CrossRef] [Green Version]
  22. Petersen, W.A.; Deierling, W.K.; Gauthier, M.L.; Christian, H.J. Precipitation Ice and Lightning: From Global to Cell Scales. 2005. Available online: https://www.researchgate.net/publication/268372661_Precipitation_Ice_and_Lightning_From_Global_to_Cell_Scales (accessed on 9 October 2021).
  23. Abreu, L.P. Relâmpagos no Nordeste do Brasil: Ocorrência, Variabilidade Espaço-Temporal e Relação com Microfísica das Nuvens; Universidade Federal do Rio Grande do Norte: Natal, Brazil, 2018. [Google Scholar]
  24. Mattos, E.V.; Machado, L.A.T.; Williams, E.R.; Goodman, S.J.; Blakeslee, R.J.; Bailey, J.C. Electrification life cycle of incipient thunderstorms. J. Geophys. Res. Atmos. 2017, 122, 4670–4697. [Google Scholar] [CrossRef]
  25. Petersen, W.A.; Rutledge, S.A. Regional Variability in Tropical Convection: Observations from TRMM. J. Clim. 2001, 14, 3566–3586. [Google Scholar] [CrossRef]
  26. Williams, E.R.; Weber, M.E.; Orville, R.E. The relationship between lightning type and convective state of thunderclouds. J. Geophys. Res. 1989, 94, 13213. [Google Scholar] [CrossRef] [Green Version]
  27. Williams, E.; Boldi, B.; Matlin, A.; Weber, M.; Hodanish, S.; Sharp, D.; Goodman, S.; Raghavan, R.; Buechler, D. The behavior of total lightning activity in severe Florida thunderstorms. Atmos. Res. 1999, 51, 245–265. [Google Scholar] [CrossRef] [Green Version]
  28. Lamb, D. Clouds and Fog, Cloud Microphysics. In Encyclopedia of Atmospheric Sciences; Elsevier: Amsterdam, The Netherlands, 2015; Volume 2, pp. 133–140. ISBN 978-0-12-382225-3. [Google Scholar]
  29. Wallace, J.M.; Hobbs, P.V. Atmospheric Science: An Introductory Survey, 2nd ed.; Elsevier: Amsterdam, The Netherlands, 2006; ISBN 9780127329512. [Google Scholar]
  30. Carey, L.D.; Schultz, E.V.; Schultz, C.J.; Deierling, W.; Petersen, W.A.; Bain, A.L.; Pickering, K.E. An Evaluation of Relationships between Radar-Inferred Kinematic and Microphysical Parameters and Lightning Flash Rates in Alabama Storms. Atmosphere 2019, 10, 796. [Google Scholar] [CrossRef] [Green Version]
  31. Christian, H.J.; Blakeslee, R.J.; Boccippio, D.J.; Boeck, W.L.; Buechler, D.E.; Driscoll, K.; Goodman, S.J.; Hall, J.M.; Koshak, W.J.; Mach, D.M.; et al. Global frequency and distribution of lightning as observed from space by the Optical Transient Detector. J. Geophys. Res. 2003, 108, 4005. [Google Scholar] [CrossRef]
  32. Clark, S.K.; Ward, D.S.; Mahowald, N.M. Parameterization-based uncertainty in future lightning flash density. Geophys. Res. Lett. 2017, 44, 2893–2901. [Google Scholar] [CrossRef]
  33. Kummerow, C.; Barnes, W.; Kozu, T.; Shiue, J.; Simpson, J. The Tropical Rainfall Measuring Mission (TRMM) Sensor Package. J. Atmos. Ocean. Technol. 1998, 15, 809–817. [Google Scholar] [CrossRef]
  34. Allen, D.J.; Pickering, K.E. Evaluation of lightning flash rate parameterizations for use in a global chemical transport model. J. Geophys. Res. Atmos. 2002, 107, ACH15-1–ACH15-21. [Google Scholar] [CrossRef]
  35. Petersen, W.A.; Christian, H.J.; Rutledge, S.A. TRMM observations of the global relationship between ice water content and lightning. Geophys. Res. Lett. 2005, 32. [Google Scholar] [CrossRef] [Green Version]
  36. Grewe, V.; Brunner, D.; Dameris, M.; Grenfell, J.L.; Hein, R.; Shindell, D.; Staehelin, J. Origin and variability of upper tropospheric nitrogen oxides and ozone at northern mid-latitudes. Atmos. Environ. 2001, 35, 3421–3433. [Google Scholar] [CrossRef] [Green Version]
  37. Deierling, W.; Petersen, W.A. Total lightning activity as an indicator of updraft characteristics. J. Geophys. Res. 2008, 113, D16210. [Google Scholar] [CrossRef] [Green Version]
  38. Deierling, W.; Petersen, W.A.; Latham, J.; Ellis, S.; Christian, H.J. The relationship between lightning activity and ice fluxes in thunderstorms. J. Geophys. Res. 2008, 113, D15210. [Google Scholar] [CrossRef] [Green Version]
  39. Wang, N.-Y.; Gopalan, K.; Albrecht, R.I. Application of lightning to passive microwave convective and stratiform partitioning in passive microwave rainfall retrieval algorithm over land from TRMM. J. Geophys. Res. Atmos. 2012, 117. [Google Scholar] [CrossRef] [Green Version]
  40. Basarab, B.M.; Rutledge, S.A.; Fuchs, B.R. An improved lightning flash rate parameterization developed from Colorado DC3 thunderstorm data for use in cloud-resolving chemical transport models. J. Geophys. Res. Atmos. 2015, 120, 9481–9499. [Google Scholar] [CrossRef]
  41. Hayashi, S.; Umehara, A.; Nagumo, N.; Ushio, T. The relationship between lightning flash rate and ice-related volume derived from dual-polarization radar. Atmos. Res. 2021, 248, 105166. [Google Scholar] [CrossRef]
  42. Finney, D.L.; Doherty, R.M.; Wild, O.; Huntrieser, H.; Pumphrey, H.C.; Blyth, A.M. Using cloud ice flux to parametrise large-scale lightning. Atmos. Chem. Phys 2014, 14, 12665–12682. [Google Scholar] [CrossRef] [Green Version]
  43. Morales Rodriguez, C.A. Thunderstorm Efficiency Regimes in South America as Observed by STARNET and TRMM. J. Geophys. Res. Atmos. 2019, 124, 11428–11451. [Google Scholar] [CrossRef]
  44. Mattos, E.V.; Machado, L.A.T. Cloud-to-ground lightning and Mesoscale Convective Systems. Atmos. Res. 2011, 99, 377–390. [Google Scholar] [CrossRef] [Green Version]
  45. Cecil, D.J.; Blankenship, C.B. Toward a Global Climatology of Severe Hailstorms as Estimated by Satellite Passive Microwave Imagers. J. Clim. 2012, 25, 687–703. [Google Scholar] [CrossRef]
  46. Anselmo, E.M. Morfologia das Tempestades Elétricas na América do Sul. Ph.D. Thesis, Universidade de São Paulo, São Paulo, Brazil, 2015. [Google Scholar]
  47. Zhao, P.; Zhou, Y.; Xiao, H.; Liu, J.; Gao, J.; Ge, F. Total Lightning Flash Activity Response to Aerosol over China Area. Atmosphere 2017, 8, 26. [Google Scholar] [CrossRef] [Green Version]
  48. Rasmussen, K.L.; Houze, R.A. Orogenic Convection in Subtropical South America as Seen by the TRMM Satellite. Mon. Weather Rev. 2011, 139, 2399–2420. [Google Scholar] [CrossRef]
  49. Brazilian Institute of Geography and Statistics (IBGE). Sinopse do Censo Demográfico 2010; IBGE: Rio de Janeiro, Brazil, 2010. [Google Scholar]
  50. Alvares, C.A.; Stape, J.L.; Sentelhas, P.C.; de Moraes Gonçalves, J.L.; Sparovek, G. Köppen’s climate classification map for Brazil. Meteorologische Zeitschrift 2013, 22, 711–728. [Google Scholar] [CrossRef]
  51. Oliveira, P.T.; Santos e Silva, C.M.; Lima, K.C. Climatology and trend analysis of extreme precipitation in subregions of Northeast Brazil. Theor. Appl. Climatol. 2017, 130, 77–90. [Google Scholar] [CrossRef]
  52. Silva, P.E.; Silva, C.M.S.; Spyrides, M.H.C.; Andrade, L.M.B. Analysis of Climate Extreme Indices in the Northeast Brazil and the Brazilian Amazon in the Period from 1980 to 2013. Anuario do Instituto de Geociencias 2019, 42, 137–148. [Google Scholar] [CrossRef]
  53. Rodrigues, D.T.; Gonçalves, W.A.; Spyrides, M.H.C.; Santos e Silva, C.M. Spatial and temporal assessment of the extreme and daily precipitation of the Tropical Rainfall Measuring Mission satellite in Northeast Brazil. Int. J. Remote Sens. 2020, 41, 549–572. [Google Scholar] [CrossRef]
  54. Hastenrath, S.; Heller, L. Dynamics of climatic hazards in northeast Brazil. Q. J. R. Meteorol. Soc. 1977, 103, 77–92. [Google Scholar] [CrossRef]
  55. Reboita, M.S.; Krusche, N.; Ambrizzi, T.; Porfírio, R.; Rocha, D. Entendendo o Tempo e o Clima na América do Sul O Sol como Fonte de Energia. Terrae Didatica 2012, 8, 34–50. [Google Scholar] [CrossRef] [Green Version]
  56. Gan, M.A.; Kousky, V.E. Vórtices Ciclônicos Da Alta Troposfera No Oceano Atlântico Sul. Rev. Bras. Meteorol. 1986, 1, 19–28. [Google Scholar]
  57. Kousky, V.E.; Gan, M.A. Upper tropospheric cyclonic vortices in the tropical South Atlantic. Tellus 1981, 33, 538–551. [Google Scholar] [CrossRef] [Green Version]
  58. Houze, R.A. Cloud Dynamics; Academic Press: Cambridge, MA, USA, 1993. [Google Scholar]
  59. Machado, L.A.T.; Rossow, W.B. Structural Characteristics and Radiative Properties of Tropical Cloud Clusters. Mon. Weather Rev. 1993, 121, 3234–3260. [Google Scholar] [CrossRef]
  60. Brito, B.M.; Levit, V.; Fedorova, N.; Molion, L.C.B.; Tenório, R.S.; Rodrigues, R.N.; da Silva, B.F.P. Análise do comportamento das trovoadas no estado de Alagoas, previsão à curto prazo. Rev. Bras. Meteorol. 2011, 26, 243–256. [Google Scholar] [CrossRef] [Green Version]
  61. Fedorova, N.; Levit, V.; da Cruz, C.D. On Frontal Zone Analysis in the Tropical Region of the Northeast Brazil. Pure Appl. Geophys. 2016, 173, 1403–1421. [Google Scholar] [CrossRef]
  62. Gomes, H.B.; Ambrizzi, T.; Herdies, D.L.; Hodges, K.; Pontes da Silva, B.F. Easterly Wave Disturbances over Northeast Brazil: An Observational Analysis. Adv. Meteorol. 2015, 2015, 1–20. [Google Scholar] [CrossRef] [Green Version]
  63. Yamazaki, Y.; Rao, V.B. Tropical Cloudiness over the South Atlantic Ocean. J. Meteorol. Soc. Japan 1977, 55, 205–207. [Google Scholar] [CrossRef] [Green Version]
  64. NASA. Lightning Imaging Sensor (LIS) Instrument Overview. Available online: https://lightning.nsstc.nasa.gov/lis/overview_lis_instrument.html (accessed on 3 May 2017).
  65. Bitzer, P.M. Global distribution and properties of continuing current in lightning. J. Geophys. Res. Atmos. 2017, 122, 1033–1041. [Google Scholar] [CrossRef]
  66. Boccippio, D.J.; Koshak, W.J.; Blakeslee, R.J. Performance Assessment of the Optical Transient Detector and Lightning Imaging Sensor. Part I: Predicted Diurnal Variability. J. Atmos. Ocean. Technol. 2002, 19, 1318–1332. [Google Scholar] [CrossRef]
  67. Christian, H.J.; Blakeslee, R.J.; Goodman, S.J.; Mach, D.M. Algorithm Theoretical Basis Document (ATBD) for the Lightning Imaging Sensor (LIS). 2000. Available online: https://eospso.gsfc.nasa.gov/sites/default/files/atbd/atbd-lis-01.pdf (accessed on 9 October 2021).
  68. Goodman, S.J.; Christian, H.J.; Rust, W.D. A Comparison of the Optical Pulse Characteristics of Intracloud and Cloud-to-Ground Lightning as Observed above Clouds. J. Appl. Meteorol. 1988, 27, 1369–1381. [Google Scholar] [CrossRef] [Green Version]
  69. NASA. TRMM Microwave Imager (TMI) 2A12. Available online: https://disc.gsfc.nasa.gov/precipitation/documentation/documentation/TRMM_README/TRMM_2A12_readme.shtml (accessed on 3 May 2017).
  70. Banze, B.E. Avaliação dos Modelos de Estimativa de Precipitação do TRMM em Moçambique; Universidade de São Paulo: São Paulo, Brazil, 2016. [Google Scholar]
  71. NASA. TRMM Instruments. Available online: https://gpm.nasa.gov/missions/TRMM/satellite (accessed on 14 January 2021).
  72. NASA. Tropical Rainfall Measuring Mission Precipitation Proceassing System: File Specification 2A25; NASA: Washington, DC, USA, 2015. [Google Scholar]
  73. De Oliveira, P.T. Estudo Estatístico Sobre Eventos de Precipitação Intensa no Nordeste do Brasil; Universidade Federal do Rio Grande do Norte: Natal, Brazil, 2014. [Google Scholar]
  74. Wilks, D.S. Statistical Methods in the Atmospheric Sciences; Academic Press: Cambridge, MA, USA, 2006; Volume 59, ISBN 9780080456225. [Google Scholar]
  75. Chambers, J.M.; Freeny, A.E.; Heiberger, R.M. Analysis of Variance; Designed Experiments. In Statistical Models in S; Routledge: Oxfordshire, UK, 1992; p. 49. [Google Scholar]
  76. Driscoll, W.C. Robustness of the ANOVA and Tukey-Kramer statistical tests. Comput. Ind. Eng. 1996, 31, 265–268. [Google Scholar] [CrossRef]
  77. Tukey, J.W. Comparing Individual Means in the Analysis of Variance. Biometrics 1949, 5, 99. [Google Scholar] [CrossRef]
  78. Royston, J.P. An Extension of Shapiro and Wilk’s W Test for Normality to Large Samples. Appl. Stat. 1982, 31, 115. [Google Scholar] [CrossRef]
  79. Brown, M.B.; Forsythe, A.B. Robust Tests for the Equality of Variances. J. Am. Stat. Assoc. 1974, 69, 364. [Google Scholar] [CrossRef]
  80. Ljung, G.M.; Box, G.E.P. On a Measure of Lack of Fit in Time Series Models. Biometrika 1978, 65, 297. [Google Scholar] [CrossRef]
  81. Rodrigues, D.T. Análise de Eventos Extremos de Precipitação no Nordeste do Brasil; Universidade Federal do Rio Grande do Norte: Natal, Brazil, 2019; Volume 1. [Google Scholar]
  82. Cumming, G.; Fidler, F.; Vaux, D.L. Error bars in experimental biology. J. Cell Biol. 2007, 177, 7–11. [Google Scholar] [CrossRef] [PubMed] [Green Version]
  83. Palharini, R.S.A.; Vila, D.A. Climatological Behavior of Precipitating Clouds in the Northeast Region of Brazil. Adv. Meteorol. 2017, 2017, 1–12. [Google Scholar] [CrossRef]
  84. Mattos, E.V.; Machado, L.A.T.; Williams, E.R.; Albrecht, R.I. Polarimetric radar characteristics of storms with and without lightning activity. J. Geophys. Res. Atmos. 2016, 121, 201–220. [Google Scholar] [CrossRef]
  85. Toracinta, E.R.; Cecil, D.J.; Zipser, E.J.; Nesbitt, S.W. Radar, Passive Microwave, and Lightning Characteristics of Precipitating Systems in the Tropics. Mon. Weather Rev. 2002, 130, 802–824. [Google Scholar] [CrossRef]
  86. Zipser, E.J.; Lutz, K.R. The Vertical Profile of Radar Reflectivity of Convective Cells: A Strong Indicator of Storm Intensity and Lightning Probability? Mon. Weather Rev. 1994, 122, 1751–1759. [Google Scholar] [CrossRef] [Green Version]
  87. Torenbeek, E. Appendix B—International Standard Atmosphere: Manual of the ICAO Standard Atmosphere. In Advanced Aircraft Design: Conceptual Design, Analysis and Optimization of Subsonic Civil Airplanes; Wiley: Hoboken, NJ, USA, 2013; pp. 397–398. [Google Scholar] [CrossRef]
  88. Cavcar, M. The International Standard Atmosphere (ISA). Available online: http://fisicaatmo.at.fcen.uba.ar/practicas/ISAweb.pdf (accessed on 8 October 2021).
  89. Agency, E.A.S. Definitions and Abbreviations used in Certification Specifications for Products, Parts and Appliances: CS-Definitions. Available online: https://www.easa.europa.eu/sites/default/files/dfu/CS-Definitions—Amendment2.pdf (accessed on 8 October 2021).
  90. Czekala, H.; Crewell, S.; Simmer, C.; Thiele, A. Discrimination of cloud and rain liquid water path by groundbased polarized microwave radiometry. Geophys. Res. Lett. 2001, 28, 267–270. [Google Scholar] [CrossRef]
  91. Collier, A.B.; Hughes, A.R.W. Lightning and the African ITCZ. J. Atmos. Solar-Terrestrial Phys. 2011, 73, 2392–2398. [Google Scholar] [CrossRef]
  92. Melo, A.B.C.; Nobre, P.; Melo, M.L.D.; Santana, S.C. Estudo climatológico da posiçõo da ZCIT no atlântico equatorial e sua influência sobre o Nordeste do Brasil. Congr. Bras. Meteorol. 2000, 11, 1142–1147. [Google Scholar]
  93. Soula, S.; Kasereka, J.K.; Georgis, J.F.; Barthe, C. Lightning climatology in the Congo Basin. Atmos. Res. 2016, 178–179, 304–319. [Google Scholar] [CrossRef]
  94. Reboita, M.S.; Gan, M.A.; Rocha, R.P.D.; Ambrizzi, T. Regimes de precipitação na América do Sul: Uma revisão bibliográfica. Rev. Bras. Meteorol. 2010, 25, 185–204. [Google Scholar] [CrossRef]
  95. Harris, G.N.; Bowman, K.P.; Shin, D.-B. Comparison of Freezing-Level Altitudes from the NCEP Reanalysis with TRMM Precipitation Radar Brightband Data. J. Clim. 2000, 13, 4137–4148. [Google Scholar] [CrossRef]
  96. Vendrasco, E.P.; Machado, L.A.T.; Araujo, C.S.; Ribaud, J.-F.; Ferreira, R.C. Potential use of the GLM for nowcasting and data assimilation. Atmos. Res. 2020, 242, 105019. [Google Scholar] [CrossRef]
  97. Soriano, L.R.; Sánchez Llorente, J.; González Zamora, A.; de Pablo Dávila, F. Influence of land cover on lightning and convective precipitation over the European continent. Prog. Phys. Geogr. Earth Environ. 2019, 43, 352–364. [Google Scholar] [CrossRef]
  98. Minobe, S.; Park, J.H.; Virts, K.S. Diurnal Cycles of Precipitation and Lightning in the Tropics Observed by TRMM3G68, GSMaP, LIS, and WWLLN. J. Clim. 2020, 33, 4293–4313. [Google Scholar] [CrossRef] [Green Version]
  99. Williams, E.R. The Electrification of Thunderstorms. Sci. Am. 1988, 259, 88–99. [Google Scholar] [CrossRef]
  100. Steiner, M.; Smith, J.A. Convective versus stratiform rainfall: An ice-microphysical and kinematic conceptual model. Atmos. Res. 1998, 47–48, 317–326. [Google Scholar] [CrossRef]
  101. Williams, E.; Rothkin, K.; Stevenson, D.; Boccippio, D. Global Lightning Variations Caused by Changes in Thunderstorm Flash Rate and by Changes in the Number of Thunderstorms. J. Appl. Meteorol. 2000, 39, 2223–2230. [Google Scholar] [CrossRef]
  102. Xavier, A.C.; King, W.; Scanlon, B.R. Daily gridded meteorological variables in Brazil (1980–2013). Int. J. Climatol. 2016, 2659, 2644–2659. [Google Scholar] [CrossRef] [Green Version]
  103. Takayabu, Y.N. Rain-yield per flash calculated from TRMM PR and LIS data and its relationship to the contribution of tall convective rain. Geophys. Res. Lett. 2006, 33. [Google Scholar] [CrossRef] [Green Version]
  104. Bourscheidt, V.; Pinto, O.; Naccarato, K.P.; Pinto, I.R.C.A. The influence of topography on the cloud-to-ground lightning density in South Brazil. Atmos. Res. 2009, 91, 508–513. [Google Scholar] [CrossRef]
  105. Bürgesser, R.E.; Nicora, M.G.; Ávila, E.E. Characterization of the lightning activity of “Relámpago del Catatumbo”. J. Atmos. Solar-Terrestrial Phys. 2012, 77, 241–247. [Google Scholar] [CrossRef]
  106. Molion, L.C.B.; Bernardo, S.D.O. Dinâmica das Chuvas no Nordeste Brasileiro. An. Congr. Bras. Meteorol. 2002, 1, 1334–1342. [Google Scholar] [CrossRef]
  107. Uvo, C.B. A Zona de Convergência Intertropical (ZCIT) e Sua Relação Com a Precipitação na Região Norte do Nordeste Brasileiro. Master’s Thesis, Instituto Nacional de Pesquisas Espaciais, São José dos Campos, Brazil, 1989. [Google Scholar]
  108. Rasmussen, K.L.; Zuluaga, M.D.; Houze, R.A. Severe convection and lightning in subtropical South America. Geophys. Res. Lett. 2014, 41, 7359–7366. [Google Scholar] [CrossRef]
  109. Sheridan, S.C.; Griffiths, J.F.; Orville, R.E. Warm Season Cloud-to-Ground Lightning–Precipitation Relationships in the South-Central United States. Weather Forecast. 1997, 12, 449–458. [Google Scholar] [CrossRef]
  110. Straka, J.M.; Zrnić, D.S.; Ryzhkov, A.V. Bulk Hydrometeor Classification and Quantification Using Polarimetric Radar Data: Synthesis of Relations. J. Appl. Meteorol. 2000, 39, 1341–1372. [Google Scholar] [CrossRef]
  111. Rinehart, R.E. Radar for Meteorologists, 5th ed.; Rinehart Publications, Ed.; Rinehart Publications: New York, NY, USA, 2010. [Google Scholar]
  112. Liu, Z.; Zheng, D.; Guo, F.; Zhang, Y.; Zhang, Y.; Wu, C.; Chen, H.; Han, S. Lightning activity and its associations with cloud structures in a rainstorm dominated by warm precipitation. Atmos. Res. 2020, 246, 105120. [Google Scholar] [CrossRef]
  113. Katsanos, D.K.; Lagouvardos, K.; Kotroni, V.; Argiriou, A.A. The Relationship of Lightning Activity with Microwave Brightness Temperatures and Spaceborne Radar Reflectivity Profiles in the Central and Eastern Mediterranean. J. Appl. Meteorol. Climatol. 2007, 46, 1901–1912. [Google Scholar] [CrossRef]
  114. Feng, G.; Qie, X.; Yuan, T.; Niu, S. Lightning activity and precipitation structure of hailstorms. Sci. China Ser. D Earth Sci. 2007, 50, 629–639. [Google Scholar] [CrossRef]
  115. Liu, C.; Cecil, D.J.; Zipser, E.J.; Kronfeld, K.; Robertson, R. Relationships between lightning flash rates and radar reflectivity vertical structures in thunderstorms over the tropics and subtropics. J. Geophys. Res. Atmos. 2012, 117. [Google Scholar] [CrossRef] [Green Version]
  116. Goodman, S.J.; Blakeslee, R.J.; Koshak, W.J.; Mach, D.; Bailey, J.; Buechler, D.; Carey, L.; Schultz, C.; Bateman, M.; McCaul, E.; et al. The GOES-R Geostationary Lightning Mapper (GLM). Atmos. Res. 2013, 125–126, 34–49. [Google Scholar] [CrossRef] [Green Version]
Figure 1. Geographical location of NEB and topography (m) with state division. The red circles represent the location of the state capitals. The boxes denote the main topographic formations: (1) Borborema Plateau; (2) Chapada (high plains) Diamantina; and (3) Chapada das Mangabeiras and Serra [mountain range] Geral do Goiás.
Remotesensing 13 04491 g001
Figure 2. Relative frequency distributions (%) of microphysical properties: (a) Ice Water Path, (b) Freezing Level Height, (c) Rain Water Path, (d) Surface Precipitation and (e) Convective Precipitation.
Remotesensing 13 04491 g002
Figure 3. Spatial and seasonal distribution of (ad) Freezing Level Height, (eh) Ice Water Path, (il) Surface Precipitation; with 0.04 degrees spatial resolution.
Remotesensing 13 04491 g003
Figure 4. Spatial representation of regions found by quantile analysis as a function of lightning density: T1 (<0.1 flash km−2 year−1), T2 (between 0.1 and 2.8 flash km−2 year−1); T3 (between 2.8 and 6.8 flash km−2 year−1) and T4 (above 6.8 flash km−2 year−1).
Remotesensing 13 04491 g004
Figure 5. Mean and error bar of clouds’ microphysical properties (a) Freezing Level Height, (b) Ice Water Path, (c) Convective Precipitation, (d) Rain Water Path, (e) Surface Precipitation as a function of tertile classes T1 (<0.1 flash km−2 year−1), T2 (between 0.1 and 2.8 flash km−2 year−1); T3 (between 2.8 and 6.8 flash km−2 year−1) and T4 (above 6.8 flash km−2 year−1).
Remotesensing 13 04491 g005
Figure 6. Tukey test results for NEB sub-regions by microphysical parameters of lightning-generating clouds (a) Freezing Level Height, (b) Ice Water Path, (c) Convective Precipitation, (d) Rain Water Path, (e) Surface Precipitation. Significant values (p-value < 0.1) are represented with shades of blue, while non-significant values have shades of red.
Remotesensing 13 04491 g006
Figure 7. Average reflectivity profiles (dBZ) as a function of the lightning density categories T1 (<0.1 flash km−2 year−1; black line); T2 (between 0.1 and 2.8 flash km−2 year−1; green line); T3 (between 2.8 and 6.8 flash km−2 year−1; blue line); and T4 (above 6.8 flash km−2 year−1; red line). The regions highlighted in shades of gray indicate the microphysical layers: warm (white), mixed (light gray) and glacial phase (dark gray).
Remotesensing 13 04491 g007
Table 1. Attributes of 2A-CLIM and 2A25 products.
FeaturePre-Boost
(before 7 August 2001)
Post-Boost
(after 24 August 2001)
Temporal coverage8 December 1997 to 7 August 200124 August 2001 to 8 April 2015
Temporal coverage used in this work1 January 1998 to 31 December 2013
Geographic coverageLatitude: 38° S–38° N/Longitude: 180° W–180° E
Temporal resolution~16 orbits/day
Spatial resolution~4.4 km~5.1 km
Variables used in this
work (Products)
Ice Water Path (2A-CLIM);
Convective Precipitation (2A-CLIM);
Rain Water Path (2A-CLIM);
Surface Precipitation (2A-CLIM);
Freezing Level Heigth (2A25);
Reflectivity (2A25).
Publisher’s Note: MDPI stays neutral with regard to jurisdictional claims in published maps and institutional affiliations.

