Article

Comparison of Multi-Year Reanalysis, Models, and Satellite Remote Sensing Products for Agricultural Drought Monitoring over South Asian Countries

1
School of Atmospheric Sciences, Nanjing University of Information Science and Technology, Nanjing 210044, China
2
Key Laboratory of Meteorological Disaster, Ministry of Education, Nanjing University of Information Science and Technology, Nanjing 210044, China
3
Collaborative Innovation Center on Forecast and Evaluation of Meteorological Disasters, Nanjing University of Information Science and Technology, Nanjing 210044, China
4
Lab of Environmental Remote Sensing (LERS), School of Marine Sciences, Nanjing University of Information Science and Technology, Nanjing 210044, China
5
Department of Natural Sciences, University of Karachi, Karachi 75270, Pakistan
6
Department of Agronomy, Faculty of Agriculture and Environment, The Islamia University Bahawalpur (IUB), Bahawalpur 63100, Pakistan
7
State Key Laboratory of Information Engineering in Surveying, Mapping and Remote Sensing (LIESMARS), Wuhan University, Wuhan 430079, China
*
Author to whom correspondence should be addressed.
Remote Sens. 2021, 13(16), 3294; https://doi.org/10.3390/rs13163294
Submission received: 10 July 2021 / Revised: 13 August 2021 / Accepted: 15 August 2021 / Published: 20 August 2021
(This article belongs to the Special Issue Remote Sensing in Irrigated Crop Water Stress Assessment)

Abstract

:
The substantial reliance of South Asia (SA) to rain-based agriculture makes the region susceptible to food scarcity due to droughts. Previously, most research on SA has emphasized the meteorological aspects with little consideration of agrarian drought impressions. The insufficient amount of in situ precipitation data across SA has also hindered thorough investigation in the agriculture sector. In recent times, models, satellite remote sensing, and reanalysis products have increased the amount of data. Hence, soil moisture, precipitation, terrestrial water storage (TWS), and vegetation condition index (VCI) products have been employed to illustrate SA droughts from 1982 to 2019 using a standardized index/anomaly approach. Besides, the relationships of these products towards crop production are evaluated using the annual national production of barley, maize, rice, and wheat by computing the yield anomaly index (YAI). Our findings indicate that MERRA-2, CPC, FLDAS (soil moisture), GPCC, and CHIRPS (precipitation) are alike and constant over the entire four regions of South Asia (northwest, southwest, northeast, and southeast). On the other hand, GLDAS and ERA5 remain poor when compared to other soil moisture products and identified drought conditions in regions one (northwest) and three (northeast). Likewise, TWS products such as MERRA-2 TWS and GRACE TWS (2002–2014) followed the patterns of ERA5 and GLDAS and presented divergent and inconsistent drought patterns. Furthermore, the vegetation condition index (VCI) remained less responsive in regions three (northeast) and four (southeast) only. Based on annual crop production data, MERRA-2, CPC, FLDAS, GPCC, and CHIRPS performed fairly well and indicated stronger and more significant associations (0.80 to 0.96) when compared to others. Thus, the current outcomes are imperative for gauging the deficient amount of data in the SA region, as they provide substitutes for agricultural drought monitoring.

1. Introduction

South Asia (defined as Pakistan, Bangladesh, India, Afghanistan, Nepal, Bhutan, and Sri Lanka) relies deeply on rain-fed subsistence agriculture, which is gradually becoming more susceptible to droughts [1,2,3]. South Asia (SA) is one of the most disaster-prone and densely populated regions in the world, comprising over one-fifth of the world’s population [4]. Population increases and frequent drought events have been leading issues that have furthered food shortages and water crises [5]. According to a recent study conducted by Zhai et al. [6], a significant increasing trend of droughts has been recorded over SA. Moreover, strong increases in average drought frequencies and durations have been projected. A drought is an abnormally dry climate period and is one of the most destructive natural hazard types, and droughts can be distinguished into hydrological, meteorological, and agricultural droughts [7]. An agrarian drought includes a discrepancy in accessible water that could compromise crop production [8], and this can have overwhelming effects on crop production and water supply [9]. About 31% of the agricultural lands of SA have been influenced by droughts during the past two decades, representing a severe hazard to the economic and social development of the region [10]. According to the World Economic Forum (WEF), a global annual economic loss of USD 6–8 billion is caused by agricultural droughts and related activities [11]. To increase security against droughts caused by global changes, it is essential to find comprehensive, reliable, and timely drought monitoring methods [10,12]. Inclusive descriptions of droughts in SA, like in several other regions worldwide, faces challenges when using ground-based precipitation datasets. For instance, rainfall variability (spatial) cannot be measured satisfactorily because of an uneven and sparse distribution of rain gauges [12]. Aadhar et al. [5] developed a high resolution (0.05°) precipitation (bias-corrected) data collection method which can be used for near real-time drought monitoring in SA. Additionally, breaks/gaps in records and poor proceedings in data handling confound the use of weather station data [9,13]. In many studies, ground/station-based precipitation datasets replaced with satellite, model output, and reanalysis products have provided consistent and reliable data with regional and global coverage at several spatial/temporal levels, which is considered satisfactory for drought detection and characterization [14]. Sharma et al. [15] evaluated satellite-based precipitation products in terms of gauge stations precipitation data and found that their performance was better for drought monitoring in Nepal. Similarly, a study carried by Bai et al. [16] showed consistent performance for satellite-based precipitation datasets for drought detection in China.
In addition to model outputs and satellite products, normalized difference vegetation index (NDVI) [17,18,19,20] and Gravity Recovery and Climate Experiment (GRACE) water storage datasets [12,21] have been used to assess drought. The NDVI has been used directly, or occasionally in a derivative form, such as a vegetation condition index (VCI), [22,23,24], in many studies to monitor the effects of a drought on agriculture. Many drought studies have been carried out in different regions of world and have been purely based on precipitation data [13,25,26]. The aforementioned studies and some others [27,28] have used standardized precipitation index (SPI), NDVI, and soil moisture (SM) products for agricultural drought assessment; however, for a region like SA, the majority of people depend upon rain-fed agriculture [1]. Further studies concentrating on crop production and agrarian drought influences would be more helpful to people in SA. Hence, the current study focuses on drought behaviors in agricultural regions in terms of soil moisture, precipitation, water storage, and NDVI data derived from satellite, model, and reanalysis products. Further, the existing study considers the effectiveness of products in the context of annual crop yields, which has not been of significant focus in prior studies.
To provide reliable information for agricultural drought detection when using various products, it is indispensable to recognize the most active agricultural drought indicators for the SA region. Consequently, the primary goals of study are: (1) to highlight/illustrate droughts in agricultural regions of countries in SA in terms of the spatial magnitude and severity by using satellite, model, and reanalysis products. Further, (2) to assess how well the data are related to agricultural droughts in the context of comparison with crop production data. This is a unique and comprehensive study regarding the performance of satellite remote sensing, reanalysis, and model products. Besides, GRACE satellite data are used for agricultural drought detection over all countries in SA for the first time here, thus proving the link between total water storage and crop yields.

2. Materials and Methods
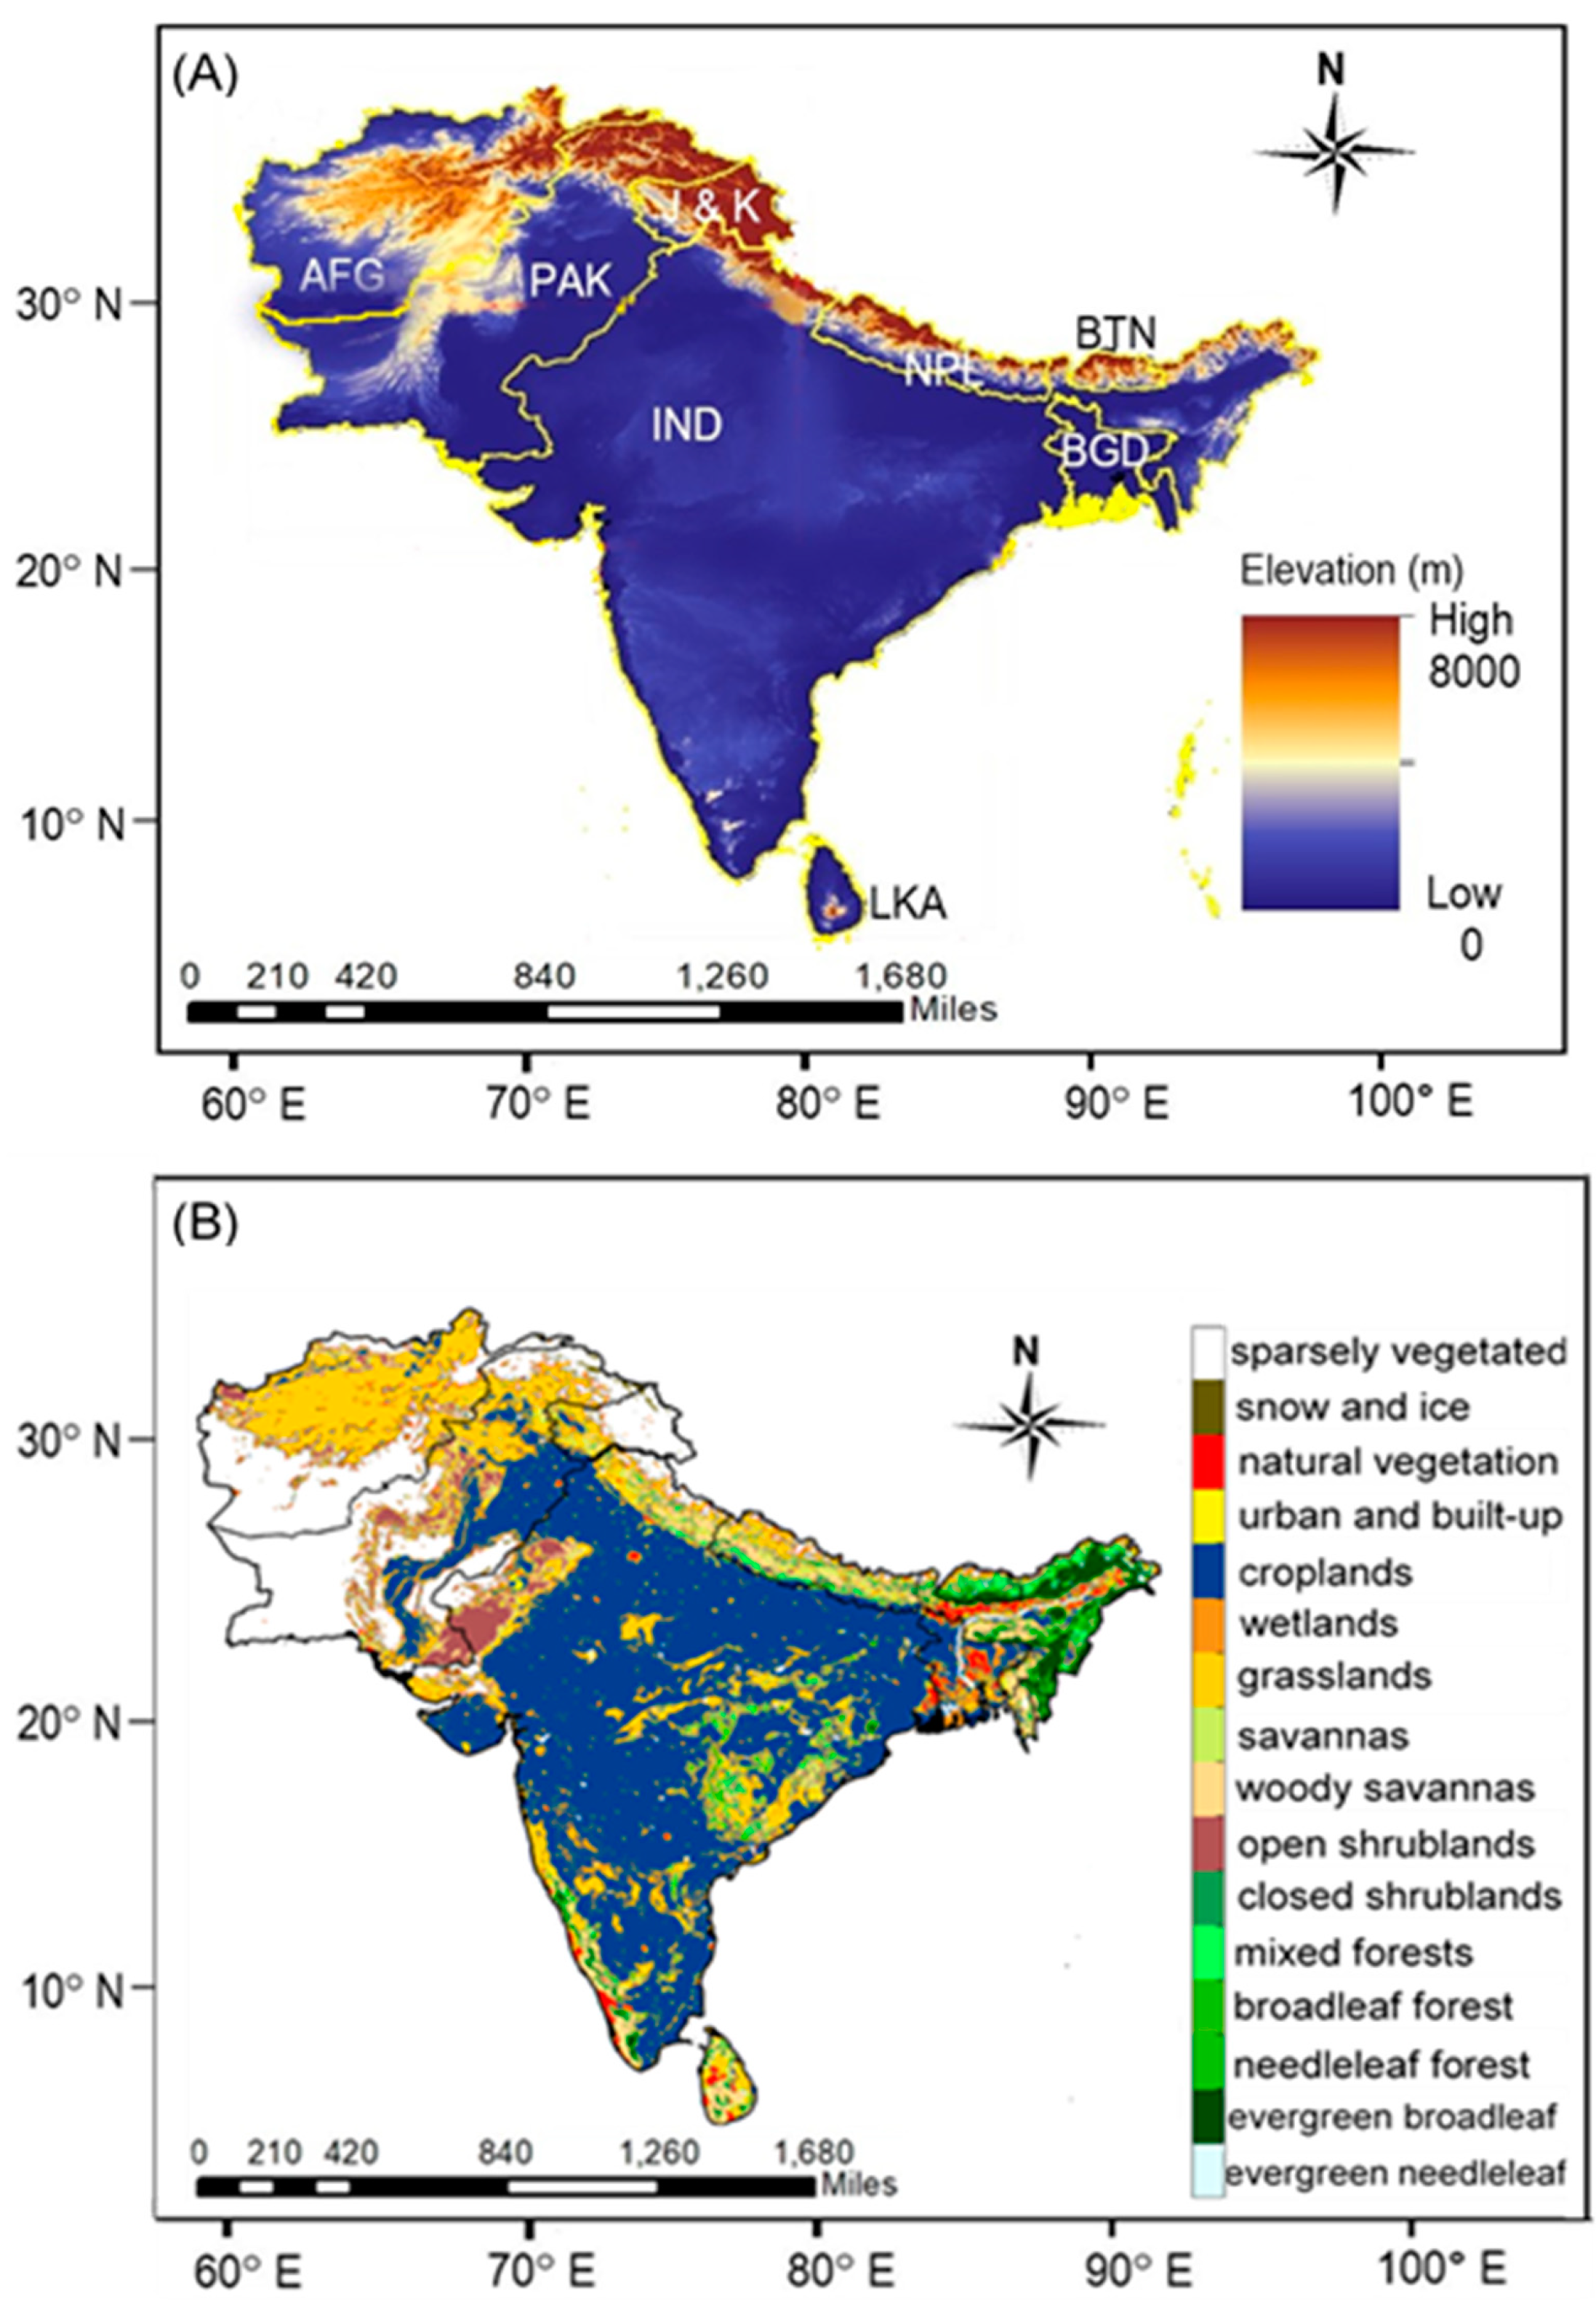
2.1. Study Area

This study focuses on SA, which is situated between 5° to 40°N and 60° to 100°E (Figure 1A). This area has a diverse range of climatic zones, including tropical, sub-tropical, mountainous, humid, alpine, dry land, and desert areas with bimodal rainfall (summer and winter monsoon) regimes. SA features four seasons (spring, summer, autumn, and winter). This region is famous for its reversal of winds during the monsoon season. Monsoon rainfall characteristics vary between areas in terms of the spatial and temporal scales [2]. The summer monsoon season, along with southwesterly winds, represents about 75% of annual rainfall [29]. Besides, the winter monsoon season typically covers a vast area, including the northern and northwest regions. The western disturbances caused by the Mediterranean Sea and Atlantic Ocean (MSAO) remain influential in these areas during the winter season. South Asian agriculture mainly depends upon the summer monsoon season. About 70% of people in SA related with direct or indirect agricultural practices. The major source of income in SA is agriculture, which depends on rainfall patterns [1]. India is the leading country in South Asia and second largest country worldwide, having 160 million hectares of agricultural land [30]. Pakistan is the second largest country in SA and contributes about 23.3 million hectares of land in the agriculture sector [31]. Bangladesh has 9.3 million hectares of agricultural land and Afghanistan has 8 million hectares [32]. The other countries in SA contribute far lower proportions. South Asia has a total land area of 5.2 million km2 [10]. Figure 1A demonstrates the typical elevation above sea level and the overall geographical location, while Figure 1B indicates MODIS-based land cover for SA.

2.2. Data

2.2.1. Precipitation

(I).
The Climate Hazard Group Infrared Precipitation with Stations (CHIRPS) dataset provides global data (50°N–50°S) at monthly, five-day, and daily intervals with a 0.05° spatial resolution. CHIRPS data comprise the combination of satellite estimation and in-situ/station observation data based upon cold cloud duration (CCD) data. Primarily, CHIRPS data have been produced for agricultural drought monitoring [33]. Monthly product version 2.0 was downloaded from ftp://ftp.chg.ucsb.edu/pub/org/chg/products/CHIRPS-2.0/ (accessed on 9 February 2021) for the period 1982 to 2019. CHIRPS precipitation data are frequently used for hydrology and drought-related studies [12,28,34].
(II).
The Global Precipitation Climatology Center (GPCC) reanalysis dataset, version 7, at a monthly basis with a 0.5° spatial resolution, has been accessed via ftp://ftp.dwd.de/pub/data/gpcc/html/fulldata_v7_doi_download.html (accessed on 12 February 2021) from 1982 to 2019. Additionally, this product is gauge-gridded based on 75,000 global rain gauge stations and has been used for drought monitoring [12].

2.2.2. Soil Moisture

(I).
The second Modern-Era Retrospective Analysis for Research and Application (MERRA-2) soil moisture (reanalysis) product is a replacement of the original MERRA reanalysis product of the US National Aeronautics and Space Administration [35]. The monthly soil moisture product, having a 0.625° by 0.5° root zone, has been downloaded from https://gmao.gsfc.nasa.gov/reanalysis/MERRA-2/data_access/ (accessed on 12 February 2021) for the duration of 1982 to 2019. Due to better data forcing (observation-corrected precipitation) and an upgraded assimilation system (upgraded canopy interception), MERRA-2 provides enhanced soil moisture (SM) evaluation when compared to MERRA [36].
(II).
The ERA5 reanalysis dataset is a replacement of ERA-Interim (reanalysis) dataset and is based on a four-dimensional integration which enhances essential dynamics and model physics [37]. The European Center for Medium Range Weather Forecasts offers a temporal series of various variables from 1981 to the present. The monthly ERA5 average reanalysis soil moisture (SM) product is available with a regular grid size of 0.1° × 0.1° [38]. These data have been used for the period of 1982–2019 as per the https://www.ecmwf.int/en/forecasts/datasets website (accessed on 6 march 2021).
(III).
The Climate Prediction Center (CPC) provides several SM products. Soil moisture version 2 data, at a monthly basis with a 0.5° spatial resolution, are used in the existing study for the period from 1982 to 2019. This dataset was acquired from the laboratory database of the National Oceanic and Atmospheric Administration website http://www.esrl.noaa.gov/psd/data/gridded/data.cpcsoil.html (accessed on 16 February 2021). This dataset is considered in present study because it includes in situ precipitation as an input and thus is considered to provide data that would be very close to the real soil moisture data [39].
(IV).
The Global Land Assimilation System (GLDAS), with the soil moisture version 2 dataset, was used at a monthly basis with a 1° spatial resolution as downloaded from http://disc.sci.gsfc.nasa.gov/services/grads-gds/glades (accessed on 20 February 2021) for the period of 1982 to 2014. All three layers of soil moisture were aggregated as one for further processing [40].
(V).
The Famine Early Warning System Network (FEWS NET) Land Data Assimilation System (FLDAS) is a conventional system of NASA that has been upgraded to work with domains and data streams and provide monitoring and forecasting within the context of nutrition safety estimation in data-sparse and underdeveloped countries [12]. The VIC and NOAH land surface models and supplement FLDAS. The FLDAS NOAH soil moisture product, at a monthly basis with a 0.1° spatial resolution, was downloaded for the period of 1982 to 2019 from ftp://hydro1.sci.gsfc.nasa.gov/data/s4pa/FLDAS/FLDAS_NOAH01_C_EA_M.001/ (accessed on 26 February 2021). This dataset resulted from an arrangement of the CHIRPS and MERA-2 datasets. FLDAS and GLDAS (NOAH model) were considered because of their extensive usage by atmospheric and land modelling societies. Consequently, the model limitations are satisfactory reliable and have been tested well. Additionally, several studies have used these limitations around the world [25,41,42].

2.2.3. Terrestrial Water Storage (TWS)

(I).
Gravity Recovery and Climate Experiment (GRACE) satellite operations have been providing monthly temporal gravity variations (global) in terms of spherical harmonic coefficients (SHCs) since 2002 [21,43]. The Center for Space Research’s (CSR) release five (RL05) monthly spherical harmonic coefficients, downloaded from http://icgem.gfz-potsdam.de/ICGEM/shms/monthly/csr-rl05/ (accessed on 20 February 2021) for the period of 2002 to 2017. The GRACE terrestrial water storage measurements agree with the geophysical model and Earth rotation-derived variations [44], and hence are used globally for drought-related studies [45,46].
(II).
The MERRA-2 land water storage product, used in addition to GRACE, was acquired from https://gmao.gsfc.nasa.gov/reanalysis/MERRA-2/data_access/ (accessed on 26 February 2021) on a monthly basis with a 0.5° latitude to 0.625° longitude resolution. This product is commonly used for agricultural drought monitoring in the period of 2002–2019 [12].

2.2.4. Normalized Difference Vegetation Index

NOAA Advanced Very High Resolution Radiometer (AVHRR) normalized difference vegetation index (NDVI) data, with 15-day temporal and 0.083° × 0.083° spatial resolutions, have been considered to calculate VCI data [47]. The data were downloaded from http://ecocast.arc.nasa.gov/data/pub/gimms/3g.v0/ (accessed on 28 February 2021) for the period of 1982 to 2019. NDVI data are advantageous and are extensively used in local and global scales to characterize weather-related vegetation stresses [9,17,18,48].

2.2.5. Crop Yield

Annual barley, maize, rice, and wheat yield data for Afghanistan, Pakistan, India, Bangladesh, Nepal, and Bhutan for 1982 to 2019 were used, obtained from the Food and Agricultural Organization (FAO) data portal http://www.fao.org/faostat/en/#data/QC (accessed on 20 February 2021). For Sri Lanka, the same crop product data could not be acquired because of the unavailability of datasets. These data are regularly used as the most credible crop production data [12,49] to assess the efficiency of model and satellite products in terms of monitoring agrarian droughts. The summary of the datasets is given in Table 1.

2.3. Methods

Because of the connection between precipitation anomalies and agricultural drought [38,51], standardized indices (SI) were calculated, e.g., standardized precipitation indices (SPI) for CHIRPS and GPCC precipitation data products and standardized soil moisture indices (SSMI) for the MERRA-2, ERA5, GLDAS, FLDAS, and CPC soil moisture data products. Likewise, a standardized terrestrial water storage index (TWSI) for MERRA-2 terrestrial water storage data was computed to characterize agricultural droughts [63,64]; however, standardized anomaly (SA)/Z-scores were calculated for the GRACE water storage product because of the short time period from 2002–2017 [12]. The subsequent standardized indices (SIs) and standardized anomalies (SAs) were subjected to k-means clustering analysis to identify the main temporal and spatial occurrences over homogenous sub-regions. Finally, proportional variance and correlation in each region was assessed, along with the relationships between field/crop data and significant testing at 0.05 significance level. The SPI, SSMI, TWSI, SA, and VCI conditions are only presented and discussed here for the June to August period. The scale and duration were taken under consideration of South Asian agriculture depending upon monsoon rainfall [65].
Datasets with different resolutions cannot be directly processed together [66,67,68,69]. All datasets other than GLDAS and GRACE were aggregated spatially at 1° by 1° resolution before standardization in order to maintain uniformity. Comparisons of agricultural drought information were primarily related to several datasets with the same variables, such as the soil moisture, precipitation product, and water storage product datasets as the existing study is completely focused on agricultural droughts over the region. The cropland cells were extracted from the MODIS land cover dataset, then keeping those cells as a standard for all other datasets (CHIRPS, GPCC, MERRA-2, CPC, FLDAS, GLDAS, ERA5, MERRA-2 TWS, GRACE TWS and AVHRR-VCI) during filtering/extraction.

2.3.1. Standardized Precipitation Index (SPI)

Precipitation is considered an essential constituent for long-term drought monitoring and estimation in any region of interest. The use of such indices is regarded as an ingenious standardized approach based on precipitation scarcity [68]. The SPI is the most important and frequently used index for drought monitoring [15,70,71,72,73]. This index computes a gamma probability distribution function for a precipitation time series. Furthermore, it involves the transformation of accumulated gamma probability to a cumulative distribution function for a standard normal distribution [74]. Because of the sensitivity in the calculated SPI values to the fitted parametric distribution, a non-parametric SPI fitting approach has been applied in the current study via use of the Standardized Drought Analysis Toolbox (SDAT) [74]. The various SPI drought intensities [12,75] used to characterize droughts are given in Table 2. The SDAT offers a widespread outline for the origins of non-parametric univariate and multivariate standardized indices (SI). A non-parametric framework is typically used for deriving non-parametric standardized drought indices against various land surface and climate variables, such as precipitation, soil moisture, humidity, and terrestrial water storage. The mathematical concept regarding the calculation of indices behind SDAT is given by Equations (1) and (2) [12,74]:
  SI = ϕ 1   ( p )
where ϕ represents a standardized normal distribution function and p is the probability, which can be calculated using Equation (2):
p ( xi ) = i 0.44 n + 0.12  
where p(xi) is the empirical probability, i indicates the rank of non-zero data (precipitation, soil moisture, and terrestrial water storage) from the smallest to largest, while n denotes the sample size. Standardized indices can be computed by moving the outputs of Equation (2) into Equation (1). The subsequent indices, i.e., the SSMI, SPI, and standardized terrestrial water storage index (TWSI), were computed using similar approaches. Moreover, the same drought categories (Table 2) were used for the SSMI and TWSI. The spatial patterns were scaled in the form of ±1. Thus, time-based assessment indicated the genuine magnitude (Table 2) of SI/SA, where spatial patterns have values near ±1. Interpretation of the spatial patterns has been taken under consideration with the context of temporal evaluation and indicates spatial drought development pattern at any time when the temporal values of evaluation drop below −0.84 [12].

2.3.2. Standardized Anomalies (SA)

For GRACE data products, SAs were computed instead of Sis in order to categorize agricultural drought. This was because the GRACE products feature short timeframes. Here, TWSI was obtained like SPI [12]. The anomalies were computed for 3 months, removing the monthly mean, and then dividing by the standard deviation [76] as follows:
XYabc = Xabc 1 n   c = 1 n Xabc σ ab
where XYabc specifies the standardized TWS (monthly) for location a, month b, and year c; Xabc is the average TWS (monthly) for location a, month b, and year c; and n demonstrates the length of years; however, σab is the standard deviation (long-term) for location a, month b, and year c. The resulting SAs (z-scores) indicate the deviations of TWS near mean values and are typically used to monitor droughts globally [64,77,78]. Index values <0 designate drought conditions and values >0 indicate wet conditions, while a value of 0 indicates average conditions [12,64]. To validate the uniformity between the SA and SI data in terms of characterizing agricultural droughts over South Asia, CHIRPS-derived SPI and CHIRPS-derived SA decompositions (spatiotemporal) were compared over the study region, showing a parallel drought pattern. Additionally, a significant positive correlation (>0.90) was seen between the SI and SA temporal patterns. Because of the close bond/association between the SI and SA data, the SPI drought categories (Table 2) were considered to sufficiently distinguish droughts [12,64].

2.3.3. Vegetation Condition Index (VCI)

The VCI approach has been used to achieve greater precision and strength in determining drought verdicts as it is advantageous to indicate weather-linked vegetation stress [9,20,24,47]. Droughts based on vegetation are closely associated with climatic impacts. Higher VCI values denote wet or stable moisture contents, representing unstressed vegetation conditions, while lower values demonstrate vegetation stress or drought [20]. The VCI data were calculated by using Equation (4):
VCI = NDVIi NDVImin NDVI   max NDVImin 100
The NDVIi represents a monthly/yearly value of the NDVI, while NDVImin and NDVImax are the long-term minimum and maximum values of NDVI, respectively. The AVHRR NDVI data considered in this study are used globally for drought-related studies.

2.3.4. K-Means Clustering Algorithm

South Asia has multifaceted climatic regimes, where precipitation fluctuates considerably over the entire region [10]. Moreover, the region can also be affected other factors, such as the given topography, landscape, and seaside locality [79]. A K-means clustering technique was employed with three-month sets of SPI, SSMI, TWSI, and VCI data to assess drought occurrence over different homogenous sub-regions. The algorithm generates clusters with the aim of: (I) decreasing inconsistency with number of clusters k; and (II) increasing the erraticism of each centroid amongst all data. The algorithm provides better partition outputs, particularly when applied against a larger number of grids. In this algorithm, the data points were assigned to a cluster in such a manner that the sum of the squared distance between the data points and centroid would be at a minimum. Less variation within clusters leads to more similar data points being located within the same cluster. The resulting clusters were used to divide large regions into sub-regions. Thus, this study followed the same pattern to divide the SA region. The names of the regions (northwest, southwest, northeast, and southeast) were given based on their locations in the South Asia region. This method is used worldwide, such as by Santos et al., who used k-means clustering in Portugal for the spatial and temporal monitoring of drought patterns [80]. Furthermore, Li et al. [81] have used k-means clustering in China.

2.3.5. Correlation between Crop Yield Anomaly (YAI) and Drought Indices

Scientific investigations based on remote sensing datasets pertaining to agricultural drought assessments require validation in order to understand the result certainty. Typically, ground/field-based measurements are considered for validation. As crop yield data are available at the country level, SIs/SAs were re-calculated against each country. In the current study, major crop statistics for wheat, maize, rice, and barley were used from 1982–2019. Consequently, a long-term yield anomaly index (YAI) over each of the countries in the study region was performed [65]. YAI values were computed to find the deviations in yield for specific years. Firstly, this approach was applied for each year separately. Secondly, the results were used to further identify an overall connotation amongst the YAI and drought indices. Generally, crop production experiences increasing trends because of advances in adaptation and technology in agriculture. Thus, a linear regression technique was applied to remove trends from the data [82]. This index can be calculated using the equation [65,83] given below:
YAI = ( γ     μ ) σ      
where γ denotes the yield of a precise year, whereas μ indicates the average (long-term) yield; however, σ signifies the standard deviation. Besides, the correlation matrix among drought indices, percentage variance, significant testing at a 0.05 significance level, and general order of products based on their performance in each region were considered.

3. Results and Discussion

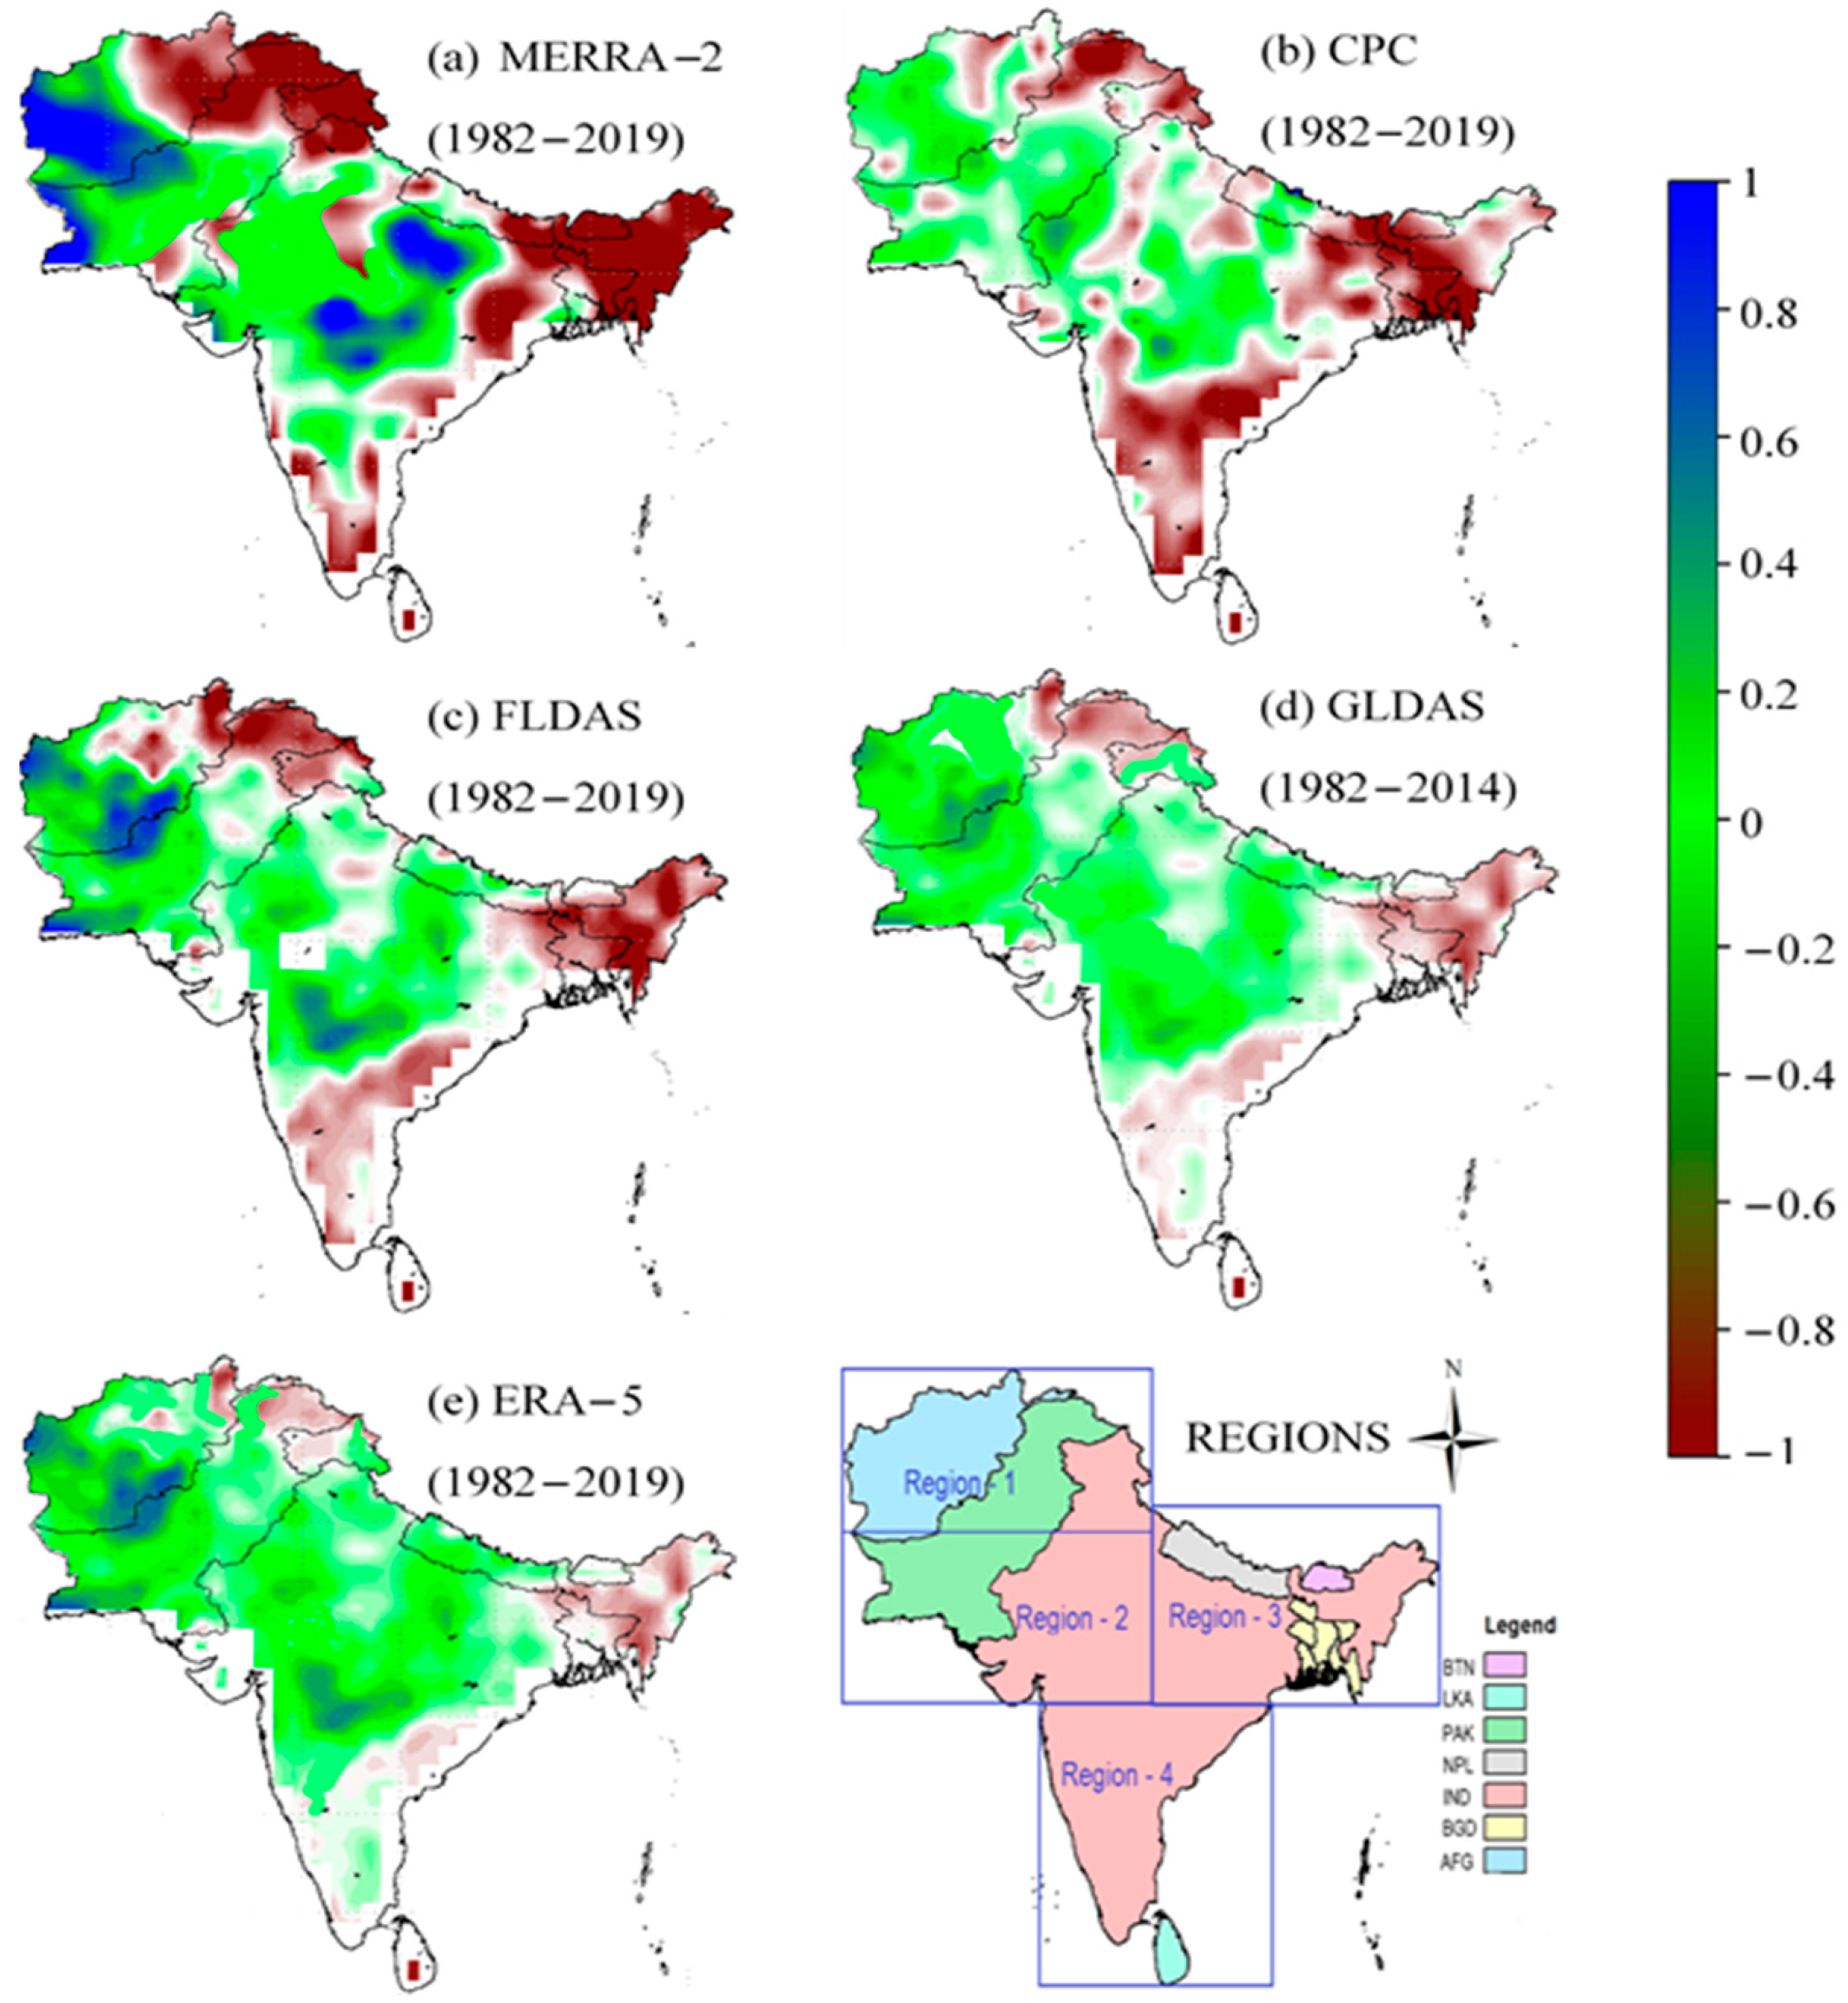
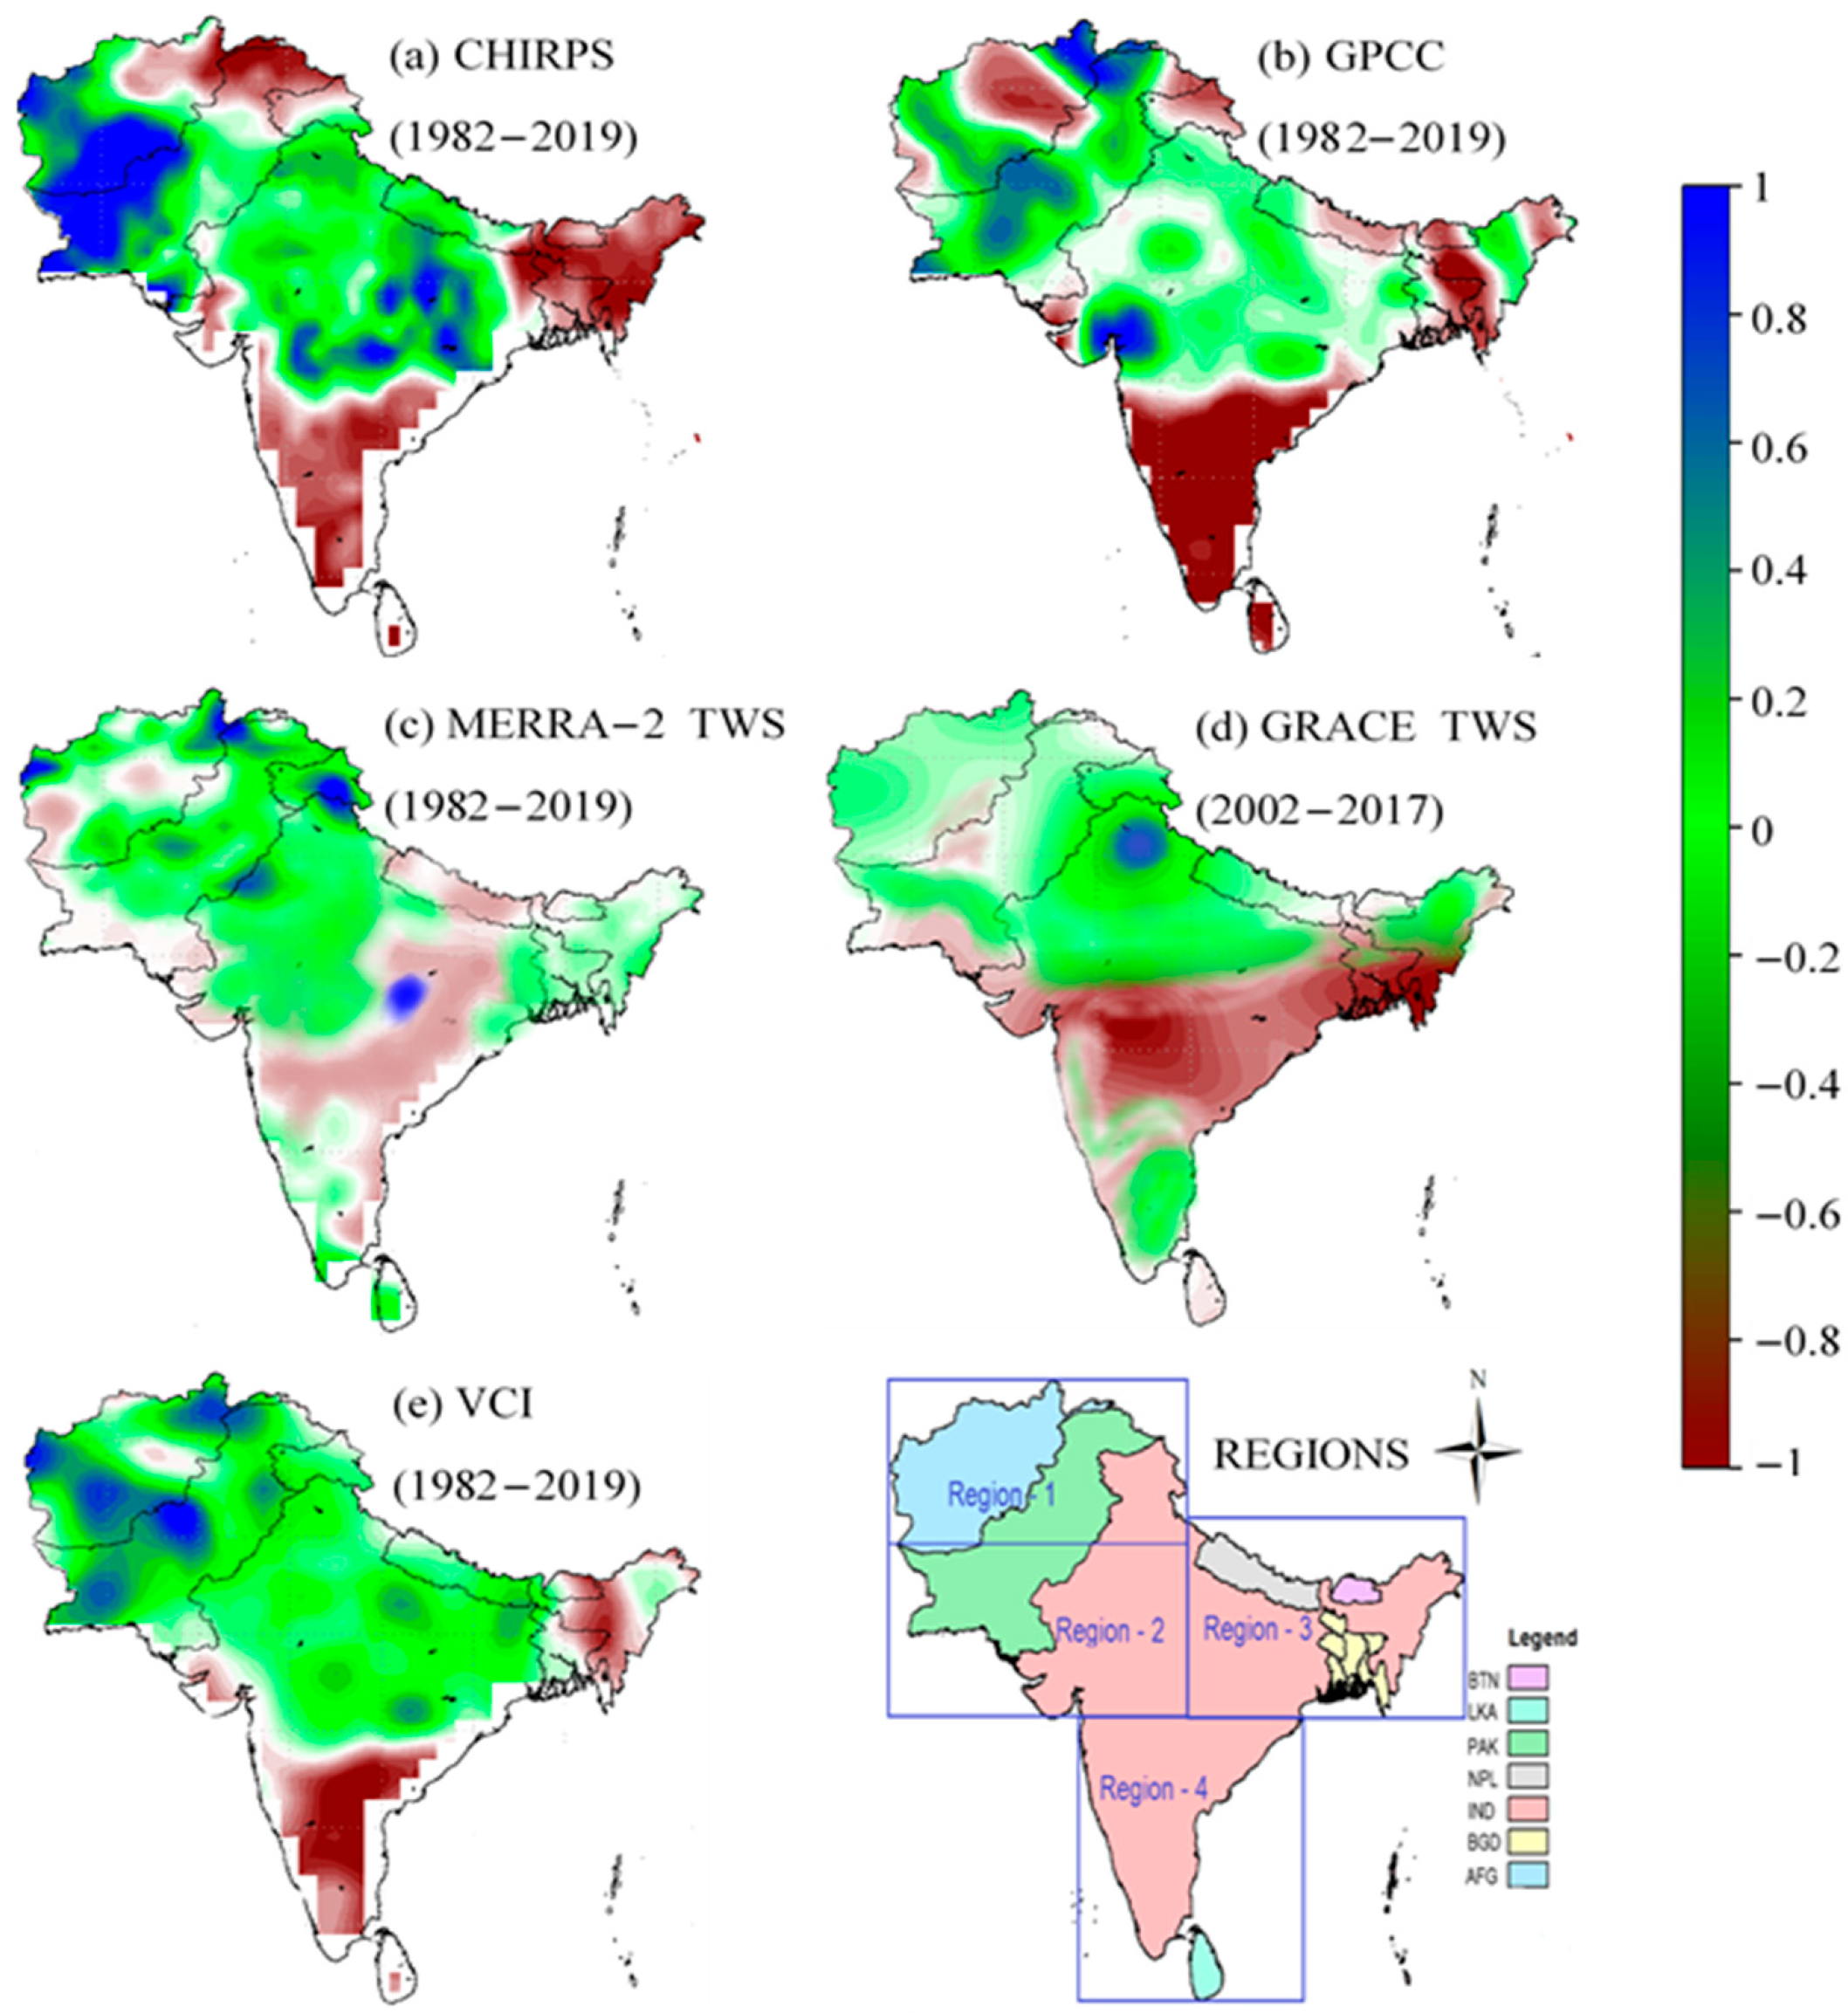
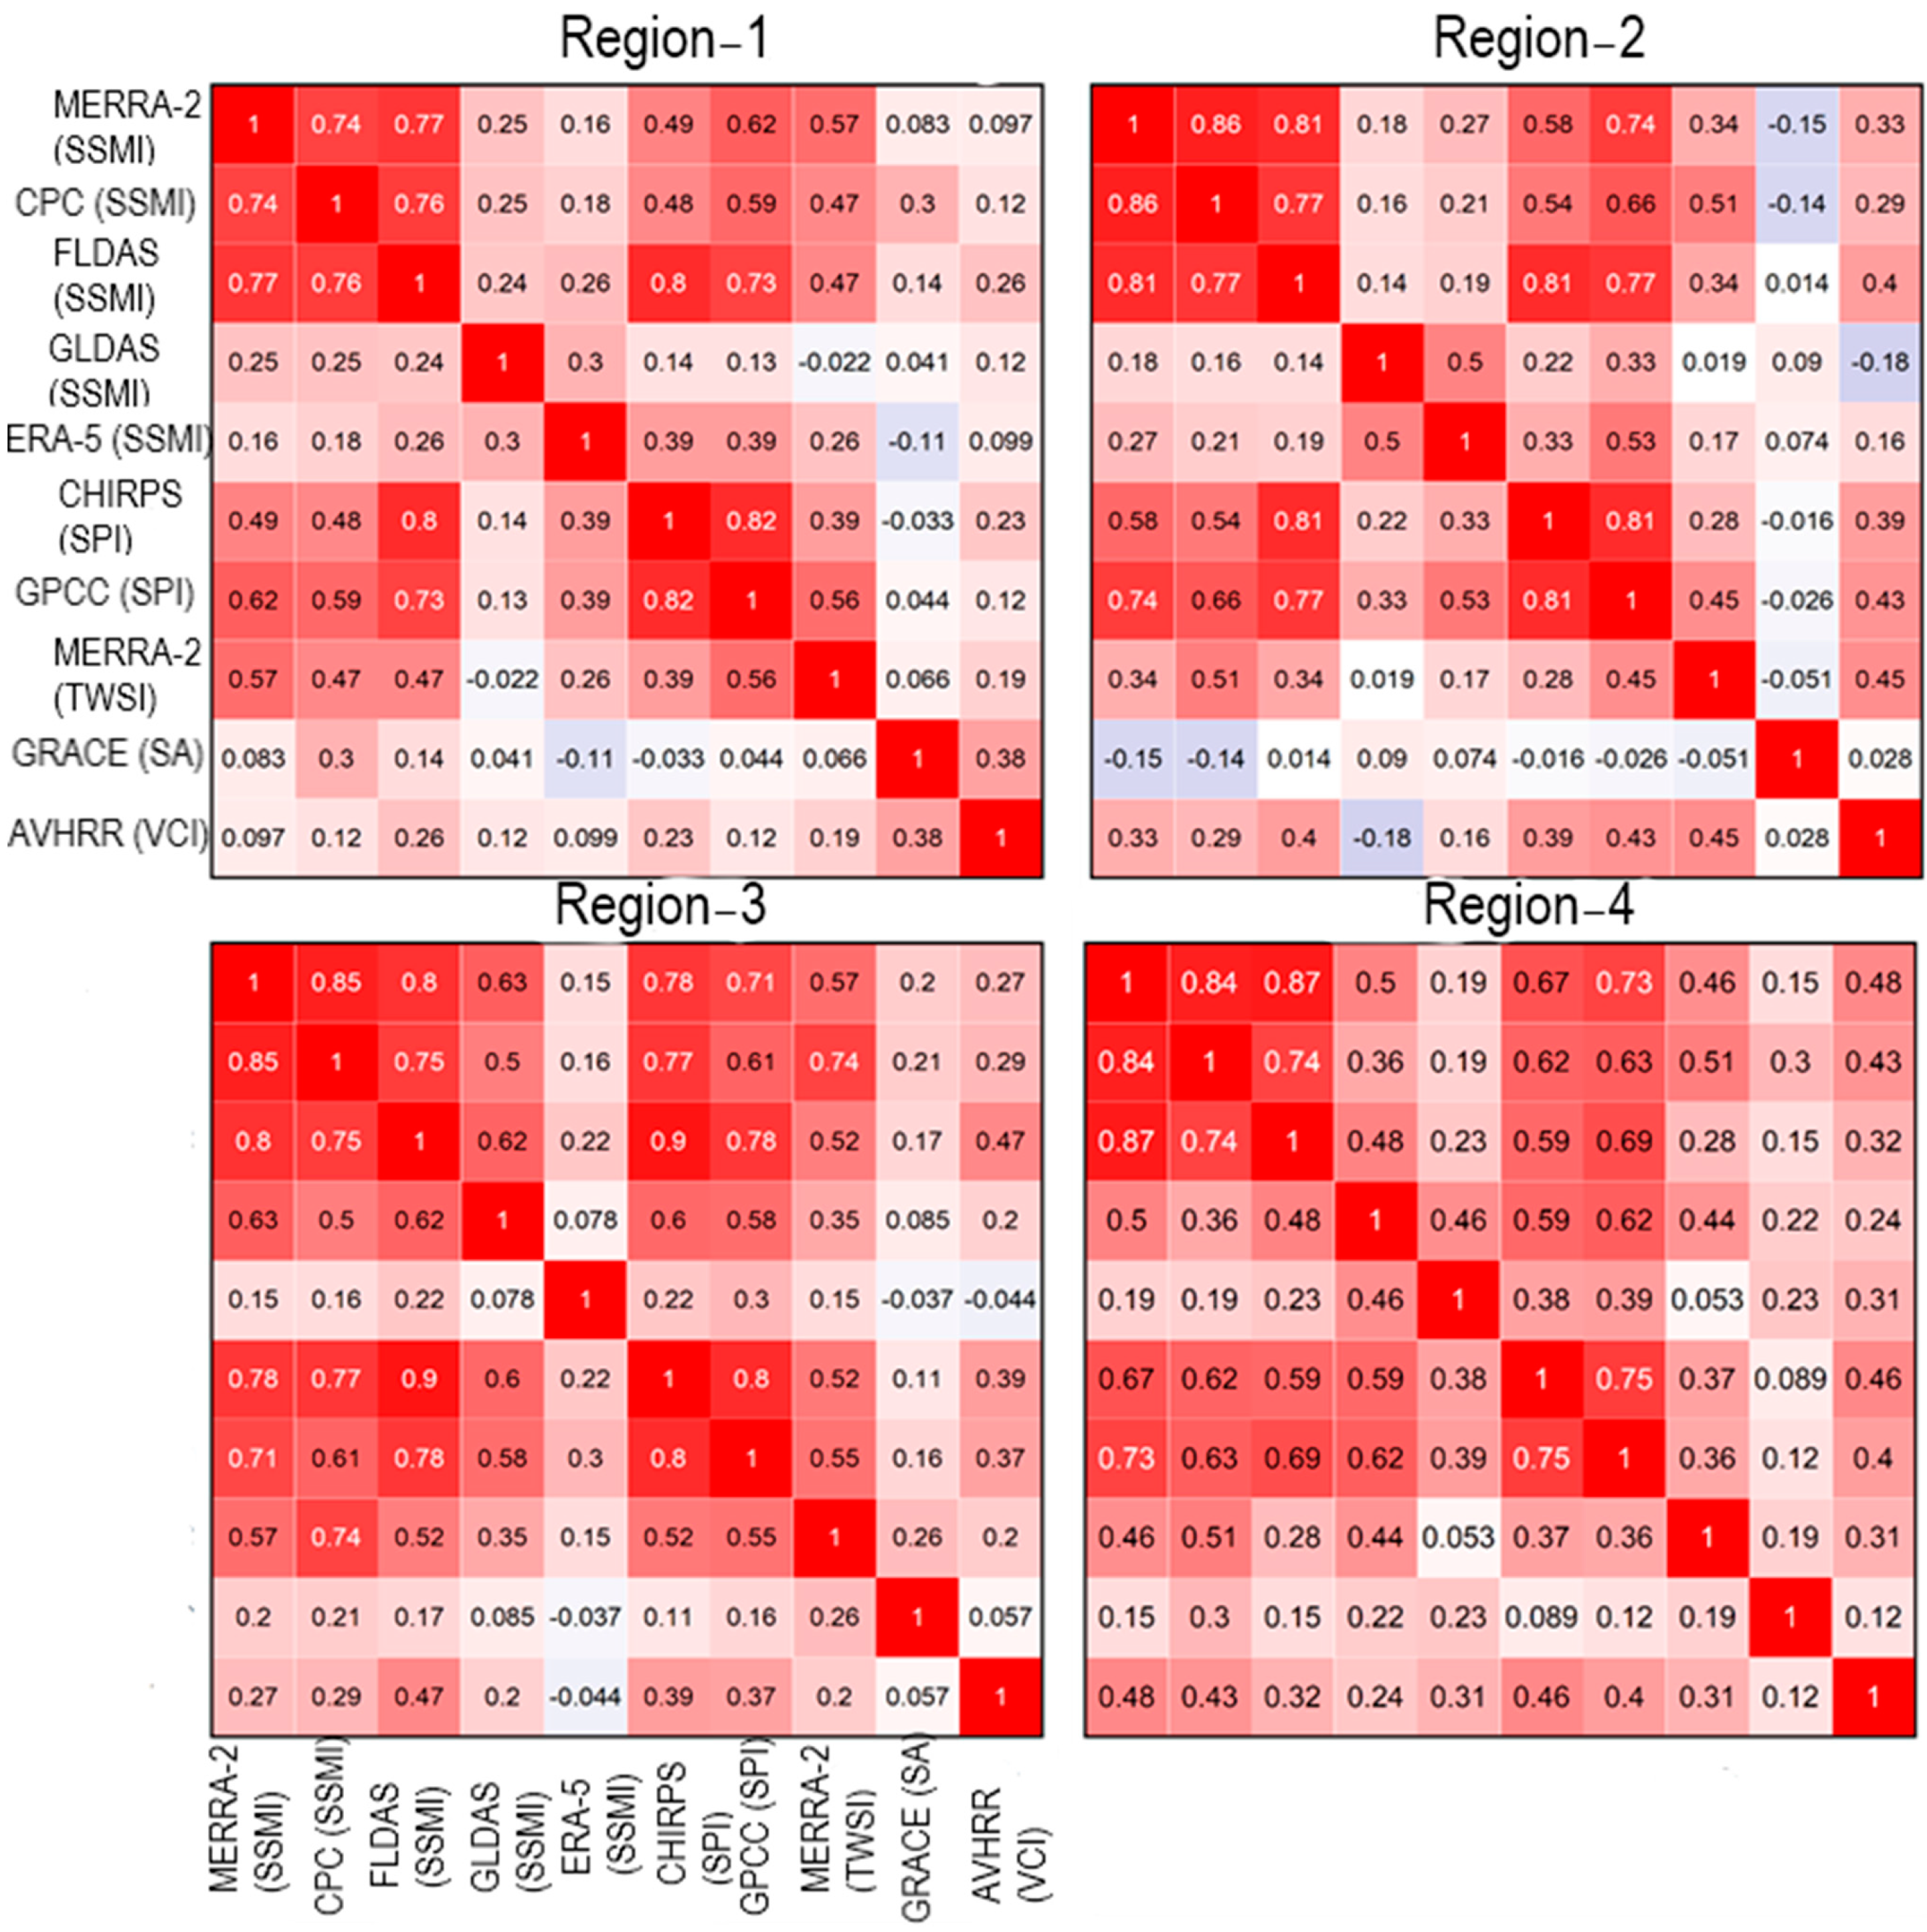
3.1. Spatial Variability

The four most substantial components (four regions) of the study area in terms of explaining variability indicated separate patterns (spatial) for all datasets (Figure 2 and Figure 3). The MERRA-2, CPC, FLDAS (soil moisture), CHIRPS, and GPCC (precipitation) data remained almost alike and constant over the entire four regions of South Asia; however, in the case of the ERA5 and GLDAS data, the spatial patterns of the standardized soil moisture indexes (SSMI) were dissimilar when compared to the other SM products (Figure 2). Equally, the standardized terrestrial water storage index (TWSI) of MERRA-2 and GRACE products indicated different patterns for regions one and three (Figure 3). This could be endorsed to the circumstance that region two covers southern and southwestern Pakistan and almost all of western India. This region represents the core belt of the typical monsoon area and hence has consistent rainfall, causing smaller discrepancies to be produced [83,84]. On the other hand, region four comprises an entire region of southern India and Sri Lanka; however, this region features highly variability because of dry and wet extremes [2], thus representing significant variations in the SI/SA spatial patterns.
The vegetation condition index is only presented with the spatial drought pattern in regions three and four (Figure 3). This is because vegetation-based indices are only associated with green plant biomass. Hence, such indices are considered lethargic and less receptive to climatic variables [85]. Table 3 shows the topographical coverage of study region. The total variance of SI/SA for all corresponding products in all regions was explained to be between 22.71% (ERA5) to 84.43% (MERRA-2 TWS). Most of the products indicated the highest or lowest discrepancy over the study region, as given in Table 4.

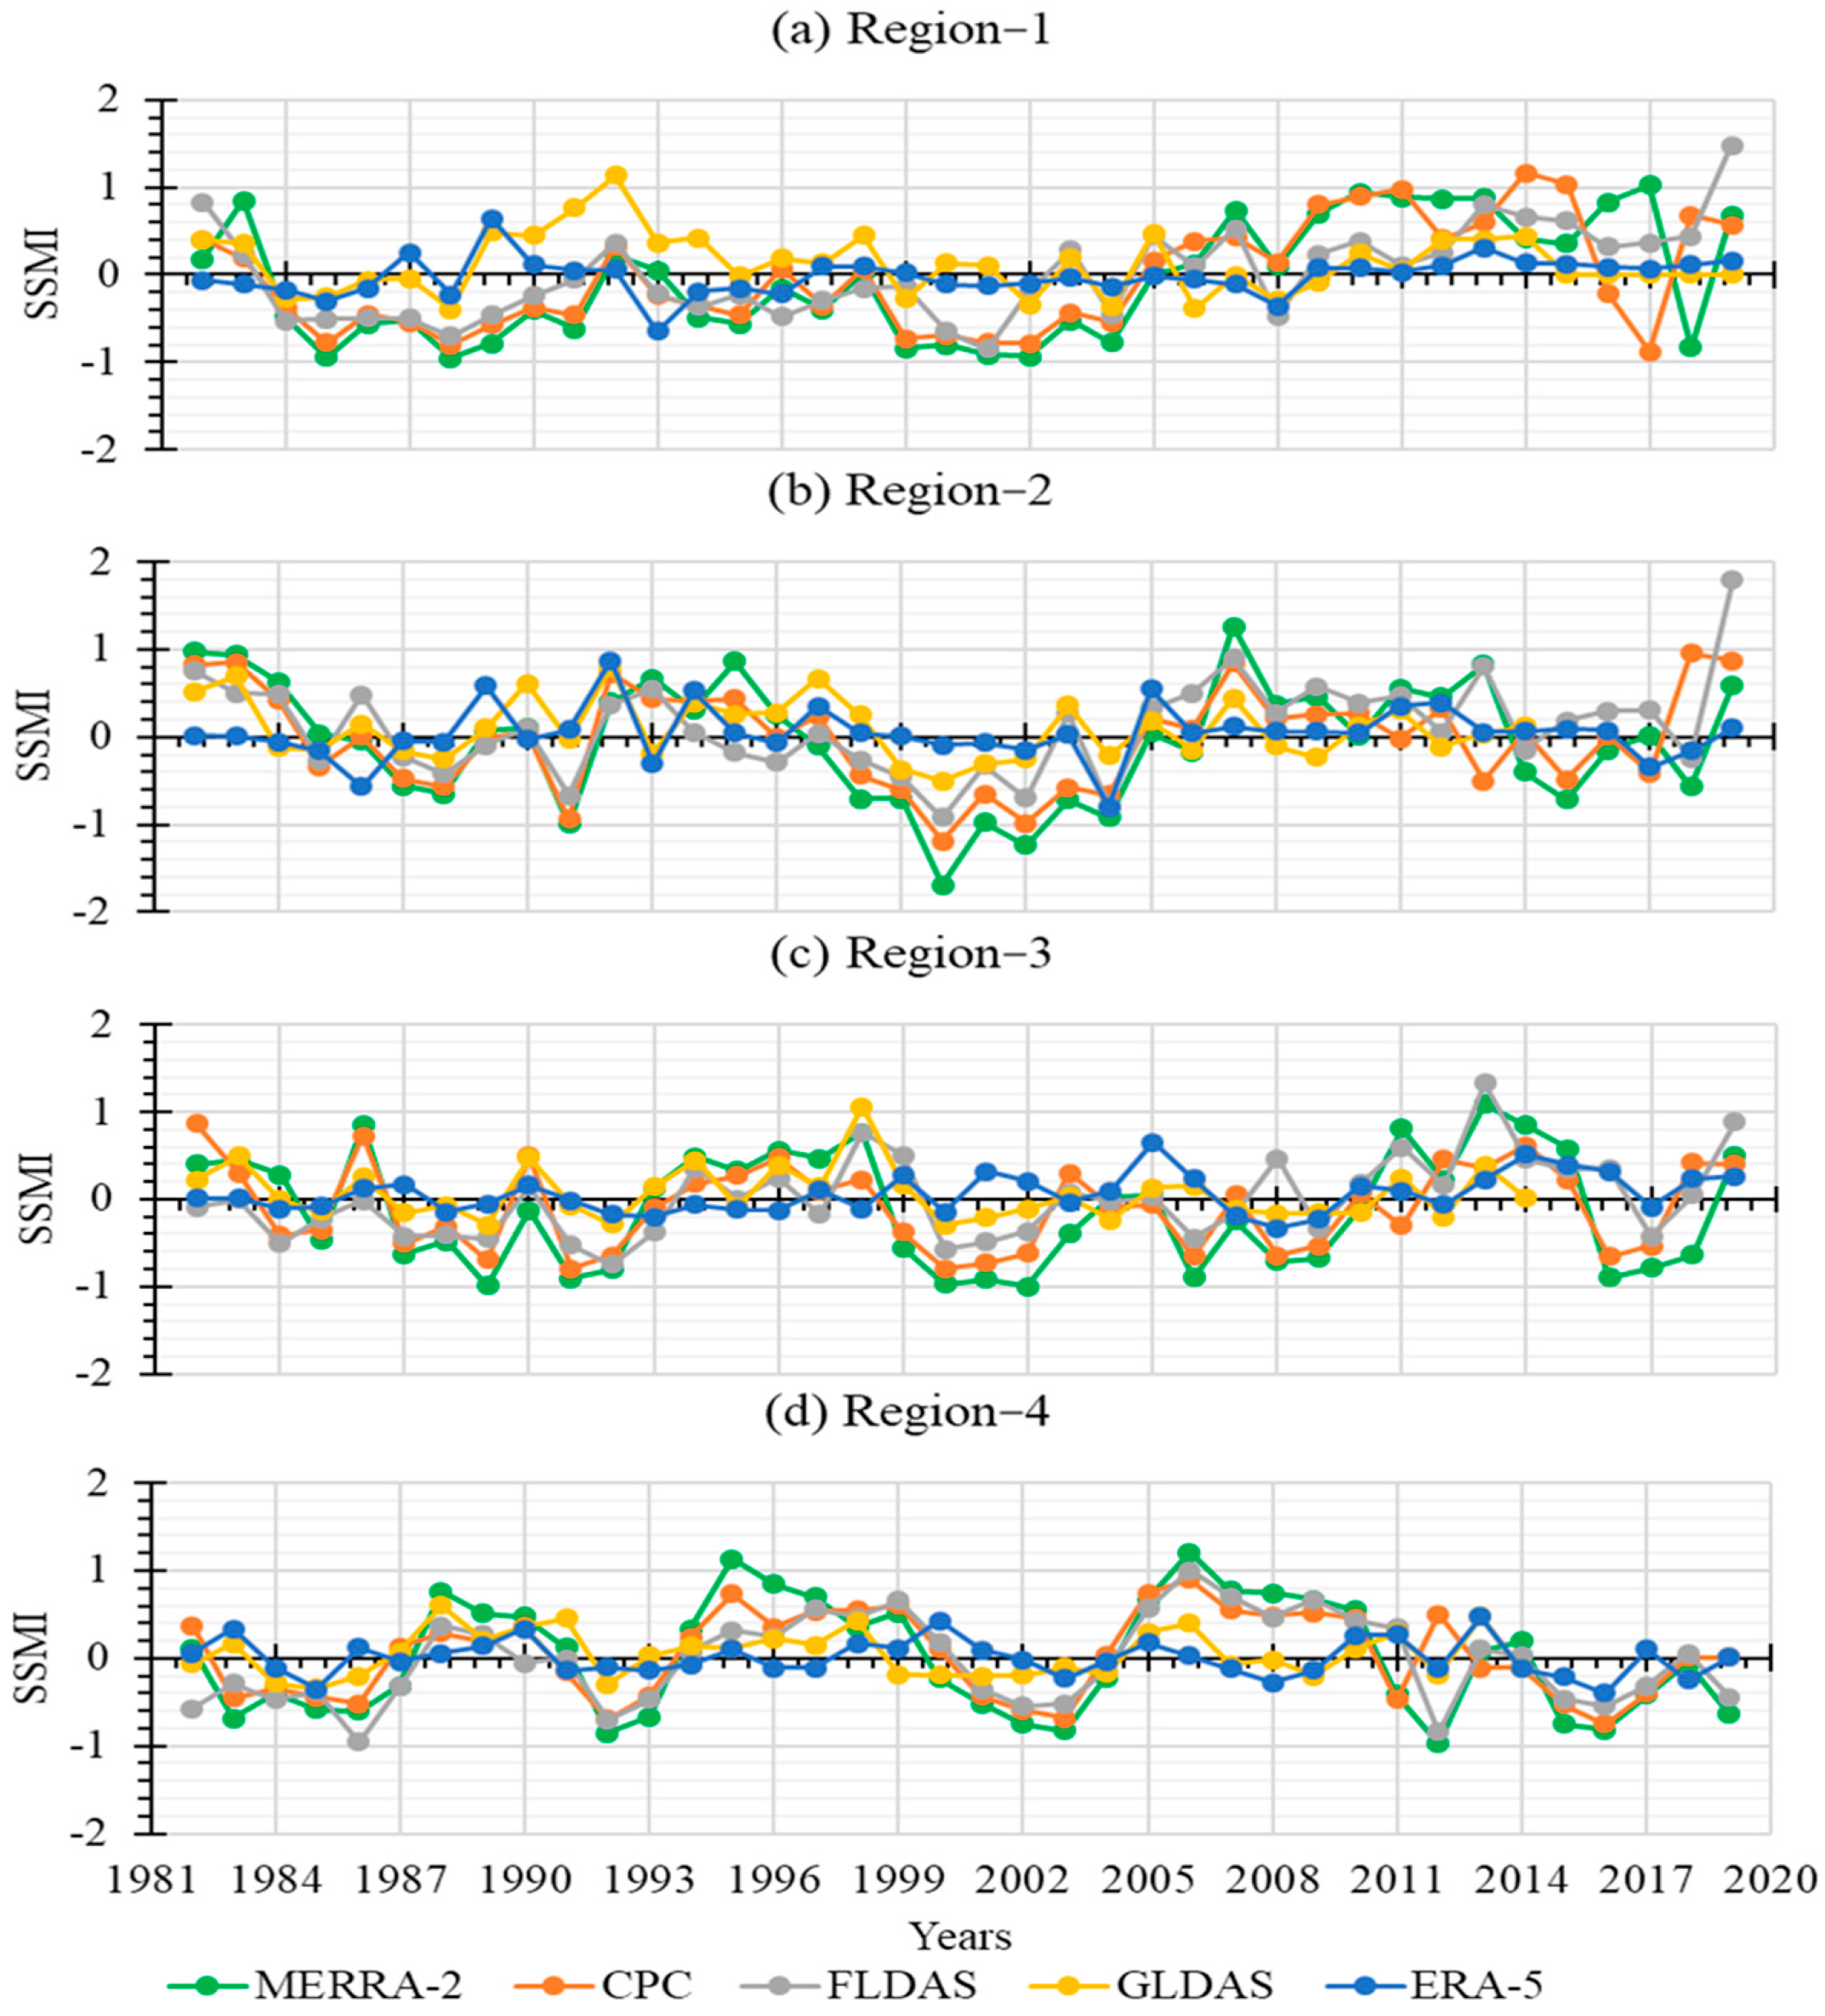
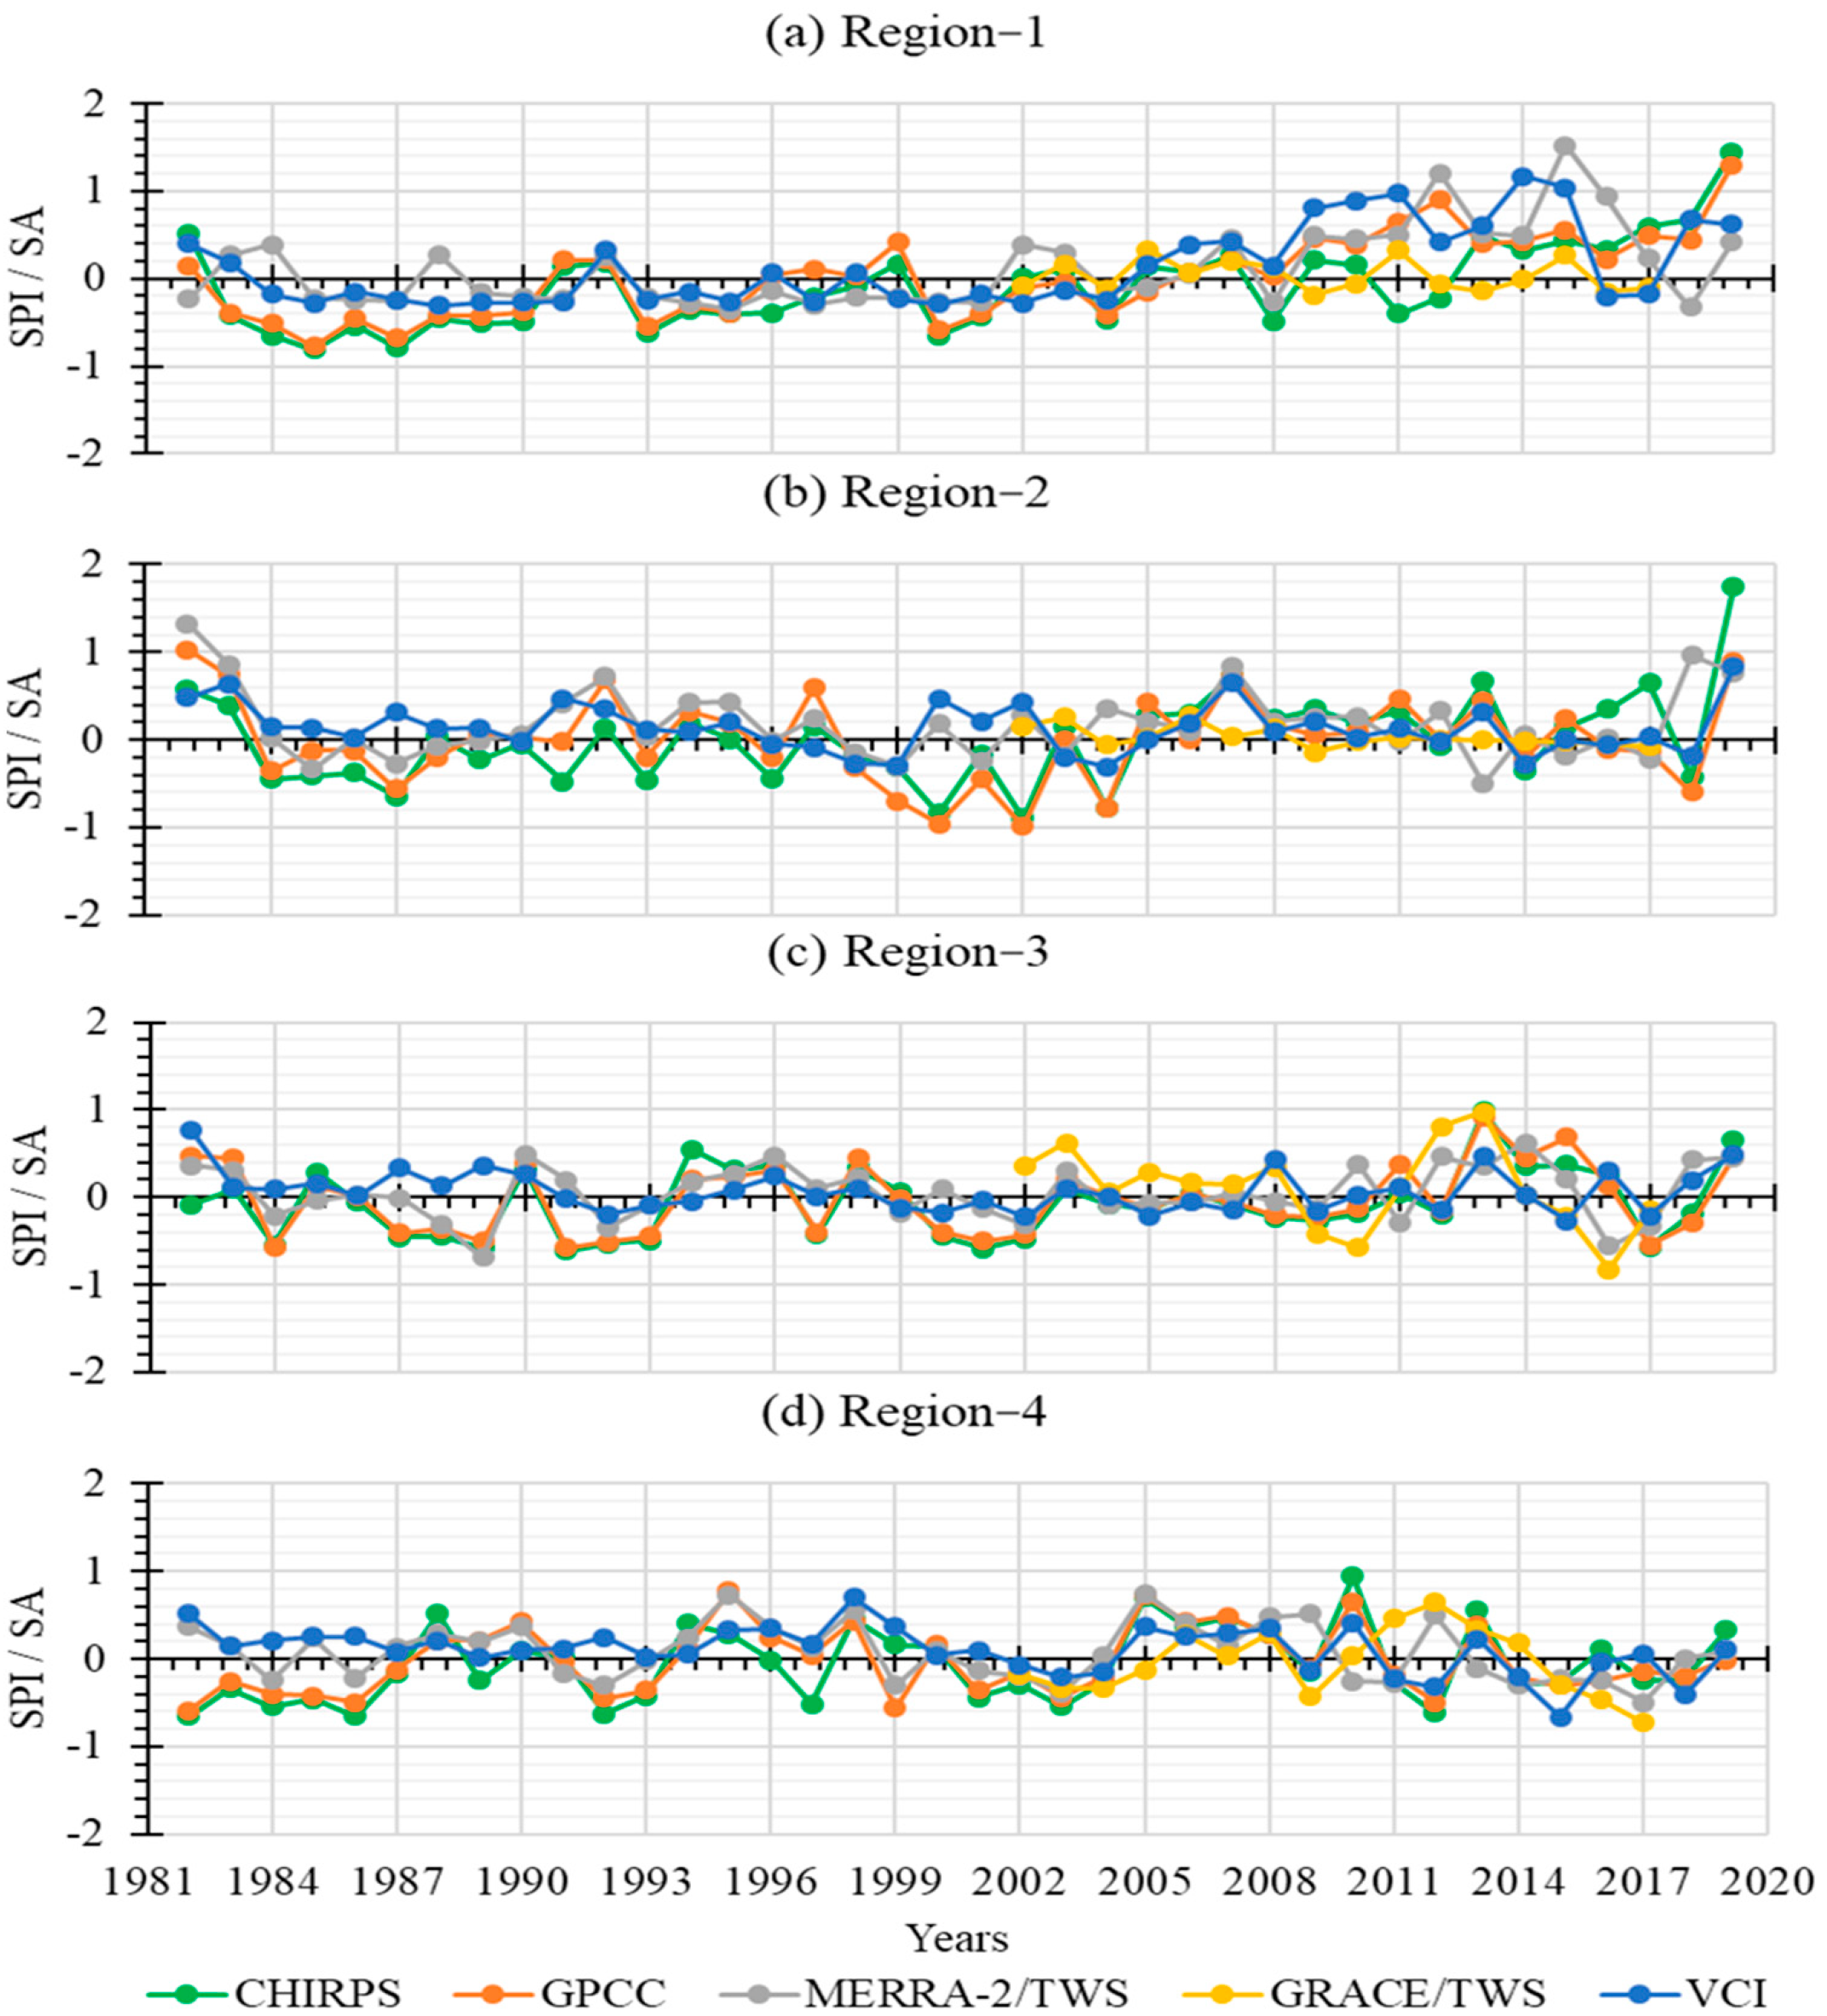
3.2. Temporal Variability

The temporal assessment of the aforementioned spatial patterns, pertaining to all regions, is presented in Figure 4 and Figure 5. Generally, the temporal estimation is interpreted in combination with spatial patterns (Table 2) [12]. It has been revealed that maximums for the regions in terms of suffering from severe to extreme drought during 1988–89, 1991–92, 1999, 2000–04, and 2016–18 feature negative values ranging from –0.84 to –1.65. All products had different drought patterns in different regions, which may be attributed to the geographical locations of regions. Further, the tendencies and durations of droughts exceedingly depended upon the amount of precipitation received in a particular area [83,86]. The performances of the soil moisture products (MERRA-2, CPC, and FLDAS) were determined to be almost similar over the entire study region, having little differences between index values; however, inconsistency has been identified for the performances of the GLDAS and ERA5 soil moisture products (Figure 4), especially in regions one and three. Finally, the soil moisture datasets mainly appeared in two classes/groups based on their performances. The MERRA-2, CPC, and FLDAS data represent one category that was found to be interrelated in regard to the outputs over the study region, while ERA5 and GLDAS were not found to be interrelated. The performances of the precipitation products (GPCC and CHIRPS) were found to be better and were close to each other. This is because both datasets contain in situ measurements of rainfall. The CHIRPS data features precipitation estimation based on a combination of satellite data and in situ measurements, while the GPCC data purely features in situ information [33].
In relation to precipitation products, the GRACE terrestrial water storage (GRACE TWS), MERRA-2 terrestrial water storage (MERRA-2 TWS), and vegetation condition index (VCI) data showed comparatively diverse responses in the temporal evaluation. This is visible in Figure 4. In the case of the MERRA-2 TWS and GRACE TWS data, no substantial performance was observed, especially in regions one and two. The SI/SA values had remained either positive or slightly negative, and typically almost near to zero. This could be attributed to the delayed response of the variation in the TWS to rainfall and soil moisture [12]. Similarly, the VCI demonstrated minor variances in index values and no tendency towards drought detection, except for regions three and four. The VCI indicated dominantly wet data in regions 1 and 2, and some extent of wetness in region 3, which is opposite to the general trends of the soil moisture and precipitation products. These drought indices, which are based on vegetation alone, were considered to be less responsive when compared to the evaporative indices because the evaporative indices feature less influence by vegetation growth and diagnose instant deficits in wetness through differences in evapotranspiration [85]. The current temporal evaluations clearly support the spatial analyses.
In addition, the correlation analysis confirmed the precision of the spatial and temporal analyses, indicating close associations between various products (Figure 6). Among soil moisture products, MERRA-2, CPC, and FLDAS revealed strong relationships across all regions when compared to GLDAS and ERA5. Further, the connotations between the precipitation products (CHIRPS and GPCC) were similar to those between the previously mentioned soil moisture products (MERRA-2, CPC, and FLDAS).
Significant (p < 0.05) correlations between drought indices (MERRA-2, CPC, FLDAS, CHIRPS, and GPCC) have been observed in regions two and three, which supports the same performance, as observed in Figure 2 and Figure 3. As a whole, the coefficient matrix exposed the strong relationships for soil moisture products (MERRA-2, CPC, and FLDAS) between each other, ranging from 0.74 to 0.87; however, their association towards ERA5 and GLDAS has been noted to be weak and non-significant (p > 0.05), ranging from 0.14 to 0.50 in regions one, two, and four. Only region two indicated the highest value of 0.63 between MERRA2 and GLDAS. In the case of the precipitation products (CHIRPS and GPCC), they were found to be significantly correlated to each other over the entire region, while their relationships with MERRA-2, CPC, and FLDAS remained mixed. In regions one, two, and three, they showed fairly positive and strong correlations. On the other hand, in region four, GPCC only specified a good relationship (0.73) with MERRA-2. In addition to the soil moisture and precipitation, the water storage products (MERRA-2 TWS and GRACE TWS) demonstrated a weak correlation with all products, except MERRA-2 TWS and CPC (0.74) in region three. Likewise, the VCI data had fragile, negative, or non-significant relationships.
All the products (GLDAS, ERA5, MERRA-2 TWS and GRACE TWS, and VCI) demonstrated dissimilar outputs in the spatial drought severity maps (Figure 2 and Figure 3) temporal evaluations (Figure 4 and Figure 5), and correlation matrix analyses (Figure 6) when compared to other products. These variations could be ascribed to the differences in the preparation of products. Besides, various environments and impacting factors may also influence drought patterns. For instance, local soil characteristics may affect drought severity, as suggested by the soil moisture products. Similarly, rainfall properties (amount, duration, and intensity) may change the drought harshness, as shown by the precipitation products [12].

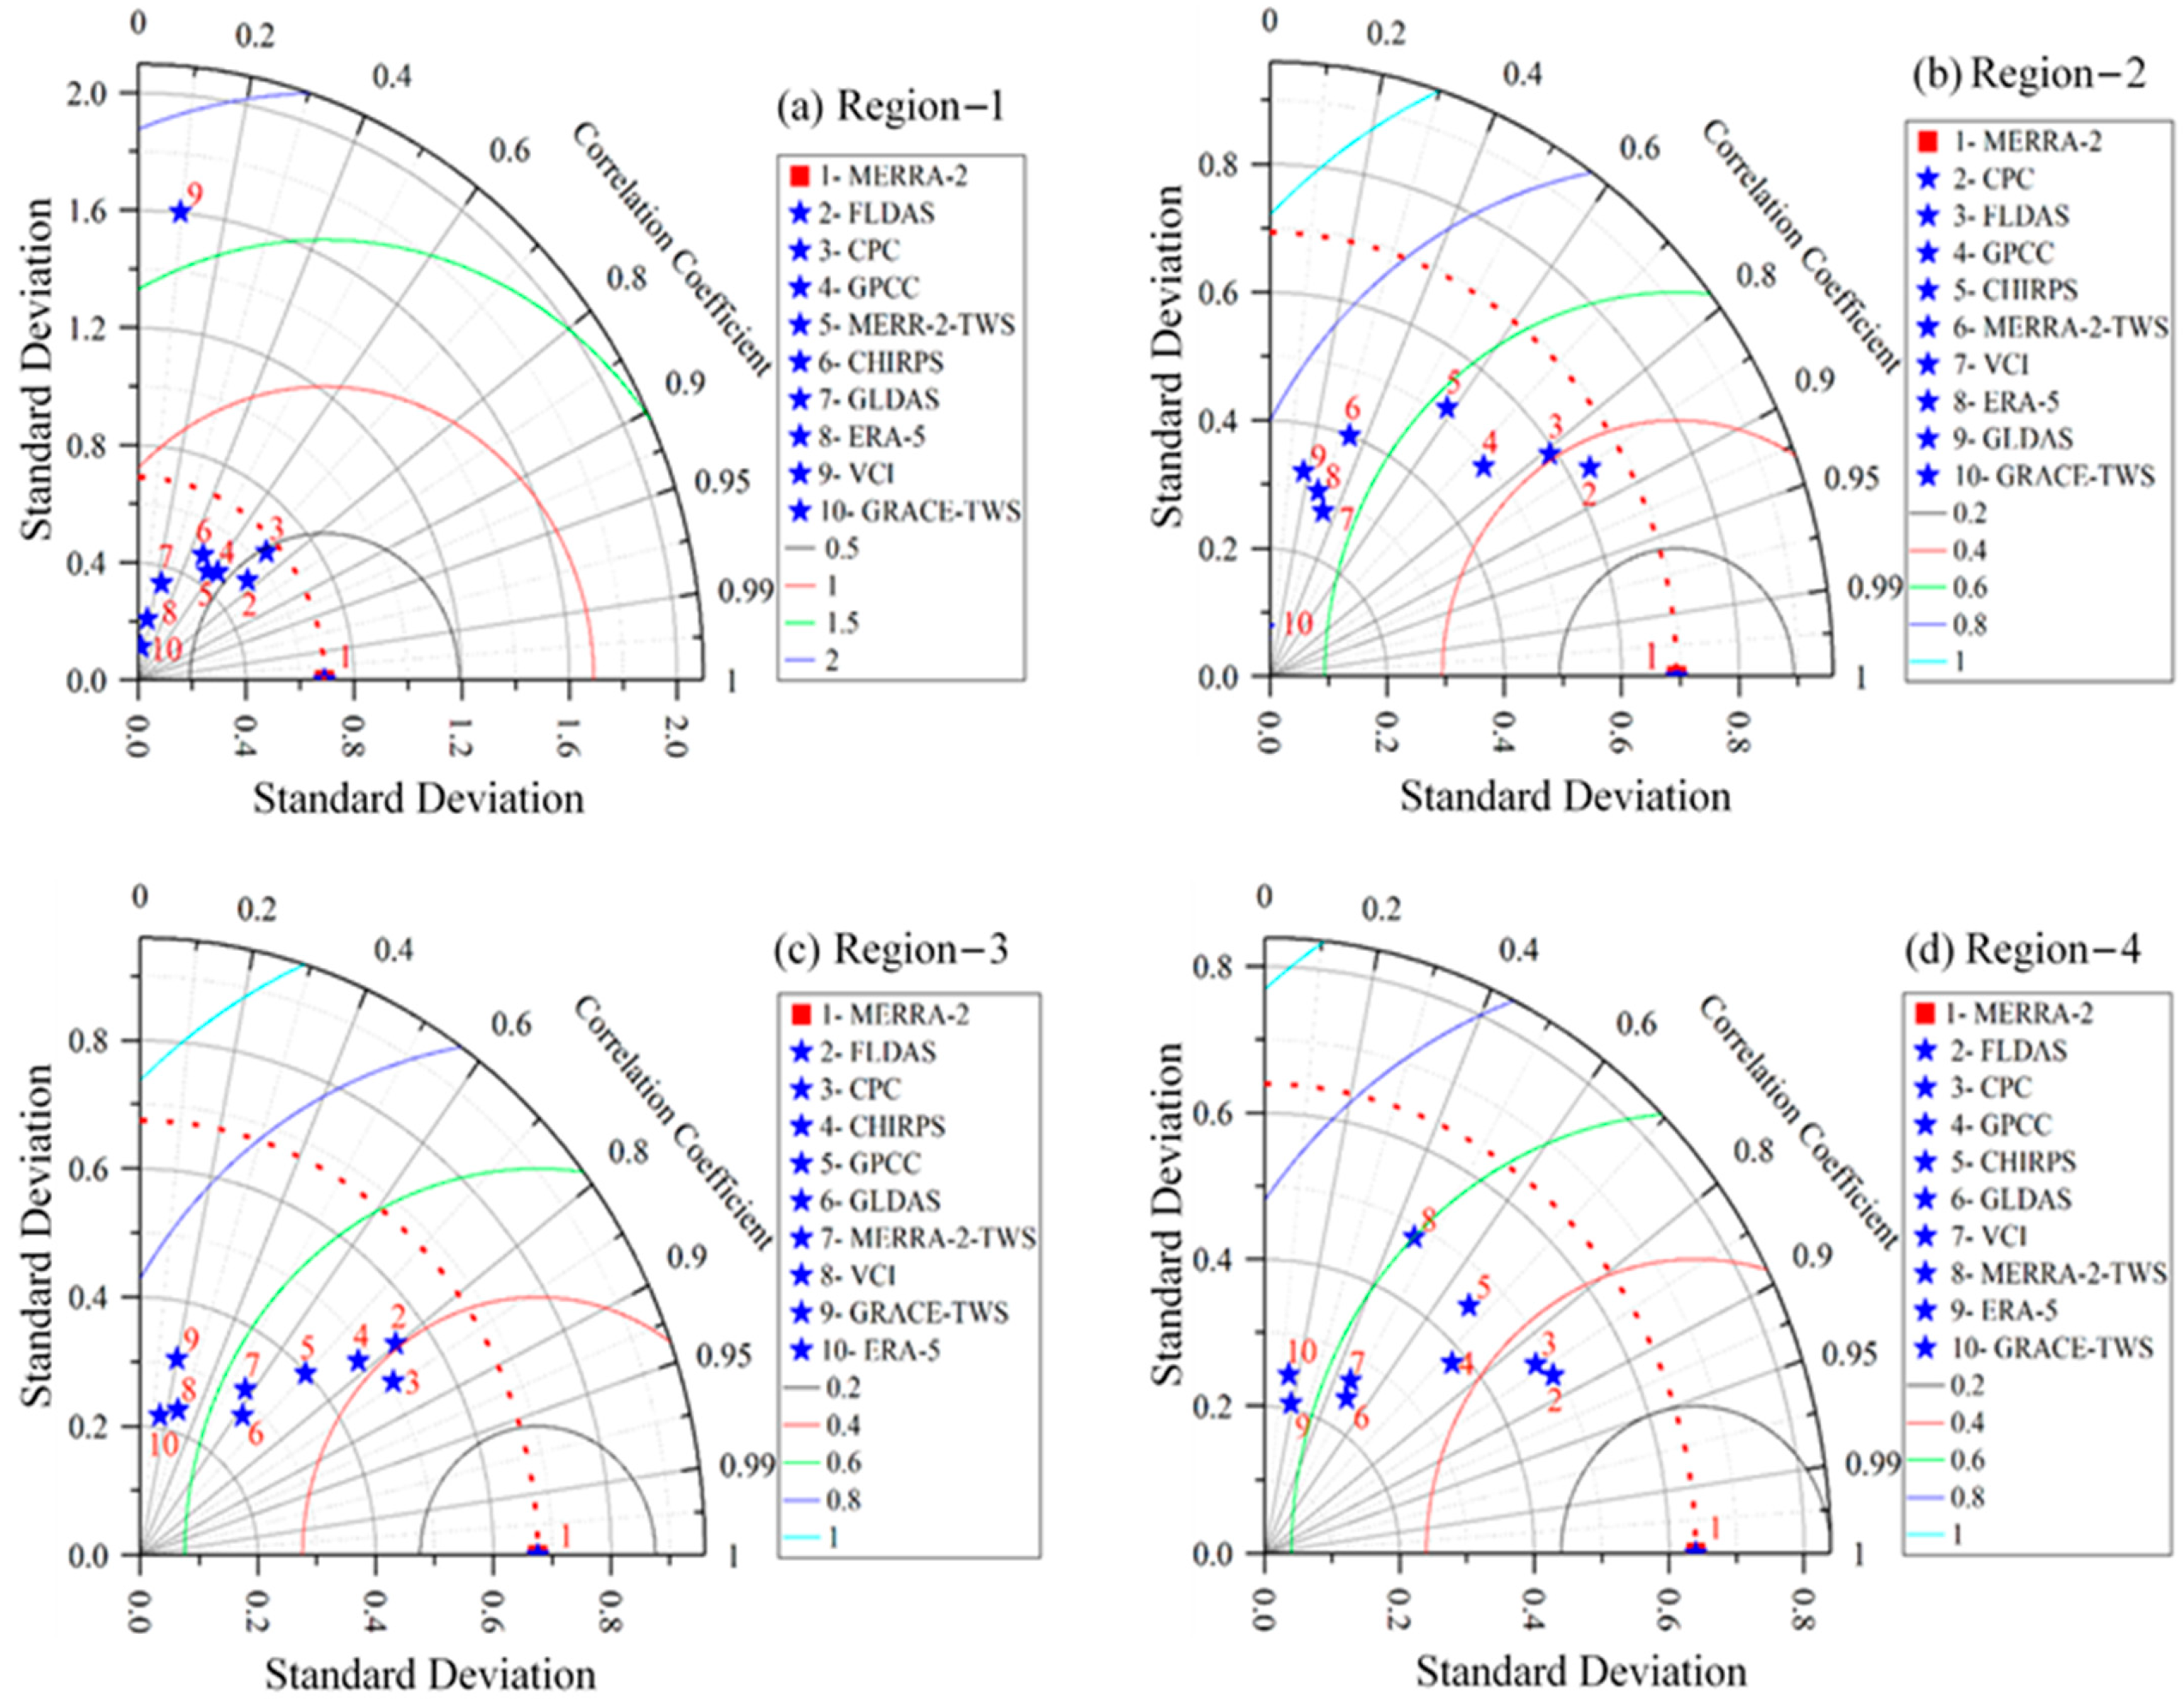
3.3. General Ranking of Products Based on Overall Performances

We used Taylor diagrams to assess and elaborate upon the capabilities of all products and their rankings in terms of their overall performance within the context of drought detection (Figure 7). The spatial, temporal, and crop yield analyses confirmed that the MERRA-2 soil moisture (SM) product performed equally well over the entire region when compared to the other products. Hence, the ranking of all other products was carried out relative to MERRA- 2. From the Taylor diagram (Figure 7), the products were separately grouped based upon the standard deviation, correlation coefficient, and root mean square difference (RMSD) in each region. Out of 10 various products, the MERRA-2, CPC, and FLDAS soil moisture products seemed to be closely connected and performed fairly well and performed better, presenting a high correlation coefficient and low RMSD in each region. The orders of ranking were recorded as first, second, and third for MERRA-2, FLDAS, and CPC in regions one, two, and four, respectively; however, in region two, CPC remained second after MERRA-2. Further, it was perceived that the GPCC and CHIRPS rainfall products persisted in the fourth and fifth positions for regions one, two, and four, respectively. In region two, CHIRPS has remained fourth and was after the CPC soil moisture product. All other products showed the least performance for drought capturing and a low coefficient for correlation. Thus, they were placed at lower positions.

3.4. Relationship between Drought Indices and Crop Yield Anomaly

Figure 8 stipulates the association between the YAI and drought indices (all products) during the study period over the entire region. The relationships varied substantially among all the indices for all countries. As the time durations of the GRACE and GLDAS products were different and comparatively shorter than the other products, the data were divided and the YAI was computed two times. Figure 8 separately represents the performances of the drought indices against field data for the periods of 2002–2014 (a–f) and 1982–2019 (g–l) over the six countries of South Asia. Standardized indices (SI) were calculated for the longer period (1982–2019), whereas standardized anomalies (SA) were used for the shorter period (2002–2014). Sri Lanka was excluded because of the unavailability of crop yield data (specifically for wheat and barley). During the short time period from 2002–2014 (a–f), MERRA-2, CPC, and FLDAS (soil moisture products), along with CHIRPS and GPCC (precipitation products), performed well for all crop yield data over the four major countries, i.e., Pakistan, India, Bangladesh, and Afghanistan. Significant correlations (p < 0.05) were recorded, ranging from 0.80 to 0.96; however, it has been noted that the performance remained diverse for all crops in the other two countries, where they showed the least performance overall for barley in Nepal and wheat in Bhutan. The results specified that the products such as GLDAS, ERA5, MERRA-2 TWS, GRACE TWS, and VCI performed poorly as compared to MERRA-2, CPC, FLDAS, CHIRPS and GPCC over the study region.
In the case of the long-term YAI from 1982–2019 (g–l), the above-mentioned products indicate a miscellaneous relationship. MERRA-2, CPC, FLDAS, CHIRPS, and GPCC showed mixed but significant associations against different crops in all countries, except Bhutan.
CHIRPS and GPCC demonstrated strong correlations with wheat. As a whole, both precipitation products performed equally during 2002–2014; however, CHIRPS performed relatively better than GPCC during 1982–2019. This could be attributed to the fact that CHIRPS has satellite-based estimation data in addition to as well as rain gauge data. According to investigations carried out by Chen et al. [87], spatial resolution plays substantial role in the performance of gridded products, unlike GPCC, which only features a rain gauge record. Hence, its performance is reliant on topographical changes and gauge density data [33]. On the other hand, ERA5, GLDAS, MERRA-2 TWS, GRACE TWS, and VCI have been identified as the least responsive datasets, with lower correlation compared to other products. The poor performances of these products could be connected to poor performances in drought detection, as seen in Section 3.1 and Section 3.2. The products related to soil moisture indicate the rainwater which left behind after evaporation and run-off. Consequently, they are more likely to expose variability in crop yield rather than rainfall. Thus, their weak presentation could be related to how well they fit the area/region [12]. Moreover, both FLDAS and GLDAS are products of the same model, while FLDAS demonstrated better performance than GLDAS. This is because, for FLDAS, the NOAH model is forced by CHIRPS [12]. The inconsistent performance of ERA5, GLDAS, MERRA-2 TWS, GRACE TWS, and VCI products positively endorsed our spatial and temporal analyses. In the Figure 8, the dark red color indicates a significantly positive correlation, while the dark green color indicates a significantly negative correlation. The study led by Hamal et al. [82] supports our results more effectively and is in line with outputs regarding the correlations among crop yields and SIs/SAs.

4. Conclusions

The current study has investigated the performances of soil moisture products (MERRA-2, CPC, FLDAS, GLDAS, and ERA5), precipitation products (CHIRPS and GPCC), and terrestrial water storage products (MERRA-2 TWS and GRACE TWS) in order to support agricultural drought characterization in South Asia. This was performed using standardized index/standardized anomaly and K-means algorithms. Additionally, the study computed YAI data to assess the relationships between field measurements (crop yield data) and drought indices.
The drought characterizations (spatial and temporal) elucidated MERRA-2, CPC, FLDAS (soil moisture), GPCC, and CHRRPS (precipitation) as being alike and constant over the four considered regions (northwest, southwest, northeast, and southeast) of South Asia. On the other hand, GLDAS and ERA5 performed poorly when compared to the other soil moisture products and identified droughts in regions one (northwest) and three (northeast). The TWS products (MERRA-2 TWS and GRACE TWS) followed the patterns of ERA5 and GLDAS and showed dissimilar and inconsistent drought patterns. GRACE TWS and MERRA-2 TWS highlighted droughts in the regions three (northeast) and four (southeast). In addition to the soil moisture and precipitation products, the VCI data identified droughts in regions three and four. From ground/field measurement analysis, stronger and significant (p < 0.05) associations (0.80 to 0.96) were recorded for MERRA-2, CPC, and FLDAS for soil moisture and CHRRPS and GPCC for precipitation over the six considered countries (Pakistan, India, Bangladesh, Afghanistan, Nepal, and Bhutan). Besides, low consistency and weaker relationships were identified for all other products (ERA5, GLDAS, MERRA-2 TWS, GRACE TWS, and VCI). Further, based on the performances of all products, this study suggests the use of the MERRA-2, CPC and FLDAS datasets for soil moisture and CHIRPS and GPCC datasets for precipitation as optimal indicators for agrarian drought detection in South Asian countries. Further investigations should examine how well the model, reanalysis, and satellite-based datasets fit the area/region.

Author Contributions

M.S. and W.Z. established the unique idea and methodology for the current study; F.M., I.U. and M.B. contributed formal analysis and interpretation; M.A., S.I., S.N., R.W.A. and R.I. helped in the manuscript writing process. All authors have read and agreed to the published version of the manuscript.

Funding

The National Natural Science Foundation of China (grant number 41575070) supported the present study.

Institutional Review Board Statement

Not applicable.

Informed Consent Statement

Not applicable.

Data Availability Statement

Not applicable.

Acknowledgments

M.S., the principal author, and all co-authors are extremely grateful to all remote sensing data suppliers and their staff for developing and upholding the websites used in existing study. We owe our deepest appreciation to Nanjing University of Information Science and Technology (NUIST) and the China Scholarship Council (CSC) for providing obligatory support and fellowship. We would extend our heartfelt thanks to the anonymous reviewers for their valuable time and courtesy.

Conflicts of Interest

The authors declare no conflict of interest.

References

  1. Stabinsky, D. Defining Role of Agriculture in South Asia; OXFAM: Oxford, UK, 2014; p. 3. [Google Scholar]
  2. Almazroui, M.; Saeed, S.; Saeed, F.; Islam, M.N.; Ismail, M. Projections of Precipitation and Temperature over the South Asian Countries in CMIP6. Earth Syst. Environ. 2020, 4, 297–320. [Google Scholar] [CrossRef]
  3. Aryal, J.P.; Sapkota, T.B.; Khurana, R.; Khatri-Chhetri, A.; Rahut, D.B.; Jat, M.L. Climate Change and Agriculture in South Asia: Adaptation Options in Smallholder Production Systems; Springer: Dordrecht, The Netherlands, 2020; Volume 22, ISBN 0123456789. [Google Scholar]
  4. Sivakumar, M.V.K.; Stefanski, R. Climate Change and Food Security in South Asia; Springer Science & Business Media: Berlin, Germany, 2011. [Google Scholar]
  5. Aadhar, S.; Mishra, V. Data Descriptor: High-resolution near real-time drought monitoring in South Asia. Sci. Data 2017, 4, 1–14. [Google Scholar] [CrossRef] [PubMed] [Green Version]
  6. Zhai, J.; Mondal, S.K.; Fischer, T.; Wang, Y.; Su, B.; Huang, J.; Tao, H.; Wang, G.; Ullah, W.; Uddin, M.J. Future drought characteristics through a multi-model ensemble from CMIP6 over South Asia. Atmos. Res. 2020, 246, 105111. [Google Scholar] [CrossRef]
  7. Winkler, K.; Gessner, U.; Hochschild, V. Identifying Droughts Affecting Agriculture in Africa Based on Remote Sensing Time Series between 2000–2016: Rainfall Anomalies and Vegetation Condition in the Context of ENSO. Remote Sens. 2017, 9, 831. [Google Scholar] [CrossRef] [Green Version]
  8. Sánchez, N.; González-Zamora, Á.; Martínez-Fernández, J.; Piles, M.; Pablos, M. Integrated remote sensing approach to global agricultural drought monitoring. Agric. For. Meteorol. 2018, 259, 141–153. [Google Scholar] [CrossRef]
  9. Rojas, O.; Vrieling, A.; Rembold, F. Assessing drought probability for agricultural areas in Africa with coarse resolution remote sensing imagery. Remote Sens. Environ. 2011, 115, 343–352. [Google Scholar] [CrossRef]
  10. Ali, S.; Tong, D.; Xu, Z.T.; Henchiri, M.; Wilson, K.; Siqi, S.; Zhang, J. Characterization of drought monitoring events through MODIS- and TRMM-based DSI and TVDI over South Asia during 2001–2017. Environ. Sci. Pollut. Res. 2019, 26, 33568–33581. [Google Scholar] [CrossRef]
  11. Hu, T.; Renzullo, L.J.; van Dijk, A.I.J.M.; He, J.; Tian, S.; Xu, Z.; Zhou, J.; Liu, T.; Liu, Q. Monitoring agricultural drought in Australia using MTSAT-2 land surface temperature retrievals. Remote Sens. Environ. 2020, 236, 111419. [Google Scholar] [CrossRef]
  12. Agutu, N.O.; Awange, J.L.; Zerihun, A.; Ndehedehe, C.E.; Kuhn, M.; Fukuda, Y. Assessing multi-satellite remote sensing, reanalysis, and land surface models’ products in characterizing agricultural drought in East Africa. Remote Sens. Environ. 2017, 194, 287–302. [Google Scholar] [CrossRef] [Green Version]
  13. Naumann, G.; Dutra, E.; Barbosa, P.; Pappenberger, F.; Wetterhall, F.; Vogt, J.V. Comparison of drought indicators derived from multiple data sets over Africa. Hydrol. Earth Syst. Sci. 2014, 18, 1625–1640. [Google Scholar] [CrossRef] [Green Version]
  14. Damberg, L.; AghaKouchak, A. Global trends and patterns of drought from space. Theor. Appl. Climatol. 2014, 117, 441–448. [Google Scholar] [CrossRef]
  15. Sharma, S.; Khadka, N.; Hamal, K.; Shrestha, D.; Talchabhadel, R.; Chen, Y. How Accurately Can Satellite Products (TMPA and IMERG) Detect Precipitation Patterns, Extremities, and Drought Across the Nepalese Himalaya? Earth Sp. Sci. 2020, 7, e2020EA001315. [Google Scholar] [CrossRef]
  16. Bai, X.; Shen, W.; Wu, X.; Wang, P. Applicability of long-term satellite-based precipitation products for drought indices considering global warming. J. Environ. Manag. 2020, 255, 109846. [Google Scholar] [CrossRef] [PubMed]
  17. Fedorov, N.I.; Zharkikh, T.L.; Mikhailenko, O.I.; Bakirova, R.T.; Martynenko, V.B. Forecast changes in the productivity of plant communities in the pre-urals steppe site of orenburg state nature reserve (Russia) in extreme drought conditions using NDVI. Nat. Conserv. Res. 2019, 4, 104–110. [Google Scholar] [CrossRef]
  18. Chuai, X.W.; Huang, X.J.; Wang, W.J.; Bao, G. NDVI, temperature and precipitation changes and their relationships with different vegetation types during 1998–2007 in Inner Mongolia, China. Int. J. Climatol. 2013, 33, 1696–1706. [Google Scholar] [CrossRef]
  19. Kogan, F.N. Global Drought Watch from Space. Bull. Am. Meteorol. Soc. 1997, 78, 621–636. [Google Scholar] [CrossRef]
  20. Bhuiyan, C.; Singh, R.P.; Kogan, F.N. Monitoring drought dynamics in the Aravalli region (India) using different indices based on ground and remote sensing data. Int. J. Appl. Earth Obs. Geoinf. 2006, 8, 289–302. [Google Scholar] [CrossRef]
  21. Tapley, B.D.; Bettadpur, S.; Watkins, M.; Reigber, C. The gravity recovery and climate experiment: Mission overview and early results. Geophys. Res. Lett. 2004, 31, 1–4. [Google Scholar] [CrossRef] [Green Version]
  22. Baniya, B.; Tang, Q.; Xu, X.; Haile, G.G.; Chhipi-Shrestha, G. Spatial and temporal variation of drought based on satellite derived vegetation condition index in Nepal from 1982–2015. Sensors 2019, 19, 430. [Google Scholar] [CrossRef] [PubMed] [Green Version]
  23. Rousta, I.; Olafsson, H.; Moniruzzaman, M.; Zhang, H.; Liou, Y.A.; Mushore, T.D.; Gupta, A. Impacts of drought on vegetation assessed by vegetation indices and meteorological factors in Afghanistan. Remote Sens. 2020, 12, 2433. [Google Scholar] [CrossRef]
  24. Qu, C.; Hao, X.; Qu, J.J. Monitoring extreme agricultural drought over the Horn of Africa (HOA) using remote sensing measurements. Remote Sens. 2019, 11, 902. [Google Scholar] [CrossRef] [Green Version]
  25. Anderson, W.B.; Zaitchik, B.F.; Hain, C.R.; Anderson, M.C.; Yilmaz, M.T.; Mecikalski, J.; Schultz, L. Towards an integrated soil moisture drought monitor for East Africa. Hydrol. Earth Syst. Sci. 2012, 16, 2893–2913. [Google Scholar] [CrossRef] [Green Version]
  26. Nicholson, S.E. A detailed look at the recent drought situation in the Greater Horn of Africa. J. Arid Environ. 2014, 103, 71–79. [Google Scholar] [CrossRef]
  27. Mwangi, E.; Wetterhall, F.; Dutra, E.; Di Giuseppe, F.; Pappenberger, F. Forecasting droughts in East Africa. Hydrol. Earth Syst. Sci. 2014, 18, 611–620. [Google Scholar] [CrossRef] [Green Version]
  28. Shukla, S.; McNally, A.; Husak, G.; Funk, C. A seasonal agricultural drought forecast system for food-insecure regions of East Africa. Hydrol. Earth Syst. Sci. 2014, 18, 3907–3921. [Google Scholar] [CrossRef] [Green Version]
  29. Arshad, M.; Ma, X.; Yin, J.; Ullah, W.; Ali, G.; Ullah, S.; Liu, M.; Shahzaman, M.; Ullah, I. Evaluation of GPM-IMERG and TRMM-3B42 precipitation products over Pakistan. Atmos. Res. 2020, 249, 105341. [Google Scholar] [CrossRef]
  30. Dhawan, V. Water and Agriculture in India. In Background Paper for the South Asia Expert Panel During the Global Forum for Food and Agriculture; 2017; Volume 28, Available online: https://www.oav.de/fileadmin/user_upload/5_Publikationen/5_Studien/170118_Study_Water_Agriculture_India.pdf (accessed on 4 April 2021).
  31. Minstry of Environment Government of Pakistan Land Use Atlas of Pakistan. Report. 2004, pp. 1–70. Available online: http://202.83.164.29/moclc/userfiles1/file/Land_Use_Atlas_of_Pakistan.pdf (accessed on 11 April 2021).
  32. World Bank Islamic Republic of Afghanistan Agriculture Sector review. In Revitalizing Agriculture for Economic Growth, Job Creation and Food Security; 2014; Available online: https://openknowledge.worldbank.org/handle/10986/21733 (accessed on 11 April 2021).
  33. Funk, C.; Peterson, P.; Landsfeld, M.; Pedreros, D.; Verdin, J.; Shukla, S.; Husak, G.; Rowland, J.; Harrison, L.; Hoell, A.; et al. The climate hazards infrared precipitation with stations—A new environmental record for monitoring extremes. Sci. Data 2015, 2, 1–21. [Google Scholar] [CrossRef] [PubMed] [Green Version]
  34. McNally, A.; Arsenault, K.; Kumar, S.; Shukla, S.; Peterson, P.; Wang, S.; Funk, C.; Peters-Lidard, C.D.; Verdin, J.P. A land data assimilation system for sub-Saharan Africa food and water security applications. Sci. Data 2017, 4, 1–19. [Google Scholar] [CrossRef] [PubMed] [Green Version]
  35. Decker, M.; Brunke, M.A.; Wang, Z.; Sakaguchi, K.; Zeng, X.; Bosilovich, M.G. Evaluation of the reanalysis products from GSFC, NCEP, and ECMWF using flux tower observations. J. Clim. 2012, 25, 1916–1944. [Google Scholar] [CrossRef]
  36. Bosilovich, M.; Akella, S.; Coy, L.; Cullather, R.; Draper, C.; Gelaro, R.; Kovach, R.; Liu, Q.; Molod, A.; Norris, P.; et al. MERRA-2: Initial Evaluation of the Climate. In NASA Tech. Rep. Ser. Glob. Model. Data Assim.; 2015. Available online: https://gmao.gsfc.nasa.gov/pubs/docs/GEOS-5.0.1_Documentation_r3.pdf (accessed on 4 April 2021).
  37. Xu, L.; Chen, N.; Zhang, X.; Moradkhani, H.; Zhang, C.; Hu, C. In-situ and triple-collocation based evaluations of eight global root zone soil moisture products. Remote Sens. Environ. 2021, 254, 112248. [Google Scholar] [CrossRef]
  38. Almendra-Martín, L.; Martínez-Fernández, J.; González-Zamora, Á.; Benito-Verdugo, P.; Herrero-Jiménez, C.M. Agricultural Drought Trends on the Iberian Peninsula: An Analysis Using Modeled and Reanalysis Soil Moisture Products. Atmosphere 2021, 12, 236. [Google Scholar] [CrossRef]
  39. Dirmeyer, P.A.; Guo, Z.; Gao, X. Comparison, validation, and transferability of eight multiyear global soil wetness products. J. Hydrometeorol. 2004, 5, 1011–1033. [Google Scholar] [CrossRef]
  40. Rodell, B.Y.M.; Houser, P.R.; Jambor, U.; Gottschalck, J.; Mitchell, K.; Meng, C.; Arsenault, K.; Cosgrove, B.; Radakovich, J.; Bosilovich, M.; et al. THE GLOBAL LAND DATA ASSIMILATION SYSTEM This powerful new land surface modeling system integrates data from advanced observing systems to support improved forecast model initialization and hydrometeorological investigations. Bull. Am. Meteor. Soc. 2004, 85, 381–394. [Google Scholar] [CrossRef] [Green Version]
  41. Yilmaz, M.T.; Anderson, M.C.; Zaitchik, B.; Hain, C.R.; Crow, W.T.; Ozdogan, M.; Chun, J.A.; Evans, J. Comparison of prognostic and diagnostic surface flux modeling approaches over the Nile River basin. Water Resour. Res. 2014, 50, 386–408. [Google Scholar] [CrossRef]
  42. McNally, A.; Shukla, S.; Arsenault, K.R.; Wang, S.; Peters-Lidard, C.D.; Verdin, J.P. Evaluating ESA CCI soil moisture in East Africa. Int. J. Appl. Earth Obs. Geoinf. 2016, 48, 96–109. [Google Scholar] [CrossRef] [PubMed] [Green Version]
  43. Wouters, B.; Bonin, J.A.; Chambers, D.P.; Riva, R.E.M.; Sasgen, I.; Wahr, J. GRACE, time-varying gravity, Earth system dynamics and climate change. Rep. Prog. Phys. 2014, 77, 116801. [Google Scholar] [CrossRef] [Green Version]
  44. Chen, J.L.; Wilson, C.R.; Tapley, B.D.; Ries, J.C. Low degree gravitational changes from GRACE: Validation and interpretation. Geophys. Res. Lett. 2004, 31. [Google Scholar] [CrossRef]
  45. Chen, J.L.; Wilson, C.R.; Tapley, B.D.; Yang, Z.L.; Niu, G.Y. 2005 drought event in the Amazon River basin as measured by GRACE and estimated by climate models. J. Geophys. Res. Solid Earth 2009, 114. [Google Scholar] [CrossRef]
  46. Long, D.; Scanlon, B.R.; Longuevergne, L.; Sun, A.Y.; Fernando, D.N.; Save, H. GRACE satellite monitoring of large depletion in water storage in response to the 2011 drought in Texas. Geophys. Res. Lett. 2013, 40, 3395–3401. [Google Scholar] [CrossRef] [Green Version]
  47. Kogan, F.N. Droughts of the late 1980s in the United States as derived from NOAA polar-orbiting satellite data. Bull. Am. Meteorol. Soc. 1995, 76, 655–668. [Google Scholar] [CrossRef] [Green Version]
  48. Karnieli, A.; Agam, N.; Pinker, R.T.; Anderson, M.; Imhoff, M.L.; Gutman, G.G.; Panov, N.; Goldberg, A. Use of NDVI and Land Surface Temperature for Drought Assessment: Merits and Limitations. J. Clim. 2010, 23, 618–633. [Google Scholar] [CrossRef]
  49. Ngendakumana, V. FAO Statistical Data Quality Framework: A multi-layred approach to monitoring and assessment. In Proceedings of the Conference on Data Quality for International Organizations Committee for the Coordination of Statistical Activities; 2001; Volume 3, pp. 1–15. Available online: https://unstats.un.org/unsd/ccsa/cdqio-2004/pp-1-fao.pdf (accessed on 19 April 2021).
  50. Funk, C.; Hoell, A.; Shukla, S.; Bladé, I.; Liebmann, B.; Roberts, J.B.; Robertson, F.R.; Husak, G. Predicting East African spring droughts using Pacific and Indian Ocean sea surface temperature indices. Hydrol. Earth Syst. Sci. 2014, 18, 4965–4978. [Google Scholar] [CrossRef] [Green Version]
  51. Kurnik, B.; Barbosa, P.; Vogt, J. Testing two different precipitation datasets to compute the standardized precipitation index over the horn of Africa. Int. J. Remote Sens. 2011, 32, 5947–5964. [Google Scholar] [CrossRef]
  52. Dutra, E.; Wetterhall, F.; Di Giuseppe, F.; Naumann, G.; Barbosa, P.; Vogt, J.; Pozzi, W.; Pappenberger, F. Global meteorological drought-Part 1: Probabilistic monitoring. Hydrol. Earth Syst. Sci. 2014, 18, 2657–2667. [Google Scholar] [CrossRef] [Green Version]
  53. Jung, H.C.; Kang, D.H.; Kim, E.; Getirana, A.; Yoon, Y.; Kumar, S.; Peters-lidard, C.D.; Hwang, E.H. Towards a soil moisture drought monitoring system for South Korea. J. Hydrol. 2020, 589, 125176. [Google Scholar] [CrossRef]
  54. Chen, N.; Li, R.; Zhang, X.; Yang, C.; Wang, X.; Zeng, L.; Tang, S.; Wang, W.; Li, D.; Niyogi, D. Drought propagation in Northern China Plain: A comparative analysis of GLDAS and MERRA-2 datasets. J. Hydrol. 2020, 588, 125026. [Google Scholar] [CrossRef]
  55. Fan, Y.; van den Dool, H. Climate Prediction Center global monthly soil moisture data set at 0.5° resolution for 1948 to present. J. Geophys. Res. D Atmos. 2004, 109, 1–8. [Google Scholar] [CrossRef] [Green Version]
  56. Wu, J. Agricultural Drought Monitoring and Prediction Using Soil Moisture Deficit Index; The University of North Dakota: Grand Forks, ND, USA, 2014. [Google Scholar]
  57. Le, M.H.; Kim, H.; Moon, H.; Zhang, R.; Lakshmi, V.; Nguyen, L.B. Assessment of drought conditions over Vietnam using standardized precipitation evapotranspiration index, MERRA-2 re-analysis, and dynamic land cover. J. Hydrol. Reg. Stud. 2020, 32, 100767. [Google Scholar] [CrossRef]
  58. Chen, S.; Gan, T.Y.; Tan, X.; Shao, D.; Zhu, J. Assessment of CFSR, ERA-Interim, JRA-55, MERRA-2, NCEP-2 reanalysis data for drought analysis over China. Clim. Dyn. 2019, 53, 737–757. [Google Scholar] [CrossRef]
  59. Cheng, M.; Zhong, L.; Ma, Y.; Zou, M.; Ge, N.; Wang, X.; Hu, Y. A study on the assessment of multi-source satellite soil moisture products and reanalysis data for the Tibetan Plateau. Remote Sens. 2019, 11, 1196. [Google Scholar] [CrossRef] [Green Version]
  60. Heimhuber, V.; Tulbure, M.G.; Broich, M.; Xie, Z.; Hurriyet, M. The role of GRACE total water storage anomalies, streamflow and rainfall in stream salinity trends across Australia’s Murray-Darling Basin during and post the Millennium Drought. Int. J. Appl. Earth Obs. Geoinf. 2019, 83, 101927. [Google Scholar] [CrossRef]
  61. Wang, J.; Price, K.P.; Rich, P.M. Spatial patterns of NDVI in response to precipitation and temperature in the central Great Plains. Int. J. Remote Sens. 2001, 22, 3827–3844. [Google Scholar] [CrossRef]
  62. Ali, S.; Henchiri, M.; Yao, F.; Zhang, J. Analysis of vegetation dynamics, drought in relation with climate over South Asia from 1990 to 2011. Environ. Sci. Pollut. Res. 2019, 26, 11470–11481. [Google Scholar] [CrossRef] [PubMed]
  63. Jiao, W.; Tian, C.; Chang, Q.; Novick, K.A.; Wang, L. A new multi-sensor integrated index for drought monitoring. Agric. For. Meteorol. 2019, 268, 74–85. [Google Scholar] [CrossRef] [Green Version]
  64. Wu, H.; Hayes, M.J.; Weiss, A.; Hu, Q. An evaluation of the Standardized Precipitation Index, the China-Z Index and the statistical Z-Score. Int. J. Climatol. 2001, 21, 745–758. [Google Scholar] [CrossRef]
  65. Sur, K.; Lunagaria, M.M. Association between drought and agricultural productivity using remote sensing data: A case study of Gujarat state of India. J. Water Clim. Chang. 2020, 11, 189–202. [Google Scholar] [CrossRef]
  66. Mustafa, F.; Bu, L.; Wang, Q.; Ali, M.A.; Bilal, M.; Shahzaman, M.; Qiu, Z. Multi-year comparison of CO2 concentration from NOAA carbon tracker reanalysis model with data from GOSAT and OCO-2 over Asia. Remote Sens. 2020, 12, 2498. [Google Scholar] [CrossRef]
  67. Mustafa, F.; Wang, H.; Bu, L.; Wang, Q.; Shahzaman, M.; Bilal, M.; Zhou, M.; Iqbal, R.; Aslam, R.W.; Ali, M.A.; et al. Validation of gosat and oco-2 against in situ aircraft measurements and comparison with carbontracker and geos-chem over Qinhuangdao, China. Remote Sens. 2021, 13, 899. [Google Scholar] [CrossRef]
  68. Ullah, I.; Ma, X.; Azam, K.; Syed, S.; Liu, M.; Arshad, M. Evaluating the meteorological drought characteristics over Pakistan using in situ observations and reanalysis products. Int. J. Climatol. 2021, 41, 4437–4459. [Google Scholar] [CrossRef]
  69. Iyakaremye, V.; Zeng, G.; Yang, X.; Zhang, G.; Ullah, I.; Gahigi, A.; Vuguziga, F.; Asfaw, T.G.; Ayugi, B. Increased high-temperature extremes and associated population exposure in Africa by the mid-21st century. Sci. Total Environ. 2021, 790, 148162. [Google Scholar] [CrossRef] [PubMed]
  70. Vicente-Serrano, S.M.; Beguería, S.; Lorenzo-Lacruz, J.; Camarero, J.J.; López-Moreno, J.I.; Azorin-Molina, C.; Revuelto, J.; Morán-Tejeda, E.; Sanchez-Lorenzo, A. Performance of Drought Indices for Ecological, Agricultural, and Hydrological Applications. Earth Interact. 2012, 16, 1–27. [Google Scholar] [CrossRef] [Green Version]
  71. Zhang, L.; Yao, Y.; Bei, X.; Jia, K.; Zhang, X.; Xie, X.; Jiang, B.; Shang, K.; Xu, J.; Chen, X. Assessing the remotely sensed evaporative drought index for drought monitoring over Northeast China. Remote Sens. 2019, 11, 1960. [Google Scholar] [CrossRef] [Green Version]
  72. Wgnn, J.; Vmi, C. Investigate The Sensitivity Of The Satellite-Based Agricultural Drought Indices To Monitor The Drought Condition Of Paddy And Introduction To Enhanced Multi-Temporal Agricultural Drought Indices. J. Remote Sens. GIS 2020, 9, 272. [Google Scholar]
  73. Ullah, I.; Ma, X.; Yin, J.; Saleem, F.; Syed, S.; Omer, A.; Habtemicheal, B.A.; Liu, M.; Arshad, M. Observed changes in seasonal drought characteristics and their possible potential drivers over Pakistan. Int. J. Climatol. 2021, 1–21. [Google Scholar] [CrossRef]
  74. Farahmand, A.; AghaKouchak, A. A generalized framework for deriving nonparametric standardized drought indicators. Adv. Water Resour. 2015, 76, 140–145. [Google Scholar] [CrossRef]
  75. Lincoln, N. PI to Identify Drought Using the SPI to Identify Drought; 2001; pp. 5–12. Available online: https://digitalcommons.unl.edu/cgi/viewcontent.cgi?article=1000&context=droughtnetnews (accessed on 15 May 2021).
  76. Peters, A.J.; Walter-Shea, E.A.; Ji, L.; Viña, A.; Hayes, M.; Svoboda, M.D. Drought monitoring with NDVI-based Standardized Vegetation Index. Photogramm. Eng. Remote Sens. 2002, 68, 71–75. [Google Scholar]
  77. Cammalleri, C.; Micale, F.; Vogt, J. On the value of combining different modelled soil moisture products for European drought monitoring. J. Hydrol. 2015, 525, 547–558. [Google Scholar] [CrossRef]
  78. Agnew, C.T.; Chappell, A. Drought in the Sahel. GeoJournal 1999, 48, 299–311. [Google Scholar] [CrossRef]
  79. Aadhar, S.; Mishra, V. On the occurrence of the worst drought in South Asia in the observed and future climate. Environ. Res. Lett. 2021, 16, 024050. [Google Scholar] [CrossRef]
  80. Santos, J.F.; Pulido-Calvo, I.; Portela, M.M. Spatial and temporal variability of droughts in Portugal. Water Resour. Res. 2010, 46, 1–13. [Google Scholar] [CrossRef] [Green Version]
  81. Li, X.; Zhou, W.; Chen, Y.D. Assessment of regional drought trend and risk over China: A drought climate division perspective. J. Clim. 2015, 28, 7025–7037. [Google Scholar] [CrossRef]
  82. Hamal, K.; Sharma, S.; Khadka, N.; Haile, G.G.; Joshi, B.B.; Xu, T.; Dawadi, B. Assessment of drought impacts on crop yields across Nepal during 1987–2017. Meteorol. Appl. 2020, 27, 1–18. [Google Scholar] [CrossRef]
  83. Shahzaman, M.; Zhu, W.; Bilal, M.; Habtemicheal, B.A.; Mustafa, F.; Arshad, M.; Ullah, I.; Ishfaq, S.; Iqbal, R. Remote sensing indices for spatial monitoring of agricultural drought in south asian countries. Remote Sens. 2021, 13, 2059. [Google Scholar] [CrossRef]
  84. Mahto, S.S.; Mishra, V. Dominance of summer monsoon flash droughts in India. Environ. Res. Lett. 2020, 15, 104061. [Google Scholar] [CrossRef]
  85. Anderson, M.C.; Zolin, C.A.; Sentelhas, P.C.; Hain, C.R.; Semmens, K.; Tugrul Yilmaz, M.; Gao, F.; Otkin, J.A.; Tetrault, R. The Evaporative Stress Index as an indicator of agricultural drought in Brazil: An assessment based on crop yield impacts. Remote Sens. Environ. 2016, 174, 82–99. [Google Scholar] [CrossRef]
  86. Asoka, A.; Mishra, V. Prediction of vegetation anomalies to improve food security and water management in India. Geophys. Res. Lett. 2015, 42, 5290–5298. [Google Scholar] [CrossRef] [Green Version]
  87. Chen, Y.; Sharma, S.; Zhou, X.; Yang, K.; Li, X.; Niu, X.; Hu, X.; Khadka, N. Spatial performance of multiple reanalysis precipitation datasets on the southern slope of central Himalaya. Atmos. Res. 2021, 250, 105365. [Google Scholar] [CrossRef]
Figure 1. (A) Elevation map of South Asia. (B) Land cover types in the study area as generated with the MODIS MCD12 dataset.
Remotesensing 13 03294 g001
Figure 2. (ae) The spatial patterns of different standardized soil moisture index (SSMI) over South Asia. These patterns have been scaled in the form of ±1, hence temporal assessment indicates the genuine magnitude (Figure 4) of SSMI, where spatial patterns have values near ±1.
Remotesensing 13 03294 g002
Figure 3. (ae) Spatial patterns of (a) SPI from CHIRPS, (b) SPI from GPCC, (c) TWSI from MERRA-2, (d) SA from GRACE, and (e) VCI from AVHRR over South Asia. These patterns have been scaled in the form of ±1, and hence temporal assessment indicates the genuine magnitude (Figure 5) of SI/SA, where spatial patterns have values nearby ±1.
Remotesensing 13 03294 g003
Figure 4. (ad) Temporal assessment of standardized soil moisture index data over the study region. Temporal valuation interpreted in conjunction with Table 2.
Remotesensing 13 03294 g004
Figure 5. (ad) Temporal assessment (SPI from CHIRPS, SPI from GPCC, TWSI from MERRA-2, SA from GRACE, and VCI from AVHRR) over the study region. Temporal valuation interpreted in conjunction with Table 2.
Remotesensing 13 03294 g005
Figure 6. Relationships between drought indices for all four regions of South Asia.
Remotesensing 13 03294 g006
Figure 7. (ad) Taylor diagrams indicating the overall rankings of products (SSMI from MERRA-2, FLDAS, CPC, GLDAS and ERA5, SPI from CHIRPS and GPCC, TWSI from MERRA-2, SA from GRACE, and VCI from AVHRR) relative to MERRA-2 soil moisture over all regions of South Asia. The angular axis denotes the coefficient of correlation and the radial axis indicates the standard deviation. The semi-circle demonstrates the root mean square difference (RMSD).
Remotesensing 13 03294 g007
Figure 8. (al) The relationships between the yield anomaly index (YAI) data and drought index/anomaly data for South Asian countries.
Remotesensing 13 03294 g008
Table 1. Summary of the datasets.
ParametersProductsTemporal ResolutionSpatial ResolutionDurationPrimary References
PrecipitationCHIRPSMonthly0.05° × 0.05°1982–2019Funk et al., 2015; McNally et al., 2017, 2016; Shukla et al., 2014 [28,33,34,42].
GPCCMonthly0.5° × 0.5°1982–2019Agutu et al., 2017; Dutra et al., 2014; C. Funk et al., 2014; Kurnik et al., 2011 [12,50,51,52].
Soil moistureFLDASMonthly0.1° × 0.1°1982–2019Agutu et al., 2017; Jung et al., 2020; McNally et al., 2017 [12,34,53].
GLDASMonthly1° × 1°1982–2014Agutu et al., 2017; Chen et al., 2020; Jung et al., 2020 [12,53,54].
CPCMonthly0.5° × 0.5°1982–2019Fan and van den Dool, 2004; Wu, 2014 [55,56].
MERRA-2Monthly0.625° × 0.5°1982–2019Chen et al., 2020, 2019; Le et al., 2020 [54,57,58].
ERA5Monthly1° × 1°1982–2019Almendra-Martín et al., 2021; Cheng et al., 2019 [38,59].
TWSMERRA-2Monthly0.625° × 0.5°1982–2019Agutu et al., 2017; Bosilovich et al., 2015 [12,36].
GRACEMonthly1° × 1°2002–2017Fan and van den Dool, 2004; Heimhuber et al., 2019; Wu, 2014 [55,56,60].
VCINDVI15 days0.083° × 0.083°1982–2019Ali et al., 2019a; Bhuiyan et al., 2006; Karnieli et al., 2010; Wang et al., 2001 [20,48,61,62].
Crop dataBarley, maize, wheat, and riceAnnualNational1982–2019http://www.fao.org/faostat/en/#data/QC
(accessed on 20 February 2021).
Table 2. SPI drought categories [75].
SPIDrought Categories
>1.65Extreme wetness
>1.28Severe wetness
>0.84Moderate wetness
>−0.84 and <0.84Average (normal)
<−0.84Moderate dryness
<−1.28Severe dryness
<−1.65Extreme dryness
Table 3. Geographical coverage of study region.
RegionsCountries/Areas
Region 1 (northwest)Afghanistan; northern, eastern, and central parts of Pakistan; Jammu and Kashmir, northern India
Region 2 (southwest)Southern and southwestern Pakistan and western India
Region 3 (northeast)Central and eastern India, Nepal, Bhutan, and Bangladesh
Region 4 (southeast)Southern India and Sri Lanka
Table 4. Percentage of variance as exposed by different products for all four regions.
RegionMERRA-2
(SSMI)
CPC
(SSMI)
FLDAS
(SSMI)
GLDAS
(SSMI)
ERA5
(SSMI)
CHIRPS
(SPI)
GPCC
(SPI)
MERRA-2
(TWSI)
GRACE
(SA)
AVHRR
(VCI)
118.7016.617.9711.624.5814.0918.1120.291.3019.1
214.0617.414.8210.589.0516.7017.0325.960.567.45
315.6015.718.557.704.7917.7615.809.789.645.47
414.8913.712.555.914.2915.4913.4028.406.047.13
Mean63.2563.463.8935.8122.7164.0464.3484.4317.5439.15
Publisher’s Note: MDPI stays neutral with regard to jurisdictional claims in published maps and institutional affiliations.

