Article

Retrieving Crop Albedo Based on Radar Sentinel-1 and Random Forest Approach

by
Abdelhakim Amazirh
1,*,
El Houssaine Bouras
2,3,
Luis Enrique Olivera-Guerra
3,
Salah Er-Raki
1,2 and
Abdelghani Chehbouni
1,3
1
Center for Remote Sensing Applications (CRSA), University Mohammed VI Polytechnic (UM6P), Benguerir 43150, Morocco
2
ProcEDE, Faculty of Sciences and Techniques, Cadi Ayyad University, Marrakech 40000, Morocco
3
Centre d’Etudes Spatiales de la BIOsphère (CESBIO), Université de Toulouse (CNES/CNRS/INRA, IRD/UPS), 31013 Toulouse, France
*
Author to whom correspondence should be addressed.
Remote Sens. 2021, 13(16), 3181; https://doi.org/10.3390/rs13163181
Submission received: 28 June 2021 / Revised: 5 August 2021 / Accepted: 5 August 2021 / Published: 11 August 2021
(This article belongs to the Special Issue Remote Sensing in Irrigated Crop Water Stress Assessment)

Abstract

:
Monitoring agricultural crops is of paramount importance for preserving water resources and increasing water efficiency over semi-arid areas. This can be achieved by modelling the water resources all along the growing season through the coupled water–surface energy balance. Surface albedo is a key land surface variable to constrain the surface radiation budget and hence the coupled water–surface energy balance. In order to capture the hydric status changes over the growing season, optical remote sensing becomes impractical due to cloud cover in some periods, especially over irrigated winter crops in semi-arid regions. To fill the gap, this paper aims to generate cloudless surface albedo product from Sentinel-1 data that offers a source of high spatio-temporal resolution images. This can help to better capture the vegetation development along the growth season through the surface radiation budget. Random Forest (RF) algorithm was implemented using Sentinel-1 backscatters as input. The approach was tested over an irrigated semi-arid zone in Morocco, which is known by its heterogeneity in term of soil conditions and crop types. The obtained results are evaluated against Landsat-derived albedo with quasi-concurrent Landsat/Sentinel-1 overpasses (up to one day offset), while a further validation was investigated using in situ field scale albedo data. The best model-hyperparameters selection was dependent on two validation approaches (K-fold cross-validation ‘k = 10’, and holdout). The more robust and accurate model parameters are those that represent the best statistical metrics (root mean square error ‘RMSE’, bias and correlation coefficient ‘R’). Coefficient values ranging from 0.70 to 0.79 and a RMSE value between 0.0002 and 0.00048 were obtained comparing Landsat and predicted albedo by RF method. The relative error ratio equals 4.5, which is acceptable to predict surface albedo.

1. Introduction

Surface albedo (α), described as the ratio of reflected to incoming (diffuse and direct fractions) solar irradiance at the surface, is one of the main variables affecting environmental, biophysical, and plant physiological processes (respiration, photosynthesis, etc.) as well as Earth’s climate [1,2]. The vegetated land surfaces α is one of the crucial surface variables that play an important role included in the main processes that drive the surface energy balance exchanges and biomass growth, counting rain and light interception and evapotranspiration [3,4].
Surface albedo variation is related to many surface parameters and variables, including soil moisture, roughness, soil color, and the fraction of vegetation [5,6,7,8]. To help improve the ability to model the effects of land surface variation and the exchange between soil-vegetation-atmosphere, a better understanding of α and how it changes with variations in these parameters is crucial. Matthias et al. [5] and Potter et al. [9] stated that in a vegetated area, soil albedo affects soil temperature variation, which influences soil biophysical processes, like plant development, seed germination, and root growth. Over bare soil, α is influenced by soil surface optical properties, solar zenith angle, and soil surface hydric status (degree of dryness or wetness) [5,10,11]. However, Cresswell et al. [12] stated that the α variation is generally affected by soil moisture more than surface roughness, which impacts relatively less on soil albedo variation. In practice, α can be measured based on ground-based, aircraft, or satellite sensors depending on the application level [13,14,15,16,17]. However, these numerous measurements have shown that α shows large seasonal and spatial variations [18,19]. On a local scale, α can be measured directly from in situ observations by albedometers, or using two back-to-back identical pyranometers [16,20,21] or through a goniometric system providing many directional surface reflectance observations [22]. Despite the direct measurements of α, a limited scale can be observed and only a few surfaces can be characterized. Other limitations are related to economic and technological constraints as well as direct measurements are time consuming [18]. On a spatial scale, α derived from ground-based observations is not valid for other sites due to the spatial and temporal variations associated with surface properties of other external factors affecting α such as snow cover [23], altitude (relief) [24], soil moisture [21,25,26], and seasonal variation of vegetation characteristics. Therefore, accurate estimates of α over each field are known as becoming progressively significant in many respects. In this regard, remote sensing as a promising technic to retrieve α in different spatial scales proved its applicability and accuracy for a varied range of surface land cover types. Several previous studies have focused on estimating α from satellite observations based on radiative transfer model inversion and have been devoted to deriving regional α from satellite sensed information, like the Moderate Resolution Imaging Spectroradiometer (MODIS) [27,28,29,30,31], Advanced Very High Resolution Radiometer (AVHRR) [32], POLarization and Directionality of the Earth’s Reflectances (POLDER) [33], Multi-angle Imaging Spectroradiometer (MISR) [30], Meteosat-EUMETSAT [34], and the Spinning Enhanced Visible and InfraRed Imager (SEVIRI) [35]. Wang et al. [27] have proved that MODIS-based albedo and in situ observations are in accordance and agree well over different land surface types. Moreover, other works have also validated global albedo derived from satellites against ground-based measurements over several land covers [27,36,37,38,39,40]. However, α products are available at a kilometric and sub-kilometric resolution (500m) every 16 and even 8 days’ time scale, which makes their application over agriculture areas and individual small land areas limited [41]. In this context, high spatio-temporal resolution offered by many sensors, such as Sentinel 2, Landsat, and FORMOSAT-2 sensors, could fill the gap [42]. Bsaibes et al. [43] have used FORMOSAT-2 near infrared and red reflectances to retrieve solar albedo based on empirical approaches using continuous in situ observations over some different fields. In the same vein, other research used reflectance bands in green, red, and near infrared [42,44,45].
The above techniques are based on unidirectional surface reflectance, where they consider the surface as a Lambertian, therefore considering α equivalent to surface reflectance [46,47,48,49,50]. Other works were focused on driven α based on surface reflectance derived in diverse angular observations acquired from airborne data [51]. These works are based on the fact that surface reflectance is highly anisotropic, where a lot of numbers of angular measurements are necessary to derive α overall views and illumination angles, incorporating the bidirectional reflectance distribution function [31,51,52,53,54,55]. However, retrieving surface albedo at a daily scale remains a challenging issue, due to its complexity and difficulty of implementation. In addition, optical data requires many cloudless images of the surface during the investigated time every day [56,57,58,59]. Promising tools like machine learning approaches have demonstrated their ability to retrieve many environmental variables and solve complex non-linear problems. Machine learning approaches were used for monitoring a normalized difference vegetation index using Sentinel-1 data [60], while other works used machine leaning approaches for spatial downscaling of land surface temperature [61,62], mapping soil moisture [63,64], gap-filling of high-resolution soil moisture [65], evapotranspiration [66], and crop yield forecasting [67].
Even though many authors widely used the above-mentioned remote sensing algorithms and methodologies to retrieve surface albedo, cloud cover remains the main limitation and challenge to monitor environmental variables, where the optical remote sensing-based methods are promising in regions with infrequent cloud conditions. This issue affects the temporal resolution and makes monitoring α continuously unsuitable for an operational standpoint. To fill the gap, radar sensors give the opportunity to monitor surface variables in any conditions since they are not affected by clouds [68]. Thus, the aim of this work is to retrieve α independently of cloud cover (cloudless albedo product) for agricultural applications using cloud-free Sentinel-1 data. The idea is to model the α based on the Sentinel-1 backscatter coefficient with random forest regression technique. The presented research paper differs from the past studies, where the used approach here will allow for retrieving α independently from optical data. Nevertheless, retrieving α from radar and optical data such as Landsat could also be coupled, providing a continuous albedo product with a high frequency. In addition, this study uses radar images (Sentinel-1) to derive the crop albedo with high resolution although the presence of clouds.

2. Materials and Methods
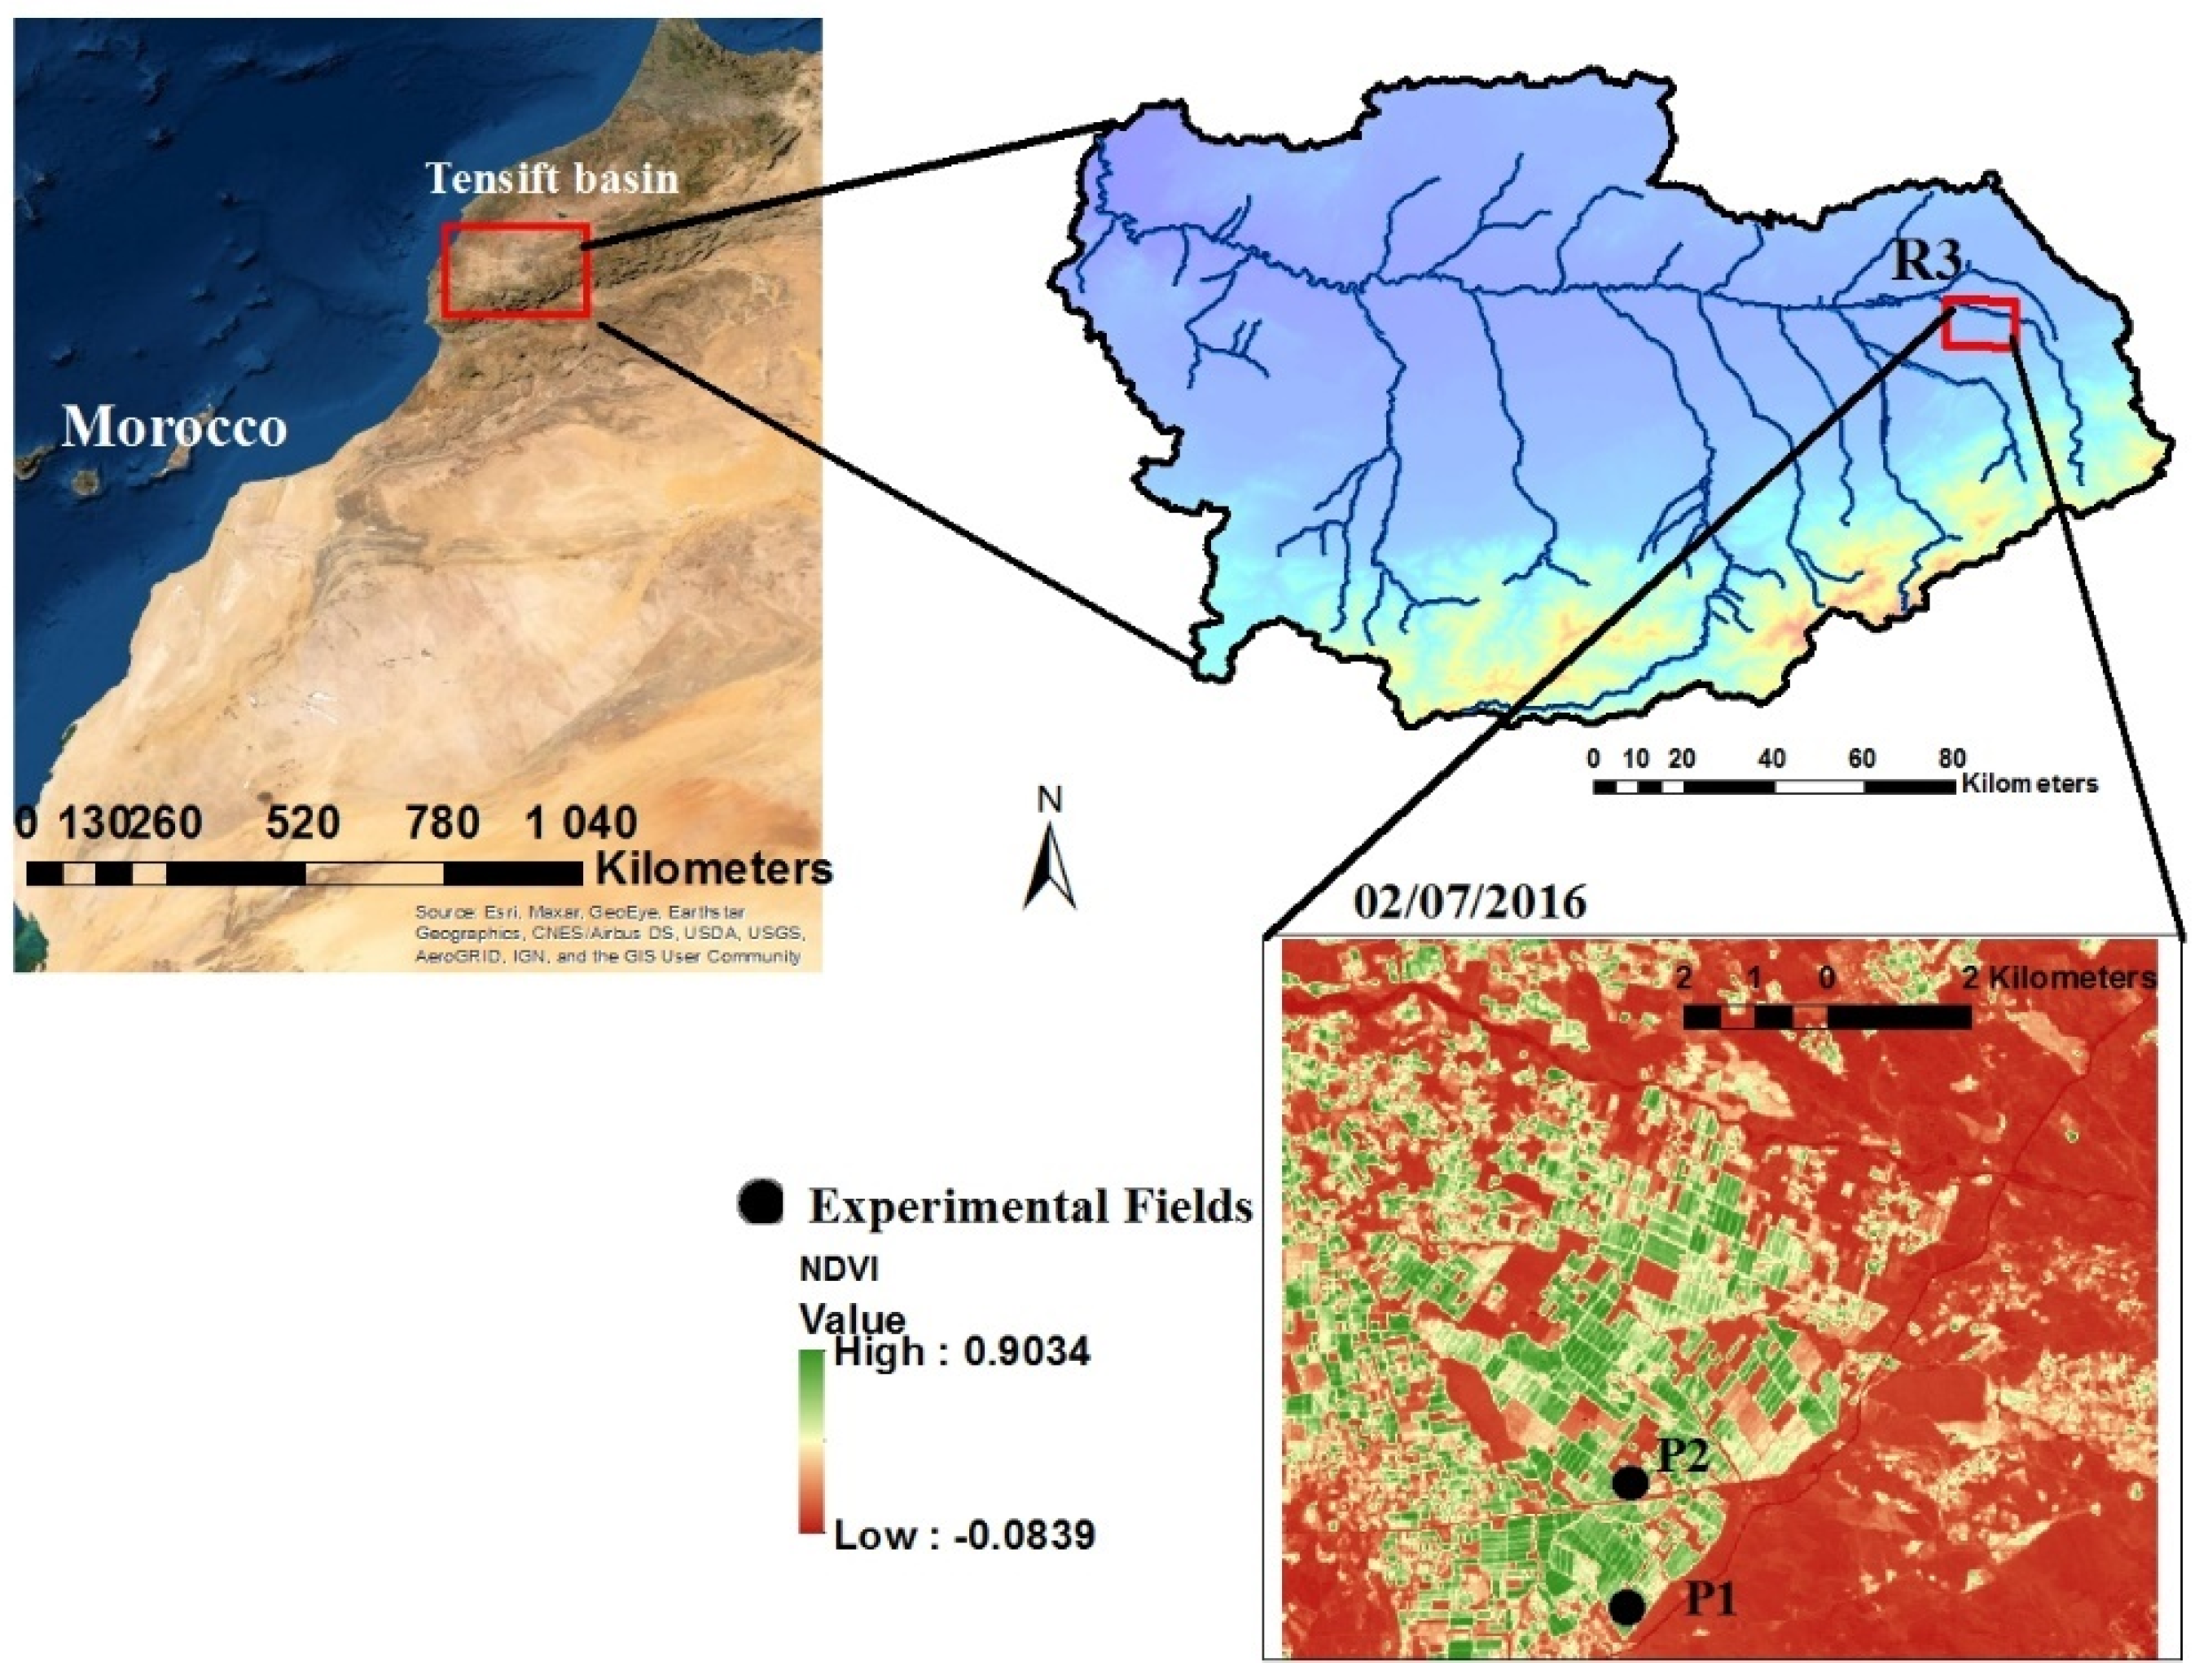
2.1. Study Site

The study was investigated in a semi-arid zone in Morocco over the Tensift region. This area is located in North Africa especially in the center of Morocco (Figure 1). It occupies about 24,000 km2, which corresponds to 4.4% of the Moroccan domain. This zone is known for a different topography (landform) with a wide altitude range. This area received an amount of 250 mm/year of rainfall against 1600 mm/year of reference evapotranspiration (ET0). This pushed farmers to an overexploitation of water resources through irrigation to overcome the crop water needs. The investigated area is known by different altitudes, from 575 m to 927 m (Figure 1). The area is known for its heterogeneity in terms of land covers like wheat, olive, alfalfa, and horticulture, including an irrigated perimeter called R3 where 50% of this area is occupied by wheat crops. The selected area is considered as a well-known area and it has been extensively utilized as a typical agricultural area since 2002 [69,70,71,72,73,74,75,76,77,78,79,80]. Two experimental wheat sites were made in the R3 perimeter during the 2015/2016 agricultural season: a 4-ha flood-irrigated field (P1) and a 2-ha drip-irrigated field (P2). The two irrigated wheat sites were permanently monitored over the season (Figure 1).

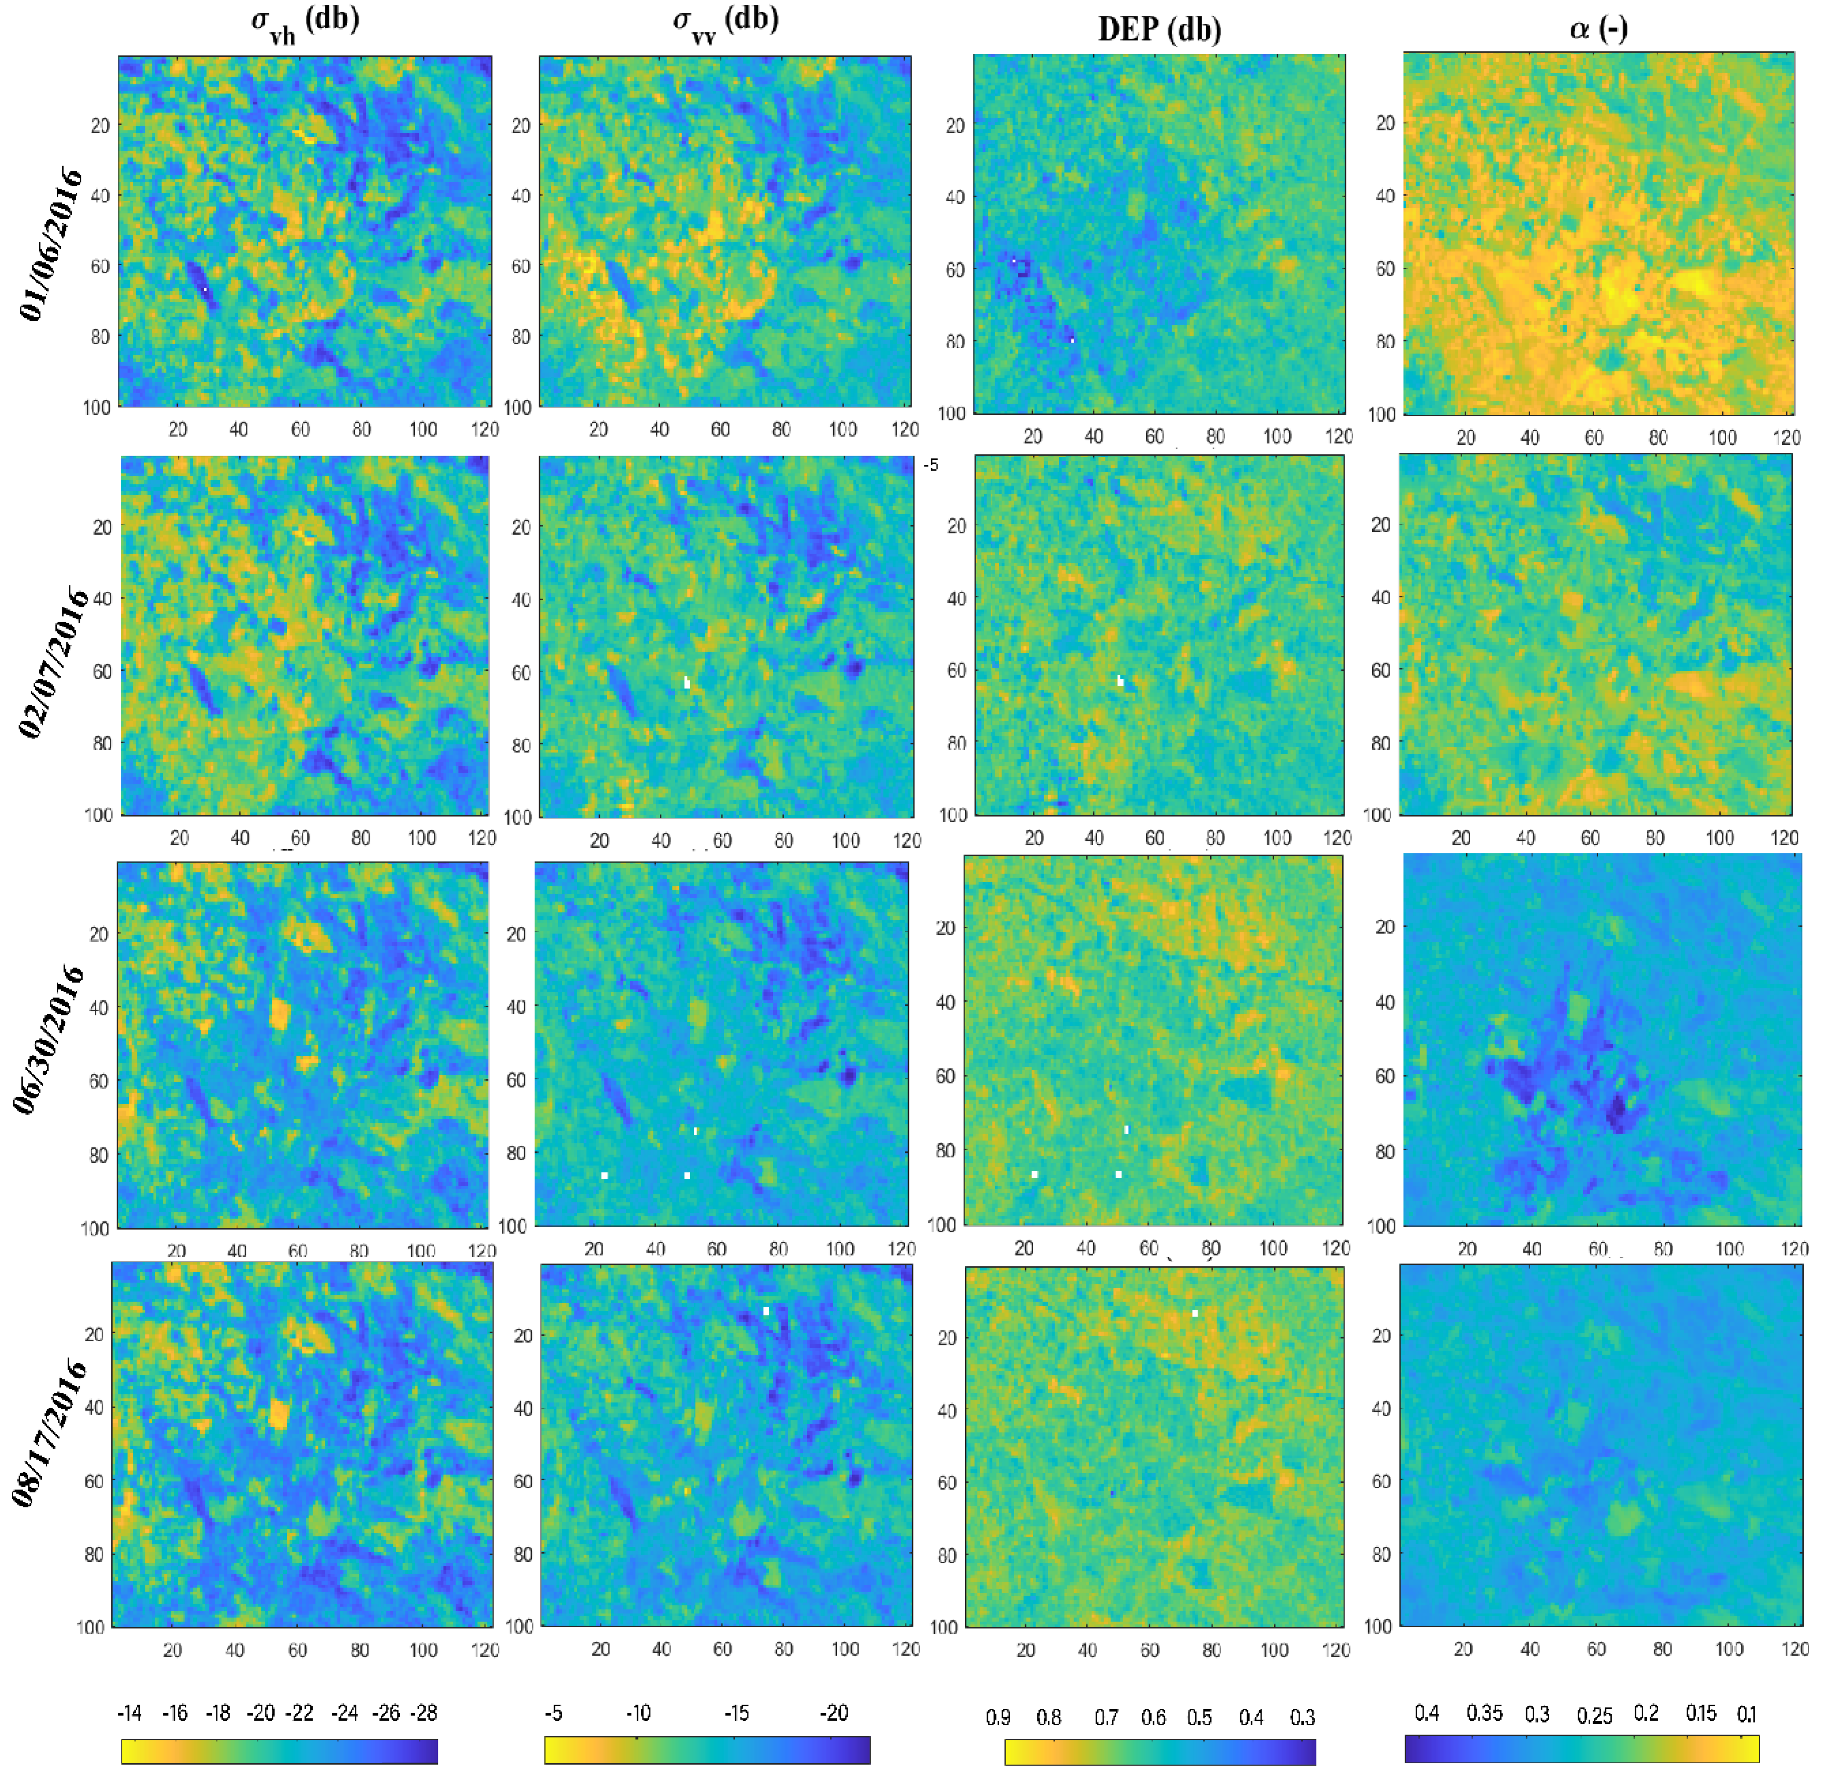
2.2. Data Description and Processing

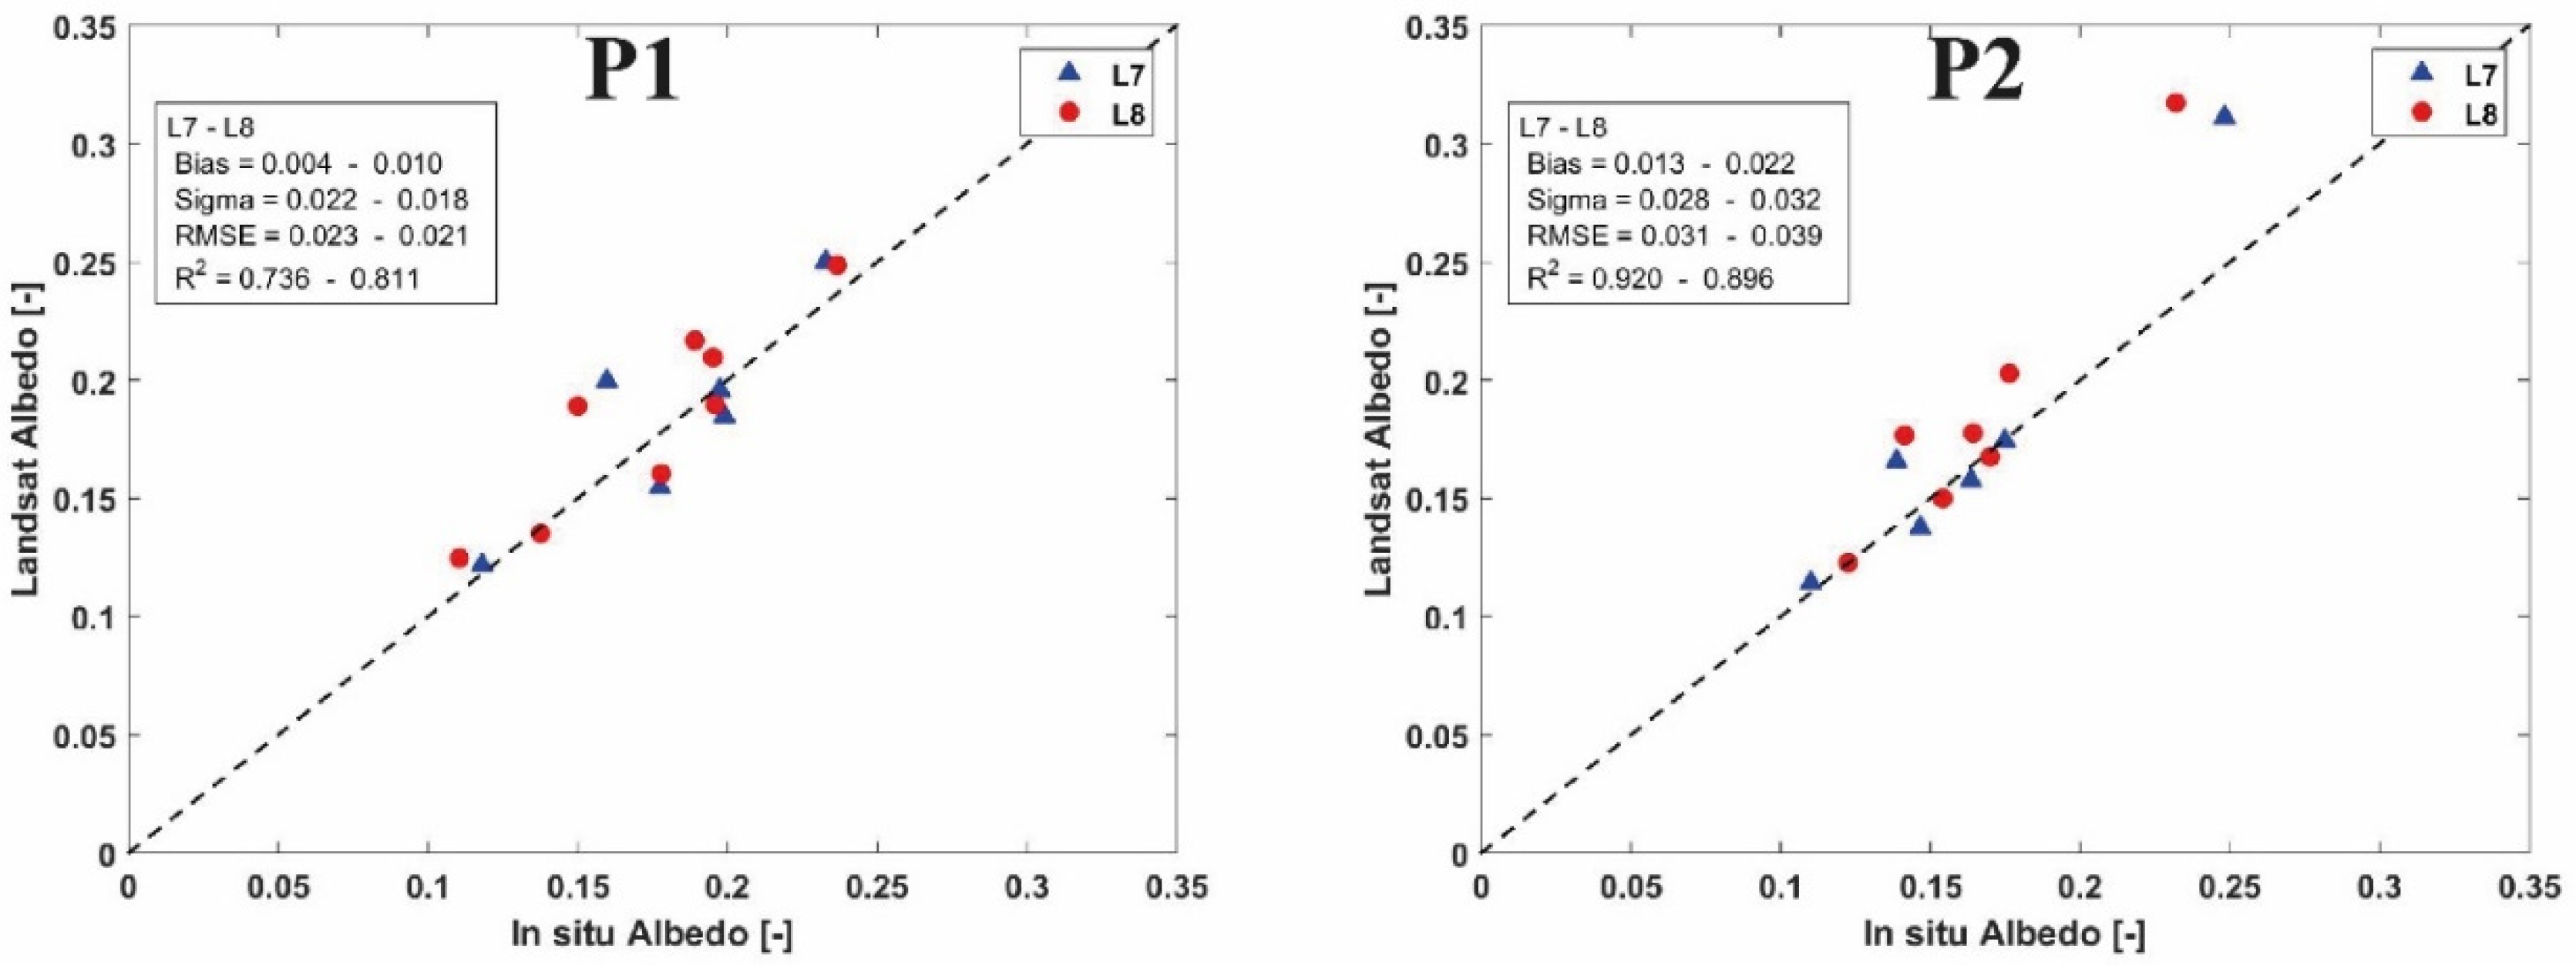
2.2.1. In Situ Albedo Measurements

Both monitored sites were equipped with two eddy covariance (EC) systems providing energy flux measurements. Net radiometer Kipp and Zonen CNR4 sensors were installed in the tower, providing net radiation (Rn) measurements and incoming and outgoing short-wave components. The incoming and the outgoing short-wave components were used to calculate the daily ground-based albedo at the Landsat overpass satellite (~11 a.m.) due to the fact that Landsat data were used as reference data to validate the predicted albedo.

2.2.2. Landsat

Landsat 7 (L-7) and Landsat 8 (L-8) satellites were launched in April 1999 and February 2013 by the National Aeronautics and Space Administration (NASA), respectively. The images were acquired freely from the United States Geological Survey (USGS) Earth Explorer (URL: https://earthexplorer.usgs.gov/) website (accessed on 7 August 2021).
L-8 (L-7) images the land surface at eleven (eight) spectral bands in the optical and thermal infrared domains. The spatial resolution ranged from 30 m to 100 m with a revisit time of 16 days. By using both sensors, this allows acquiring data with a frequency of 8 days. Six L-7 and eight L-8 cloud-free level-1 images were available in the 2015–2016 wheat growing season (14 images in total), which were acquired at 11:30 a.m. Note that Landsat data were used as reference data to validate the random forest albedo predictions.
In this study, for the optical data, the top-of-atmosphere (TOA) reflectance values were corrected for atmospheric effects, including environmental effects to get the surface reflectance. Then, corrected reflectances were projected into WGS84 UTM Zones 29 North. Reflectance at the red (RED) and near infrared (NIR) bands were used to compute the surface albedo (α) by weighting the RED and NIR reflectances with the coefficients given by Weiss et al. [42] and this was validated in Bsaibes et al. [43]. This equation was used and validated over several sites [81,82].
α = 0.6 RED + 0.4 NIR
To assess the reliability of α derived from L7/L8, the corresponding pixels of Landsat α were compared against in situ α for each site. The comparison is presented in Figure 2 for both monitored sites in the R3 irrigated perimeter for all of the year 2016 (January to December).
From Figure 2, a very good agreement is noticed between ground-based and satellite-derived α with a determination coefficient (R2) of 0.73 and 0.81 with a root mean square error (RMSE) equal to 0.021 and 0.023 for the flood-irrigated site (P1) using L-7 and L-8, respectively. For the drip-irrigated site, an R2 reach 0.92 and 0.89 with an RMSE equal to 0.031 and 0.039 using L-7 and L-8, respectively. The shortage of spatial representativeness of in situ data at the L-7 and L-8 pixel scales explains the small errors and slight overestimation. In addition, the in situ measurements of α are performed over a limited and tiny portion of the target. The covered in situ area corresponds to a small area within Landsat pixel. Finally, each crop field might include a combination of wet and dry Landsat pixels. At the field scale, a linear average of all pixel values was calculated.

2.2.3. Sentinel-1

ESA Sentinel-1 (S-1) mission is composed of a constellation of two identical satellites: the S-1A, which was launched in April 2014, and the S-1B, which was launched in April 2016, in the frame of the Copernicus program. S-1 data were acquired for free from the S-1 Data Hub website (https://scihub.copernicus.eu/) (accessed on 7 August 2021). Both sensors orbit at an altitude of ~700 km in the same orbital plane with a phase shift of 180°. S-1 twins operate at a frequency of 5.33 GHz, which corresponds to wavelength of 5.6 cm. This frequency lies down in C-band synthetic aperture radar. Four operational modes (Wave, Extra Wide Swath, Interferometric Wide Swath, and Strip Map) with different polarizations are provided by S-1 sensors. The data were acquired with a high temporal resolution that could go up to 3–6 days by using S-1A and S-1B. In the interferometric Wide Swath mode, S-1 provides data at cross-polarization VH and co-polarization VV mode where V and H stand for vertical-horizontal, respectively. The native resolution of S-1 data is 10 m with an incidence angle around 40° for the ascending and descending overpasses over the investigated area.
The S-1 signal underwent several corrections to convert raw intensity to a backscattering coefficient using the Sentinel Application Platform (SNAP). The first step is to remove thermal noise from the power-detected images by removing additive noise. After that, radiometric calibration was applied to obtain a backscattered signal called the backscattering coefficient which expresses in general in decibel (dB). Then applying geometric corrections to correct for geometric distortions and deformations related to the satellite view mode, using a Digital Elevation Model (DEM-SRTM). Finally, a refined Lee speckle filter was adopted to reduce speckle effects in the images.

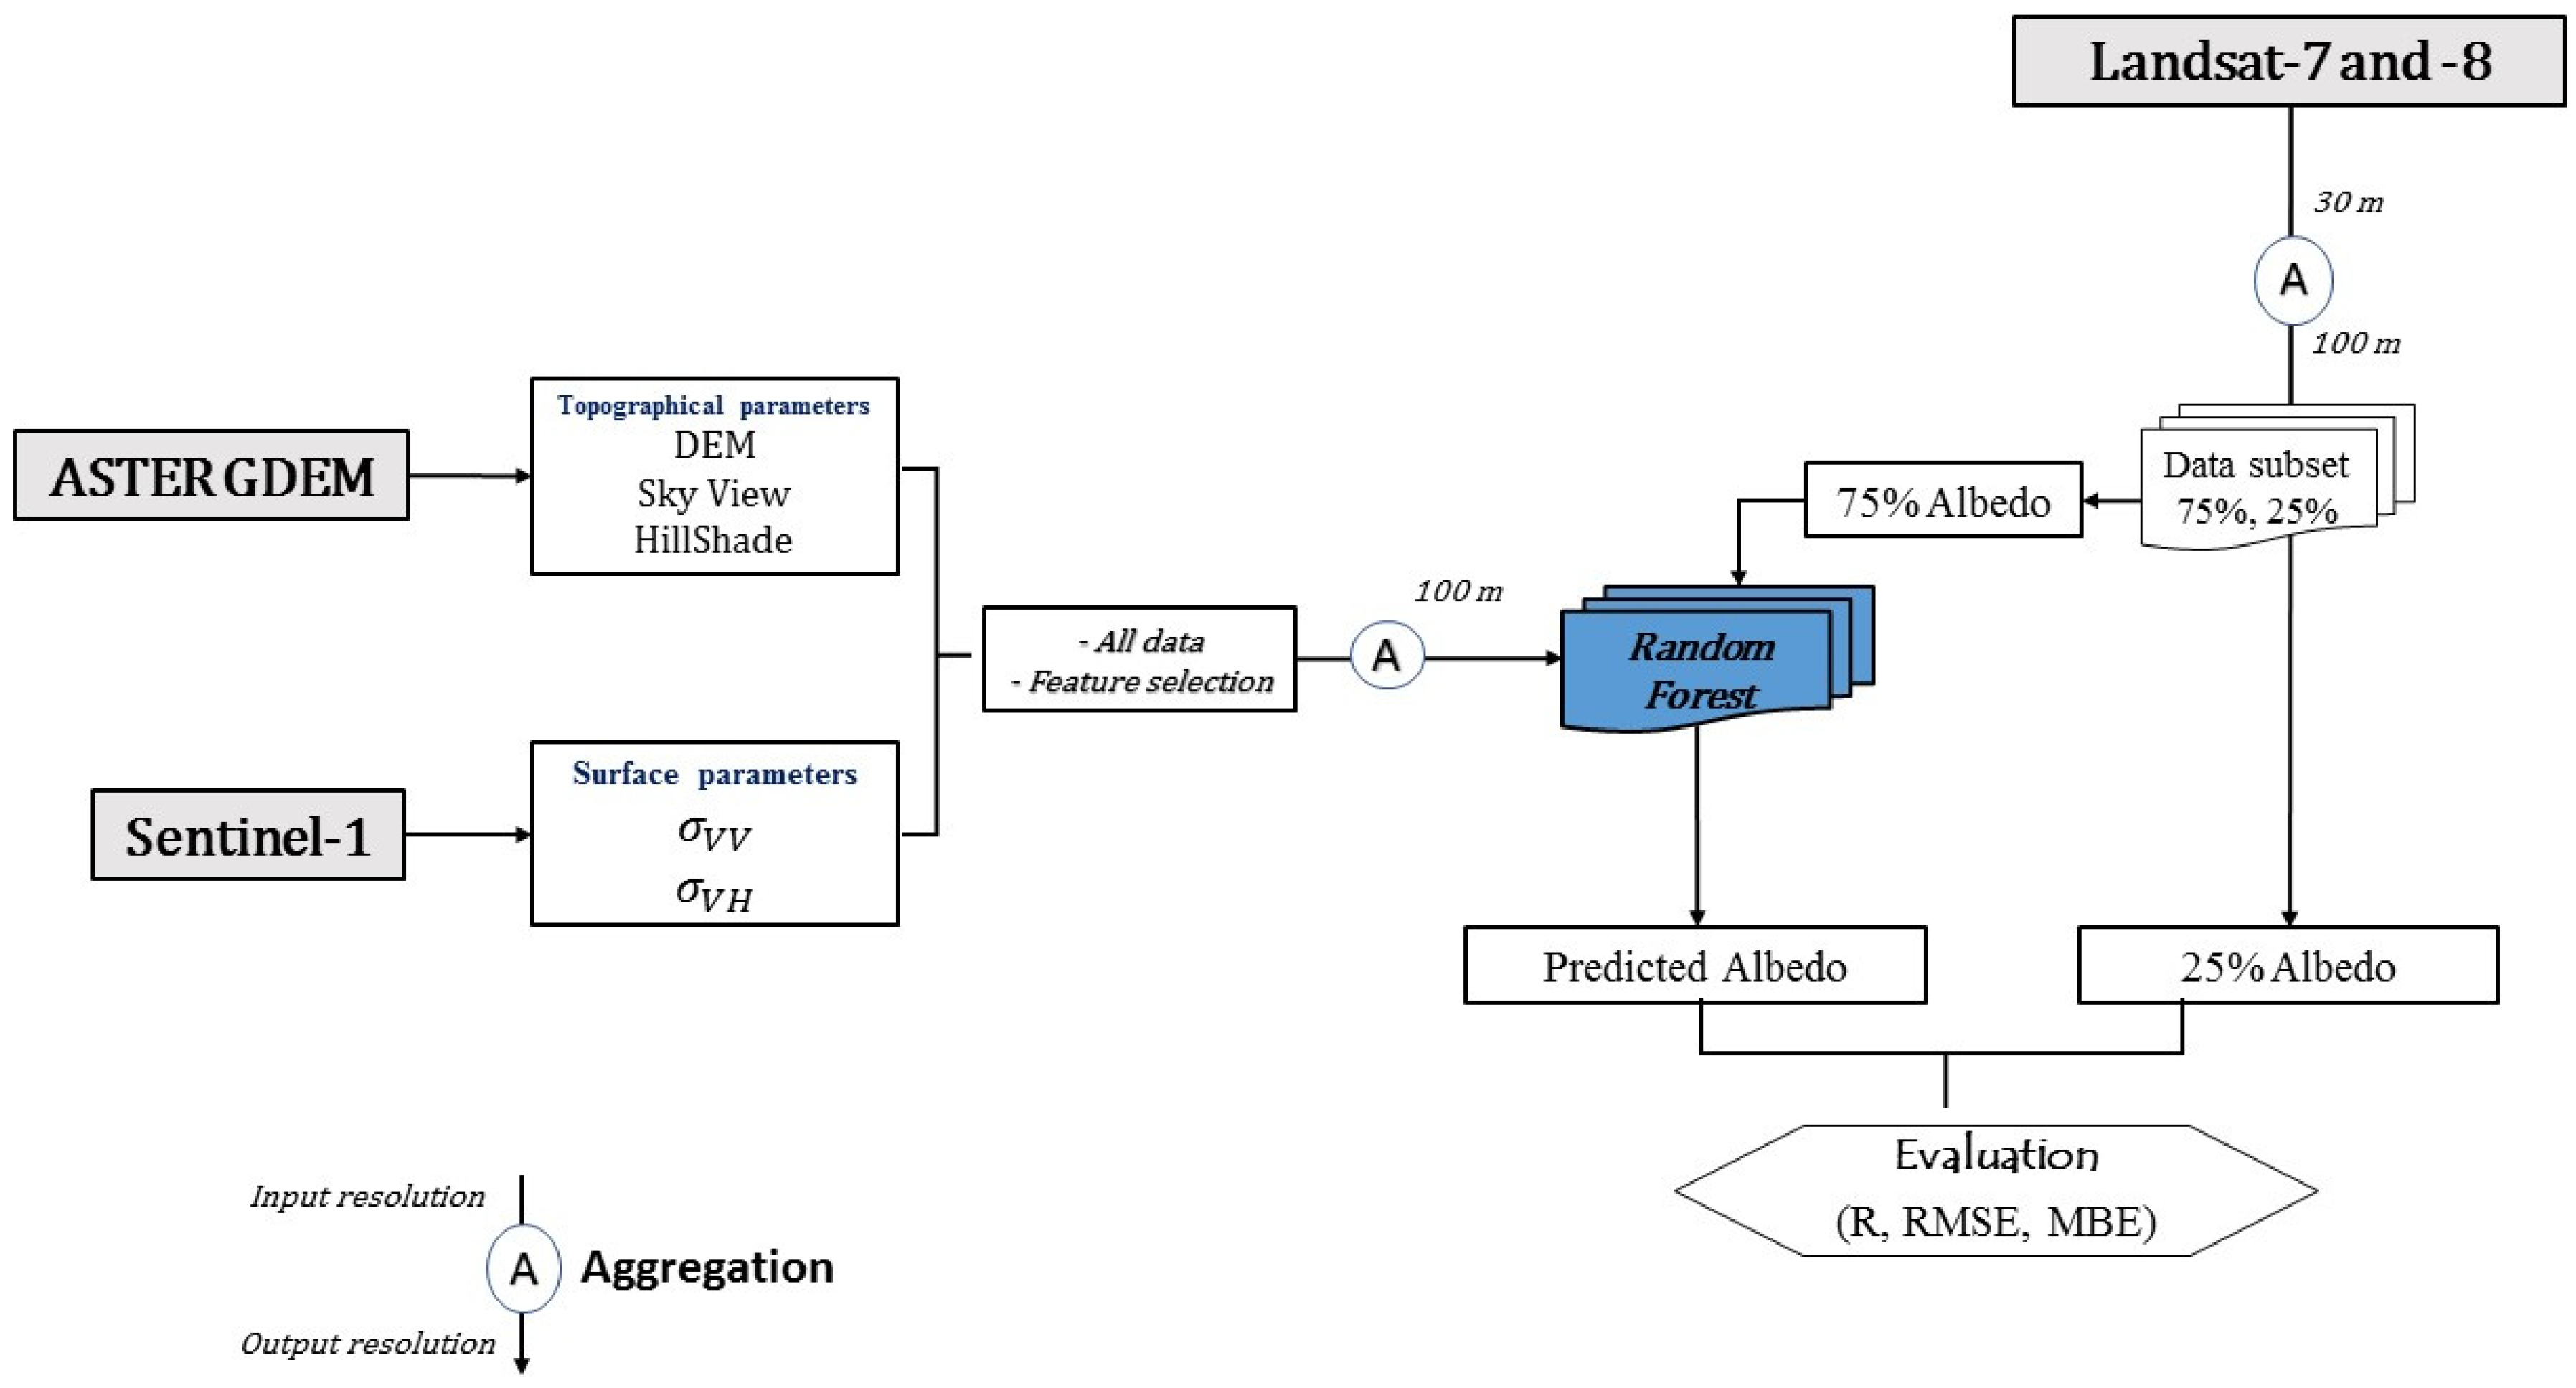
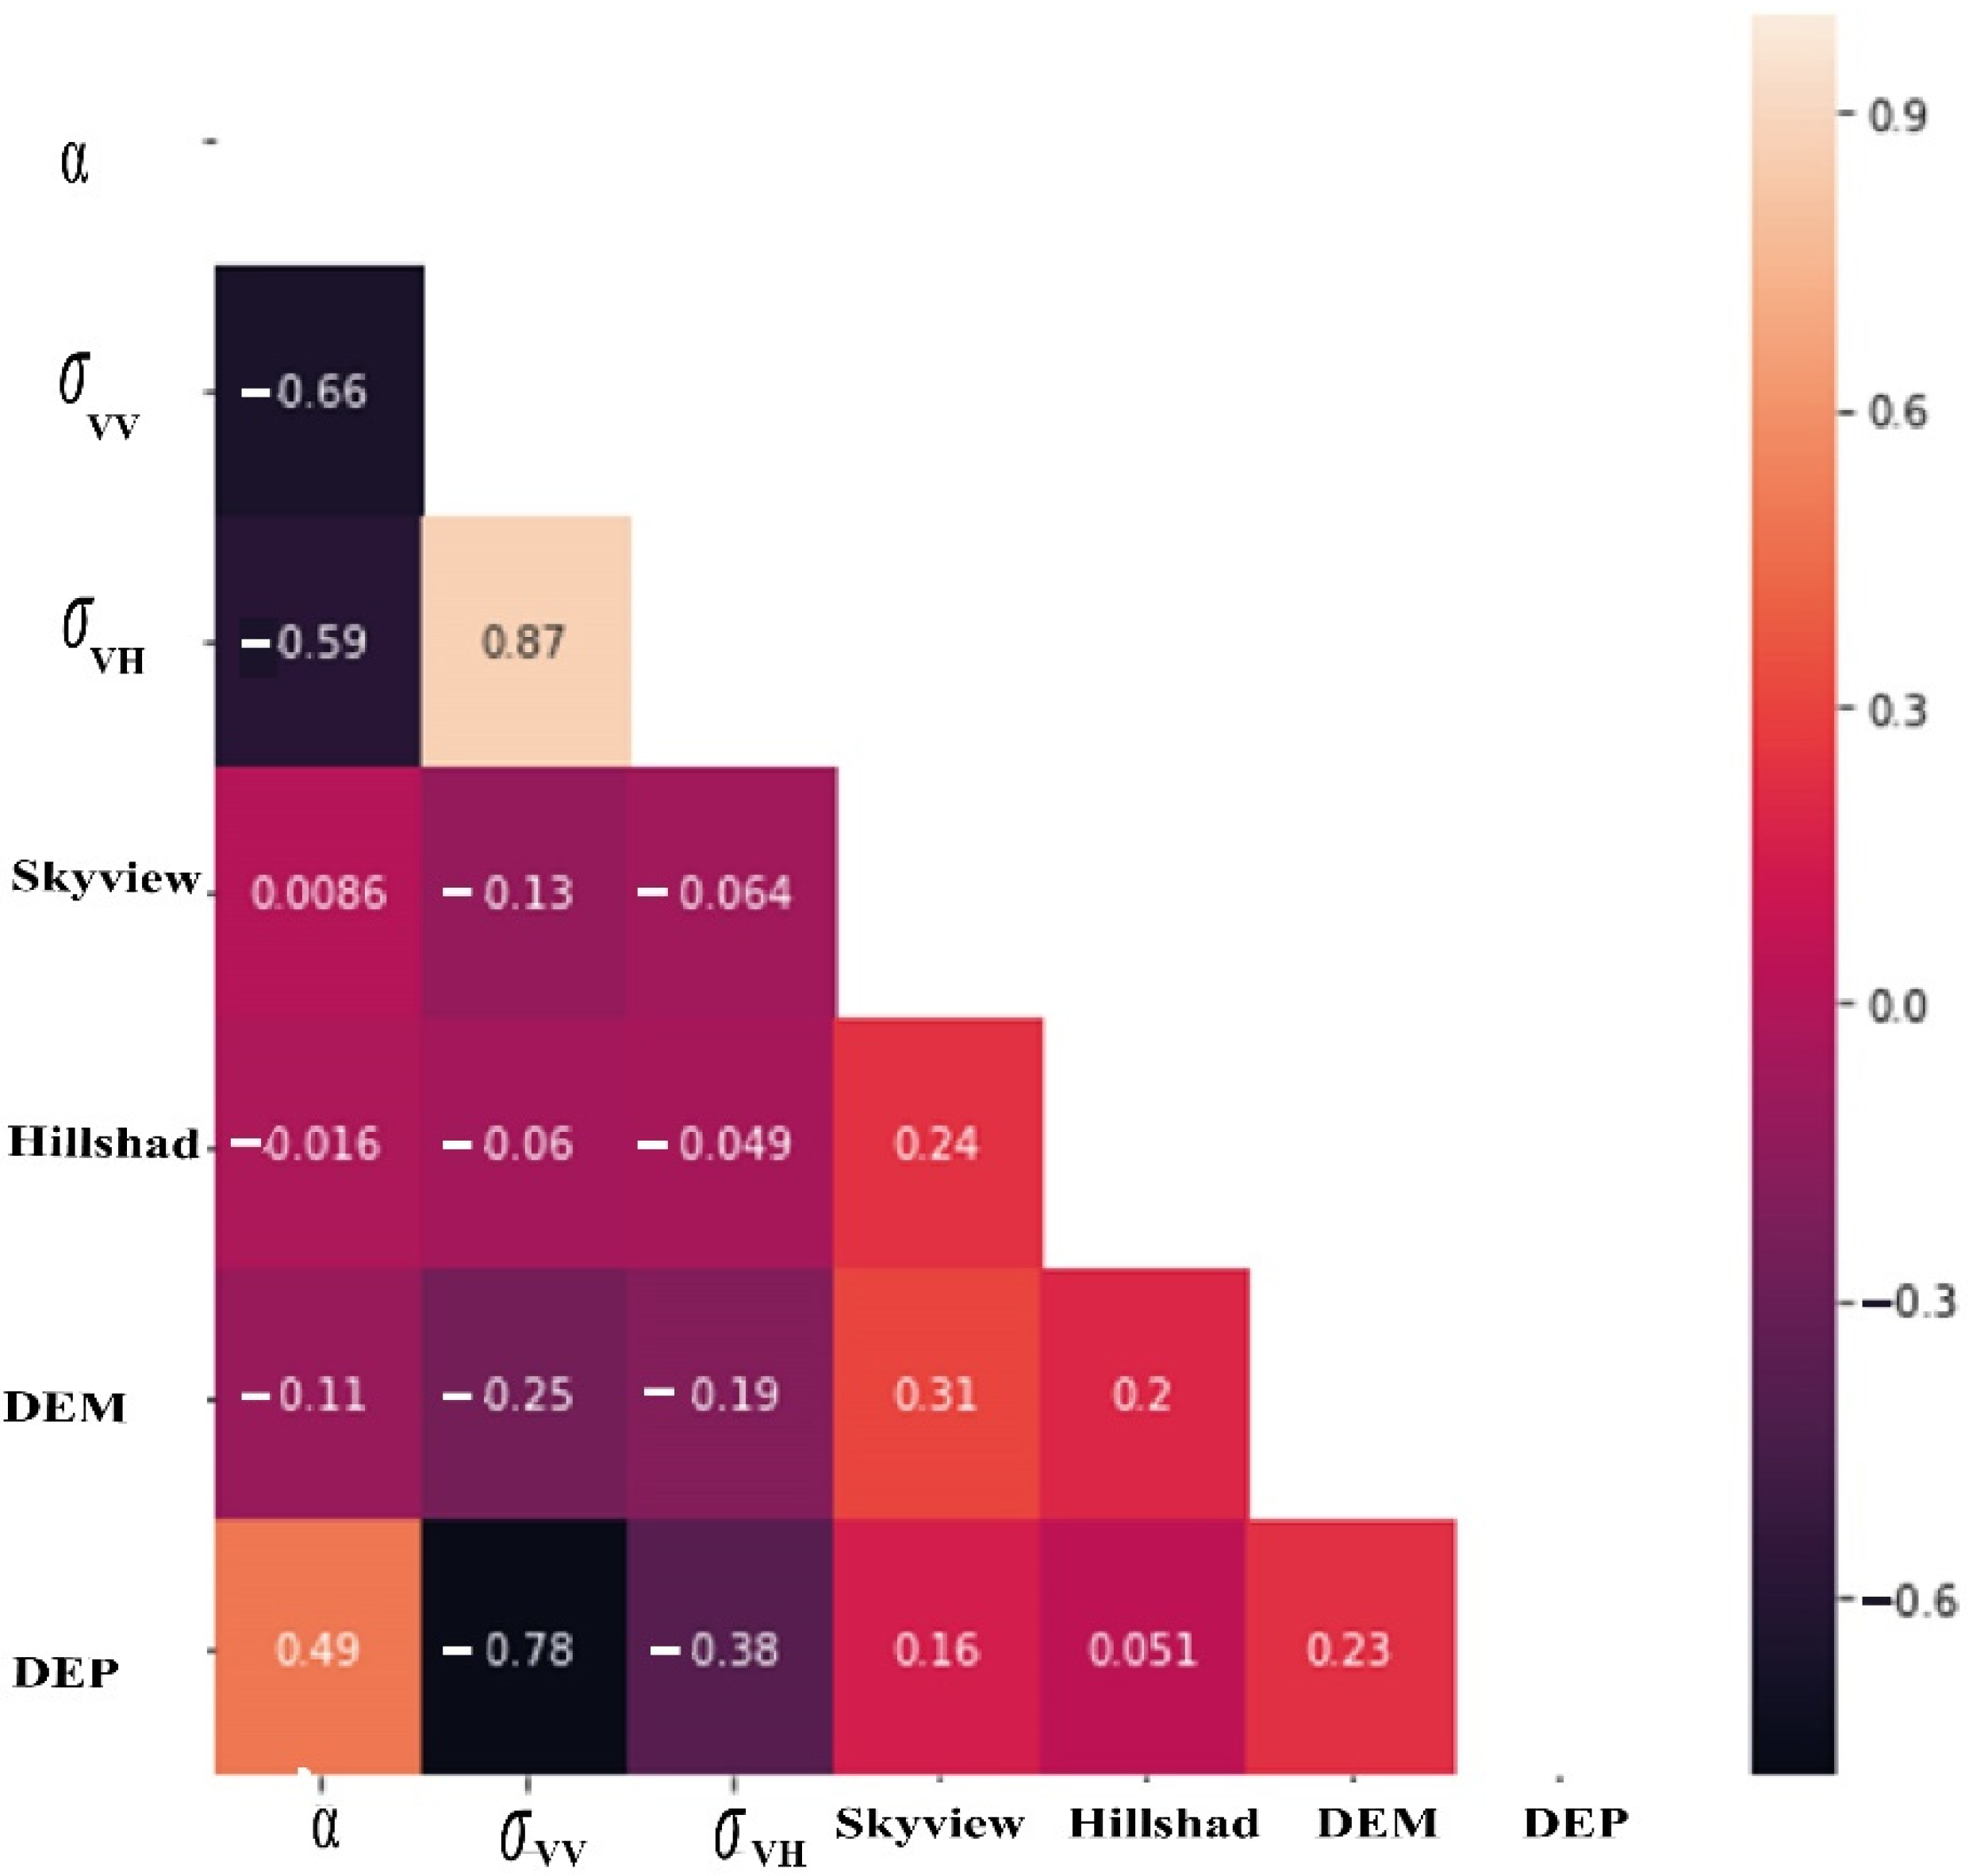
2.3. Method: Regression Algorithms and Approaches Used in Albedo Modeling

The random forest (RF) model is a machine learning model that has been widely utilized for solving classification and regression problems [83]. RF model is a non-linear regressor that functions by constructing an assembly of decision trees (multiple weak classifiers) at the training step and providing in output mean prediction (regression) of individual trees or classes for regression or classification problems, respectively [83]. The RF algorithm has many advantages in the regression tasks such as simplicity and flexibility where the affection is lower than other models by hyper-parameters. The decorrelated, adaptive, and randomized features make RF appropriate for non-linear relationships and complex algorithms.
Because the RF algorithm is non-parametric, more related input variables can be included. Further, it is not sensitive to outliers and performs well in the training stage when it comes to randomizing samples and variables. In this paper, the central idea of the RF model is to create a nonlinear function to estimate α based on regression trees as follows:
α = Ӻ R F   ( σ V V ,   σ V H , D E P ,   D E M , S k y V i e w , H i l l s h a d e )
where Ӻ R F is a nonlinear function that relates input variables to output α by a nonlinear relationship. σ V V   and   σ V H are the backscatter VV and VH polarization, respectively. DEP is the depolarization ratio which is calculated as σ V V / σ V H . DEM (m) is the digital elevation model. The hillshade and sky view (the percentage of the sky visible from each pixel) are computed based on DEM. According to Ayoubi et al. [84], the obtained images were divided randomly into two group of pixels: training (75%) and validation (25%). The RF models were evaluated at 100 m resolution in this study using one agriculture season (2015–2016) of available overlapping Landsat and Sentinel-1 data throughout the whole study area. In order to provide one image for each step of wheat growth, three dates were chosen based on the wheat growth stages including the initial, the development-mid-season, the late season, and one day after harvest (by August). In the training procedure, 45,750 points were used and a 10-fold cross-validation method was set up to adjust RF parameters in order to ensure the generalizability and robustness of the RF models. The pixels samples were divided into ten portions at random, with nine serving as the training dataset and the remaining serving as the testing dataset. In this work, the k value was set as 10. The developed approach was applied over an irrigated perimeter R3.
A grid-search optimization method [63,85] was adopted to optimize the most relevant hyper-parameters in RF model. The most important parameters in RF that have been optimized in order to achieve better prediction results are the maximum characteristic number that determines node splitting among different decision trees (max features), the maximum depth of a decision tree (max depth), and the number of decision trees (m). The optimized max_features, max_depth, and m values were equal to 2, 500, and 100, respectively. Figure 3 presents the flowchart of the investigated approach.
The approach to estimate α from radar data was compared against the α estimated from Landsat data using the correlation coefficient (R), bias (MBE), and root mean square error (RMSE). The calculation formulas for R, bias, and RMSE are as follows:
R = ( i = 1 n ( I i I ¯ ) ( E i E ¯ ) i = 1 n ( I i I ¯ ) 2 i = 1 n ( E i E ¯ ) 2
MAE = 1 n i = 1 n | E i I i |
RMSE = 1 n i = 1 n ( E i I i ) 2  
where Ei is the estimated value by random forest algorithm; Ii is the reference value of albedo (obtained from Landsat); I ¯ and E ¯ are the means of observed and reference albedo; n denotes the image’s pixel number.

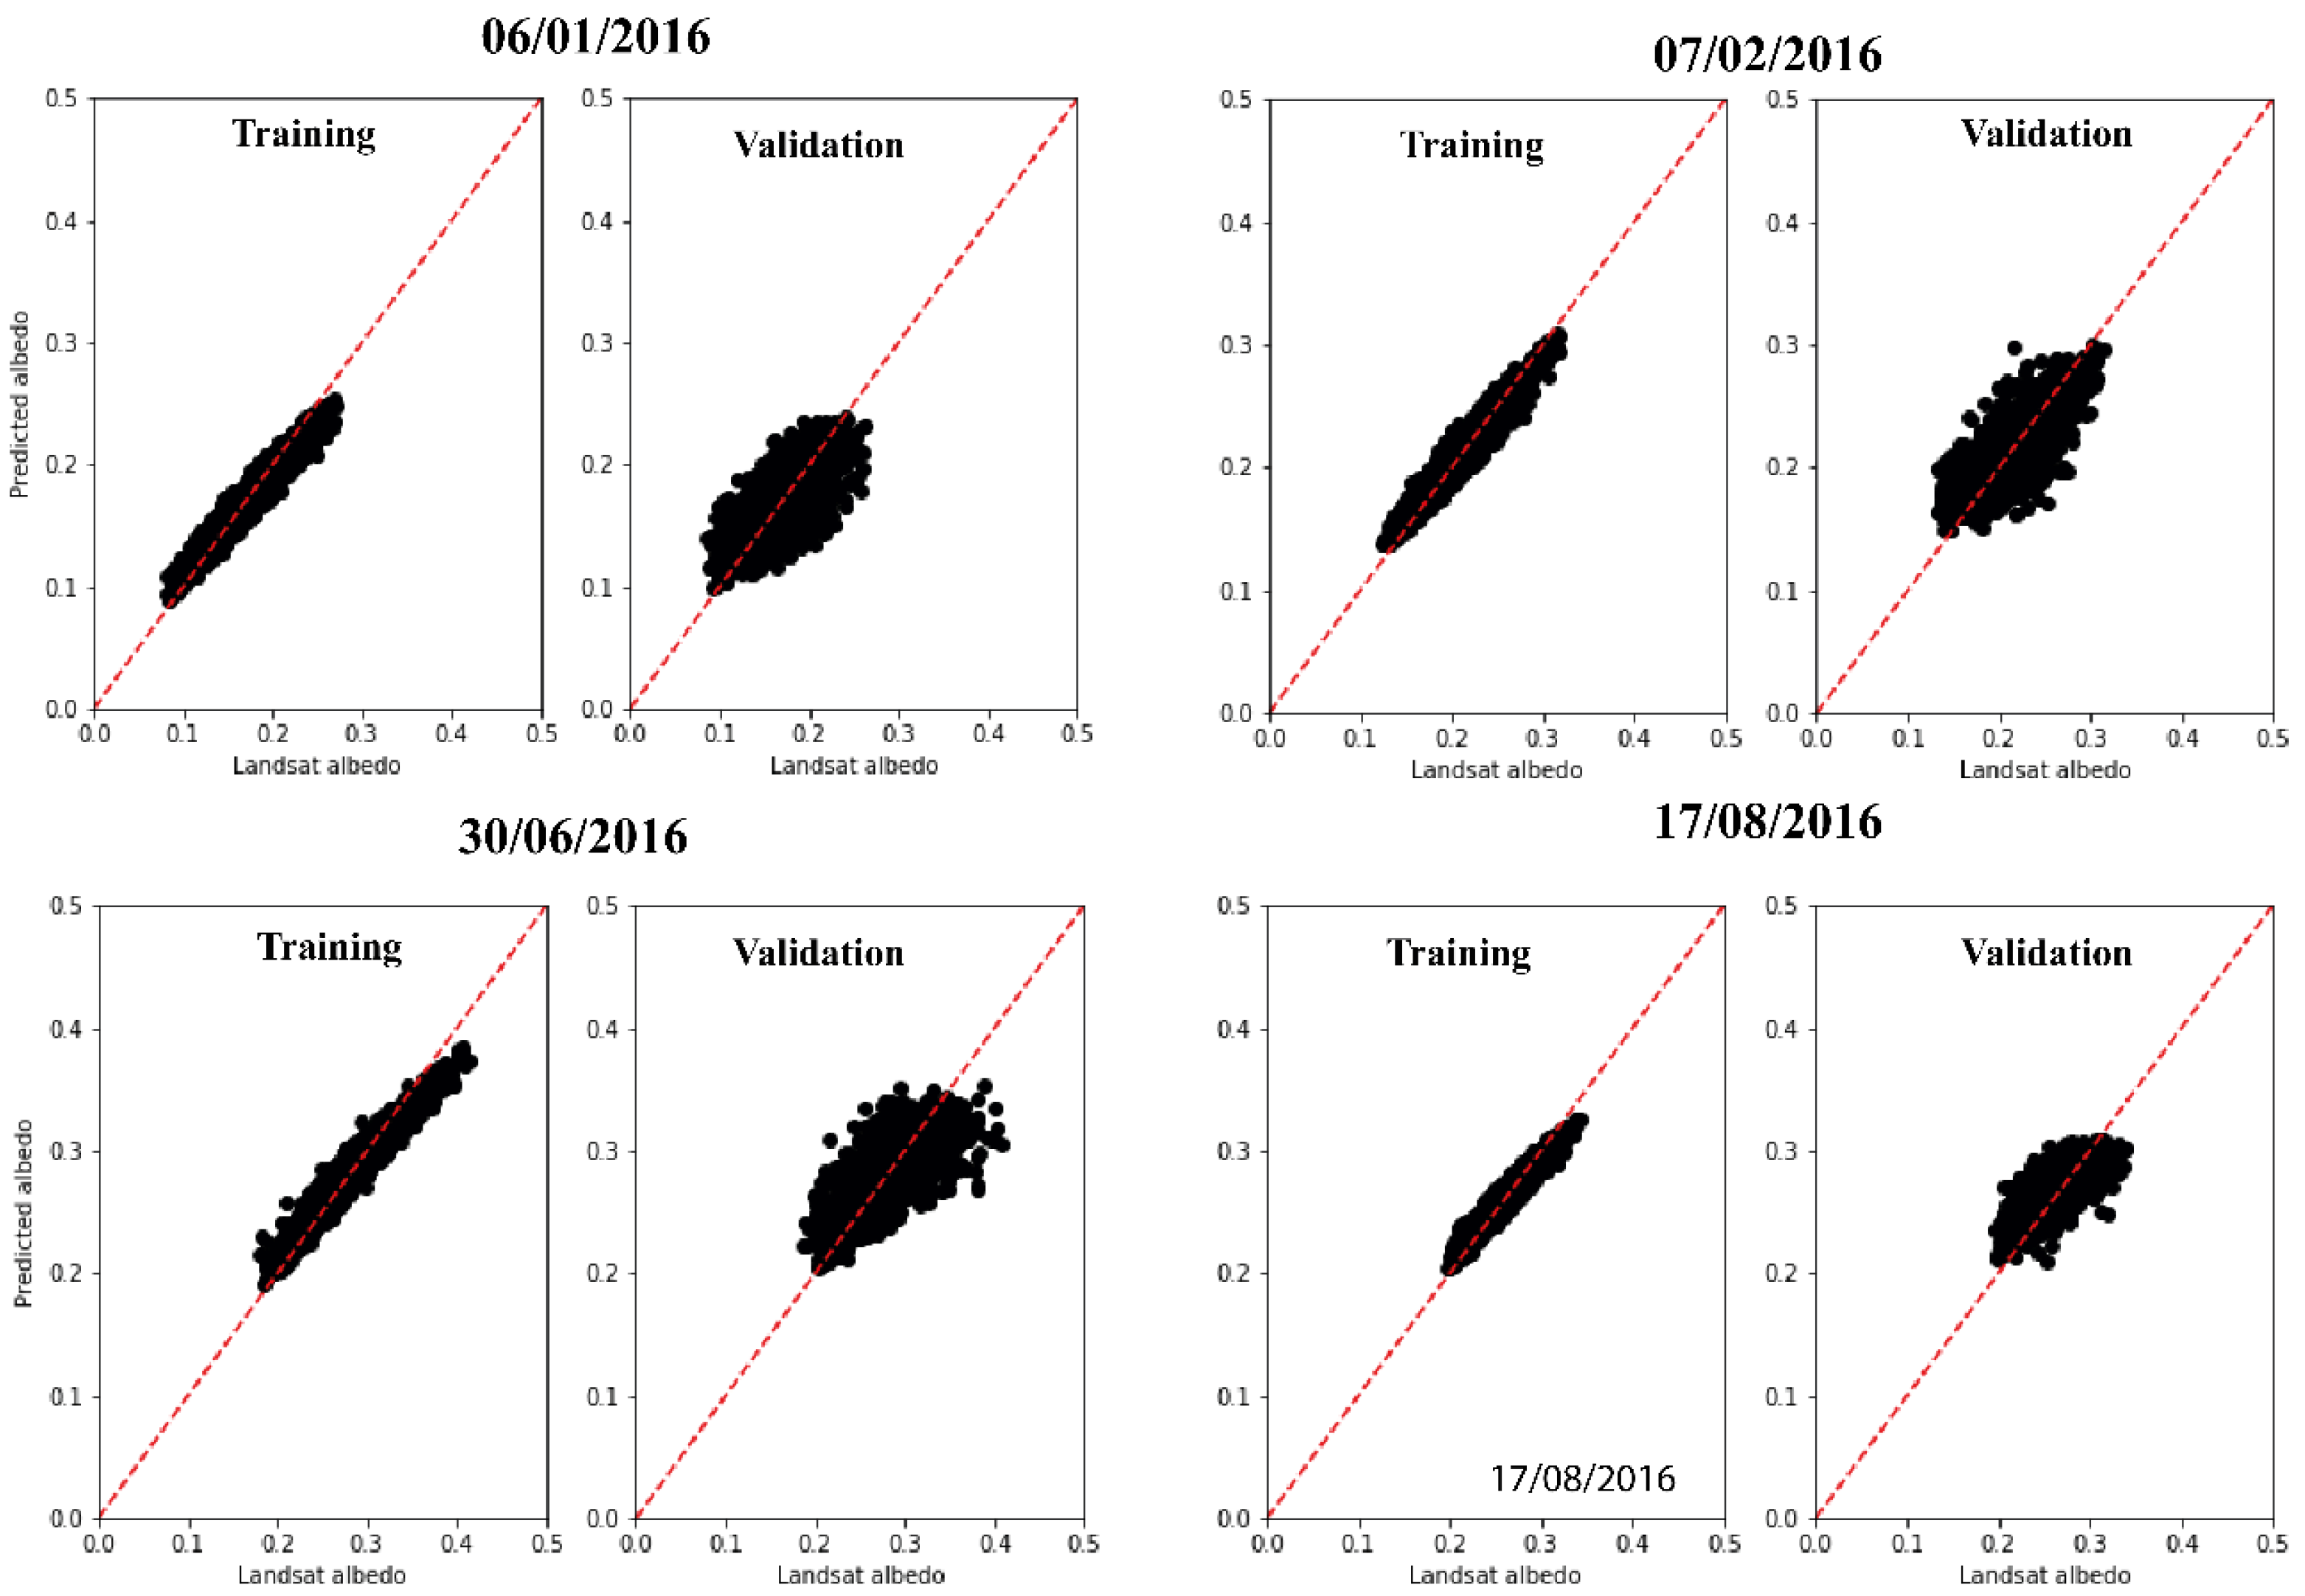
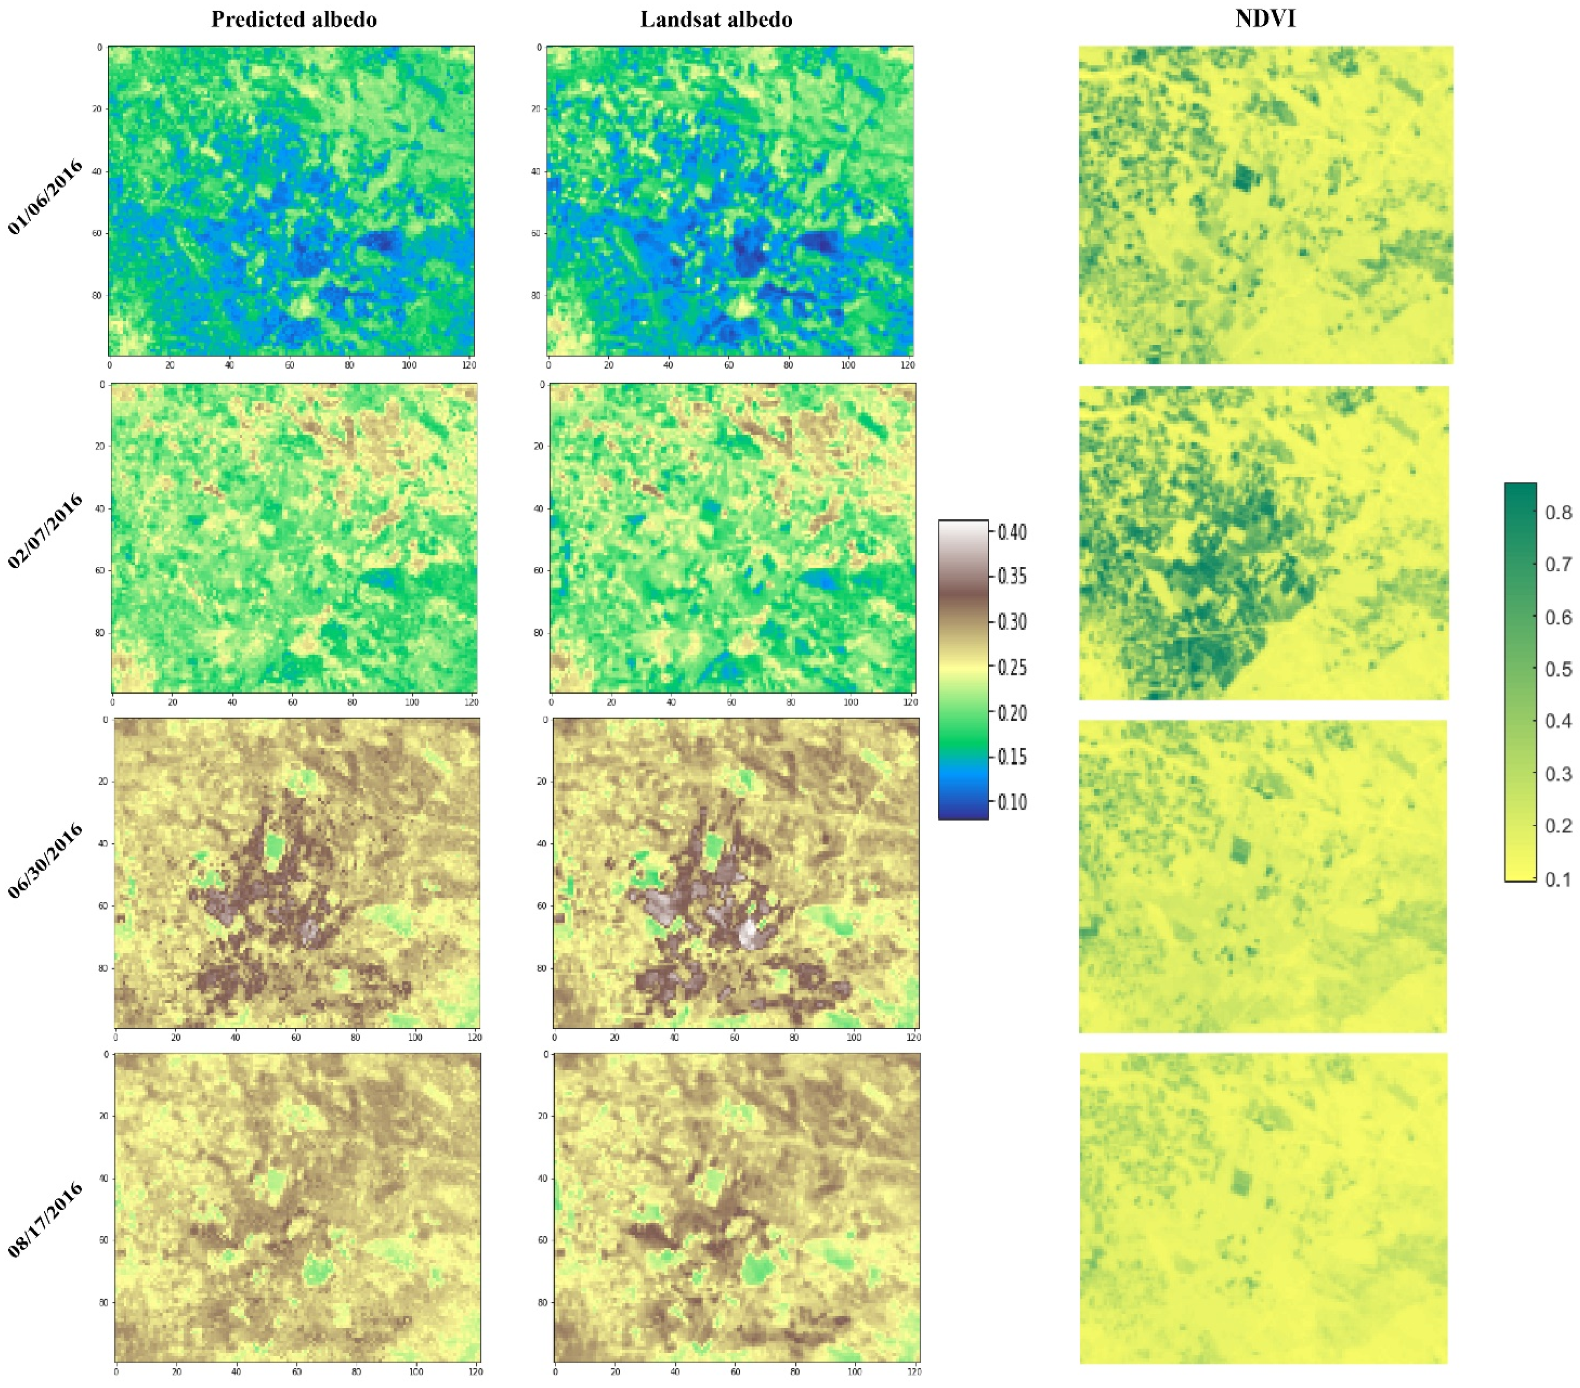
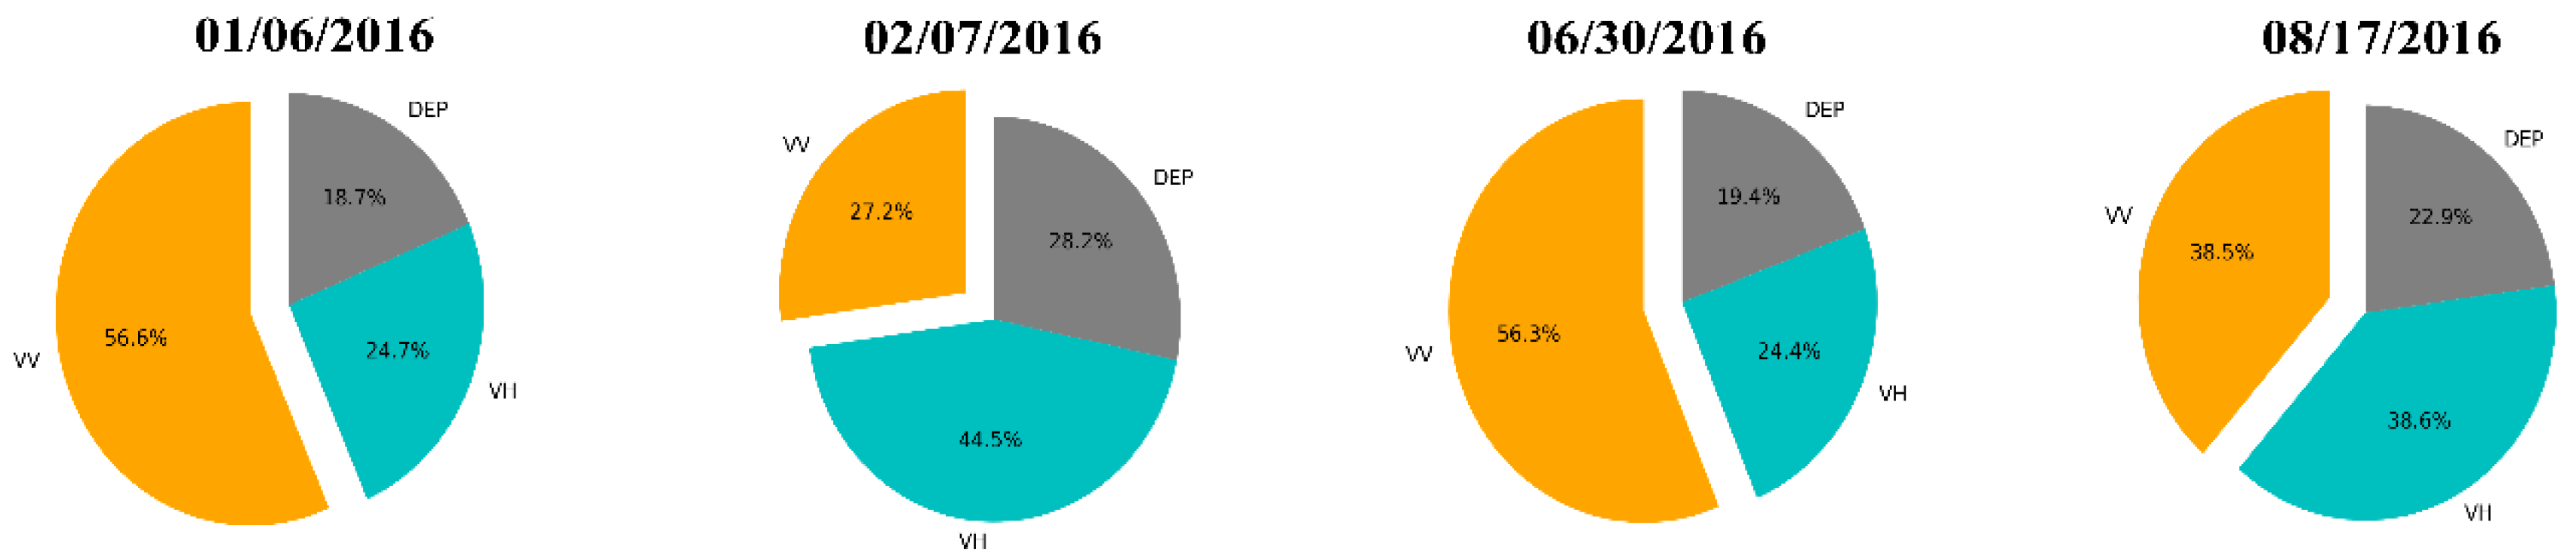
3. Results and Discussions

The albedo prediction results are not only influenced by the model parameters but also by the different combinations of input data, so it is crucial to further analyze the effect of each variable on the α prediction results. Each possible combination is composed of σ V V ,   σ V H , DEM, sky view, and hillshade to retrieve α. It is required to limit the number of input features to both decrease the computing cost of modeling and, in some situations, increase the model’s performance. For this reason, a feature selection was performed to limit the number of input variables when developing the albedo predictive model. This statistical-based feature selection method uses statistics parameters to evaluate the relationship between surface albedo and input variables. This allows selecting the input variables that show a strong relationship with the output variable. Figure 4 presents a correlation matrix with the relationship between albedo and other input variables utilizing Pearson correlation using feature selection method. Figure 4 also shows the correlations of the independent variables with albedo, with the goal of displaying the quantitative links between these variables.
From the feature selection method, it is clear that σ V V ,   σ V H , and DEP are the most relevant variables affecting the α with a correlation coefficient of −0.66, −0.59, and 0.49, respectively. The fact that the correlation is higher between albedo and backscatter coefficients is due to the fact that the variability of α is due to the changeability of the land surface type (bare soil, green vegetation, and senescent vegetation); surface color which depends on soil moisture (surface soil color and crop); and soil proprieties. The only means to assess soil moisture variation in bare soil is to observe and interpret changes in soil color, with dry soil appearing brighter than wet soil. In the case of vegetated areas, changes in vegetation water content or color are reflected in albedo observations since the C-band radar signal is sensible to vegetation water content. The reason for the C-sensitivity band’s response to variations in albedo can be explained in this way.
In order to visualize the correlation between albedo and other independent variables, Figure 5 shows a visualization of the images selected using feature selection to train the model. This set consists of the backscatter coefficients in the different polarizations of Sentinel-1 ( σ V V ,   σ V H ) and the depolarization ratio σ V V /   σ V H . By analyzing Figure 5, it seems visually that the relationship between the backscatter coefficients and albedo is remarkable. The albedo variability can be observed solely by looking at the dynamics of the backscatter coefficients’ values, σ V V ,   σ V H , and σ V V /   σ V H , and this is confirmed when looking to the correlation coefficient values reported in Figure 4.
Using the 100 m Landsat albedo images as a reference, the retrieval results are visually and quantitatively analyzed in Figure 6 and Figure 7. Results statistics are also reported and listed in Table 1, showing that the RF algorithm performs well for all of the dates and delivers accurate and stable results over the R3 agriculture site. The R value ranges from 0.70 to 0.79 for the validation step with a RMSE between 0.00021 and 0.00048. The highest R of 0.79 was obtained on 7 February 2016.
Figure 7 presents albedo estimates captured all along the investigated period from RF-based Sentinel-1 retrievals. The radar-based albedo images are obtained across the season for four clear-sky selected dates over the irrigated perimeter R3. The k-fold cross-validation results using the training set with a set number (k) equal to 10 were used to predict the surface albedo while the cross-validation is necessary to verify the modeling’s resilience, which is evident in all of the RF approach’s results due to their low variability, as seen in Figure 7.
From Figure 7, the spatial heterogeneity in soil properties (type, dry, or humid) and land cover over the investigated area generates strong variations in surface albedo at high resolution. Here, we test if the RF model can capture surface albedo variability over the complex area. The highest value of albedo (0.4) was obtained on the 30th of June, which corresponds to senescent vegetation albedo [86]. To better interpret the results and define the variable driven by the albedo variability over the irrigated perimeter R3 and along the season, Figure 8 presents the RF input variable importance to predict surface albedo for each date. From Figure 8, at the initial stage of wheat crop growth (01/06/2016), the spatial variation of surface albedo is driven by VV polarization. This is due to the small portion of the surface covered by the crops, where VV polarization is sensitive to soil moisture at the surface changes as reported by Amazirh et al. [78]. In the development stage (7 February 2016), some fields have achieved effective complete cover, while others have a low fraction of green vegetation, depending on the planting date and vegetation development. This variation in VH polarization has a direct impact on the variation in surface albedo, which is highly influenced by the geometrical arrangement and shape of the vegetation [78,80,87,88,89,90]. In the vegetated area (especially at the center of the image), when the VH value is high, the surface albedo becomes smaller and vice versa. Note that the harvest date for winter wheat crop in the studied area is at the end of June. On 17 August 2016, the fields are in bare soil conditions, which are characterized by a low vegetation. Moreover, the surface albedo is driven by soil moisture variability, where VV polarization is sensible to soil moisture variability. When soil moisture is important on the surface, surface albedo decreases, which is similar with the findings of Cresswell et al. [12] and Idso et al. [10], who found a drop in surface albedo as surface soil moisture increased. Light scattering in the direction of the incident radiation and absorption of more incident photons are caused by a reduction in the relative refractive index of wet soil, resulting in a low albedo value [7,91]. This is due both to water content at the surface and surface roughness. Albedo is largely dependent on surface roughness over bare soil, especially in dry conditions, where surface roughness causes a drop in surface albedo, as illustrated in [92].
A further evaluation of the predicted α by RF technique was performed by comparing in situ and predicted albedo at the field level. In situ data were selected at Landsat overpass satellite over P1 and P2 fields (Figure 9). Since our objective is to asses wheat albedo, four dates were used for each field which correspond to the wheat phenological growth stages. From the plots, it can be observed that the RF technique allows the prediction of surface albedo correctly with very good accuracy and correlation. The RF method permits the retrieval of the temporal dynamics of α all over the season over the two fields with an R2 of 0.97 and 0.98 over P2 and P1 sites, respectively. The reached RMSE for both sites is equal to 0.04 with a linear regression slope of 0.83 and 1.12 for P2 and P1 sites, respectively. By combing both sets of data from the two fields, a very good correlation was also obtained with a RMSE equal to 0.04 with an R2 reaches 0.96.
The relative error ratio (RER, ratio between range and RMSE) was also calculated to show how the RF predictions are good independently of the albedo range and to test the applicability and practical utility of the RF model. In Figure 9, the RMSE equals 0.004 within a range of 0.18 (maximum value minus minimum value); therefore, RER is equal to 4.5 which shows an acceptable performance, especially in remote sensing applications.

4. Conclusions

The investigated work confirmed that it is possible to accurately retrieve surface albedo from radar C-band data, along with the regression approach. Sentinel-1 radar data were used to simulate the surface albedo of agricultural crops during their growth stage, and the results were quite accurate. The methodology is based on the correlation of VV and VH polarization backscatter coefficients with the albedo of agricultural crops. The method described in this research demonstrates the utility of radar Sentinel-1 data for continuous agriculture monitoring in areas with frequent cloud cover. The random forest approach was applied over an irrigated perimeter in central Morocco and evaluated against Landsat albedo estimates. The Landsat-derived albedo was also compared to in situ albedo in two experimental fields sited in the 2015–2016 crop growing season.
The comparison results based on statistical measures show that the random forest approach achieves very good albedo modeling performance. For the in situ evaluation, the determination coefficient (R2) between Landsat-derived and in situ albedo achieved 0.81 and 0.92 for drip- and flood-irrigated wheat, respectively. The founded results illustrate that the RF algorithm presented a very good performance for different growing stage periods. For the spatial evaluation, a root mean square error (RMSE) between 0.00021 and 0.00048 was achieved between predicted and Landsat-derived albedo with a R value that lies between 0.7 and 0.79 (R2 between 0.5 and 0.62). Those results are very encouraging as they open the path for monitoring of agricultural crops continuously every 3–6 days during any weather situation, taking the advantage of the high frequency of Sentinel-1 images.
The study was done over an irrigated perimeter to retrieve crop albedo. Future research should be carried out over an extended area. This study opens a path for spatialization of surface albedo over various crop types in order to provide albedo products all over the world. Additionally, mountain areas are the most affected places by clouds; extending the application of random forest into those regions would be very interesting and of a benefit to retrieve albedo in mountains. The estimate of surface albedo using radar data allows for improving the estimates of evapotranspiration (by an energy balance model, for example), instead of deriving the albedo from optical reflectance using empirical relationships. In this work, a random method to split data was used; nonrandom approaches such as (e.g., Kennard-stone, SELECT, principal component decomposition, etc.) could be used to improve our model by taking into account the maximum amount of spectral variability in the calibration dataset to develop a more robust and stable model.

Author Contributions

Conceptualization, A.A., E.H.B.; methodology, A.A., E.H.B.; software, A.A., E.H.B.; writing—original draft preparation, A.A.; review and editing, A.A., E.H.B., L.E.O.-G., S.E.-R., A.C.; project administration, A.C.; supervision, A.C., S.E.-R. All authors have read and agreed to the published version of the manuscript.

Funding

This research was carried out within the Center for Remote Sensing Applications, at the Mohammed VI Polytechnic University Morocco. This work was funded by OCP (AS No 71) and by the European Commission Horizon 2020 Programme for Research and Innovation (H2020) in the context of the Marie Sklodowska-Curie Research and Innovation Staff Exchange (RISE) action (REC project, grant agreement no: 645642), followed by ACCWA project, grant agreement no. 823965).

Institutional Review Board Statement

Not applicable.

Informed Consent Statement

Not applicable.

Acknowledgments

The authors acknowledge the Joint International Laboratory TREMA (https://www.lmi-trema.ma) (accessed on 7 August 2021) (IRD, UCAM, DMN, CNESTEN, ABHT, and ORMVAH) for the in situ data. PRIMA IDEWA and ALTOS projects are also acknowledged.

Conflicts of Interest

The authors declare no conflict of interest.

References

  1. Yin, X. The albedo of vegetated land surfaces: Systems analysis and mathematical modeling. Theor. Appl. Climatol. 1998, 60. [Google Scholar] [CrossRef]
  2. Tooming, H. Dependence of global radiation on cloudiness and surface albedo in Tartu, Estonia. Theor. Appl. Climatol. 2002, 72. [Google Scholar] [CrossRef]
  3. Bonan, G.B. Forests and climate change: Forcings, feedbacks, and the climate benefits of forests. Science 2008, 320, 1444–1449. [Google Scholar] [CrossRef] [PubMed] [Green Version]
  4. Chapin, F.S.; Randerson, J.T.; McGuire, A.D.; Foley, J.A.; Field, C.B. Changing feedbacks in the climate-biosphere system. Front. Ecol. Environ. 2008, 6, 313–320. [Google Scholar] [CrossRef]
  5. Matthias, A.D.; Fimbres, A.; Sano, E.E.; Post, D.F.; Accioly, L.; Batchily, A.K.; Ferreira, L.G. Surface Roughness Effects on Soil Albedo. Soil Sci. Soc. Am. J. 2000, 64, 1035–1041. [Google Scholar] [CrossRef] [Green Version]
  6. Muller, E.; Décamps, H. Modeling soil moisture—Reflectance. Remote Sens. Environ. 2001, 76, 173–180. [Google Scholar] [CrossRef] [Green Version]
  7. Lobell, D.B.; Asner, G.P. Moisture Effects on Soil Reflectance. Soil Sci. Soc. Am. J. 2002, 66, 722–727. [Google Scholar] [CrossRef]
  8. Hales, K.; Neelin, J.D.; Zeng, N. Sensitivity of tropical land climate to leaf area index: Role of surface conductance versus Albedo. J. Clim. 2004, 17, 1459–1473. [Google Scholar] [CrossRef]
  9. Potter, K.N.; Horton, R.; Cruse, R.M. Soil Surface Roughness Effects on Radiation Reflectance and Soil Heat Flux. Soil Sci. Soc. Am. J. 1987, 51, 855–860. [Google Scholar] [CrossRef]
  10. Idso, S.B.; Jackson, R.D.; Reginato, R.J.; Kimball, B.A.; Nakayama, F.S. The Dependence of Bare Soil Albedo on Soil Water Content. J. Appl. Meteorol. 1975, 14, 109–113. [Google Scholar] [CrossRef] [Green Version]
  11. Jacobs, A.F.G.; van Pul, W.A.J. Seasonal changes in the albedo of a maize crop during two seasons. Agric. For. Meteorol. 1990, 49, 351–360. [Google Scholar] [CrossRef]
  12. Cresswell, H.P.; Painter, D.J.; Cameron, K.C. Tillage and Water Content Effects on Surface Soil Hydraulic Properties and Shortwave Albedo. Soil Sci. Soc. Am. J. 1993, 57, 816–824. [Google Scholar] [CrossRef] [Green Version]
  13. Pinker, R.T.; Thompson, O.E.; Eck, T.F. The albedo of a tropical evergreen forest. Q. J. R. Meteorol. Soc. 1980, 106, 551–558. [Google Scholar] [CrossRef]
  14. McCaughey, J.H. The albedo of a mature mixed forest and a clear-cut site at Petawawa, Ontario. Agric. For. Meteorol. 1987, 40, 251–263. [Google Scholar] [CrossRef]
  15. Ben-Gai, T.; Bitan, A.; Manes, A.; Alpert, P.; Israeli, A. Aircraft measurements of surface Albedo in relation to climatic changes in southern Israel. Theor. Appl. Climatol. 1998, 61, 207–215. [Google Scholar] [CrossRef]
  16. Song, J. Diurnal asymmetry in surface albedo. Agric. For. Meteorol. 1998, 92, 181–189. [Google Scholar] [CrossRef]
  17. Song, J. Phenological influences on the albedo of prairie grassland and crop fields. Int. J. Biometeorol. 1999, 42, 153–157. [Google Scholar] [CrossRef]
  18. Iqbal, M. An Introduction to Solar Radiation; Academic Press Inc.: New York, NY, USA, 1983. [Google Scholar]
  19. Maghrabi, A.H.; Al-Mostafa, Z.A. Estimating surface albedo over Saudi Arabia. Renew. Energy 2009, 34, 1607–1610. [Google Scholar] [CrossRef]
  20. Arnfield, A.J. A Note on the Diurnal, Latitudinal and Seasonal Variation of the Surface Reflection Coefficient. J. Appl. Meteorol. 1975, 14, 1603–1608. [Google Scholar] [CrossRef] [Green Version]
  21. Zheng, Z.; Wei, Z.; Wen, Z.; Dong, W.; Li, Z.; Wen, X.; Zhu, X.; Ji, D.; Chen, C.; Yan, D. Inclusion of Solar Elevation Angle in Land Surface Albedo Parameterization Over Bare Soil Surface. J. Adv. Model. Earth Syst. 2017, 9, 3069–3081. [Google Scholar] [CrossRef] [PubMed] [Green Version]
  22. Liang, L.; Wang, J. Broadband albedo. In Advanced Remote Sensing; Elsevier: Cham, Switzerland, 2012; pp. 193–250. [Google Scholar]
  23. Morton, F.I. Operational estimates of areal evapotranspiration and their significance to the science and practice of hydrology. J. Hydrol. 1983, 66, 1–76. [Google Scholar] [CrossRef]
  24. Iziomon, M.G.; Mayer, H. On the variability and modelling of surface albedo and long-wave radiation components. Agric. For. Meteorol. 2002, 111, 141–152. [Google Scholar] [CrossRef]
  25. Liu, H.; Wang, B.; Fu, C. Relationships between surface albedo, soil thermal parameters and soil moisture in the semi-arid area of Tongyu, northeastern China. Adv. Atmos. Sci. 2008, 25, 757–764. [Google Scholar] [CrossRef]
  26. Zhang, Y.; Wang, X.; Pan, Y.; Hu, R. Diurnal and seasonal variations of surface albedo in a spring wheat field of arid lands of Northwestern China. Int. J. Biometeorol. 2013, 57, 67–73. [Google Scholar] [CrossRef]
  27. Wang, K.; Liang, S.; Schaaf, C.L.; Strahler, A.H. Evaluation of Moderate Resolution Imaging Spectroradiometer land surface visible and shortwave albedo products at FLUXNET sites. J. Geophys. Res. Atmos. 2010, 115. [Google Scholar] [CrossRef] [Green Version]
  28. Gueymard, C.A.; Lara-Fanego, V.; Sengupta, M.; Xie, Y. Surface albedo and reflectance: Review of definitions, angular and spectral effects, and intercomparison of major data sources in support of advanced solar irradiance modeling over the Americas. Solar Energy 2019, 182, 194–212. [Google Scholar] [CrossRef]
  29. He, T.; Liang, S.; Wang, D.; Wu, H.; Yu, Y.; Wang, J. Estimation of surface albedo and directional reflectance from Moderate Resolution Imaging Spectroradiometer (MODIS) observations. Remote Sens. Environ. 2012, 119, 286–300. [Google Scholar] [CrossRef] [Green Version]
  30. Pinty, B.; Taberner, M.; Haemmerle, V.R.; Paradise, S.R.; Vermote, E.; Verstraete, M.M.; Gobron, N.; Widlowski, J.L. Global-scale comparison of MISR and MODIS land surface albedos. J. Clim. 2011, 24, 732–749. [Google Scholar] [CrossRef] [Green Version]
  31. Schaaf, C.B.; Gao, F.; Strahler, A.H.; Lucht, W.; Li, X.; Tsang, T.; Strugnell, N.C.; Zhang, X.; Jin, Y.; Muller, J.P.; et al. First operational BRDF, albedo nadir reflectance products from MODIS. Remote Sens. Environ. 2002, 83. [Google Scholar] [CrossRef] [Green Version]
  32. Strugnell, N.C.; Lucht, W. An algorithm to infer continental-scale Albedo from AVHRR data, land over class, and field observation of typical BRDFs. J. Clim. 2001, 14, 1360–1376. [Google Scholar] [CrossRef]
  33. Leroy, M.; Deuzé, J.L.; Bréon, F.M.; Hautecoeur, O.; Herman, M.; Buriez, J.C.; Tanré, D.; Bouffiès, S.; Chazette, P.; Roujean, J.L. Retrieval of atmospheric properties and surface bidirectional reflectances over land from POLDER/ADEOS. J. Geophys. Res. Atmos. 1997, 102, 17023–17037. [Google Scholar] [CrossRef]
  34. Pinty, B.; Roveda, F.; Verstraete, M.M.; Gobron, N.; Govaerts, Y.; Martonchik, J.V.; Diner, D.J.; Kahn, R.A. Surface albedo retrieval from Meteosat 1. Theory. J. Geophys. Res. Atmos. 2000, 105, 18099–18112. [Google Scholar] [CrossRef]
  35. Geiger, B.; Carrer, D.; Franchistéguy, L.; Roujean, J.L.; Meurey, C. Land surface albedo derived on a daily basis from meteosat second generation observations. IEEE Trans. Geosci. Remote Sens. 2008, 46, 3841–3856. [Google Scholar] [CrossRef]
  36. Cescatti, A.; Marcolla, B.; Santhana Vannan, S.K.; Pan, J.Y.; Román, M.O.; Yang, X.; Ciais, P.; Cook, R.B.; Law, B.E.; Matteucci, G.; et al. Intercomparison of MODIS albedo retrievals and in situ measurements across the global FLUXNET network. Remote Sens. Environ. 2012, 121, 323–334. [Google Scholar] [CrossRef] [Green Version]
  37. Chen, Y.M.; Liang, S.; Wang, J.; Kim, H.Y.; Martonchik, J.V. Validation of MISR land surface broadband albedo. Int. J. Remote Sens. 2008, 29, 6971–6983. [Google Scholar] [CrossRef]
  38. Román, M.O.; Schaaf, C.B.; Lewis, P.; Gao, F.; Anderson, G.P.; Privette, J.L.; Strahler, A.H.; Woodcock, C.E.; Barnsley, M. Assessing the coupling between surface albedo derived from MODIS and the fraction of diffuse skylight over spatially-characterized landscapes. Remote Sens. Environ. 2010, 114, 738–760. [Google Scholar] [CrossRef]
  39. Song, R.; Muller, J.-P.; Kharbouche, S.; Woodgate, W. Intercomparison of Surface Albedo Retrievals from MISR, MODIS, CGLS Using Tower and Upscaled Tower Measurements. Remote Sens. 2019, 11, 644. [Google Scholar] [CrossRef] [Green Version]
  40. Elfarkh, J.; Ezzahar, J.; Er-Raki, S.; Simonneaux, V.; Hssaine, B.A.; Rachidi, S.; Brut, A.; Rivalland, V.; Khabba, S.; Chehbouni, A.; et al. Multi-scale evaluation of the TSEB model over a complex agricultural landscape in Morocco. Remote Sens. 2020, 12, 1181. [Google Scholar] [CrossRef] [Green Version]
  41. Tasumi, M.; Allen, R.G.; Trezza, R. At-Surface Reflectance and Albedo from Satellite for Operational Calculation of Land Surface Energy Balance. J. Hydrol. Eng. 2008, 13, 51–63. [Google Scholar] [CrossRef]
  42. Weiss, M.; Baret, F.; Leroy, M.; Bègué, A.; Hautecoeur, O.; Santer, R. Hemispherical reflectance and albedo estimates from the accumulation of across-track sun-synchronous satellite data. J. Geophys. Res. Atmos. 1999, 104, 22221–22232. [Google Scholar] [CrossRef] [Green Version]
  43. Bsaibes, A.; Courault, D.; Baret, F.; Weiss, M.; Olioso, A.; Jacob, F.; Hagolle, O.; Marloie, O.; Bertrand, N.; Desfond, V.; et al. Albedo and LAI estimates from FORMOSAT-2 data for crop monitoring. Remote Sens. Environ. 2009, 113, 716–729. [Google Scholar] [CrossRef]
  44. Jacob, F.; Olioso, A.; Weiss, M.; Baret, F.; Hautecoeur, O. Mapping short-wave albedo of agricultural surfaces using airborne PolDER data. Remote Sens. Environ. 2002, 80. [Google Scholar] [CrossRef]
  45. Liang, S.; Strahler, A.H.; Walthall, C. Retrieval of land surface albedo from satellite observations: A simulation study. J. Appl. Meteorol. 1999, 38. [Google Scholar] [CrossRef]
  46. Galleguillos, M.; Jacob, F.; Prévot, L.; French, A.; Lagacherie, P. Comparison of two temperature differencing methods to estimate daily evapotranspiration over a Mediterranean vineyard watershed from ASTER data. Remote Sens. Environ. 2011, 115. [Google Scholar] [CrossRef]
  47. McCabe, M.F.; Wood, E.F. Scale influences on the remote estimation of evapotranspiration using multiple satellite sensors. Remote Sens. Environ. 2006, 105. [Google Scholar] [CrossRef]
  48. Sobrino, J.A.; Gómez, M.; Jiménez-Muñoz, J.C.; Olioso, A. Application of a simple algorithm to estimate daily evapotranspiration from NOAA-AVHRR images for the Iberian Peninsula. Remote Sens. Environ. 2007, 110. [Google Scholar] [CrossRef]
  49. Tittebrand, A.; Berger, F.H. Spatial heterogeneity of satellite derived land surface parameters and energy flux densities for LITFASS-area. Atmos. Chem. Phys. 2009, 9. [Google Scholar] [CrossRef] [Green Version]
  50. Vinukollu, R.K.; Wood, E.F.; Ferguson, C.R.; Fisher, J.B. Global estimates of evapotranspiration for climate studies using multi-sensor remote sensing data: Evaluation of three process-based approaches. Remote Sens. Environ. 2011, 115. [Google Scholar] [CrossRef]
  51. Mattar, C.; Franch, B.; Sobrino, J.A.; Corbari, C.; Jiménez-Muñoz, J.C.; Olivera-Guerra, L.; Skokovic, D.; Sória, G.; Oltra-Carriò, R.; Julien, Y.; et al. Impacts of the broadband albedo on actual evapotranspiration estimated by S-SEBI model over an agricultural area. Remote Sens. Environ. 2014, 147, 23–42. [Google Scholar] [CrossRef]
  52. Wang, Z.; Schaaf, C.B.; Sun, Q.; Shuai, Y.; Román, M.O. Capturing rapid land surface dynamics with Collection V006 MODIS BRDF/NBAR/Albedo (MCD43) products. Remote Sens. Environ. 2018, 207. [Google Scholar] [CrossRef]
  53. Shuai, Y.; Masek, J.G.; Gao, F.; Schaaf, C.B. An algorithm for the retrieval of 30-m snow-free albedo from Landsat surface reflectance and MODIS BRDF. Remote Sens. Environ. 2011, 115. [Google Scholar] [CrossRef]
  54. Lucht, W.; Schaaf, C.B.; Strahler, A.H. An algorithm for the retrieval of albedo from space using semiempirical BRDF models. IEEE Trans. Geosci. Remote Sens. 2000, 38. [Google Scholar] [CrossRef] [Green Version]
  55. Liu, Y.; Wang, Z.; Sun, Q.; Erb, A.M.; Li, Z.; Schaaf, C.B.; Zhang, X.; Román, M.O.; Scott, R.L.; Zhang, Q.; et al. Evaluation of the VIIRS BRDF, Albedo and NBAR products suite and an assessment of continuity with the long term MODIS record. Remote Sens. Environ. 2017, 201. [Google Scholar] [CrossRef]
  56. Franch, B.; Vermote, E.; Claverie, M. Intercomparison of Landsat albedo retrieval techniques and evaluation against in situ measurements across the US SURFRAD network. Remote Sens. Environ. 2014, 152, 627–637. [Google Scholar] [CrossRef]
  57. Franch, B.; Vermote, E.F.; Sobrino, J.A.; Julien, Y. Retrieval of Surface Albedo on a Daily Basis: Application to MODIS Data. IEEE Trans. Geosci. Remote Sens. 2014, 52, 7549–7558. [Google Scholar] [CrossRef]
  58. Gao, B.; Gong, H.; Wang, T. A method for retrieving daily land surface albedo from space at 30-m resolution. Remote Sens. 2015, 7, 951. [Google Scholar] [CrossRef] [Green Version]
  59. He, T.; Liang, S.; Wang, D.; Cao, Y.; Gao, F.; Yu, Y.; Feng, M. Evaluating land surface albedo estimation from Landsat MSS, TM, ETM +, and OLI data based on the unified direct estimation approach. Remote Sens. Environ. 2018, 204. [Google Scholar] [CrossRef]
  60. Filgueiras, R.; Mantovani, E.C.; Althoff, D.; Fernandes Filho, E.I.; da Cunha, F.F. Crop NDVI monitoring based on sentinel 1. Remote Sens. 2019, 11, 1441. [Google Scholar] [CrossRef] [Green Version]
  61. Xu, S.; Zhao, Q.; Yin, K.; He, G.; Zhang, Z.; Wang, G.; Wen, M.; Zhang, N. Spatial downscaling of land surface temperature based on a multi-factor geographically weighted machine learning model. Remote Sens. 2021, 13, 1186. [Google Scholar] [CrossRef]
  62. Ebrahimy, H.; Azadbakht, M. Computers and Geosciences Downscaling MODIS land surface temperature over a heterogeneous area: An investigation of machine learning techniques, feature selection, and impacts of mixed pixels. Comput. Geosci. 2019, 124, 93–102. [Google Scholar] [CrossRef]
  63. Liu, Y.; Yang, Y.; Jing, W.; Yue, X. Comparison of different machine learning approaches for monthly satellite-based soil moisture downscaling over Northeast China. Remote Sens. 2018, 10, 31. [Google Scholar] [CrossRef] [Green Version]
  64. Zeng, L.; Hu, S.; Xiang, D.; Zhang, X.; Li, D.; Li, L.; Zhang, T. Multilayer Soil Moisture Mapping at a Regional Scale from Multisource Data via a Machine Learning Method. Remote Sens. 2019, 11, 284. [Google Scholar] [CrossRef] [Green Version]
  65. Mao, H.; Kathuria, D.; Duffield, N.; Mohanty, B.P. Gap Filling of High-Resolution Soil Moisture for SMAP/Sentinel-1: A Two-Layer Machine Learning-Based Framework. Water Resour. Res. 2019, 55, 6986–7009. [Google Scholar] [CrossRef] [Green Version]
  66. Shang, K.; Yao, Y.; Li, Y.; Yang, J.; Jia, K.; Zhang, X.; Chen, X.; Bei, X.; Guo, X. Fusion of five satellite-derived products using extremely randomized trees to estimate terrestrial latent heat flux over Europe. Remote Sens. 2020, 12, 687. [Google Scholar] [CrossRef] [Green Version]
  67. Bouras, E.H.; Jarlan, L.; Er-Raki, S.; Albergel, C.; Richard, B.; Balaghi, R.; Khabba, S. Linkages between rainfed cereal production and agricultural drought through remote sensing indices and a land data assimilation system: A case study in Morocco. Remote Sens. 2020, 12, 4018. [Google Scholar] [CrossRef]
  68. Torbick, N.; Chowdhury, D.; Salas, W.; Qi, J. Monitoring Rice Agriculture across Myanmar Using Time Series Sentinel-1 Assisted by Landsat-8 and PALSAR-2. Remote Sens. 2017, 9, 119. [Google Scholar] [CrossRef] [Green Version]
  69. Chehbouni, A.H.H.; Escadafal, R.; Duchemin, B.; Boulet, G.; Simonneaux, V.; Dedieu, G.; Mougenot, B.; Khabba, S.; Kharrou, H.; Maisongrande, P.; et al. An integrated modelling and remote sensing approach for hydrological study in arid and semi-arid regions: The SUDMED Programme. Int. J. Remote Sens. 2008, 29, 5161–5181. [Google Scholar] [CrossRef] [Green Version]
  70. Toumi, J.; Er-Raki, S.; Ezzahar, J.; Khabba, S.; Jarlan, L.; Chehbouni, A. Performance assessment of AquaCrop model for estimating evapotranspiration, soil water content and grain yield of winter wheat in Tensift Al Haouz (Morocco): Application to irrigation management. Agric. Water Manag. 2016, 163, 219–235. [Google Scholar] [CrossRef]
  71. Olivera-Guerra, L.; Merlin, O.; Er-Raki, S.; Khabba, S.; Escorihuela, M.J. Estimating the water budget components of irrigated crops: Combining the FAO-56 dual crop coefficient with surface temperature and vegetation index data. Agric. Water Manag. 2018, 208, 120–131. [Google Scholar] [CrossRef] [Green Version]
  72. Olivera-Guerra, L.; Merlin, O.; Er-Raki, S. Irrigation retrieval from Landsat optical/thermal data integrated into a crop water balance model: A case study over winter wheat fields in a semi-arid region. Remote Sens. Environ. 2020, 239, 111627. [Google Scholar] [CrossRef] [Green Version]
  73. Amazirh, A.; Er-Raki, S.; Chehbouni, A.; Rivalland, V.; Diarra, A.; Khabba, S.; Ezzahar, J.; Merlin, O. Modified Penman–Monteith equation for monitoring evapotranspiration of wheat crop: Relationship between the surface resistance and remotely sensed stress index. Biosyst. Eng. 2017, 164, 68–84. [Google Scholar] [CrossRef]
  74. Duchemin, B.; Hadria, R.; Erraki, S.; Boulet, G.; Maisongrande, P.; Chehbouni, A.; Escadafal, R.; Ezzahar, J.; Hoedjes, J.C.B.; Kharrou, M.H.; et al. Monitoring wheat phenology and irrigation in Central Morocco: On the use of relationships between evapotranspiration, crops coefficients, leaf area index and remotely-sensed vegetation indices. Agric. Water Manag. 2006, 79. [Google Scholar] [CrossRef]
  75. Er-Raki, S.; Chehbouni, A.; Guemouria, N.; Duchemin, B.; Ezzahar, J.; Hadria, R. Combining FAO-56 model and ground-based remote sensing to estimate water consumptions of wheat crops in a semi-arid region. Agric. Water Manag. 2007, 87, 41–54. [Google Scholar] [CrossRef] [Green Version]
  76. Hadria, R.; Duchemin, B.; Lahrouni, A.; Khabba, S.; Er-raki, S.; Dedieu, G.; Chehbouni, A.G.; Olioso§, A. Monitoring of irrigated wheat in a semi-arid climate using crop modelling and remote sensing data: Impact of satellite revisit time frequency. Int. J. Remote Sens. 2006, 27, 1093–1117. [Google Scholar] [CrossRef] [Green Version]
  77. Kharrou, M.H.; Le Page, M.; Chehbouni, A.; Simonneaux, V.; Er-Raki, S.; Jarlan, L.; Ouzine, L.; Khabba, S.; Chehbouni, G. Assessment of Equity and Adequacy of Water Delivery in Irrigation Systems Using Remote Sensing-Based Indicators in Semi-Arid Region, Morocco. Water Resour. Manag. 2013, 27, 4697–4714. [Google Scholar] [CrossRef]
  78. Amazirh, A.; Merlin, O.; Er-Raki, S.; Gao, Q.; Rivalland, V.; Malbeteau, Y.; Khabba, S.; Escorihuela, M.J. Retrieving surface soil moisture at high spatio-temporal resolution from a synergy between Sentinel-1 radar and Landsat thermal data: A study case over bare soil. Remote Sens. Environ. 2018, 211, 321–337. [Google Scholar] [CrossRef]
  79. Amazirh, A.; Merlin, O.; Er-Raki, S.; Bouras, E.; Chehbouni, A. Implementing a new texture-based soil evaporation reduction coefficient in the FAO dual crop coefficient method. Agric. Water Manag. 2021, 250, 106827. [Google Scholar] [CrossRef]
  80. Amazirh, A.; Merlin, O.; Er-Raki, S. Including Sentinel-1 radar data to improve the disaggregation of MODIS land surface temperature data. ISPRS J. Photogramm. Remote Sens. 2019, 150, 11–26. [Google Scholar] [CrossRef]
  81. Stefan, V.G.; Merlin, O.; Er-Raki, S.; Escorihuela, M.J.; Khabba, S. Consistency between In Situ, model-derived and high-resolution-image-based soil temperature endmembers: Towards a robust data-based model for multi-resolution monitoring of crop evapotranspiration. Remote Sens. 2015, 7, 10444–10479. [Google Scholar] [CrossRef] [Green Version]
  82. Merlin, O. An original interpretation of the wet edge of the surface temperature-albedo space to estimate crop evapotranspiration (SEB-1S), and its validation over an irrigated area in northwestern Mexico. Hydrol. Earth Syst. Sci. 2013, 17, 3623–3637. [Google Scholar] [CrossRef] [Green Version]
  83. Hastie, T.; Tibshirani, R.; Friedman, J. Springer Series in Statistics the Elements of Statistical Learning—Data Mining, Inference, and Prediction; Springer: Berlin/Heidelberg, Germany, 2009; Volume 2. [Google Scholar]
  84. Ayoubi, S.; Limam, N.; Salahuddin, M.A.; Shahriar, N.; Boutaba, R.; Estrada-Solano, F.; Caicedo, O.M. Machine Learning for Cognitive Network Management. IEEE Commun. Mag. 2018, 56. [Google Scholar] [CrossRef]
  85. Abraham, A.; Pedregosa, F.; Eickenberg, M.; Gervais, P.; Mueller, A.; Kossaifi, J.; Gramfort, A.; Thirion, B.; Varoquaux, G. Machine learning for neuroimaging with scikit-learn. Front. Neuroinformatics 2014, 8. [Google Scholar] [CrossRef] [Green Version]
  86. Merlin, O.; Jacob, F.; Wigneron, J.P.; Walker, J.; Chehbouni, G. Multidimensional disaggregation of land surface temperature using high-resolution red, near-infrared, shortwave-infrared, and microwave-L bands. IEEE Trans. Geosci. Remote Sens. 2012, 50, 1864–1880. [Google Scholar] [CrossRef] [Green Version]
  87. Bousbih, S.; Zribi, M.; El Hajj, M.; Baghdadi, N.; Lili-Chabaane, Z.; Gao, Q.; Fanise, P. Soil moisture and irrigation mapping in a semi-arid region, based on the synergetic use of Sentinel-1 and Sentinel-2 data. Remote Sens. 2018, 10, 1953. [Google Scholar] [CrossRef] [Green Version]
  88. Chauhan, S.; Srivastava, H.S. Comparative Evaluation of the Sensitivity of Multi-Polarised Sar and Optical Data for Various Land Cover. Int. J. Adv. Remote Sens. GIS Geogr. Comp. 2016, 4, 1–14. [Google Scholar]
  89. Gao, Q.; Zribi, M.; Escorihuela, M.; Baghdadi, N. Synergetic Use of Sentinel-1 and Sentinel-2 Data for Soil Moisture Mapping at 100 m Resolution. Sensors 2017, 17, 1966. [Google Scholar] [CrossRef] [Green Version]
  90. Karjalainen, M.; Harri, K.; Hyyppä, J.; Laurila, H.; Kuittinen, R. the Use of Envisat Alternating Polarization Sar Images in Agricultural Monitoring in Comparison with Radarsat-1 Sar Images. In Proceedings of the ISPRS Congress, Istanbul, Turkey, 12–23 July 2004; pp. 12–23. [Google Scholar]
  91. Twomey, S.A.; Bohren, C.F.; Mergenthaler, J.L. Reflectance and albedo differences between wet and dry surfaces. Appl. Opt. 1986, 25, 431. [Google Scholar] [CrossRef]
  92. Oguntunde, P.G.; Van De Giesen, N. Crop growth and development effects on surface albedo for maize and cowpea fields in Ghana, West Africa. Int. J. Biometeorol. 2004, 49, 106–112. [Google Scholar] [CrossRef] [PubMed]
Figure 1. The study sites’ locations and both wheat fields (black dots) equipped with the eddy covariance systems in the Tensift basin in Marrakech, Morocco.
Remotesensing 13 03181 g001
Figure 2. Comparison between surface albedo estimated by Landsat against in situ albedo for flood (P1) and drip (P2) wheat sites.
Remotesensing 13 03181 g002
Figure 3. Flowchart showing the input and the outputs of the investigated approach.
Remotesensing 13 03181 g003
Figure 4. Feature selection results between the dependent variable (albedo) and the independent variables.
Remotesensing 13 03181 g004
Figure 5. Images used in albedo modeling: albedo of Landsat-8 utilized as the reference feature; and backscatter coefficients VV and VH polarizations and the depolarization ratio (DEP) used as independent variables in the used approach.
Remotesensing 13 03181 g005
Figure 6. Comparison between predicted and Landsat estimates’ surface albedo for training and validation dataset.
Remotesensing 13 03181 g006
Figure 7. Maps of the surface albedo by random forest algorithm compared to the Landsat reference albedo imagery on the four cloudless dates over R3 area. NDVI maps were also presented.
Remotesensing 13 03181 g007
Figure 8. Feature importance for albedo estimation using the random forest algorithm for each date.
Remotesensing 13 03181 g008
Figure 9. Comparison between predicted and in situ estimates of surface albedo for drip- (P2) and flood- (P1) irrigated sites.
Remotesensing 13 03181 g009
Table 1. Summary statistics of the prediction algorithms.
DatesStatistical Metrics
TrainingValidation
R (R2)RMSEMAER (R2)RMSEMAE
01/06/20160.97 (0.94)0.000060.010.78 (0.61)0.000420.02
02/07/20160.97 (0.94)0.000050.010.79 (0.62)0.000390.02
06/30/20160.97 (0.94)0.000070.010.70 (0.50)0.000480.02
08/17/20160.97 (0.94)0.000030.000.76 (0.58)0.000210.01
Publisher’s Note: MDPI stays neutral with regard to jurisdictional claims in published maps and institutional affiliations.

