Article

Remote Sensing Indices for Spatial Monitoring of Agricultural Drought in South Asian Countries

1
School of Atmospheric Sciences, Nanjing University of Information Science and Technology, Nanjing 210044, China
2
Key Laboratory of Meteorological Disaster of Ministry of Education, Nanjing University of Information Science and Technology, Nanjing 210044, China
3
Collaborative Innovation Center on Forecast and Evaluation of Meteorological Disasters, Nanjing University of Information Science and Technology, Nanjing 210044, China
4
Lab of Environmental Remote Sensing (LERS), School of Marine Sciences, Nanjing University of Information Science and Technology, Nanjing 210044, China
5
Department of Physics, Wolo University, Dessie P.O. Box 1145, Ethiopia
6
Department of Natural Sciences, University of Karachi, Karachi 75270, Pakistan
7
Department of Agronomy, Faculty of Agriculture and Environment, The Islamia University Bahawalpur (IUB), Bahawalpur 63100, Pakistan
*
Author to whom correspondence should be addressed.
Remote Sens. 2021, 13(11), 2059; https://doi.org/10.3390/rs13112059
Submission received: 24 April 2021 / Revised: 19 May 2021 / Accepted: 21 May 2021 / Published: 23 May 2021
(This article belongs to the Special Issue Remote Sensing in Irrigated Crop Water Stress Assessment)

Abstract

:
Drought is an intricate atmospheric phenomenon with the greatest impacts on food security and agriculture in South Asia. Timely and appropriate forecasting of drought is vital in reducing its negative impacts. This study intended to explore the performance of the evaporative stress index (ESI), vegetation health index (VHI), enhanced vegetation index (EVI), and standardized anomaly index (SAI) based on satellite remote sensing data from 2002–2019 for agricultural drought assessment in Afghanistan, Pakistan, India, and Bangladesh. The spatial maps were generated against each index, which indicated a severe agricultural drought during the year 2002, compared to the other years. The results showed that the southeast region of Pakistan, and the north, northwest, and southwest regions of India and Afghanistan were significantly affected by drought. However, Bangladesh faced substantial drought in the northeast and northwest regions during the drought year (2002). The longest drought period of seven months was observed in India followed by Pakistan and Afghanistan with six months, while, only three months were perceived in Bangladesh. The correlation between drought indices and climate variables such as soil moisture has remained a significant drought-initiating variable. Furthermore, this study confirmed that the evaporative stress index (ESI) is a good agricultural drought indicator, being quick and with greater sensitivity, and thus advantageous compared to the VHI, EVI, and SAI vegetation indices.

1. Introduction

As a result of an increased global population, food security, energy, and water resources have become stern issues. Additionally, global climate change has boosted the strength and frequency of these issues [1]. South Asia is considered amongst the most susceptible regions in the world in terms of climate change, as the region comprises approximately 1.7 billion humans [2]. About 1.2 billion people exist in dollar poverty circumstances worldwide, while over 43% are found in South Asia, which mostly belongs to pastoral regions. Since 1990, South Asian plant biodiversity has remained vulnerable to drought, which influenced more than 31% of the total cultivation land. The frequency and intensity of drought have been increasing since the 20th century in many parts of South Asia. During the last three decades, more prolonged and more intense droughts have been observed mainly caused by high temperatures and low land precipitation rates [3]. According to the international disaster database (IDD), drought accounts for only up to 5% of natural disasters, but it affects about 30% of the human population. An obstinate period of abnormally dry climate conditions, leading to a deficiency in water, is simply known as drought [4]. The severity of the drought is contingent upon its frequency and duration. Global warming is a frequent concern with extreme drought events [5]. Based on upcoming projections about climate change, drought is likely to increase more because of disparities in temperature and pattern of precipitations [6]. South Asia is considered among the regions acknowledged as the most food-insecure globally, and the principal mediator of crop reduction is agricultural drought [7]. The negative connections between agriculture and drought are likely to attenuate supplementary food production, particularly in those regions having minimal crop technologies [8]. Drought is thus highly hazardous to economically challenged and social development regions [5]. According to investigations reported by Stabinsky et al. [7], South Asia contributes about 31% of the world’s rice production and 18% of its wheat.
Agricultural drought can be measured by conventional data using integrated indices of soil and weather conditions, such as the agro-hydro potential index (AHPI) and crop moisture index (CMI). Although these data can define drought status, it is not entirely satisfactory for those regions, which lack suitable and sustained records. Ground-based indices are usually performed using climate variables such as average precipitation and temperature. Applications and availability of these data exceedingly depend upon the distribution of the local or regional metrological stations and networks, while indices based on remotely sensed data are useful tools for large-scale drought monitoring [9]. However, remotely sensed imagery from satellite sensors, such as moderate resolution imaging spectroradiometer (MODIS), advanced spaceborne thermal emission and reflection radiometer (ASTER), and LANDSAT, can form a comprehensive method for agrarian drought analysis. Drought monitoring based on satellite-derived products has been found appropriate and momentous [10]. A massive range of techniques has been developed to characterize agricultural drought based on remotely sensed data at regional and global scales, such as the normalized difference vegetation index (NDVI), developed first in the 1970s [11]; the vegetation condition index (VCI); temperature condition index (TCI); vegetation health index (VHI) [12]; standardized precipitation evapotranspiration index (SPEI) [13]; Palmer drought severity index (PDSI); and U.S. drought monitor (USDM) [12,14]. Previous studies [15,16,17] have used NDVI to monitor agricultural drought stress.
The evaporative stress index (ESI) based on the evaporation volume is considered more valuable to assess agricultural drought. The evaporative stress index (ESI) is a fraction of the potential evapotranspiration to actual evapotranspiration [18]. The amount of evapotranspiration gained under ideal conditions is referred to as potential evapotranspiration, such as sufficient moisture supports healthy crops, while actual evapotranspiration is influenced by different factors, such as weather conditions, crop conditions, and water supply, etc [19]. The difference between potential and actual evapotranspiration can conclude on how much water is in an area. Recent studies [18,20,21] indicated that the evaporative stress index (ESI) is more suitable and sensitive in drought detection. It has been even used for agricultural drought detection and comparison with existing vegetation indices and found it satisfactory and applicable in the United States [20]. As a leading agrarian zone, the interaction between climate and crops has remained a significant research interest in South Asia [2].
Most of the studies focused on meteorological drought, whereas limited studies have described agricultural drought over South Asia as a whole. Besides, vegetation-based drought indices have been revealed to be appropriate for evaluating vegetation conditions generally but somewhat partial in effectively illustrating the influences of drought on vegetation [18,21]. The earlier investigations were mostly based on vegetation indices. Therefore, the present study was carried out to fill the gap by exploring the performance and effectiveness of the evaporative stress index (ESI) and other vegetation indices (EVI, SAI, and VHI) as agricultural drought monitoring tools over four major South Asian countries from 2002–2019. The ESI contemplates evapotranspiration only. Moreover, in numerous recent studies, its efficacy has been verified in drought detection, such as in Brazil [22], Australia [23] United States [20], and East Asia [18]. In the current study, we compared its performance with vegetation indices in South Asia where little research made use of ESI. Using four kinds of indices, namely, the evaporative stress index (ESI), vegetation health index (VHI), enhanced vegetation index (EVI), and standardized anomaly index (SAI), integrated with MODIS measurements, the TRMM 3B43 precipitation product, soil moisture (SM), and information from crops yield and land cover-type data, we determined the severe drought year, severe drought months, and drought development patterns in each country. The severity of the climate variables, namely, rainfall, land surface temperature (LST), and soil moisture (SM), and their associations with the drought indices, were observed. Furthermore, the performances of the drought indices were analyzed using field measurement data (crop yield). This investigation contributed valuable insight regarding agricultural drought severity in South Asia, which is supportive of sustainable solutions.

2. Materials and Methods
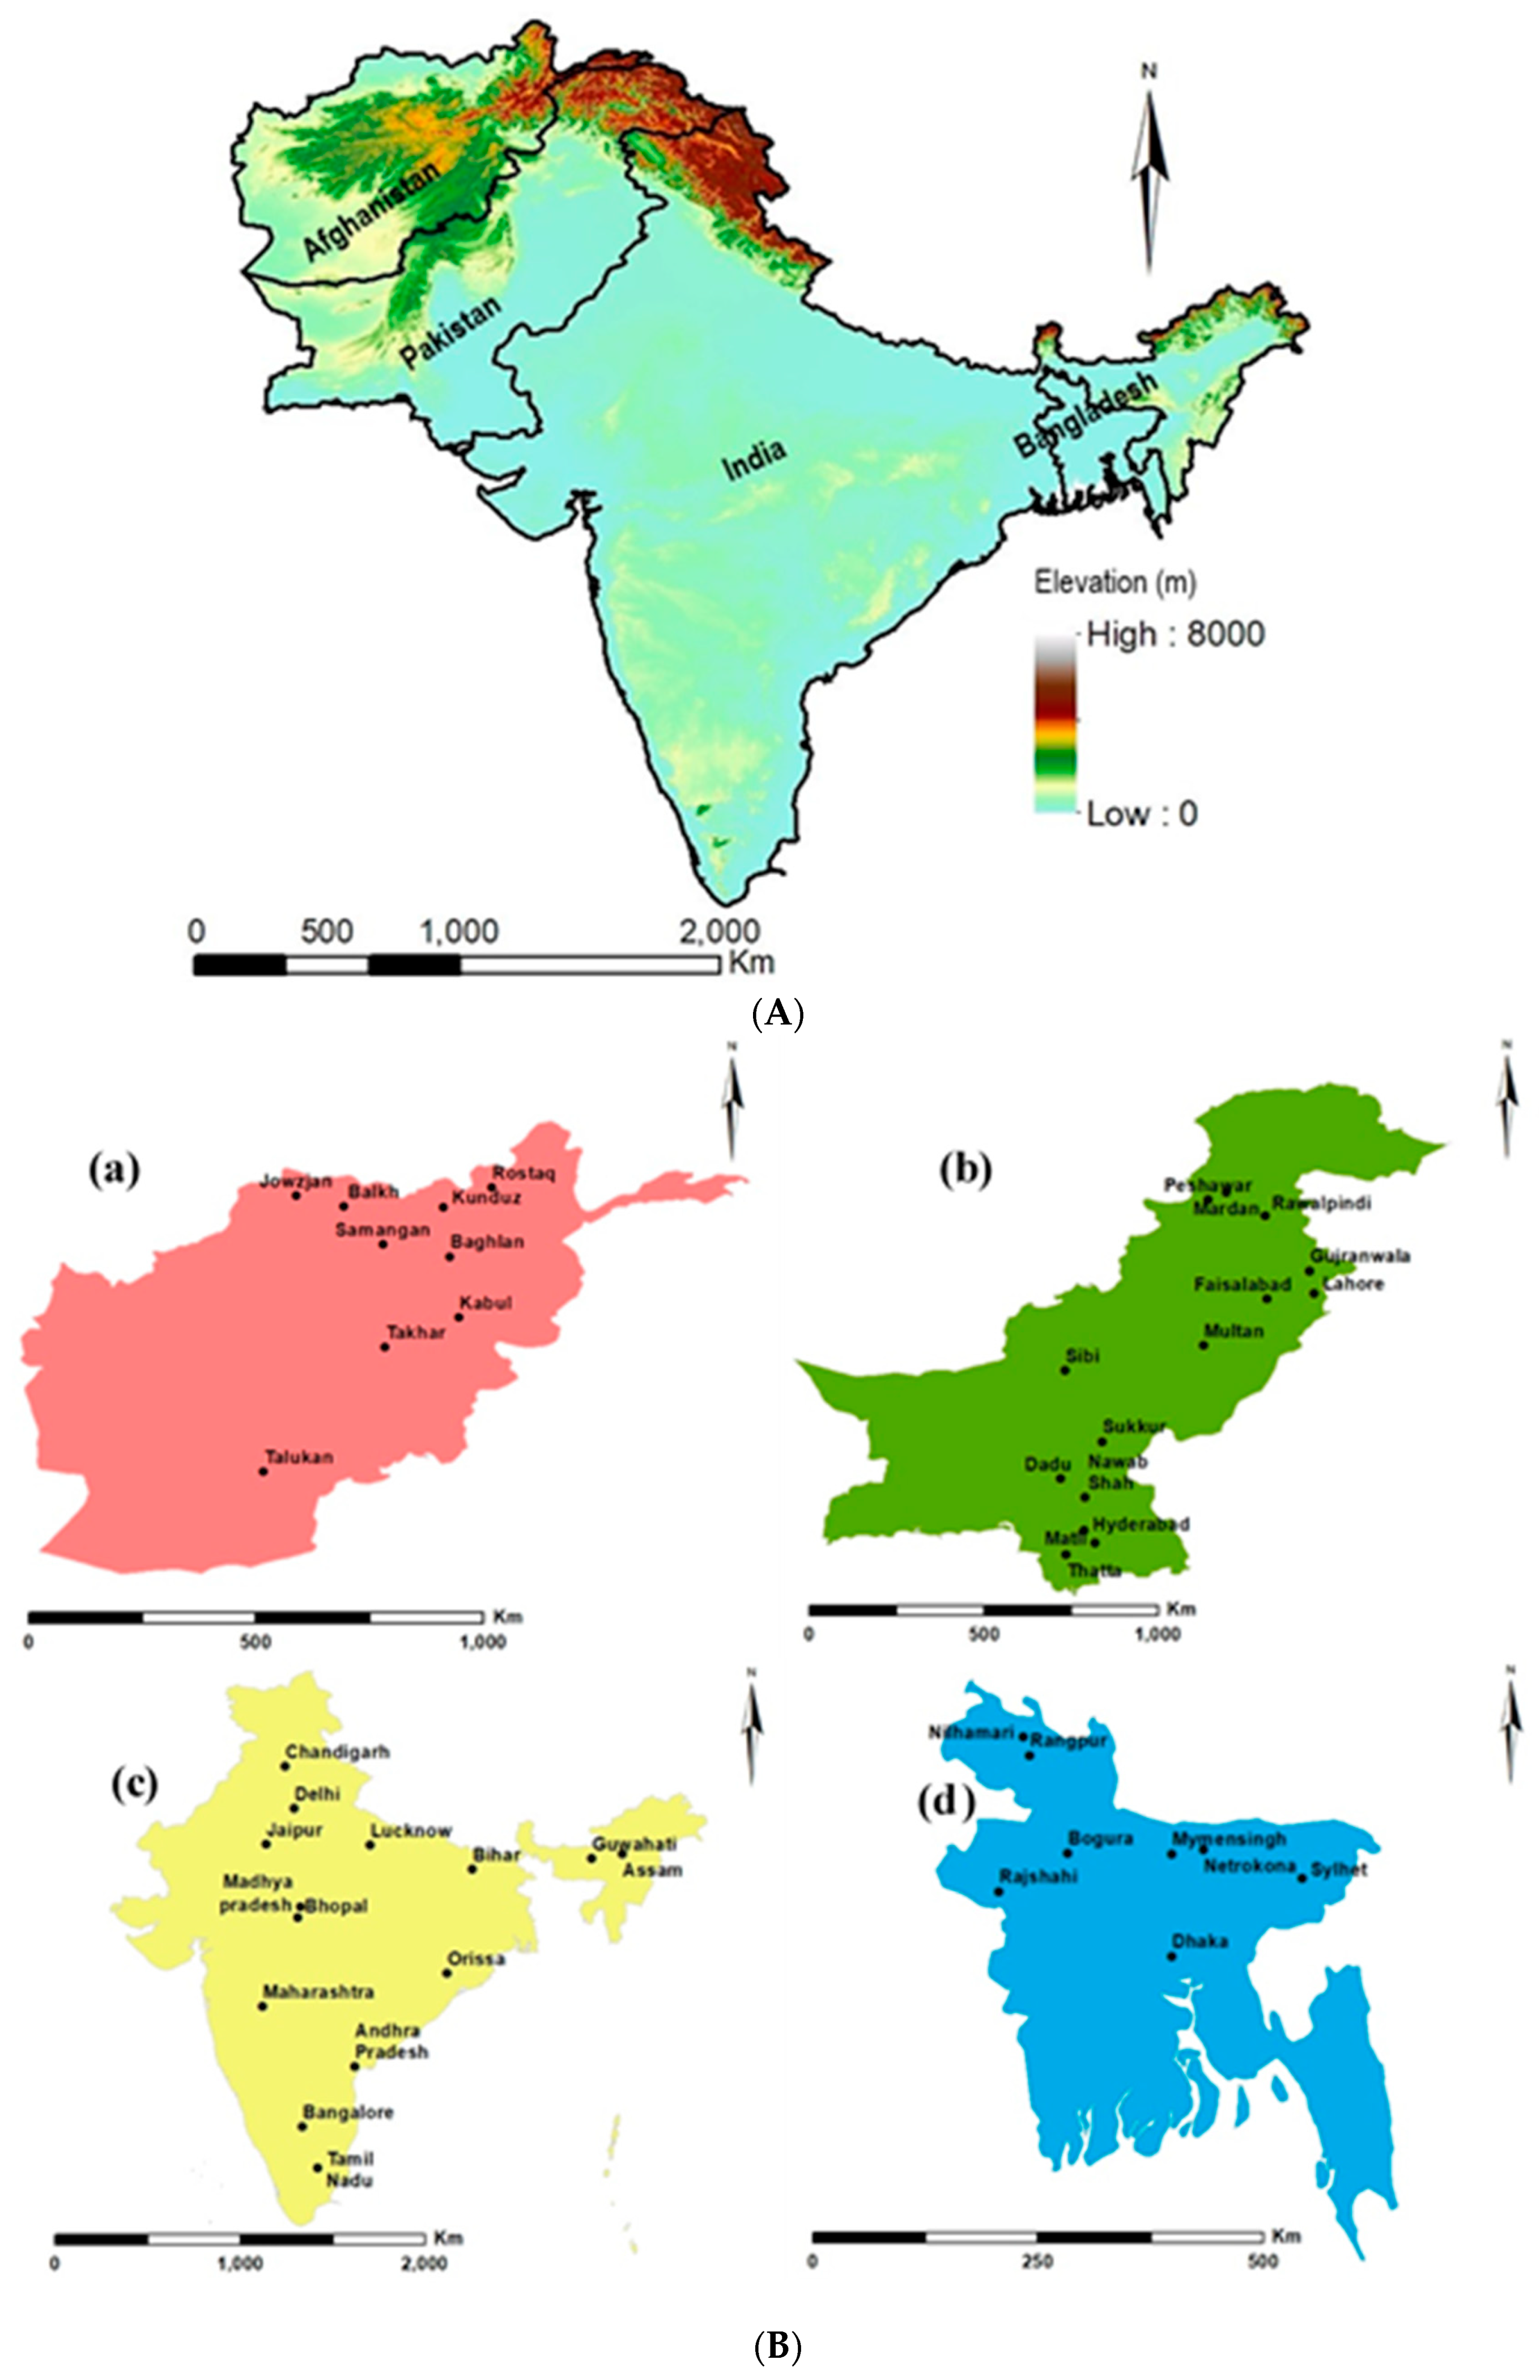
2.1. Study Area

South Asia is a region comprising eight countries, Afghanistan, Pakistan, India, Bangladesh, Nepal, Bhutan, Srilanka, and the Maldives. Amongst them, Afghanistan, Pakistan, India, and Bangladesh are considered major contributors regarding agriculture (Figure 1). This study was focused precisely on these four major agricultural countries. India is next to the United States, the second-largest country in the world, having 160 million hectares of agricultural land, which is about 60% of its total land [24]. Pakistan has about 23.3 million hectares of agricultural land, which is 20% of its total land [25]. Bangladesh has 9.5 million hectares [26], whereas Afghanistan has 8 million hectares of agricultural land [27]. About 70% of the total population has a direct or indirect concern with agriculture. It plays an important role in the lives, livelihood, and economy of individuals. The prime source of income is agronomy, which depends on rainfall. The agriculture sector of Afghanistan contributes 29.9% of the GDP of the country, while the contribution of Pakistan, India, and Bangladesh is 21.2%, 17.7%, and 18.6%, respectively [7]. This area spans over a diversity of climatic zones, such as arid, drylands and deserts, tropical and subtropical, humid, alpine and mountains, etc. There are four seasons, namely spring or pre-monsoon (March to May), monsoon or summer (June to August), post-monsoon or autumn (September to November), and winter (December to February). Precipitation appears usually during three of these seasons, pre-monsoon, monsoon, and post-monsoon season. This region is well known for its seasonal reversal of winds during the summer season. The nature of monsoonal precipitation varies from region to region and is significantly variable on spatial and temporal scales [28]. The summer monsoon connected with southwesterly winds provides a large proportion of annual rainwater in the region. About 75% of the annual rainfall is contributed by the summer monsoon but a large area in the north and northwest also receive winter monsoon rains. During the winter season, the northwestern parts remain under the influence of western disturbances caused by the Mediterranean Sea and the Atlantic Ocean that pass over South Asia. The agriculture of South Asian countries is especially linked with the summer monsoon [29].
Generally, barley, wheat, rice, maize, sorghum, oilseeds, pulses, and some other crops such as cotton is cultivated in these countries. Moreover, planting and growing seasons differ by crop type and area [7].

2.2. Data Products

2.2.1. MODIS Products

MODIS sensor aboard the Terra and Aqua satellites provide highly accurate geophysical data products. MODIS data products have been extensively used to assess drought dynamics [30]. In this study, Terra MODIS data products, i.e., MODIS 8-day surface reflectance product (MOD09A1) at 500 m spatial resolution, MODIS 8-day land surface temperature product (MOD11A2) at 1 km resolution, and MODIS 8-day land cover type product (MCD12Q1) at 500 m spatial resolution, were obtained from the NASA Earth Science Data website for the period 2002–2019.

2.2.2. TRMM Product

The tropical rainfall-measuring mission (TRMM) is a joint mission of the Japan aerospace exploration agency (JEXA) and NASA. It was initially designed as a three-year assignment, but was sustained because of its efficiency [31]. The TRMM 3B43 product provides accurate precipitation data (mm/h) because of onboard measurements from instruments of multiple satellites and the global precipitation climatology center (GPCC). TRMM 3B43 rainfall data from the years 2002–2019 were downloaded from the NASA Earth Science Data website [32]. This product based on monthly data makes available an area 50 degrees south to 50 degrees north latitude with a 0.25° spatial resolution [1].

2.2.3. FLDAS Product and ESI Images

The soil moisture (SM) data (0–10) cm based on monthly observations with 0.1° × 0.1° spatial resolution was downloaded from the Land Data Assimilation System (FLDAS product) for the years 2002–2019. This model dataset resulted from the simulation run forced by the arrangement of the CHIRPS and MERA-2 datasets [33]. It has been used to monitor hydro-meteorological dynamics linked with food security appraisals in data-sparse developing countries [34]. The ESI 4 weeks and 12 weeks of composited global images can be acquired through SERVIR Global. It is a joint mission of the United States Agency for International Development (USAID) and NASA [18]. In this study, we used ESI 4 weeks of data at 5 km spatial resolution.

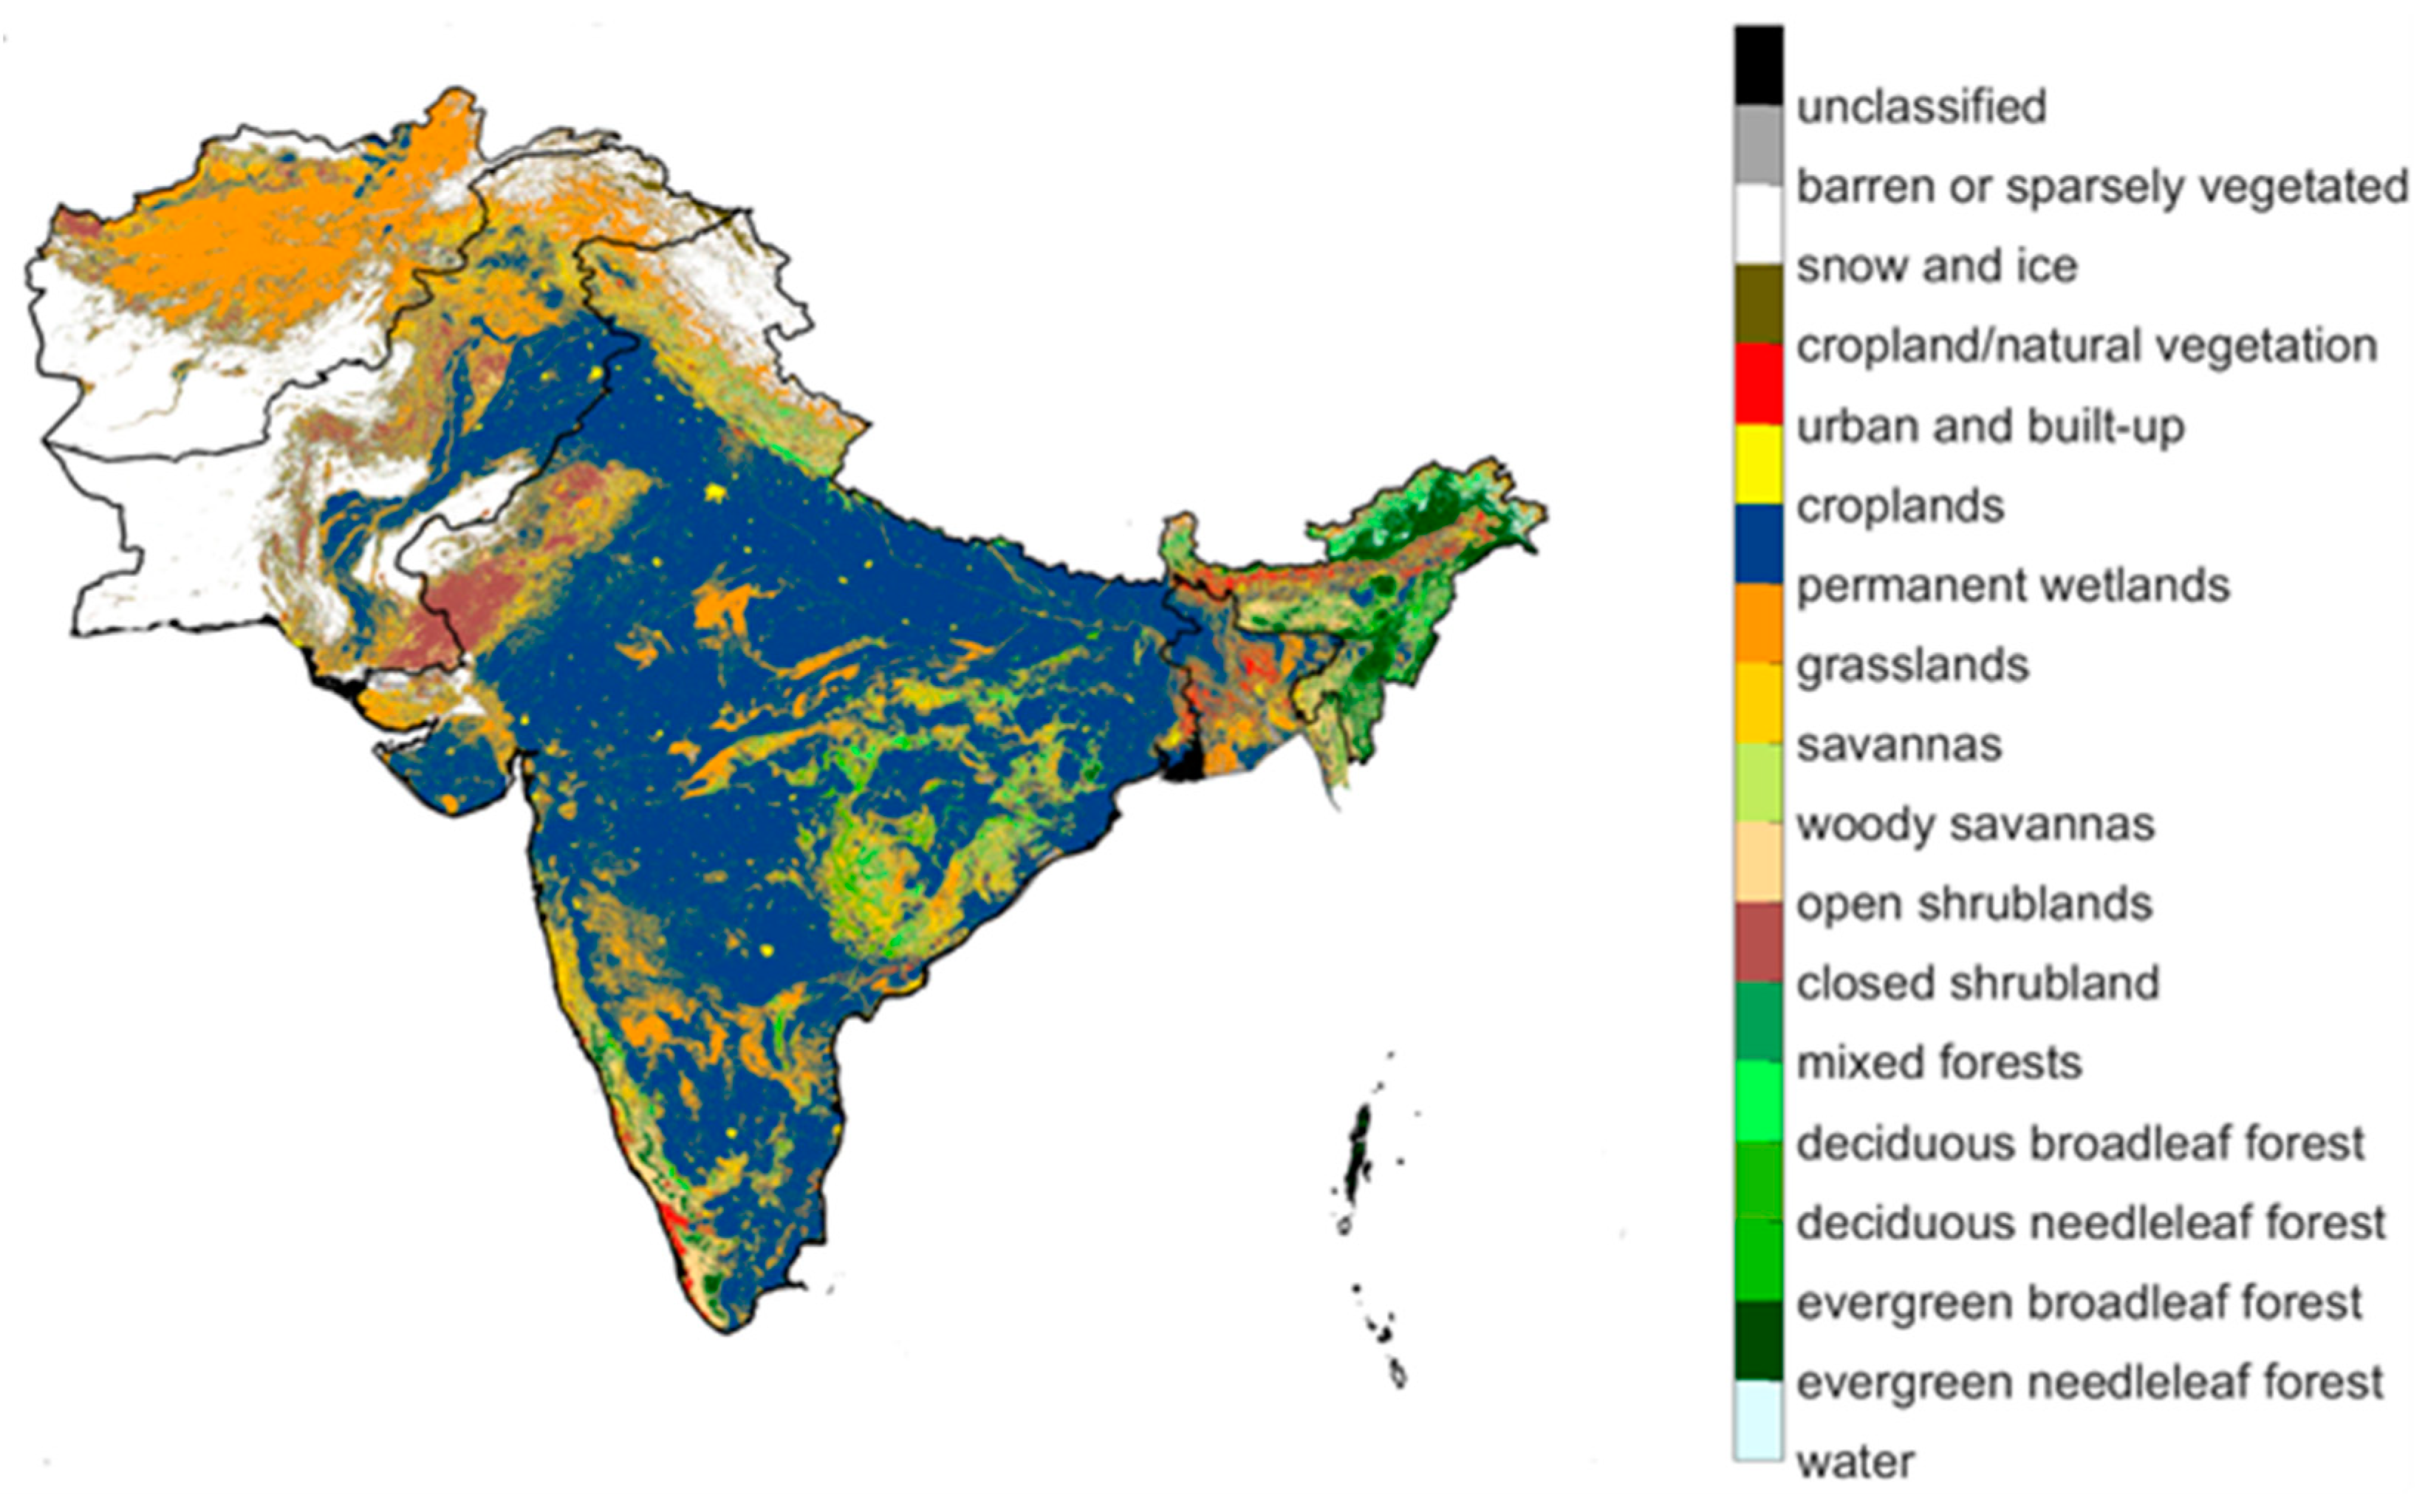
2.2.4. Land Cover Type Data

There are different land cover types (LCT) data sets accessible for crop monitoring; even MODIS (MCD12Q1) products have five categories of land cover types. The study conducted by Meroni et al. [35] showed that different remote sensing data could reach different conclusions. According to consequences reported by Perez et al. [36] regarding the performance of nine LCT data sets, MODIS–IGBP (International Geosphere-Biosphere Programme) data products were found valuable for cropland monitoring. So, we used IGBP–type 1 of MCD12 data products to make the land cover type maps in this study (Figure 2).

2.2.5. Annual Crop Production

National annual barley, maize, rice, and wheat production data for Pakistan, India, Bangladesh, and Afghanistan were downloaded from the Food and Agricultural Organization (FAO) for the period 2002–2019. Although this dataset has abundant quality measures, there still is some level of uncertainty. Even, with these uncertainties, this dataset is still considered the most reliable and readily accessible data [37].

2.3. Methods

The different datasets cannot be processed directly because of their differences in terms of spatial and temporal resolutions [38,39]. For instance, the ESI data were retrieved from SERVIR Global and data from the MODIS sensor aboard the Terra and Aqua satellites, but both have different resolutions, which cause mismatching of data. Thus, temporal and spatial interpolation techniques have been carried out. All MODIS 8-day products were re-projected and resampled first using the MRT re-projection tool at 0.05-degree spatial resolution and then converted into monthly/annual data using the time weighting method [1]. To deal with the evaporative stress index (ESI), 4-week images from the geospatial data-abstraction library (GDAL) were used to convert all images into network common data form (NetCDF) files. Using climate data operators (CDO), the spatial and temporal interpolations were carried out and then spatial plots were generated. Besides the MODIS and evaporative stress index (ESI) data, both the spatial aggregation and temporal composite tactics were applied against other data sets, such as soil moisture and precipitation [40]. The NDVI distribution pattern is a good indicator to identify agricultural drought. However, it was problematic to focus only on the NDVI values to monitor agrarian drought at the larger level because the crops were not only affected by climate factors but also by many local factors [4]. Thus, four remote sensing-based indices (evaporative stress index (ESI), vegetation health index (VHI), enhanced vegetation index (EVI), and standardized anomaly index (SAI)) were used to generate spatial distribution maps and compared to identify drought development patterns more accurately in drought-affected regions. The spatial maps were generated for the period 2002–2019 over four major agricultural countries of South Asia (Figure 1) against each year separately to classify severe drought years. The development pattern of drought during the severe drought year was considered serious and spatial maps were generated further regarding drought months against each country separately. The drought development pattern is different in each country because of the geographical location of the countries. Moreover, planting and growing seasons highly vary from country to country. Consequently, to find an accurate description of the severe drought distribution pattern amongst the months of a severe drought year in each country, the regions were divided country-wise and spatial maps were created [18].
The evaporative stress index (ESI) was developed as a new drought detection tool [20] that specifies standardized anomalies in a normalized clear sky evapotranspiration ratio where reference evapotranspiration (ET) is taken under consideration to reduce the influence of moisture-less drivers. Mostly, FAO–96PM (Penman–Monteith) is used as a reference for evapotranspiration [20]. During the recent studies of different scaling fluxes over the United States, the FAO–96 PM has been identified as the best agreement with drought detection and classification in the U.S. Drought Monitor, especially with moisture-based drought indices [18]. The impacts of seasonal variations on net radiation at the surface of land can be reduced by taking reference ET under consideration rather than evapotranspiration alone. It gives a more expressive and better depiction of moisture-based stress [22]. Therefore, it was used in the existing study. The evaporative stress index (ESI) is based on the remotely sensed model ALEXI (Atmosphere–Land Exchange Inverse), which computes through a two-source energy balance model [19,21]. In the current study, pre-calculated data were plotted over the study region. A value of −2 or below is an indication of drought while above 2 demonstrates no drought or wet condition [22,23]. This index can be calculated using the following Equation (1), as suggested by [23].
ESI = rET ( rET )   σ ( rET ) ,
where (rET) represents ET fraction climatology and σ(rET) denotes ET fraction standard deviation. In turn, rET is an evapotranspiration fraction and can be calculated using Equation (2).
rET = ET PET
where ET is the reference evapotranspiration and PET is potential evapotranspiration.
The vegetation health index (VHI) is a remote sensing-based vegetation index and applied habitually worldwide for drought detection, drought severity, period, and early warning systems [18]. It is the sum of the vegetation condition index (VCI) [41] and temperature condition index (TCI) [42]. In the present study, we calculated this index using Equations (3) and (4), as suggested by [9,10,42].
VHI = a   VCI + ( 1 a ) TCI
where a denotes the weight parameter constant, which is normally 0.5. The VHI has a value range between 0 and 100 and a value < 30 is considered as drought [1].
VCI = NDVIi NDVImin NDVI   max NDVImin
NDVIi represents a smoothed pixel value of NDVI in a month or year, while NDVImax and NDVImin are the absolute maximum and minimum values of the NDVI calculated (Equation (5)) for each pixel in the same month or year. It reflects the spatial variability and also enumerates the impact of the environment on vegetation [12].
NDVI = ρ nir ρ red ρ nir + ρ red
where ρ red is surface reflectance at the red channel (MOD09A1 band 1) and ρ nir is surface reflectance near the infra-red channel (MOD09A1 band 2) [1].
VCI and TCI can be calculated using Equations (4) and (6) [41,43]. Previous studies [10,16] have also used TCI and VCI for drought monitoring.
TCI = LSTmax LST LSTmax LSTmin
The enhanced vegetation index (EVI) was proposed to boost up vegetation signals with optimized sensitivity in rich biomass areas and monitoring vegetation through reduced environmental influence [43]. The enhanced vegetation index (EVI) has been exposed to be well connected with the leaf area index, canopy cover, biomass, and fraction of photosynthetically active emissions. Therefore, it is valuable to assess annual, inter-annual, and seasonal disparities in vegetation and drought dynamics [44]. Higher diversity of vegetation in an area causes saturation problems of NDVI. Therefore, the enhanced vegetation index (EVI) is used to overcome such problems. The blue reflectance band is calculated along with the red and infrared bands to reduce atmospheric and soil background influences. It has been calculated using Equation (7) [9].
EVI = G ρ nir ρ red ( L + NIR + C 1 Red C 2 ρ blue )
L is a canopy background factor and is equal to 1. C1 = 6 and C2 = 7.5 are aerosol correction factors, ρ red is surface reflectance at the red channel (MOD09A1 band 1), and ρ nir is the surface reflectance near infra-red channel (MOD09A1 band 2). In turn, ρ blue is reflectance at the blue channel (MOD09A1 band 3) and G is a gain factor with a 2.5 value [45]. Based on the description delivered by NASA and LAAD, the EVI values < 0.2 and >0.08 are considered as drought while >0.2 indicates healthy vegetation [1,44].
A simple way to compute irregularities is to apply the standardized anomaly index (SAI). It is a standardized exodus from the long-term mean. We calculated SAI from NDVI using Equation (8) [46].
SAIi = Xi X ¯ σ ,
Xi is the mean value of NDVI in a month or year, and X ¯ is the long-term mean of NDVI, while sign σ denotes the standard deviation of all data. Spatial maps of the standardized anomaly index (SAI) were generated by subtracting the seasonal climatology means from the overall mean divided by the standard deviation. These maps specify the strength of the variables in the current situation as compared to the normal situation. Liou et al. recently used a standardized anomaly index (SAI) to investigate drought patterns over Ethiopia [46]. The positive values of the index, >0, indicate no drought while negative values, <0, demonstrate drought [47].

2.3.1. Relationship between Drought Indices and Climate Variables

To get a broader illustration of the correlation between the climatic variables and indices, the coefficient of correlation was computed during the drought year against each pixel to find the strength of the linear association. It can imitate the direction and relationship between quantitative and continuous variables [48]. A common technique was used to calculate the correlation, using Equation (9).
r = i = 1 n ( Xi X ) ( Yi Y ) i = 1 n ( Xi X ) 2 i = 1 n ( Yi Y ) 2 ,
where r characterizes the co-efficient of correlation, n denotes the length of time, i shows the number of years, Xi designates the independent variables while Yi the dependent variables, and X and Y demonstrate the mean values. The value range of the coefficient of correlation is between −1 to +1. The values near +1 are considered a significant positive correlation while values near −1 are considered as a significant negative correlation [49,50].

2.3.2. Relationship between Drought Indices and Crop Yield Anomaly

Agricultural drought indices based on remote sensing dataset needs to be validated with field measurements. Therefore, crop statistics of predominant crops such as barley, maize, rice, and wheat from 2002–2019 were considered for validation. The crop yield anomaly index (YAI) was applied to recognize the deviation of yield for a precise year using Equation (10) [51].
YAI = ( γ μ ) σ
where γ is the crop yield of a particular year and μ signifies the long-term average; however, σ is the standard deviation. The relationship between the YAI and drought indices was determined to find a better agreement. Additionally, the temporal distribution of the annual crop yield data and range of drought frequency (occurrence) were calculated.

3. Results and Discussion

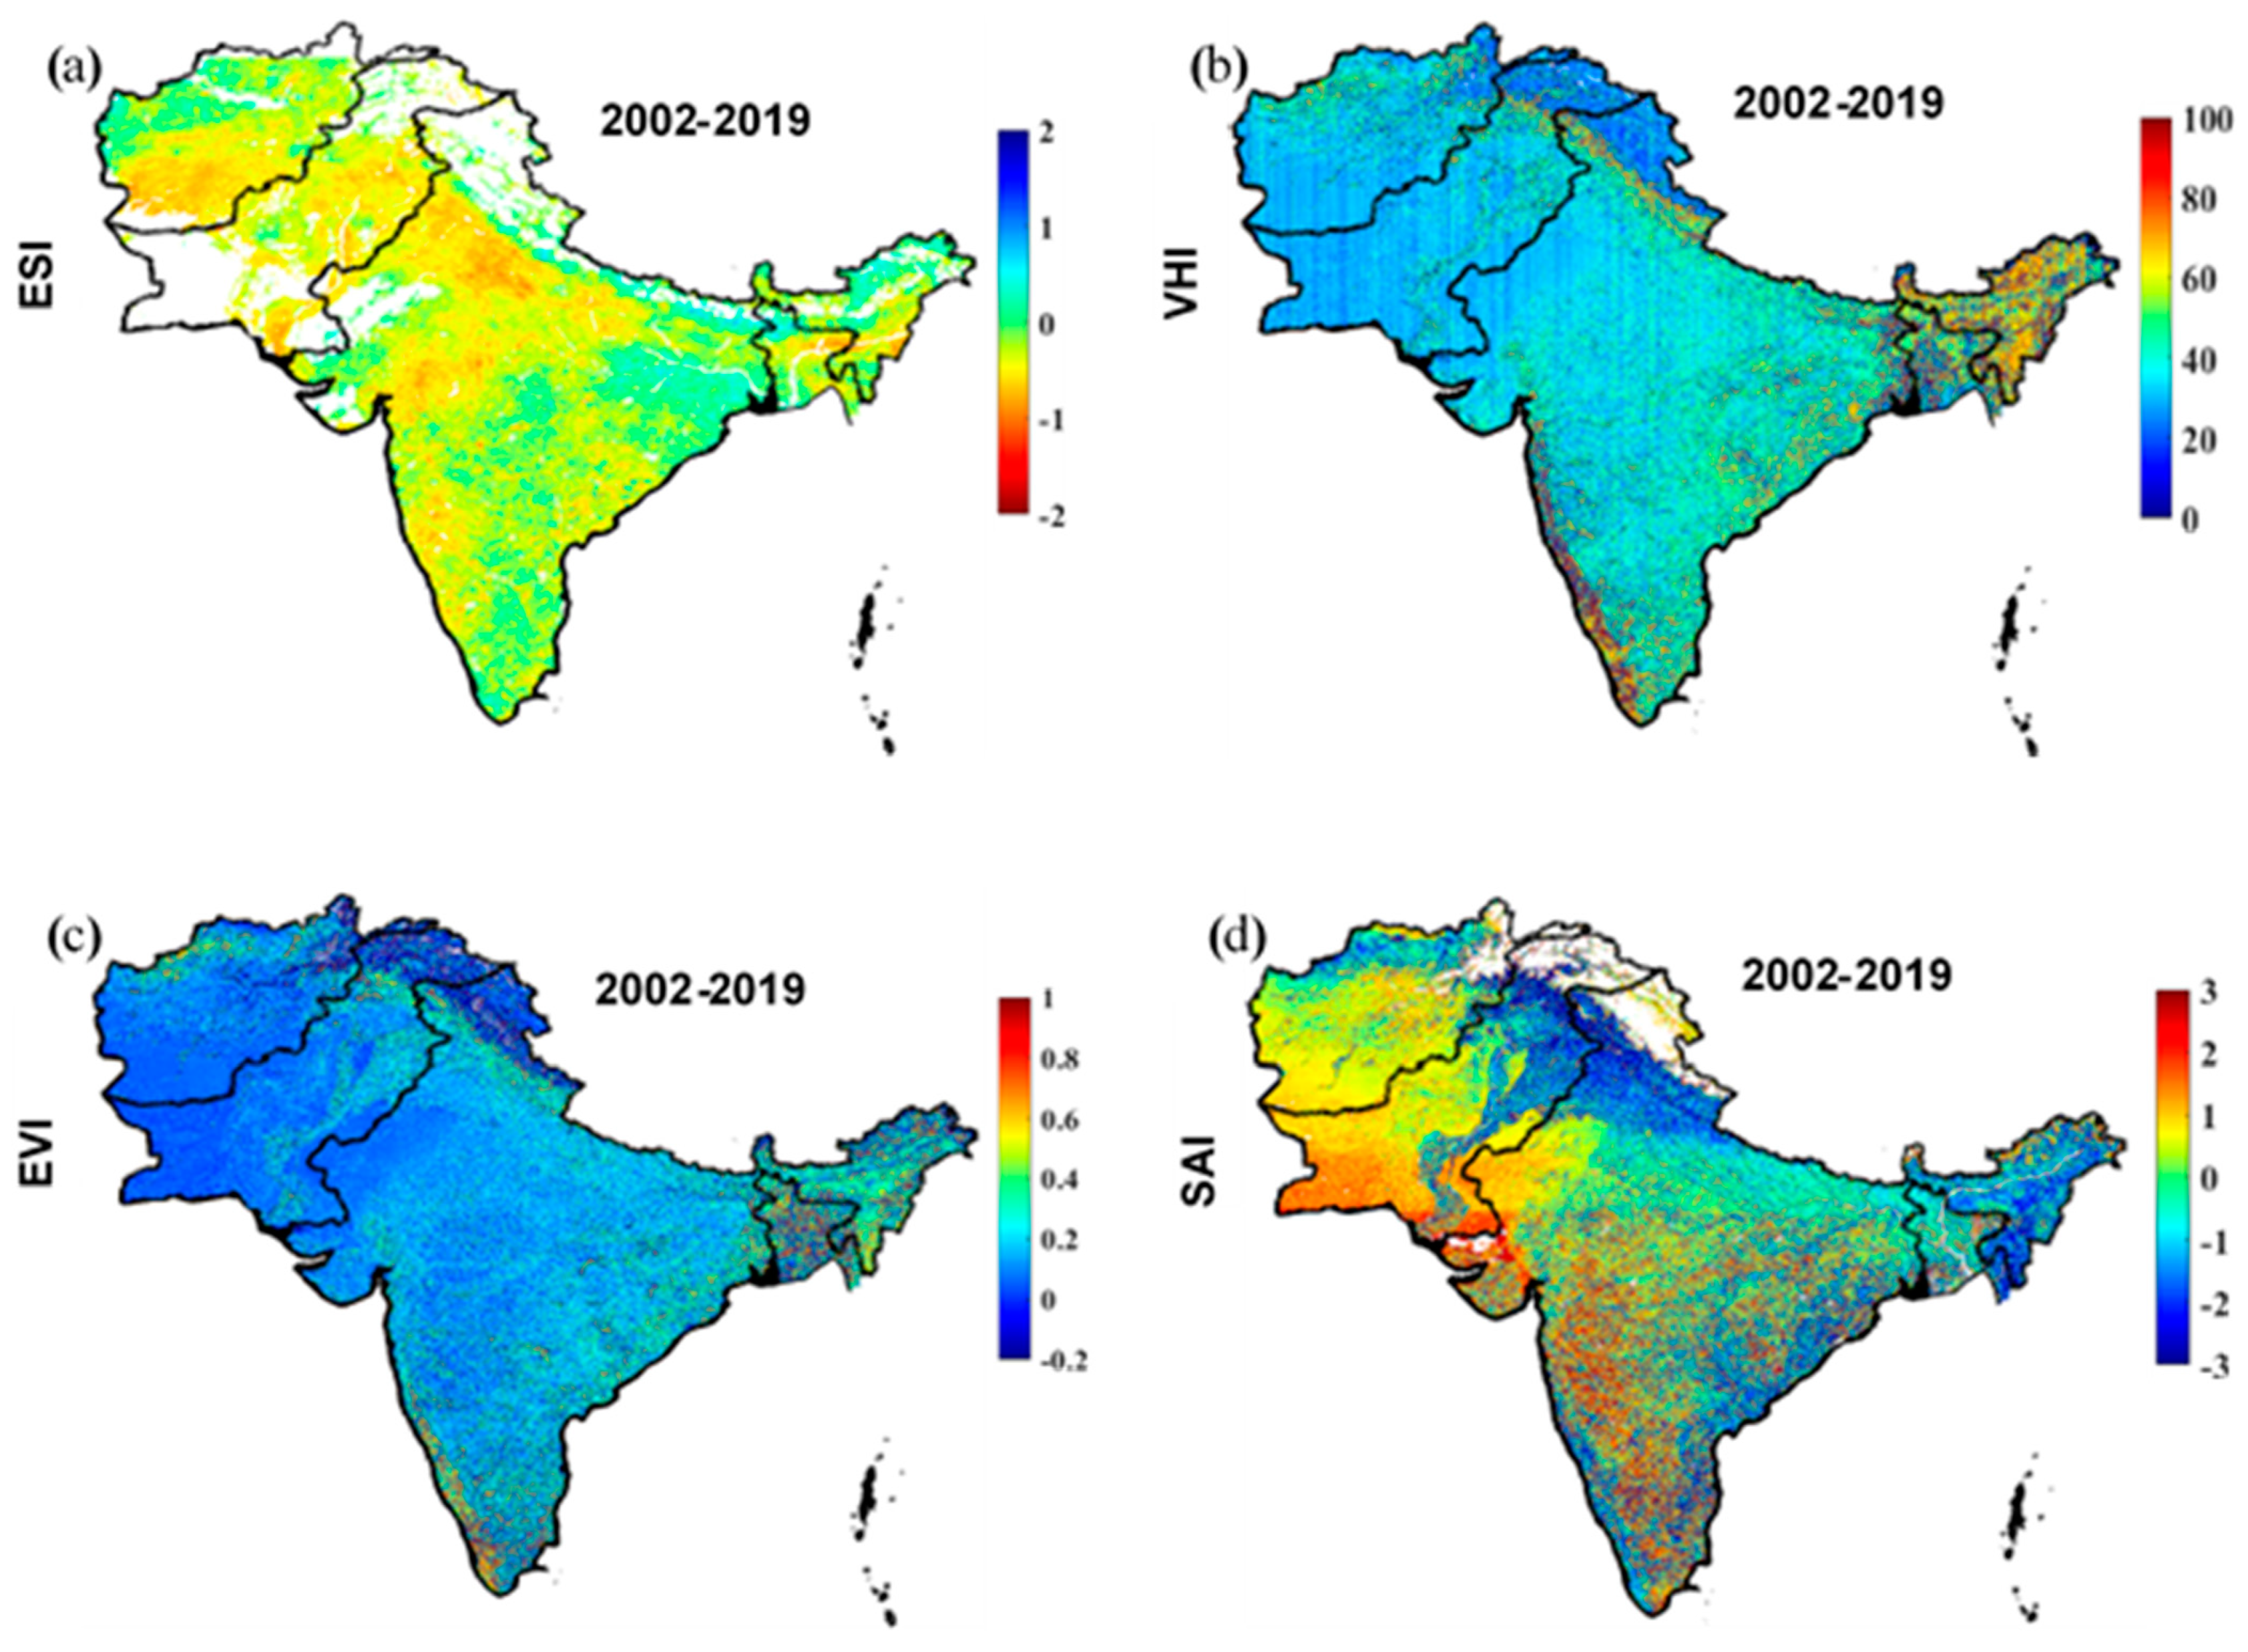
3.1. Drought Analysis Using Spatial Distribution Maps

Figure 3 elucidates the long-term average (2002–2019) spatial distribution maps over the study region acquired through all indices (ESI, VHI, EVI, and SAI) to identify the drought-affected areas. The results suggest that the occurrence and severity of the drought vary in each index. An exception was noted in the performance of the indices. In the case of ESI, the results showed that some regions of Pakistan and India were severely affected by drought as compared to the other two countries. Normally, northwestern and western regions of India were examined under the stress of dryness along with fertile plain regions of Punjab and Sindh (southeastern regions) in Pakistan. Whereas, the eastern and southern regions of Afghanistan and the central zone of Bangladesh were also observed under the stress of dryness. Based on the MODIS land cover type (Figure 2), all these regions are agricultural.
The case of VHI and EVI showed somewhat weaker drought patterns and pointed out the areas having less vegetation. For instance, southern Punjab, Northern Sindh, and a vast part of Baluchistan province in Pakistan are deserted, barren land, or sparsely vegetated regions. All vegetation indices (VHI, EVI, and SAI) showed drought in these regions except ESI (Figure 3). Similarly, SAI indicated minor differences in index values and no tendency towards drought detection, except for the central zone of India. Overall, vegetation indices remained less sensitive as compared to ESI. This is because that ESI is less influenced by vegetation growth and recognizes immediate deficiencies in wetness through differences in evapotranspiration. It responds quickly to rapid intra-soil wet and dry conditions, whereas vegetation indices perform poorly. The vegetation indices related only to green plant biomass are less responsive and considered sluggish to climate variables [22]. Within this context, ESI was able to show drought patterns with more accuracy and sensitivity [18]. As a whole, the spatial analysis indicated that ESI performed well and recognized the drought-affected regions better than vegetation indices. As the main emphasis of this study is agricultural drought, the ESI showed better agreement compared to the other indices.
Figure 4 shows significant variations in the spatial distribution of ESI from 2002 to 2019, which is an important drought indicator. Low and high values of ESI represent more and less drought-affected areas, respectively. The spatial maps exposed severe drought conditions in 2002 over the study region, having a low ESI value of −3.165. The drought year, 2002, was considered further for comprehensive details regarding drought months, drought-affected regions, comparisons of drought indices, and their relationship with climate variables and crop yield data in each country. Presently, it is much more difficult to know about the compensation that drought has caused. Therefore, the areas affected by drought were identified.

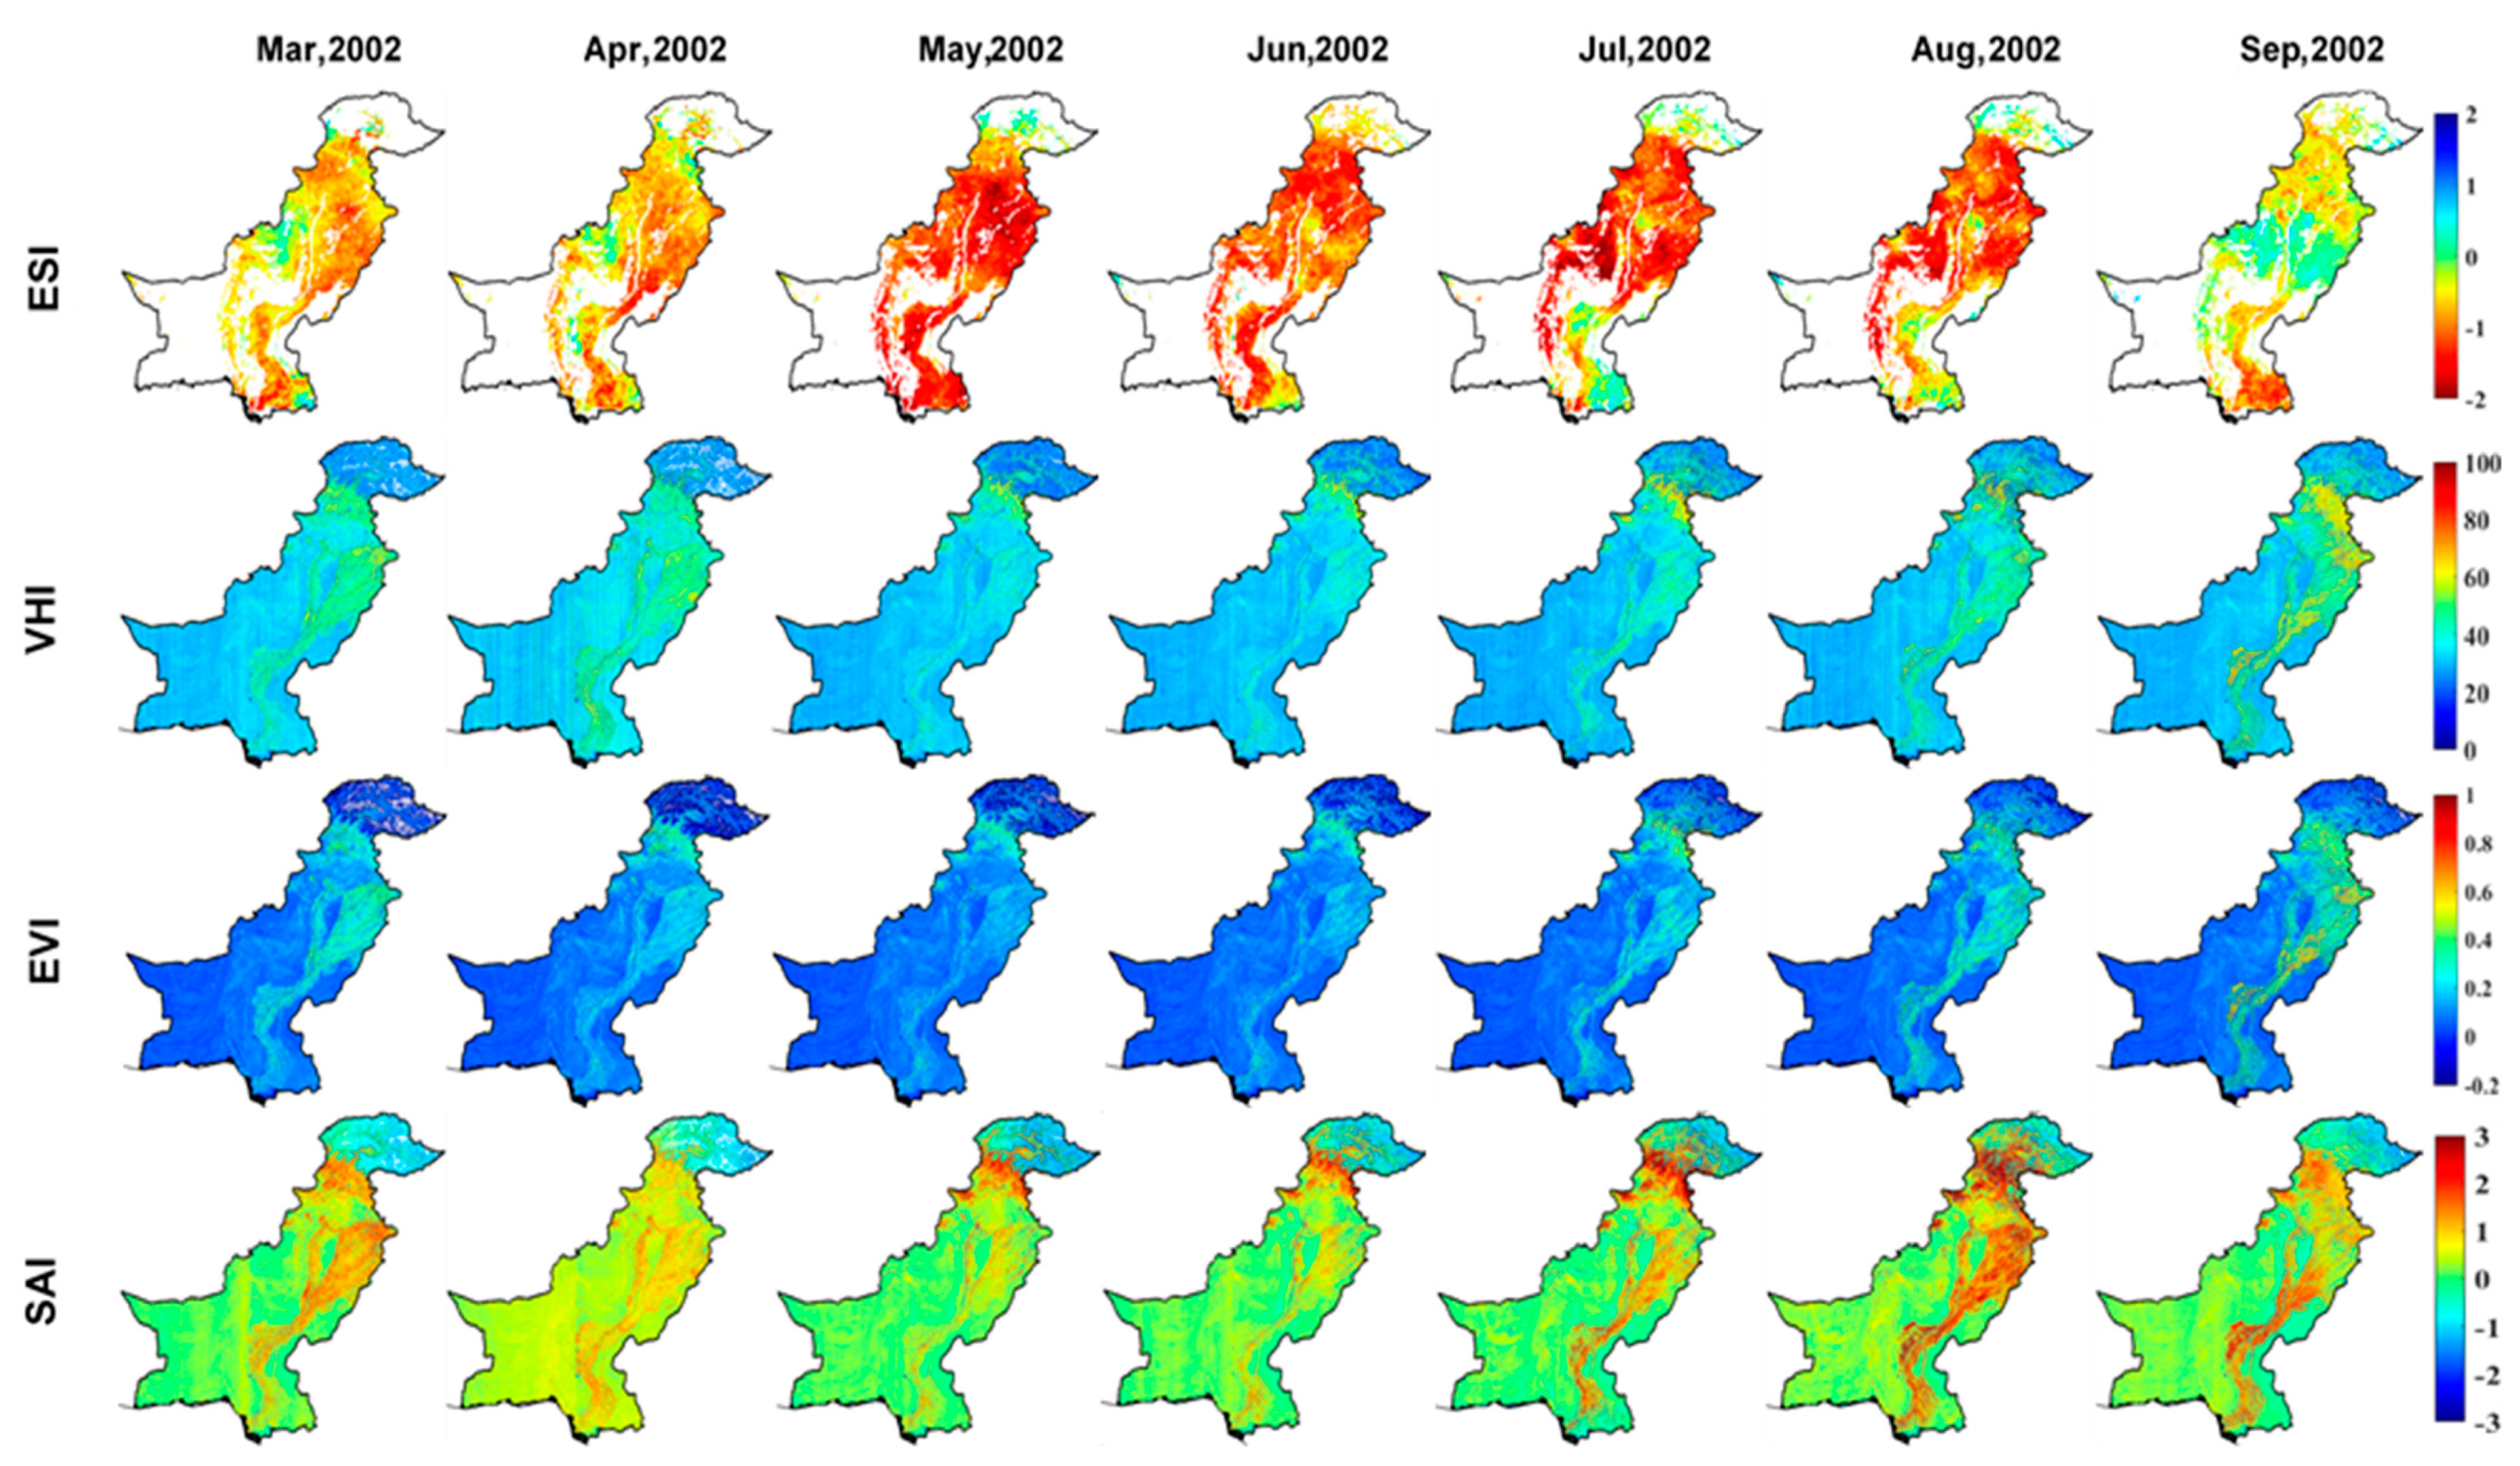
3.2. Agricultural Drought Developments in Pakistan

The ESI indicated drought stress (Figure 5) over Pakistan, affecting Rawalpindi, Gujranwala, Lahore, Faisal Abad, and Multan in Punjab province while Sukhar, Daddo, Nawab Shah Hyderabad, Matli, and Thatta (Figure 1B) in Sindh province during March and April. Drought was seen across all countries during May and June. July and August remained dry over mostly the Punjab province and northwest regions of the country, which comprise Peshawar and Mardan in Khyber Pakhtunkhwa (KPK) province. Sibbi in Balochistan also noticed the influence of drought. After August, drought tended to ease in most of the areas except Thatta and Hyderabad in Sindh province. In the case of VHI, May, June, and July indicated slight drought patterns in Punjab and agricultural land along the Indus river of Sindh and Peshawar KPK. In the case of EVI, drought started to develop in April and the index values generally increased during May and June while the SAI was found as the least drought-sensitive index, which exposed slight drought only in May and June. Based on descriptions derived from spatial plots, the ESI demonstrated substantial outputs. Our investigations on ESI performance are well coordinated with the findings led by Anderson et al. [20] over the United States and Yoon et al. [18] over East Asia. The agricultural drought in Pakistan is especially concerning given the summer monsoon. The precipitation erraticism in Pakistan was due to an abrupt discrepancy in the circulation patterns of the weather systems, such as the western weather system and summer monsoon. Pakistan receives 50% to 60% precipitation from the summer monsoon while about 30% winter rainfall from the western system [52]. Any disturbance in these systems results in frequent drought [53]. Besides climate change, the recent discovery of an El Niño is also associated with drought. A strong presence of El Niño was found near the equator with anomalous high rainfall while anomalous low rainfall in India, Pakistan, and Indonesia [54]. A study by Ali et al. [4] positively supported our findings by expressing low precipitation during the year 2002. Figure 5 depicts that agricultural drought started to develop over different regions of Pakistan from March, which converted gradually to severe drought in May and lasted until August during the drought year 2002. As a whole, Pakistan faced six months of severe drought episodes.

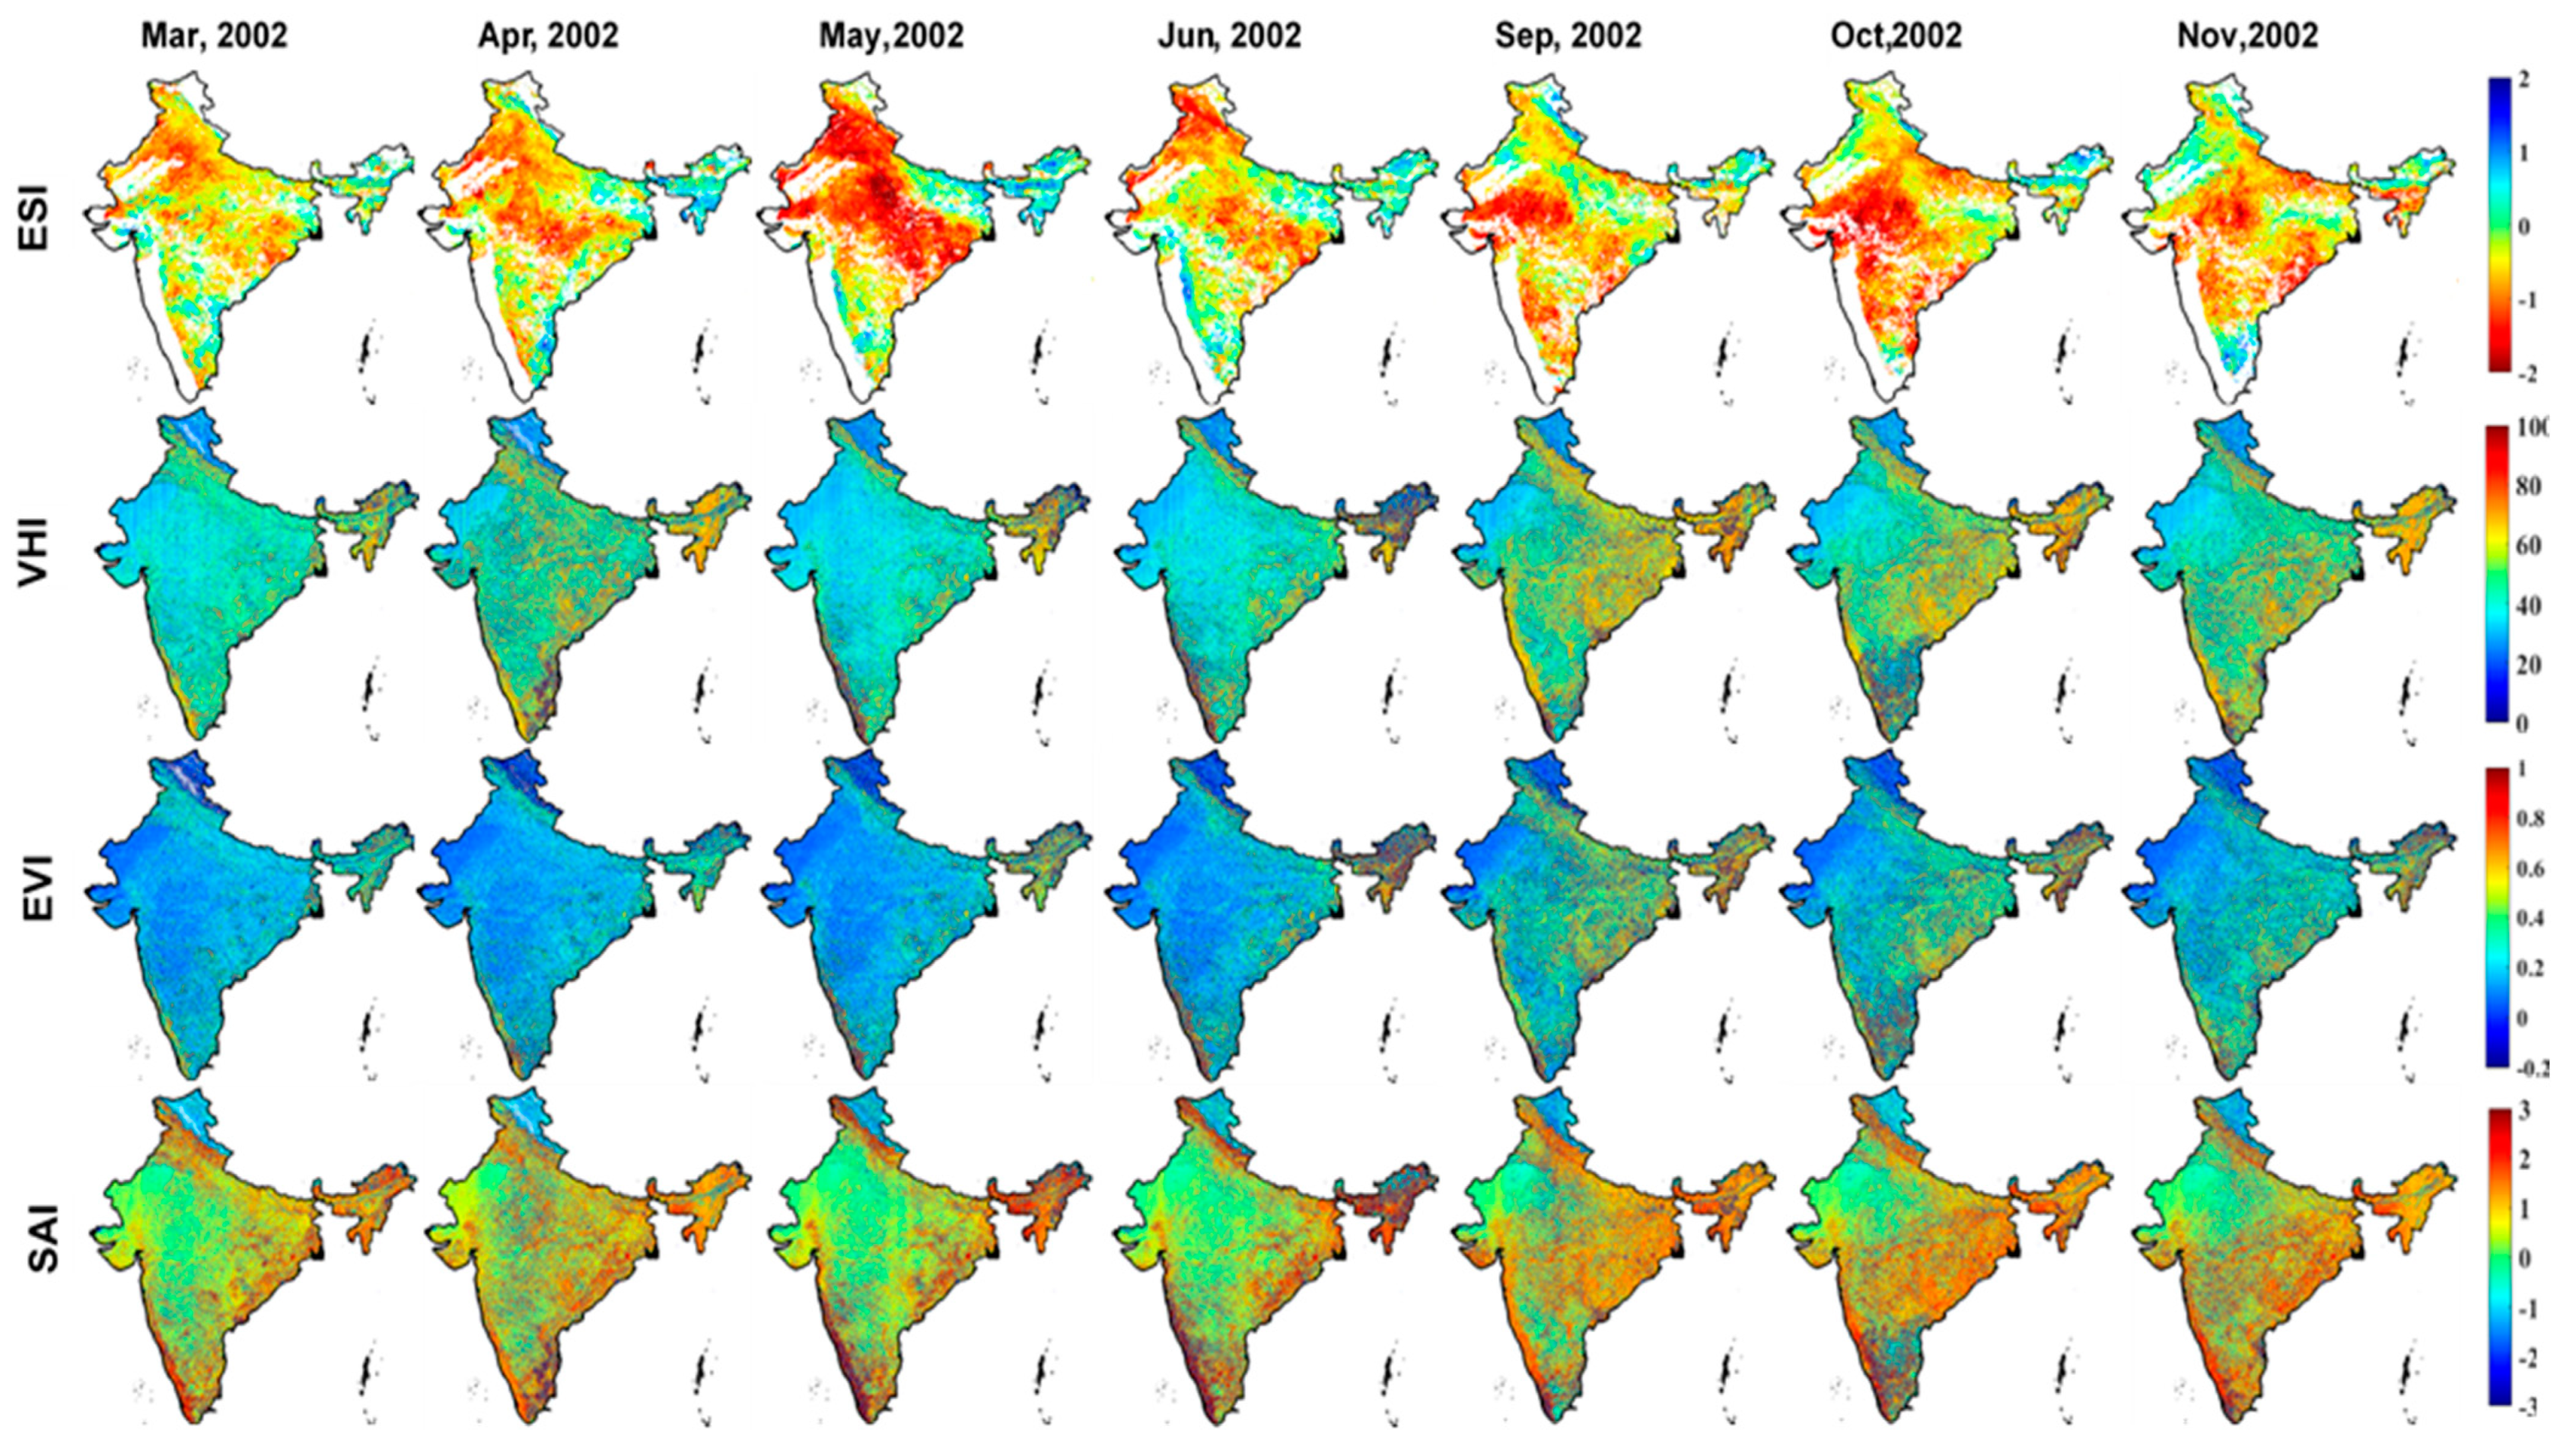
3.3. Agricultural Drought Developments in India

The ESI identified a severe drought pattern over India in two episodes: the first episode from March to June and the second from September to November (Figure 6).
Based on the first episode, the northwestern and eastern regions of the country remained under the stress of drought. These regions include Delhi, Lucknow, Jaipur, Bhopal, and Chandigarh (Figure 1B). It can be seen that drought has a deep influence over Orissa, South Bihar, and Madhya Pradesh along with the earlier-mentioned regions, except for the southern parts of India during May. Drought tended to ease in most of the parts at the beginning of June, due to the excessive monsoon rainfall, when there was no water deficiency found except in the northwestern areas, Orissa, and eastern parts of Madhya Pradesh. India receives southwest monsoon as a primary source of water for agriculture with intermediate dry spells, which is highly variable in space and time [55]. However, during the late summer season or at the beginning of the autumn, a second episode appeared, covering mostly the southern and southeastern parts. These regions include Tamil Nado eastern Bangalore, western Andhra Pradesh, and Maharashtra (Figure 1B and Figure 6). The northeast region Guwahati and Assam also continued under drought stress during November. In the case of VHI and SAI, drought has been seen in May and June while in the case of EVI from March to June. The EVI recognized the same regions as ESI in the first episode but during the second episode, it sustained less sensitivity as compared to the ESI. It is interesting that from March to June mostly the northeastern and western saw drought conditions, while from September to November, the southeastern and western regions of India were under dry conditions. As a whole, severe agricultural drought appeared from March to June and September to November (7 months) during the drought year (2002) and the ESI identified it better and was found to be more sensitive in terms of a drought-detection tool. Our findings are well connected with the investigations carried out by Chandrashekhar et al. [56], expressing that rainfall had remained below average during the year 2002, causing the first severe drought in India since 1987; indeed, the monsoon season of India was exceptional, being 19% drier as compared to average monsoon season. Drought during the monsoon season decreases soil moisture contents sharply and can have implications for agriculture and water management [29].

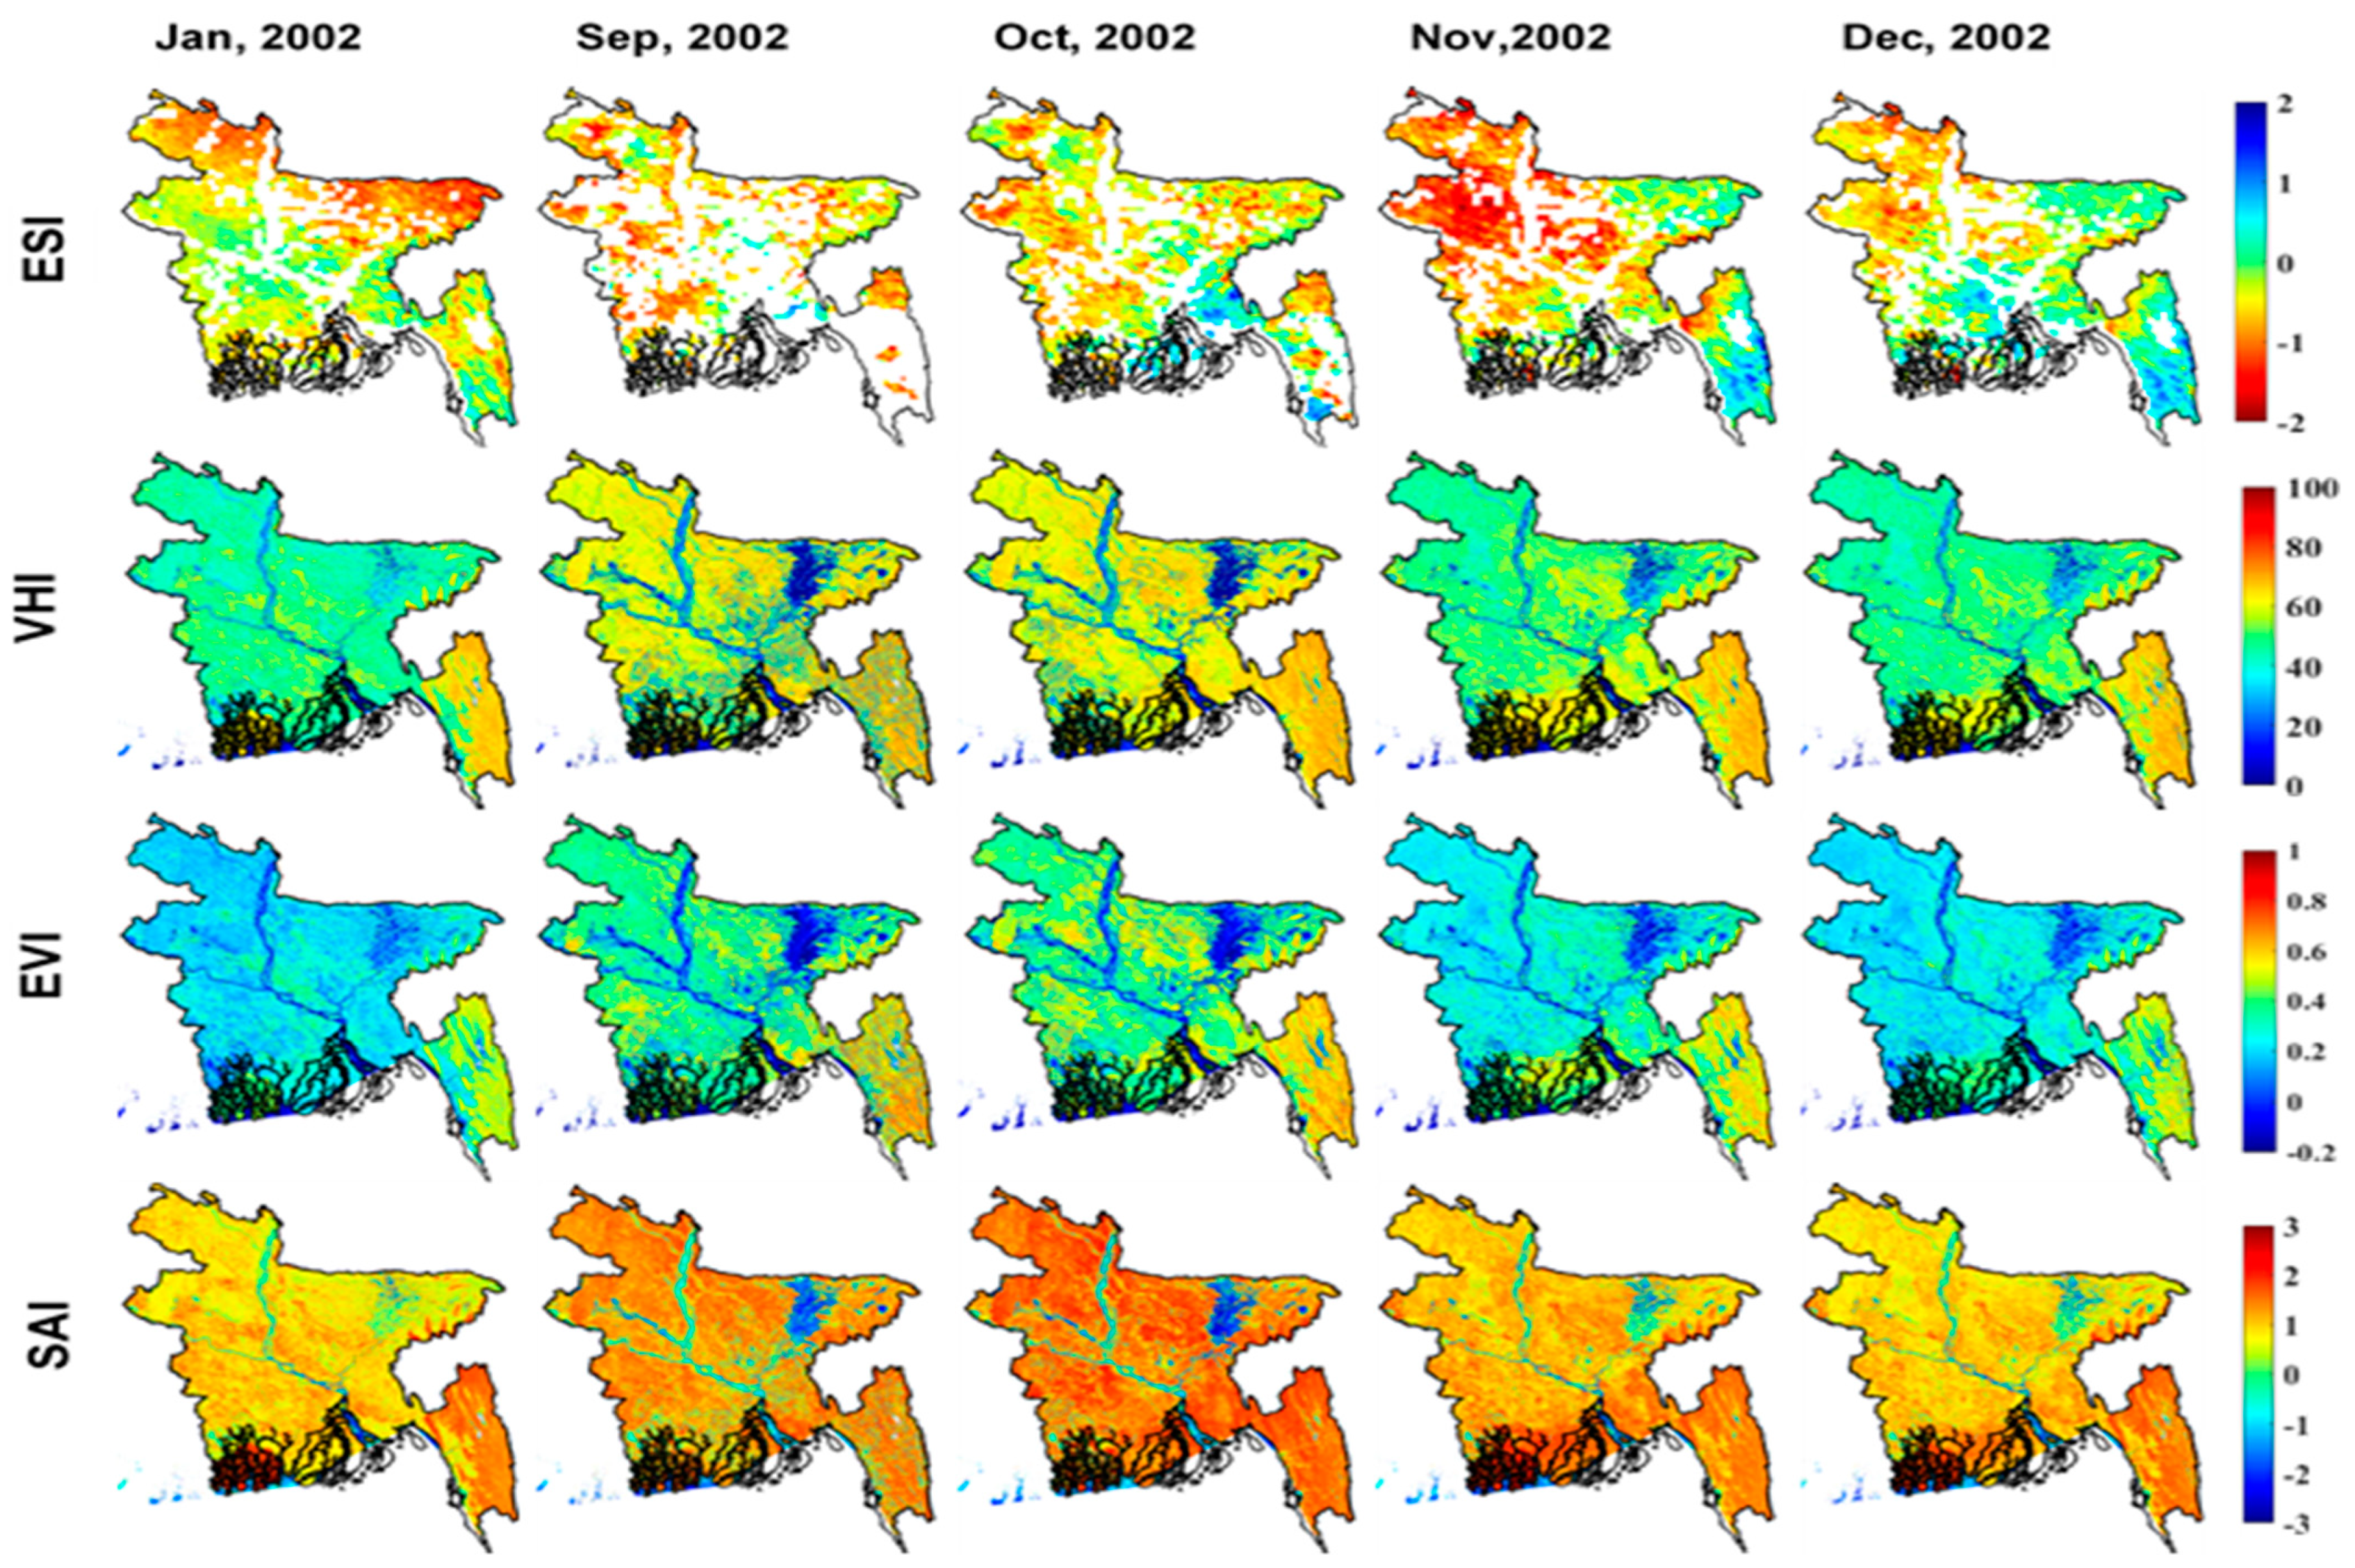
3.4. Agricultural Drought Developments in Bangladesh

Figure 7 illustrates the spatial distribution and the drought-affected areas over Bangladesh. The results suggest that the incidence of drought varies by region, time, and austerity as well. Relatively, it was perceived that moderate drought developed more habitually than severe and extreme drought. In Figure 7, drought patterns were observed for the north, northwestern zone, western zone, and north-central zone during November and December, while for the northeastern zone in January. These zones include Nilphamari, Rangpur, Bogra, Rajshahi, Dhakka, Mymensingh, and Sylhet (Figure 1B). The drought started to develop in September and October, but only slightly. The case of VHI and EVI showed somewhat weaker drought patterns compared to the ESI and pointed out only the north-central region from September to December. However, overall drought detection was recorded poorly. For the SAI, minor differences were seen in the index values among regions but no tendency towards drought detection, except for Netrokona, a city in the central zone from September to October. Conversely, November, December, and January (3 months) were observed as severe agricultural drought months in the year 2002. Moreover, the southern area presented weaker drought patterns to some extent as compared to others. It could be in response to deforestation or climate variabilities [2]. Current findings are well-coordinated with the investigation of Sarmah et al. [2] concerning dry seasons and variation in climate variables, which synergistically reduce agriculture and natural vegetation. Research findings by Ali et al. [57], regarding drought events from 1990 to 2011 using NOAA products over South Asia, are also positively connected with those of our study, and could be well harmonized to show the current consequences.

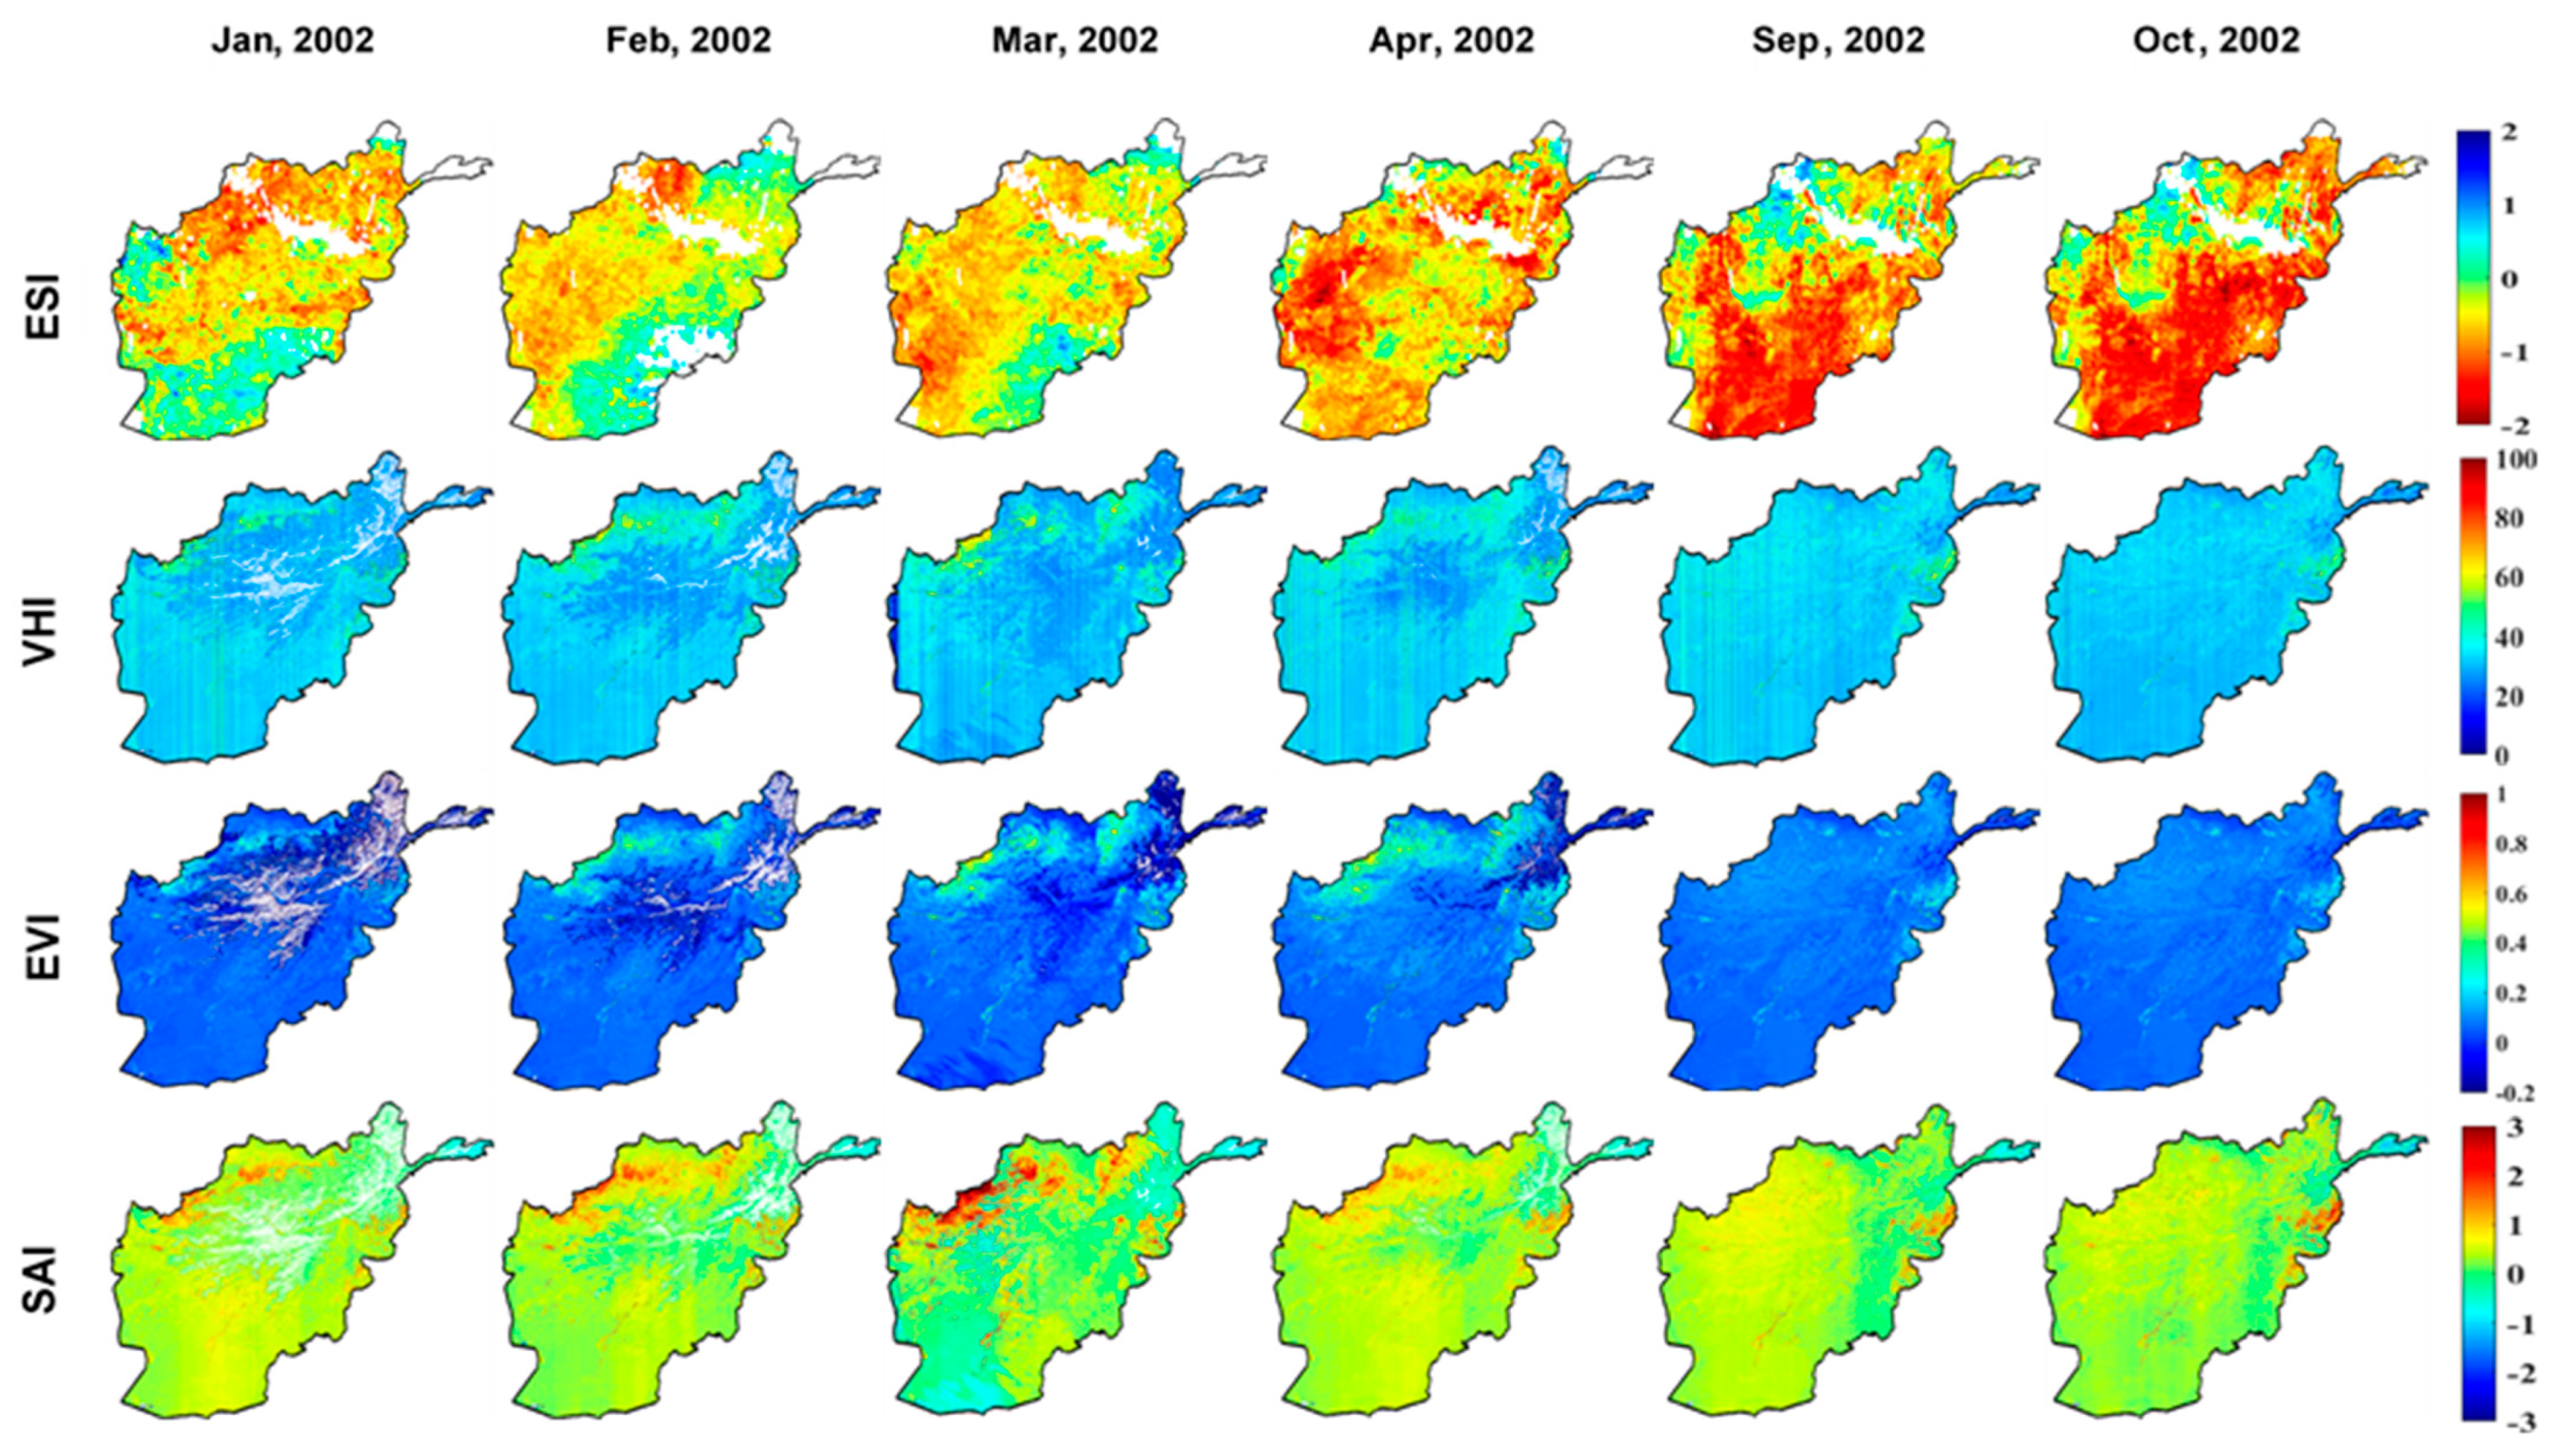
3.5. Agricultural Drought Developments in Afghanistan

The ESI exposed the drought patterns (Figure 8) from January to March in the northern, western, and northwestern zones of the country, including Rostaq, Takhar, Taluqan, Kunduz, Balkh, Baghlan, Samangan, and the region of Towzjan (Figure 1B). Based on MODIS land cover (Figure 2), maximum cropland is situated in these zones. After March, almost the whole country experienced drought, except the Southcentral regions. The central areas showed a weak linkage to drought as compared to the southern and eastern regions during September and October; however, Kabul has remained under high drought risk. In the case of VHI, a normal drought pattern was identified from January to April. EVI demonstrated drought over the whole country in September and October. However, index values presented average drought in other months for agricultural areas and severe drought for nonagricultural areas. The SAI presented no substantial drought. It is fascinating that the north and northwestern parts experienced drought from January to April (4 months) while south and southeastern in September and October (2 months). Based on the depiction derived from spatial maps, the ESI identified agricultural drought more precisely with two episodes of drought in 2002. It could be the response of the combined but inverse effect of precipitation and land surface temperature. The drought in the agrarian sector of Afghanistan is highly susceptible to variations in precipitation, land surface temperature, and snowmelt. An early snowmelt cause reduction in river flows, which create inadequate water conditions for agricultural practices. As a result, due to the low soil moisture contents, drought becomes obvious. Besides, soil evaporation due to high LST and a less frequent precipitation rate during the crop season enhance its severity [58]. The harmony between drought and climate variables over Afghanistan is apparent. Our findings are consistent with that found by Rousta et al. [59]; based on their exploration for the years 2001–2002, the country has one of the lowest precipitation coverages and is water scarce with high temperatures, with the instant effects of droughts seen.
Generally, all four countries showed dissimilar drought patterns during the year 2002 because of their geographical location. During the drought months, weak crop conditions and the potential for long-lasting drought patterns were found. The frequency and duration of the drought highly depend upon rainfall received [60], which is seen from the correlation analysis and significant output of each month. Our results could also be linked back with another study conducted by Wu et al. [61] about vegetation and climate variables on a global scale. Their output confirmed that the length of the change in climatic factors is effectively responsible for the drought. Because of this comparative study, pertaining to drought months in each country, March, April, and May (MAM) were found well to be connected in that they initiated the drought patterns in all countries, excluding Bangladesh where drought appeared from November to January. Additionally, soil moisture upsurges affect agriculture, more typically so as compared to the other two factors.

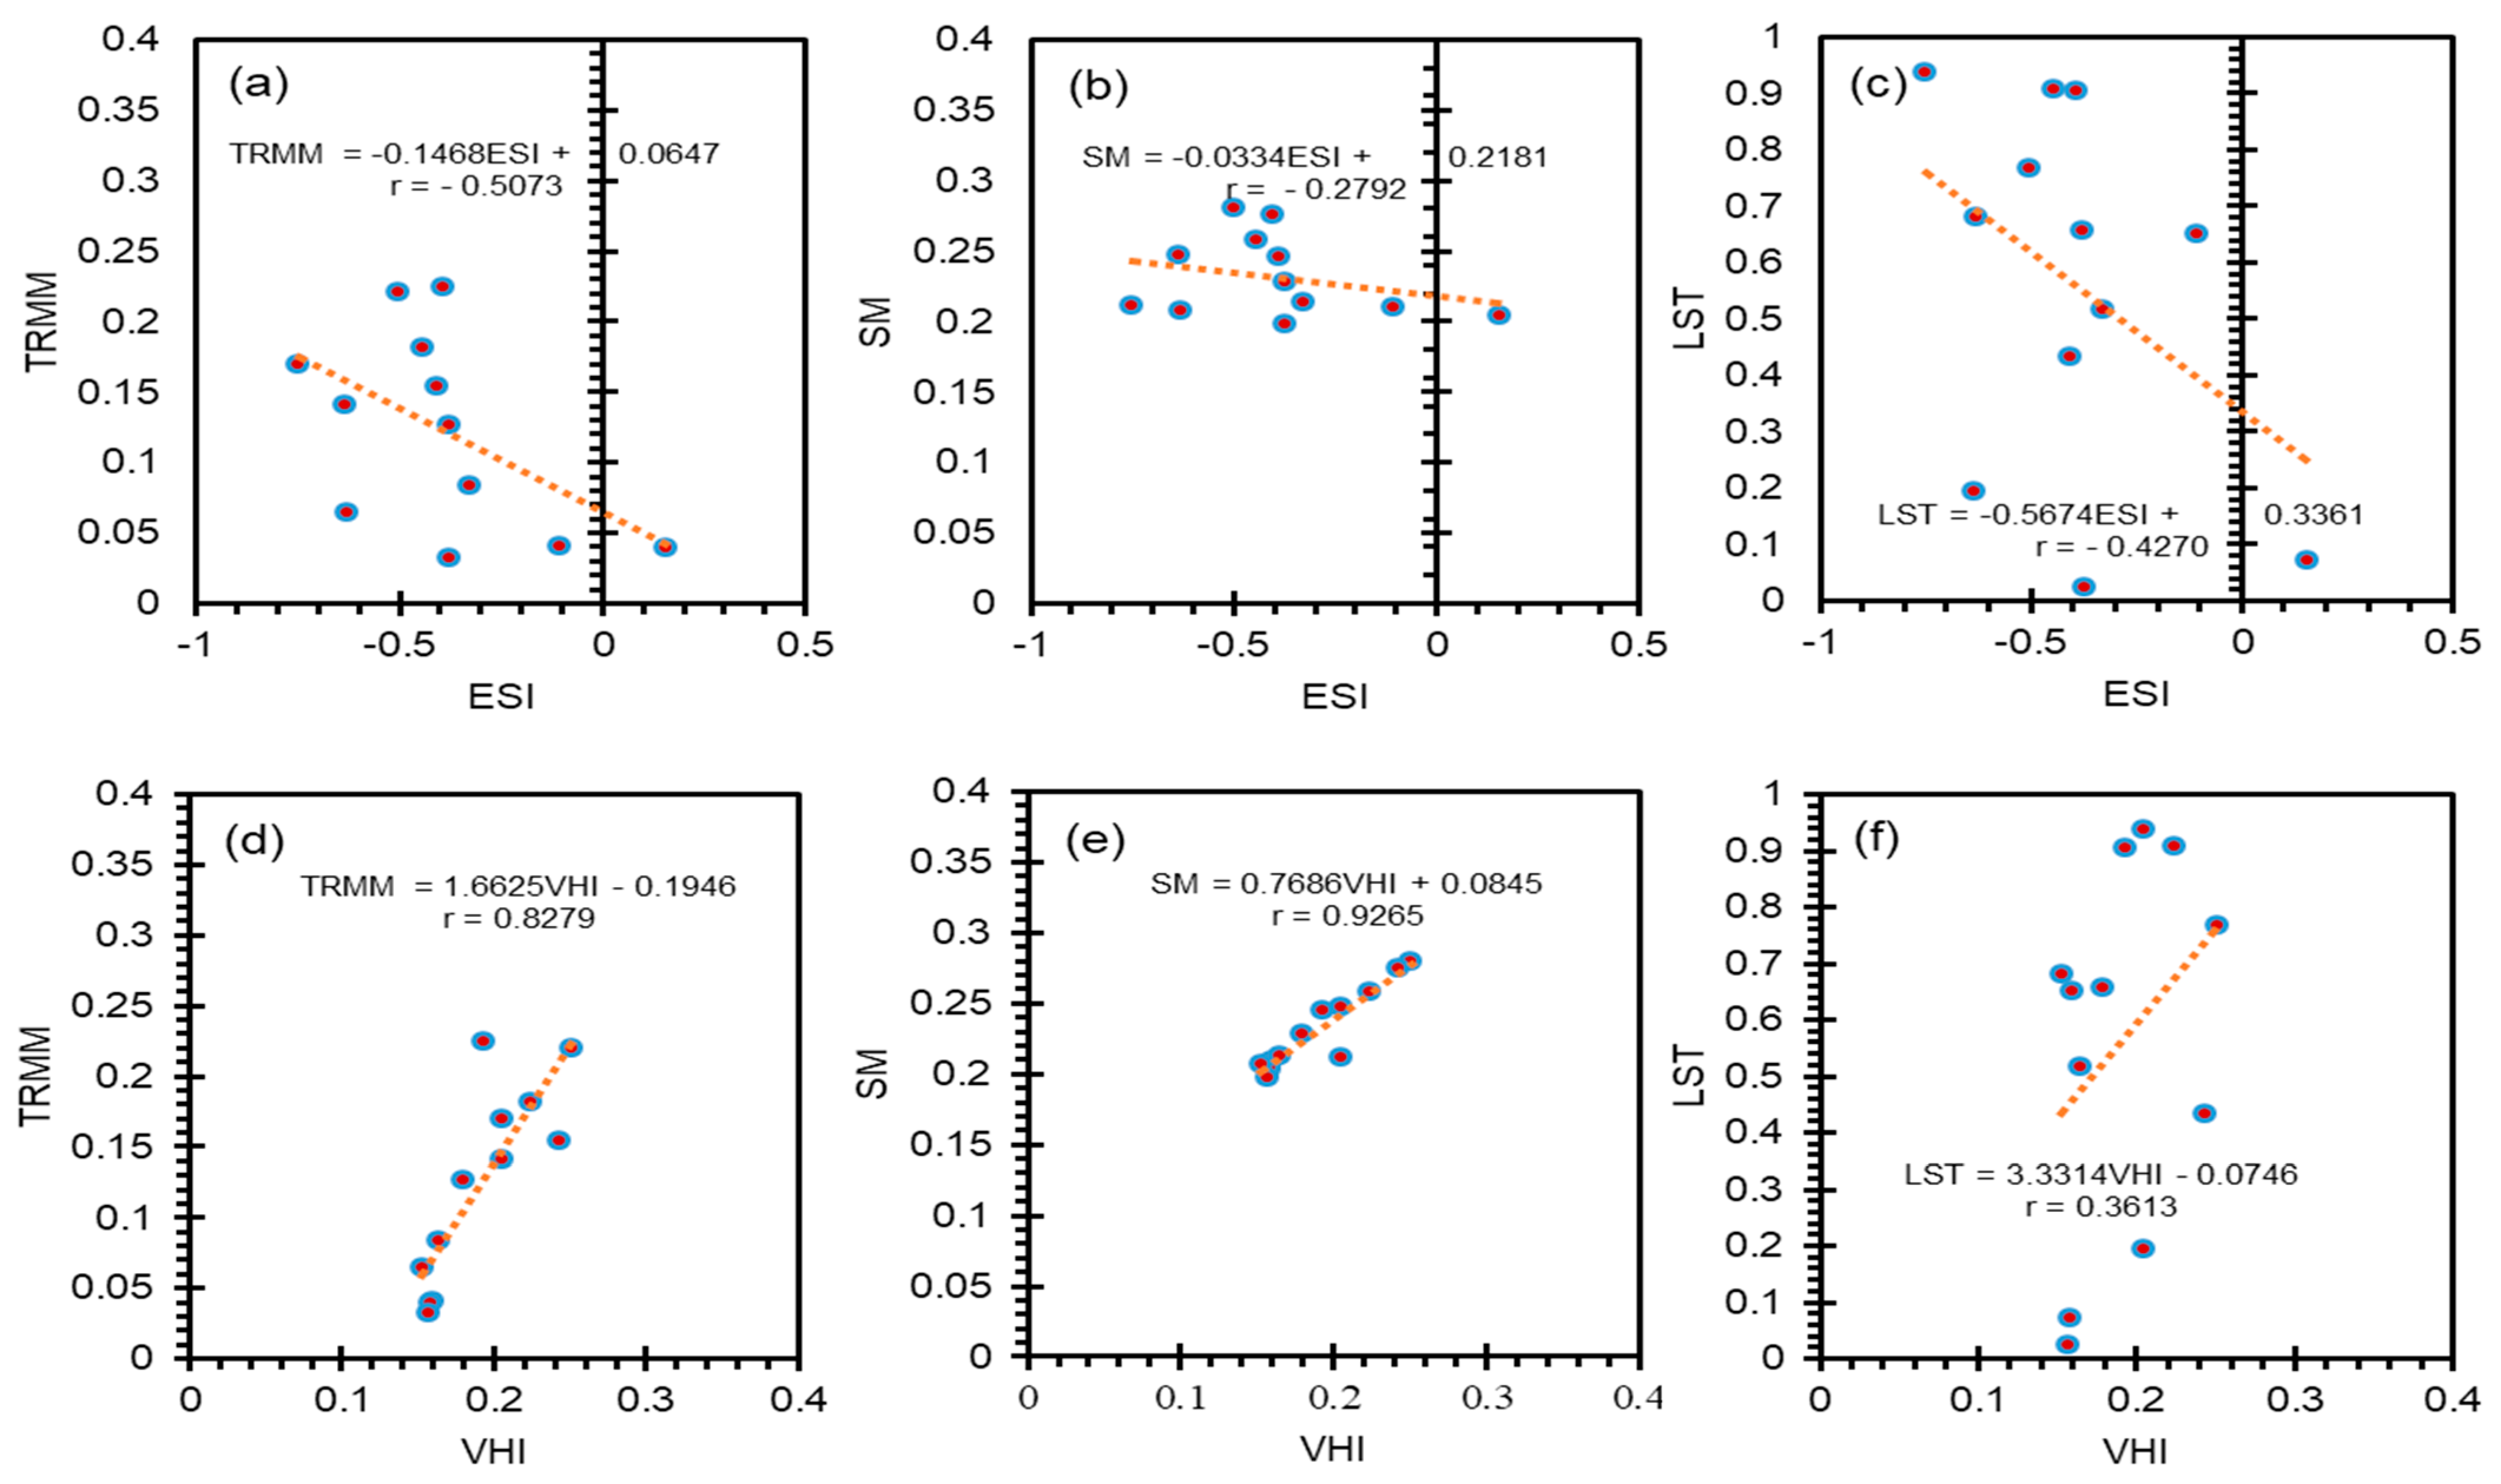
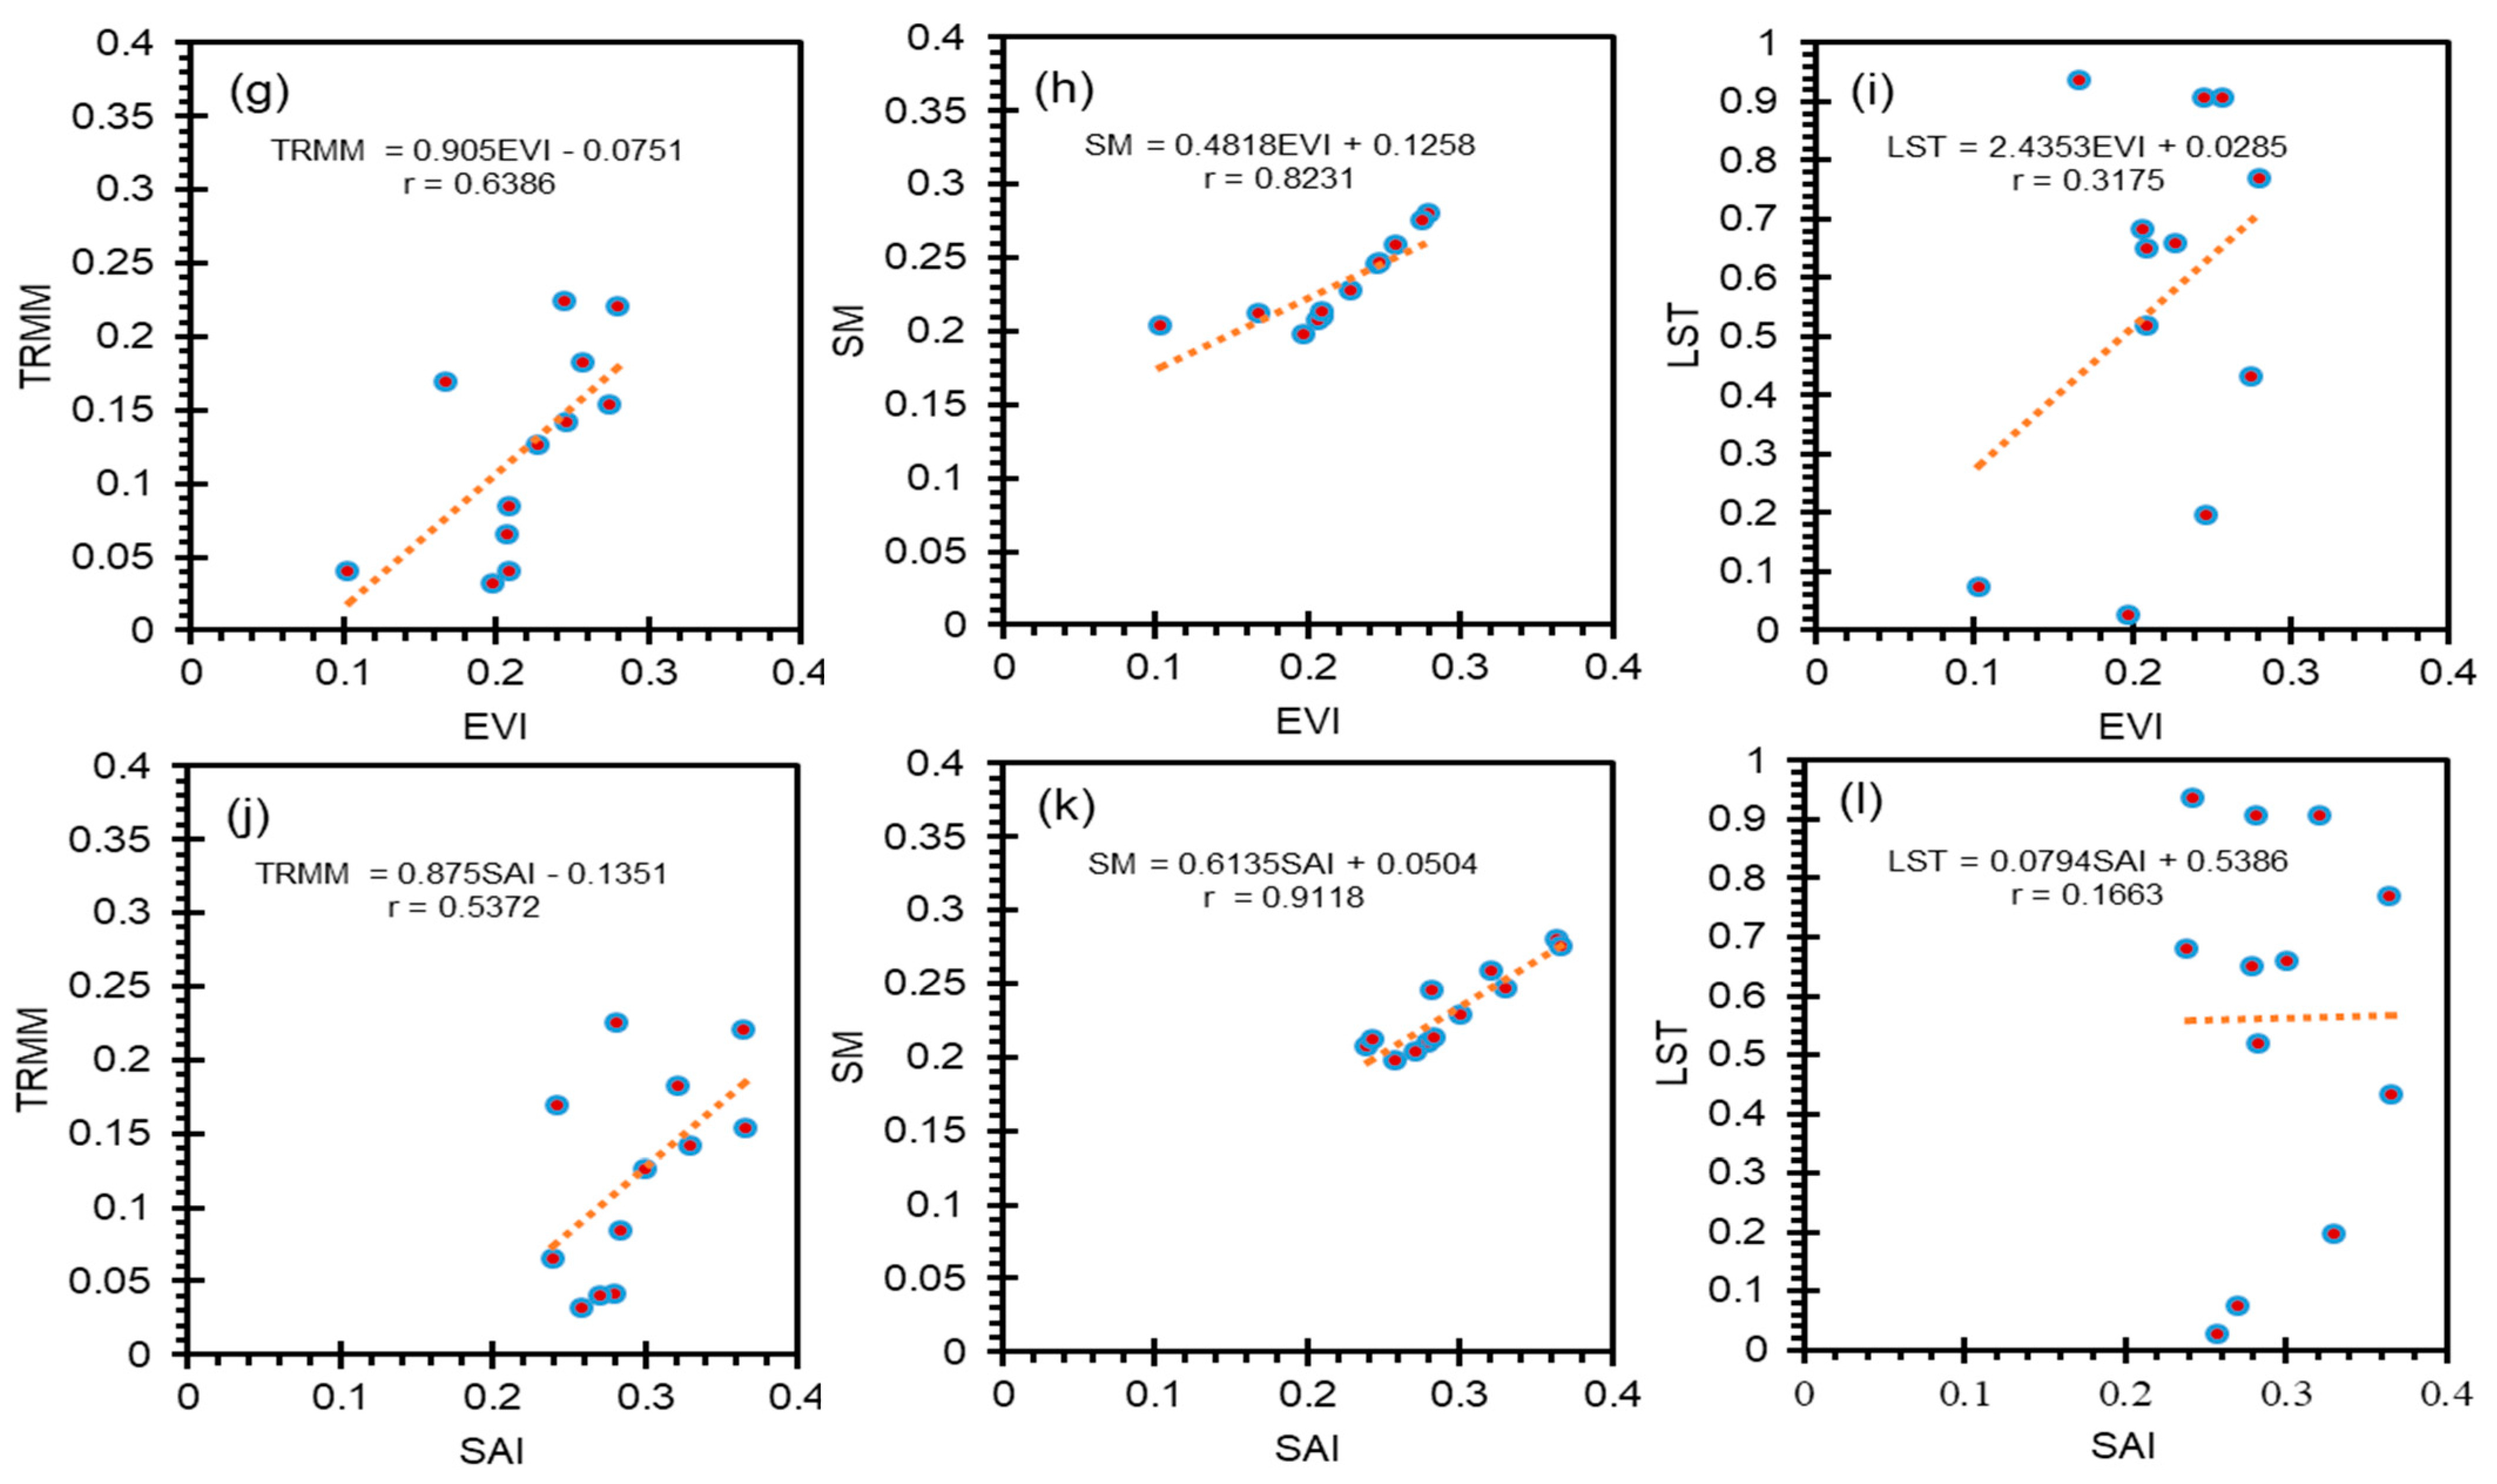
3.6. Relationship between Drought Indices and Climate Variables

Among the possible instigating factors of the agricultural drought in 2002 are climate variables (LST, TRMM 3B43, SM), which were sorted by correlation analysis over the study region (all four countries). Thus, all indices focused on climate factors, and scattered plots were generated [62,63]. Figure 9 shows the statistical analysis regarding the correlation between the drought indices (ESI, VHI) and climate variables (TRMM 3b43, SM, LST) over the study region. It was observed that the correlation remained negative in the case of an ESI having a coefficient correlation of −0.5073, −0.2792, and −0.4270 for precipitation, soil moisture, and land surface temperature, respectively. The negative correlation indicates an important concern with drought patterns, which might induce declines in the growth of crops, which could be a response to climate stress; moreover, in such regions, water is ultimately the limiting factor for crop growth and crop health throughout the year [63].
The negative values of precipitation and soil moisture are because of high evaporation progression caused by an increase in LST. The ESI well exposed all the climate parameters of concern; amongst them were soil moisture that remained significantly negative, followed by precipitation and LST. According to previous studies, the negative connection between ESI and LST reveals an intensification of temperature by accelerating the evaporation process, which leads to water scarcity; as a result, soil moisture contents are reduced and frequent droughts appear, which prohibits crop growth [64]. It can be perceived that all three factors contributed to the drought pattern. However, soil moisture showed a higher effect than the others did. The possible driver of drought is poor precipitation and the ESI is highly sensitive to evaporation; therefore, it exemplified the deficiency of water in the soil [65]. The negative correlation revealed in this study agrees with the findings of Chuai et al. [66].
The connotation between vegetation indices and climate variables showed a positive correlation. The positive correlation is assumed to be occurring when energy is the defensive factor for vegetation and without water deficiencies [63]. The association between VHI and soil moisture (0.9265) and rainfall (0.8279) specified a significant positive relationship (Figure 10), conferring that higher precipitation indorse higher crop conditions, and lower precipitation causes the diminution of crop condition and promotes drought. However, the relationship between VHI and LST remained frail, having a value of 0.3613. The present findings are well supported with the findings by Nanzad et al. [64], expressing that drought occurs only in those agrarian regions having low precipitation and high temperature.
It can be seen from the positive correlations between the EVI and climate variables (Figure 10), such as with soil moisture (0.8231) and TRMM 3b43 (0.6386), that these are significant indicators for crop growth compared to LST (0.3175). The effect of SM seems more significant as compared to rainfall; however, LST indicates a weak or non-significant effect. According to an investigation by Chuai et al. [66], mostly the regions with sufficient SM show higher crop conditions, even increased temperature has a positive effect; this is because a much warmer environment provides enough heat for better crop growth. Whereas, due to uneven rainfall and restricted soil water contents, coupled with increased LST, droughts are formed, which affects crops. These conclusions could be compared with the study led by Asoka et al. [60], showing that greening in agricultural regions is highly attributed to irrigation practices while low irrigation promotes drought. The SAI association (Figure 10) was lower for all three parameters and the peak signal occurred only for SM (0.6118); however, a fragile bond was perceived for precipitation and LST, having a coefficient of correlation of 0.5372 and 0.1663, respectively. Ali et al. reported similar consequences over the South Asian region using different tactics of NPA and TCI [4]. These investigations could be more strengthened from the valuable inputs of Li et al. [67], which confirmed that moisture deficiency enhanced drought, and a responsible factor for yield loss, mostly in rain-fed farming systems of South Asia.

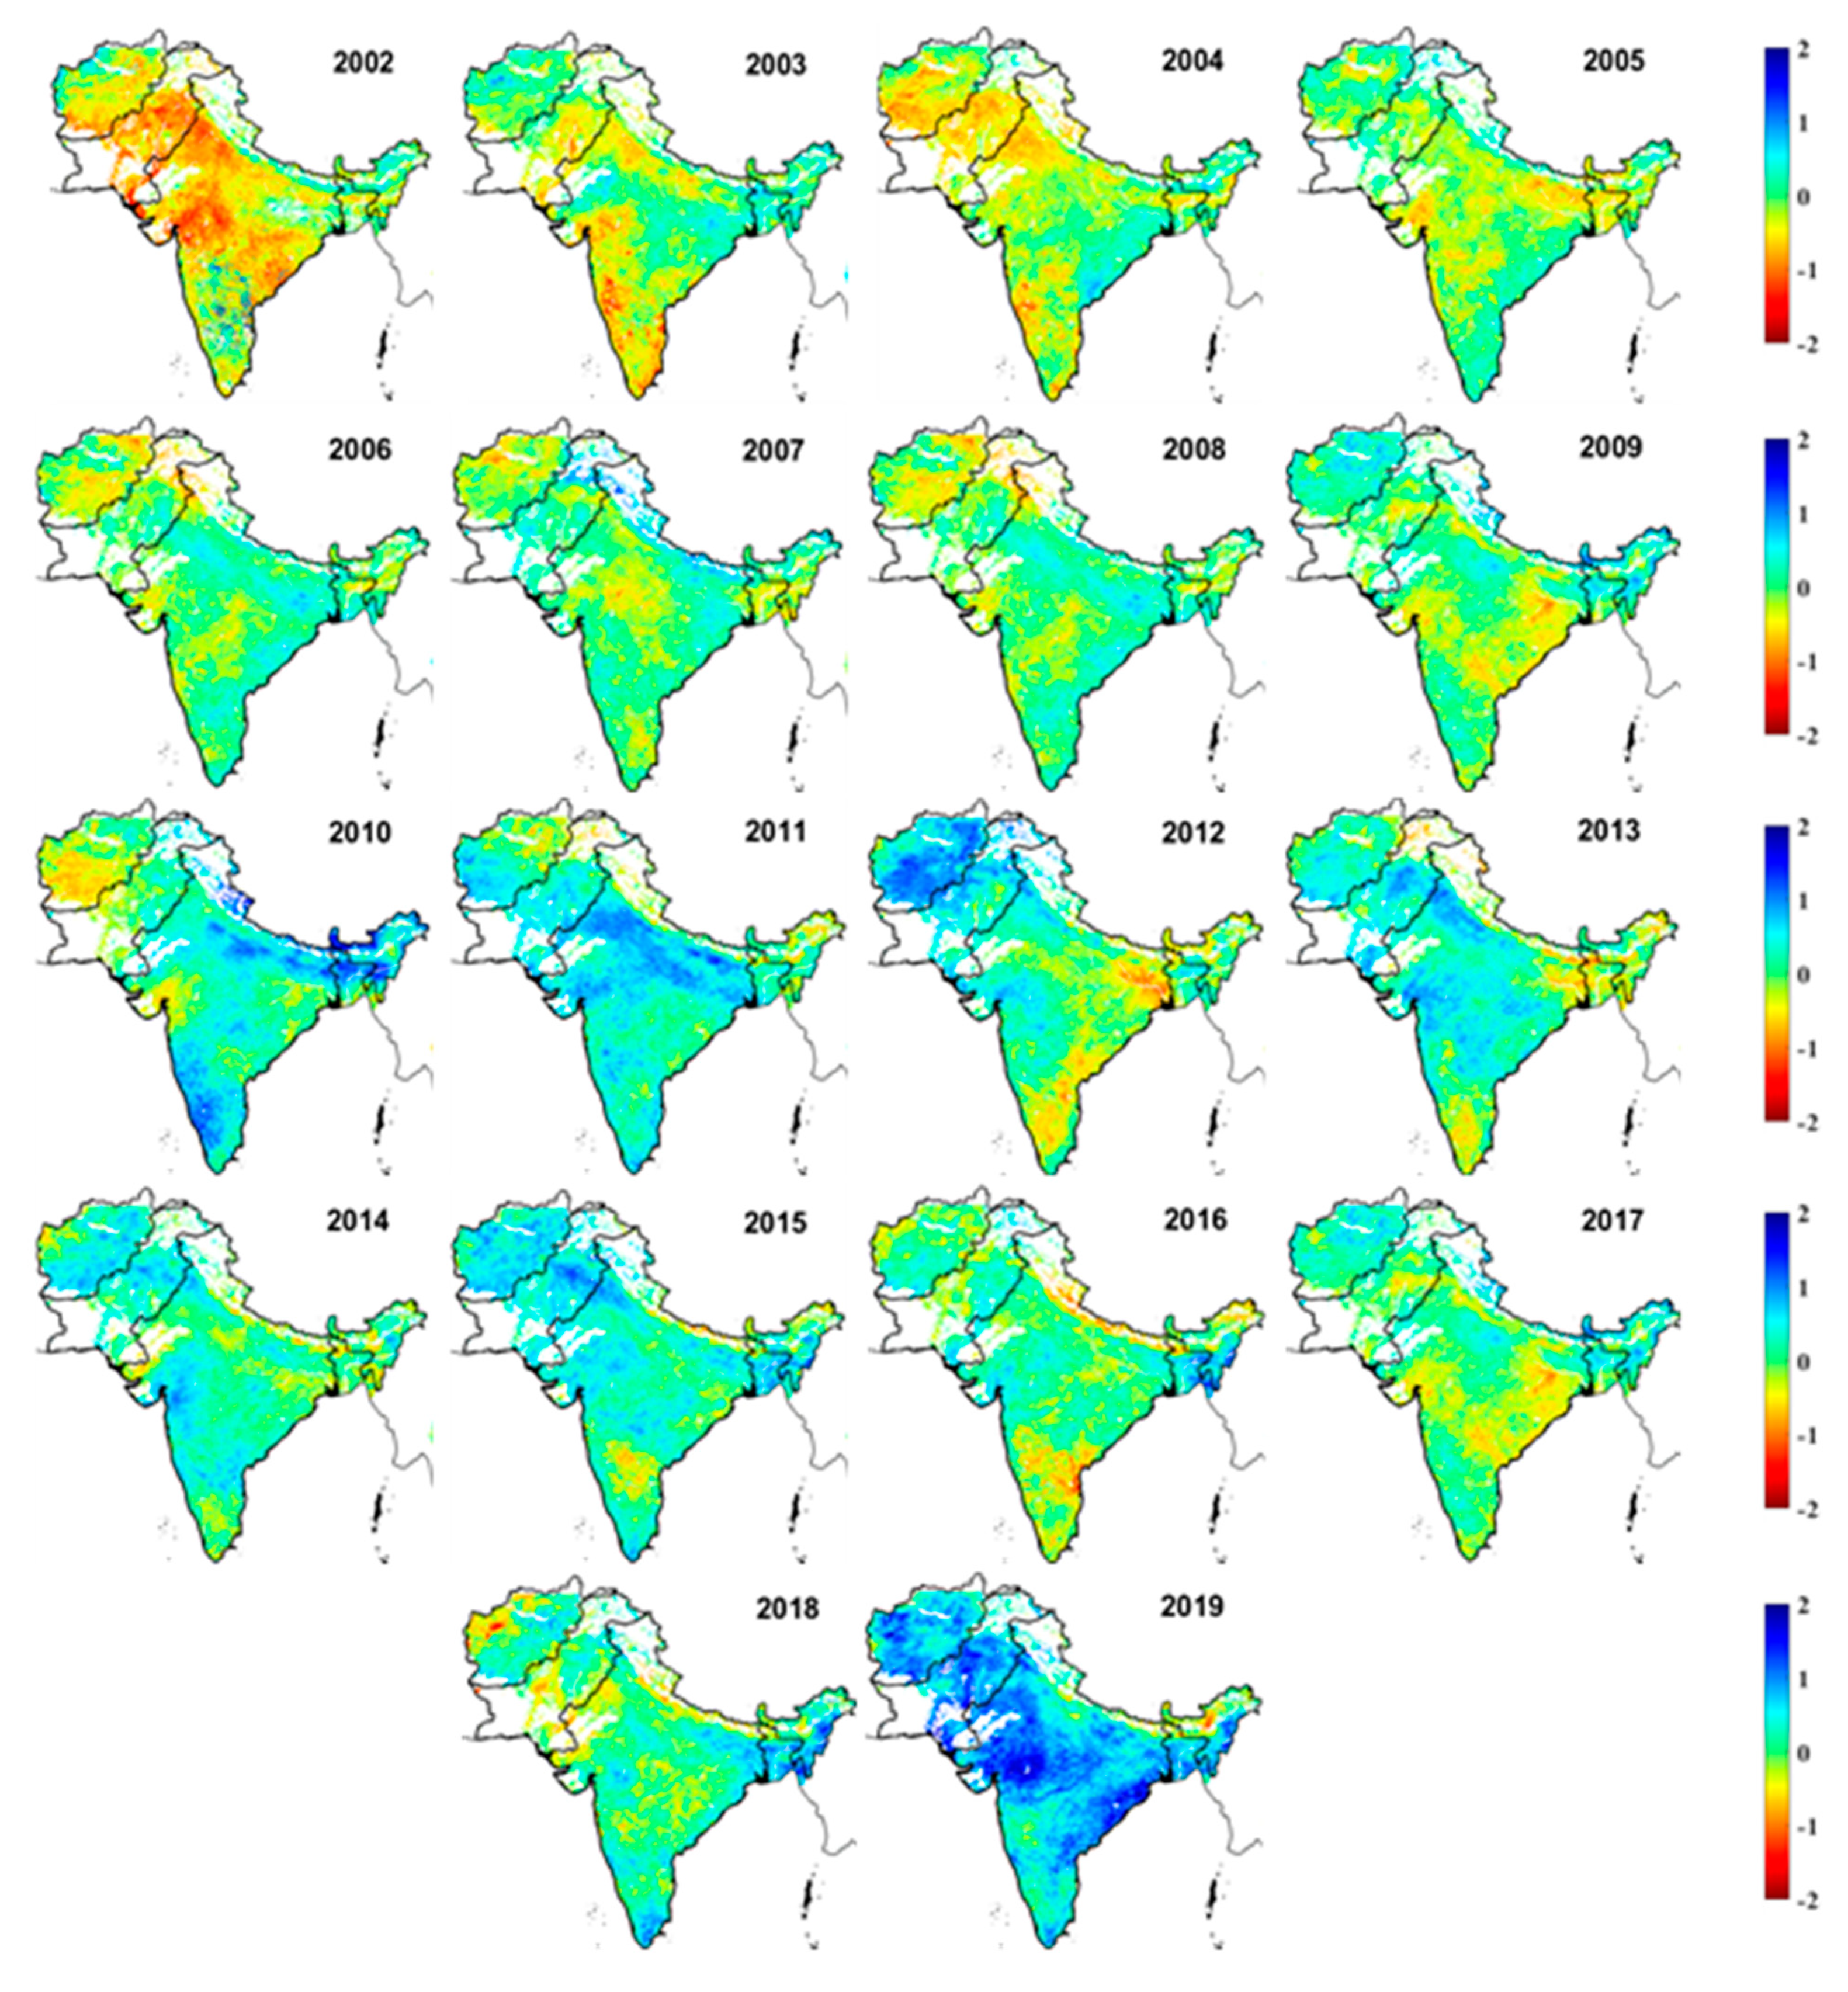
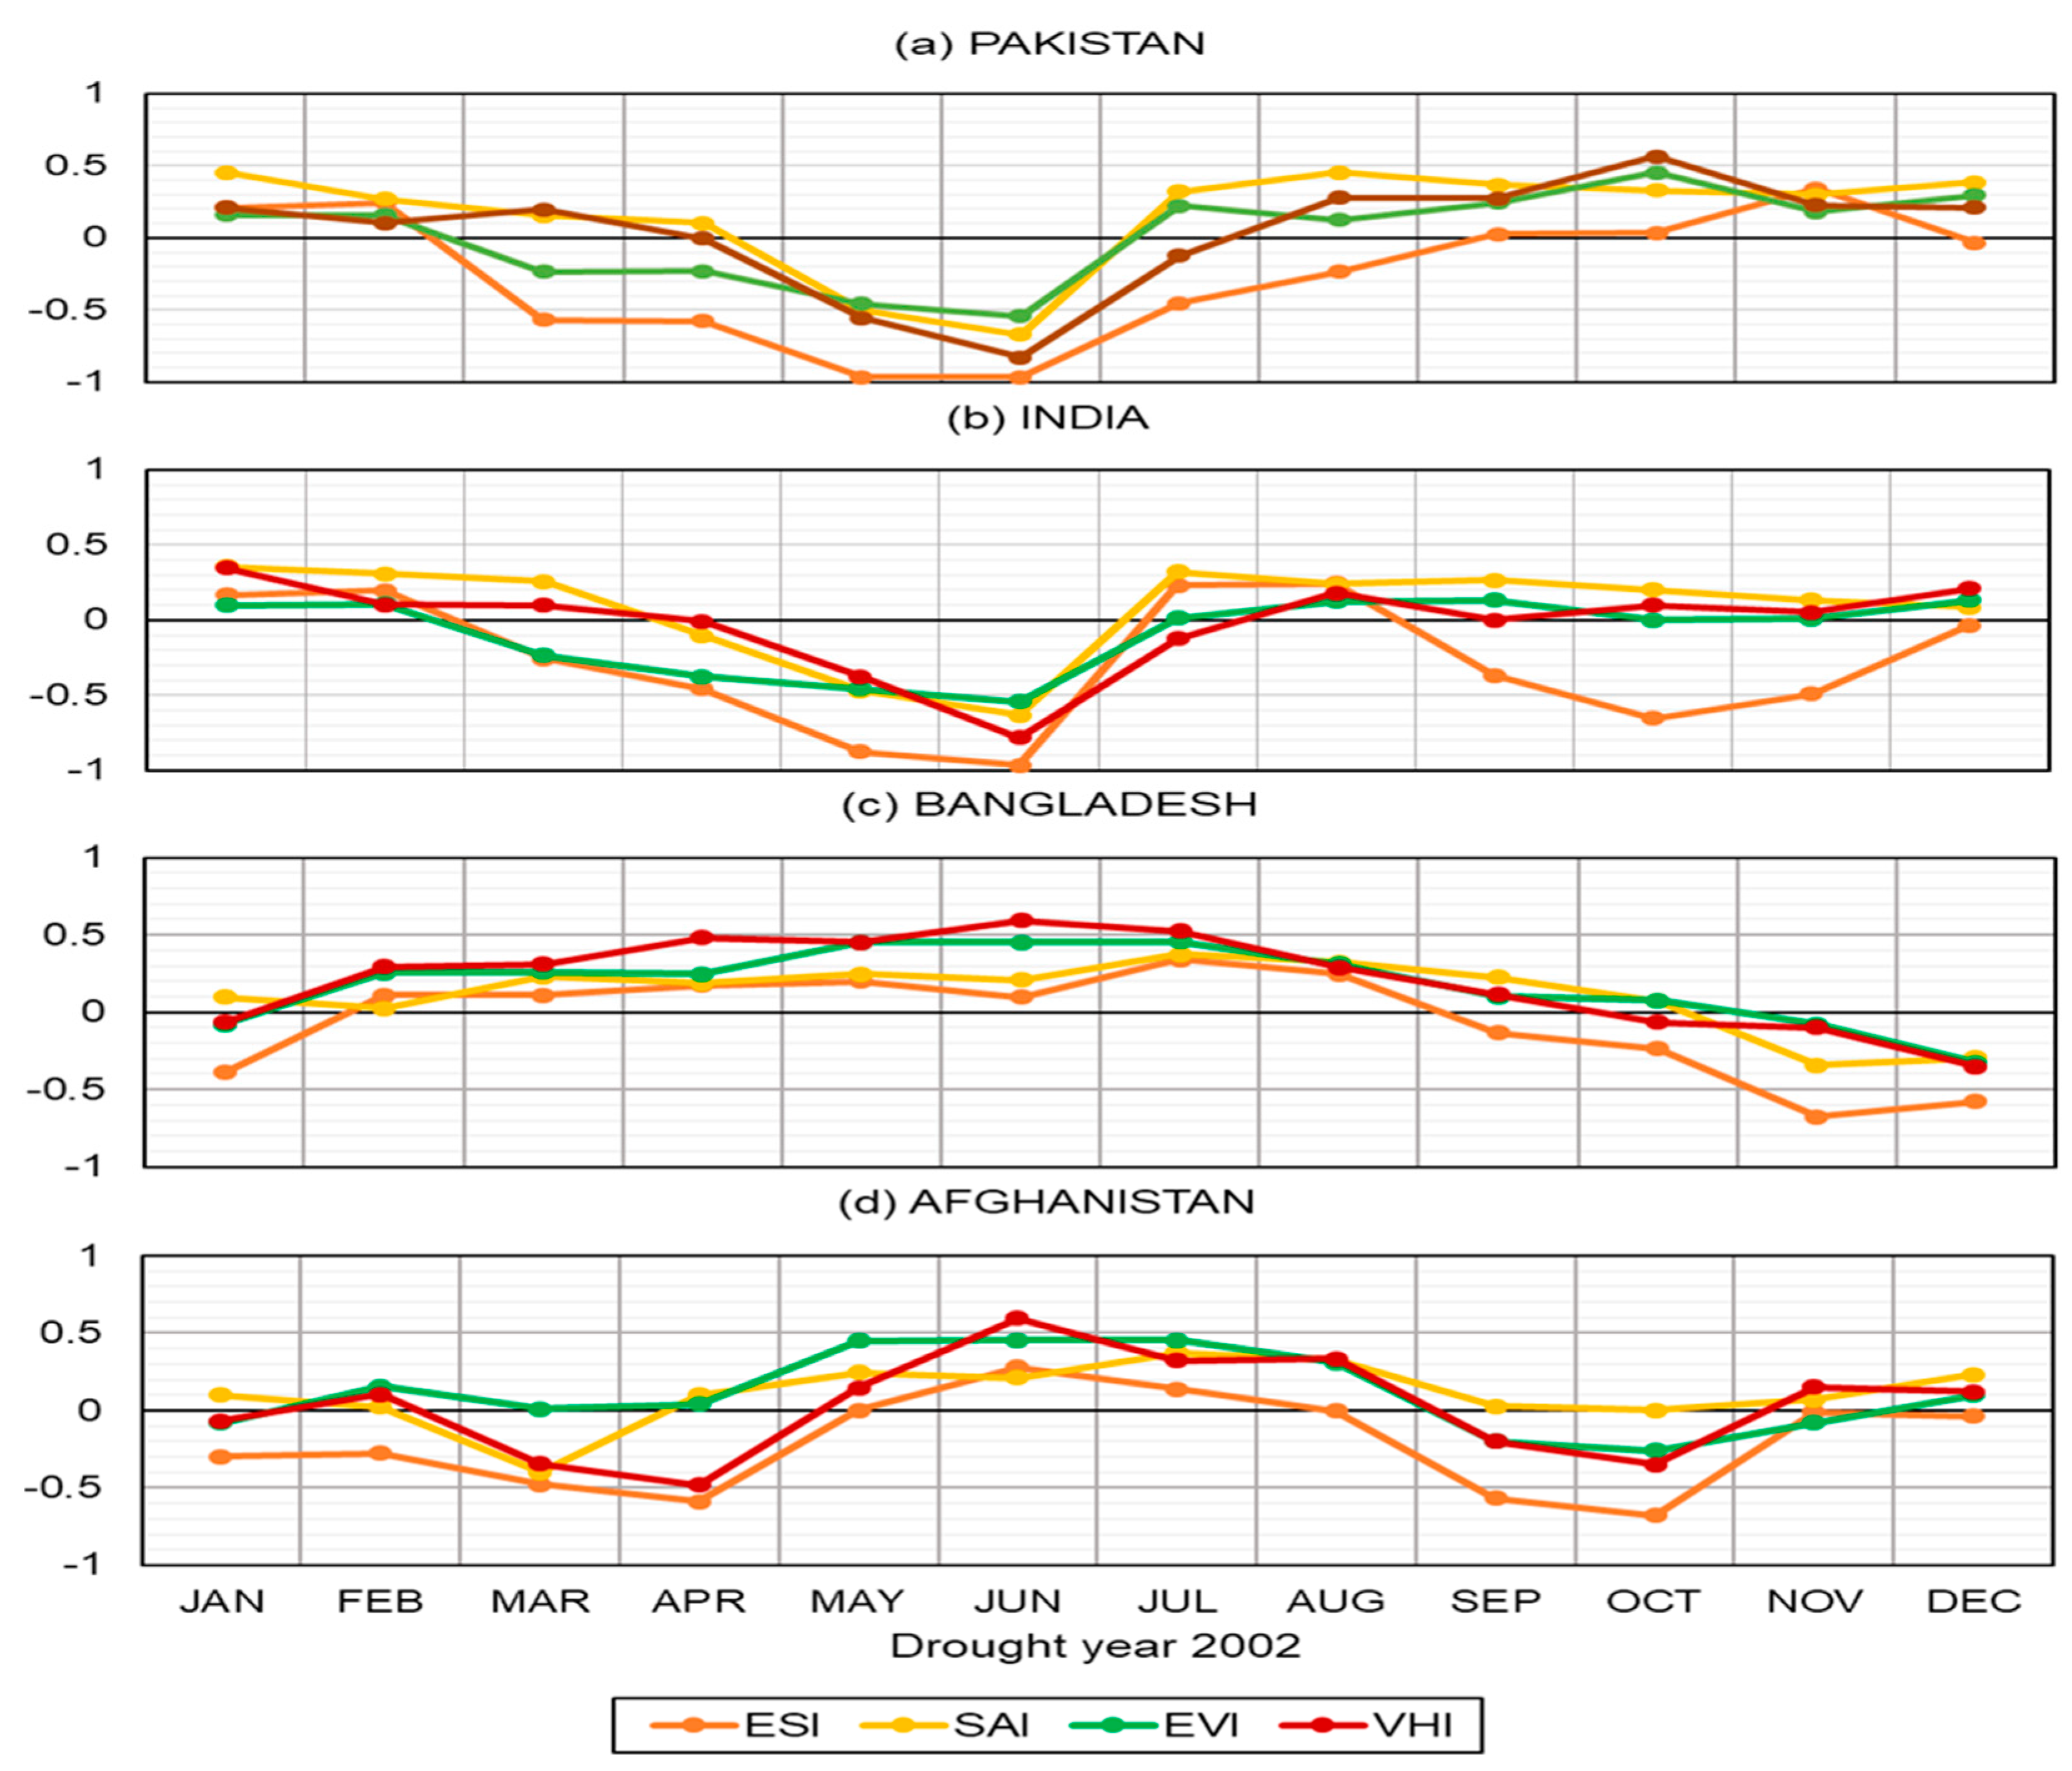
3.7. Temporal Distribution of Drought

Figure 11 elucidates temporal variations in the monthly drought distribution patterns determined by the drought indices (ESI, SAI, EVI, and VHI) during 2002, the drought year. The temporal disparities in monthly drought occurrence identified by the drought indices were divergent in all countries. The drought length obtained using ESI is different from the drought length specified by SAI, EVI, and VHI. The ESI values stayed between −0.3 and −0.9 from March to August (6 months) in Pakistan, while from March to June and September to November (7 months) in India. However, in Bangladesh, it was sustained between −0.3 and −0.7 from November to January (3 months).
Similarly, in Afghanistan, the ESI values remained below −0.3 and −0.7 from January to April and September to October (6 months). The drought duration determined by VHI (May to July) is 3 months shorter than the ESI drought estimation in Pakistan and 4 months shorter than in India. VHI values for Pakistan and India remained between −0.2 and −0.6. In the case of Bangladesh, the VHI drought duration is one month shorter than the ESI drought estimation. The months November and December can be observed as having values between −0.1 and −0.3, respectively, which indicate slight drought. However, in Afghanistan, VHI drought estimation is 2 months shorter than the ESI. The peak values range from −0.1 to −0.5 during March and April and September and October. Similarly, the duration of drought defined by the EVI and SAI indices was less compared to the ESI. The temporal drought distribution was 2 months shorter in Pakistan, 3 months in India, 1 month in Bangladesh, and 3 months in Afghanistan, compared to the ESI drought duration. The curve hit the value −0.5 during May and June in Pakistan and India only. However, it remained between −0.1 and −0.3 from November to December and September to November in Bangladesh and Afghanistan, respectively. The SAI exposed the shortest drought duration compared to all other indices. The peak value −0.6 was seen only for Pakistan and India during June followed by Afghanistan with a −0.6 index value during March only. As a whole, the SAI, EVI, and VHI demonstrated a shorter temporal drought distribution compared to the ESI.

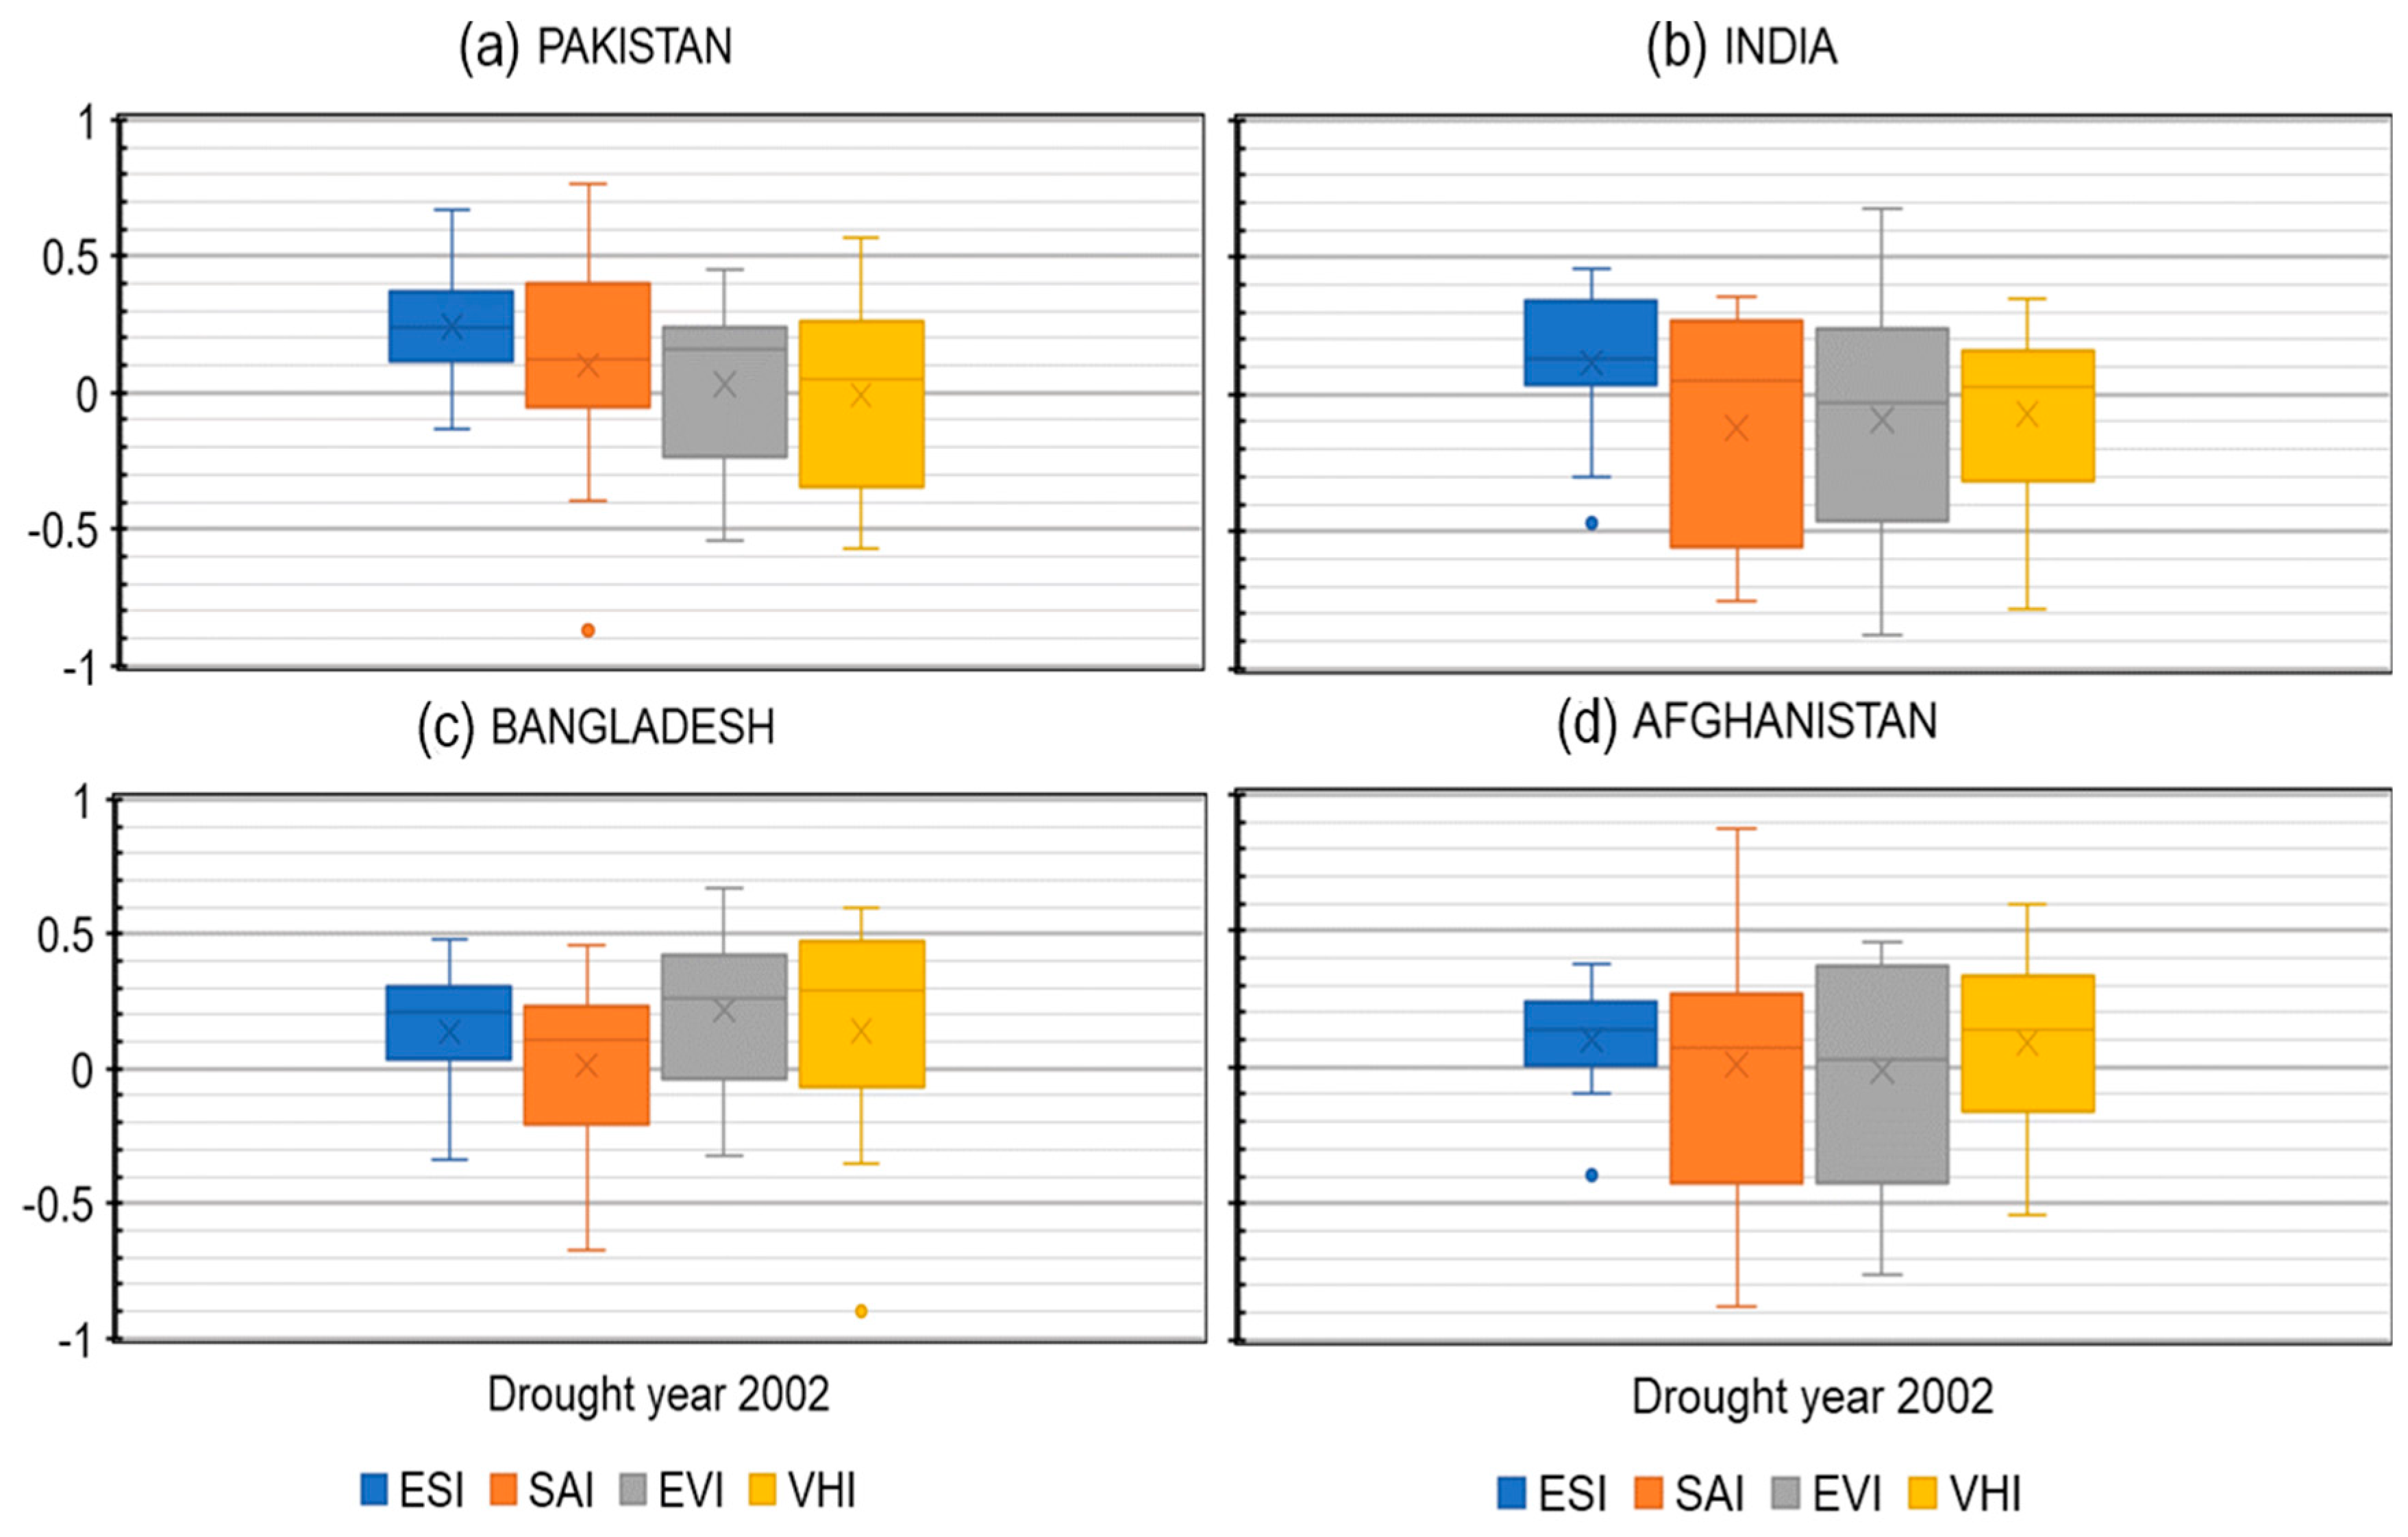
3.8. Estimation of Agricultural Drought Severity by Drought Indices Using Boxplots

Figure 12 shows the range of agricultural drought severity (occurrence) over SA during the drought year 2002 based on the remote sensing drought indices’ (ESI, SAI, EVI, and VHI) data estimation. The upper and lower lines of the box plot indicate the 25th and 75th quartiles of the drought index; however, a horizontal line within the box represents the median. The cross sign in the box indicates the mean values. The deviation between the data distribution regarding the drought indices were observed in the range from − 1 to 1. The results suggest that the drought indices are progressively showing ups and downs in their median values. Probably, this is because of the limitation of the upper and lower whisker of the box plot [68]. From Figure 12, it can be perceived that the divergences in the median values of the boxes are highly variable for all indices over the study region. In the case of ESI, the interquartile range (IQR) or box sizes are smaller in all countries compared to the other indices. This confirms that data is consistent and mostly distributed near the median line [69], even a symmetric distribution in Pakistan and Afghanistan. However, slightly positive and slightly negative skewness were observed in India and Bangladesh, respectively. Furthermore, the upper and lower whiskers of the ESI also indicate data distribution towards the median compared to the other indices. On the other hand, the three indices (SAI, EVI, and VHI) in all countries showed dispersed data that are negatively skewed, indicating less consistency in the data distribution. Negatively skewed data may lead to misleading results [70]. The data distribution near the median is considered more consistent [69]. Thus, the ESI has a better tendency to indicate drought severity.

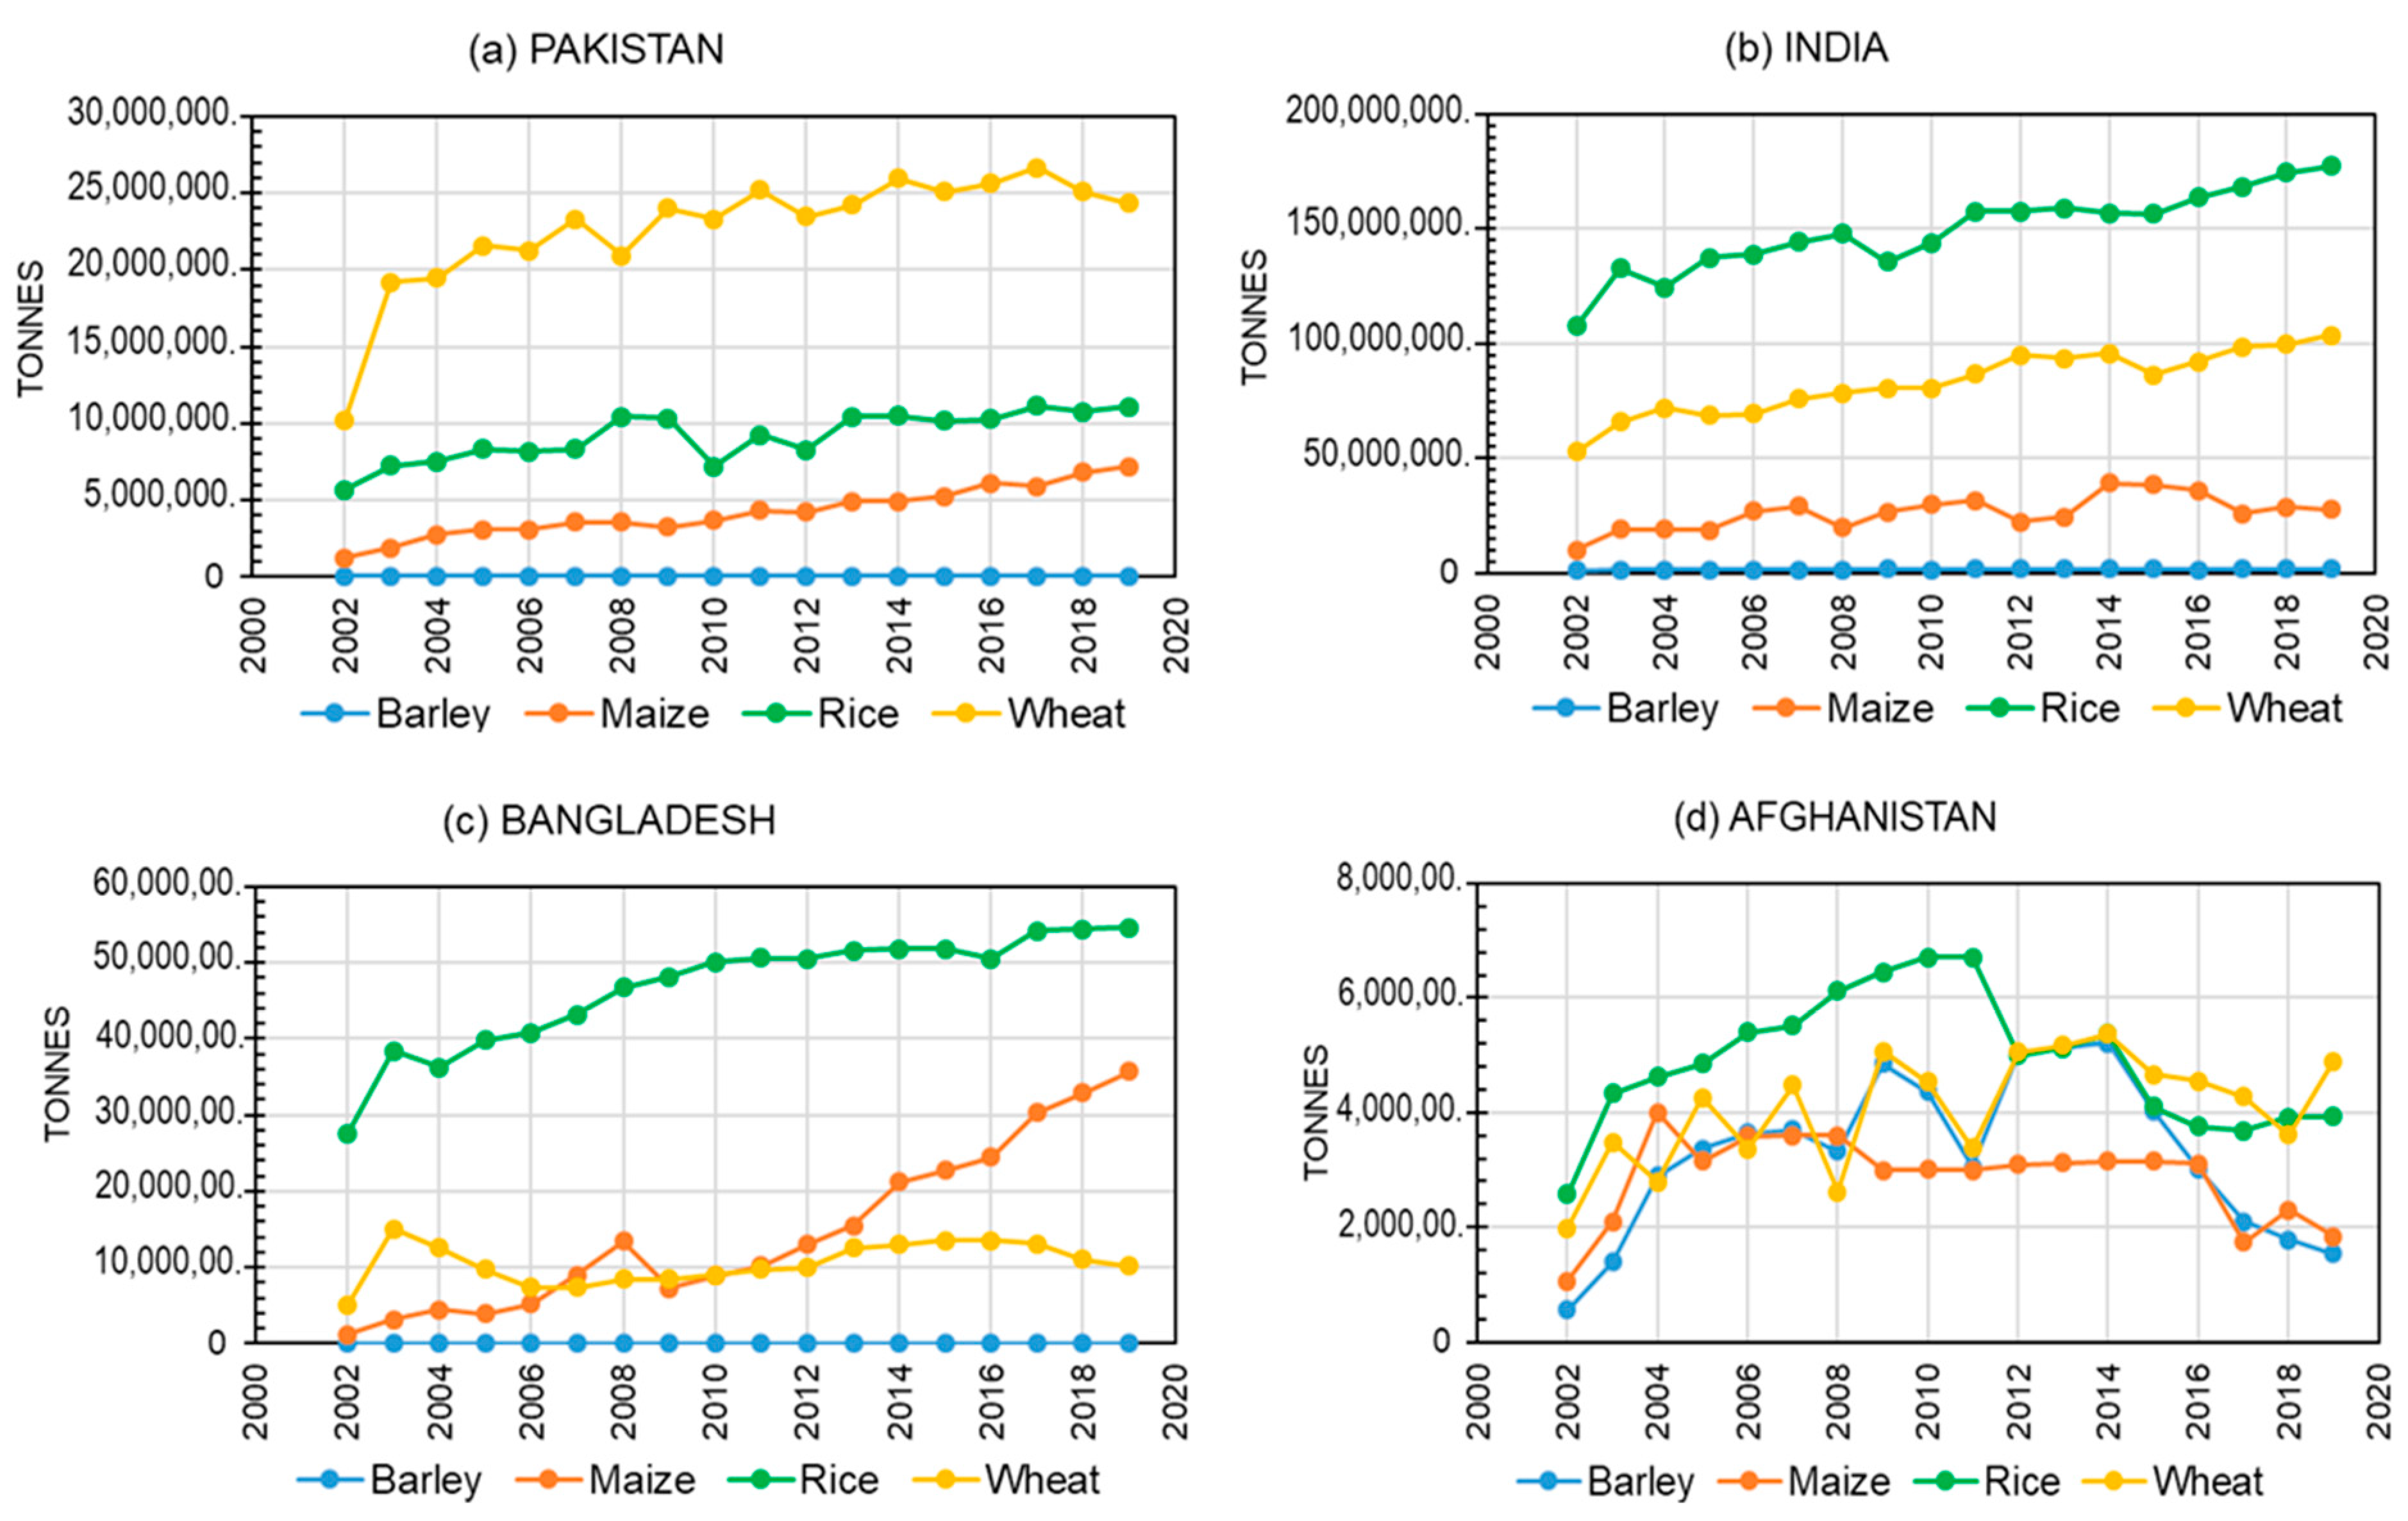
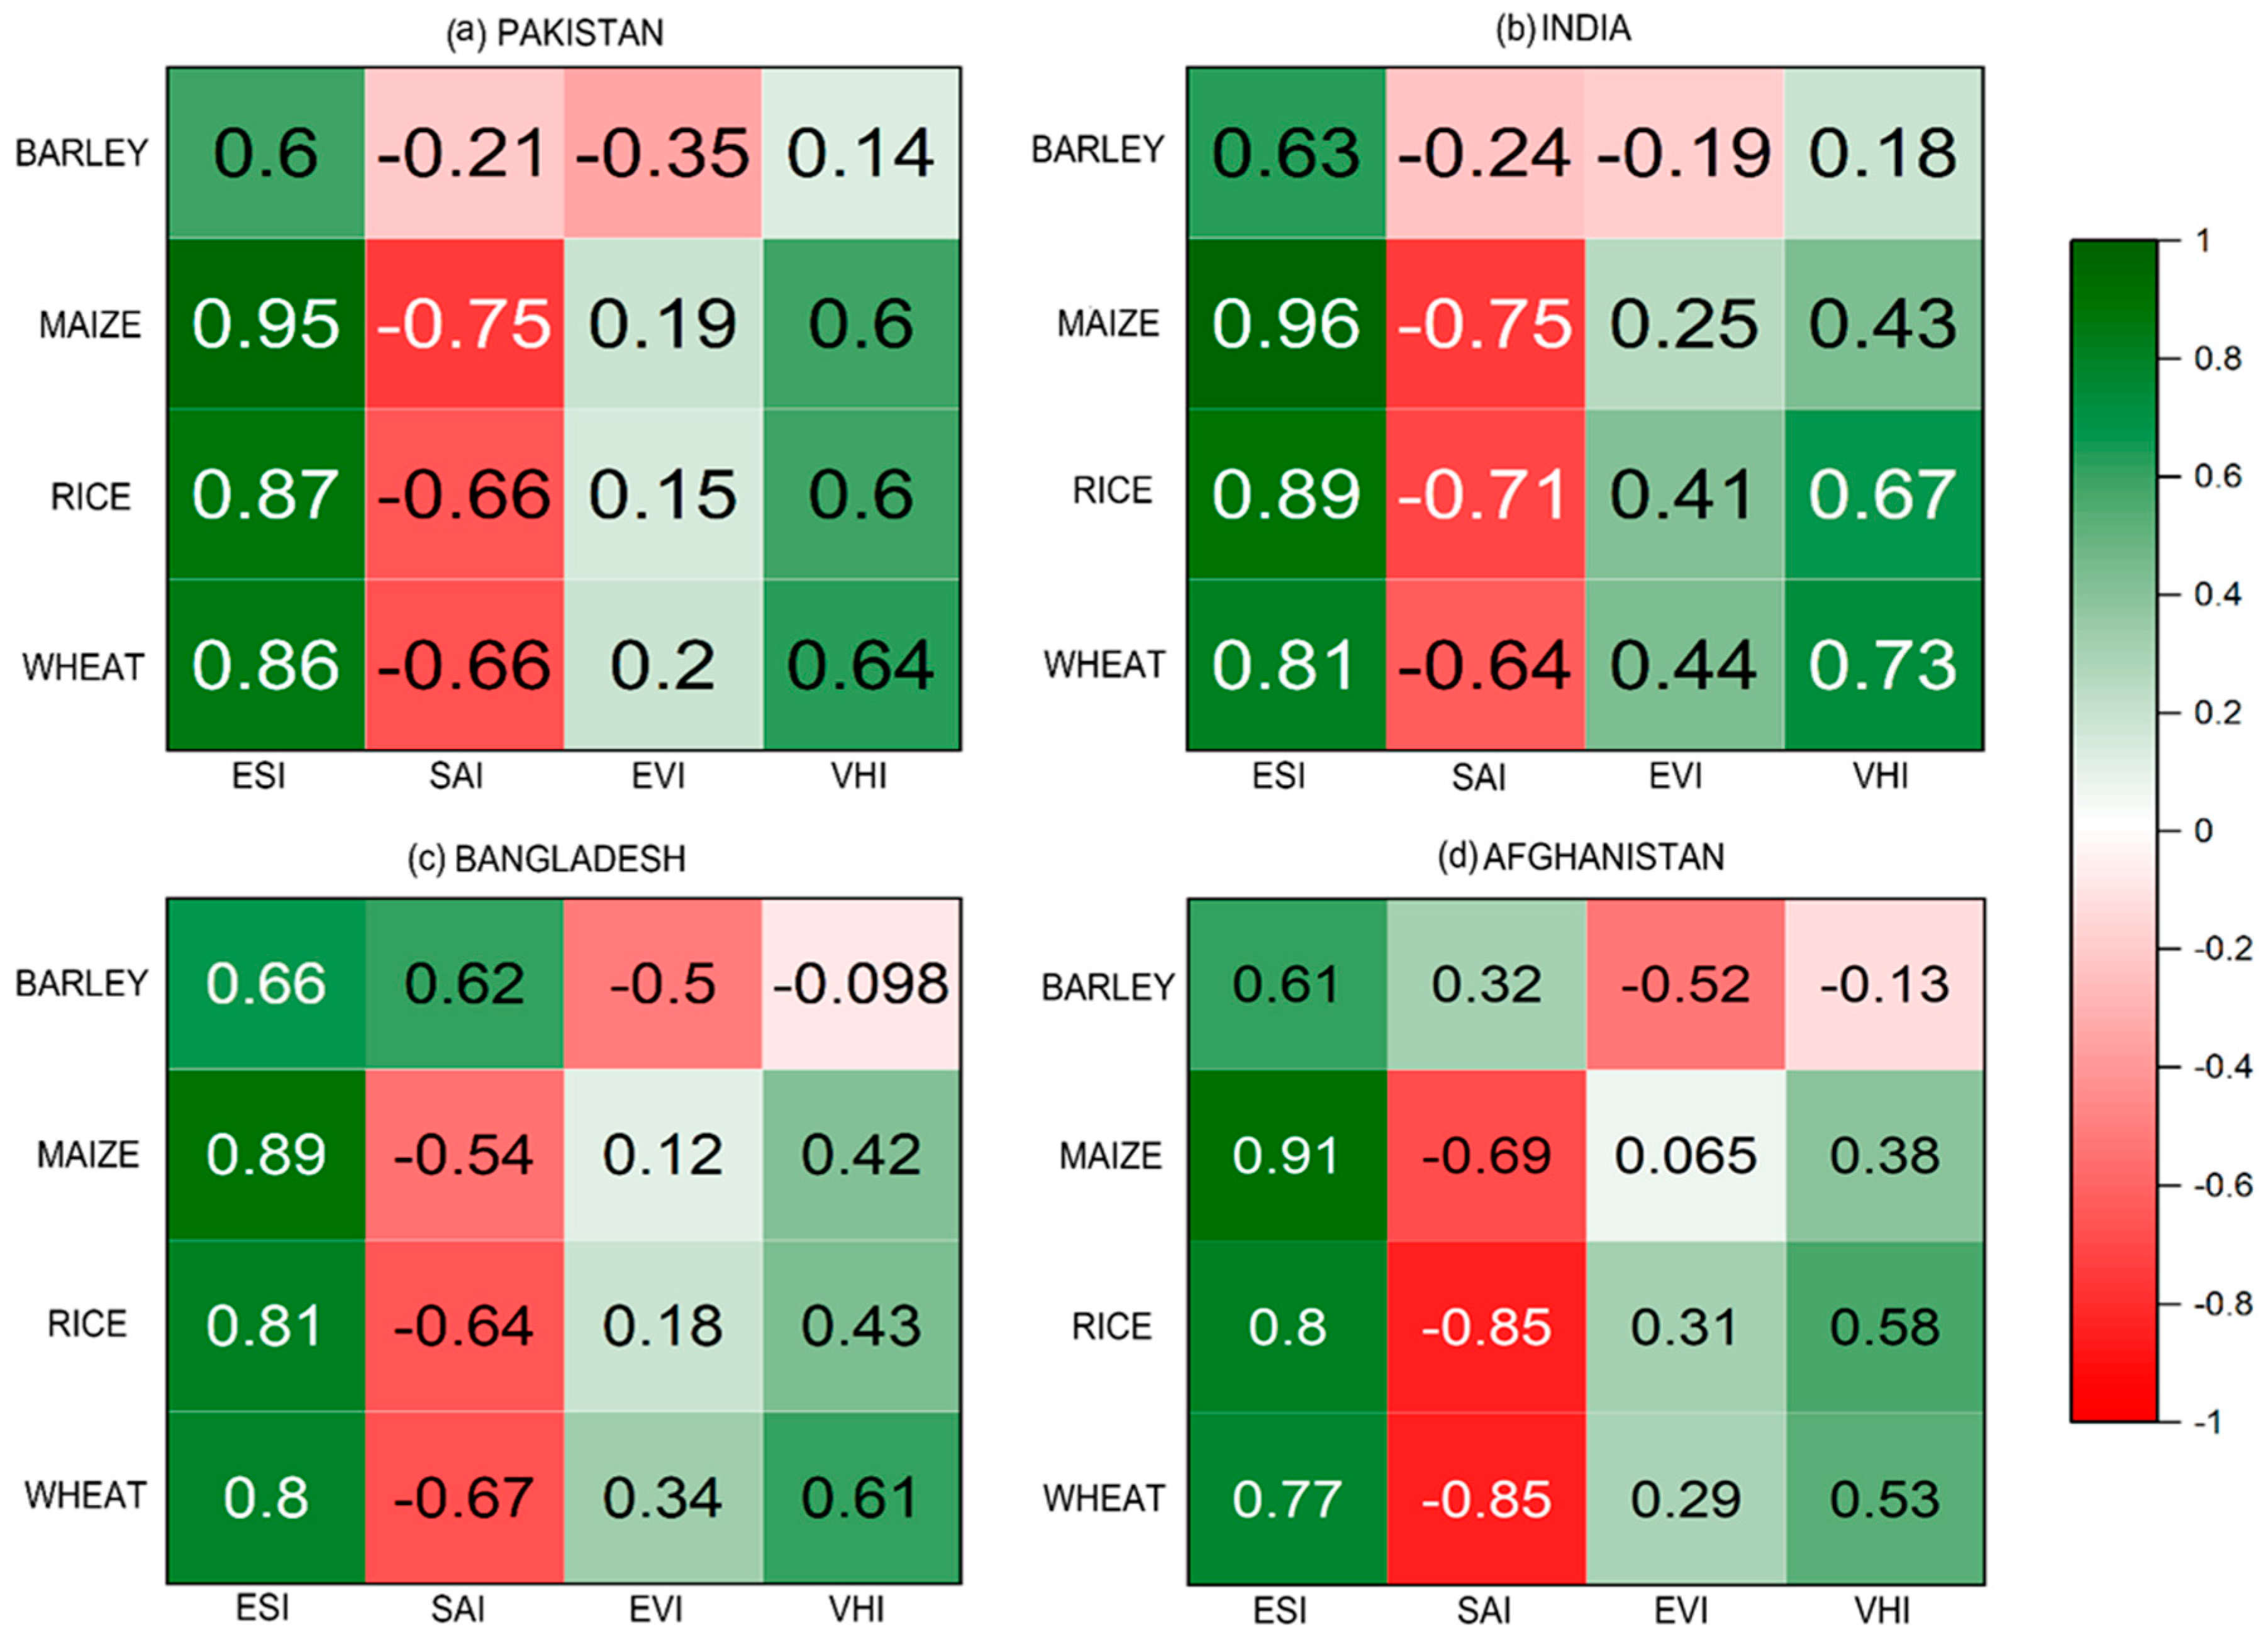
3.9. Temporal Crop Variability and Relationship between the Yield Anomaly Index and Drought Indices

Figure 13 shows a comparison of crop production for the common period of 2002–2019. All crops showed variability in crop production. During the first decade of intensive agriculture, beginning from 2002–2011, the crop production (barley, maize, rice, and wheat) increased in countries, whereas a low production rate was seen during the year 2002 for all crops in all countries. The long-term crop yield remained significantly above in all years; however, because of the drought strengthening, less soil moisture contents, and soil fertility [69], the yield level dropped in the year 2002. During the second half of the study period, crop yield was seen moving from the bottom, indicating a decrease in Afghanistan only, while the other three countries demonstrated better yield. Overall, wheat and rice yield indicated a higher rate compared to maize and barley. Figure 14 specifies a correlation matrix between the yield anomaly index (YAI) and drought indices (ESI, SAI, EVI, and VHI) during the drought year 2002. The connotations varied substantially amongst all indices in all countries. The ESI association towards YAI was much higher; however, weak or poor relationships were seen for the other three indices. In all cases (Pakistan, India, Bangladesh, and Afghanistan), the vegetation-based SAI, EVI, and VHI drought indices remained nonsignificant (p < 0.05), but the correlations for ESI were observed to be significant. The strongest correlation of the ESI was found for all crops except barley over the study region. The ESI correlation values for the crops wheat, rice, and maize, respectively, were 0.86, 0.87, and 0.95 found in Pakistan; 0.81, 0.89 and 0.86 in India; 0.80, 0.81, and 0.89 in Bangladesh; and 0.77, 0.80, and 0.91 in Afghanistan. Conversely, a moderate correlation of 0.60 and 0.63 was seen for barley, in both Pakistan and India. Similarly, 0.66 and 0.61 in Bangladesh and Afghanistan. In the case of VHI, no significant correlation was found with YAI in all countries, excluding India, where the highest correlation of 0.73 was seen for wheat and 0.67 for rice only. The EVI remained nonsignificant, while the SAI indicated a negative correlation with YAI over the study region. Based on the aforementioned output, the ESI specified a good association with crop production compared to the other indices.
The study led by Peña-Gallardo et al. [71] supports our findings positively and are in line with the results of the correlation matrix between the drought indices and crop yield data.
The statistical analysis supported our spatial output, indicating that the vegetation indices (VHI, EVI, and SAI) are less receptive to agricultural drought as compared to the ESI. The reason could be that vegetation-based drought indices show a deliberate retort; this is because of a lagging surface or canopy temperature, which responds sharply in case of any crop stress [21].

4. Conclusions

The existing study examined agricultural drought and its development patterns over four major countries of South Asia. The year 2002 underwent a severe agricultural drought year with a low ESI value of −3.365, the lowest amongst all the years from 2002–2019. Hence, agricultural drought and its development patterns based on ESI, VHI, EVI, and SAI outputs and their relationship with climate variables (LST, TRMM, and SM) and field measurements (crop yield data) were determined widely during the severe drought year (2002). Remote sensing data were used to enhance the limits of the ground-based drought indices, which are traditionally used to evaluate drought. The ESI was observed with regard to usability amongst the other indices. In the case of ESI, higher drought patterns were seen for all countries. Drought-affected and non-drought areas were well highlighted. The vegetation indices also indicated drought generally. However, overall drought observations were recorded poorly. Statistical analysis regarding the temporal distribution of drought, the correlation matrix between the drought indices and yield anomaly index (YAI), the correlation with climate variables, and range of drought severity employing box plots reflected that the ESI has a good agreement with drought development patterns compared to the vegetation indices in the study region. Normally, dissimilar drought patterns were observed in each country. The drought started to develop in March (pre-monsoon) over Pakistan, which turned to severe during May and lasted until August. However, in the case of India, March to June and September to November, drought was seen mostly in the northwestern and southwestern regions. In Bangladesh, from November to January, severe drought was identified in the northeastern and western regions. Two spells of drought were over Afghanistan from January to April and September to October, covering the northwestern and southeastern zones. The longest drought period of seven months was noted in India followed by Pakistan and Afghanistan with six months of severe drought. The shortest drought period of only three months was observed in Bangladesh. Based on descriptive statistics, adequate soil moisture showed a significant effect on vegetation growth, and conversely, inadequate soil moisture was a frequent cause of the drought pattern during the year 2002.
This study will attract positively the attention of young researchers in the field of agriculture, as well as policymakers, for sustainable solutions, providing comprehensive information regarding the drought-stressed areas in each country. Furthermore, this study will provide a new platform in the future, to enhance ESI-based investigations on different aspects over South Asia. To advance the identification and prediction of agricultural drought, a comprehensive examination can be conducted using remotely sensed data from different sources and a diversity of drought indices for the study area.

Author Contributions

M.S. and W.Z. developed the original idea and methodology of this research; B.A.H. helped in the database and analysis; M.B. and F.M. contributed to data correction and interpretation; M.A., I.U., S.I. and R.I. contributed to manuscript writing and editing. All authors have read and agreed to the published version of the manuscript.

Funding

The National Natural Science Foundation of China (grant number 41575070) supported this research work.

Institutional Review Board Statement

Not applicable.

Informed Consent Statement

Not applicable.

Data Availability Statement

Not applicable.

Acknowledgments

The principal author is extremely indebted to all remote sensing data providers and their staff for establishing and upholding the sites used in the current study. The MODIS data can be accessed at https://earthdata.nasa.gov/. However, soil moisture products FLADS (0-10) cm can be accessed at https://disc.gsfc.nasa.gov/ whereas TRMM-3B43 at 0.25°data, ESI 4 week data, and annual crop yield could be obtained at these sites https://pmm.nasa.gov/data-access/downloads/trmm, http://catalogue.servirglobal.net/, and http://www.fao.org/faostat/en/#data. We owe our sincere thanks to Nanjing University of Information Science and Technology, China, for providing essential infrastructure without which this work would not have been possible. We would like to thank the anonymous reviewers for their precious attention.

Conflicts of Interest

The authors declare no conflict of interest.

References

  1. Qu, C.; Hao, X.; Qu, J.J. Monitoring extreme agricultural drought over the Horn of Africa (HOA) using remote sensing measurements. Remote Sens. 2019, 11, 902. [Google Scholar] [CrossRef] [Green Version]
  2. Sarmah, S.; Jia, G.; Zhang, A. Satellite view of seasonal greenness trends and controls in South Asia. Environ. Res. Lett. 2018, 13, 034026. [Google Scholar] [CrossRef]
  3. Sivakumar, M.V.K.; Stefanski, R. Climate Change and Food Security in South Asia; Springer Science & Business Media: Berlin/Heidelberg, Germany, 2011. [Google Scholar]
  4. Ali, S.; Tong, D.; Xu, Z.T.; Henchiri, M.; Wilson, K.; Siqi, S.; Zhang, J. Characterization of drought monitoring events through MODIS- and TRMM-based DSI and TVDI over South Asia during 2001–2017. Environ. Sci. Pollut. Res. 2019, 26, 33568–33581. [Google Scholar] [CrossRef] [PubMed]
  5. Zhang, J.; Mu, Q.; Huang, J. Assessing the remotely sensed Drought Severity Index for agricultural drought monitoring and impact analysis in North China. Ecol. Indic. 2016, 63, 296–309. [Google Scholar] [CrossRef]
  6. Bennett, A.C.; Mcdowell, N.G.; Allen, C.D.; Anderson-Teixeira, K.J. Larger trees suffer most during drought in forests worldwide. Nat. Plants 2015, 1, 1–5. [Google Scholar] [CrossRef]
  7. Stabinsky, D. Defining Role of Agriculture in South Asia; Climate Action Network South Asia: Dhaka, Bangladesh, 2014; pp. 19–26. [Google Scholar]
  8. Funk, C.C.; Brown, M.E. Declining global per capita agricultural production and warming oceans threaten food security. Food Secur. 2009, 1, 271–289. [Google Scholar] [CrossRef]
  9. Dalezios, N.R.; Gobin, A.; Tarquis Alfonso, A.M.; Eslamian, S. Agricultural Drought Indices: Combining Crop, Climate, and Soil Factors. In Handbook of Drought and Water Scarcity, Principles of Drought and Water Scarcity; Eslamian, S., Eslamian, F., Eds.; CRC Press: New York, NY, USA, 2017; Volume 1, pp. 73–90. [Google Scholar]
  10. Tran, H.T.; Campbell, J.B.; Tran, T.D.; Tran, H.T. Monitoring drought vulnerability using multispectral indices observed from sequential remote sensing (Case Study: Tuy Phong, Binh Thuan, Vietnam). GISci. Remote Sens. 2017, 54, 167–184. [Google Scholar] [CrossRef] [Green Version]
  11. Holben, B.N.; Tucker, C.J.; Fan, C.J. Spectral assessment of soybean leaf area and lear biomass. Photogramm. Eng. Remote Sens. 1980, 46, 651–656. [Google Scholar]
  12. Kogan, F.N. Droughts of the late 1980s in the United States as derived from NOAA polar-orbiting satellite data. Bull. Am. Meteorol. Soc. 1995, 76, 655–668. [Google Scholar] [CrossRef] [Green Version]
  13. Bezdan, J.; Bezdan, A.; Blagojević, B.; Mesaroš, M.; Pejič, B.; Vraneševič, M.; Pavič, D.; Nikolič-Dorić, E. SPEI-based approach to agricultural drought monitoring in Vojvodina region. Water 2019, 11, 1481. [Google Scholar] [CrossRef] [Green Version]
  14. Chen, L.G.; Gottschalck, J.; Hartman, A.; Miskus, D.; Tinker, R.; Artusa, A. Flash drought characteristics based on U.S. drought monitor. Atmosphere 2019, 10, 498. [Google Scholar] [CrossRef] [Green Version]
  15. Barriopedro, D.; Gouveia, C.M.; Trigo, R.M.; Wang, L. The 2009/10 drought in China: Possible causes and impacts on vegetation. J. Hydrometeorol. 2012, 13, 1251–1267. [Google Scholar] [CrossRef] [Green Version]
  16. West, H.; Quinn, N.; Horswell, M. Remote sensing for drought monitoring & impact assessment: Progress, past challenges and future opportunities. Remote Sens. Environ. 2019, 232, 111291. [Google Scholar]
  17. Thenkabail, A.; Lyon, P.; Huete, J.; Gitelson, A. Remote Sensing Estimation of Crop Biophysical Characteristics at Various Scales. Hyperspectr. Remote Sens. Veg. 2011, 329–358. [Google Scholar]
  18. Yoon, D.H.; Nam, W.H.; Lee, H.J.; Hong, E.M.; Feng, S.; Wardlow, B.D.; Tadesse, T.; Svoboda, M.D.; Hayes, M.J.; Kim, D.E. Agricultural drought assessment in East Asia using satellite-based indices. Remote Sens. 2020, 12, 444. [Google Scholar] [CrossRef] [Green Version]
  19. Otkin, J.A.; Anderson, M.C.; Hain, C.; Mladenova, I.E.; Basara, J.B.; Svoboda, M. Examining rapid onset drought development using the thermal infrared-based evaporative stress index. J. Hydrometeorol. 2013, 14, 1057–1074. [Google Scholar] [CrossRef]
  20. Anderson, M.C.; Hain, C.; Wardlow, B.; Pimstein, A.; Mecikalski, J.R.; Kustas, W.P. Evaluation of drought indices based on Thermal remote sensing of evapotranspiration over the continental United States. J. Clim. 2011, 24, 2025–2044. [Google Scholar] [CrossRef]
  21. Anderson, M.C.; Cammalleri, C.; Hain, C.R.; Otkin, J.; Zhan, X.; Kustas, W. Using a Diagnostic Soil-Plant-Atmosphere Model for Monitoring Drought at Field to Continental Scales. Procedia Environ. Sci. 2013, 19, 47–56. [Google Scholar] [CrossRef] [Green Version]
  22. Anderson, M.C.; Zolin, C.A.; Sentelhas, P.C.; Hain, C.R.; Semmens, K.; Tugrul Yilmaz, M.; Gao, F.; Otkin, J.A.; Tetrault, R. The Evaporative Stress Index as an indicator of agricultural drought in Brazil: An assessment based on crop yield impacts. Remote Sens. Environ. 2016, 174, 82–99. [Google Scholar] [CrossRef]
  23. Nguyen, H.; Wheeler, M.C.; Otkin, J.A.; Cowan, T.; Frost, A.; Stone, R. Using the evaporative stress index to monitor flash drought in Australia. Environ. Res. Lett. 2019, 14, 064016. [Google Scholar] [CrossRef] [Green Version]
  24. Dhawan, V. Water and Agriculture in India. Background Paper for the South Asia Expert Panel during the Global Forum for Food and Agriculture. 2017, Volume 28. Available online: https://www.oav.de/fileadmin/user_upload/5_Publikationen/5_Studien/170118_Study_Water_Agriculture_India.pdf (accessed on 20 May 2021).
  25. Minstry of Environment Government of Pakistan Land Use Atlas of Pakistan. Report. 2004, pp. 1–70. Available online: https://wedocs.unep.org/bitstream/handle/20.500.11822/9393/-Land_Use_Atlas_of_Pakistan-2009Pakistan_LandUseAtlas_2009.pdf.pdf?sequence=3&isAllowed=y (accessed on 20 May 2021).
  26. The Structure of Health Factors among Community-dwelling Elderly People. Available online: https://www.ues.tmu.ac.jp/cus/archives/cn17/pdf/82-03.pdf (accessed on 20 May 2021).
  27. World Bank Islamic Republic of Afghanistan Agriculture Sector Review. Revitalizing Agriculture for Economic Growth, Job Creation and Food Security. 2014. Available online: https://openknowledge.worldbank.org/handle/10986/21733 (accessed on 20 May 2021).
  28. Almazroui, M.; Saeed, S.; Saeed, F.; Islam, M.N.; Ismail, M. Projections of Precipitation and Temperature over the South Asian Countries in CMIP6. Earth Syst. Environ. 2020, 4, 297–320. [Google Scholar] [CrossRef]
  29. Mahto, S.S.; Mishra, V. Dominance of summer monsoon flash droughts in India. Environ. Res. Lett. 2020. Available online: https://ui.adsabs.harvard.edu/abs/2020ERL....15j4061M/abstract (accessed on 20 May 2021). [CrossRef]
  30. Savtchenko, A.; Ouzounov, D.; Ahmad, S.; Acker, J.; Leptoukh, G.; Koziana, J.; Nickless, D. Terra and Aqua MODIS products available from NASA GES DAAC. Adv. Space Res. 2004, 34, 710–714. [Google Scholar] [CrossRef]
  31. Braun, S.A.; Stocker, E.; Marius, J. Tropical Rainfall Measuring Mission. 2011, pp. 1–58. Available online: https://earthobservatory.nasa.gov/features/TRMM (accessed on 20 May 2021).
  32. NASA. JAXA Key TRMM Facts. Earth Sci. Ref. Handb. 2001, 243–254. Available online: https://ghrc.nsstc.nasa.gov/home/sites/default/files/trmm_fact_sheet_0.pdf (accessed on 20 May 2021).
  33. Jung, H.C.; Kang, D.H.; Kim, E.; Getirana, A.; Yoon, Y.; Kumar, S.; Peters-lidard, C.D.; Hwang, E.H. Towards a soil moisture drought monitoring system for South Korea. J. Hydrol. 2020, 589, 125176. [Google Scholar] [CrossRef]
  34. McNally, A.; Arsenault, K.; Kumar, S.; Shukla, S.; Peterson, P.; Wang, S.; Funk, C.; Peters-Lidard, C.D.; Verdin, J.P. A land data assimilation system for sub-Saharan Africa food and water security applications. Sci. Data 2017, 4, 1–19. [Google Scholar] [CrossRef] [Green Version]
  35. Meroni, M.; Atzberger, C.; Vancutsem, C.; Gobron, N.; Baret, F.; Lacaze, R.; Eerens, H.; Leo, O. Evaluation of agreement between space remote sensing SPOT-VEGETATION fAPAR Time Series. IEEE Trans. Geosci. Remote Sens. 2013, 51, 1951–1962. [Google Scholar] [CrossRef]
  36. Pérez-Hoyos, A.; Rembold, F.; Kerdiles, H.; Gallego, J. Comparison of global land cover datasets for cropland monitoring. Remote Sens. 2017, 9, 1118. [Google Scholar] [CrossRef] [Green Version]
  37. Agutu, N.O.; Awange, J.L.; Zerihun, A.; Ndehedehe, C.E.; Kuhn, M.; Fukuda, Y. Assessing multi-satellite remote sensing, reanalysis, and land surface models’ products in characterizing agricultural drought in East Africa. Remote Sens. Environ. 2017, 194, 287–302. [Google Scholar] [CrossRef] [Green Version]
  38. Mustafa, F.; Bu, L.; Wang, Q.; Ali, M.A.; Bilal, M.; Shahzaman, M.; Qiu, Z. Multi-year comparison of CO2 concentration from NOAA carbon tracker reanalysis model with data from GOSAT and OCO-2 over Asia. Remote Sens. 2020, 12, 2498. [Google Scholar] [CrossRef]
  39. Mustafa, F.; Wang, H.; Bu, L.; Wang, Q.; Shahzaman, M.; Bilal, M.; Zhou, M.; Iqbal, R.; Aslam, R.W.; Ali, M.A.; et al. Validation of gosat and oco-2 against in situ aircraft measurements and comparison with carbontracker and geos-chem over Qinhuangdao, China. Remote Sens. 2021, 13, 899. [Google Scholar] [CrossRef]
  40. Kaspar, F.; Schulzweida, U.; Wetterdienst, D. “Climate Data Operators” As a User-Friendly Processing Tool for Cmsaf’S Satellite-Derived Climate Monitoring Products. In Proceedings of the Conference: EUMETSAT Meteorological Satellite Conference, Córdoba, Spain, 20–24 September 2010. [Google Scholar]
  41. Kogan, F.N. Global Drought Watch from Space. Bull. Am. Meteorol. Soc. 1997, 78, 621–636. [Google Scholar] [CrossRef]
  42. Brema, J.; Rahul, T.S.; Julius, J.J. Proceedings of International Conference on Remote Sensing for Disaster Management; Springer International Publishing: Berlin/Heidelberg, Germany, 2019; ISBN 978-3-319-77275-2. [Google Scholar]
  43. Huete, A. Land Remote Sensing and Global Environmental Change: NASA’s Earth Observing System and the Science of ASTER and MODIS; Springer International Publishing: Berlin/Heidelberg, Germany, 2011; ISBN 9781441967480. [Google Scholar]
  44. Rowhani, P.; Linderman, M.; Lambin, E.F. Global interannual variability in terrestrial ecosystems: Sources and spatial distribution using MODIS-derived vegetation indices, social and biophysical factors. Int. J. Remote Sens. 2011, 32, 5393–5411. [Google Scholar] [CrossRef]
  45. Noormets, A. Phenology of ecosystem processes: Applications in global change research. Phenol. Ecosyst. Process. Appl. Glob. Chang. Res. 2009, 1–275. Available online: https://link.springer.com/book/10.1007%2F978-1-4419-0026-5 (accessed on 20 May 2021).
  46. Liou, Y.A.; Mulualem, G.M. Spatio-temporal assessment of drought in Ethiopia and the impact of recent intense droughts. Remote Sens. 2019, 11, 1828. [Google Scholar] [CrossRef] [Green Version]
  47. Koudahe, K.; Kayode, A.J.; Samson, A.O.; Adebola, A.A.; Djaman, K. Trend Analysis in Standardized Precipitation Index and Standardized Anomaly Index in the Context of Climate Change in Southern Togo. Atmos. Clim. Sci. 2017, 07, 401–423. [Google Scholar] [CrossRef] [Green Version]
  48. Kang, C.H.; Zhang, Y.; Wang, Z.; Liu, L.; Zhang, H.; Jo, Y. The driving force analysis of NDVI dynamics in the trans-boundary Tumen River Basin between 2000 and 2015. Sustainability 2017, 9, 2350. [Google Scholar] [CrossRef] [Green Version]
  49. Wilks, D.S. Statistical Methods in the Atmospheric Sciences, 2nd ed.; Academic Press: Cambridge, MA, USA, 2007; ISBN 9780127519661. [Google Scholar]
  50. Kamoutsis, A.; Matsoukis, A.; Chronopoulou-Sereli, A. Triticum Aestivum L. Phenological response to air temperature in Greece. Ital. J. Agrometeorol. 2010, 2, 51–55. [Google Scholar]
  51. Sur, K.; Lunagaria, M.M. Association between drought and agricultural productivity using remote sensing data: A case study of Gujarat state of India. J. Water Clim. Chang. 2020, 11, 189–202. [Google Scholar] [CrossRef]
  52. Arshad, M.; Ma, X.; Yin, J.; Ullah, W.; Ali, G.; Ullah, S.; Liu, M.; Shahzaman, M.; Ullah, I. Evaluation of GPM-IMERG and TRMM-3B42 precipitation products over Pakistan. Atmos. Res. 2020, 249, 105341. [Google Scholar] [CrossRef]
  53. Naz, F.; Dars, G.H.; Ansari, K.; Jamro, S.; Krakauer, N.Y. Drought trends in Balochistan. Water 2020, 12, 470. [Google Scholar] [CrossRef] [Green Version]
  54. Sheikh, M.M. Drought management and prevention in Pakistan. Sci. Vis. 2001, 7, 117–131. [Google Scholar]
  55. Kambale, J. Climate Change Assessment of Long Term Spatio-Temporal. 2019. Available online: https://www.researchgate.net/publication/336459179_Assessment_of_long_term_Spatio-temporal_variability_and_Standardized_Anomaly_Index_of_rainfall_of_Northeastern_region_Karnataka_India (accessed on 20 May 2021).
  56. Bhuiyan, C.; Singh, R.P.; Kogan, F.N. Monitoring drought dynamics in the Aravalli region (India) using different indices based on ground and remote sensing data. Int. J. Appl. Earth Obs. Geoinf. 2006, 8, 289–302. [Google Scholar] [CrossRef]
  57. Ali, S.; Henchiri, M.; Yao, F.; Zhang, J. Analysis of vegetation dynamics, drought in relation with climate over South Asia from 1990 to 2011. Environ. Sci. Pollut. Res. 2019, 26, 11470–11481. [Google Scholar] [CrossRef] [PubMed]
  58. Development, I. Socio-Economic Impacts of Climate Change in Afghanistan A Report to the Department for International Development; Stockholm Environment Institute: Oxford, UK, 2009. [Google Scholar]
  59. Rousta, I.; Olafsson, H.; Moniruzzaman, M.; Zhang, H.; Liou, Y.A.; Mushore, T.D.; Gupta, A. Impacts of drought on vegetation assessed by vegetation indices and meteorological factors in Afghanistan. Remote Sens. 2020, 12, 2433. [Google Scholar] [CrossRef]
  60. Asoka, A.; Mishra, V. Prediction of vegetation anomalies to improve food security and water management in India. Geophys. Res. Lett. 2015, 42, 5290–5298. [Google Scholar] [CrossRef] [Green Version]
  61. Wu, D.; Zhao, X.; Liang, S.; Zhou, T.; Huang, K.; Tang, B.; Zhao, W. Time-lag effects of global vegetation responses to climate change. Glob. Chang. Biol. 2015, 21, 3520–3531. [Google Scholar] [CrossRef]
  62. Wang, J.; Price, K.P.; Rich, P.M. Spatial patterns of NDVI in response to precipitation and temperature in the central Great Plains. Int. J. Remote Sens. 2001, 22, 3827–3844. [Google Scholar] [CrossRef]
  63. Karnieli, A.; Agam, N.; Pinker, R.T.; Anderson, M.; Imhoff, M.L.; Gutman, G.G.; Panov, N.; Goldberg, A. Use of NDVI and Land Surface Temperature for Drought Assessment: Merits and Limitations. J. Clim. 2010, 23, 618–633. [Google Scholar] [CrossRef]
  64. Nanzad, L.; Zhang, J.; Tuvdendorj, B.; Nabil, M.; Zhang, S.; Bai, Y. NDVI anomaly for drought monitoring and its correlation with climate factors over Mongolia from 2000 to 2016. J. Arid Environ. 2019, 164, 69–77. [Google Scholar] [CrossRef]
  65. Measho, S.; Chen, B.; Trisurat, Y.; Pellikka, P.; Guo, L. Spatio-Temporal Analysis of Vegetation Dynamics as a Response to Climate Variability and Drought Patterns in the Semiarid Region, Eritrea. Remote Sens. 2019, 11, 724. [Google Scholar] [CrossRef] [Green Version]
  66. Chuai, X.W.; Huang, X.J.; Wang, W.J.; Bao, G. NDVI, temperature and precipitation changes and their relationships with different vegetation types during 1998-2007 in Inner Mongolia, China. Int. J. Climatol. 2013, 33, 1696–1706. [Google Scholar] [CrossRef]
  67. Li, X.; Waddington, S.R.; Dixon, J.; Joshi, A.K.; de Vicente, M.C. The relative importance of drought and other water-related constraints for major food crops in South Asian farming systems. Food Secur. 2011, 3, 19–33. [Google Scholar] [CrossRef]
  68. Ullah, I.; Ma, X.; Azam, K.; Syed, S.; Liu, M.; Arshad, M. Evaluating the Meteorological Drought Characteristics over Pakistan Using In Situ Observations and Reanalysis Products. 2021, pp. 1–23. Available online: https://rmets.onlinelibrary.wiley.com/doi/abs/10.1002/joc.7063 (accessed on 20 May 2021).
  69. Potopová, V.; Boroneanţ, C.; Boincean, B.; Soukup, J. Impact of agricultural drought on main crop yields in the Republic of Moldova. Int. J. Climatol. 2016, 36, 2063–2082. [Google Scholar] [CrossRef] [Green Version]
  70. King, W.I.; King, W.I. Skewness. Elem. Stat. Method 2012, 100, 159–166. [Google Scholar]
  71. Peña-Gallardo, M.; Martín Vicente-Serrano, S.; Domínguez-Castro, F.; Beguería, S. The impact of drought on the productivity of two rainfed crops in Spain. Nat. Hazards Earth Syst. Sci. 2019, 19, 1215–1234. [Google Scholar] [CrossRef] [Green Version]
Figure 1. (A) Elevation map of the study area. (B) Locations of drought affected regions during the drought year 2002 in Afghanistan (a), Pakistan (b), India (c) and Bangladesh (d).
Remotesensing 13 02059 g001
Figure 2. Majority land cover type of study area generated with MODIS–MCD12 data product.
Remotesensing 13 02059 g002
Figure 3. Long-term average (2002–2019) Evaporative stress index (a), Vegetation health index (b), Enhance vegetation index (c) and Standardized anomaly index (d) over study region.
Remotesensing 13 02059 g003
Figure 4. Annual average evaporative stress index (ESI) over four South Asian Countries (2002–2019).
Remotesensing 13 02059 g004
Figure 5. Comparison of the agricultural drought pattern for each index in Pakistan.
Remotesensing 13 02059 g005
Figure 6. Comparison of the agricultural drought pattern for each index in India.
Remotesensing 13 02059 g006
Figure 7. Comparison of the agricultural drought pattern for each index in Bangladesh.
Remotesensing 13 02059 g007
Figure 8. Comparison of the agricultural drought pattern for each index in Afghanistan.
Remotesensing 13 02059 g008
Figure 9. (af) Scatter plots showing the correlations between the drought indices (ESI, VHI) and climate variables (TRMM, SM, LST) during the drought year (2002).
Remotesensing 13 02059 g009
Figure 10. (gl) Scatter plots showing the correlations between the drought indices (EVI, SAI) and climate variables (TRMM, SM, LST) during the drought year (2002).
Remotesensing 13 02059 g010
Figure 11. (ad) Temporal change in the drought distribution pattern determined by the drought indices (ESI, SAI, EVI, and VHI) during 2002, the drought year.
Remotesensing 13 02059 g011
Figure 12. (ad) Boxplots presenting the range of agricultural drought severity over the study region based on the ESI, SAI, EVI, and VHI estimation during 2002, the drought year. The solid grey lines in the box show the median and the cross sign indicates mean.
Remotesensing 13 02059 g012
Figure 13. (ad) Temporal variability in the annual crop yield (barley, maize, rice, and wheat) at the country level from 2002–2019.
Remotesensing 13 02059 g013
Figure 14. (ad) The correlation coefficient matrix between the drought indices and crop yield anomaly index (YAI) in Pakistan, India, Bangladesh, and Afghanistan during 2002, the drought year.
Remotesensing 13 02059 g014
Publisher’s Note: MDPI stays neutral with regard to jurisdictional claims in published maps and institutional affiliations.

