
Potentials of Airborne Hyperspectral AVIRIS-NG Data in the Exploration of Base Metal Deposit—A Study in the Parts of Bhilwara, Rajasthan


 , , ,
, , ,
Abstract
:
1. Introduction
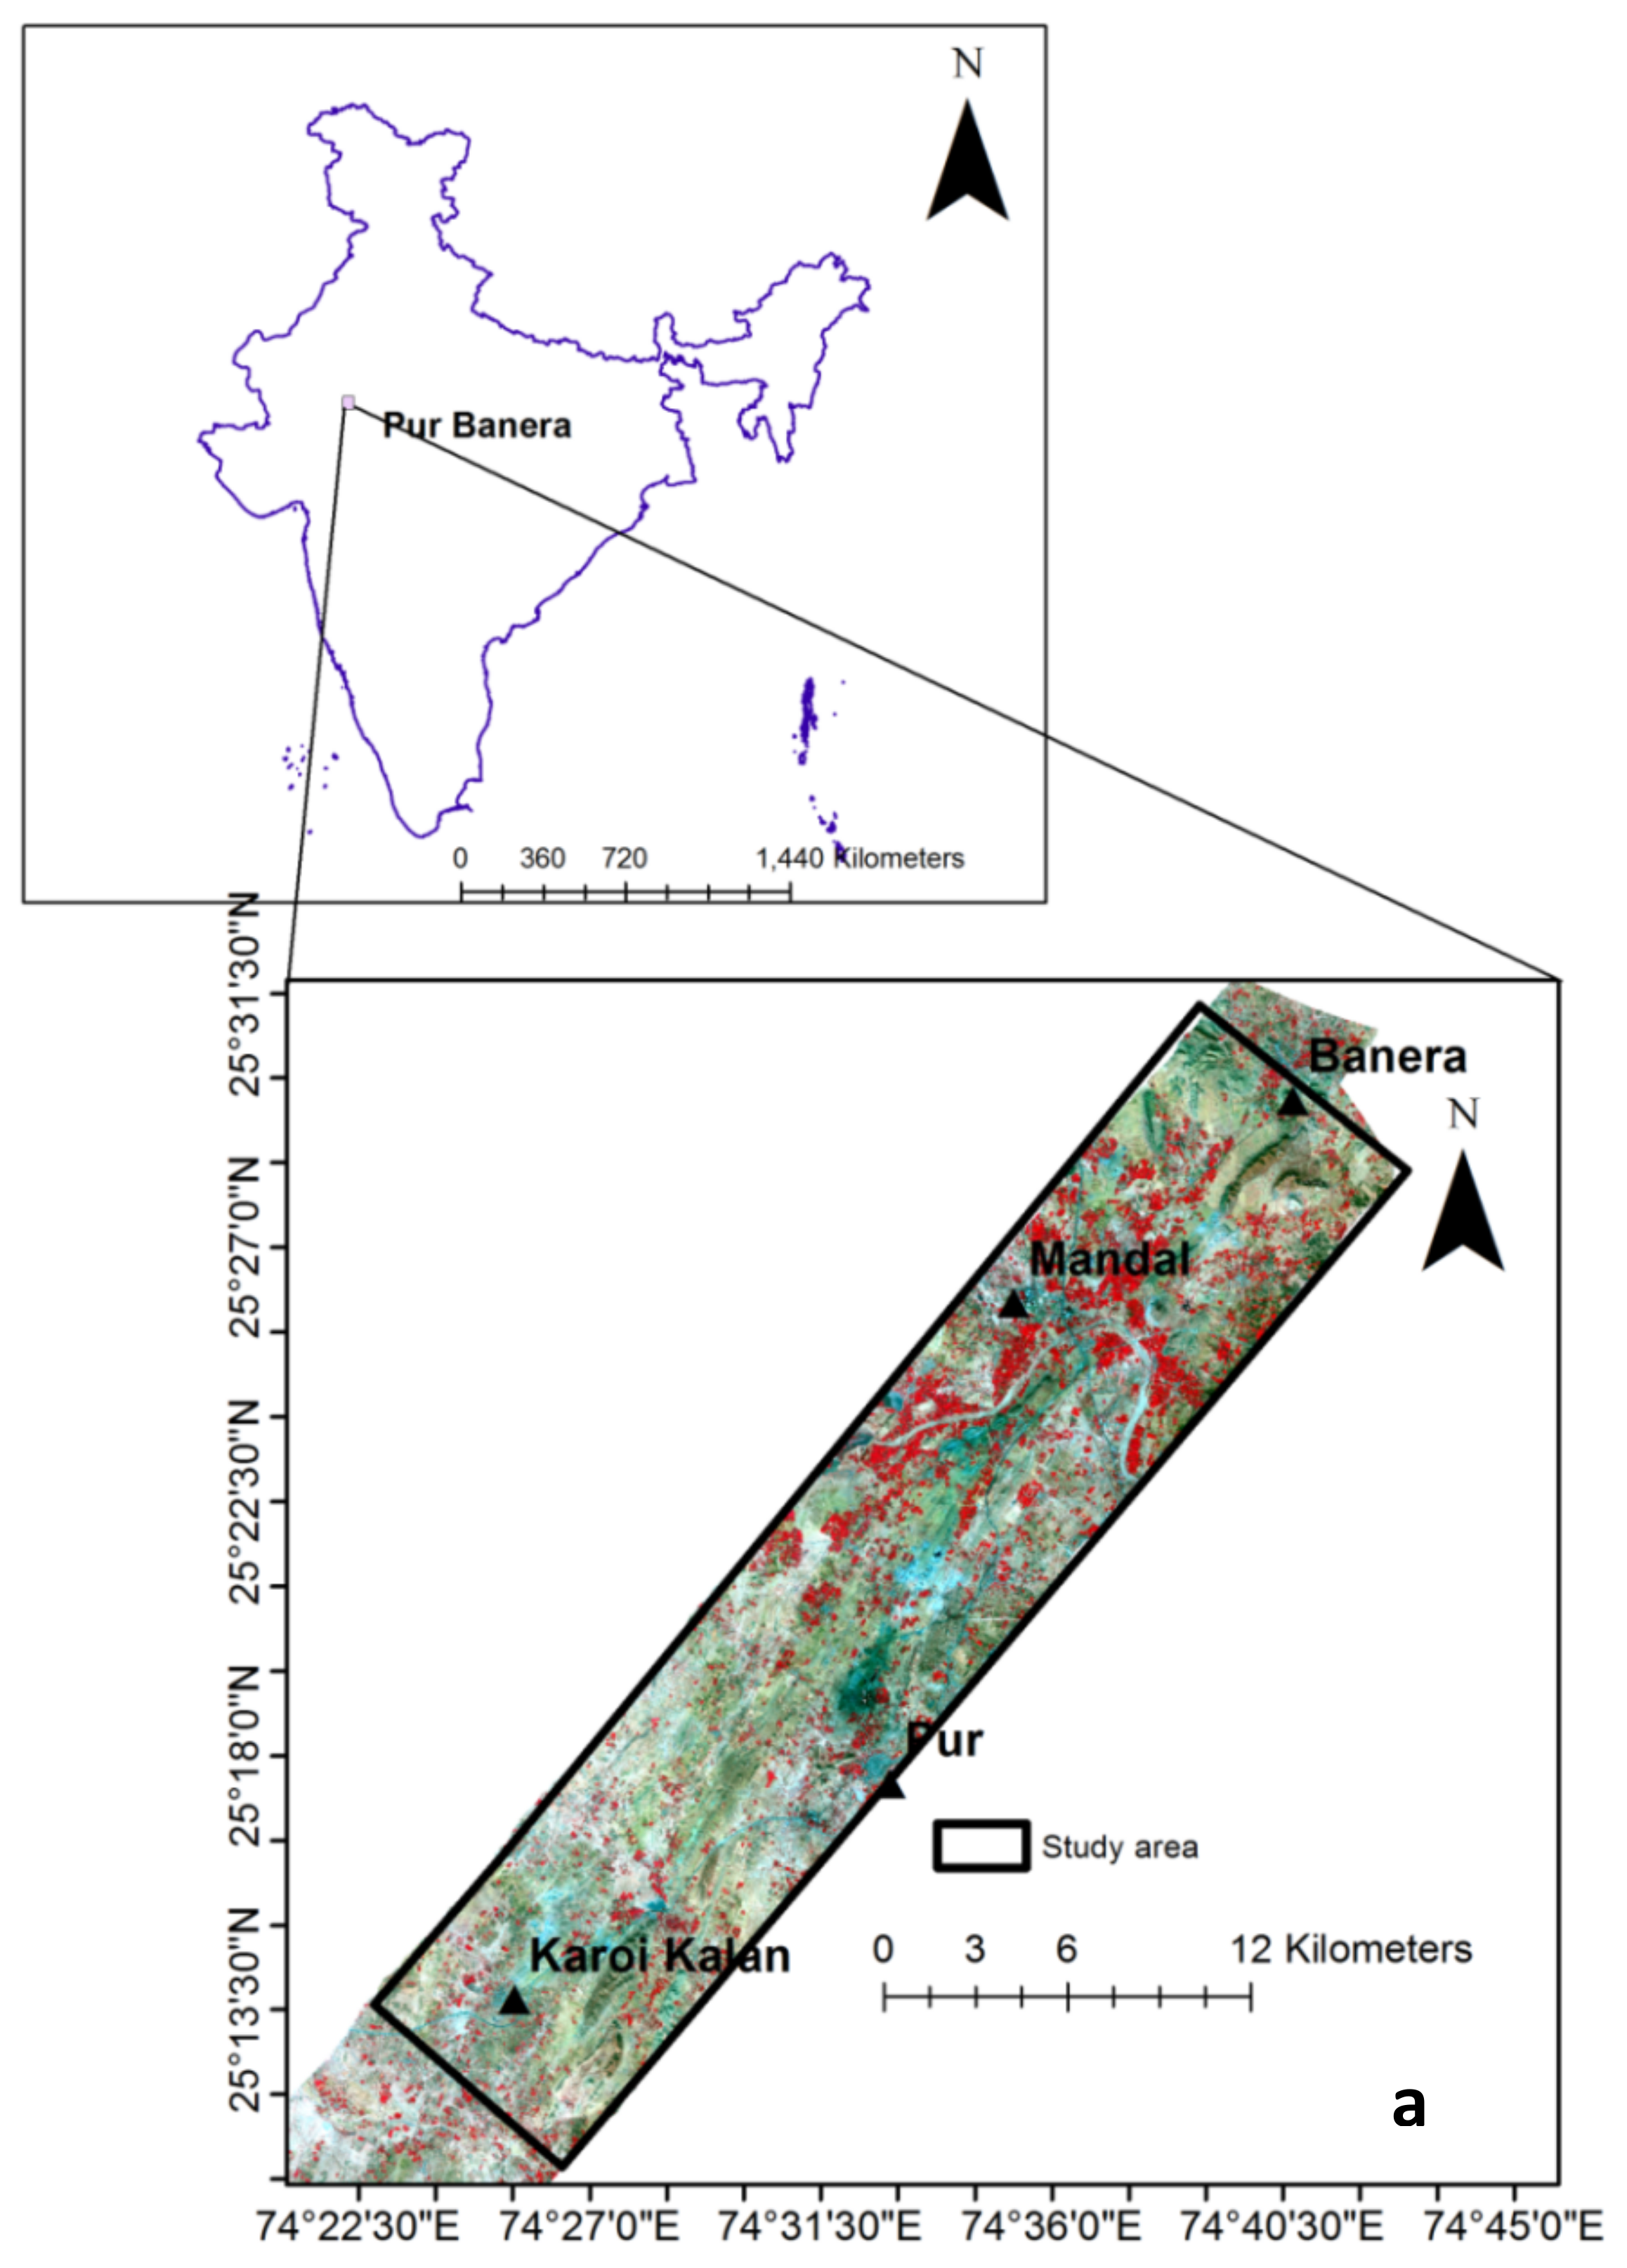
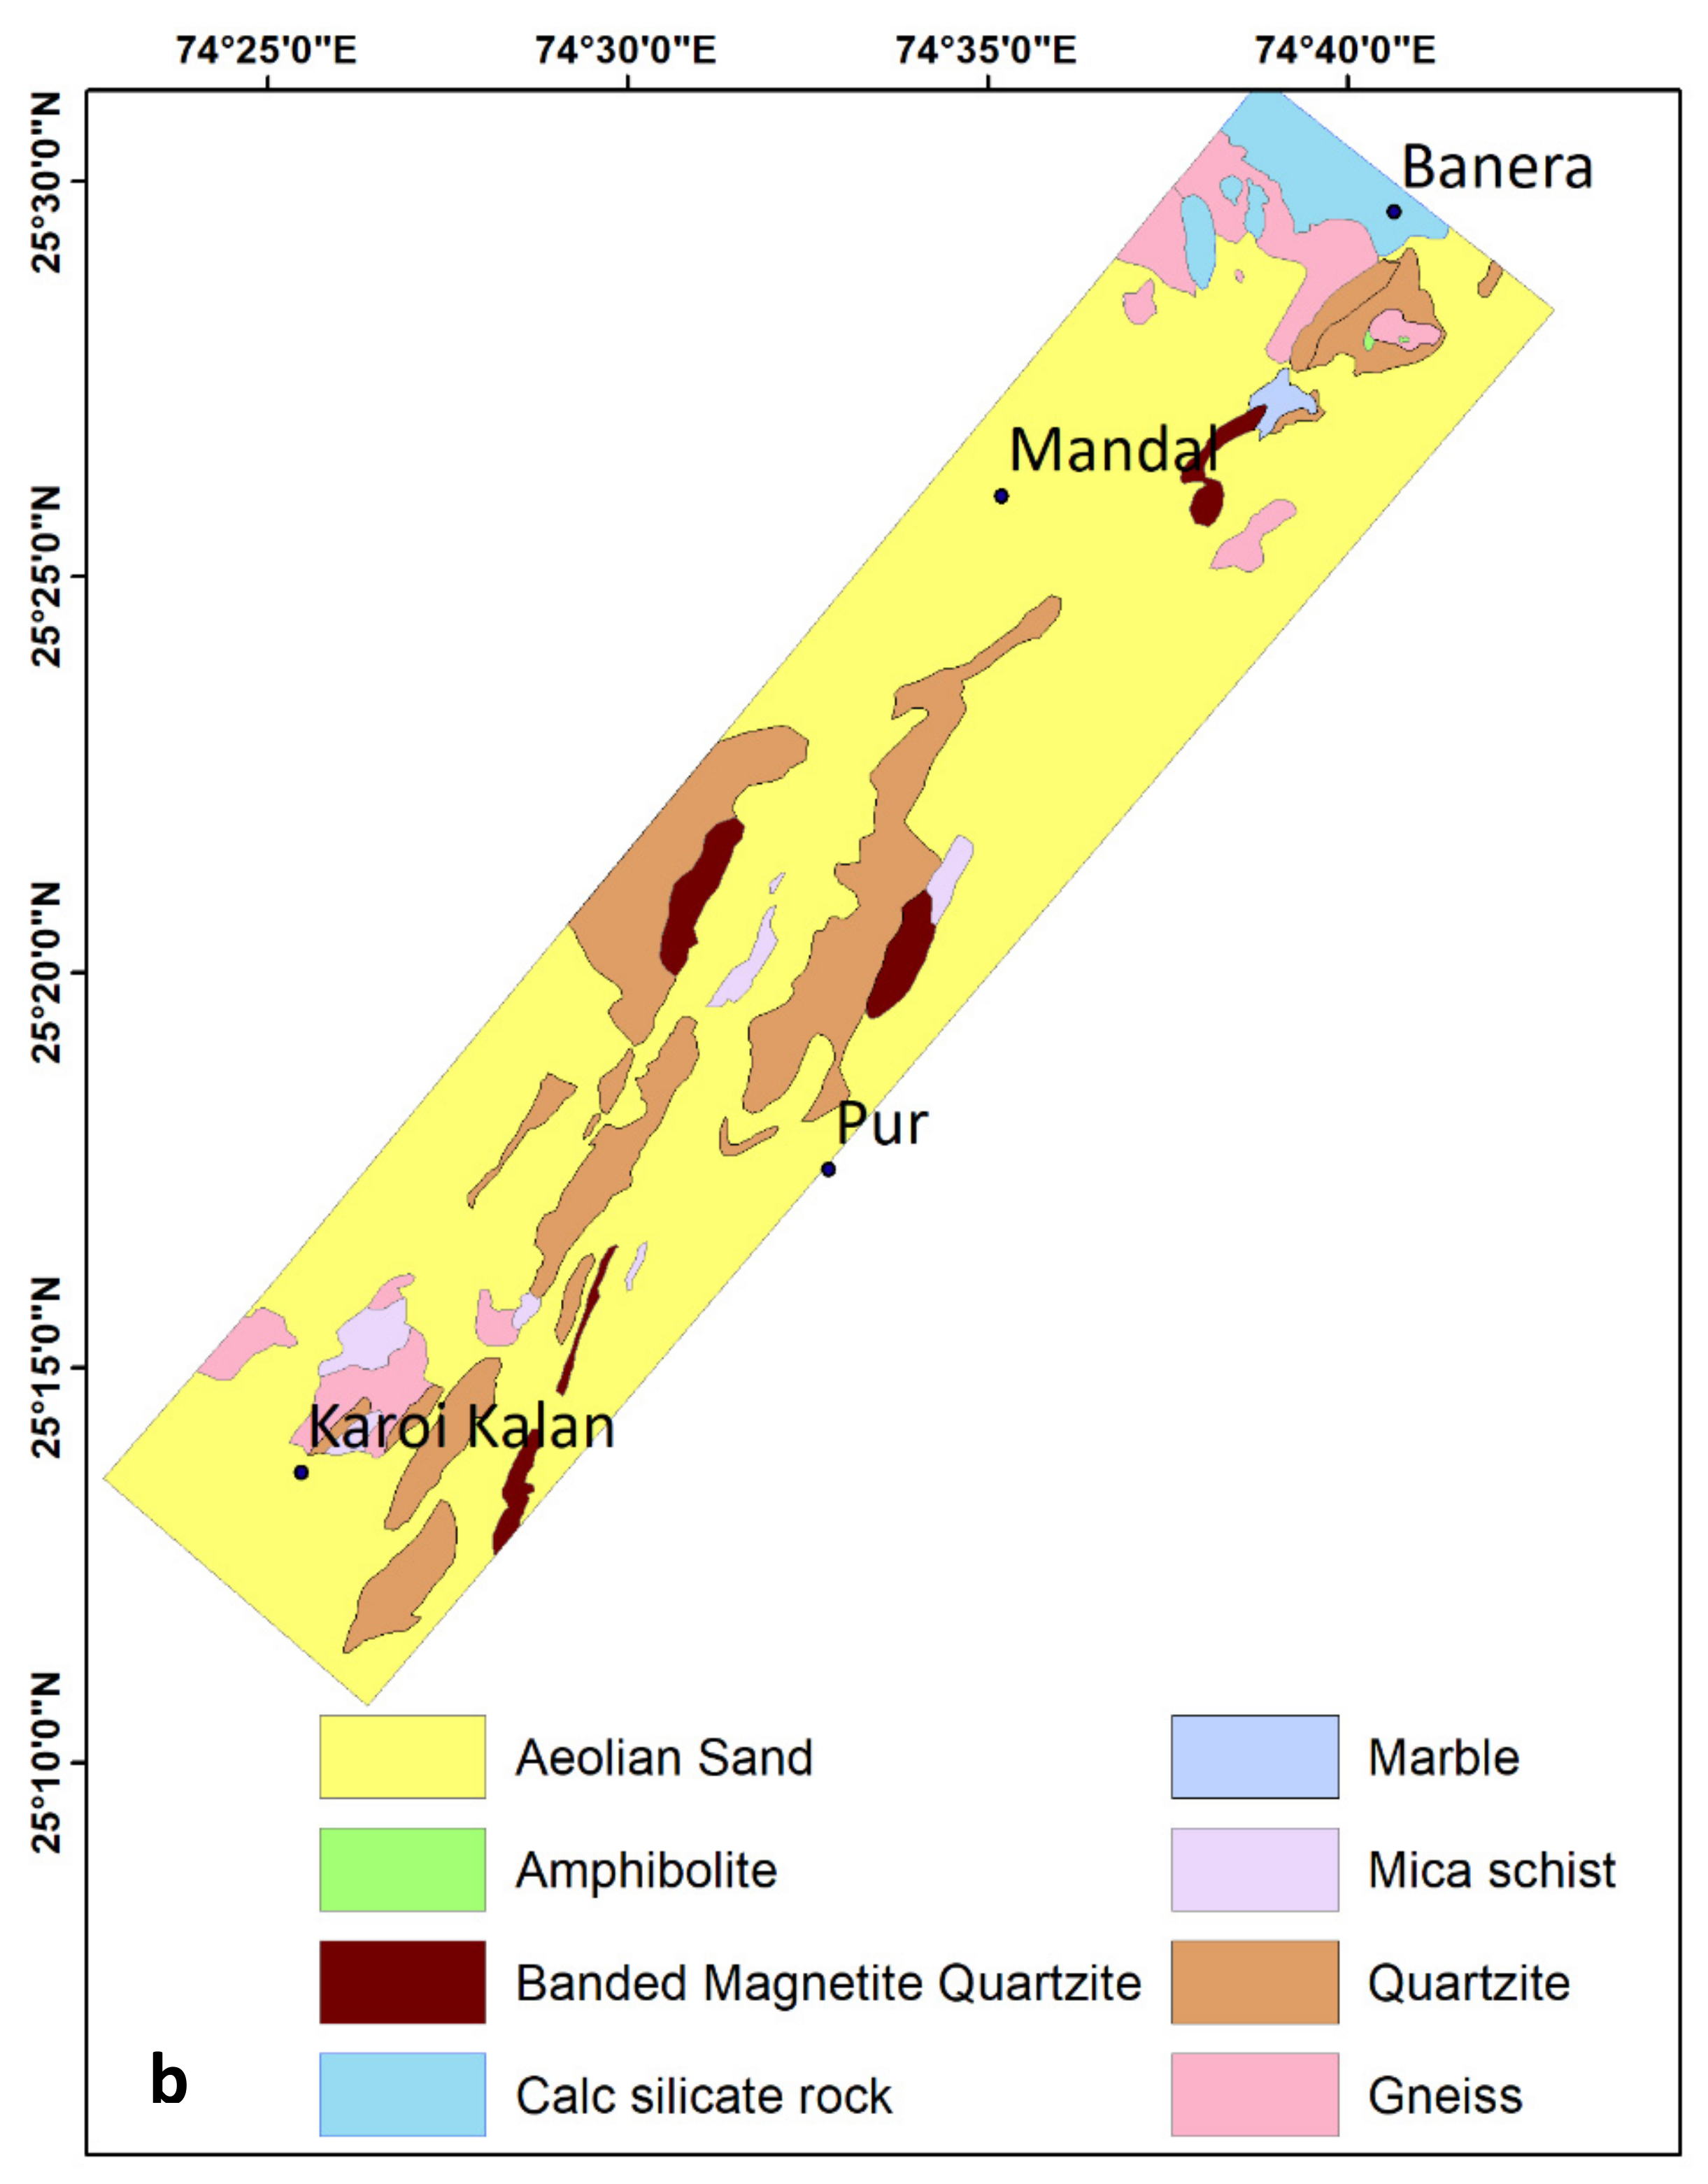
2. Geology
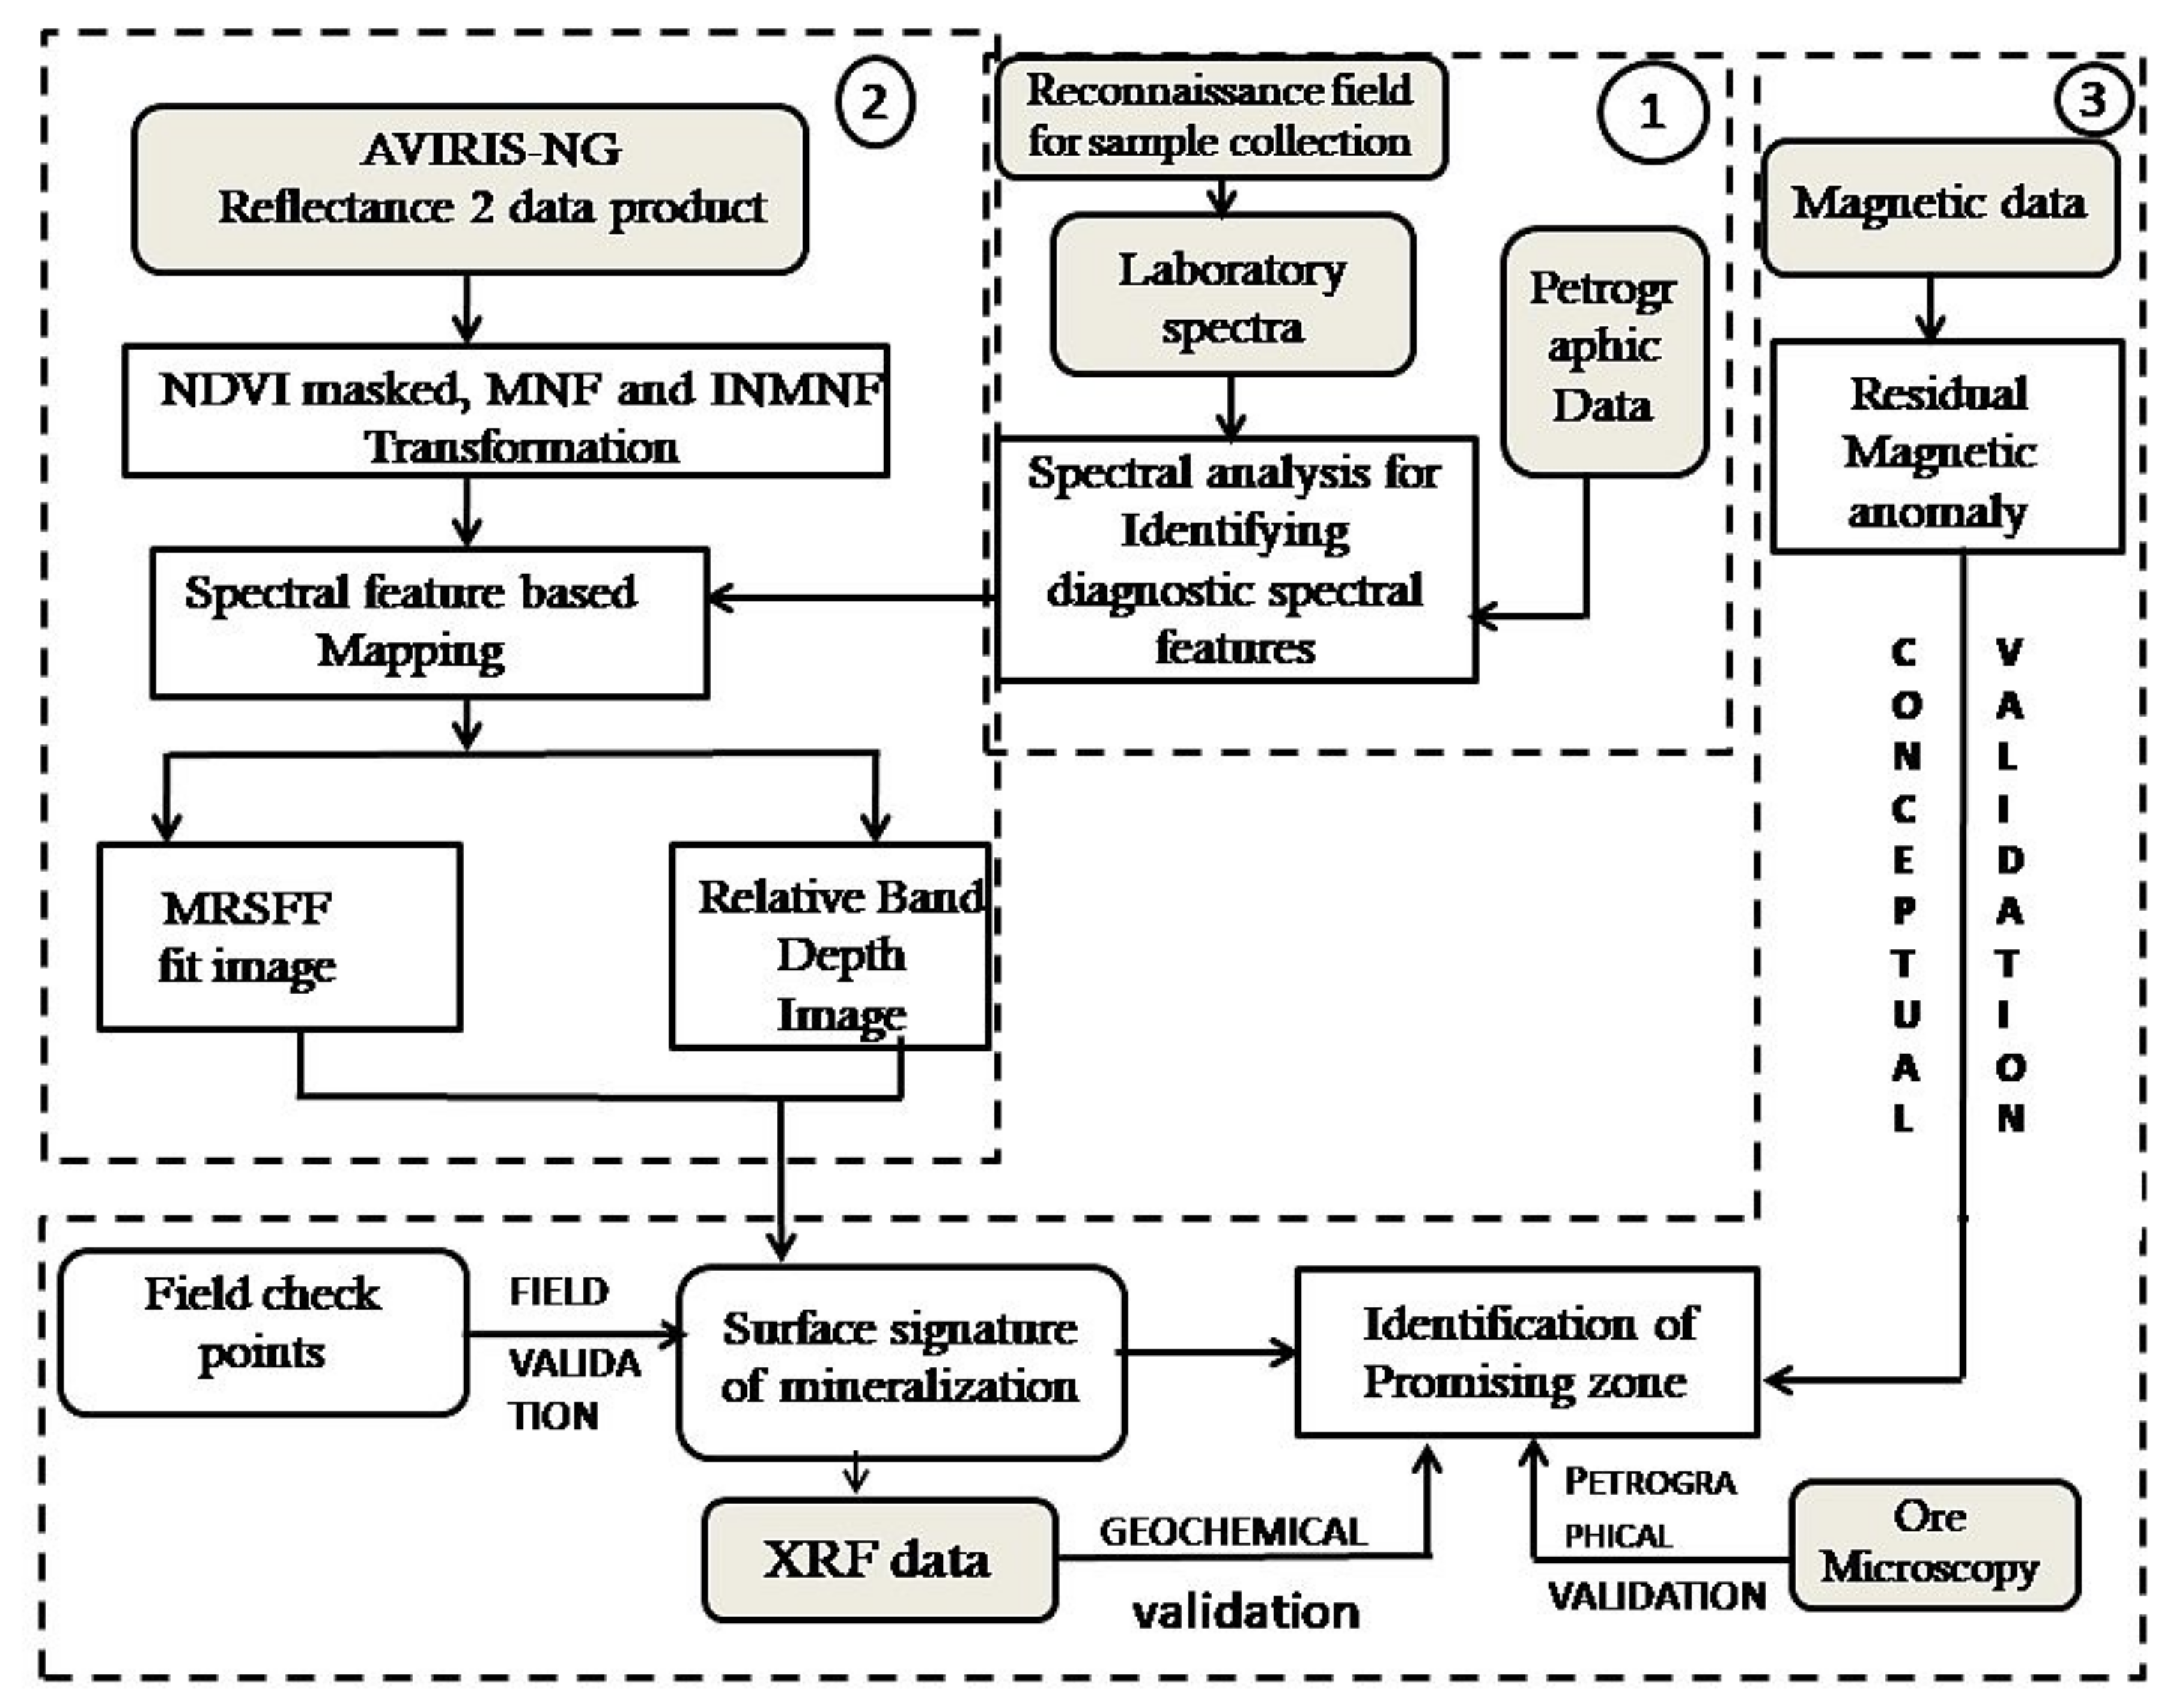
3. Materials and Methods
3.1. Materials
3.1.1. AVIRIS-NG Data
3.1.2. Spectral Datasets
3.1.3. Ground Magnetic Data
3.1.4. X-ray Fluorescence (XRF) and Petrographical Data
3.2. Methods
3.2.1. Collection and Analysis of Rock Spectra
3.2.2. AVIRIS-NG Data Processing andSpectral Mapping
3.2.3. Magnetic Data Processing
3.2.4. XRF and Petrographical Analysis
4. Results
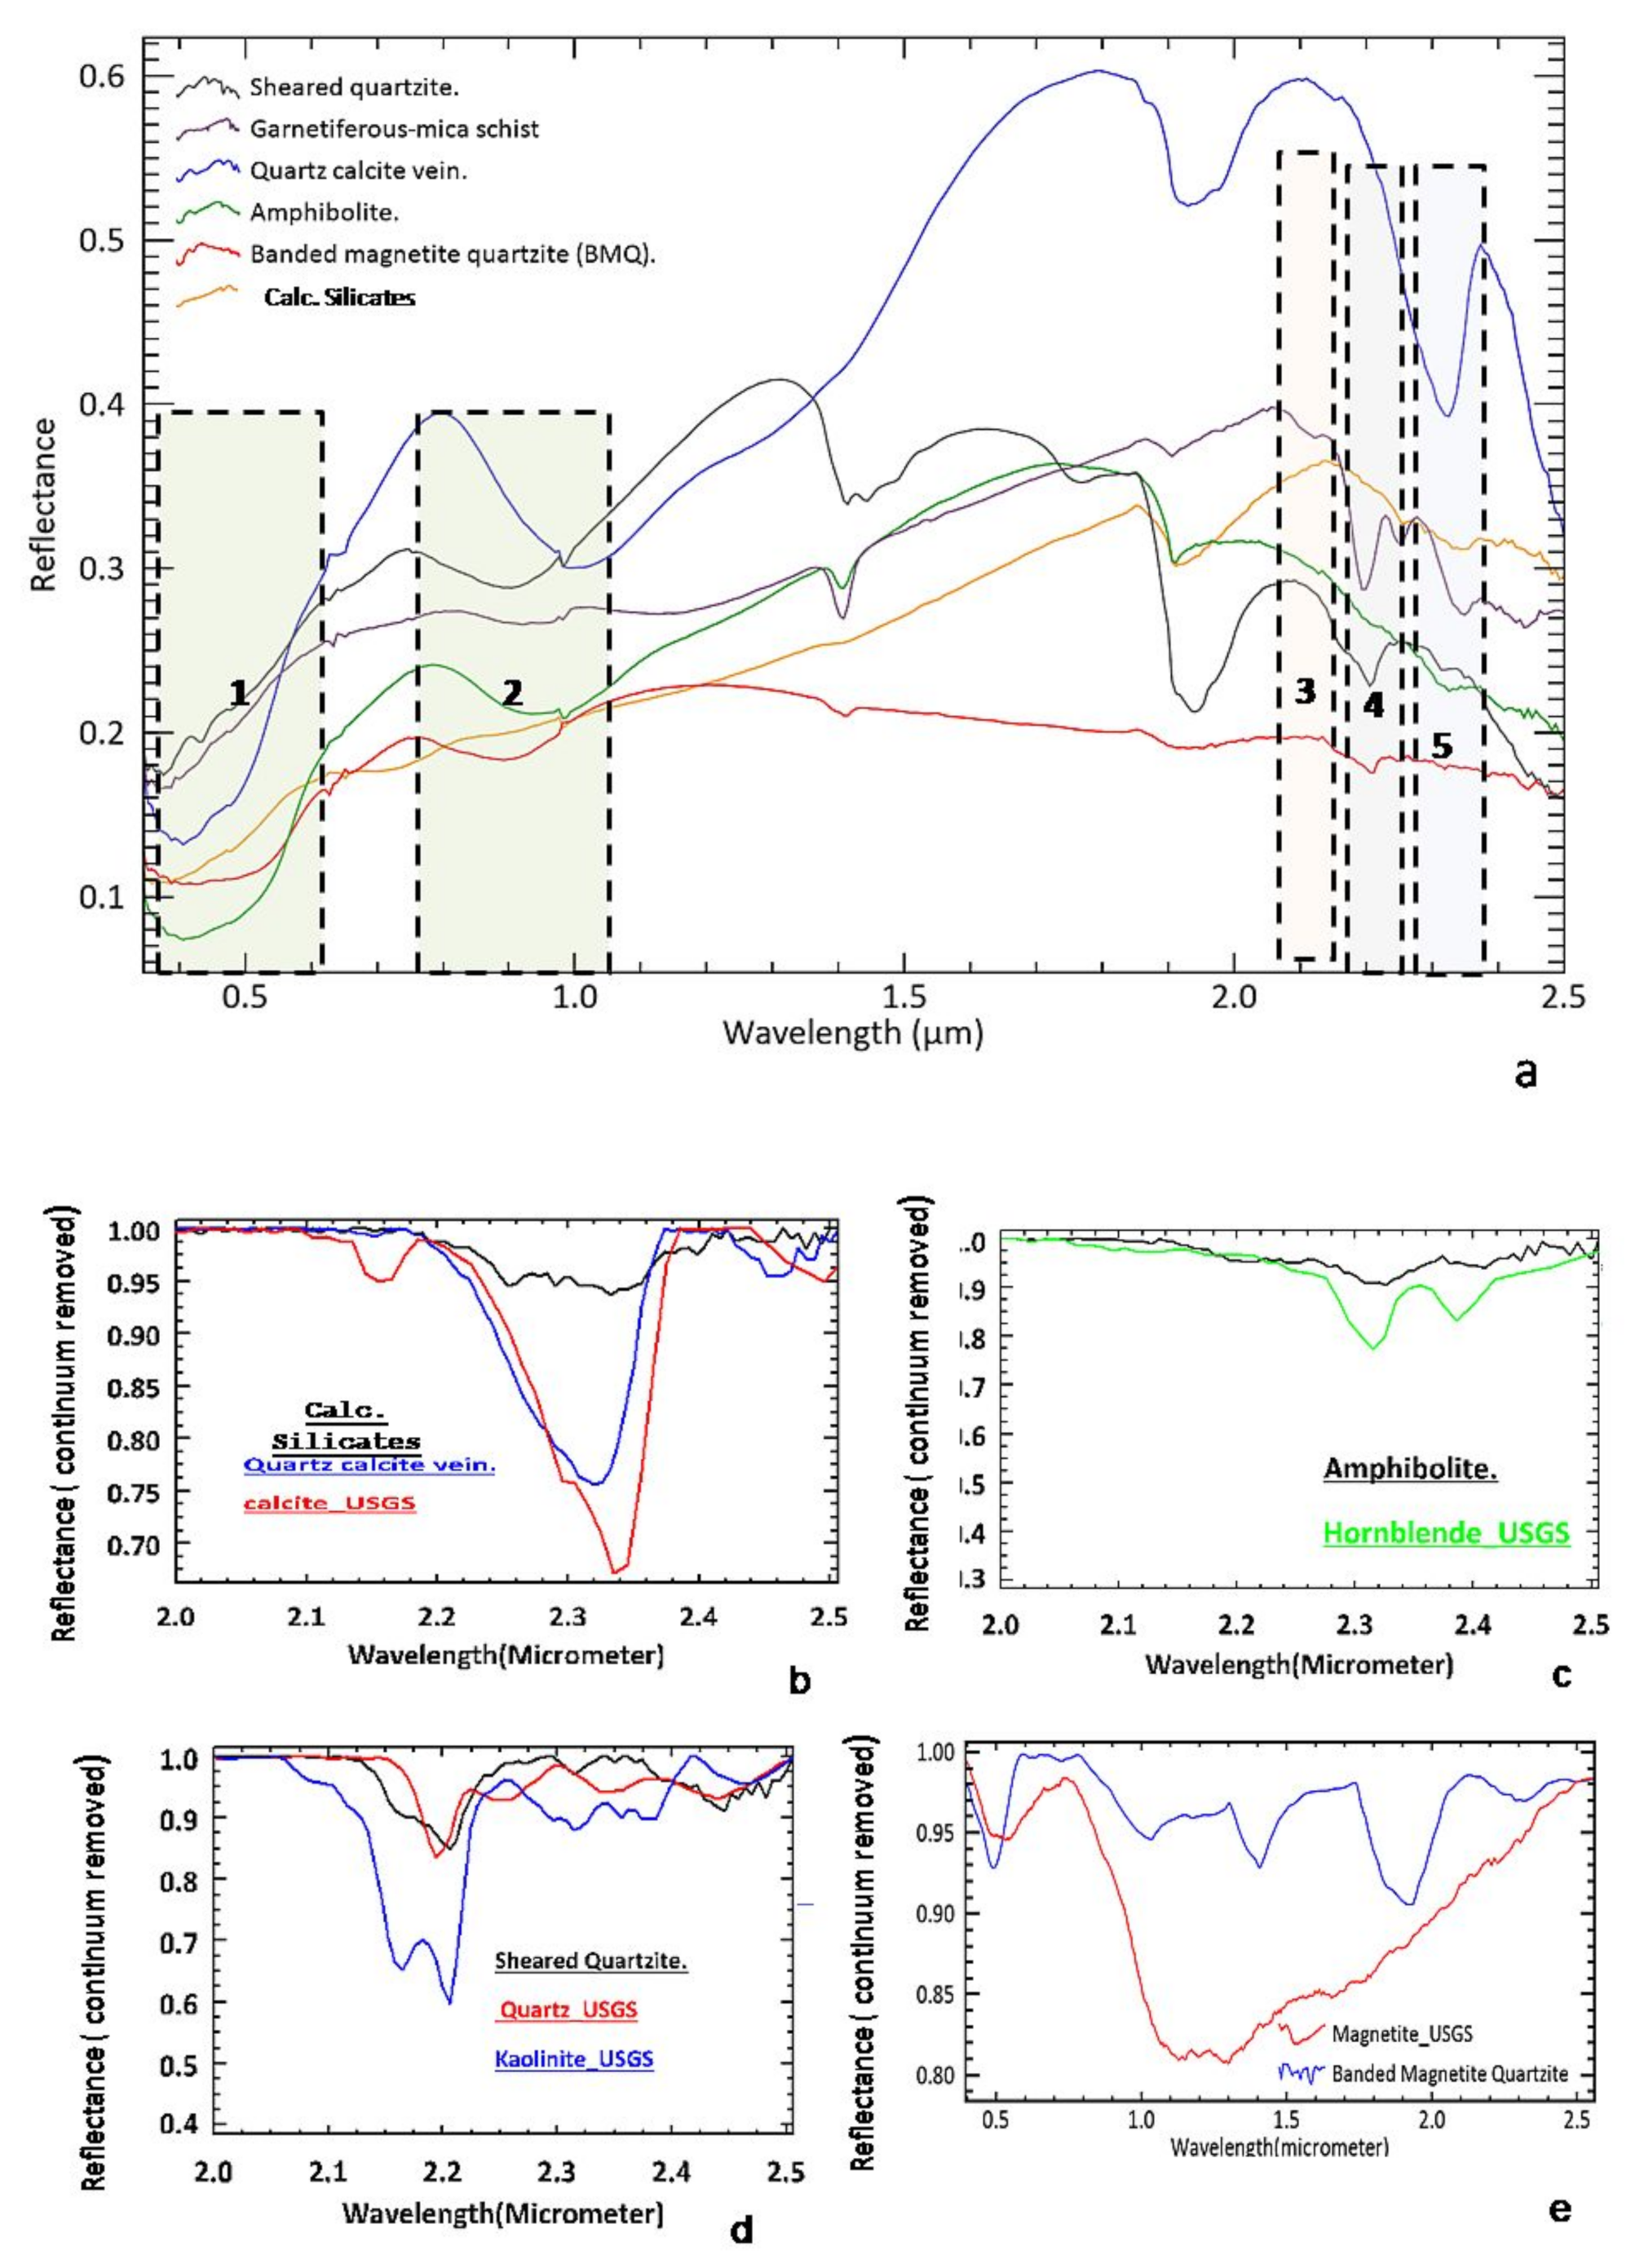
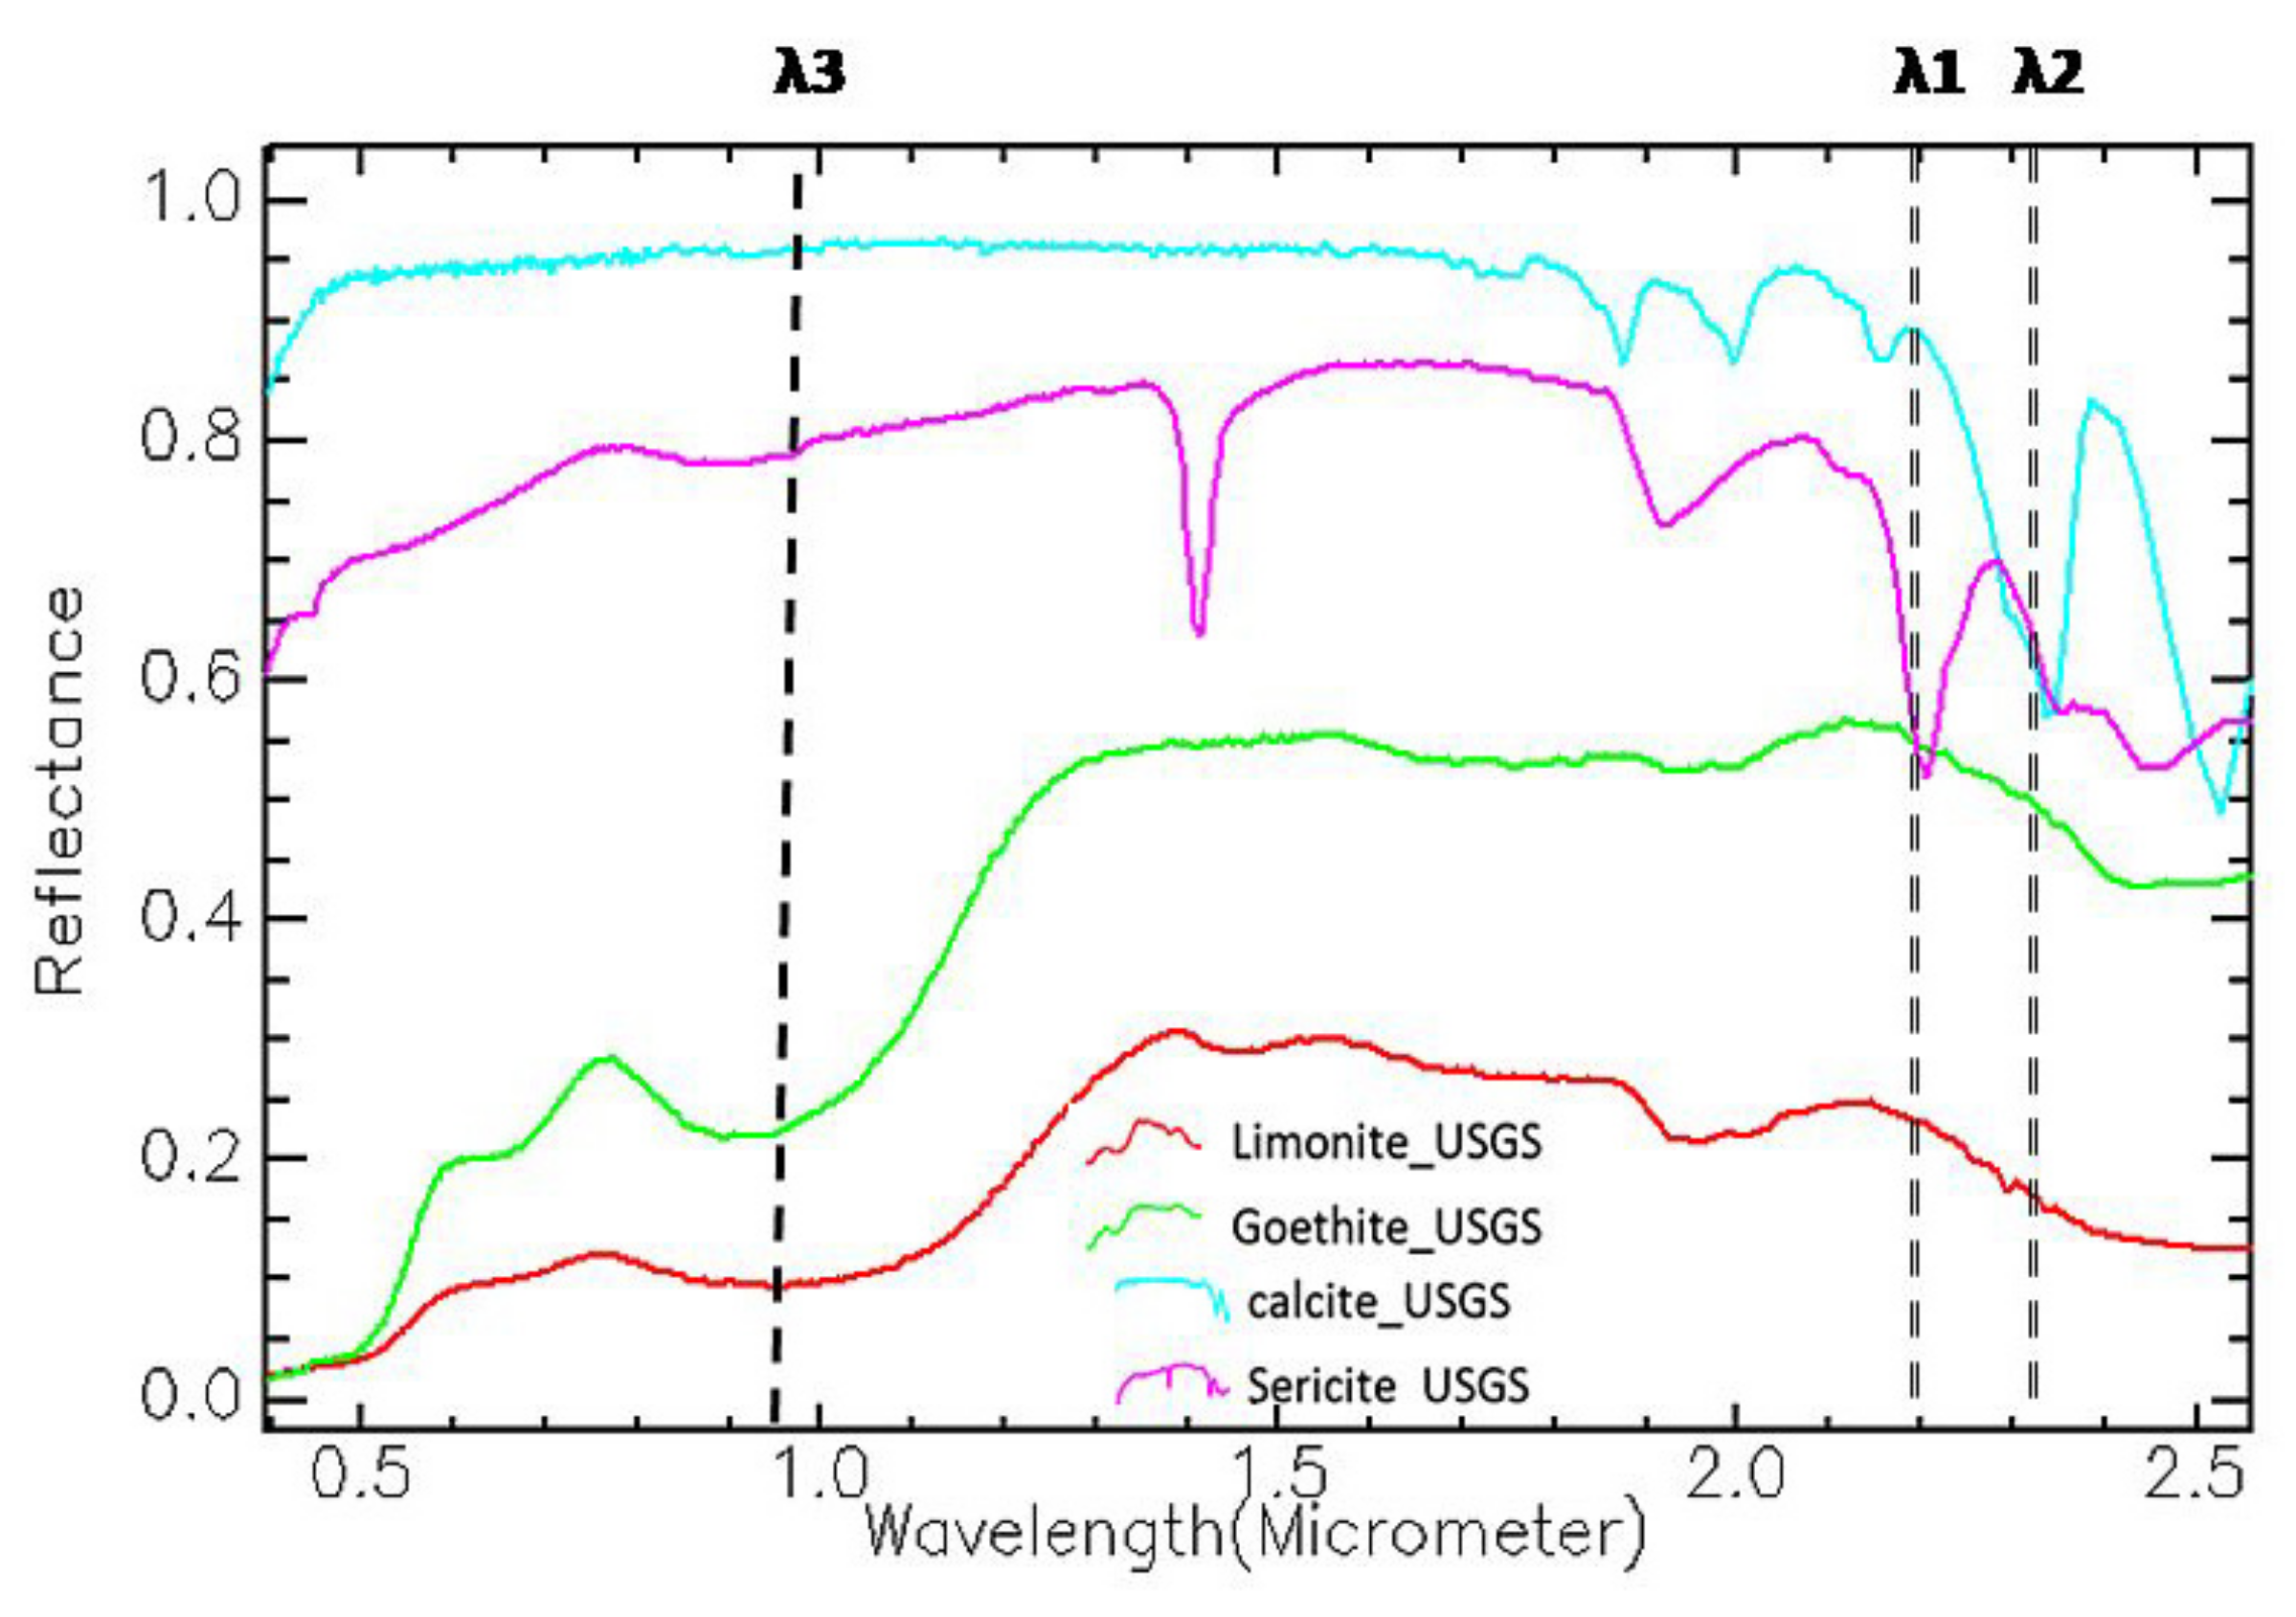
4.1. SpectralAnalysis to Identify the Diagnostic Spectral Features of Different Rocks and the Altered Rocks
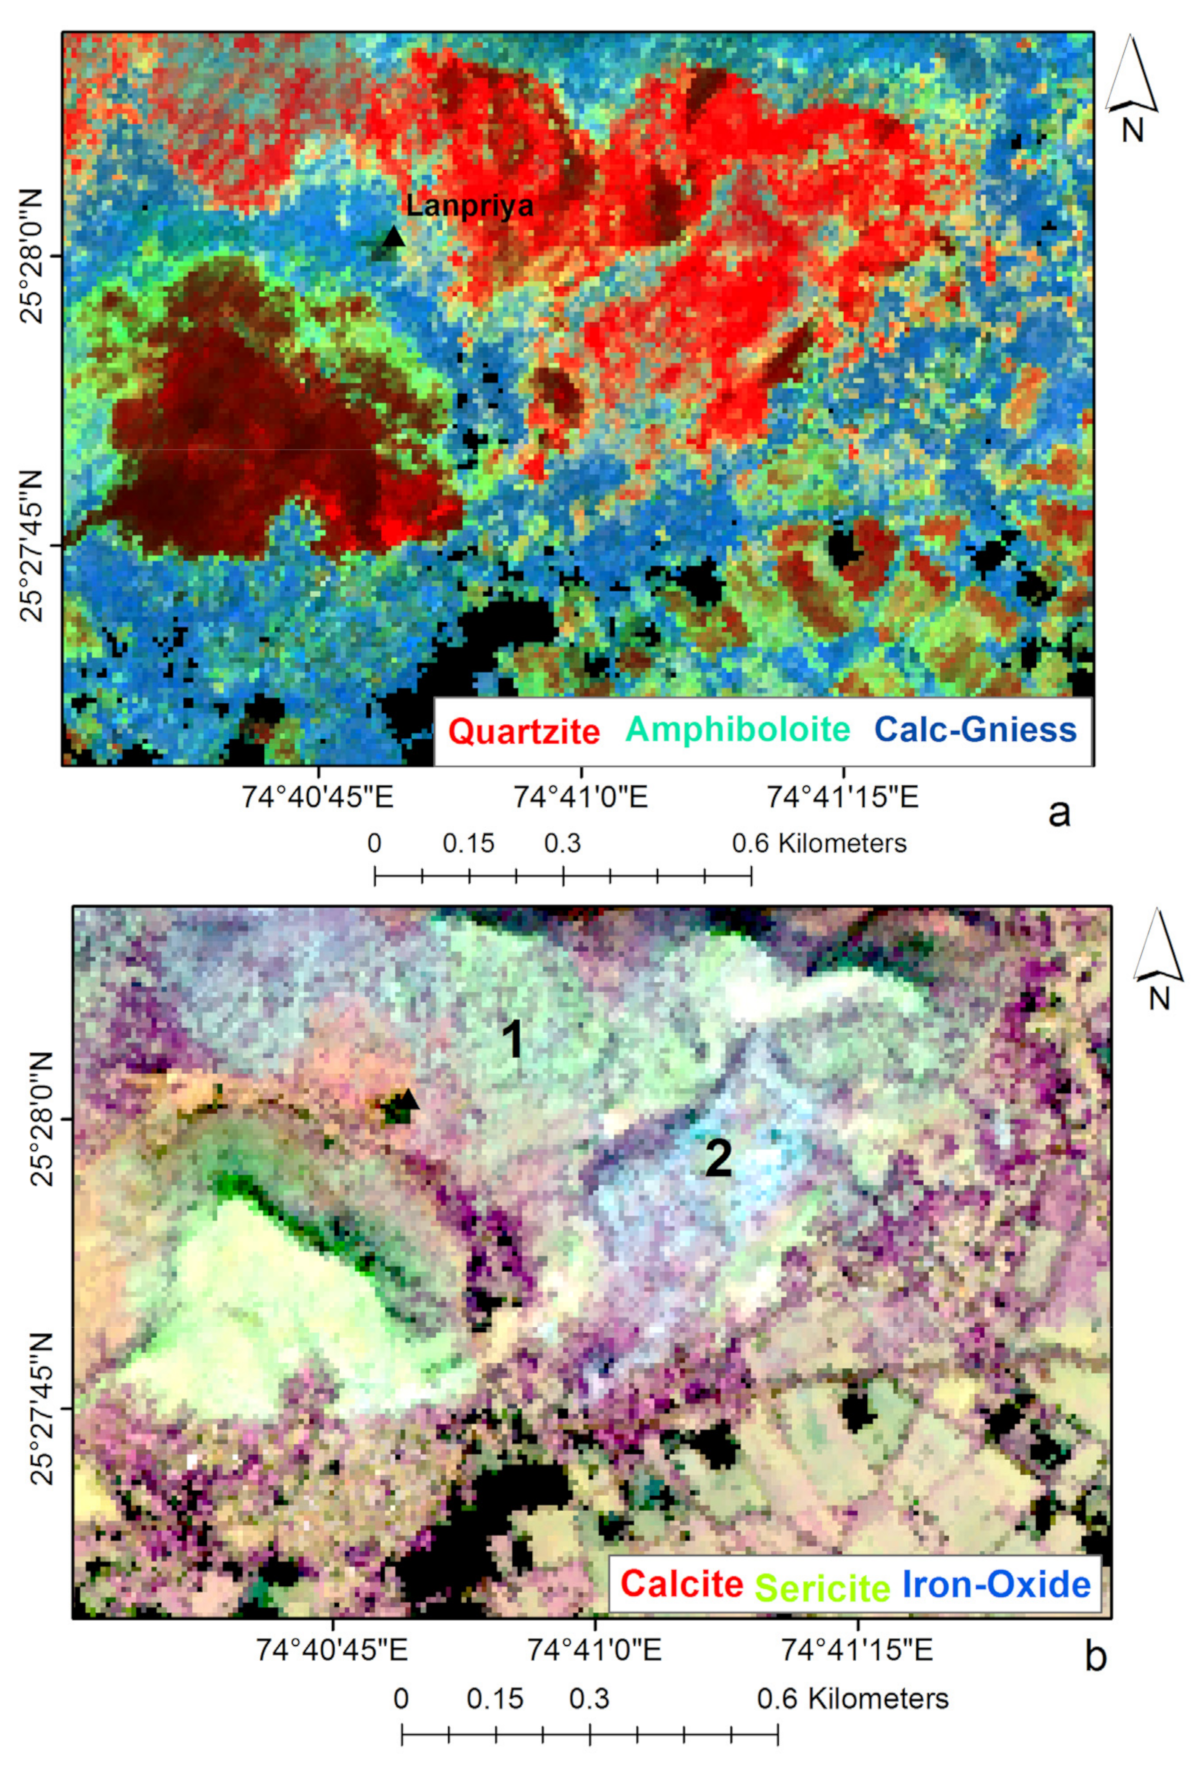
4.2. AVIRIS-NG Data Processing and Spectral Mapping for Mapping Host Rock and Surface Signatures of Mineralization
4.3. Synergistic Analysis of Ground Magnetic Data and Surface Distribution of Alteration and Supergene Minerals
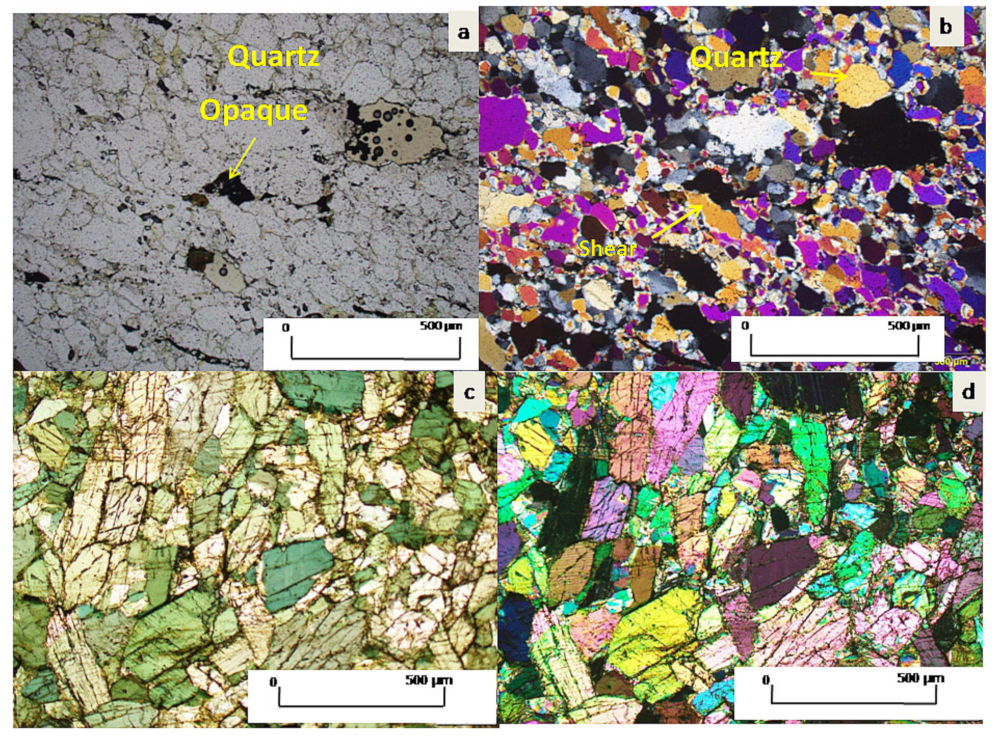
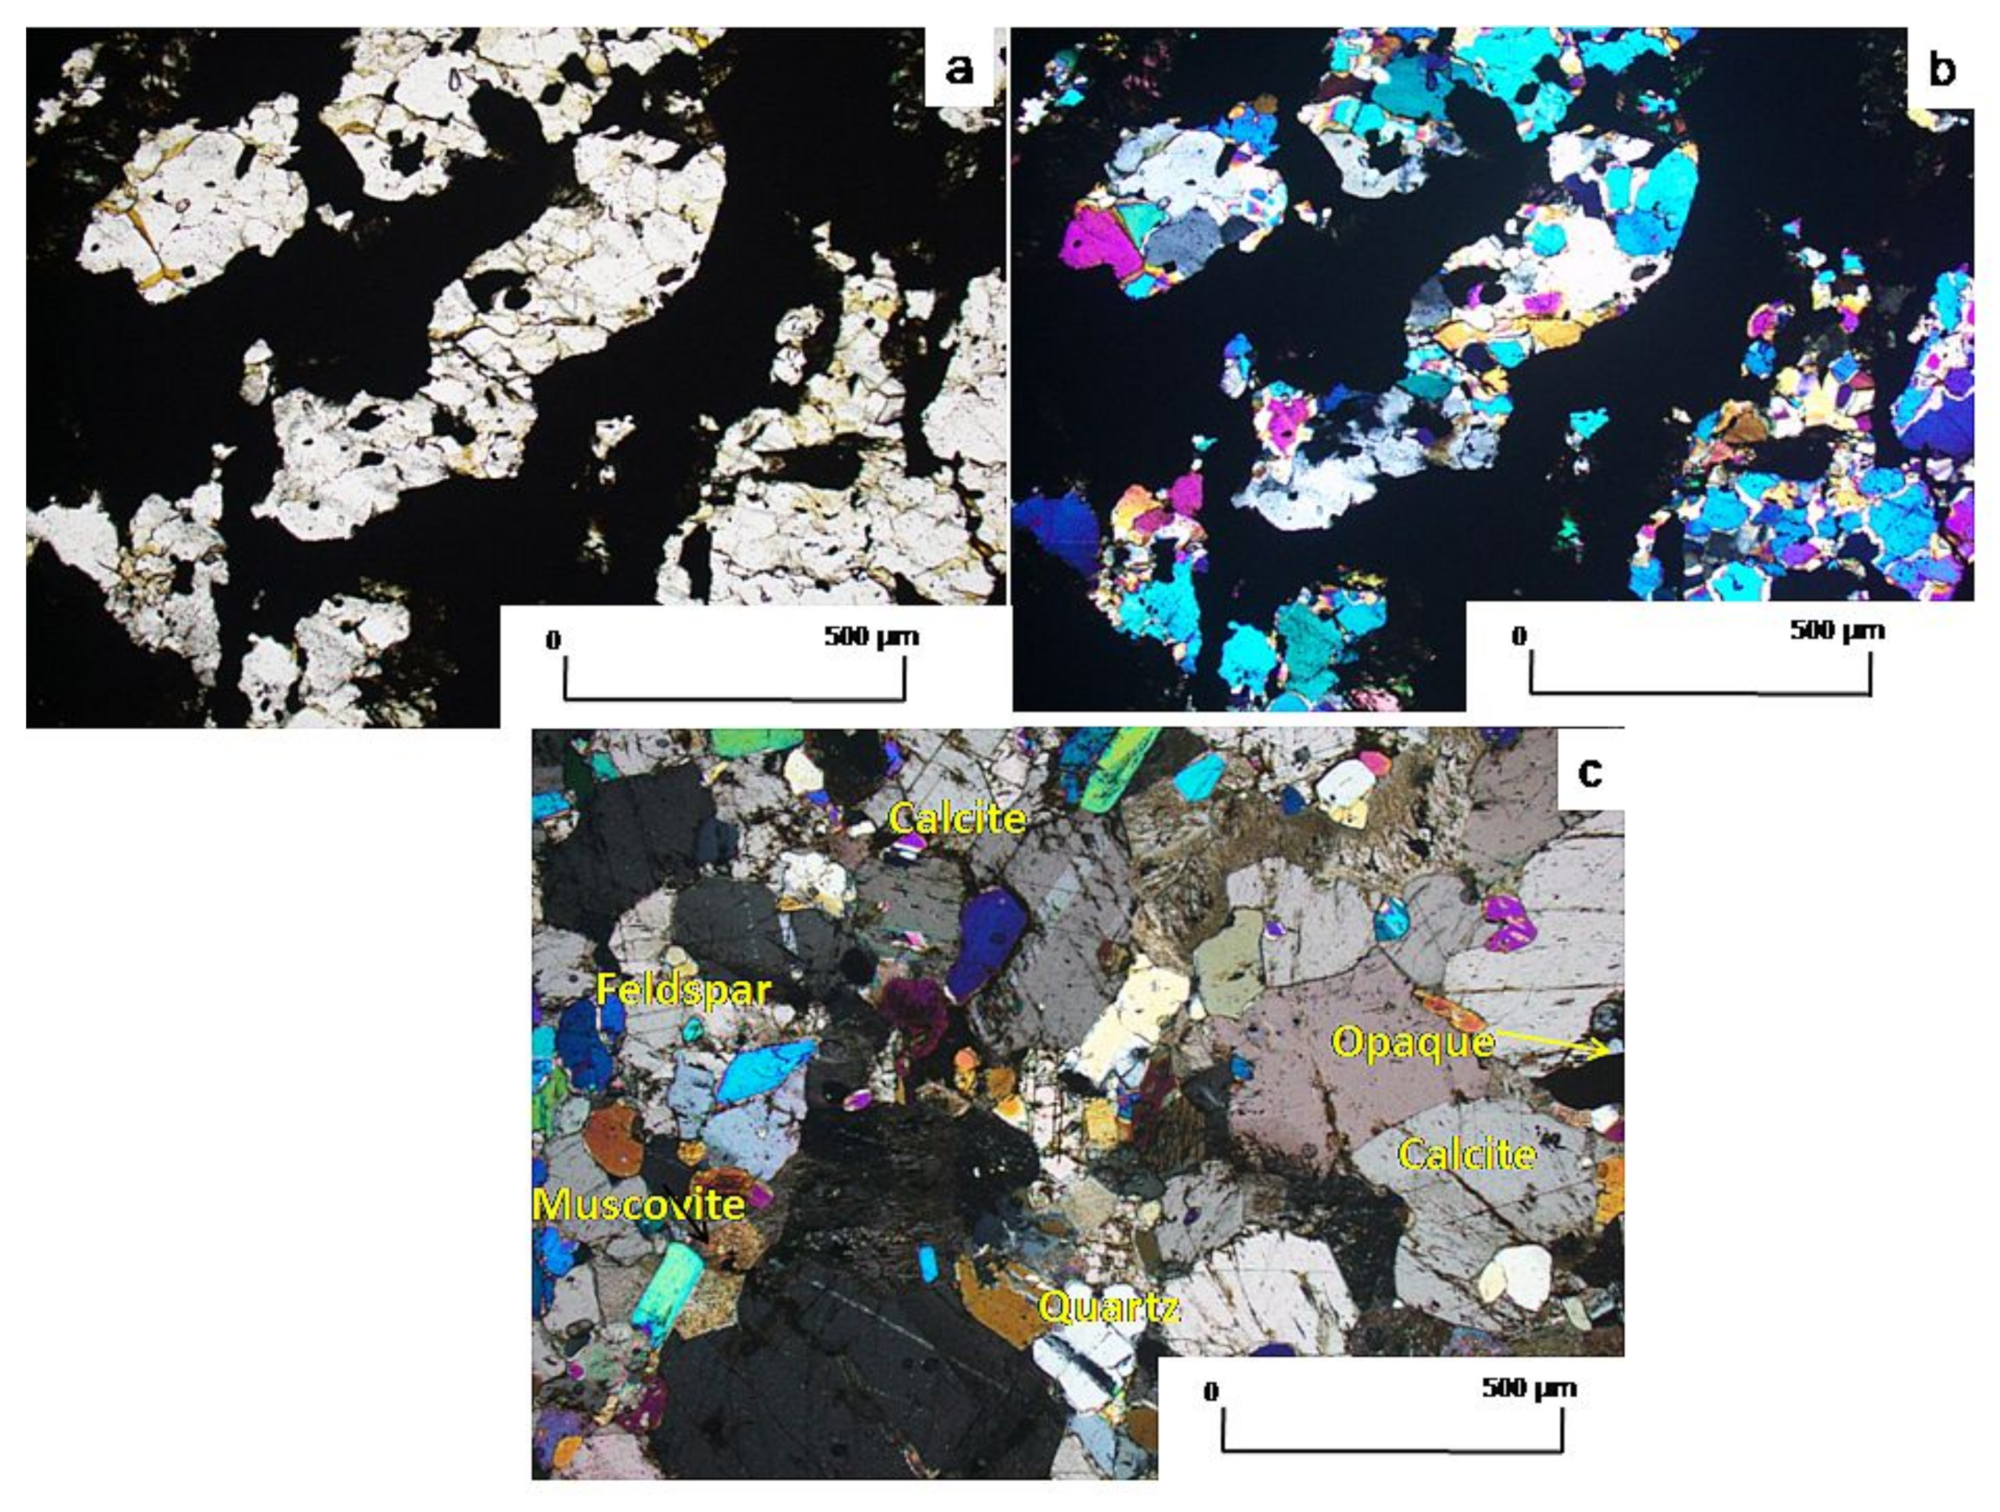
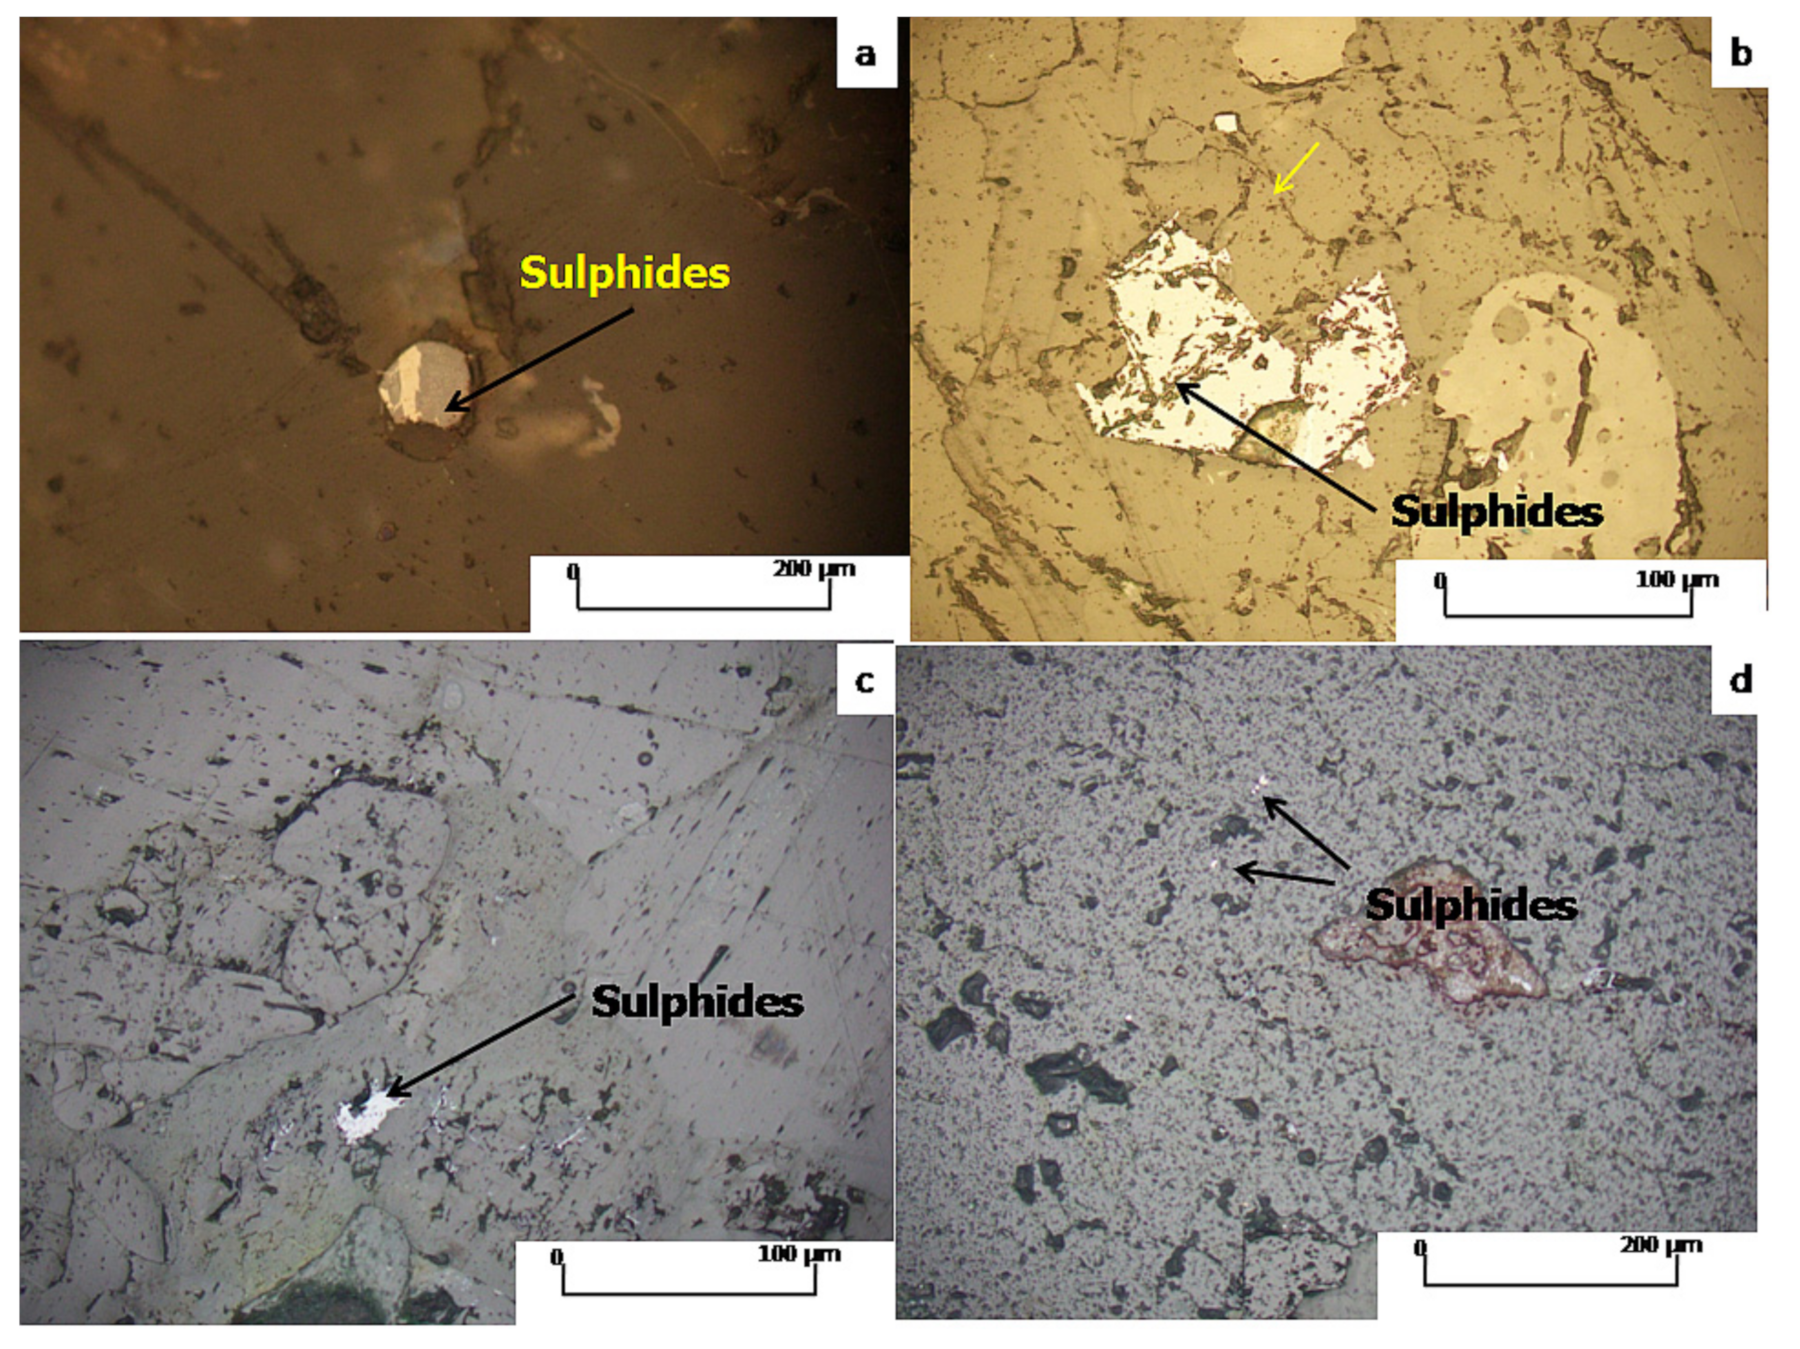
4.4. Results of XRF and Petrographic Analysis
5. Discussion
6. Conclusions
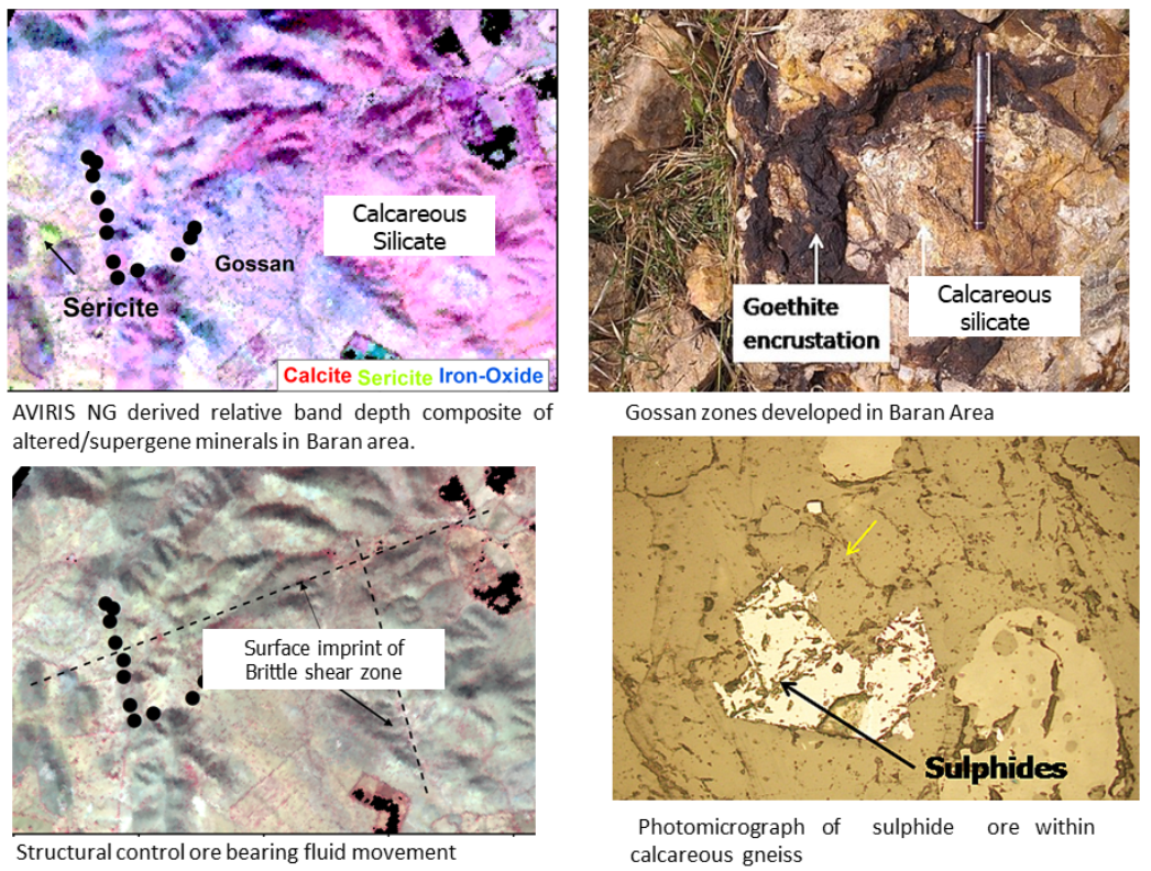
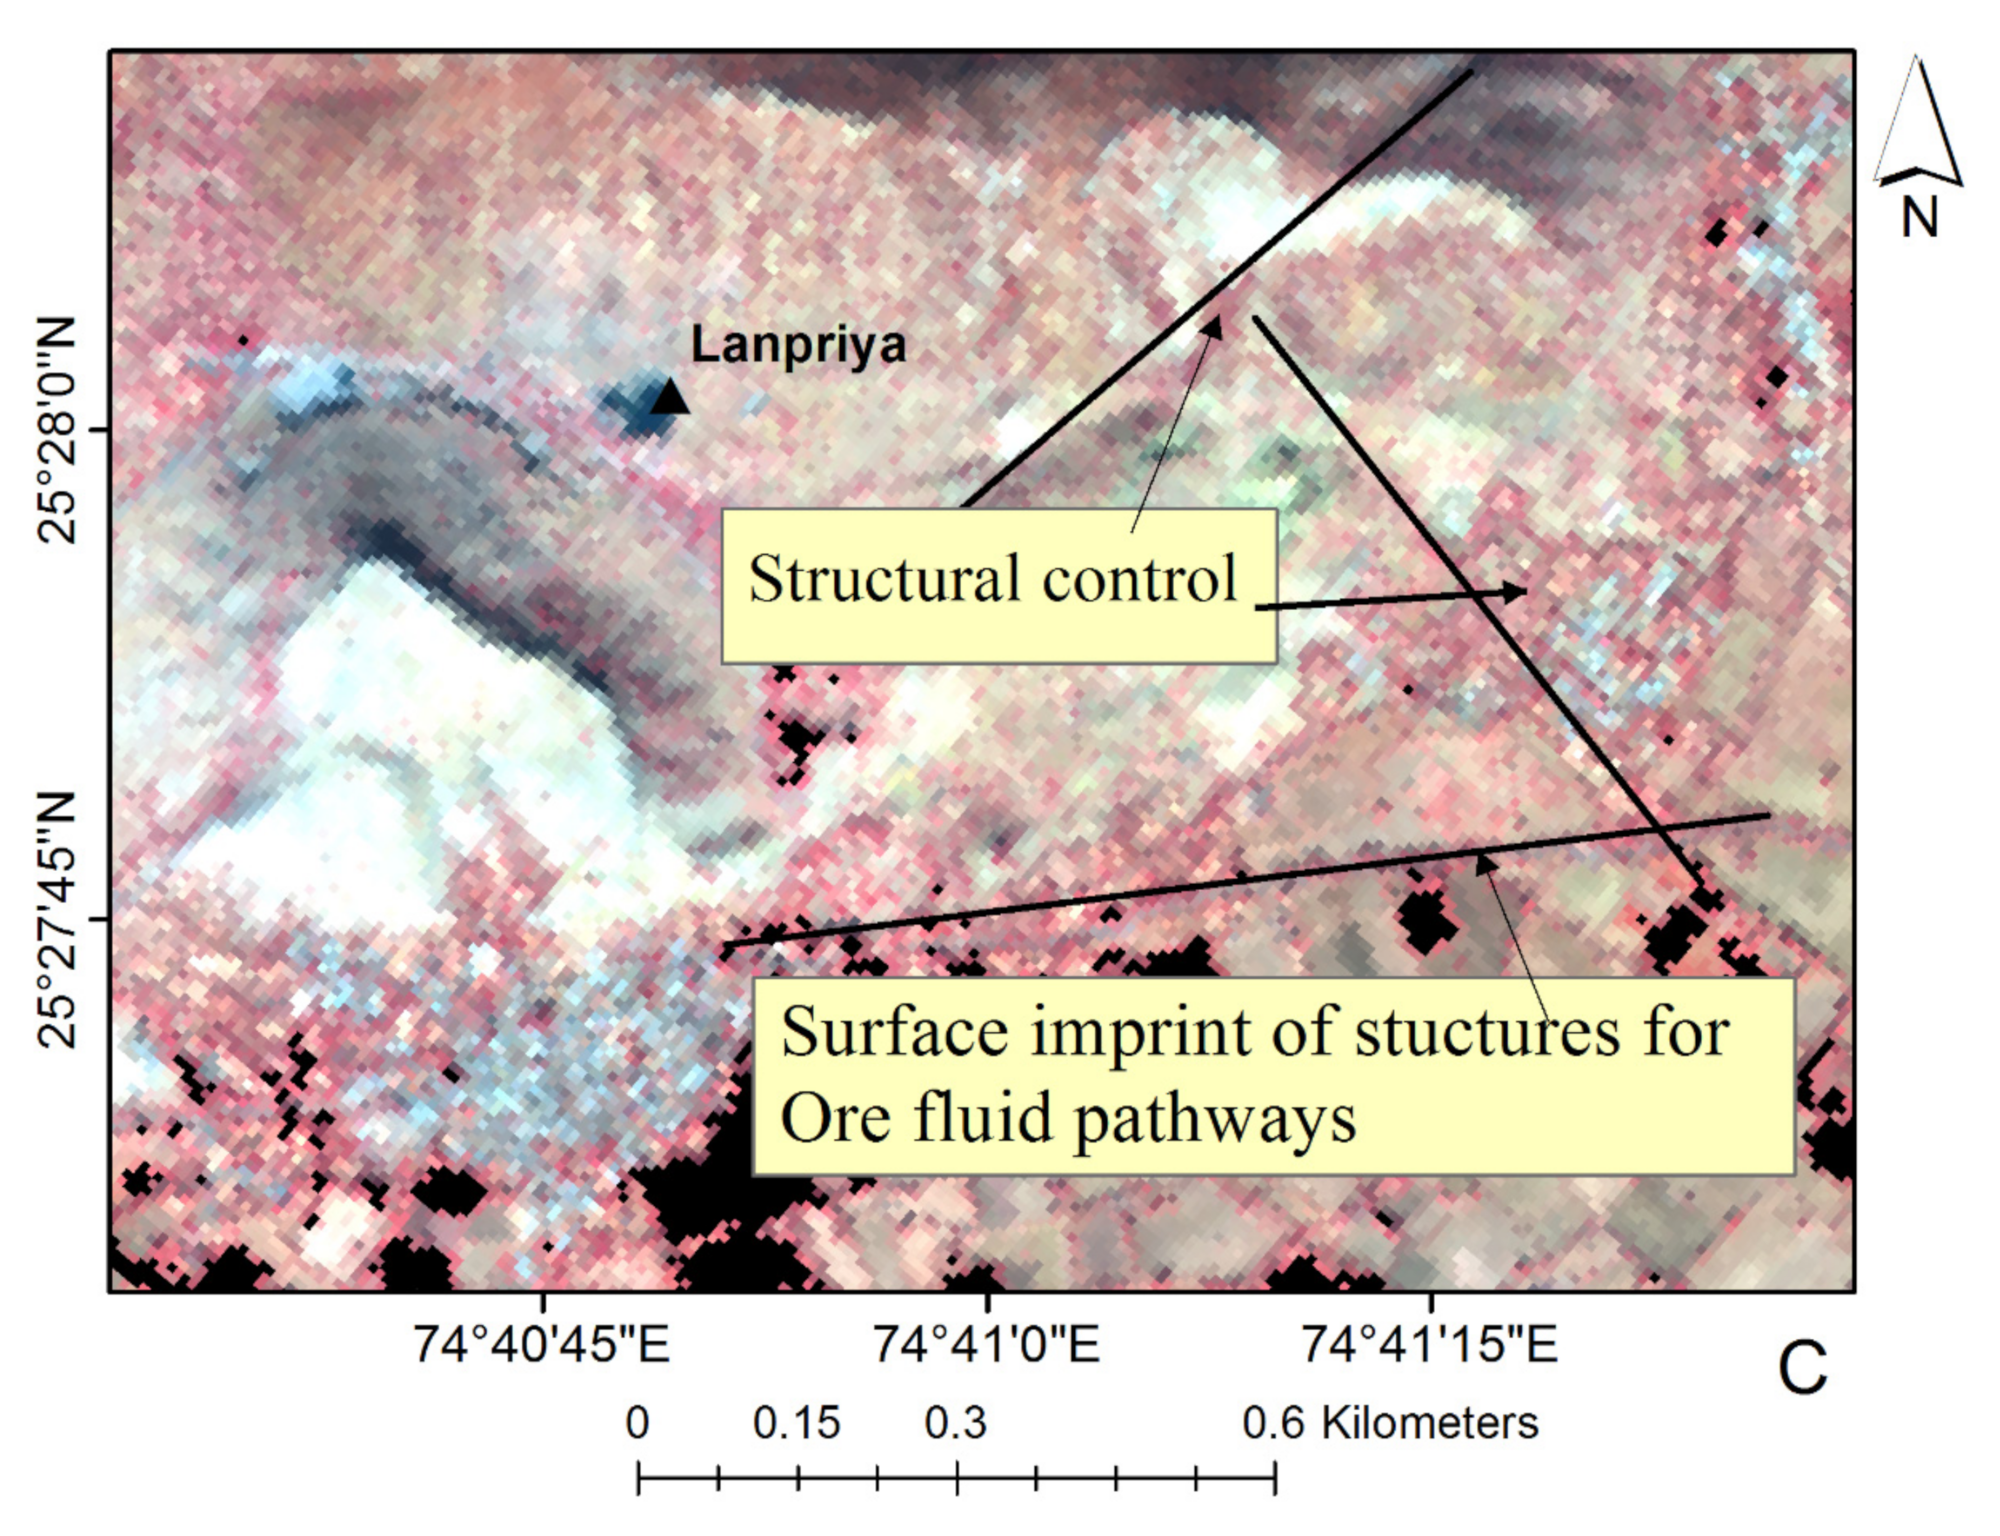
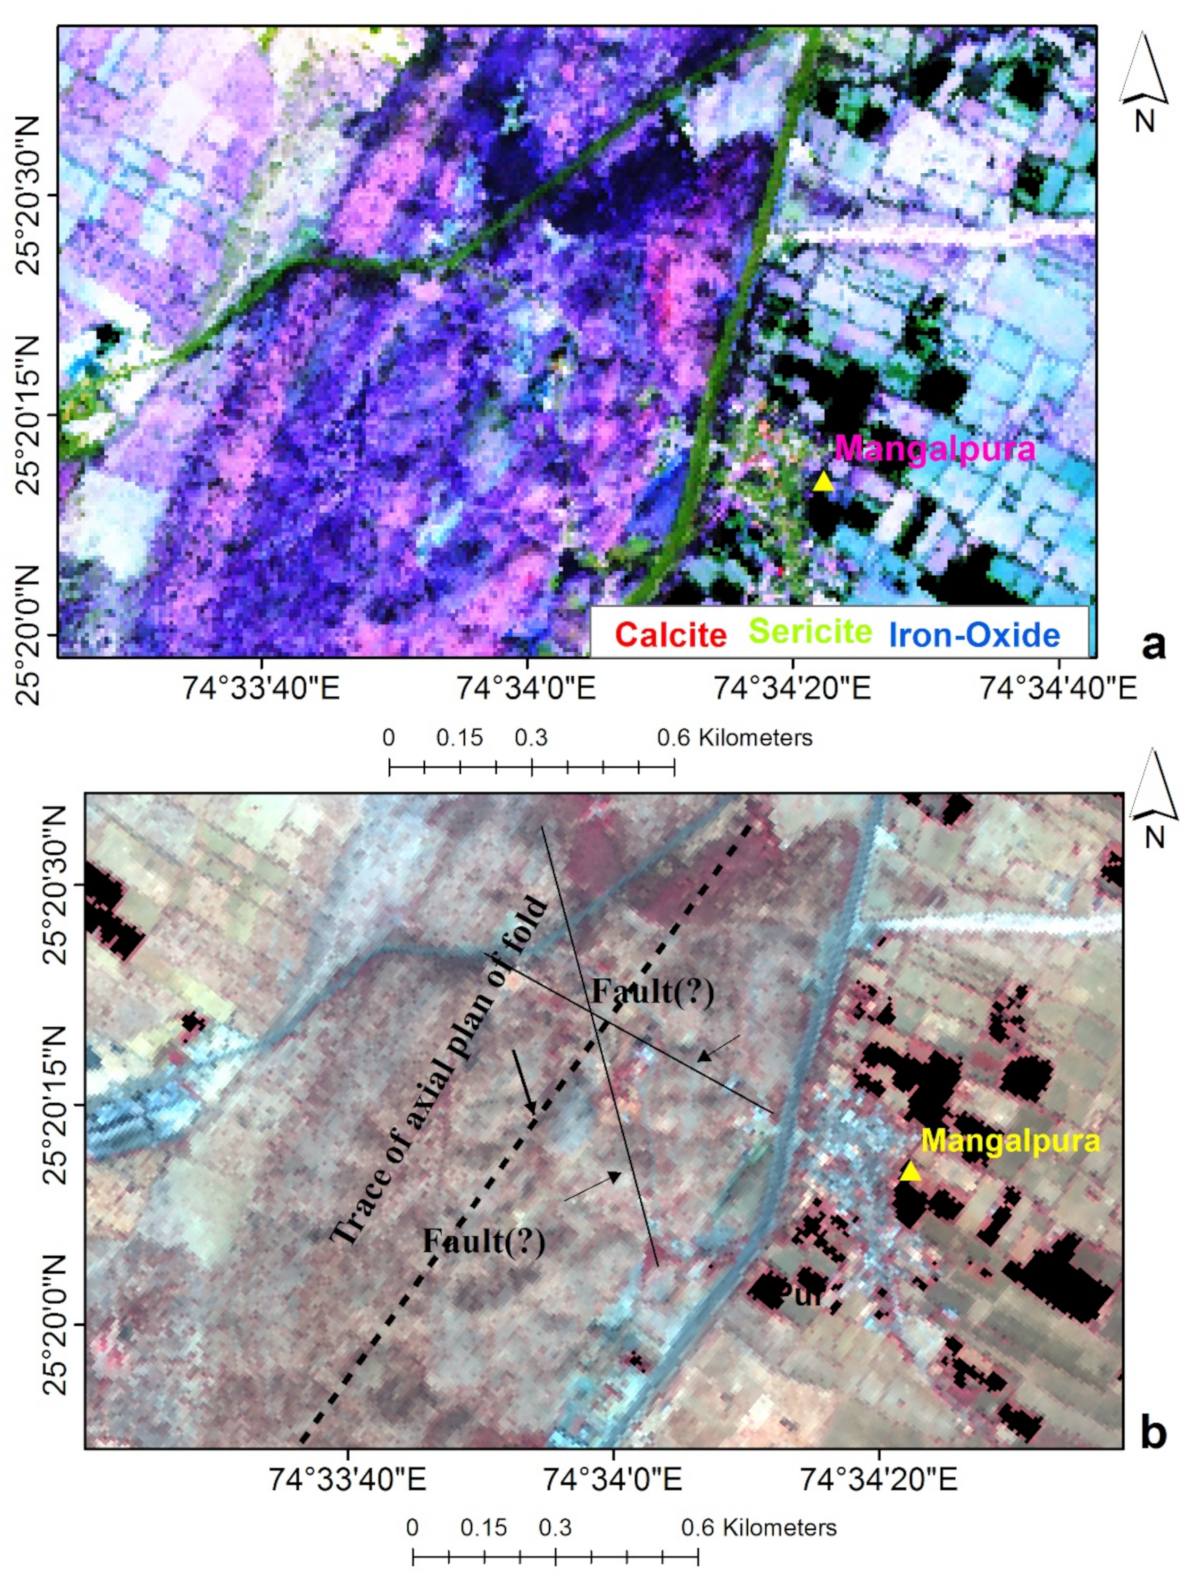
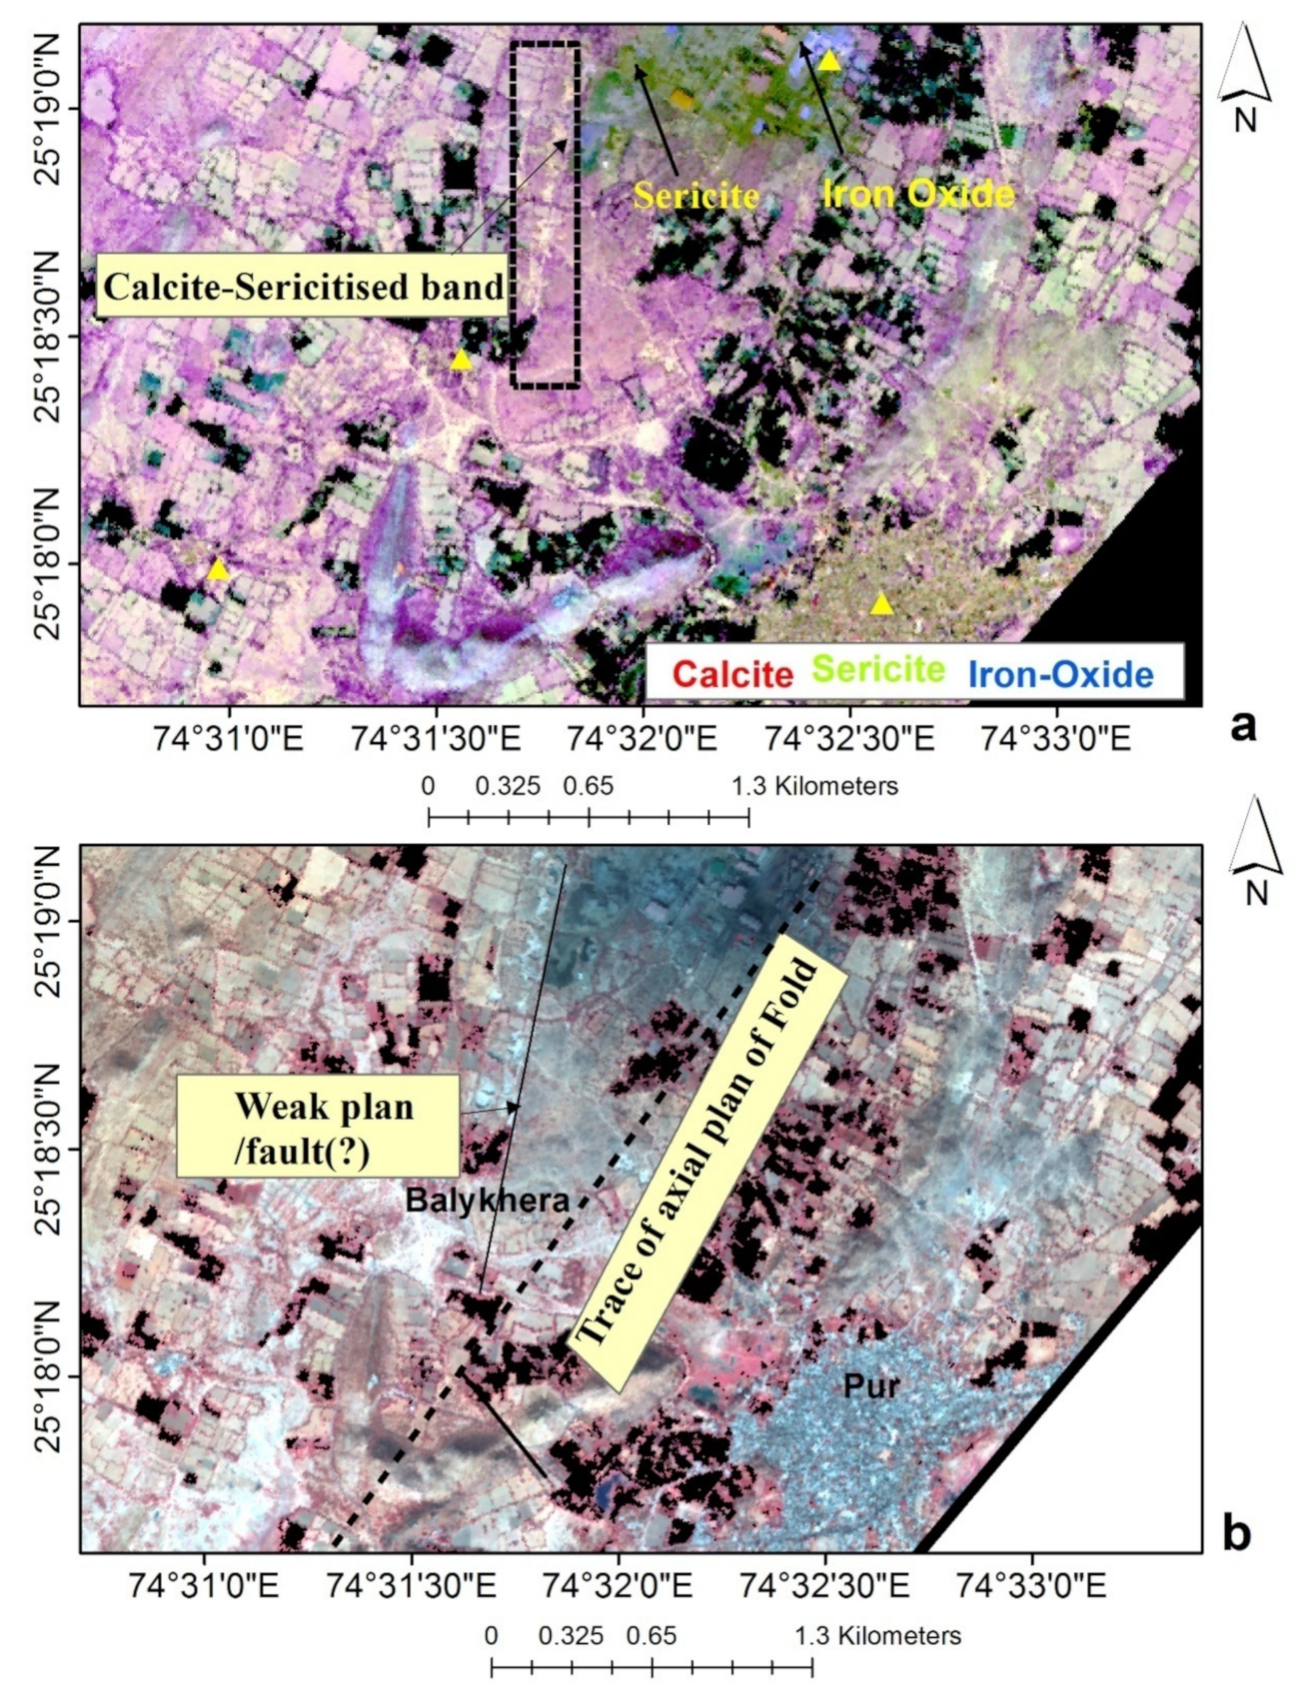
- The identified spectral anomalies in a 1:10000 scale would provide a valuable exploration guide to explore discrete mineralized areas, which are extended along a structure trending NW-SE direction. These isolated, patchy surface proxies are importantfor detecting the localized enrichment of metals.
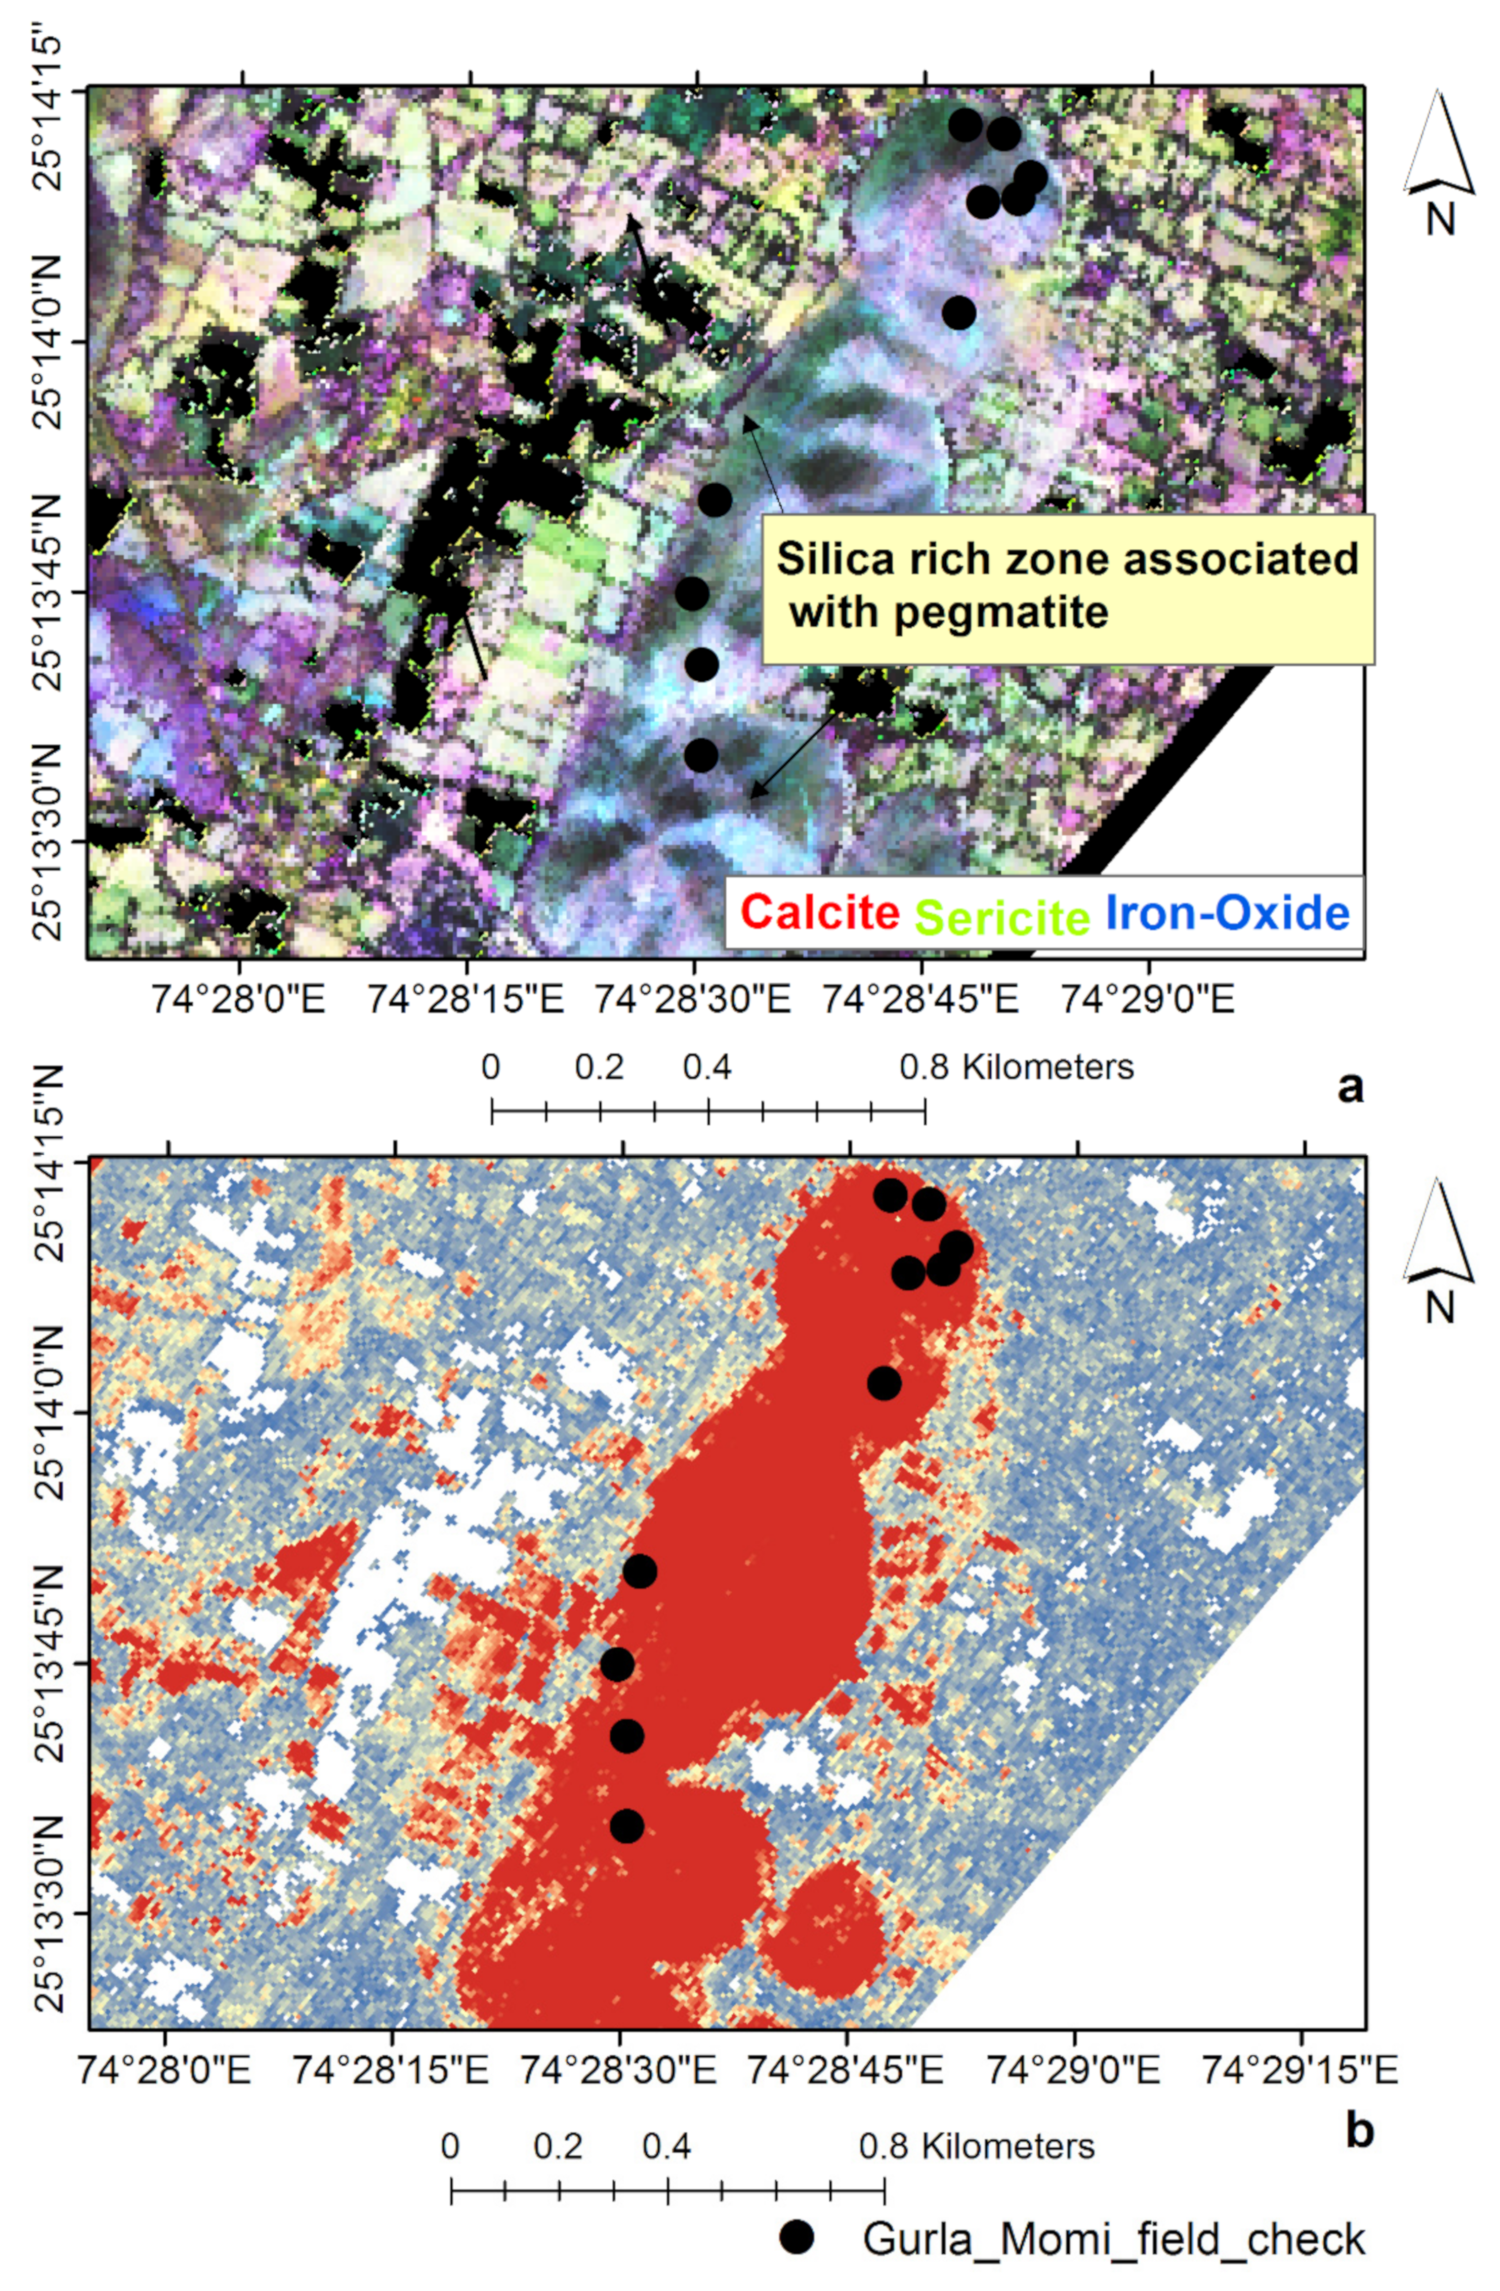
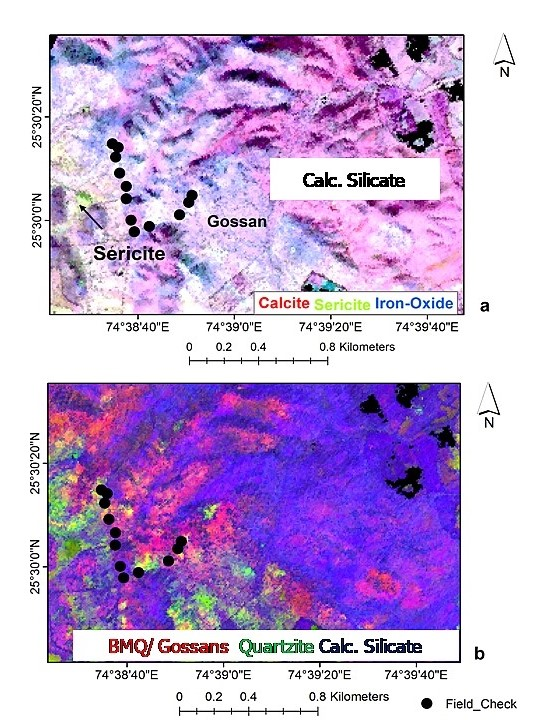
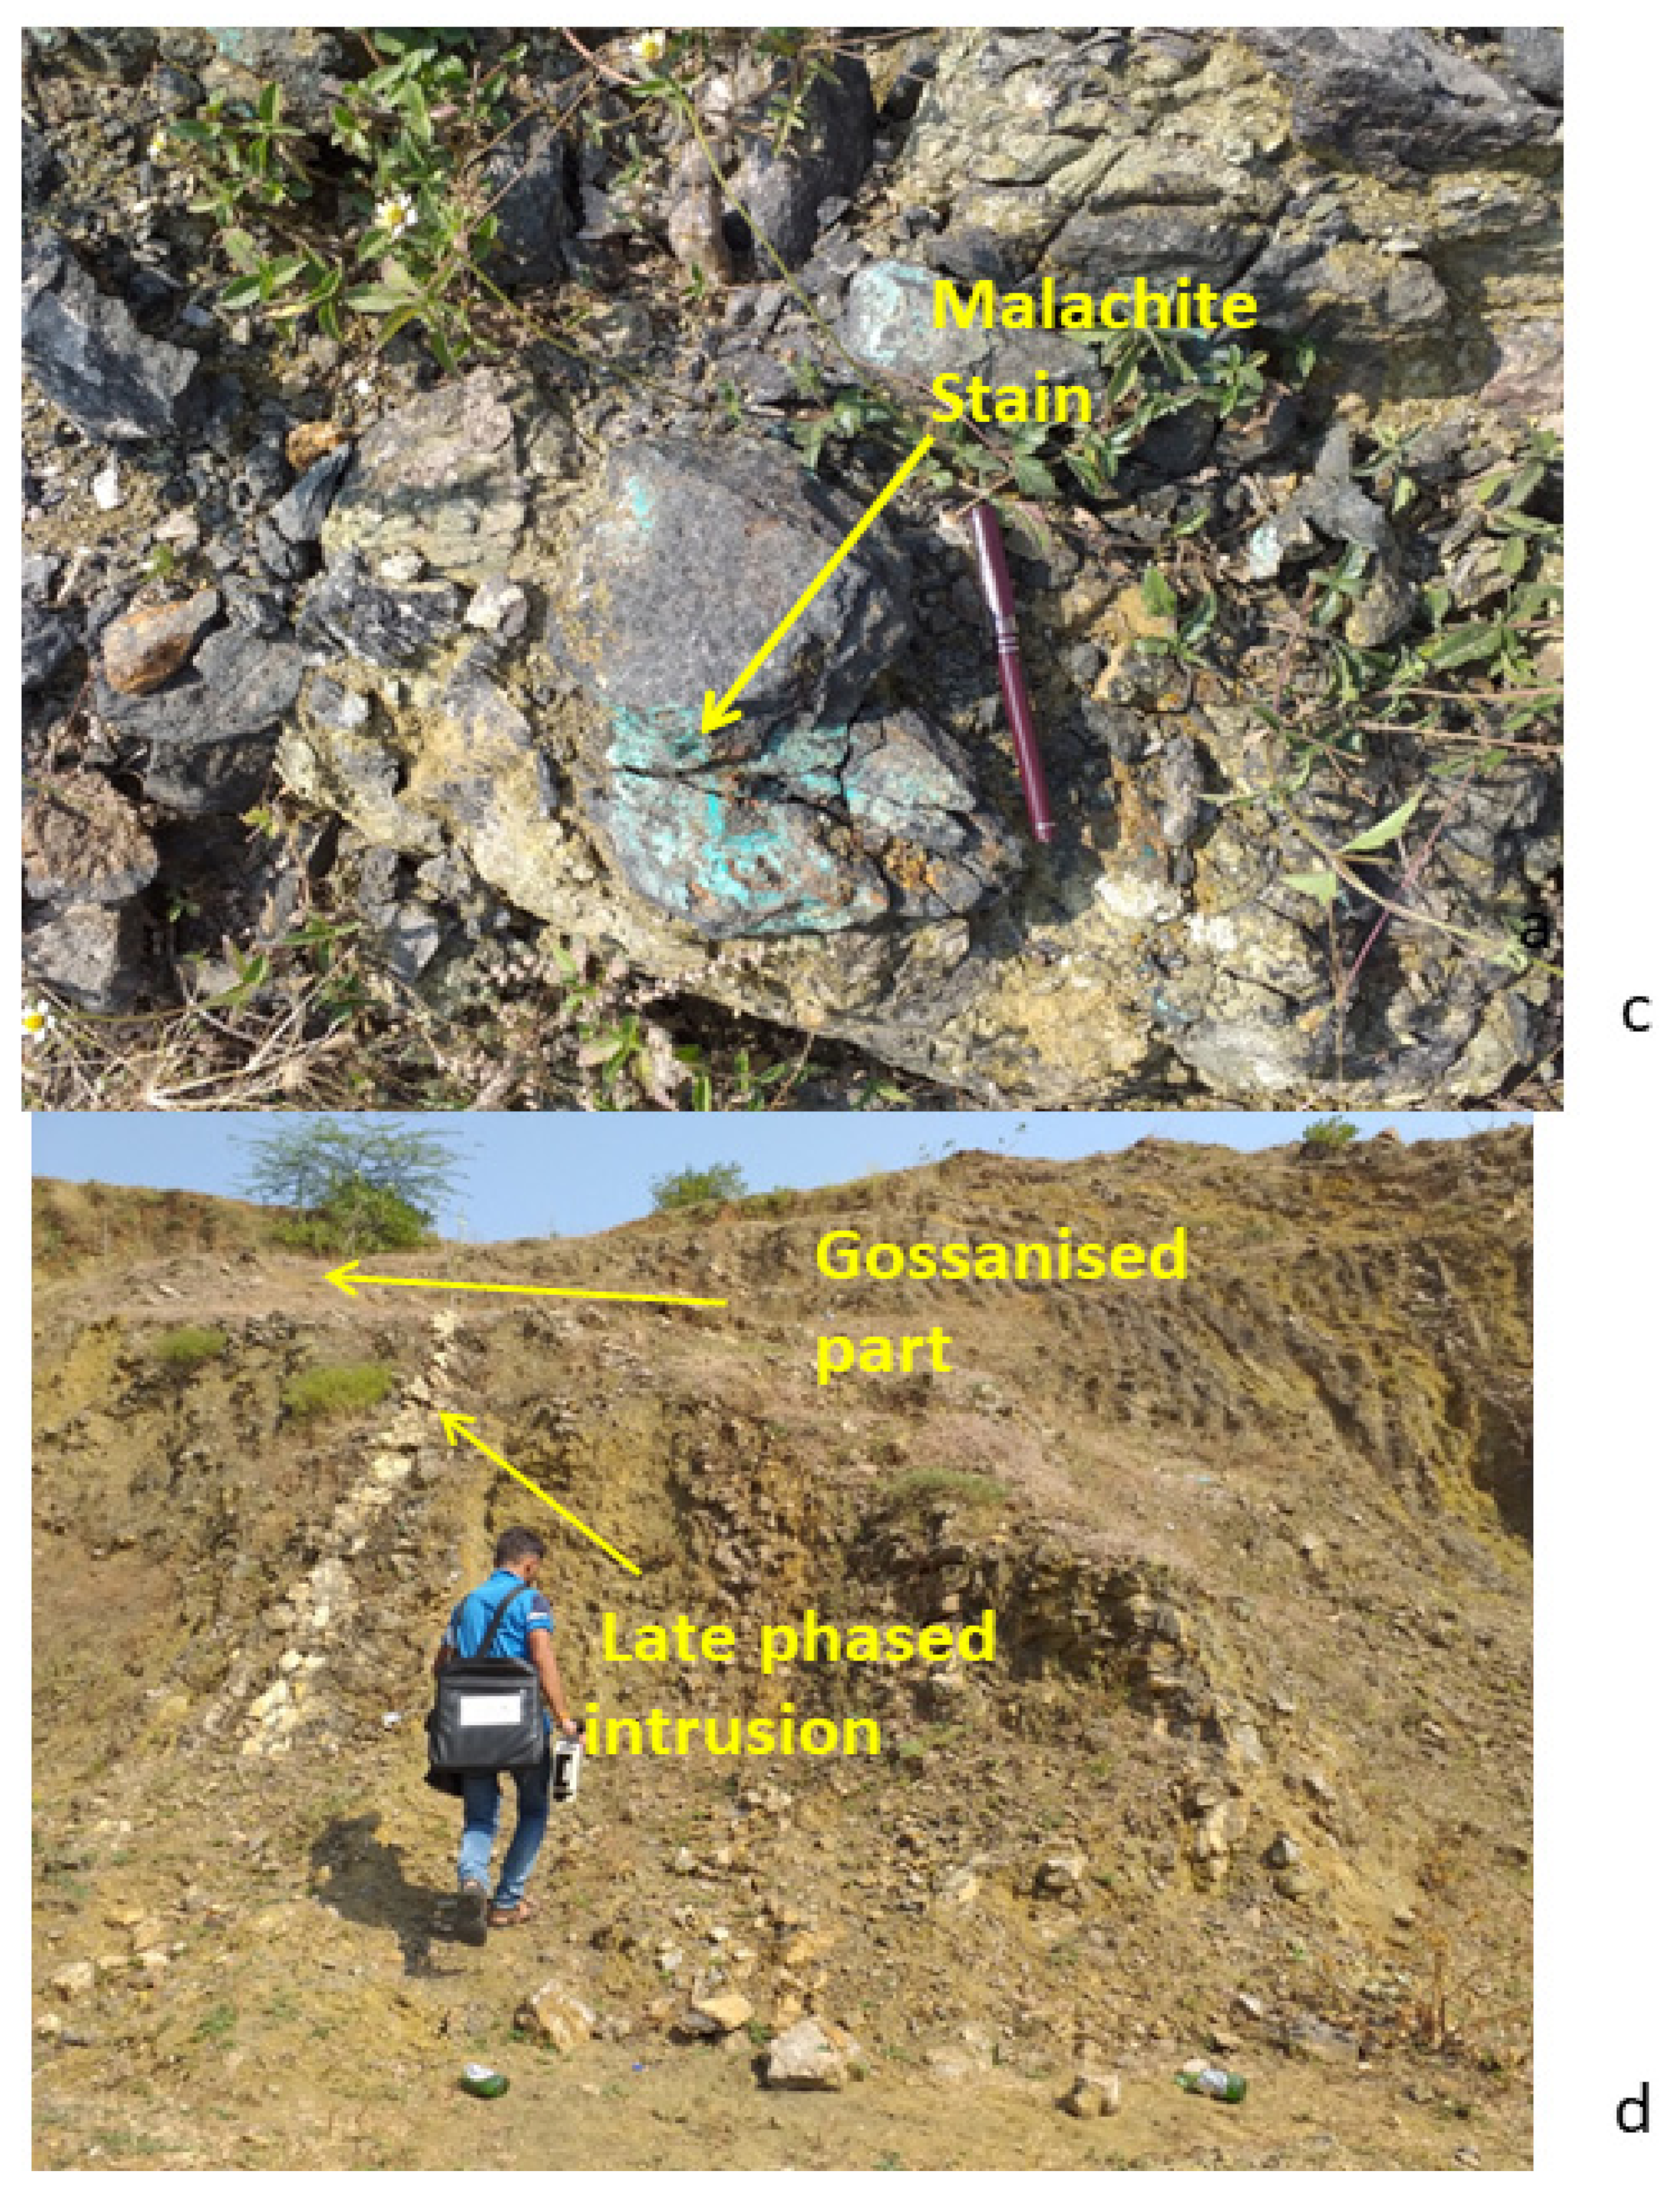
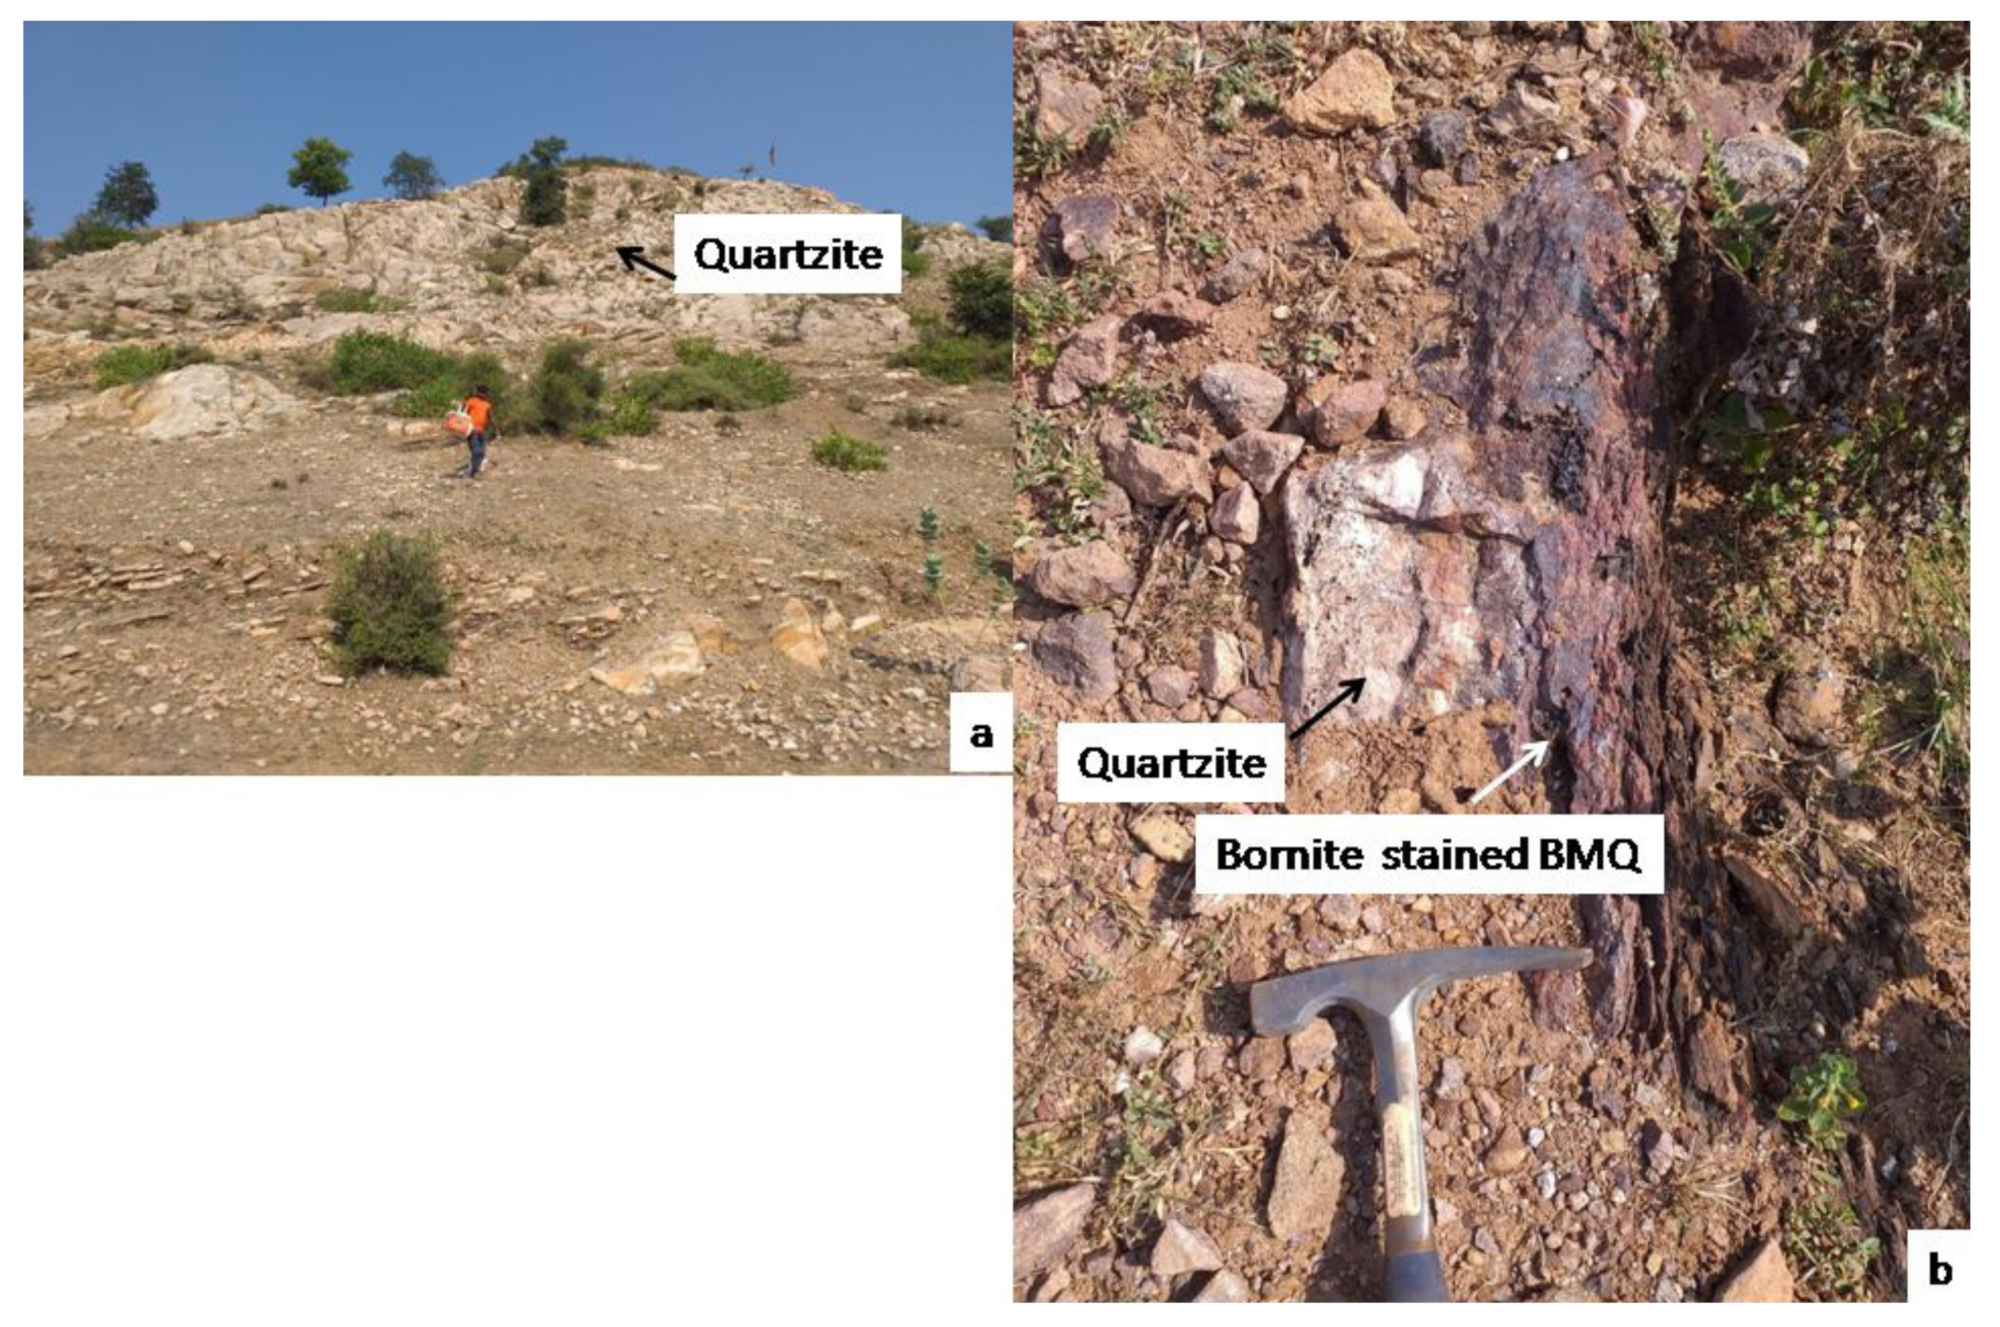
- Conjugate use of MRSFF image productsfor delineating rock types and RBD image products for identifying surface mineralizationproved suitable to establish the relation between rock types and associated surface proxies of mineralization. For example, Gossans are formed above the calcareous silicates and quartzite, whereas serictization and carbonation are prominent over BMQ and quartzite.
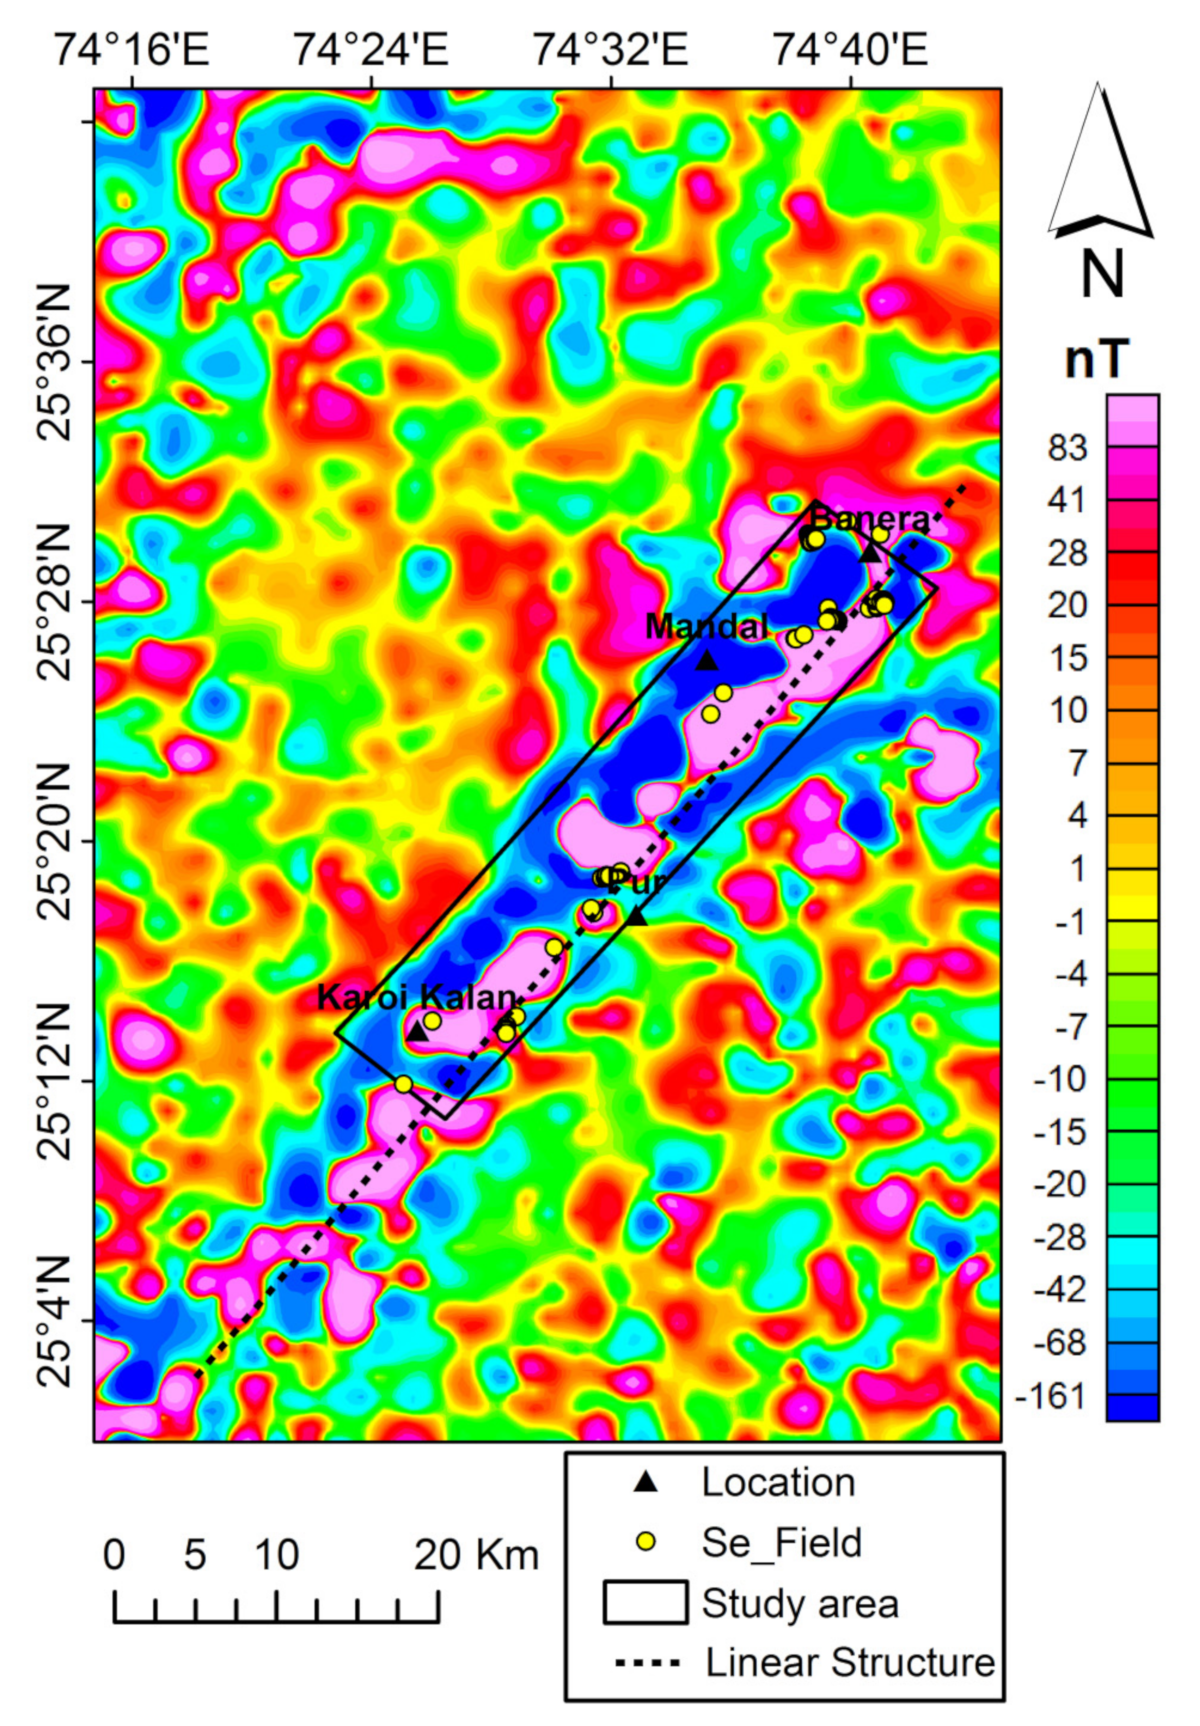
- Some ofthe surface mineral proxies had high XRF values indicative ofpromising high metal concentration. The spatial alignment of thesealteration zones or surface proxies along the structural fabricmakesthe occurrences of these surface proxies suitable for detailed exploration, as previous studies attributed the role of longitudinal structure in metal concentration in this area.
Author Contributions
Funding
Data Availability Statement
Acknowledgments
Conflicts of Interest
References
- Guha, A.; Chatterjee, S.; Ooman, T.; Kumar, K.V. Synergistic use of ASTER, L-band ALOS PALSAR and hyperspectral AVIRIS-NG data for geoexploration of lode type gold deposit—A study in HuttiMaski Schist Belt, India. Ore Geol. Rev. 2020, in press. [Google Scholar] [CrossRef]
- Guha, A.; Mondal, S.; Chatterjee, S.; Kumar, K.V. Airborne imaging spectroscopy of igneous layered complex and their mapping using different spectral enhancement conjugated support vector machine models. Geocarto Int. 2020, 1–17. [Google Scholar] [CrossRef]
- Bhattacharya, S.; Kumar, H.; Guha, A.; Dagar, A.K.; Pathak, S.; Pasricha, K.R.; Mondal, S.; Kumar, K.V.; Farrand, W.; Chatterjee, S.; et al. Potential of airborne hyperspectral data for geo-exploration over parts of different geological/metallogenic provinces in India based on AVIRIS-NG observations. Curr. Sci. 2019, 116, 1143–1156. [Google Scholar] [CrossRef]
- Kumar, C.; Chatterjee, S.; Oommen, T. Mapping hydrothermal alteration minerals using high-resolution AVIRIS-NG hyperspectral data in the Hutti-Maski gold deposit area, India. Int. J. Remote Sens. 2020, 41, 794–812. [Google Scholar] [CrossRef]
- Rani, K.; Guha, A.; Kumar, K.V.; Bhattacharya, B.K.; Pradeep, B. Potential use of airborne hyperspectral AVIRIS-NG data for mapping proterozoicmetasediments in Banswara, India. J. Geol. Soc. India 2020, 95, 152–158. [Google Scholar] [CrossRef]
- Bhattacharya, B.K.; Green, R.O.; Rao, S.; Saxena, M.; Sharma, S.; Kumar, K.A.; Srinivasulu, P.; Sharma, S.; Dhar, D.; Bandyopadhyay, S.; et al. An overview of AVIRIS-NG airborne hyperspectral science campaign over India. Curr. Sci. 2019, 116, 1082–1088. [Google Scholar] [CrossRef]
- Rockwell, B.W. Comparison of ASTER- and AVIRIS-Derived Mineral and Vegetation Maps of the White Horse Replacement Alunite Deposit and Surrounding Area, Marysvale Volcanic Field, Utah; Scientific Investigations Report 2009-5117; U.S. Geological Survey: Reston, VA, USA, 2009; 31p. [Google Scholar]
- Kruse, F.A.; Boardman, J.W.; Huntington, J.F. Comparison of airborne hyperspectral data and EO-1 Hyperion for mineral mapping. IEEE Trans. Geosci. Remote Sens. 2003, 41, 1388–1400. [Google Scholar] [CrossRef] [Green Version]
- Kruse, F.A. Mineral mapping with AVIRIS and EO-1 Hyperion. In Proceedings of the 12th JPL Airborne Geoscience Workshop, Pasadena, CA, USA, 12–16 January 1998; pp. 24–28. [Google Scholar]
- Sara, S.; Christian, M.; Christian, R. Mapping ultramafic complexes using airborne imaging spectroscopy and space-borne data in Arctic regions with abundant lichen cover, a case study from the Niaqornarssuit complex in South West Greenland. Eur. J. Remote Sens. 2020, 53, 156–175. [Google Scholar]
- Kumar, C.; Chatterjee, S.; Oommen, T.; Guha, A. Automated lithological mapping by integrating spectral enhancement techniques and machine learning algorithms using AVIRIS-NG hyperspectral data in Gold-bearing granite-greenstone rocks in Hutti, India. Int. J. Appl. Earth Obs. Geoinf. 2020, 86, 102006. [Google Scholar] [CrossRef]
- Sekandari, M.; Masoumi, I.; Pour, A.B.; Muslim, A.M.; Hossain, M.S.; Misra, A. ASTER and WorldView-3 satellite data for mapping lithology and alteration minerals associated with Pb-Zn mineralization. Geocarto Int. 2020, 1–31. [Google Scholar] [CrossRef]
- Vedas. 2021. Available online: https://vedas.sac.gov.in/aviris_web/ (accessed on 24 February 2020).
- Govil, H.; Gill, N.; Rajendran, S.; Santosh, M.; Kumar, S. Identification of new base metal mineralization in Kumaon Himalaya, India, using hyperspectral remote sensing and hydrothermal alteration. Ore Geol. Rev. 2018, 92, 271–283. [Google Scholar] [CrossRef]
- Mielke, C.; Muedi, T.; Papenfuß, A.; Boesche, N.K.; Rogass, C.; Gauert, C.D.K.; Altenberger, U.; de Wit, M.J. Multi-and hyperspectral spaceborne remote sensing of the Aggeneys base metal sulphide mineral deposit sites in the Lower Orange River region, South Africa. S. Afr. J. Geol. 2016, 119, 63–76. [Google Scholar] [CrossRef]
- Zabcic, N.; Rivard, B.; Ong, C.; Mueller, A. Using airborne hyperspectral data to characterize the surface pH and mineralogy of pyrite mine tailings. Int. J. Appl. Earth Obs. Geoinf. 2014, 32, 152–162. [Google Scholar] [CrossRef]
- Thornber, M.; Wildman, J. Supergene alteration of sulphides, VI. The binding of Cu, Ni, Zn, Co and Pb with gossan (iron-bearing) minerals. Chem. Geol. 1984, 44, 399–434. [Google Scholar] [CrossRef]
- Suárez, S.; Prichard, H.M.; Velasco, F.; Fisher, P.C.; McDonald, I. Alteration of platinum-group minerals and dispersion of platinum-group elements during progressive weathering of the Aguablanca Ni-Cu deposit, SW Spain. Miner. Depos. 2010, 45, 331–350. [Google Scholar] [CrossRef]
- Zhao, X.F.; Zhou, M.F. Fe-Cu deposits in the Kangdian region, SW China: A Proterozoic IOCG (iron-oxide-copper-gold) metallogenic province. Miner. Depos. 2011, 46, 731–747. [Google Scholar] [CrossRef]
- Bharktya, D.; Gupta, R. Regional tectonics and sulphide ore localisation in Delhi-Aravalli belt, Rajasthan, India—Use of LANDSAT imagery. Adv. Space Res. 1981, 1, 299–302. [Google Scholar] [CrossRef]
- Basu, K.K. Base metal mineralisation along the Pur-Banera belt, Bhilwara district, Rajasthan. Misc. Publ. Geol. Surv. India 1971, 16, 153–159. [Google Scholar]
- D’Souza, J.; Prabhakar, N.; Xu, Y.; Sharma, K.K.; Sheth, H. Mesoarchaean to Neoproterozoic (3.2–0.8 Ga) crustal growth and reworking in the Aravalli Craton, northwestern India: Insights from the Pur-Banera supracrustal belt. Precambrian Res. 2019, 332, 105383. [Google Scholar] [CrossRef]
- Shaji, T.S.; Desapati, T.; Fahmi, S.; Yadav, G.S.; Pande, A.K. Occurrence of uraninite and brannerite in the Samarkiya area, Bhilwara district, Rajasthan. Curr. Sci. 2007, 92, 592–594. [Google Scholar]
- Deb, M.; Sarkar, S. Proterozoic tectonic evolution and metallogenesis in the Aravalli-Delhi orogenic complex, northwestern India. Precambrian Res. 1990, 46, 115–137. [Google Scholar] [CrossRef]
- Banerjee, P.K.; Ghosh, S. Copper, lead and zinc. Rec. Geol. Surv. India 1972, 102, 41–50. [Google Scholar]
- GSI. Geology and Mineral Resources of Rajasthan, 3rd ed.; No. 30, Part 12; Miscellaneous Publication: Albuquerque, NM, USA, 2011. [Google Scholar]
- Bue, B.D.; Thompson, D.R.; Eastwood, M.; Green, R.O.; Gao, B.-C.; Keymeulen, D.; Sarture, C.M.; Mazer, A.S.; Luong, H.H. Real-time atmospheric correction of AVIRIS-NG imagery. IEEE Trans. Geosci. Remote Sens. 2015, 53, 6419–6428. [Google Scholar] [CrossRef]
- Guha, A.; Chakraborty, D.; Ekka, A.B.; Pramanik, K.; Kumar, K.V.; Chatterjee, S.; Subramanium, S.; Rao, D.A. Spectroscopic study of rocks of Hutti-Maski schist belt, Karnataka. J. Geol. Soc. India 2012, 79, 335–344. [Google Scholar] [CrossRef]
- Milton, E.J.; Schaepman, M.E.; Anderson, K.; Kneubahler, M.; Fox, N. Progress in field spectroscopy. Remote Sens. Environ. 2009, 113, 92–109. [Google Scholar] [CrossRef] [Green Version]
- Baldridge, A.M.; Hook, S.J.; Grove, C.I.; Rivera, G. The ASTER spectral library version 2.0. Remote Sens. Environ. 2009, 113, 711–715. [Google Scholar] [CrossRef]
- Biggar, S.F.; Labed, J.; Santer, R.P.; Slater, P.N.; Jackson, R.D.; Moran, M.S. Laboratory Calibration of Field Reflectance Panels. In Proceedings of the Recent Advances in Sensors, Radiometry, and Data Processing for Remote Sensing, Orlando, FL, USA, 6–8 April 1988; SPIE: Bellingham, WA, USA, 1988. [Google Scholar]
- Nicodemus, F.E. Reflectance nomenclature and directional reflectance and emissivity. Appl. Opt. 1970, 9, 1474–1475. [Google Scholar] [CrossRef]
- GSM. GSM-Proton Precision Magnetometer. 2021. Available online: http://www.gemsys.ca/pdf/GSM_19T.pdf (accessed on 12 January 2021).
- Pan Analytic. 2021. Available online: https://www.malvernpanalytical.com/ (accessed on 6 February 2021).
- Guha, A.; Rao, D.A.; Ravi, S.; Kumar, K.V.; Rao, E.D. Analysis of the potential of kimberlite rock spectra as spectral end member using samples from Narayanpet Kimberlite Field, Andhra Pradesh. Curr. Sci. 2012, 103, 1096–1104. [Google Scholar]
- Guha, A.; Kumar, K.V.; Porwal, A.; Rani, K.; Sahoo, K.; Kumar, S.A.; Singaraju, V.; Singh, R.; Khandelwal, M.; Raju, P.; et al. Reflectance spectroscopy and ASTER based mapping of rock-phosphate in parts of Paleoproterozoic sequences of Aravalli group of rocks, Rajasthan, India. Ore Geol. Rev. 2019, 108, 73–87. [Google Scholar] [CrossRef]
- Shanmugam, S.; Srinivasaperumal, P. Spectral matching approaches in hyperspectral image processing. Int. J. Remote Sens. 2014, 35, 8217–8251. [Google Scholar] [CrossRef]
- Clark, R.N.; Swayze, G.A.; Livo, K.E.; Kokaly, R.; Sutley, S.J.; Dalton, J.B.; McDougal, R.R.; Gent, C.A. Imaging spectroscopy: Earth and planetary remote sensing with the USGS Tetracorder and expert systems. J. Geophys. Res. Space Phys. 2003, 108, 1–44. [Google Scholar] [CrossRef]
- Clark, R.N. Spectroscopy of rocks and minerals, and principles of spectroscopy. In Manual of Remote Sensing: Remote Sensing for the Earth Sciences; John Wiley & Sons: New York, NY, USA, 1999; Volume 3, pp. 2–58. [Google Scholar]
- Guha, A.; Ghosh, B.; Chaudhury, S.; Rani, K.; Kumar, K.V. Spectral response of few important textural variants of chromitite and its potential in estimating relative grades of chromitite—A case study for chromitite of Nuggihalli Schist Belt, India. Curr. Sci. 2018, 114, 1721. [Google Scholar] [CrossRef]
- Smith, R.E.; Singh, B. Recognizing, in lateritic cover, detritus shed from the Archaean Gossan Hill Cu-Zn-Au volcanic-hosted massive sulphide deposit, Western Australia. Geochem. Explor. Environ. Anal. 2007, 7, 71–86. [Google Scholar] [CrossRef]
- Thébault, E.; Finlay, C.C.; Beggan, C.D.; Alken, P.; Aubert, J.; Barrois, O.; Bertrand, F.; Bondar, T.; Boness, A.; Brocco, L.; et al. International geomagnetic reference field: The 12th generation. Earth Planets Space 2015, 67, 79. [Google Scholar] [CrossRef]
- Baranov, V. A new method for interpretation of aeromagnetic maps: Pseudo-gravimetric anomalies. Geophysics 1957, 22, 359–382. [Google Scholar] [CrossRef]
- Roest, W.R.; Pilkington, M. Identifying remanent magnetization effect in magnetic data. Geophysics 1993, 58, 653–659. [Google Scholar] [CrossRef]
- Spector, A.; Grant, F.S. Statistical methods for interpreting aeromagnetic data. Geophysics 1970, 35, 293–302. [Google Scholar] [CrossRef]
- Roy, A.; Aina, A.O. Some new magnetic transformations. Geophys. Prospect. 1986, 34, 1219–1232. [Google Scholar] [CrossRef]
- Blakely, R.J. Potential Theory in Gravity and Magnetic Applications; Cambridge University Press Science: London, UK, 1995. [Google Scholar]
- Guo, L.; Meng, X.; Chen, Z.; Li, S.; Zheng, Y. Preferential filtering for gravity anomaly separation. Comput. Geosci. 2013, 51, 247–251. [Google Scholar] [CrossRef]
- Taggart, J.E., Jr.; Siems, D.F. Major Element Analysis by Wavelength Dispersive X-ray Fluorescence Spectrometry; U.S. Geological Survey Open-File Report 02-223-T; U.S. Geological Survey: Reston, VA, USA, 2002; pp. T1–T9. [Google Scholar]
- Taggart, J.E., Jr.; Lindsey, J.R.; Scott, B.A.; Vivit, D.V.; Bartel, A.J.; Stewart, K.C. Analysis of geologic materials by wavelength-dispersive X-ray fluorescence spectrometry. In Methods for Geochemical Analyses; Baedecker, P.A., Ed.; U.S. Geological Survey Professional Paper 1770; U.S. Geological Survey: Reston, VA, USA, 1987; pp. E1–E19. [Google Scholar]
- Longhi, I.; Sgavetti, M.; Chiari, R.; Mazzoli, C. Spectral analysis and classification of metamorphic rocks from laboratory reflectance spectra in the 0.4–2.5 μ m interval: A tool for hyperspectral data interpretation. Int. J. Remote Sens. 2001, 22, 3763–3782. [Google Scholar] [CrossRef]
- Kokaly, R.F.; Clark, R.N.; Swayze, G.A.; Livo, K.E.; Hoefen, T.M.; Pearson, N.C.; Wise, R.A.; Benzel, W.M.; Lowers, H.A.; Driscoll, R.L.; et al. USGS Spectral Library Version 7: Data Series 1035; U.S. Geological Survey: Reston, VA, USA, 2017; p. 61. [Google Scholar]
- Crowley, J.K.; Brickey, D.W.; Rowan, L.C. Airborne imaging spectrometer data of the Ruby Mountains, Montana: Mineral discrimination using relative absorption band-depth images. Remote Sens. Environ. 1989, 29, 121–134. [Google Scholar] [CrossRef]
- Sugden, T.J.; Deb, M.; Windley, B.F. The tectonic setting of mineralisation in the Proterozoic Aravalli Delhi Orogenic belt, NW India. Dev. Precambrian Geol. 1990, 8, 367–390. [Google Scholar]
- Zhai, D.-G.; Liu, J.-J.; Wang, J.-P.; Yao, M.-J.; Wu, S.-H.; Fu, C.; Liu, Z.-J.; Wang, S.-G.; Li, Y.-X. Fluid evolution of the Jiawula Ag-Pb-Zn deposit, Inner Mongolia: Mineralogical, fluid inclusion, and stable isotopic evidence. Int. Geol. Rev. 2013, 55, 204–224. [Google Scholar] [CrossRef]
- Holland, H.D. Granites, solutions, and base metal deposits. Econ. Geol. 1972, 67, 281–301. [Google Scholar] [CrossRef]
- Porwal, A.; Carranza, E.J.M.; Hale, M. Tectonostratigraphy and base-metal mineralization controls, Aravalli province (Western India): New interpretations from geophysical data analysis. Ore Geol. Rev. 2006, 29, 287–306. [Google Scholar] [CrossRef]
- Yadav, S.; Porwal, A. Controls on SEDEX mineralization in the Aravalli-Delhi Fold Belt: Insights from integrated 3D geological and geophysical modelling. In Proceedings of the EGU General Assembly Conference, Vienna, Austria, 23–28 April 2017; Volume 19, p. 1529. [Google Scholar]
- Hood, P.J.; Holroyd, M.T.; McGrath, P.H. Magnetic methods applied to base metal exploration. In Geophysics and Geochemistry in the Search for Metallic Ores; Hood, P.J., Ed.; Geological Survey of Canada, Economic Geology: Montreal, Canada, 1979; pp. 77–104. [Google Scholar]
- Whiteley, R.J. (Ed.) Geophysical Case History of the Woodlawn Orebody; Pergamon Press: New South Wales, Australia, 1981; p. 588. [Google Scholar]
- Clark, D.; Tonkin, C. Magnetic anomalies due to pyrrhotite: Examples from the Cobar area, N.S.W., Australia. J. Appl. Geophys. 1994, 32, 11–32. [Google Scholar] [CrossRef]
- Kumar, K.S.; Begum, S.P.; Srinivas, G.S.; Rao, M.S.H.; Prasad, P.P.; Seshunarayna, T.; Tiwari, R.K. Spectral analysis of magnetic data in the Ajmer-Sambar Sector, North-Central Rajasthan. J. Geol. Soc. India. 2018, 92, 368–372. [Google Scholar] [CrossRef]


| S No. | Sensor | Spatial Resolution (m) | Band | Band/Wavelength (µm) |
|---|---|---|---|---|
| 1 | Airborne Visible/Infrared Imaging Spectrometer- Next generation (AVIRIS-NG) | 4 | 425 | 0.38−2.510 (spectral sampling: 5 nm) |
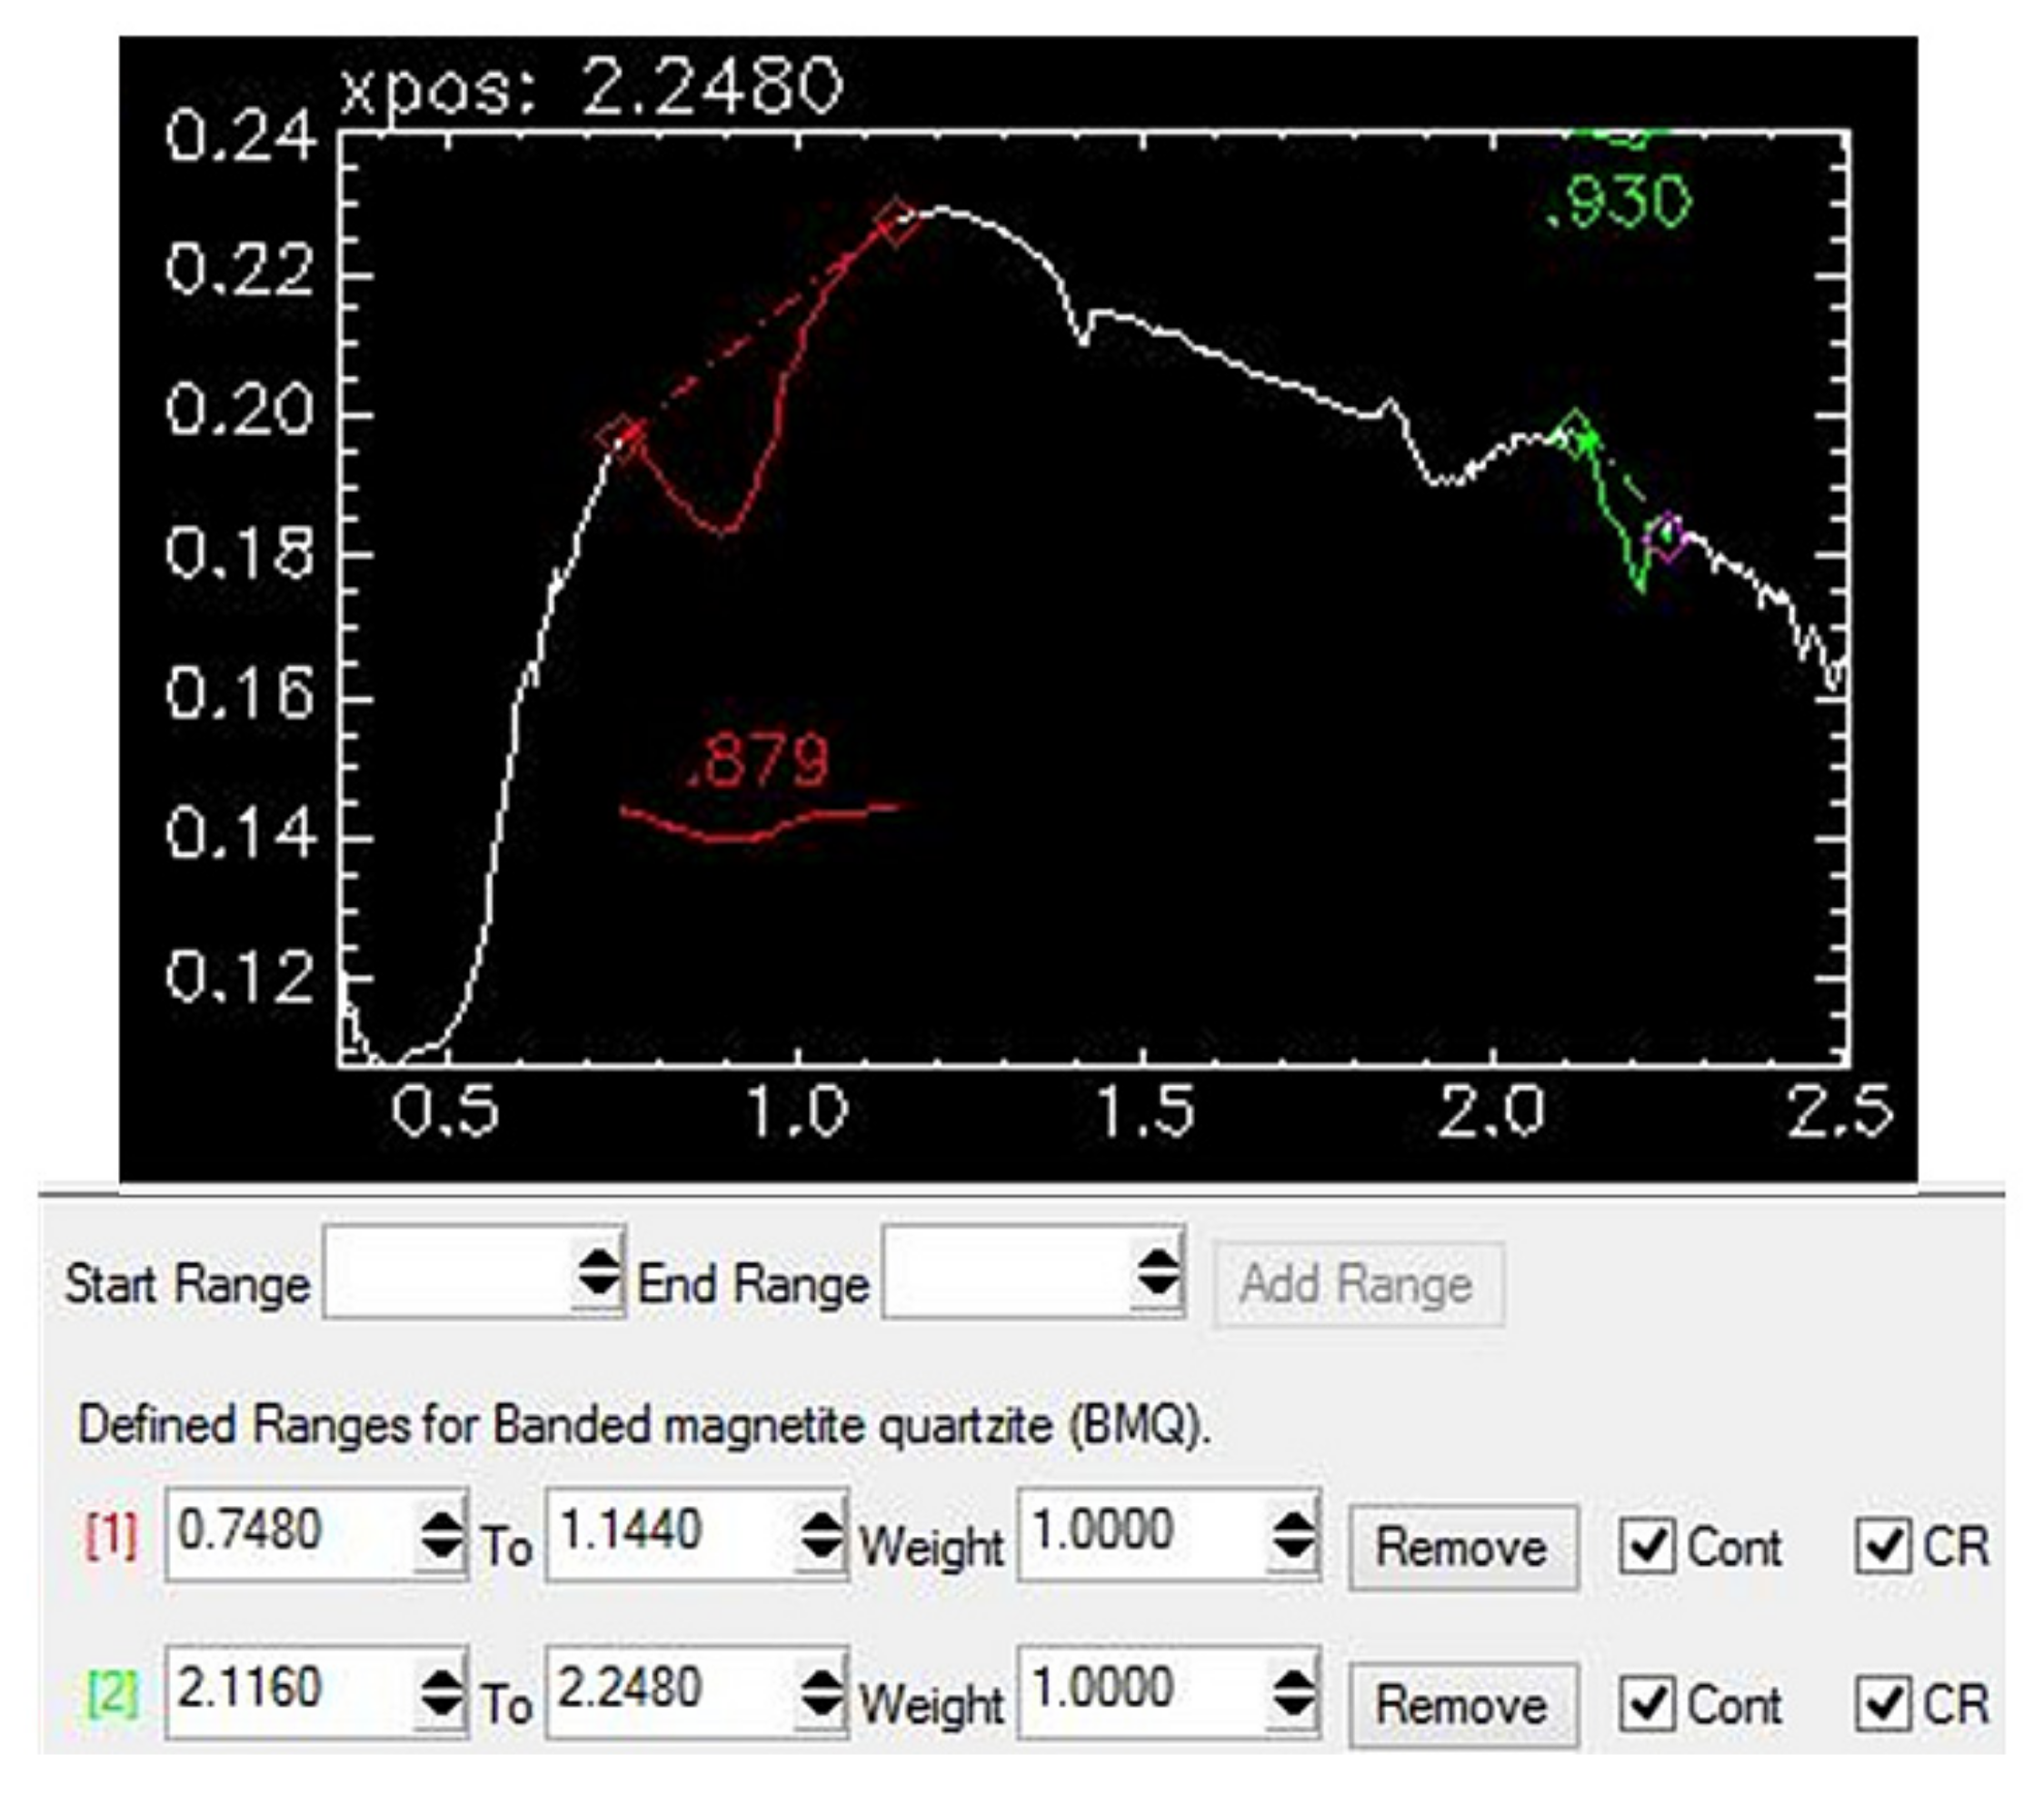
| S. No. | Mineral | Spectrometric Parameter | ||
|---|---|---|---|---|
| Wavelength of Shoulder 1 (nm) | Wavelength of Shoulder 2 (nm) | Wavelength of Abs-min (nm) | ||
| 1 | Calcite | 2184 | 2389 | 2339 |
| 3 | Illite/sericite | 2144 | 2284 | 2204 |
| 4 | Goethite | 767 | 1222 | 937 |
| Mean Values of XRF Anomalies for Base Metals (in ppm) | |||
|---|---|---|---|
| Study Area | Cu | Pb | Zn |
| Lanpriya | 6286 | 5623 | 2915 |
| Gurla-Momi | 2623 | 12 | 11 |
| Mangalpura | 8438 | 7 | 22 |
| AV 234 | 346 | 685 | 3026 |
Publisher’s Note: MDPI stays neutral with regard to jurisdictional claims in published maps and institutional affiliations. |
© 2021 by the authors. Licensee MDPI, Basel, Switzerland. This article is an open access article distributed under the terms and conditions of the Creative Commons Attribution (CC BY) license (https://creativecommons.org/licenses/by/4.0/).
Share and Cite
Guha, A.; Kumar Ghosh, U.; Sinha, J.; Pour, A.B.; Bhaisal, R.; Chatterjee, S.; Kumar Baranval, N.; Rani, N.; Kumar, K.V.; Rao, P.V.N. Potentials of Airborne Hyperspectral AVIRIS-NG Data in the Exploration of Base Metal Deposit—A Study in the Parts of Bhilwara, Rajasthan. Remote Sens. 2021, 13, 2101. https://doi.org/10.3390/rs13112101
Guha A, Kumar Ghosh U, Sinha J, Pour AB, Bhaisal R, Chatterjee S, Kumar Baranval N, Rani N, Kumar KV, Rao PVN. Potentials of Airborne Hyperspectral AVIRIS-NG Data in the Exploration of Base Metal Deposit—A Study in the Parts of Bhilwara, Rajasthan. Remote Sensing. 2021; 13(11):2101. https://doi.org/10.3390/rs13112101
Chicago/Turabian StyleGuha, Arindam, Uday Kumar Ghosh, Joyasree Sinha, Amin Beiranvand Pour, Ratnakar Bhaisal, Snehamoy Chatterjee, Nikhil Kumar Baranval, Nisha Rani, K. Vinod Kumar, and Pamaraju V. N. Rao. 2021. "Potentials of Airborne Hyperspectral AVIRIS-NG Data in the Exploration of Base Metal Deposit—A Study in the Parts of Bhilwara, Rajasthan" Remote Sensing 13, no. 11: 2101. https://doi.org/10.3390/rs13112101