Development of Spectral Disease Indices for Southern Corn Rust Detection and Severity Classification

 , ,
, ,
Abstract
:1. Introduction
2. Materials and Methods
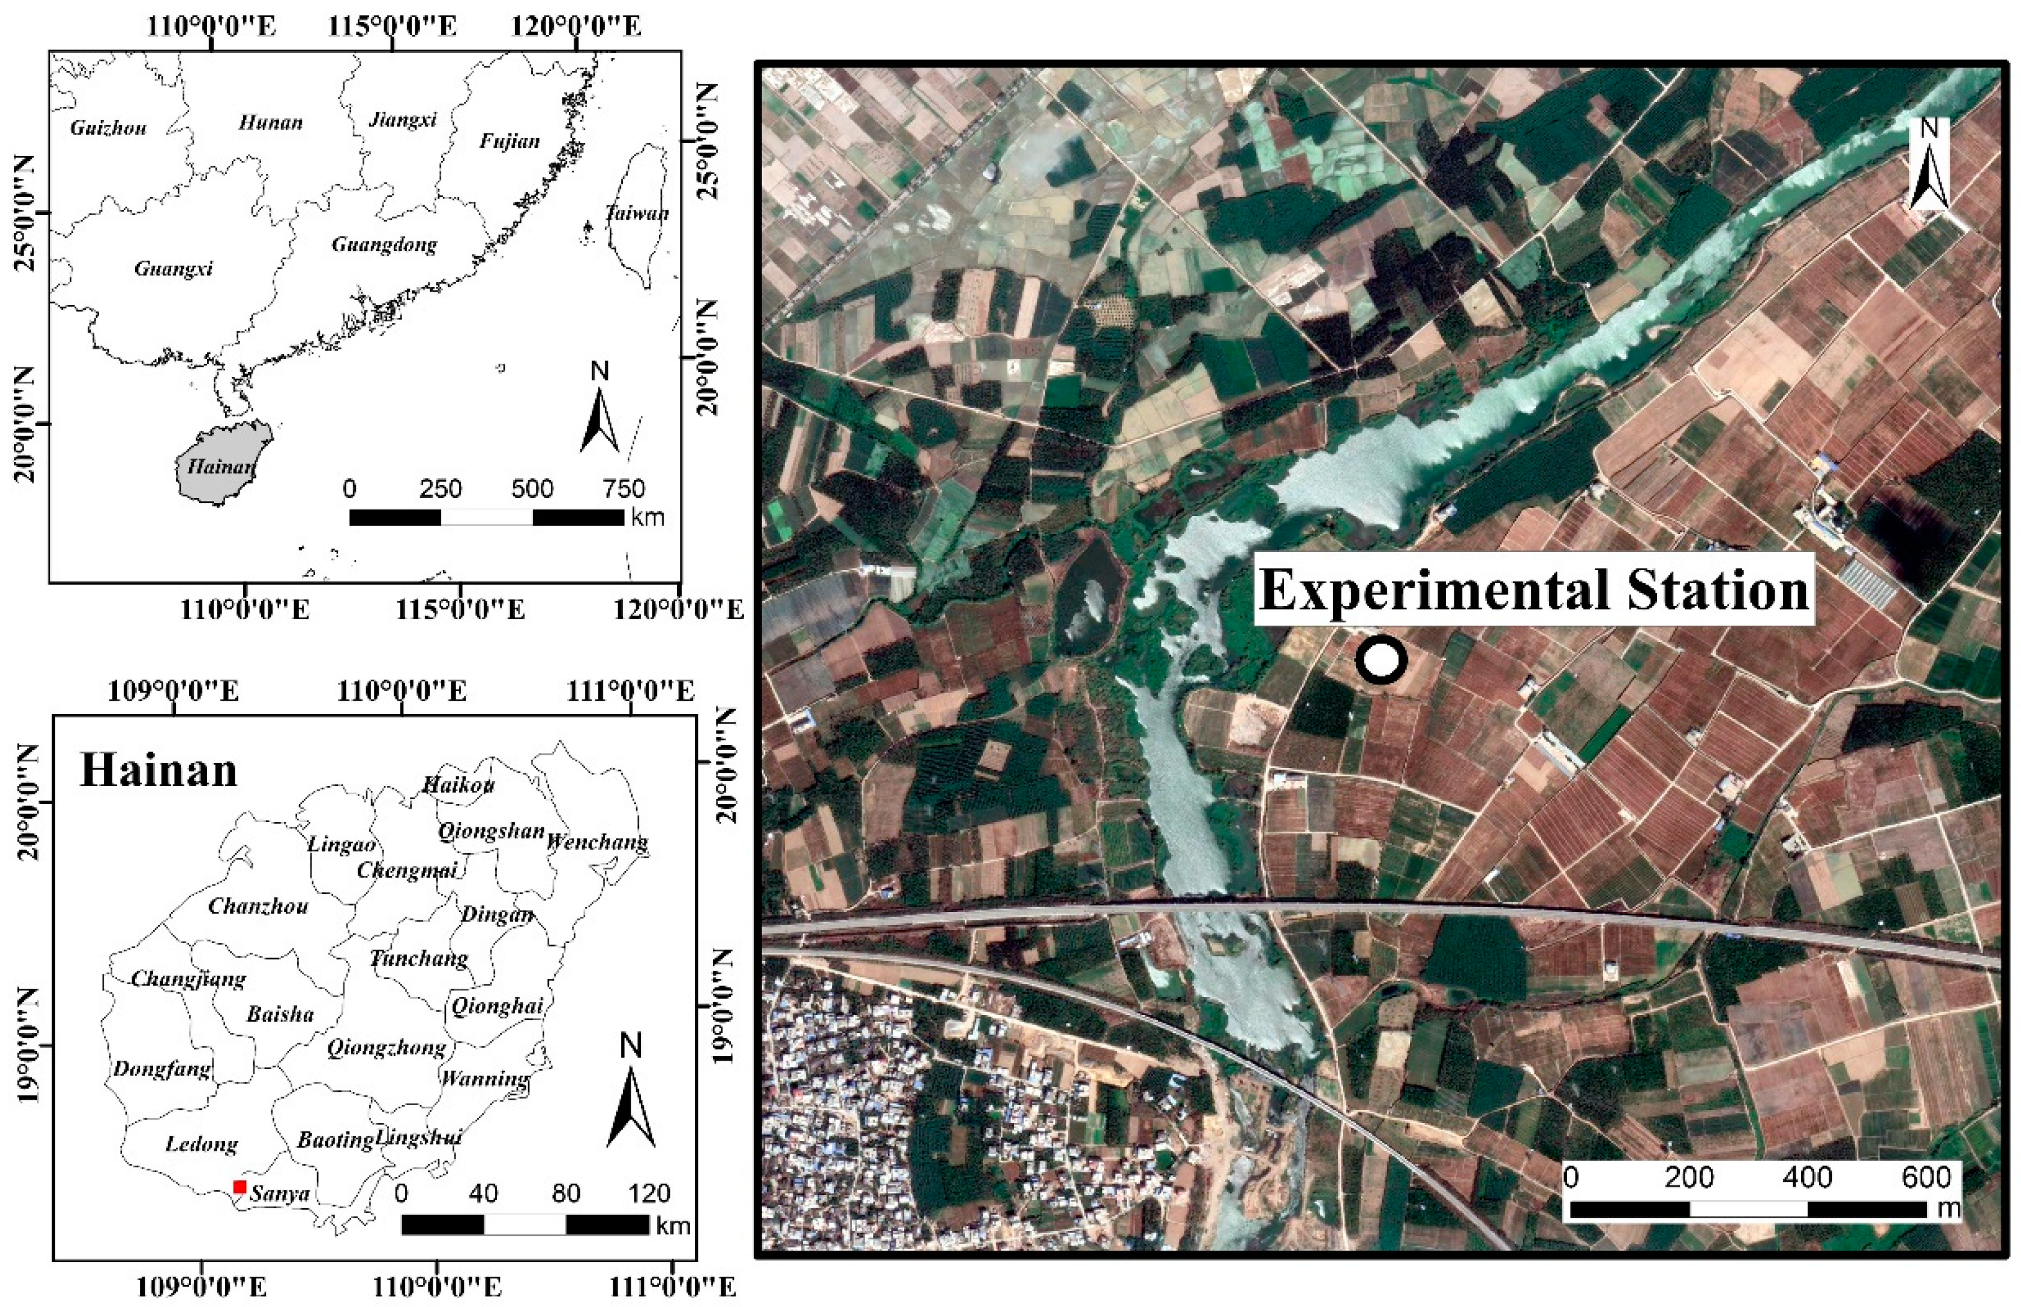
2.1. Study Site
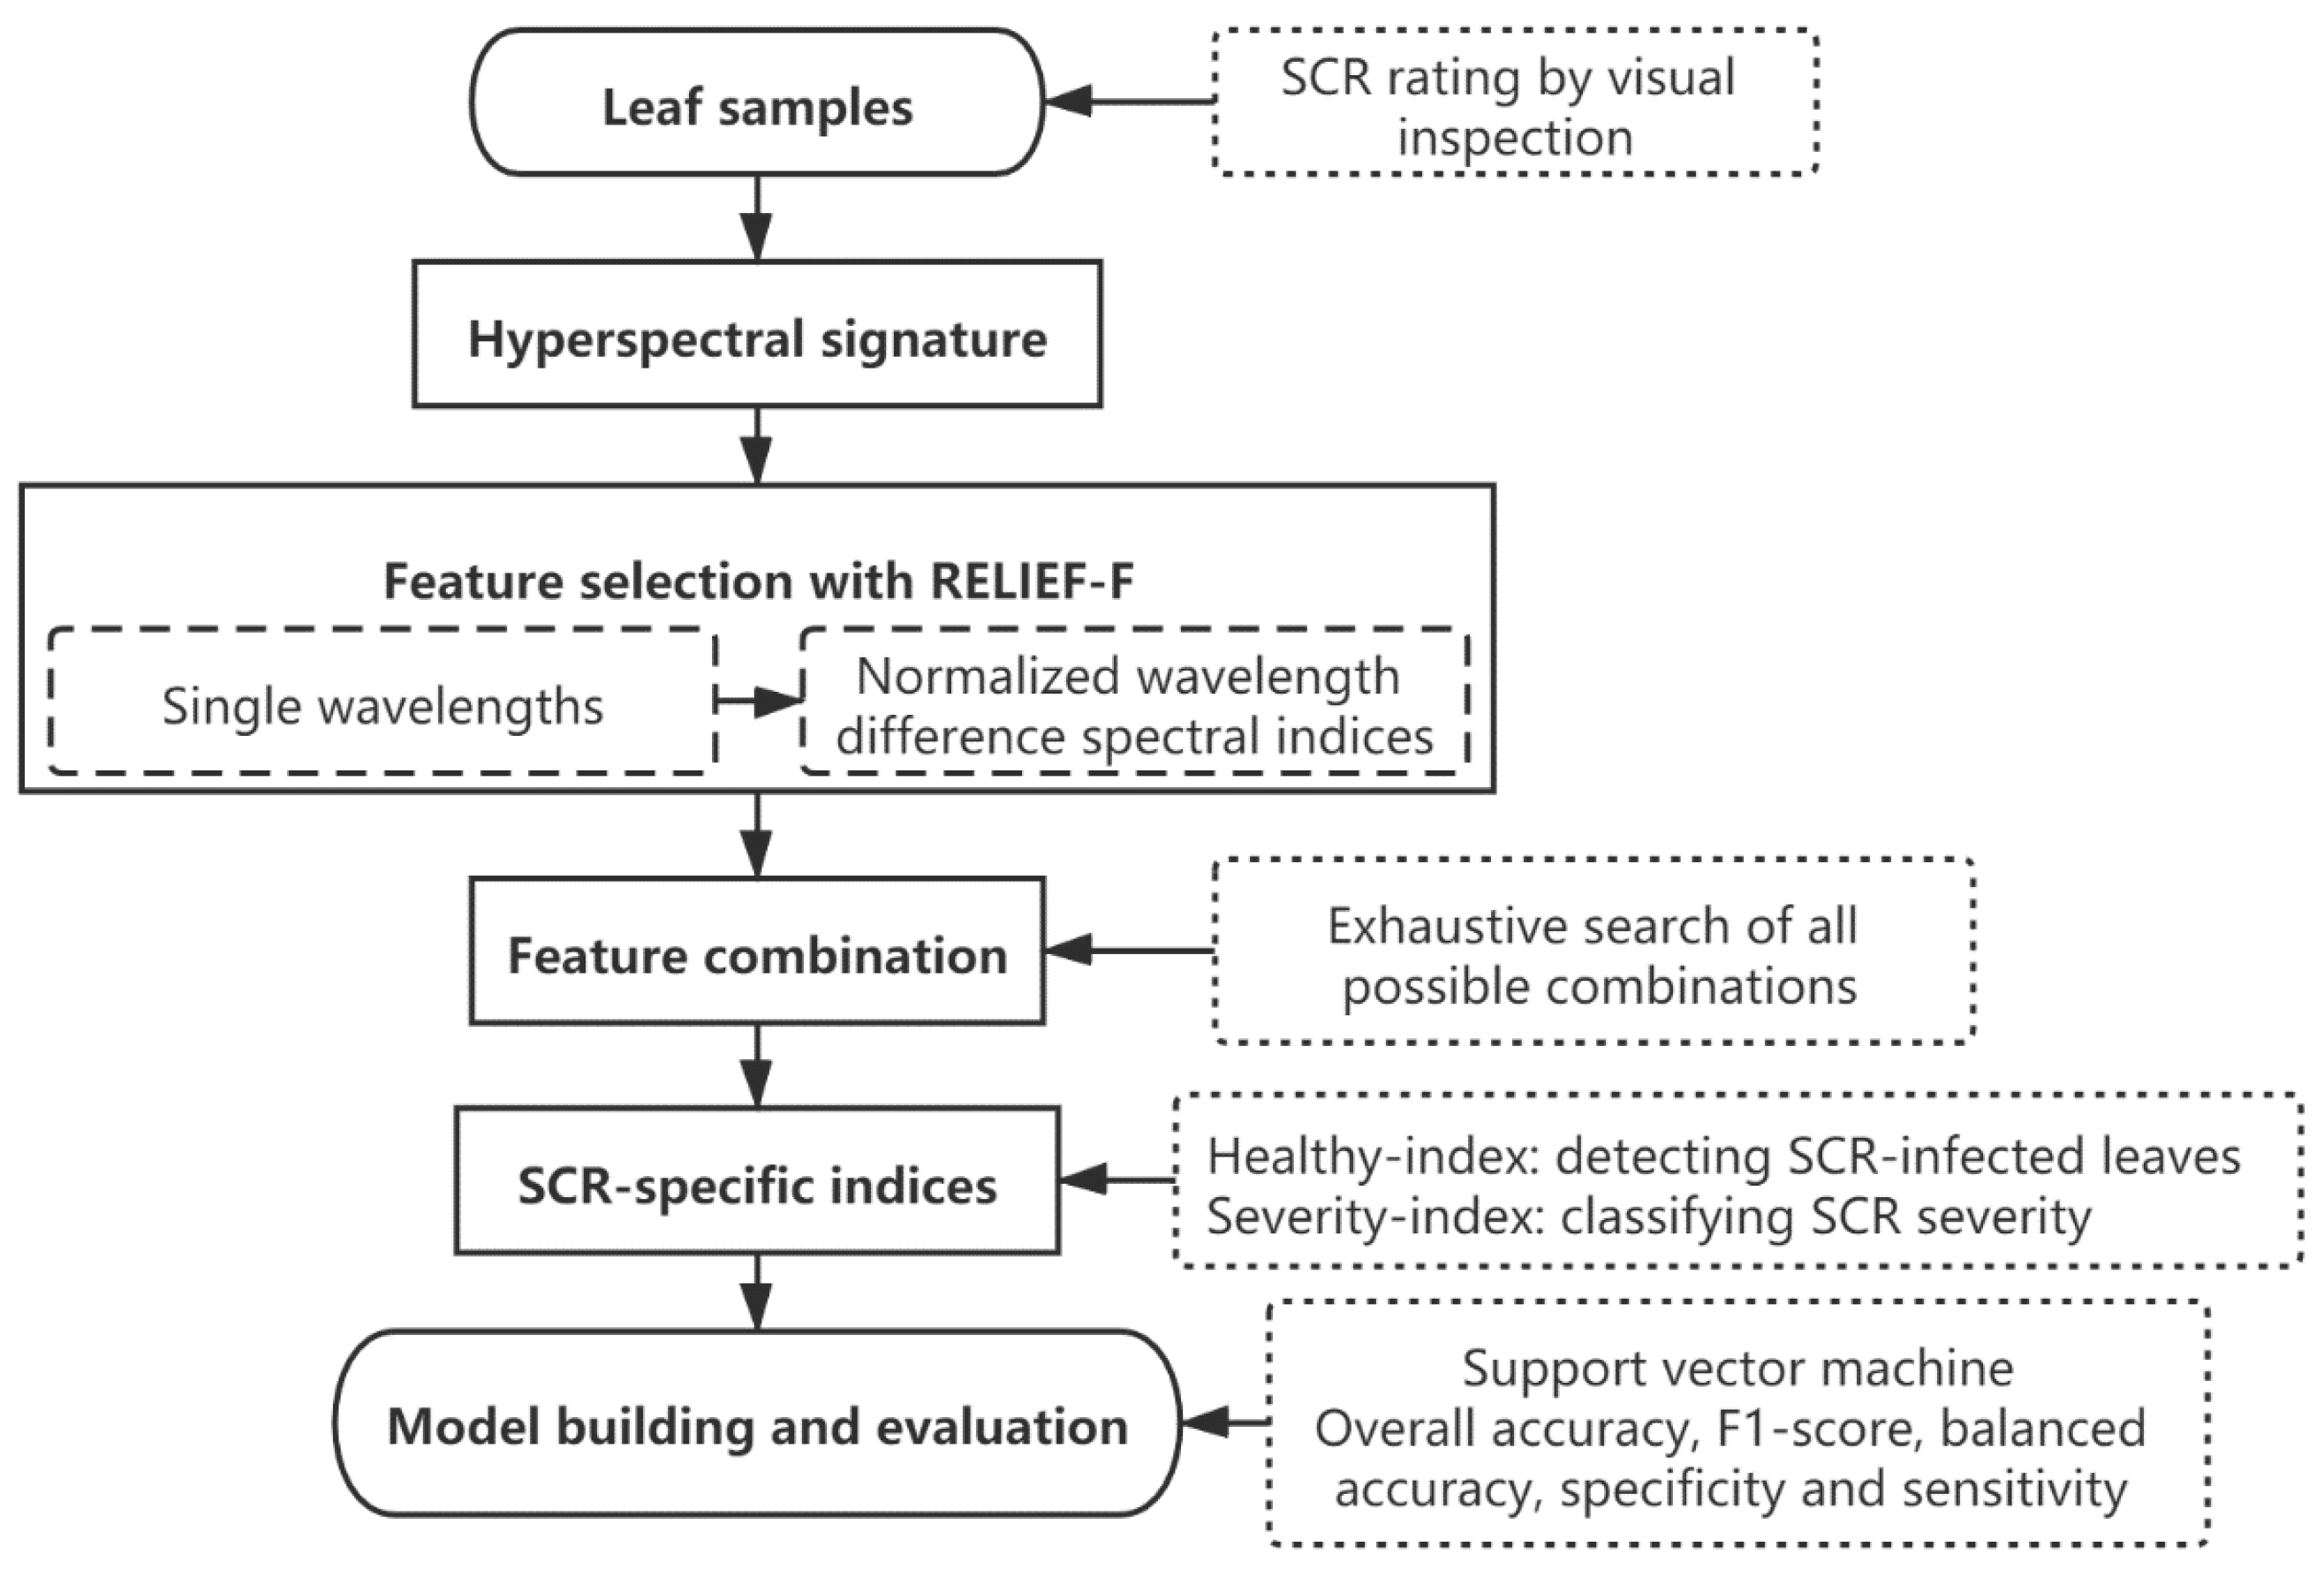
2.2. Methods
2.2.1. Data Acquisition and Preprocessing
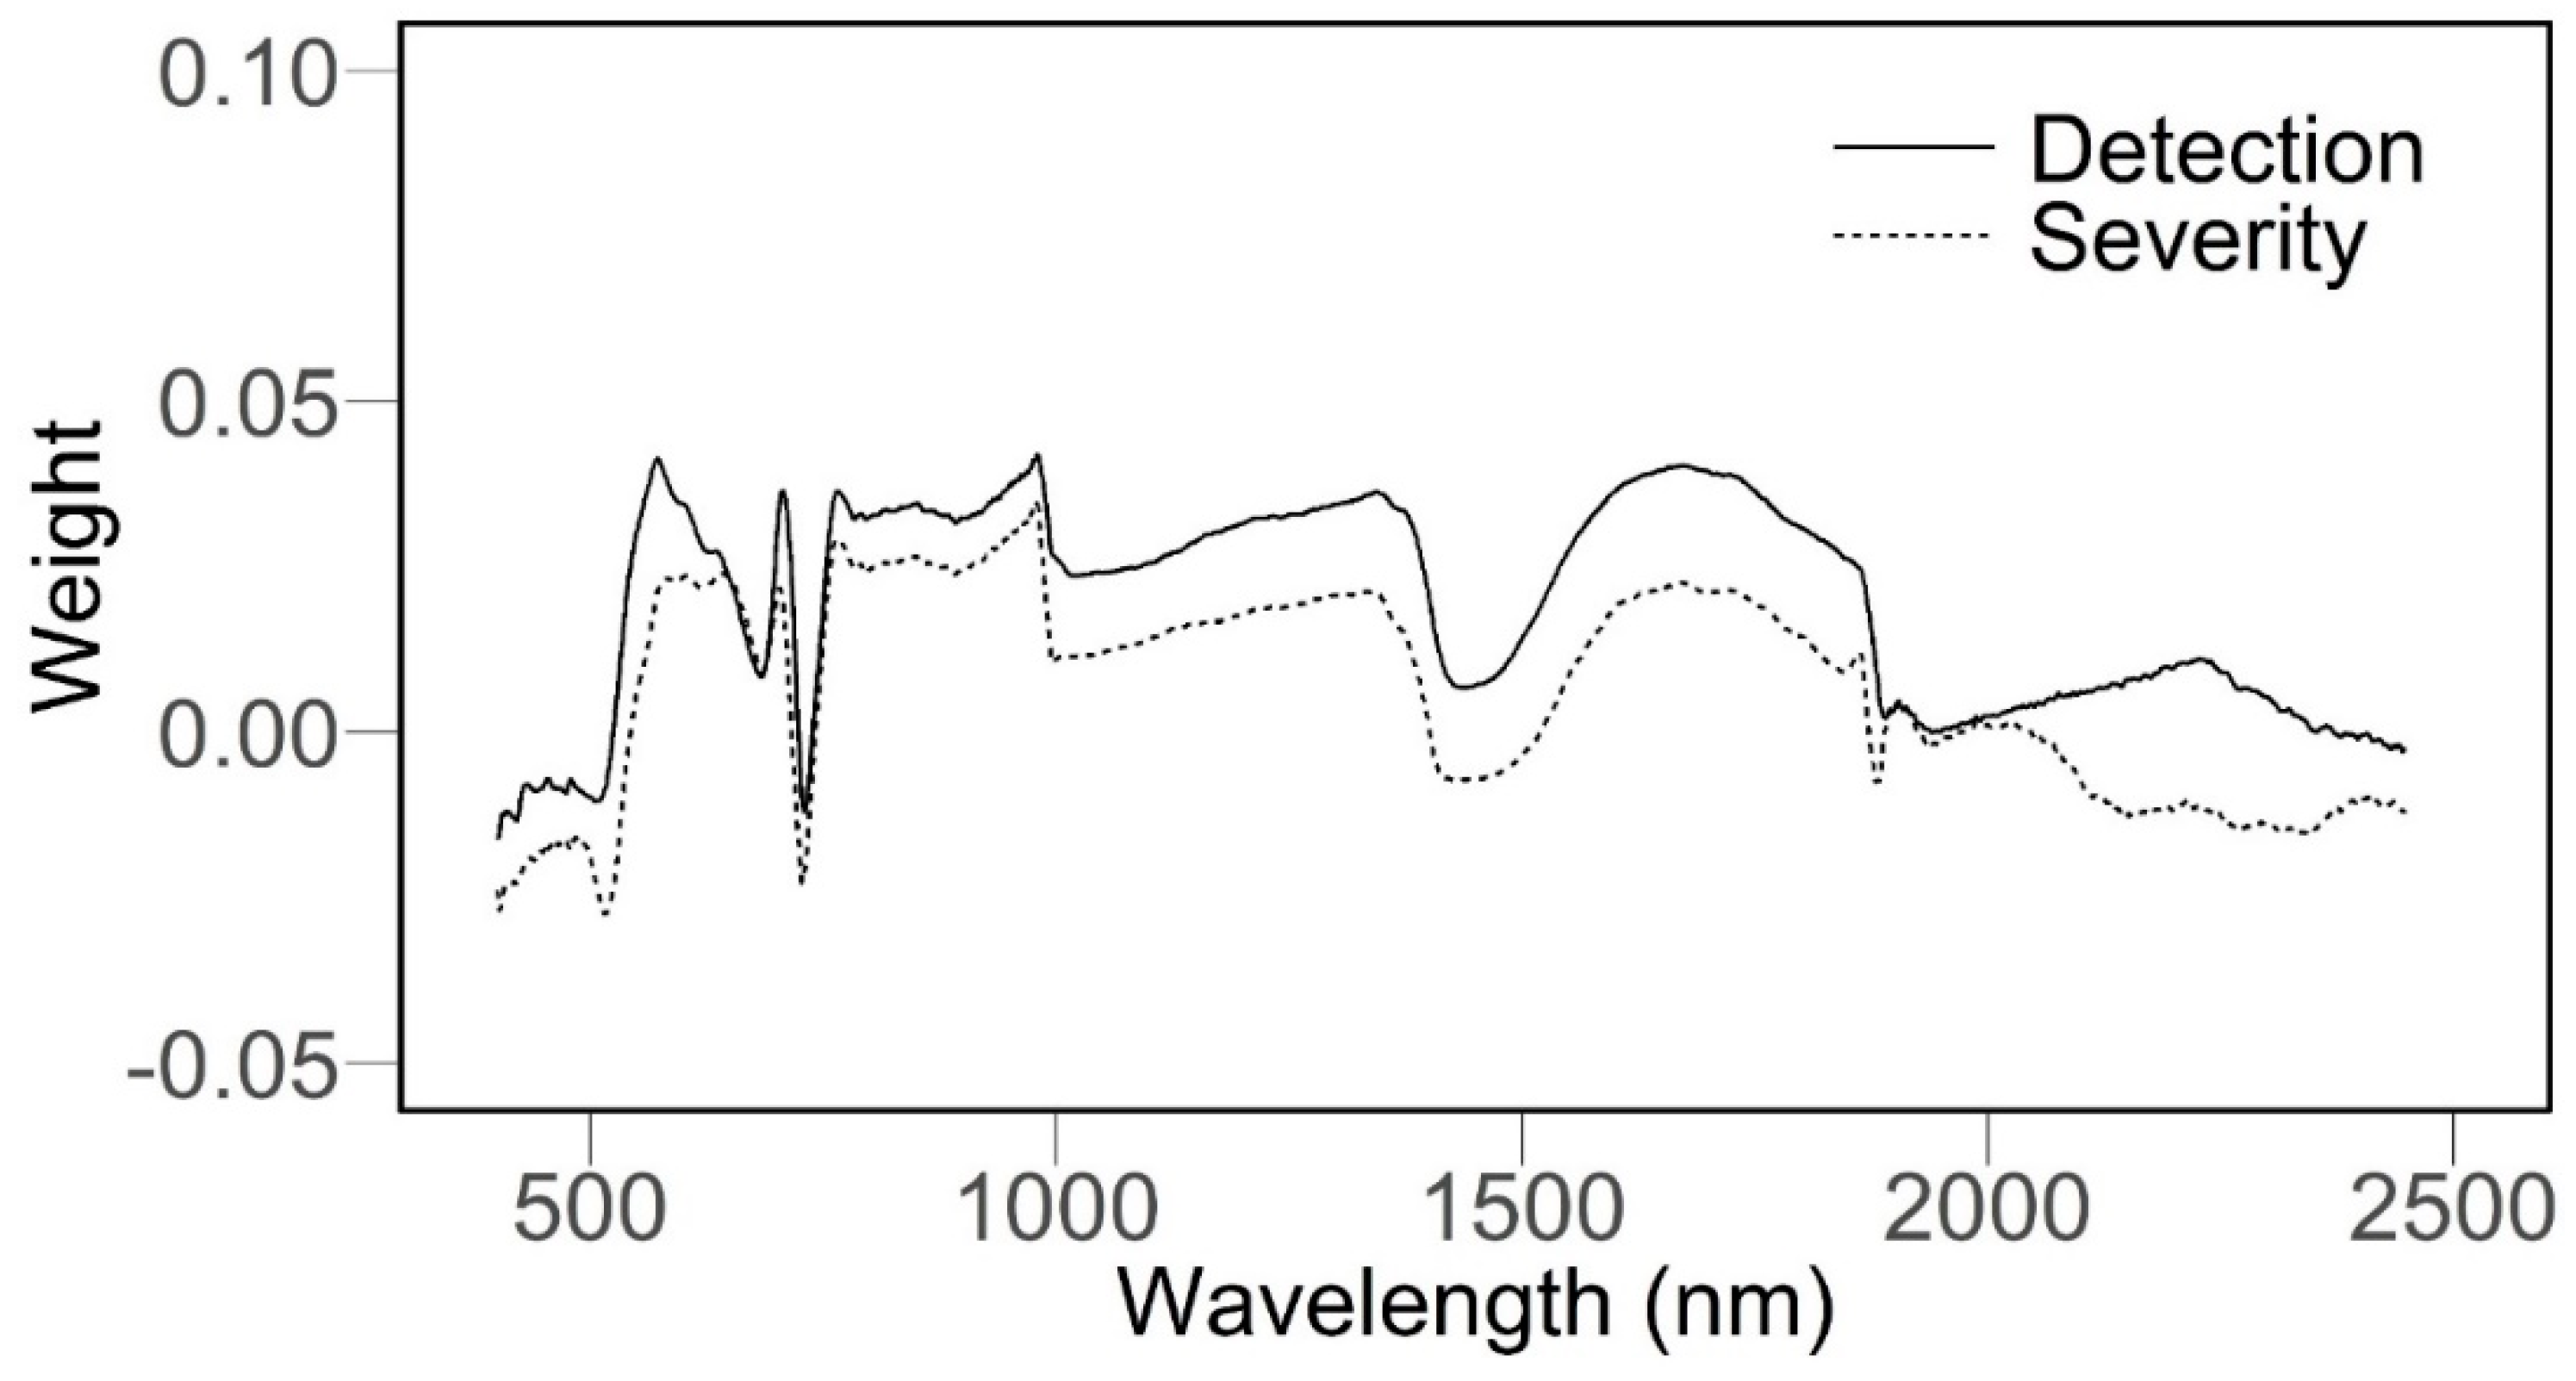
2.2.2. Feature Selection and Combination
2.2.3. Performances of Different Spectral Indices in SCR Detection and Severity Classification
3. Results
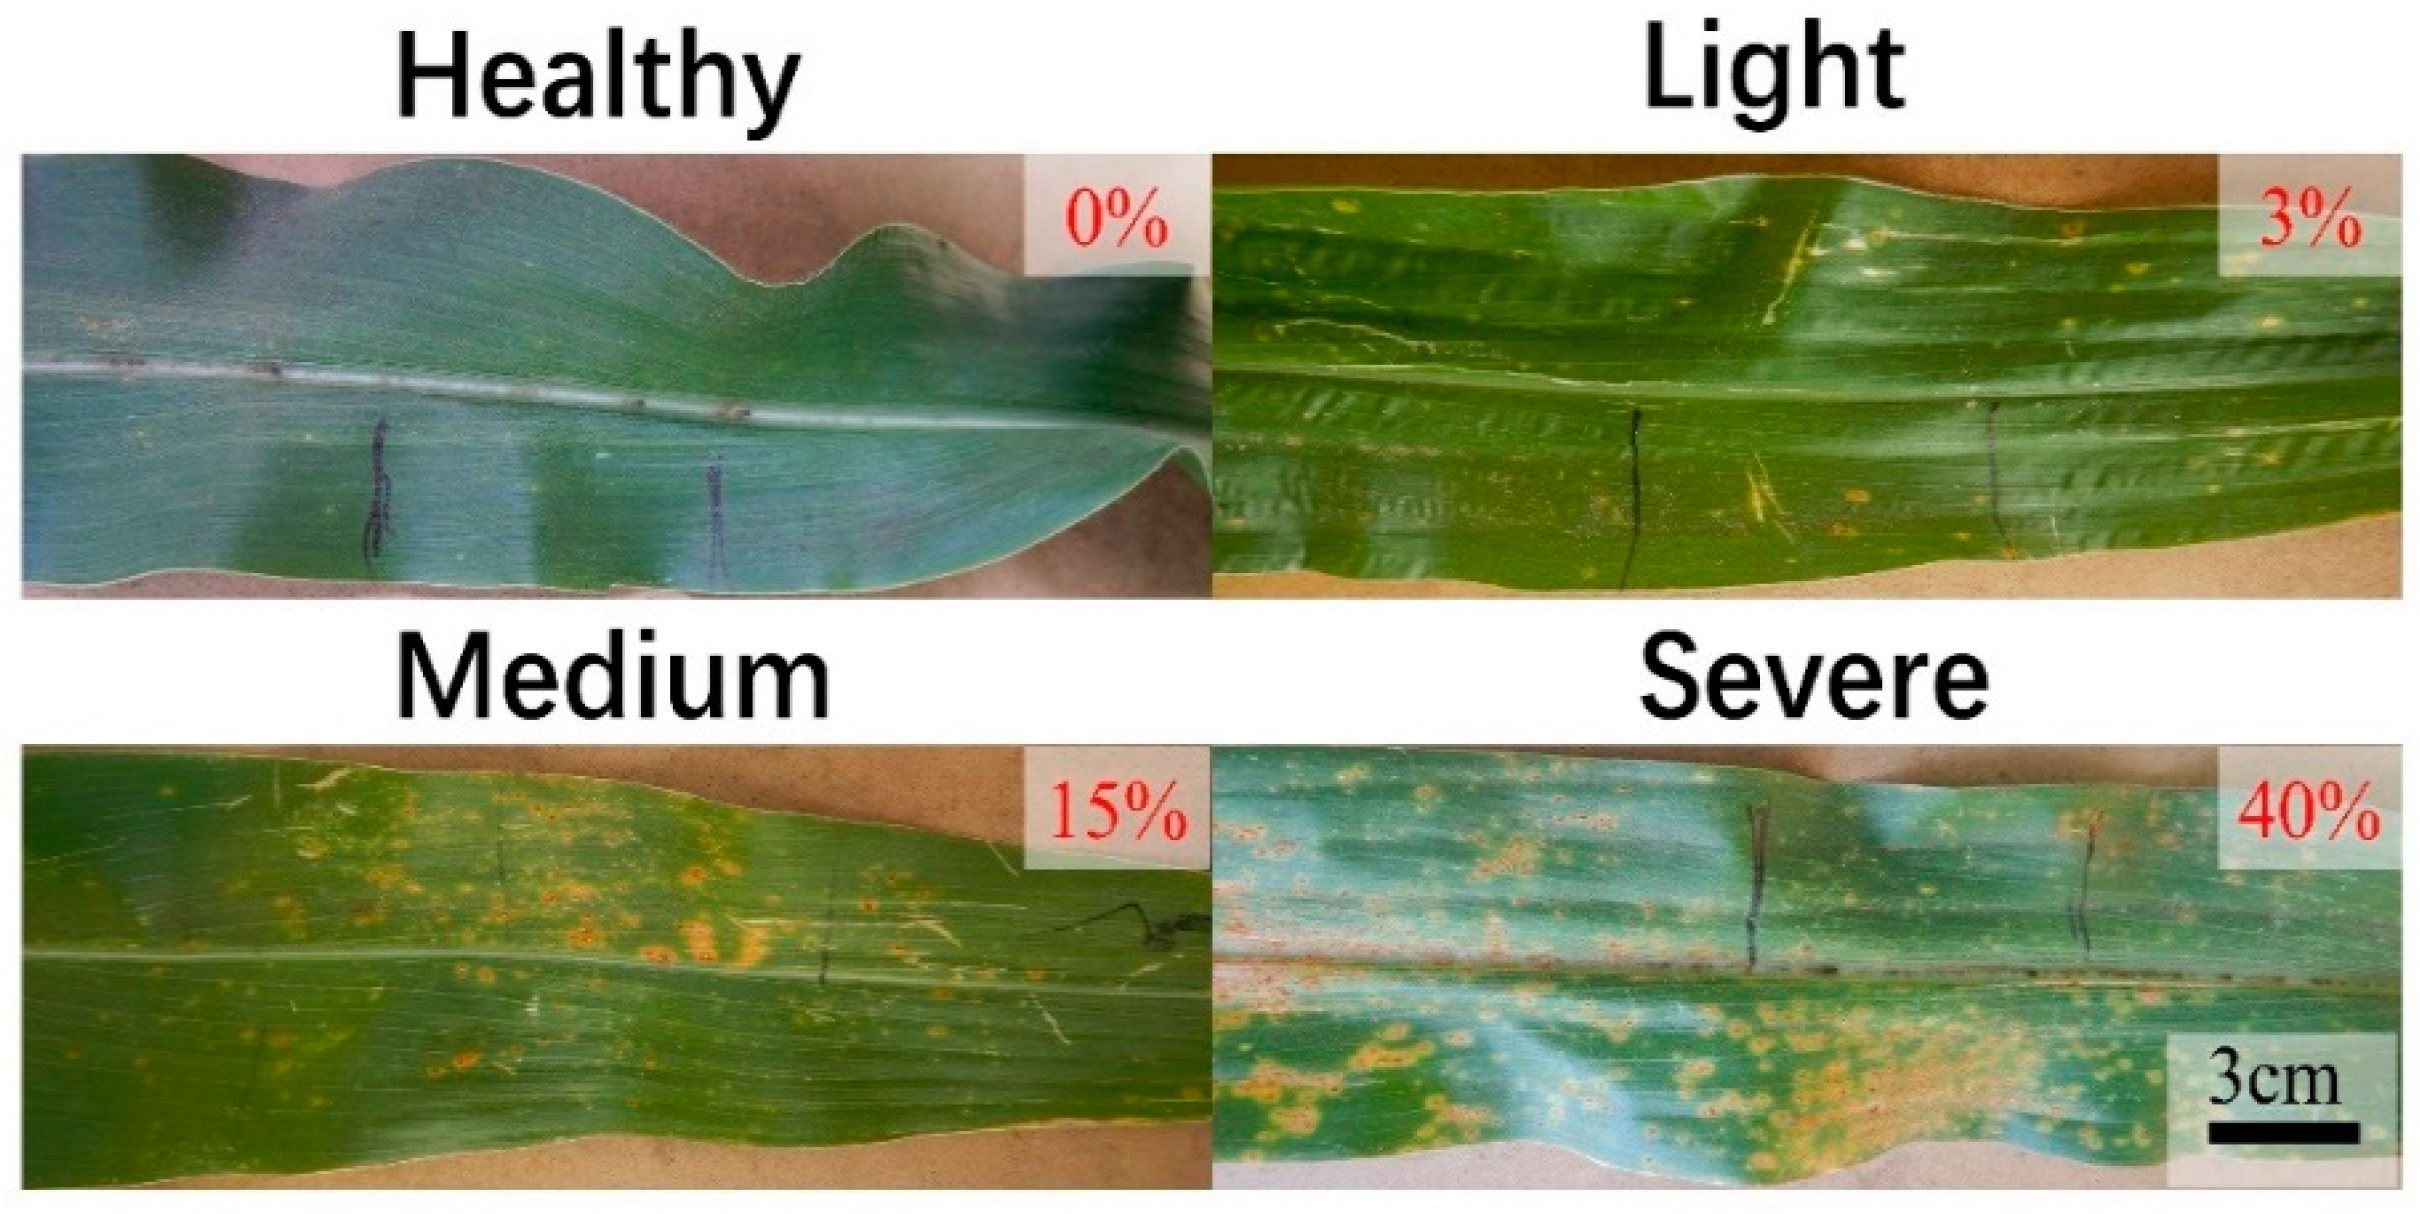
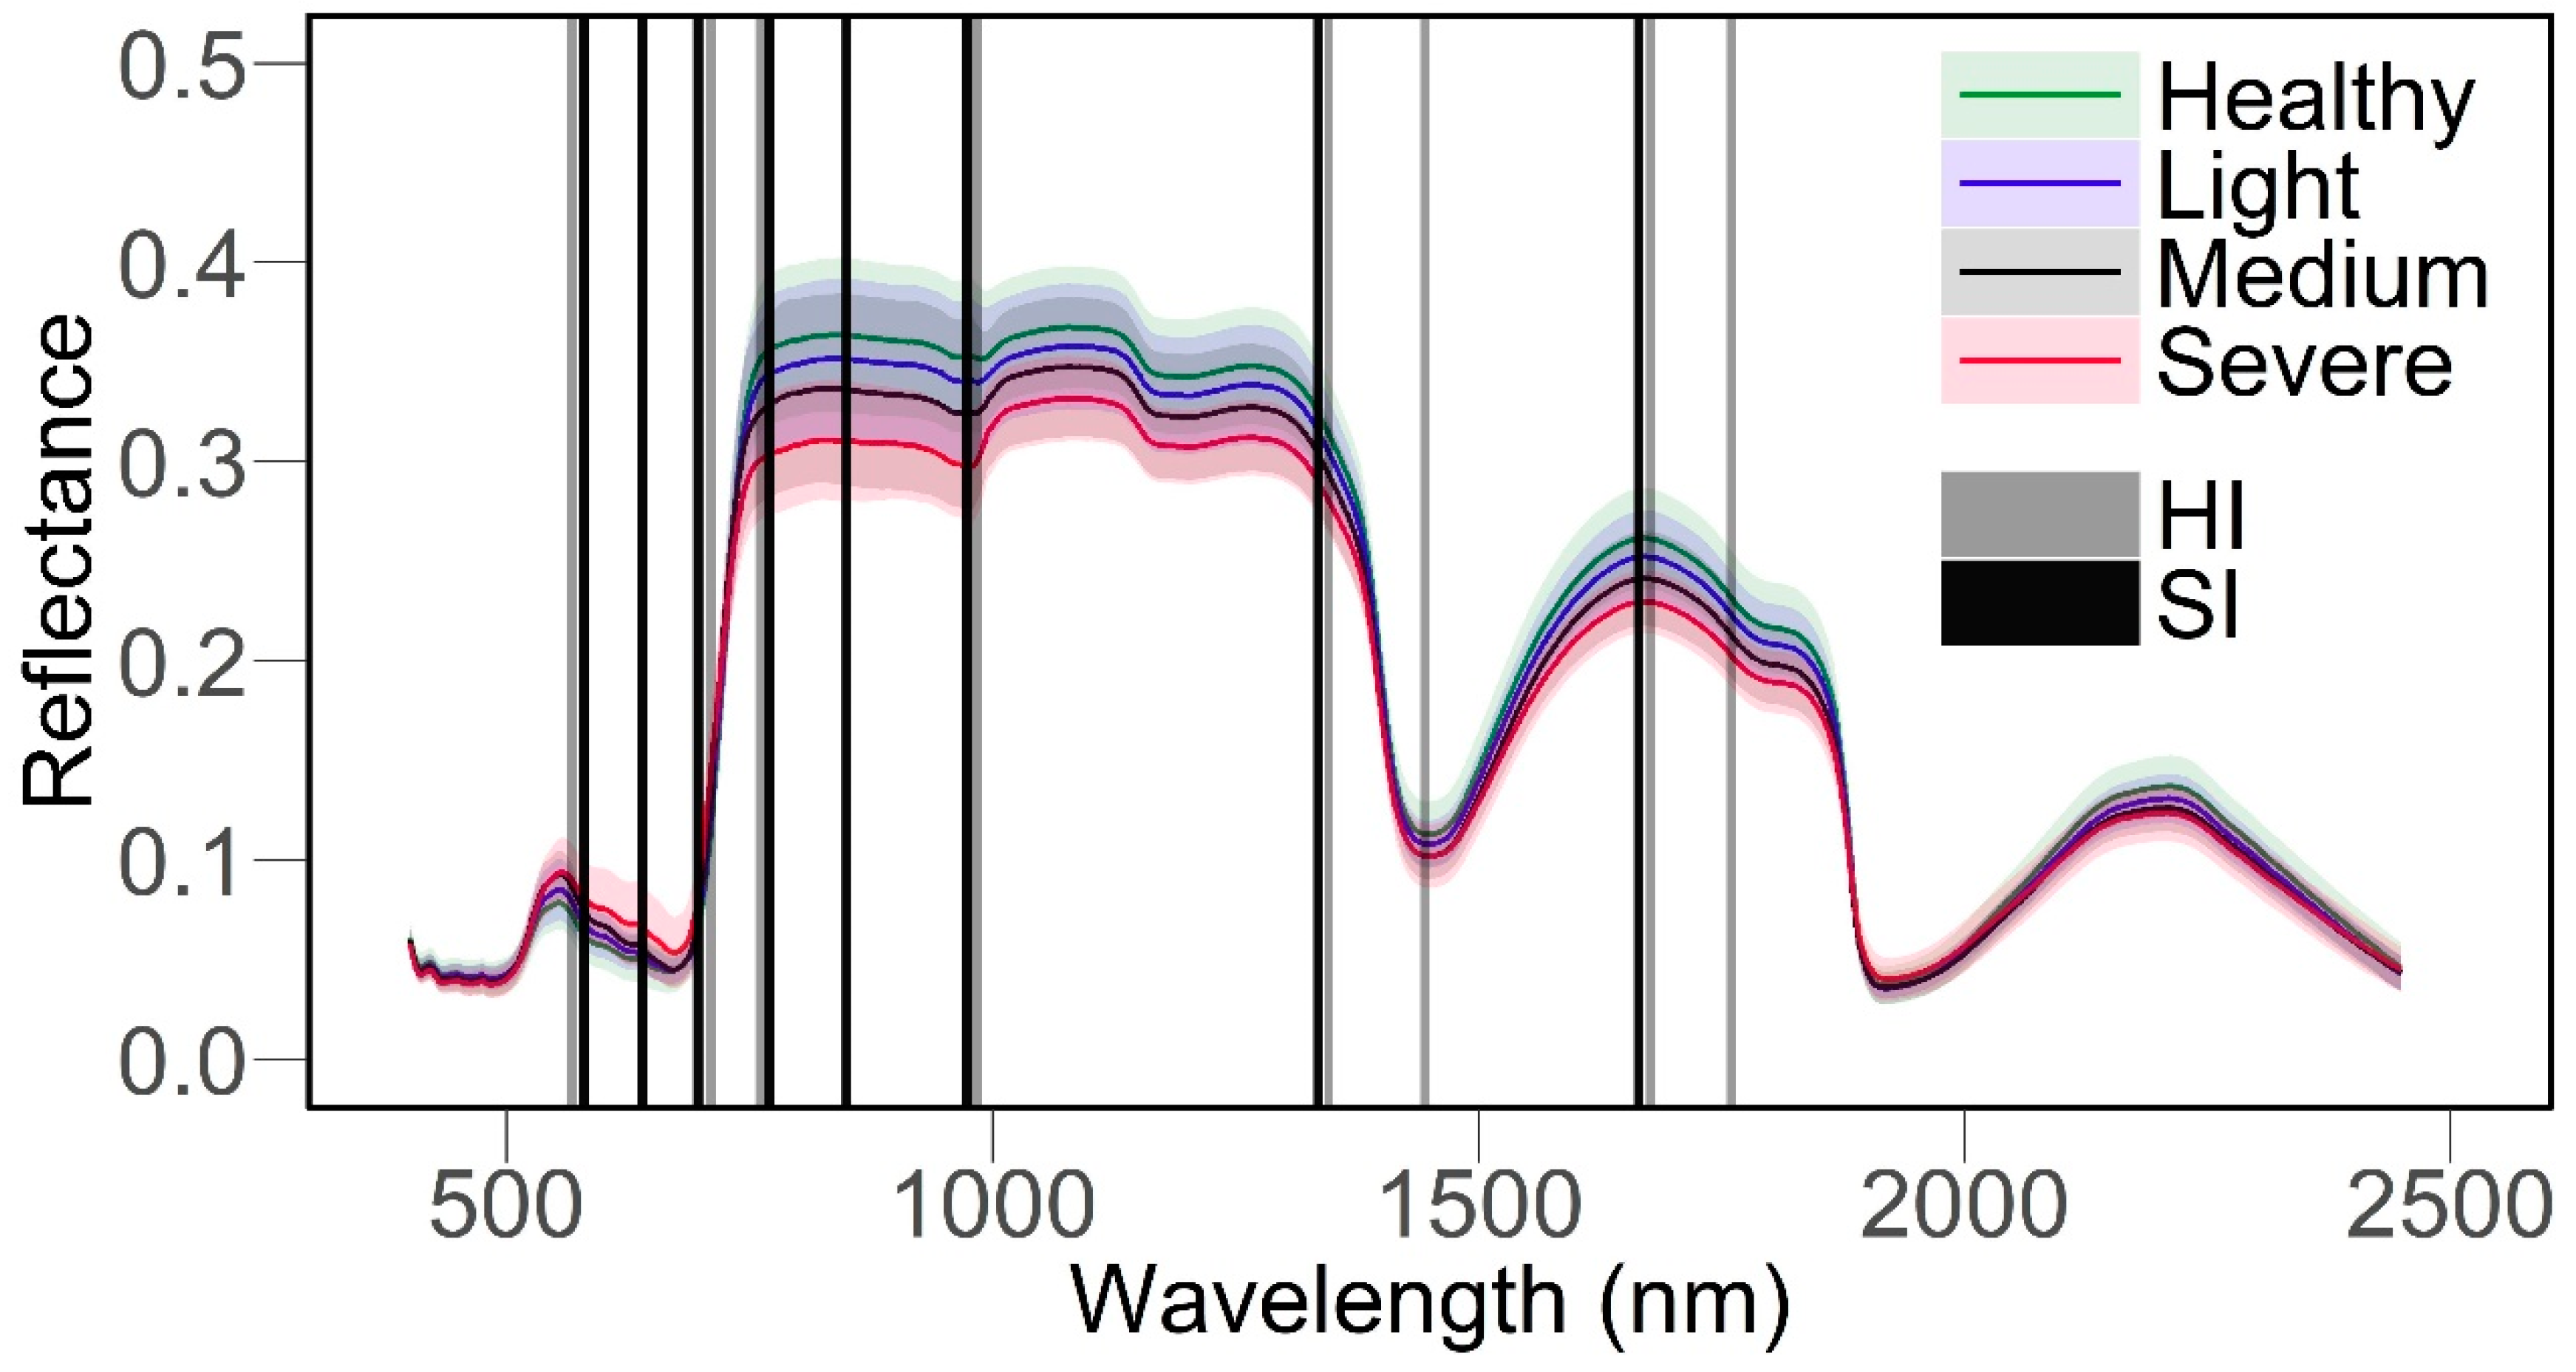
3.1. Spectral Signatures of Healthy and SCR-Infected Corn Leaves
3.2. SDIs for SCR Detection and Severity Classification
3.3. Performances of the SCR-Specific Indices
4. Discussion
4.1. Spectral Signatures of SCR-Infected Leaves
4.2. Advantages of SDIs-Based Method for Plant Disease Monitoring
4.3. Limitations and Future Studies
5. Conclusions
Supplementary Materials
Author Contributions
Funding
Acknowledgments
Conflicts of Interest
References
- Brewbaker, J.L.; Kim, S.K.; So, Y.S.; Logroño, M.; Moon, H.G.; Ming, R.; Lu, X.W.; Josue, A.D. General Resistance in Maize to Southern Rust (Puccinia polysora Underw.). Crop Sci. 2011, 51, 1393–1409. [Google Scholar] [CrossRef]
- Liu, J.; Jiang, Y.; Zeng, J.; Ji, G.; Liu, L.; Qiu, K.; Xu, Y. Analysis of the main occurrence characteristics and causes of the southern corn rust in China in 2015. China Plant Prot. 2016, 36, 44–47. [Google Scholar]
- Liu, J.; Ma, Q.; Yu, K.; Wang, X. A report about the occurrence area of southern corn rust and the resistance of the corn cultivars in china. Crops 2009, 3, 71–75. [Google Scholar]
- Mueller, D.; Wise, K.; Sisson, A.; Allen, T.; Bergstrom, G.; Bosley, D.; Bradley, C.; Broders, K.; Byamukama, E.; Chilvers, M.; et al. Corn Yield Loss Estimates Due to Diseases in the United States and Ontario, Canada from 2012 to 2015. Plant Health Prog. 2016, 17, 211–222. [Google Scholar] [CrossRef] [Green Version]
- Mahlein, A.K.; Oerke, E.-C.; Steiner, U.; Dehne, H.-W. Recent advances in sensing plant diseases for precision crop protection. Eur. J. Plant Pathol. 2012, 133, 197–209. [Google Scholar] [CrossRef]
- Mahlein, A.K.; Kuska, M.T.; Behmann, J.; Polder, G.; Walter, A. Hyperspectral Sensors and Imaging Technologies in Phytopathology: State of the Art. Annu. Rev. Phytopathol. 2018, 56, 535–558. [Google Scholar] [CrossRef]
- Zhang, J.; Huang, Y.; Pu, R.; Gonzalez-Moreno, P.; Yuan, L.; Wu, K.; Huang, W. Monitoring plant diseases and pests through remote sensing technology: A review. Comput. Electron. Agric. 2019, 165, 104943. [Google Scholar] [CrossRef]
- Gold, K.M.; Townsend, P.A.; Chlus, A.; Herrmann, I.; Couture, J.J.; Larson, E.R.; Gevens, A.J. Hyperspectral measurements enable pre-symptomatic detection and differentiation of contrasting physiological effects of late blight and earrly blight in potato. Remote Sens. 2020, 12, 286. [Google Scholar] [CrossRef] [Green Version]
- Mahlein, A.K.; Rumpf, T.; Welke, P.; Dehne, H.W.; Plumer, L.; Steiner, U.; Oerke, E.C. Development of spectral indices for detecting and identifying plant diseases. Remote Sens. Environ. 2013, 128, 21–30. [Google Scholar] [CrossRef]
- Naidu, R.A.; Perry, E.M.; Pierce, F.J.; Mekuria, T. The potential of spectral reflectance technique for the detection of Grapevine leafroll-associated virus-3 in two red-berried wine grape cultivars. Comput. Electron. Agric. 2009, 66, 38–45. [Google Scholar] [CrossRef]
- Gold, K.M.; Townsend, P.A.; Herrmann, I.; Gevens, A.J. Investigating potato late blight physiological differences across potato cultivars with spectroscopy and machine learning. Plant Sci. 2019. [Google Scholar] [CrossRef] [PubMed]
- Liu, Z.Y.; Wu, H.F.; Huang, J.F. Application of neural networks to discriminate fungal infection levels in rice panicles using hyperspectral reflectance and principal components analysis. Comput. Electron. Agric. 2010, 72, 99–106. [Google Scholar] [CrossRef]
- Zhang, J.; Pu, R.; Huang, W.; Yuan, L.; Luo, J.; Wang, J. Using in-situ hyperspectral data for detecting and discriminating yellow rust disease from nutrient stresses. Field Crops Res. 2012, 134, 165–174. [Google Scholar] [CrossRef]
- Bravo, C.; Moshou, D.; West, J.; McCartney, A.; Ramon, H. Early disease detection in wheat fields using spectral reflectance. Biosyst. Eng. 2003, 84, 137–145. [Google Scholar] [CrossRef]
- Guo, A.; Huang, W.; Ye, H.; Dong, Y.; Ma, H.; Ren, Y.; Ruan, C. Identification of Wheat Yellow Rust using Spectral and Texture Features of Hyperspectral Images. Remote Sens. 2020, 12, 1419. [Google Scholar] [CrossRef]
- Ausmus, B.S.; Hilty, J.W. Reflectance studies of healthy, maize dwarf mosaic virus-infected, and Helminthosporium maydis-infected corn leaves. Remote Sens. Environ. 1971, 2, 77–81. [Google Scholar] [CrossRef]
- Jones, C.D.; Jones, J.B.; Lee, W.S. Diagnosis of bacterial spot of tomato using spectral signatures. Comput. Electron. Agric. 2010, 74, 329–335. [Google Scholar] [CrossRef]
- Lu, J.Z.; Ehsani, R.; Shi, Y.Y.; de Castro, A.I.; Wang, S. Detection of multi-tomato leaf diseases (late blight, target and bacterial spots) in different stages by using a spectral-based sensor. Sci. Rep. 2018, 8, 2793. [Google Scholar] [CrossRef] [Green Version]
- Chen, T.; Zeng, R.; Guo, W.; Hou, X.; Lan, Y.; Zhang, L. Detection of Stress in Cotton (Gossypium hirsutum L.) Caused by Aphids Using Leaf Level Hyperspectral Measurements. Sensors 2018, 18, 2798. [Google Scholar] [CrossRef] [Green Version]
- Bauriegel, E.; Giebel, A.; Geyer, M.; Schmidt, U.; Herppich, W.B. Early detection of Fusarium infection in wheat using hyper-spectral imaging. Comput. Electron. Agric. 2011, 75, 304–312. [Google Scholar] [CrossRef]
- Huang, W.; Lamb, D.W.; Niu, Z.; Zhang, Y.; Liu, L.; Wang, J. Identification of yellow rust in wheat using in-situ spectral reflectance measurements and airborne hyperspectral imaging. Precis. Agric. 2007, 8, 187–197. [Google Scholar] [CrossRef]
- Zheng, Q.; Huang, W.; Cui, X.; Dong, Y.; Shi, Y.; Ma, H.; Liu, L. Identification of Wheat Yellow Rust Using Optimal Three-Band Spectral Indices in Different Growth Stages. Sensors 2018, 19, 35. [Google Scholar] [CrossRef] [PubMed] [Green Version]
- Shirzadifar, A.; Bajwa, S.; Nowatzki, J.; Shojaeiarani, J. Development of spectral indices for identifying glyphosate-resistant weeds. Comput. Electron. Agric. 2020, 170, 105276. [Google Scholar] [CrossRef]
- Mu, C.; Lu, S.; Fu, J.; Zhang, F.; Li, W.; Sun, Q.; Zhang, X.; Meng, Z. Research Progress on Southern Corn Rust. Fujian J. Agric. Sci. 2013, 25, 509–512. [Google Scholar]
- Bohnenkamp, D.; Behmann, J.; Mahlein, A.K. In-Field detection of yellow rust in wheat on the ground canopy and UAV scale. Remote Sens. 2019, 11, 2495. [Google Scholar] [CrossRef] [Green Version]
- Wu, J.; Rogers, A.; Albert Loren, P.; Ely, K.; Prohaska, N.; Wolfe Brett, T.; Oliveira Raimundo, C.; Saleska Scott, R.; Serbin Shawn, P. Leaf reflectance spectroscopy captures variation in carboxylation capacity across species, canopy environment and leaf age in lowland moist tropical forests. New Phytol. 2019, 224, 663–674. [Google Scholar] [CrossRef] [PubMed]
- Zhao, P.; Zhang, G.; Wu, X.; Li, N.; Shi, D.; Zhang, D.; Ji, C.; Xu, M.; Wang, S. Fine mapping of RppP25, a southern rust resistance gene in maize. J. Integr. Plant Biol. 2013, 55, 462–472. [Google Scholar] [CrossRef] [PubMed]
- Kump, K.L.; Bradbury, P.J.; Wisser, R.J.; Buckler, E.S.; Belcher, A.R.; Oropeza-Rosas, M.A.; Zwonitzer, J.C.; Kresovich, S.; McMullen, M.D.; Ware, D.; et al. Genome-wide association study of quantitative resistance to southern leaf blight in the maize nested association mapping population. Nat. Genet. 2011, 43, 163–168. [Google Scholar] [CrossRef]
- Meng, R.; Dennison, P.E. Spectroscopic analysis of green, desiccated and dead tamarisk canopies. Photogramm. Eng. Remote Sens. 2015, 81, 199–207. [Google Scholar]
- Robnik-Sikonja, M.; Kononenko, I. Theoretical and empirical analysis of ReliefF and RReliefF. Mach. Learn. 2003, 53, 23–69. [Google Scholar] [CrossRef] [Green Version]
- Amari, S.; Wu, S. Improving support vector machine classifiers by modifying kernel functions. Neural Netw. 1999, 12, 783–789. [Google Scholar] [CrossRef]
- Hsu, C.-W.; Chang, C.-C.; Lin, C.-J. A Practical Guide to Support Vector Classification; National Taiwan University: Taipei, Taiwan, 2003. [Google Scholar]
- Zarco-Tejada, P.J.; Pushnik, J.C.; Dobrowski, S.; Ustin, S.L. Steady-state chlorophyll a fluorescence detection from canopy derivative reflectance and double-peak red-edge effects. Remote Sens. Environ. 2003, 84, 283–294. [Google Scholar] [CrossRef]
- le Maire, G.; François, C.; Dufrêne, E. Towards universal broad leaf chlorophyll indices using PROSPECT simulated database and hyperspectral reflectance measurements. Remote Sens. Environ. 2004, 89, 1–28. [Google Scholar] [CrossRef]
- Cho, M.A.; Skidmore, A.K. A new technique for extracting the red edge position from hyperspectral data: The linear extrapolation method. Remote Sens. Environ. 2006, 101, 181–193. [Google Scholar] [CrossRef]
- Vogelmann, J.E.; Rock, B.N.; Moss, D.M. Red edge spectral measurements from sugar maple leaves. Int. J. Remote Sens. 1993, 14, 1563–1575. [Google Scholar] [CrossRef]
- Dash, J.; Curran, P.J. The MERIS terrestrial chlorophyll index. Int. J. Remote Sens. 2004, 25, 5403–5413. [Google Scholar] [CrossRef]
- Apan, A.; Held, A.; Phinn, S.; Markley, J. Detecting sugarcane ‘orange rust’ disease using EO-1 Hyperion hyperspectral imagery. Int. J. Remote Sens. 2004, 25, 489–498. [Google Scholar] [CrossRef] [Green Version]
- Gamon, J.A.; Penuelas, J.; Field, C.B. A narrow-waveband spectral index that tracks diurnal changes in photosynthetic efficiency. Remote Sens. Environ. 1992, 41, 35–44. [Google Scholar] [CrossRef]
- Peñuelas, J.; Gamon, J.A.; Fredeen, A.L.; Merino, J.; Field, C.B. Reflectance indices associated with physiological changes in nitrogen- and water-limited sunflower leaves. Remote Sens. Environ. 1994, 48, 135–146. [Google Scholar] [CrossRef]
- Hernández-Clemente, R.; Navarro-Cerrillo, R.M.; Zarco-Tejada, P.J. Carotenoid content estimation in a heterogeneous conifer forest using narrow-band indices and PROSPECT+DART simulations. Remote Sens. Environ. 2012, 127, 298–315. [Google Scholar] [CrossRef]
- Zheng, Q.; Huang, W.; Cui, X.; Shi, Y.; Liu, L. New Spectral Index for Detecting Wheat Yellow Rust Using Sentinel-2 Multispectral Imagery. Sensors 2018, 18, 868. [Google Scholar] [CrossRef] [PubMed] [Green Version]
- Crouch, J.A.; Szabo, L.J. Real-Time PCR Detection and Discrimination of the Southern and Common Corn Rust Pathogens Puccinia polysora and Puccinia sorghi. Plant Dis. 2011, 95, 624–632. [Google Scholar] [CrossRef] [PubMed]
- Sankaran, S.; Mishra, A.; Ehsani, R.; Davis, C. A review of advanced techniques for detecting plant diseases. Comput. Electron. Agric. 2010, 72, 1–13. [Google Scholar] [CrossRef]
- Lopez-Lopez, M.; Calderon, R.; Gonzalez-Dugo, V.; Zarco-Tejada, P.J.; Fereres, E. Early Detection and Quantification of Almond Red Leaf Blotch Using High-Resolution Hyperspectral and Thermal Imagery. Remote Sens. 2016, 8, 276. [Google Scholar] [CrossRef] [Green Version]
- Adam, E.; Deng, H.; Odindi, J.; Abdel-Rahman, E.M.; Mutanga, O. Detecting the Early Stage of Phaeosphaeria Leaf Spot Infestations in Maize CroUsing in Situ Hyperspectral Data and Guided Regularized Random Forest Algorithm. J. Spectrosc. 2017, 2017, 6961387. [Google Scholar] [CrossRef]
- Leucker, M.; Wahabzada, M.; Kersting, K.; Peter, M.; Beyer, W.; Steiner, U.; Mahlein, A.K.; Oerke, E.C. Hyperspectral imaging reveals the effect of sugar beet quantitative trait loci on Cercospora leaf spot resistance. Funct. Plant Biol. 2017, 44, 1–9. [Google Scholar] [CrossRef]
- Alisaac, E.; Behmann, J.; Kuska, M.T.; Dehne, H.W.; Mahlein, A.K. Hyperspectral quantification of wheat resistance to Fusarium head blight: Comparison of two Fusarium species. Eur. J. Plant Pathol. 2018, 152, 869–884. [Google Scholar] [CrossRef]
- Wanlayaporn, K.; Authrapun, J.; Vanavichit, A.; Tragoonrung, S. QTL Mapping for Partial Resistance to Southern Corn Rust Using RILs of Tropical Sweet Corn. Am. J. Plant Sci. 2013, 4, 878–889. [Google Scholar] [CrossRef] [Green Version]
- Bohnenkamp, D.; Kuska, M.T.; Mahlein, A.K.; Behmann, J. Hyperspectral signal decomposition and symptom detection of wheat rust disease at the leaf scale using pure fungal spore spectra as reference. Plant Pathol. 2019, 68, 1188–1195. [Google Scholar] [CrossRef]
- Kuska, M.T.; Behmann, J.; Namini, M.; Oerke, E.C.; Steiner, U.; Mahlein, A.K. Discovering coherency of specific gene expression and optical reflectance properties of barley genotypes differing for resistance reactions against powdery mildew. PLoS ONE 2019, 14, e0213291. [Google Scholar] [CrossRef]
- Kuska, M.T.; Behmann, J.; Grosskinsky, D.K.; Roitsch, T.; Mahlein, A.K. Screening of Barley Resistance Against Powdery Mildew by Simultaneous High-Throughput Enzyme Activity Signature Profiling and Multispectral Imaging. Front. Plant Sci. 2018, 9, 1074. [Google Scholar] [CrossRef] [PubMed] [Green Version]
- Thomas, S.; Kuska, M.T.; Bohnenkamp, D.; Brugger, A.; Alisaac, E.; Wahabzada, M.; Behmann, J.; Mahlein, A.K. Benefits of hyperspectral imaging for plant disease detection and plant protection: A technical perspective. J. Plant Dis. Prot. 2018, 125, 5–20. [Google Scholar] [CrossRef]
- Yang, H.; Yang, J.P.; Lv, Y.M.; He, J.J. SPAD Values and Nitrogen Nutrition Index for the Evaluation of Rice Nitrogen Status. Plant Prod. Sci. 2014, 17, 81–92. [Google Scholar] [CrossRef]
- Zhang, D.; Zhou, X.; Zhang, J.; Lan, Y.; Xu, C.; Liang, D. Detection of rice sheath blight using an unmanned aerial system with high-resolution color and multispectral imaging. PLoS ONE 2018, 13, e0187470. [Google Scholar] [CrossRef] [Green Version]
- Sankey, T.; Donager, J.; McVay, J.; Sankey, J.B. UAV lidar and hyperspectral fusion for forest monitoring in the southwestern USA. Remote Sens. Environ. 2017, 195, 30–43. [Google Scholar] [CrossRef]
- Zhang, X.; Han, L.; Dong, Y.; Shi, Y.; Huang, W.; Han, L.; González-Moreno, P.; Ma, H.; Ye, H.; Sobeih, T. A Deep Learning-Based Approach for Automated Yellow Rust Disease Detection from High.-Resolution Hyperspectral UAV Images. Remote Sens. 2019, 11, 1554. [Google Scholar] [CrossRef] [Green Version]
- Meng, R.; Yang, D.; McMahon, A.; Hantson, W.; Hayes, D.; Breen, A.; Serbin, S. A UAS Platform for Assessing Spectral, Structural, and Thermal Patterns of Arctic Tundra Vegetation. In Proceedings of the IGARSS 2019–2019 IEEE International Geoscience and Remote Sensing Symposium, Yokohama, Japan, 28 July–2 August 2019. [Google Scholar]
- Xu, M.Z.; Liu, R.G.; Chen, J.M.; Liu, Y.; Shang, R.; Ju, W.M.; Wu, C.Y.; Huang, W.J. Retrieving leaf chlorophyll content using a matrix-based vegetation index combination approach. Remote Sens. Environ. 2019, 224, 60–73. [Google Scholar] [CrossRef]
- Haboudane, D.; Tremblay, N.; Miller, J.R.; Vigneault, P. Remote estimation of crop chlorophyll content using spectral indices derived from hyperspectral data. IEEE Trans. Geosci. Remote Sens. 2008, 46, 423–437. [Google Scholar] [CrossRef]
- Ali, M.M.; Bachik, N.A.; Muhadi, N.A.; Yusof, T.N.T.; Gomes, C. Non-destructive techniques of detecting plant diseases: A review. Physiol. Mol. Plant Pathol. 2019, 108, 101426. [Google Scholar] [CrossRef]
- Tane, Z.; Roberts, D.; Koltunov, A.; Sweeney, S.; Ramirez, C. A framework for detecting conifer mortality across an ecoregion using high spatial resolution spaceborne imaging spectroscopy. Remote Sens. Environ. 2018, 209, 195–210. [Google Scholar] [CrossRef]
- Rumpf, T.; Mahlein, A.K.; Steiner, U.; Oerke, E.C.; Dehne, H.W.; Plümer, L. Early detection and classification of plant diseases with Support. Vector Machines based on hyperspectral reflectance. Comput. Electron. Agric. 2010, 74, 91–99. [Google Scholar] [CrossRef]
- Mahlein, A.K.; Alisaac, E.; Al Masri, A.; Behmann, J.; Dehne, H.W.; Oerke, E.C. Comparison and combination of thermal, fluorescence, and hyperspectral imaging for monitoring fusarium head blight of wheat on spikelet scale. Sensors 2019, 19, 2281. [Google Scholar] [CrossRef] [PubMed] [Green Version]
- Mahlein, A.K.; Kuska, M.T.; Thomas, S.; Wahabzada, M.; Behmann, J.; Rascher, U.; Kersting, K. Quantitative and qualitative phenotyping of disease resistance of crops by hyperspectral sensors: Seamless interlocking of phytopathology, sensors, and machine learning is needed! Curr. Opin. Plant Biol. 2019, 50, 156–162. [Google Scholar] [CrossRef] [PubMed]


| SCR Detection | SCR Severity | Percentage of Lesion Areas on Leaves | No. of Leaf Samples |
|---|---|---|---|
| Healthy | N.A. | No lesion | 18 |
| Infected | Light | <5% | 16 |
| Infected | Medium | 5–29% | 11 |
| Infected | Severe | >30% | 9 |
| Type | Spectral Indices | Definition | Formula | Reference |
|---|---|---|---|---|
| Detection | D730/D706 | The ratio of first derivative values at 730–706 nm | Zarco-Tejada et al. [33] | |
| DDI | The double difference index | le Maire et al. [34] | ||
| REP_LE | Red-edge position | Cho and Skidmore [35] | ||
| D715/D705 | The ratio of first derivative values at 715–705 nm | Vogelmann et al. [36] | ||
| MTCI | The MERIS Terrestrial Chlorophyll Index | Dash and Curran [37] | ||
| Severity | DWSI | The Disease-Water stress index | Apan et al. [38] | |
| PRI | The photochemical reflectance index | Gamon et al. [39] | ||
| EGFR | The simple ratio between the maxima of the first derivatives of reflectance at the red edge and green regions | Peñuelas et al. [40] | ||
| EGFN | The normalized ratio between the maxima of the first derivatives of reflectance at the red edge and green regions | Peñuelas et al. [40] | ||
| SRI | Simple ratio index | Hernández-Clemente et al. [41] |
| Type | Discriminative Wavelengths (nm) | |||||||
|---|---|---|---|---|---|---|---|---|
| Health-index (HI) | 572 | 707 | 766 | 980 | 1344 | 1445 | 1675 | 1760 |
| Severity-index (SI) | 575 | 640 | 702 | 766 | 850 | 979 | 1333 | 1670 |
| VIs | Specificity | Sensitivity | OA (%) | Marco-F1 Score |
|---|---|---|---|---|
| Heath Index (from this study) | 0.833 | 0.889 | 87.0 | 0.856 |
| D730/D706 | 0.678 | 0.950 | 85.9 | 0.831 |
| DDI | 0.778 | 0.856 | 83.0 | 0.811 |
| REP_LE | 0.711 | 0.828 | 78.9 | 0.766 |
| D715/705 | 0.700 | 0.833 | 78.9 | 0.764 |
| MTCI | 0.511 | 0.878 | 75.6 | 0.705 |
| VIs | Balanced Accuracy | OA (%) | Marco-F1 Score | ||
|---|---|---|---|---|---|
| Light | Medium | Severe | |||
| Severity Index (from this study) | 0.780 | 0.778 | 0.767 | 70.0 | 0.698 |
| DWSI | 0.769 | 0.708 | 0.637 | 61.7 | 0.589 |
| PRI | 0.775 | 0.489 | 0.778 | 61.7 | 0.526 |
| EGFR | 0.746 | 0.610 | 0.715 | 59.4 | 0.583 |
| EGFN | 0.772 | 0.612 | 0.659 | 59.4 | 0.567 |
| SRI | 0.768 | 0.575 | 0.489 | 54.4 | 0.399 |
© 2020 by the authors. Licensee MDPI, Basel, Switzerland. This article is an open access article distributed under the terms and conditions of the Creative Commons Attribution (CC BY) license (http://creativecommons.org/licenses/by/4.0/).
Share and Cite
Meng, R.; Lv, Z.; Yan, J.; Chen, G.; Zhao, F.; Zeng, L.; Xu, B. Development of Spectral Disease Indices for Southern Corn Rust Detection and Severity Classification. Remote Sens. 2020, 12, 3233. https://doi.org/10.3390/rs12193233
Meng R, Lv Z, Yan J, Chen G, Zhao F, Zeng L, Xu B. Development of Spectral Disease Indices for Southern Corn Rust Detection and Severity Classification. Remote Sensing. 2020; 12(19):3233. https://doi.org/10.3390/rs12193233
Chicago/Turabian StyleMeng, Ran, Zhengang Lv, Jianbing Yan, Gengshen Chen, Feng Zhao, Linglin Zeng, and Binyuan Xu. 2020. "Development of Spectral Disease Indices for Southern Corn Rust Detection and Severity Classification" Remote Sensing 12, no. 19: 3233. https://doi.org/10.3390/rs12193233