Article

A Google Earth Engine Tool to Investigate, Map and Monitor Volcanic Thermal Anomalies at Global Scale by Means of Mid-High Spatial Resolution Satellite Data

1
School of Engineering, University of Basilicata, Via dell’Ateneo Lucano, 10, 85100 Potenza, Italy
2
National Research Council, Institute of Methodologies for Environmental Analysis, C. da S. Loja, 85050 Tito Scalo (Pz), Italy
*
Author to whom correspondence should be addressed.
Remote Sens. 2020, 12(19), 3232; https://doi.org/10.3390/rs12193232
Submission received: 26 August 2020 / Revised: 23 September 2020 / Accepted: 30 September 2020 / Published: 4 October 2020
(This article belongs to the Collection Feature Papers for Section Environmental Remote Sensing)

Abstract

:
Several satellite-based systems have been developed over the years to study and monitor thermal volcanic activity. Most of them use high temporal resolution satellite data, provided by sensors like the Moderate Resolution Imaging Spectroradiometer (MODIS) that if on the one hand guarantee a continuous monitoring of active volcanic areas on the other hand are less suited to map thermal anomalies, and to provide accurate information about their features. The Multispectral Instrument (MSI) and the Operational Land Imager (OLI), respectively, onboard the Sentinel-2 and Landsat-8 satellites, providing Short-Wave Infrared (SWIR) data at 20 m (MSI) and 30 m (OLI) spatial resolution, may make an important contribution in this area. In this work, we present the first Google Earth Engine (GEE) App to investigate, map and monitor volcanic thermal anomalies at global scale, integrating Landsat-8 OLI and Sentinel-2 MSI observations. This open tool, which implements the Normalized Hot spot Indices (NHI) algorithm, enables the analysis of more than 1400 active volcanoes, with very low processing times, thanks to the high GEE computational resources. Performance and limitations of the tool, such as its next upgrades, aiming at increasing the user-friendly experience and extending the temporal range of data analyses, are analyzed and discussed.

1. Introduction

Every year on average about 50–70 active volcanoes erupt, posing a serious threat at both local and global scale (e.g., [1,2]). Pyroclastic flows, lava flows, ashfall, gas emissions, tsunami and lahars induced by volcanic eruptions, may kill people and destroy infrastructure and vegetated areas (e.g., [2,3,4,5,6]). During strong explosive eruptions, huge quantities of gas and ash particles may be injected into the atmosphere, with a global effect on climate change (e.g., [4,7]). Volcanic ash may also cause significant air traffic disruptions, because of potential damage to aircraft engines, and to the exposed surfaces of the aircrafts [8,9]. Systems capable of guaranteeing a continuous and efficient monitoring of these phenomena are fundamental to mitigate volcanic risk.
In this direction, several methods have been developed over the years to monitor thermal volcanic activity in near-real time (e.g., [10,11,12,13,14,15,16]), exploiting advantages of satellite remote sensing, in terms of global coverage, and of multi-spectral data provided at different spatial/temporal resolutions.
MODVOLC [17] and Middle InfraRed Observation of Volcanic Activity (MIROVA) [18] are two well-established Moderate-resolution Imaging Spectroradiometer (MODIS)-based systems running operationally. MODVOLC has performed the worldwide analysis of volcanic thermal anomalies since 2000, providing information about lava flows and other hot features in terms of hot spot pixel number, Medium Infrared (MIR) radiance, and volcanogenic radiant flux [12,17]. MIROVA provides automatic alerts about ongoing eruptions for over more than 200 active volcanoes, with the possibility of adding new target areas, based on hardware resources [19]. Both MODVOLC and MIROVA deliver hot spot products a few hours after the sensing time (e.g., 1–2 h for MODVOLC). REALVOLC [20], the Alaska Volcano Observatory (AVO) [21], Kamchatka Volcanic Eruption Response Team (KVERT) [22], Robust Satellite Techniques for Volcanoes (RSTVOLC) [23], HOTSAT [24] and HOTVOLC [25], are other efficient monitoring systems running over volcanic regions of interest. Some of them use infrared Advanced Very High-Resolution Radiometer (AVHRR) and/or Spinning Enhanced Visible and Infrared Imager (SEVIRI) data in combination with MODIS data, to increase the frequency of observation of hot targets (e.g., [23,24,25]). These systems, although highly contributing to the surveillance of active volcanoes, are however less suited to map volcanic thermal anomalies, and to provide accurate information about their features (e.g., location, spatial extent), due to the use of high-temporal/low spatial resolution satellite data (e.g., 15 min/3 km at the nadir for SEVIRI).
Databases such as the Aster Volcano Archive ((AVA); [26]) and ASTER Volcanic Thermal Output Database ((AVTOD); [27]), collecting information from the Advanced Thermal Emission and Reflection Radiometer (ASTER) are more suitable for these purposes. Unfortunately, since 2008 ASTER Short-Wave Infrared (SWIR) data (30 m spatial resolution) are no longer usable, due to the malfunctioning of SWIR detectors [28]. Since then only Thermal Infrared (TIR) data (90 m spatial resolution) have been used for volcanological studies (see [29] and reference therein).
Recent works have shown that the Operational Land Imager (OLI) sensor, offering some important enhancement to prior Landsat instruments [30], may be used with success to localize active vents, map lava flows and assess changes in thermal volcanic activity (e.g., [31,32]). The Multispectral Instrument (MSI), onboard Sentinel-2 satellites, has further extended this potential [33,34,35,36]. Systems capable of exploiting SWIR data from those sensors (20/30 m spatial resolution—MSI/OLI), with the combined revisit time of the Sentinel-2 and Landsat-8 satellites (~2.9 days [37]), may then represent an added-value in the framework of volcano monitoring.
In this paper, we present an original tool for the worldwide analysis and mapping of volcanic thermal anomalies from space, integrating Sentinel-2 MSI and Landsat-8 OLI observations. The tool, implementing the recently proposed Normalized Hot spot Indices (NHI) algorithm [35], is to our knowledge the first one based on the Google Earth Engine (GEE) developed for thermal anomaly investigation (e.g. see [38]). We describe the tool’s features, its advantages, limitations and next upgrades, in the next sections.

2. Methods

2.1. NHI Algorithm

The NHI algorithm identifies volcanic thermal anomalies in daylight conditions, on Landsat-8 OLI and Sentinel-2 MSI scenes, here after indicated as L8-OLI and S2-MSI, through the computation of two normalized indices (ranging in between ±1), exploiting the sensitivity of SWIR observations to high-temperature features (e.g., [31]):
N H I S W I R = L 2.2 L 1.6 L 2.2 + L 1.6
N H I S W N I R = L 1.6   L 0.8   L 1.6   + L 0.8  
In Equation (1), L 1.6   and   L 2.2 are the Top of the Atmosphere (TOA) radiances [W m−2 sr−1 µm−1] measured, for each pixel of the scene, at around 1.6 µm (SWIR1) and 2.2 µm (SWIR2) wavelength. In Equation (2), L 0.8 is the TOA radiance measured in the (NIR) band, at around 0.8 µm wavelength. Pixels with values of N H I S W I R > 0   OR N H I S W N I R > 0 are flagged as thermal anomalies. As shown in [35], while the first test ( N H I S W I R > 0 ) enables the identification of mid-low intensity hot spots, the second one ( N H I S W N I R > 0 ) detects those of a higher intensity level, which frequently cause the pixel saturation in the SWIR2 band (e.g., OLI channel 7; nominal saturation of 24.3 W/m2 sr μm [39]).
In a previous paper [35], we tested the NHI algorithm over a number of active volcanoes located in different geographic areas, retrieving information about thermal anomalies in good agreement with independent field and satellite-based observations. These results encouraged us to implement the algorithm within the GEE environment, as discussed in detail in Section 2.3.

2.2. The Google Earth Engine (GEE) Platform
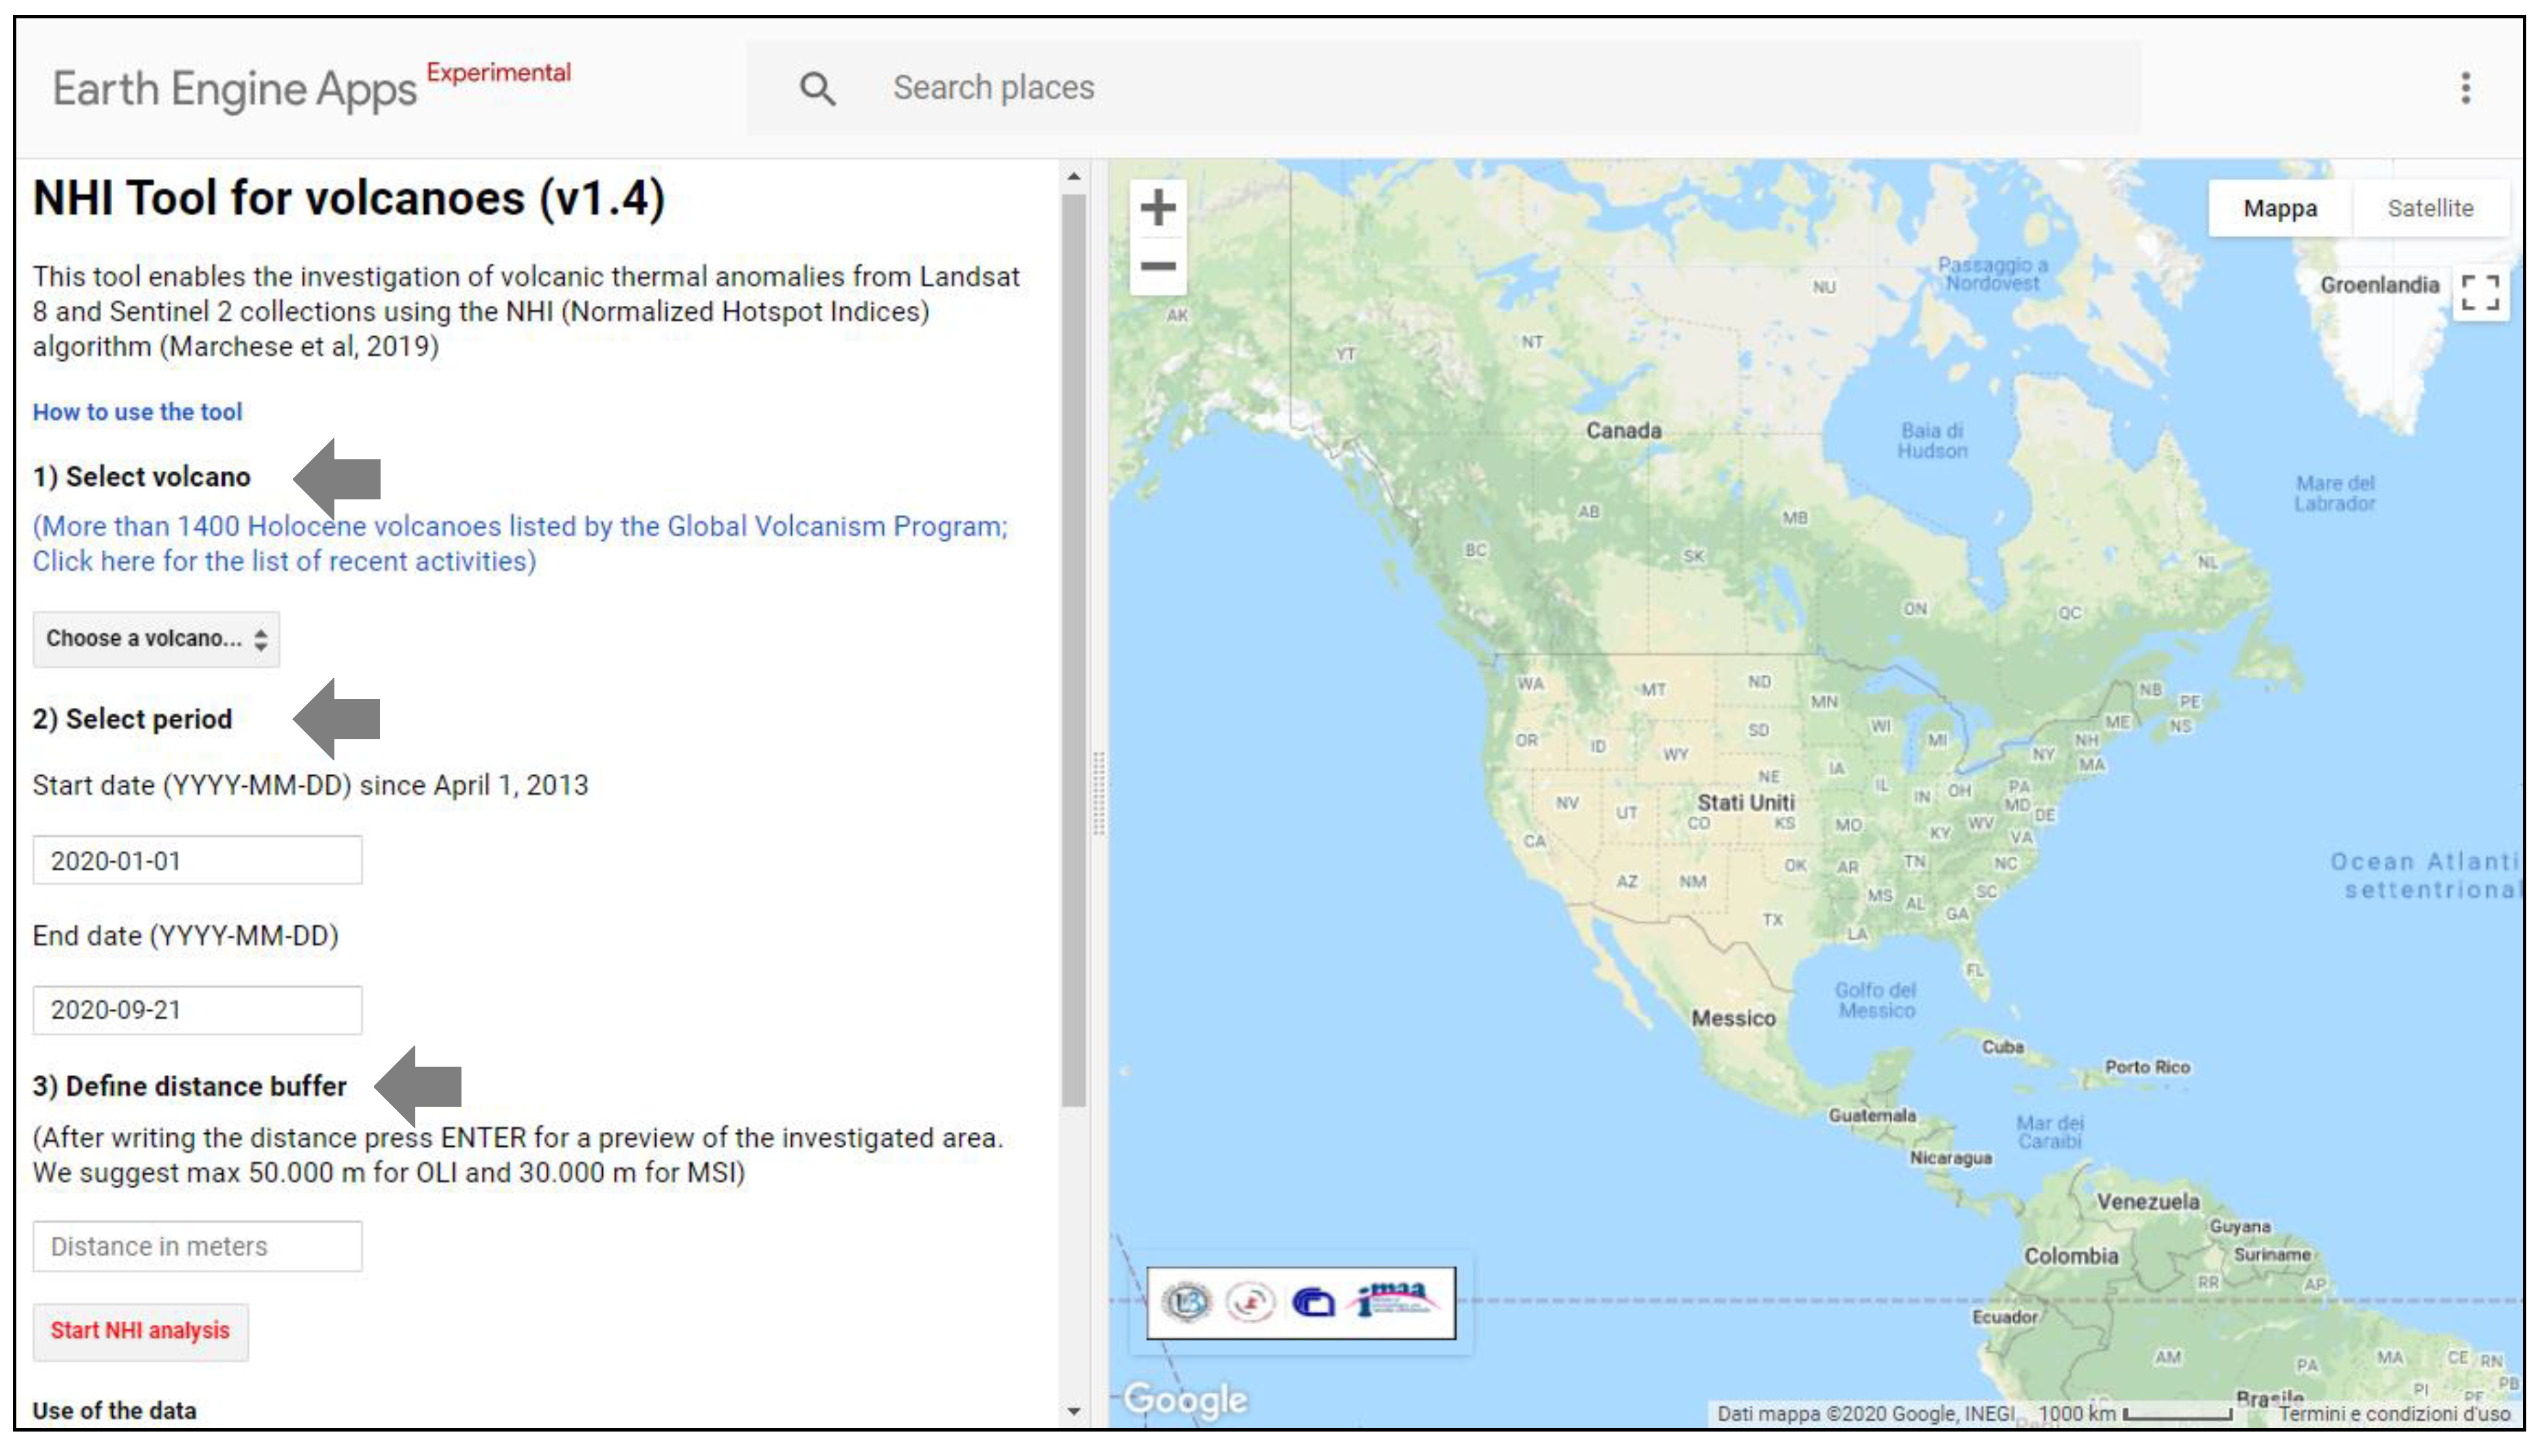
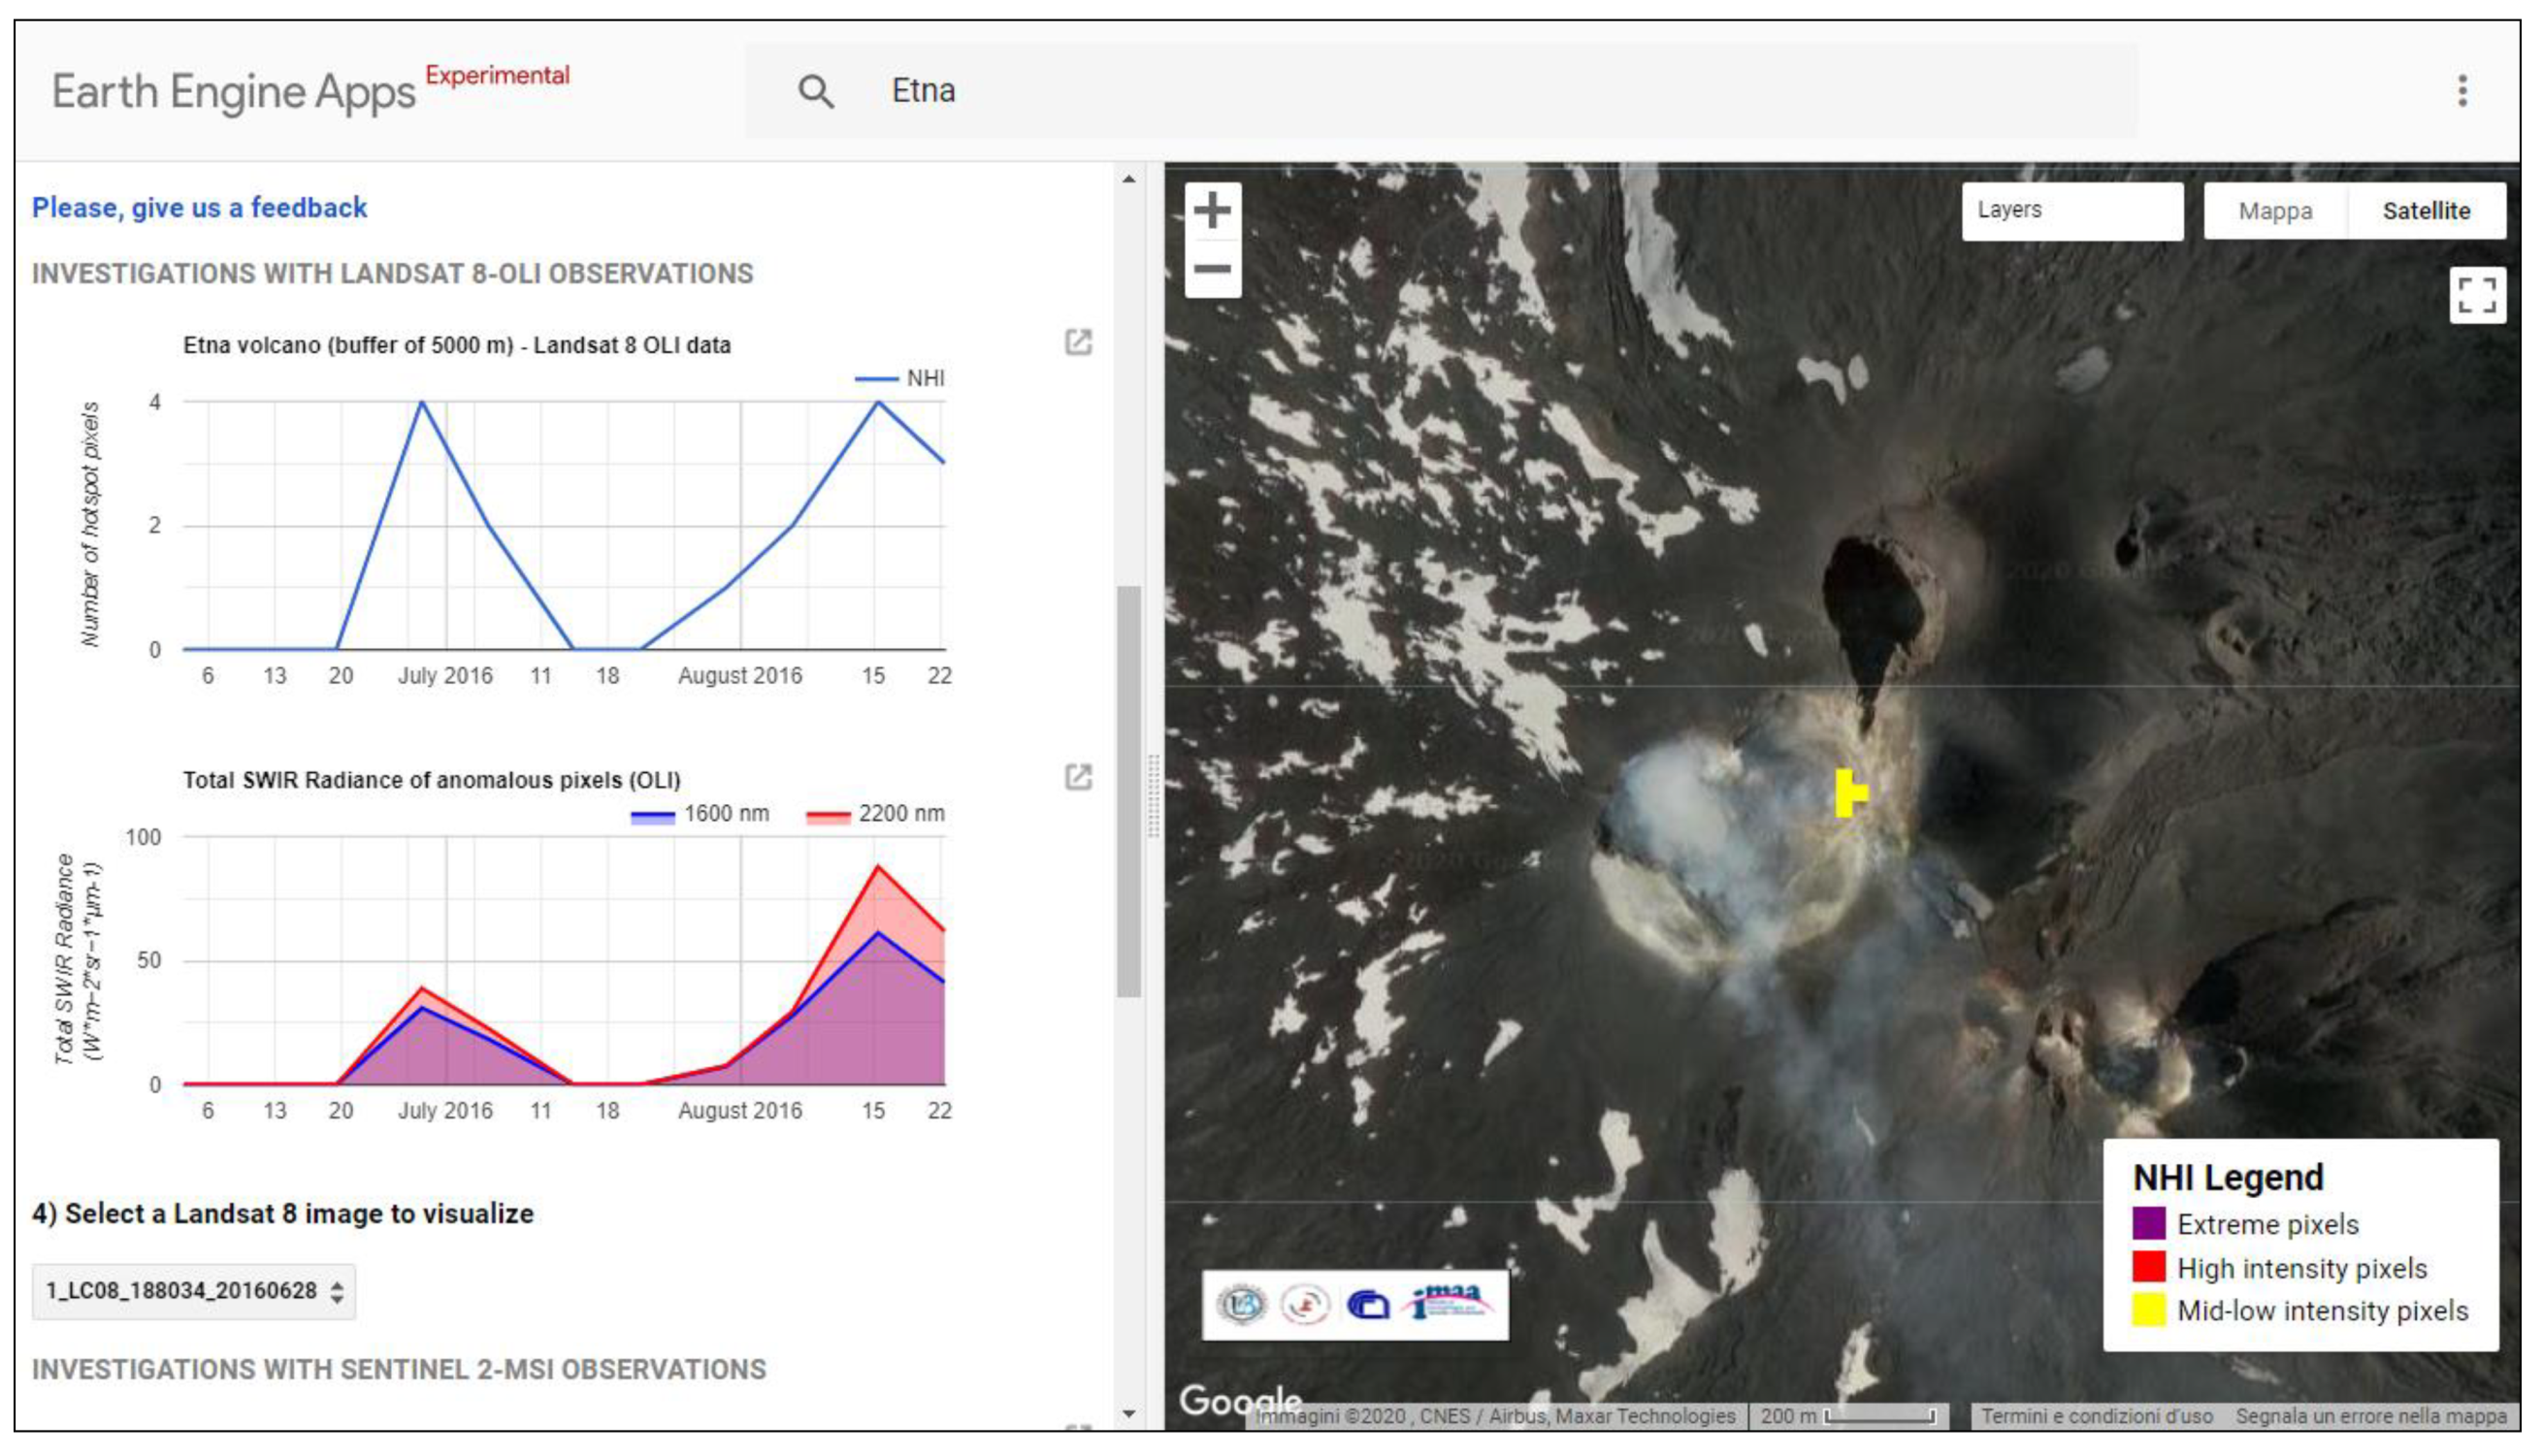
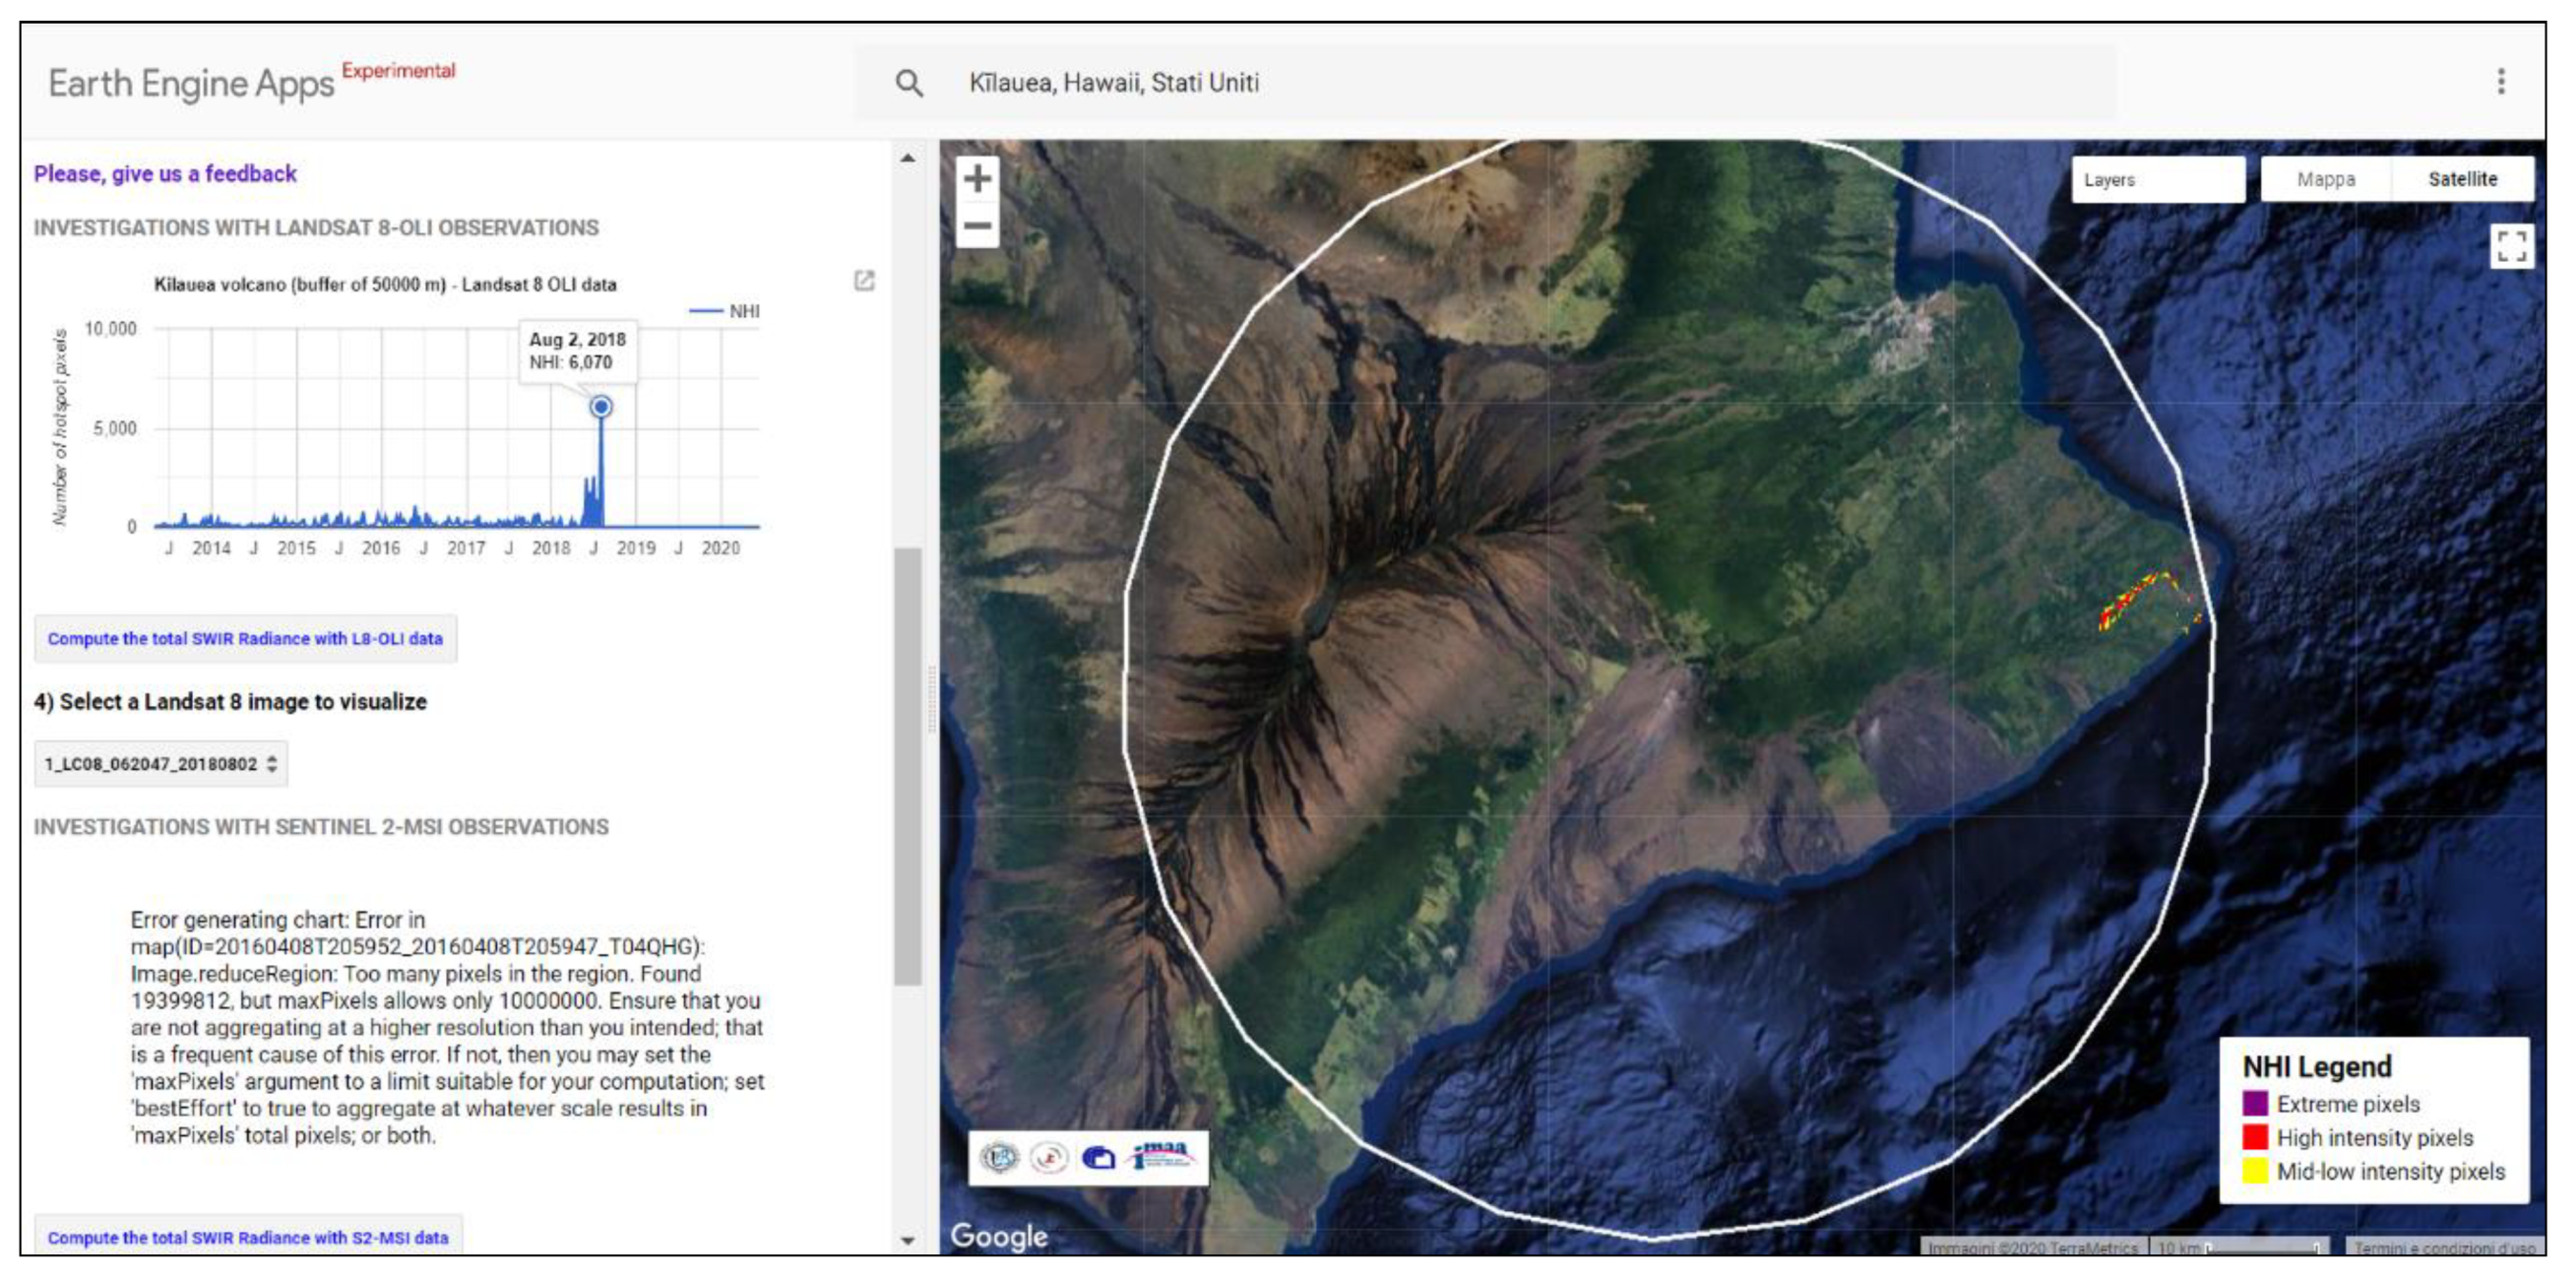
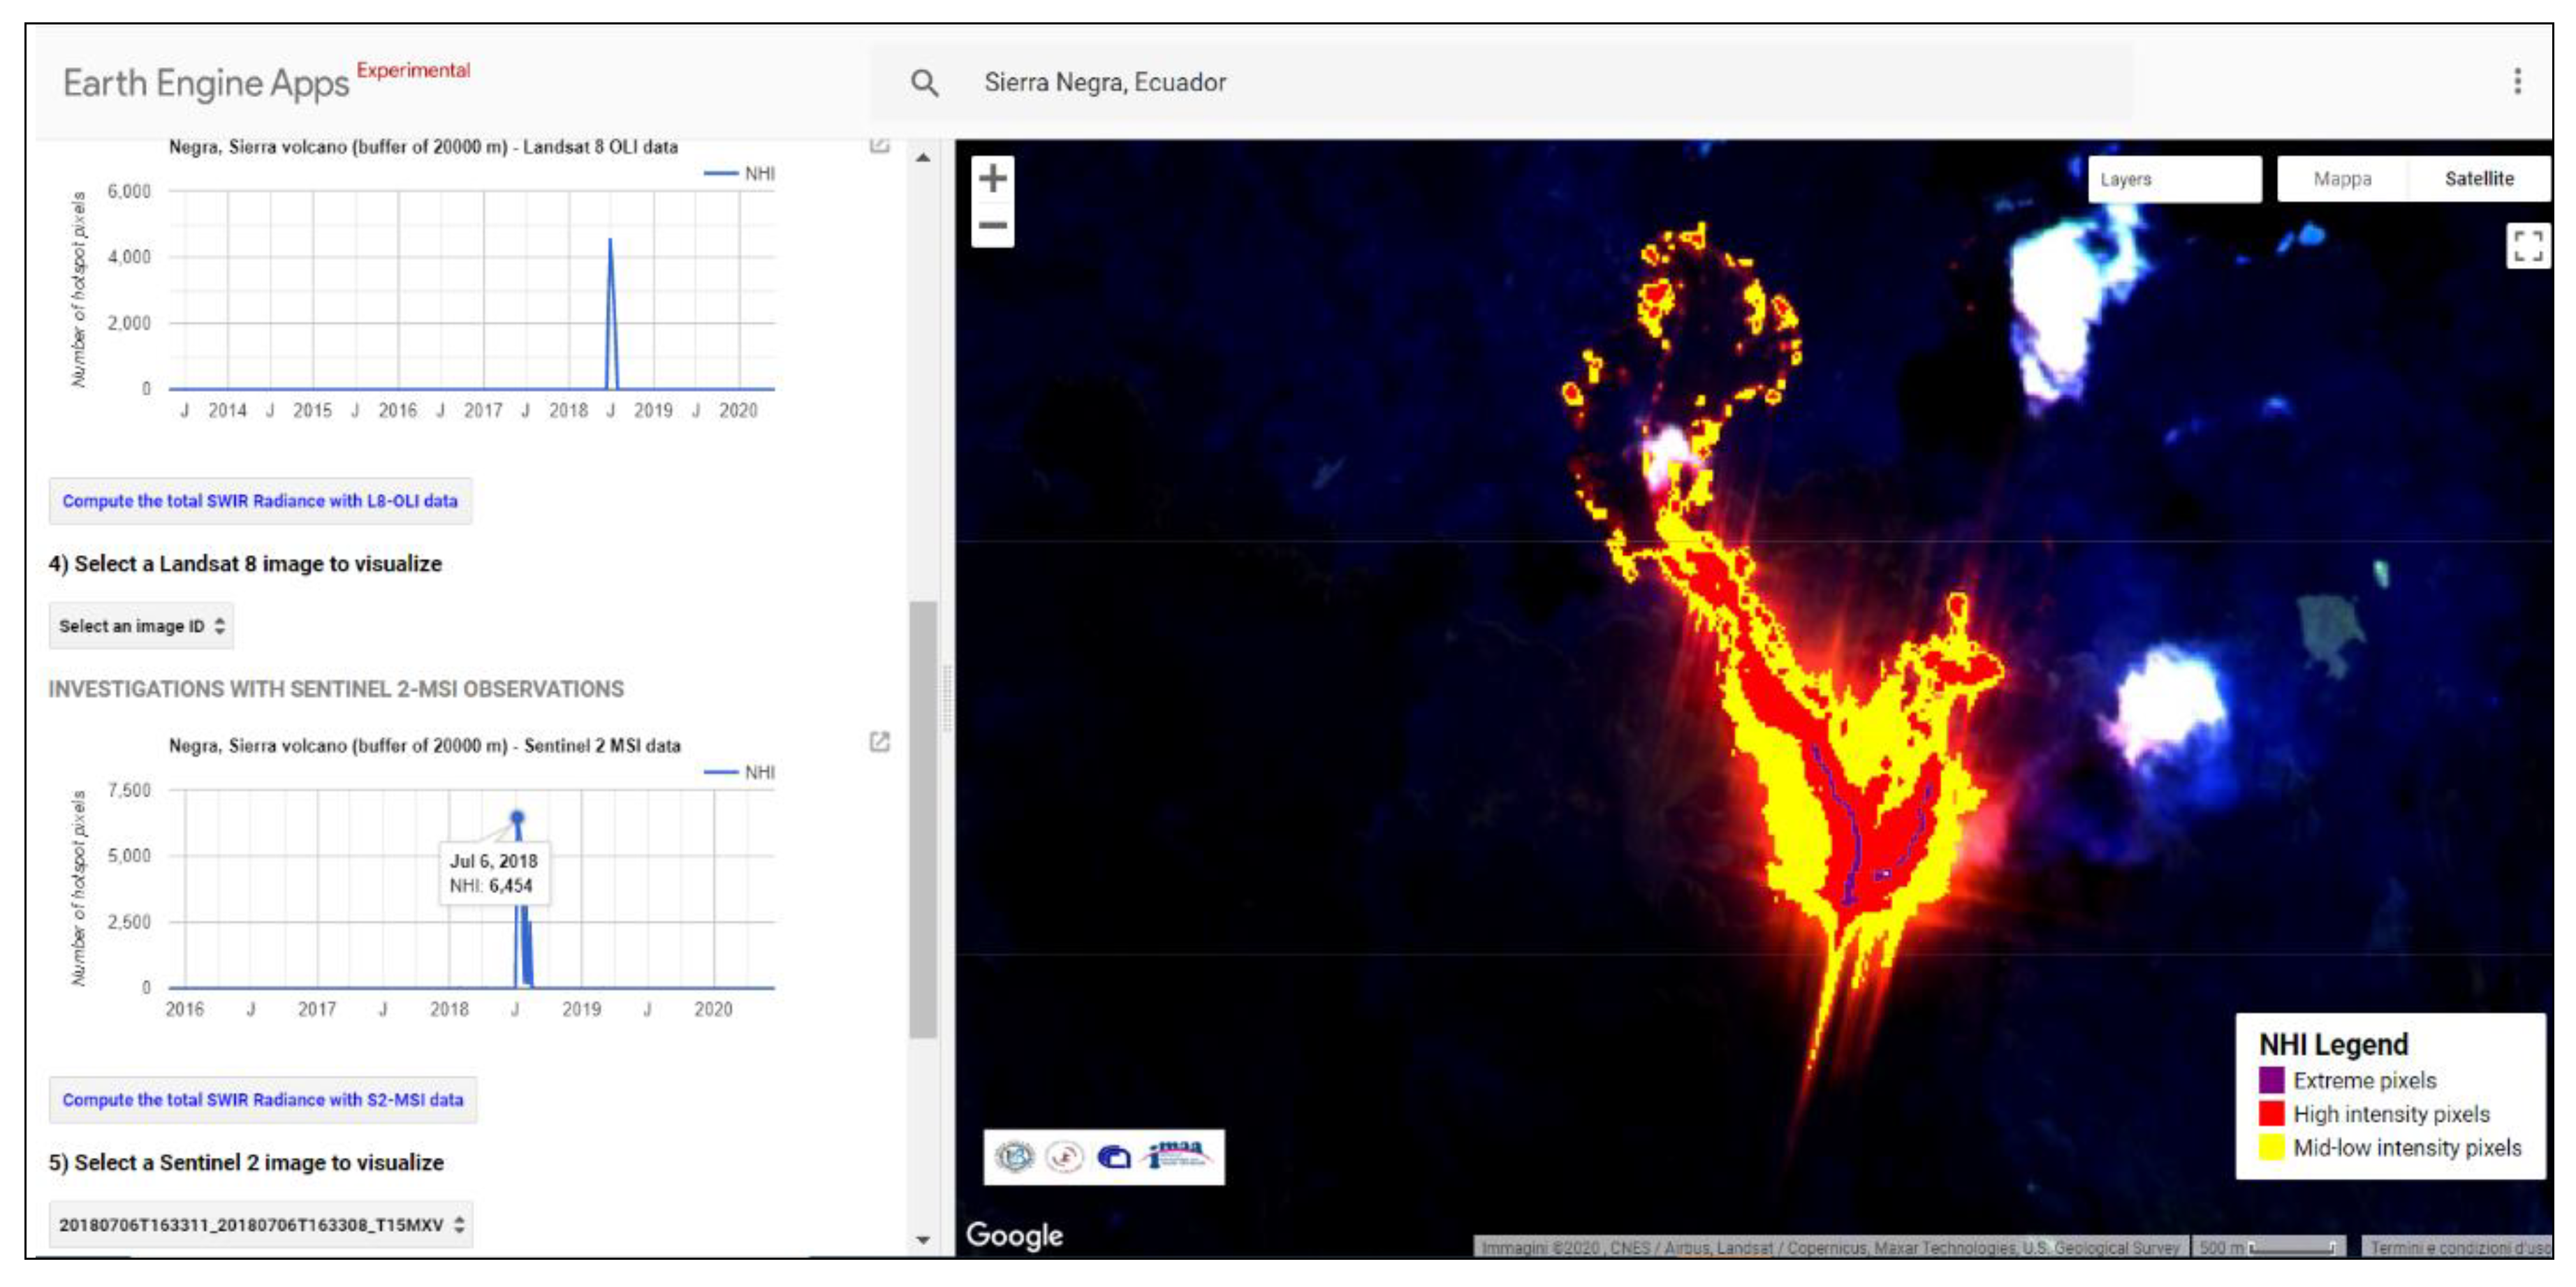
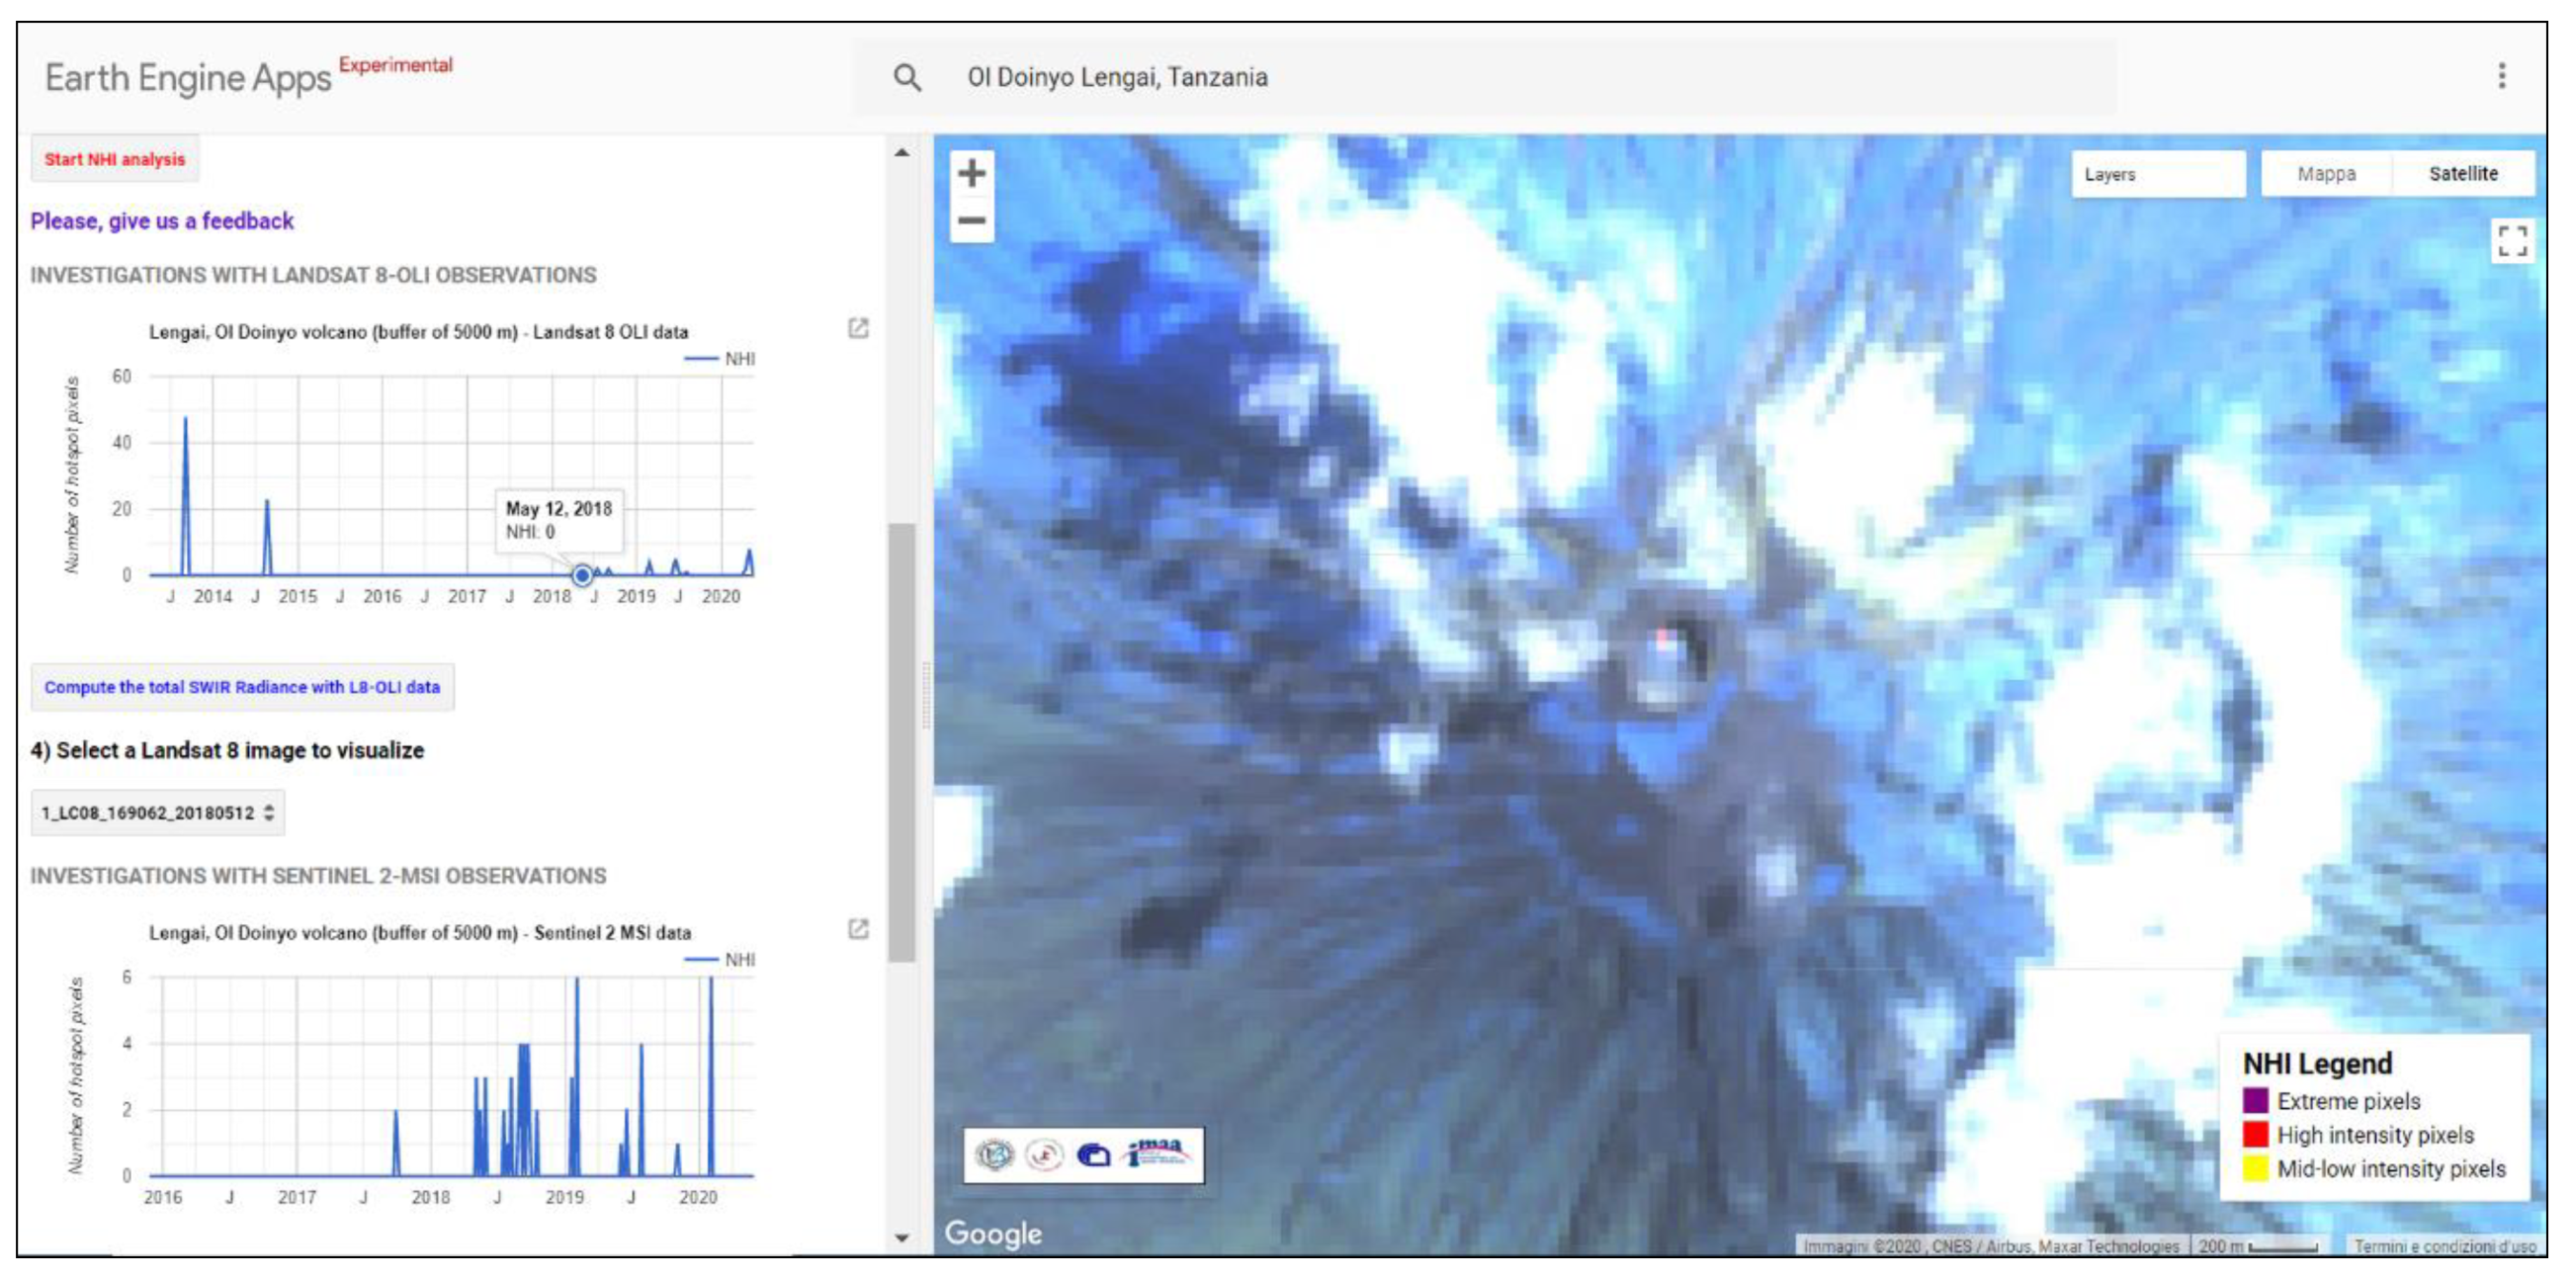
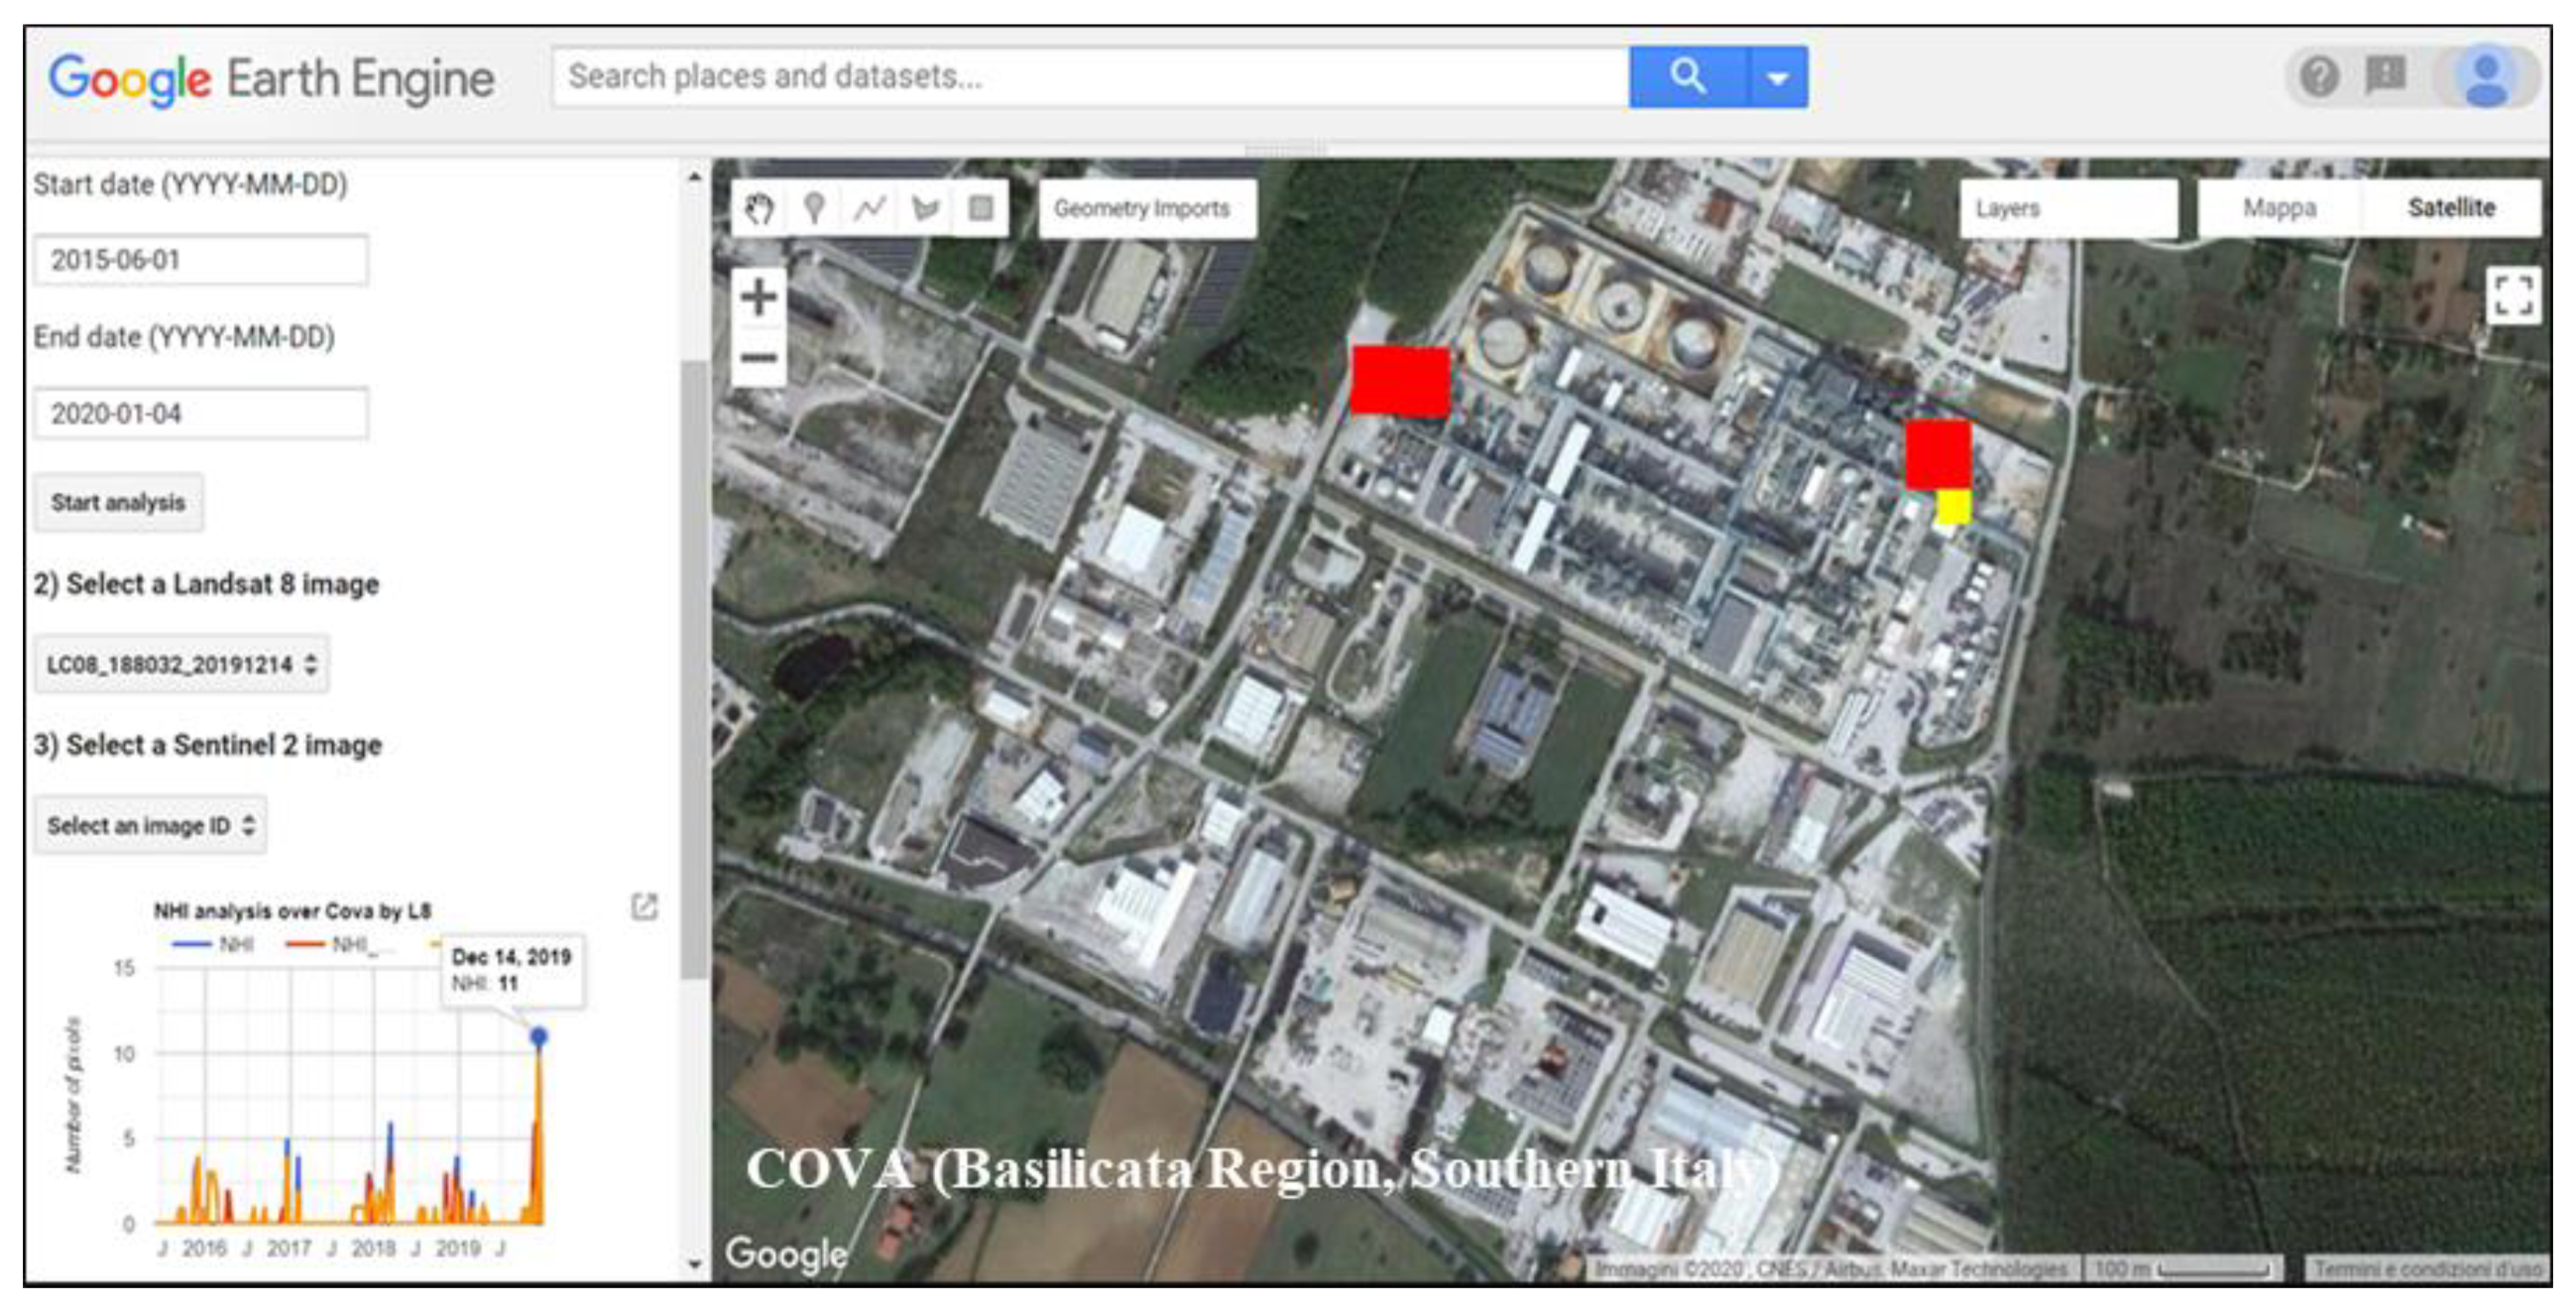
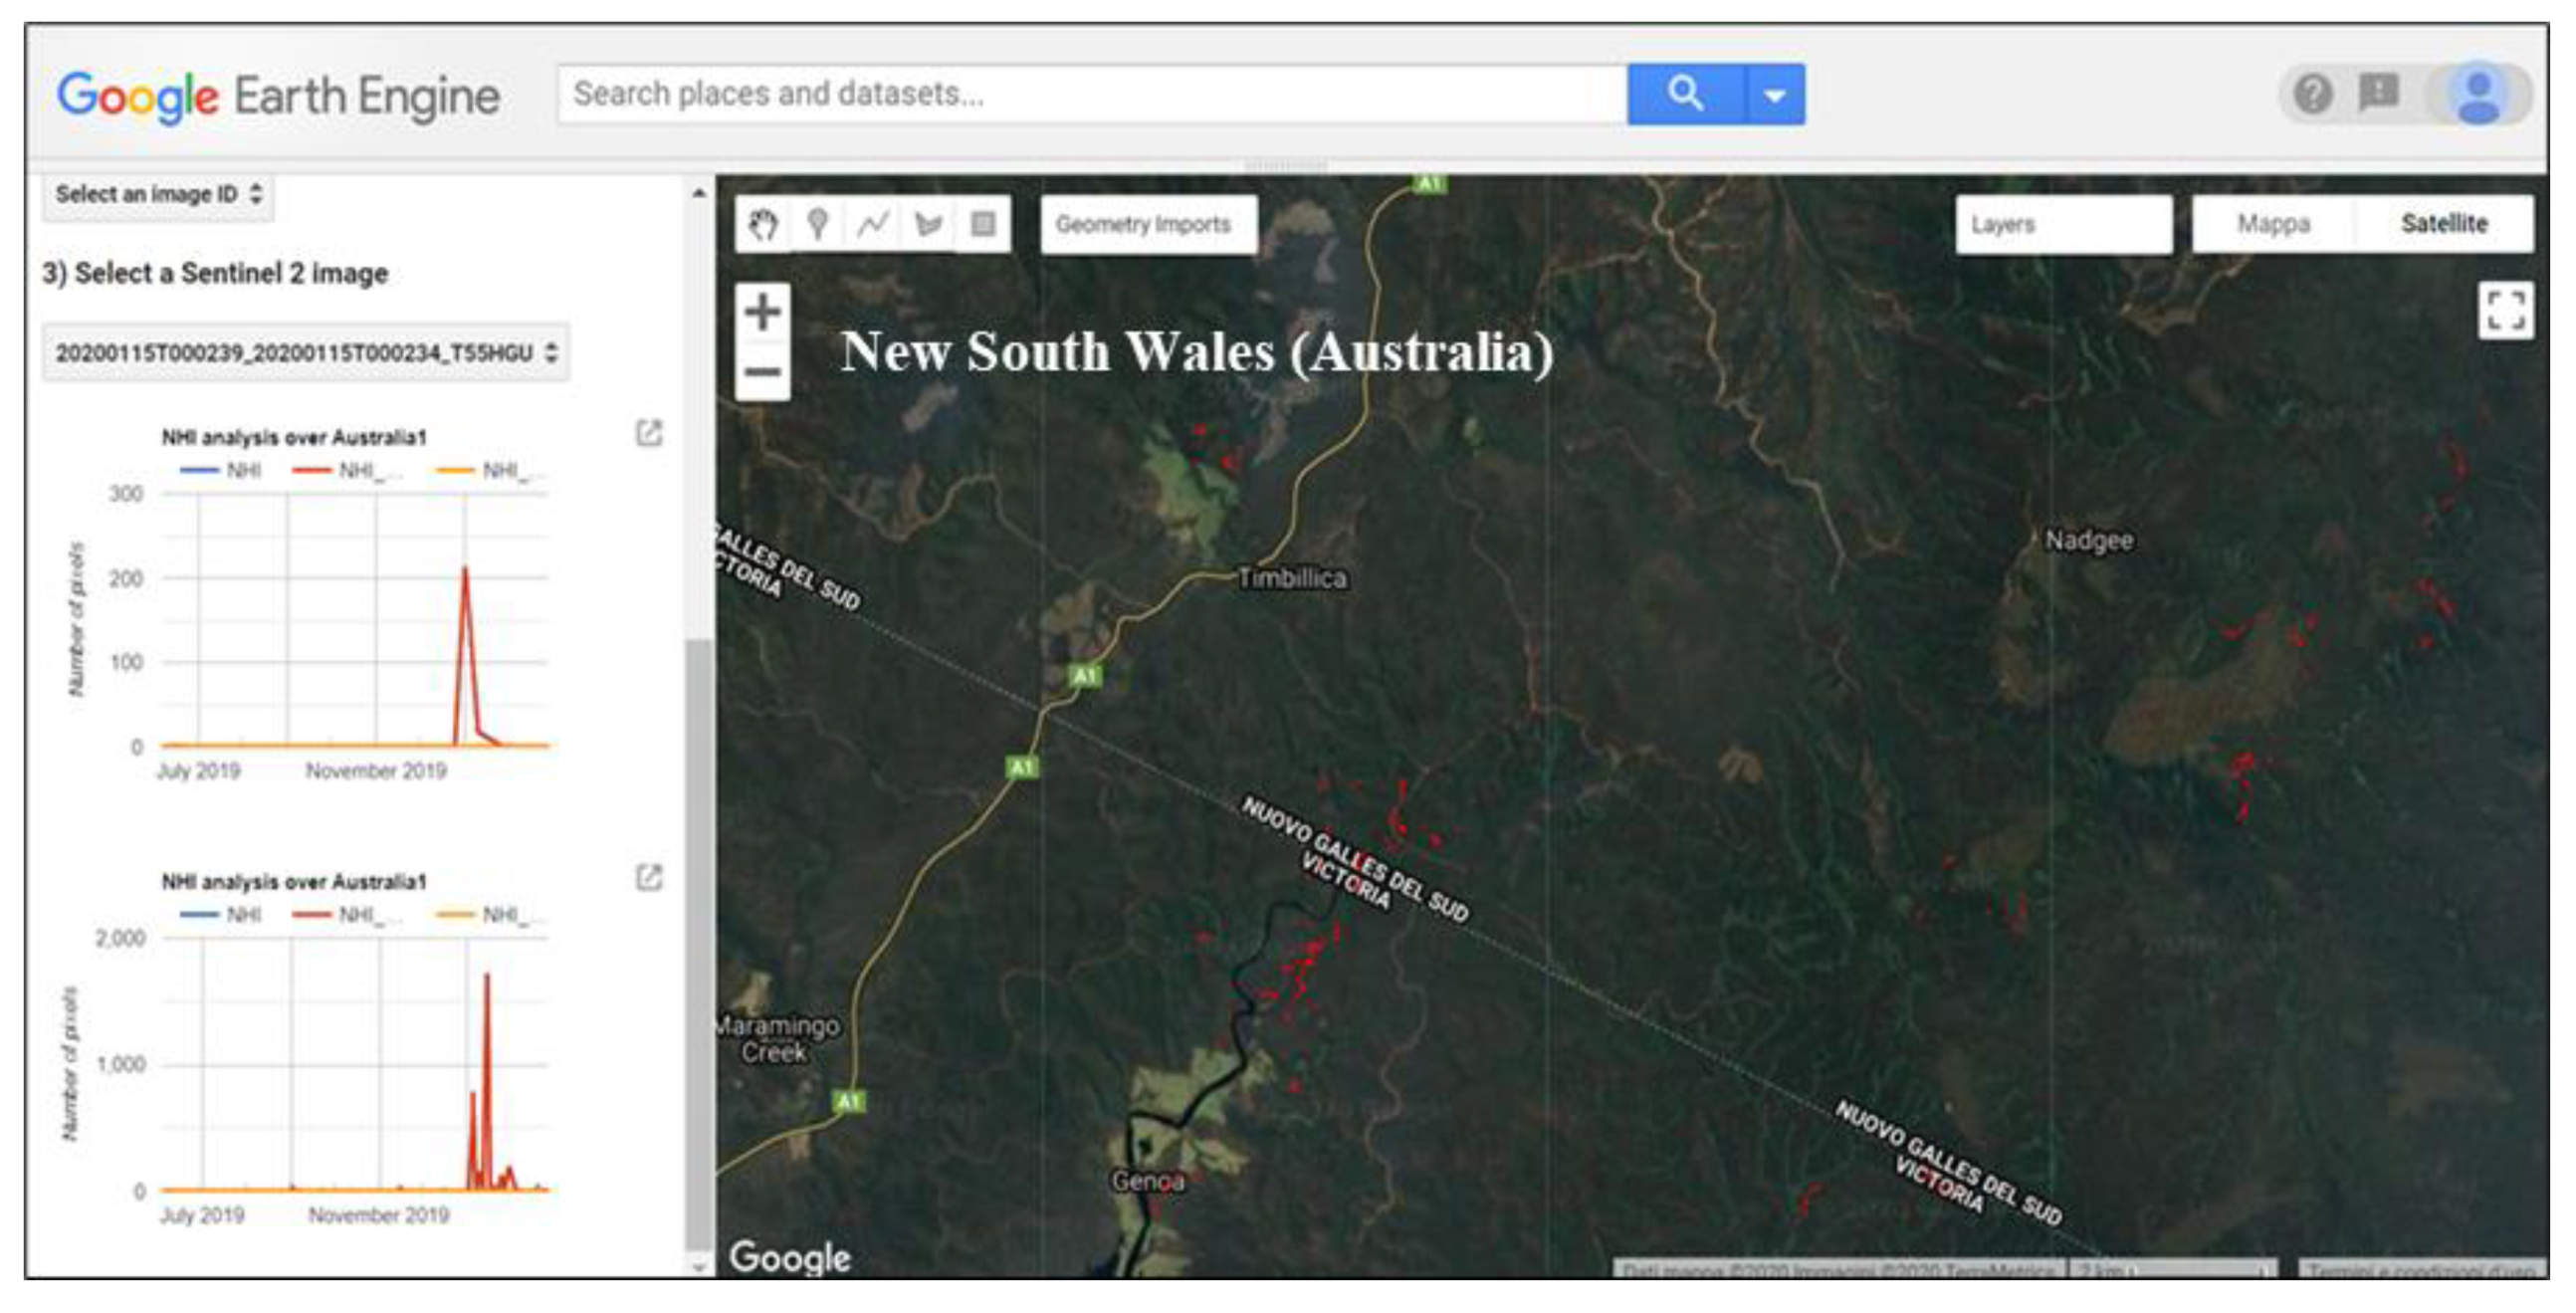
Google Earth Engine is a powerful cloud-based geo-spatial processing platform. It is addressed to a wide audience (e.g., scientists, policy makers, non-profit users), to facilitate the access to high-performance computing resources, for the analysis of huge georeferenced datasets. The GEE platform helps researchers in disseminating and sharing their results. Once an algorithm is developed, users can deliver systematic data products or deploy interactive applications, backed by the GEE’s resources [40]. The GEE platform allows for the processing of long and densely populated time-series of satellite imagery, thanks to the access to different Earth-Observing (EO) data catalogues (e.g., U.S. Geological Survey-Landsat), and to the policies of EO imagery access (e.g., the Full, Open and Free data access policy of European Commission-European Space Agency Sentinel). In detail, GEE consists of large data catalogue archives (open and free accessible) of geospatial datasets, and in a set of library functions, which are optimized for the parallel processing of geospatial data. Users can handle both the pre-processed ready-to-use public data and their own data, through the internet-accessible application programming interfaces (API), and/or the web-based interactive development environment (IDE). The GEE data catalogue includes: (i) historical and current EO satellite images, which are updated on a daily basis; (ii) scientific datasets, such as meteorological and climatological data (e.g., climate forecasts); (iii) geophysical (e.g., land cover data, digital elevation models) and socio-economic data [41]. A wide range of functions compose the GEE’s library. They include simple mathematical functions, common image processing operations, and algorithms developed for specific datasets (e.g., calibration algorithm for Landsat data). Although the GEE platform allows users to perform analyses at planetary scale, it imposes some limitations to avoid the monopolization of the system. They include the maximum duration of requests, the number of simultaneous requests per user, and the number of simultaneous executions for particular operations. A wide description of the GEE cloud computing environment, and a list of studies exploiting the GEE capabilities in different application fields, can be found in [41].

2.3. NHI Tool

The NHI tool, by exploiting the high computational resources and the extended public data archive of the GEE platform, enables the worldwide identification and mapping of volcanic thermal anomalies. The tool is accessible online, without any authentication, at the URL https://nicogenzano.users.earthengine.app/view/nhi-tool and through the open data portal of the Institute of Methodology for Environmental Analysis (IMAA) webpage [42].
Since the beta version (v.1.0) [35], the NHI tool has been developed as a GEE-App, including a group of features (i.e., GEE Feature Collection), corresponding to about 1400 Holocene’s volcanoes listed by the Global Volcanism Program (GVP) [43] (see Figure 1). The NHI tool v.1.1 was made available online in January 2020, and included an initial test on SWIR2 radiance to avoid the generation of false positives due to differences in signal to noise ratio (SNR) and minimum radiance of used spectral bands (e.g., [44,45,46]). By testing the tool over different volcanic areas, we observed that false detections mostly affected S2-MSI scenes, in correspondence to cloud-edges mainly over sea areas. By the manual inspection of satellite imagery, we found that these features were related to multispectral misregistration of S2-MSI imagery, affecting high-altitude moving objects (e.g., planes, clouds) [47].
To minimize the impact of S2-MSI data issues on thermal anomaly identification, we implemented a spectral filter within the tool, which combined a normalized index analyzing radiance measured in bands 12 and 8A of the MSI sensor to a spectral test on visible radiance (see v.1.2 in Table 1). This spectral filter reduced the number of false positives at the expense of an increase in missed detections (see also Section 3.5). Hence, we better tuned the filter with the next tool release (v.1.3); the latter included an additional spectral test to better map very intense thermal anomalies yielding the saturation of both SWIR channels (see test for “extreme pixels” in Table 1). The NHI tool v.1.4 used here is similar to the previous one, apart from a function directly integrating L8-OLI and S2-MSI observations (see Section 3.2).
As for previous tool versions, users may access the client-side of the GEE App through the graphical user interface (GUI). In detail, users may run the process through the “Start NHI Analysis” button after selecting the volcano of interest, from a drop-down menu, and setting the temporal range and the distance buffer (DB). The system generates two charts of hot spot pixel number, one for each data collection (see plot 1 in Figure 2), except when, due to the imposed computation limits of the GEE platform, a high distance buffer (i.e., >50 km for Landsat-8; >30 km for Sentinel-2 data) is used [41]. Users may then visualize the additional plots of total SWIR radiance, which is calculated by summing radiances of detected hot spot pixels at the relative SWIR wavelength (plot 2 in Figure 2), and of total hot spot area (see Section 3.2). These products may be download in three different formats, i.e., comma-separated values (CSV), Scalable Vector Graphics (SVG) and Portable Network Graphic (PNG), for the offline analysis of results. Once the system generates these charts, users may overlap thermal anomalies to a static very-high resolution image or a topographic map of the volcano. Finally, the “Layers menu” area allows users to visualize five different layers including: (i) the investigated area (white circle); (ii) three groups of hot spot pixels, classified as mid-low intensity pixels (in yellow), high-intensity pixels (in red) and extreme pixels (in violet) (see Table 1); (iii) the RGB product of the selected satellite scene (see Figure 2).
In the next section, we assess the capacity of the NHI tool (v.1.4) in investigating changes of thermal volcanic activity, in monitoring the space–time evolution of active lava flows, and in precisely localizing active vents, as a complement to information from other systems.

3. Results

3.1. Identification of Unrest/Quiescience Periods of Active Volcanoes

To assess the capacity of the NHI tool in providing information about unrest and quiescence periods of active volcanoes, we show in Figure 3 the results of the Tolbachik (Kamchatka, Russia) volcano investigation, performed by analyzing L8-OLI and S2-MSI data of April 2013–May 2020.
The most recent Tolbachick eruption began on 27 November 2012, after about 37 years of quiescence, and ended in mid-September 2013 [50]. Effusive activity was particularly intense especially during the first two days of the eruption, when the lava effusion rate was around 465 m3/s [51]. In late December 2012–June 2013, almost constant values of this parameter (~19 m3/s on average) were recorded. Afterwards, the lava effusion rate gradually decreased, until the end of the eruption [51,52].
Results from L8-OLI data (see chart on top-left side of the Figure 3) show the identification of a thermal anomaly at the Tolbachick volcano, associated to the above-mentioned lava effusion, from April 2013. In detail, the peak of hot spot pixel number (1482 pixels in total) refers to the satellite scene of 5 June 2013, when a major lava flow, moving in the SE direction, and some smaller flows affected the target area (see thermal anomaly map in Figure 3). Thermal anomaly in Figure 3 is in agreement with results of a previous independent study, where authors tested and compared three different hot spot detection methods, including the more recent HOTMAP algorithm [31]. Moreover, information from the tool is consistent with the Advanced Land Imager ALI observation of 6 June 2013, showing the presence of a lava pond in the active vent, a fluid lava in the center of lava flow, and some multiple flow-front breakouts [52].
It is worth mentioning that the tool identified also the inner part of the main flow, while it slightly overestimated its borders, due to data artifacts (see red pixels surrounding NHI detections), possibly associated to the same effects discussed in [39]. In addition, it missed a few hot spot pixels (~4-5%; see areas marked by the white circles) with SWIR2 radiance values slightly higher than the background. After June 2013, the hot spot pixel number drastically decreased also because of clouds, which strongly affected the target area, marking the reduction of thermal volcanic activity. Finally, results from L8-OLI data show that some thermal anomalies occurred also after the end of eruption (e.g., [53]). These features, which did not represent false positives (see also Table 2), may be ascribed to possible lava cooling effects recorded before the new quiescence phase of the volcano.
Regarding the outputs from S2-MSI data, they represented false positives associated to the striping of SWIR bands (e.g., [54]) and to residual multi-spectral misregistration issues, which were not completely removed by the spectral filter detailed in Table 1 (see Figure 4). The impact of these data issues on NHI tool performance is quantified in Section 3.5.

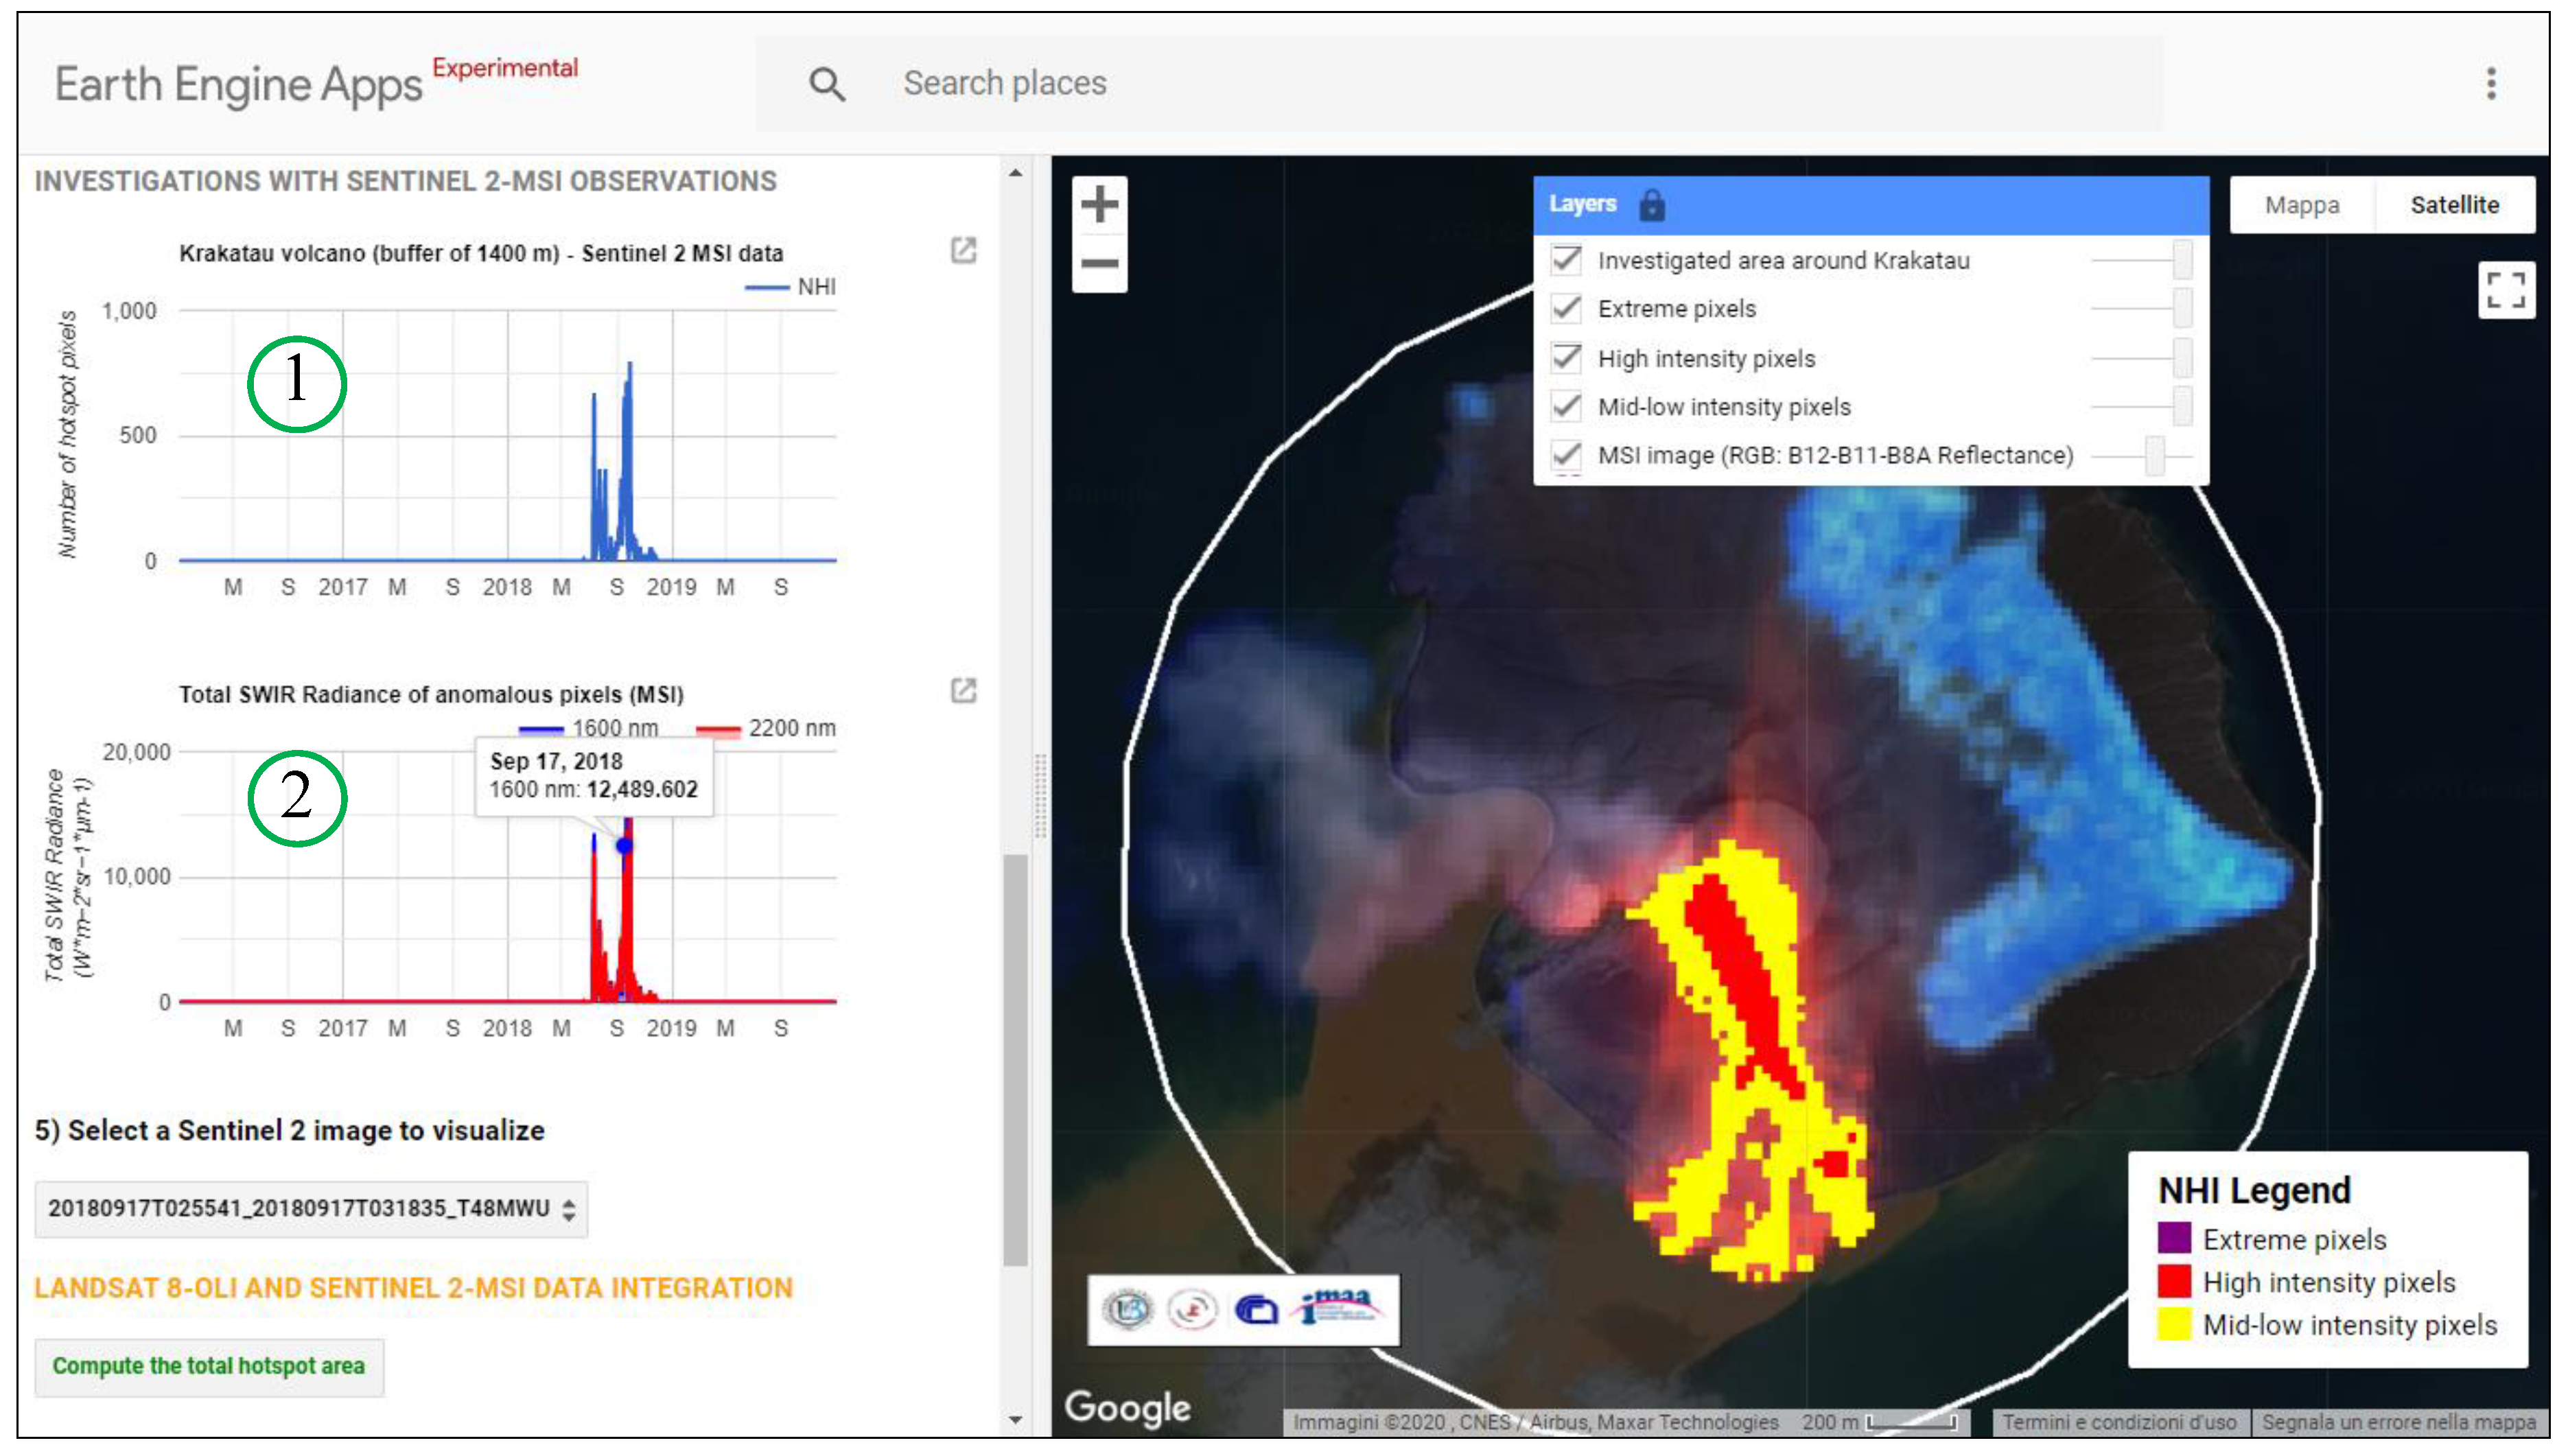
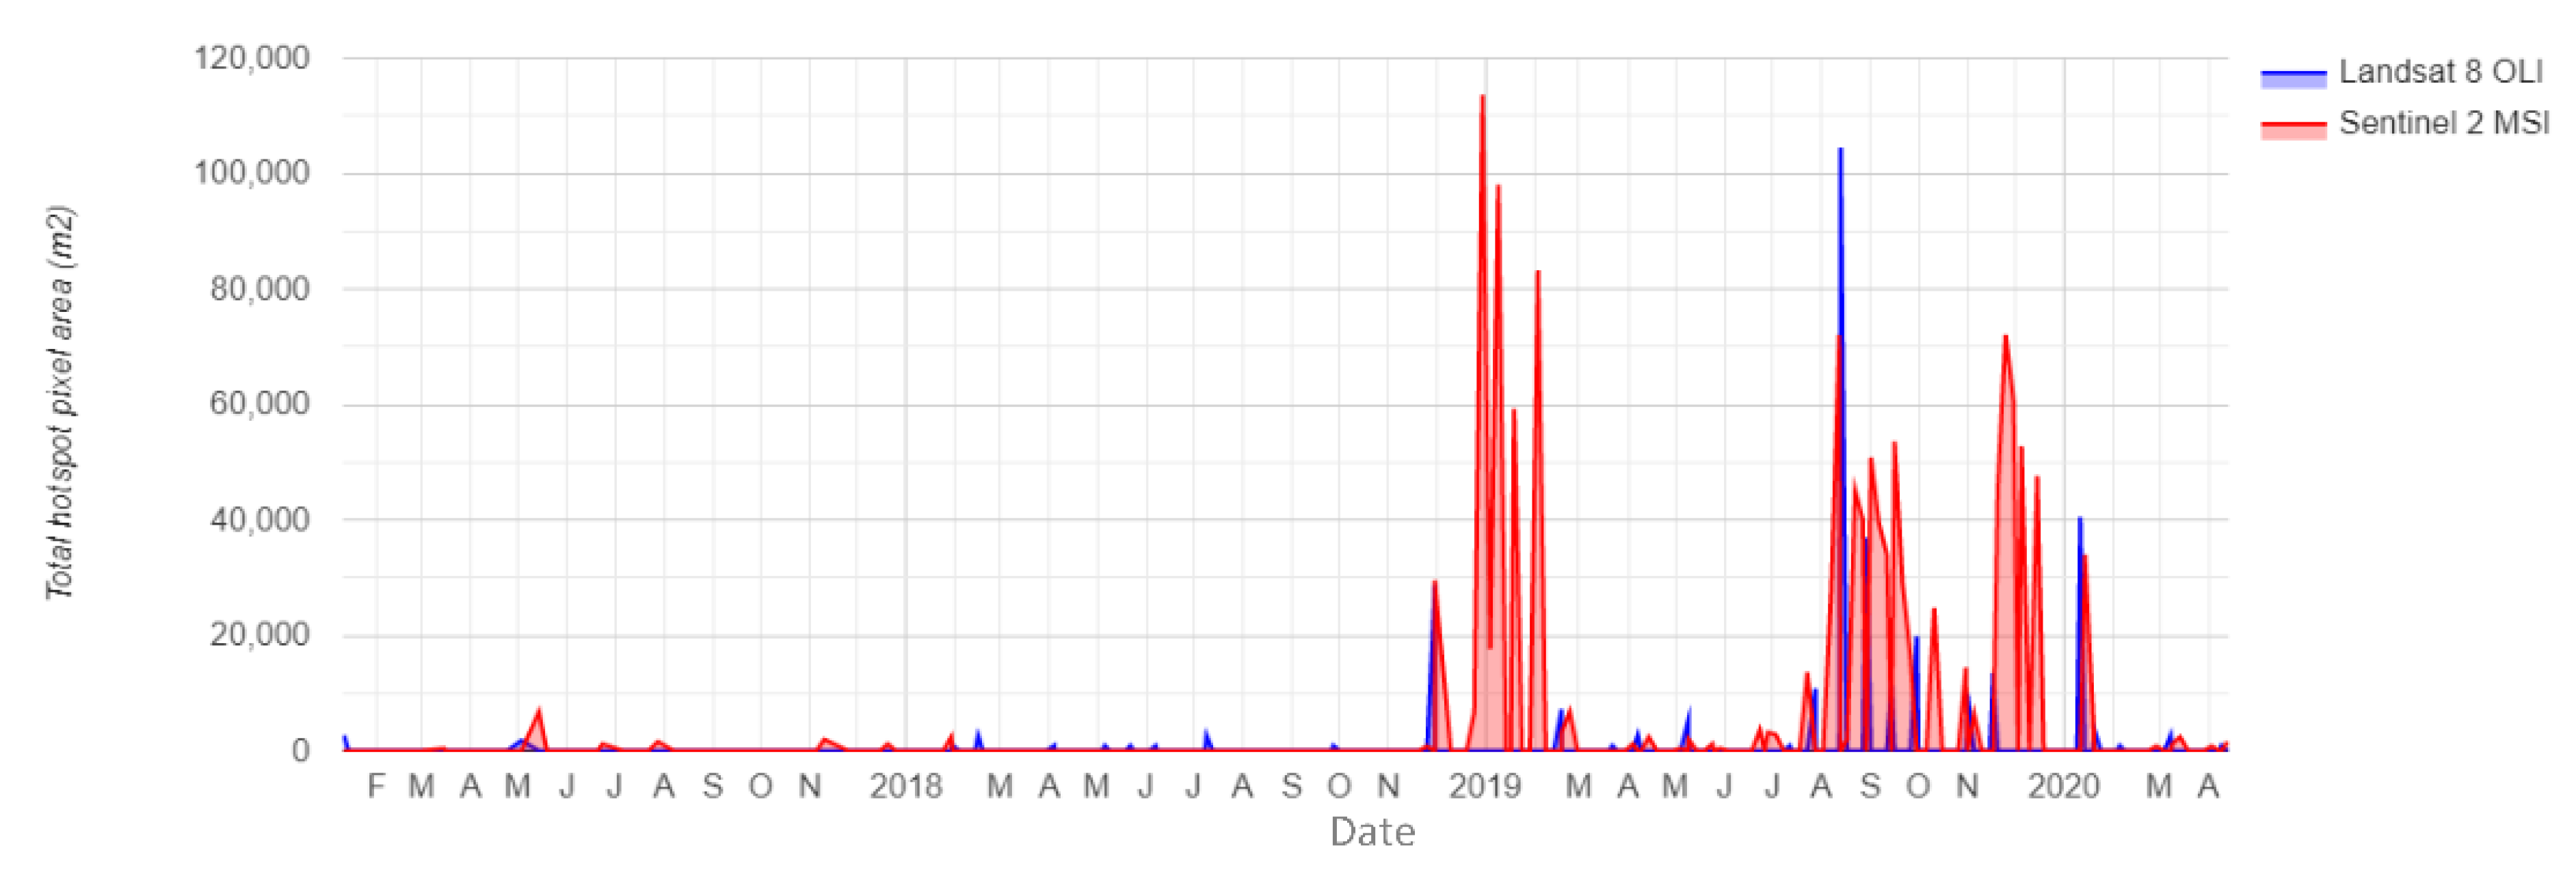
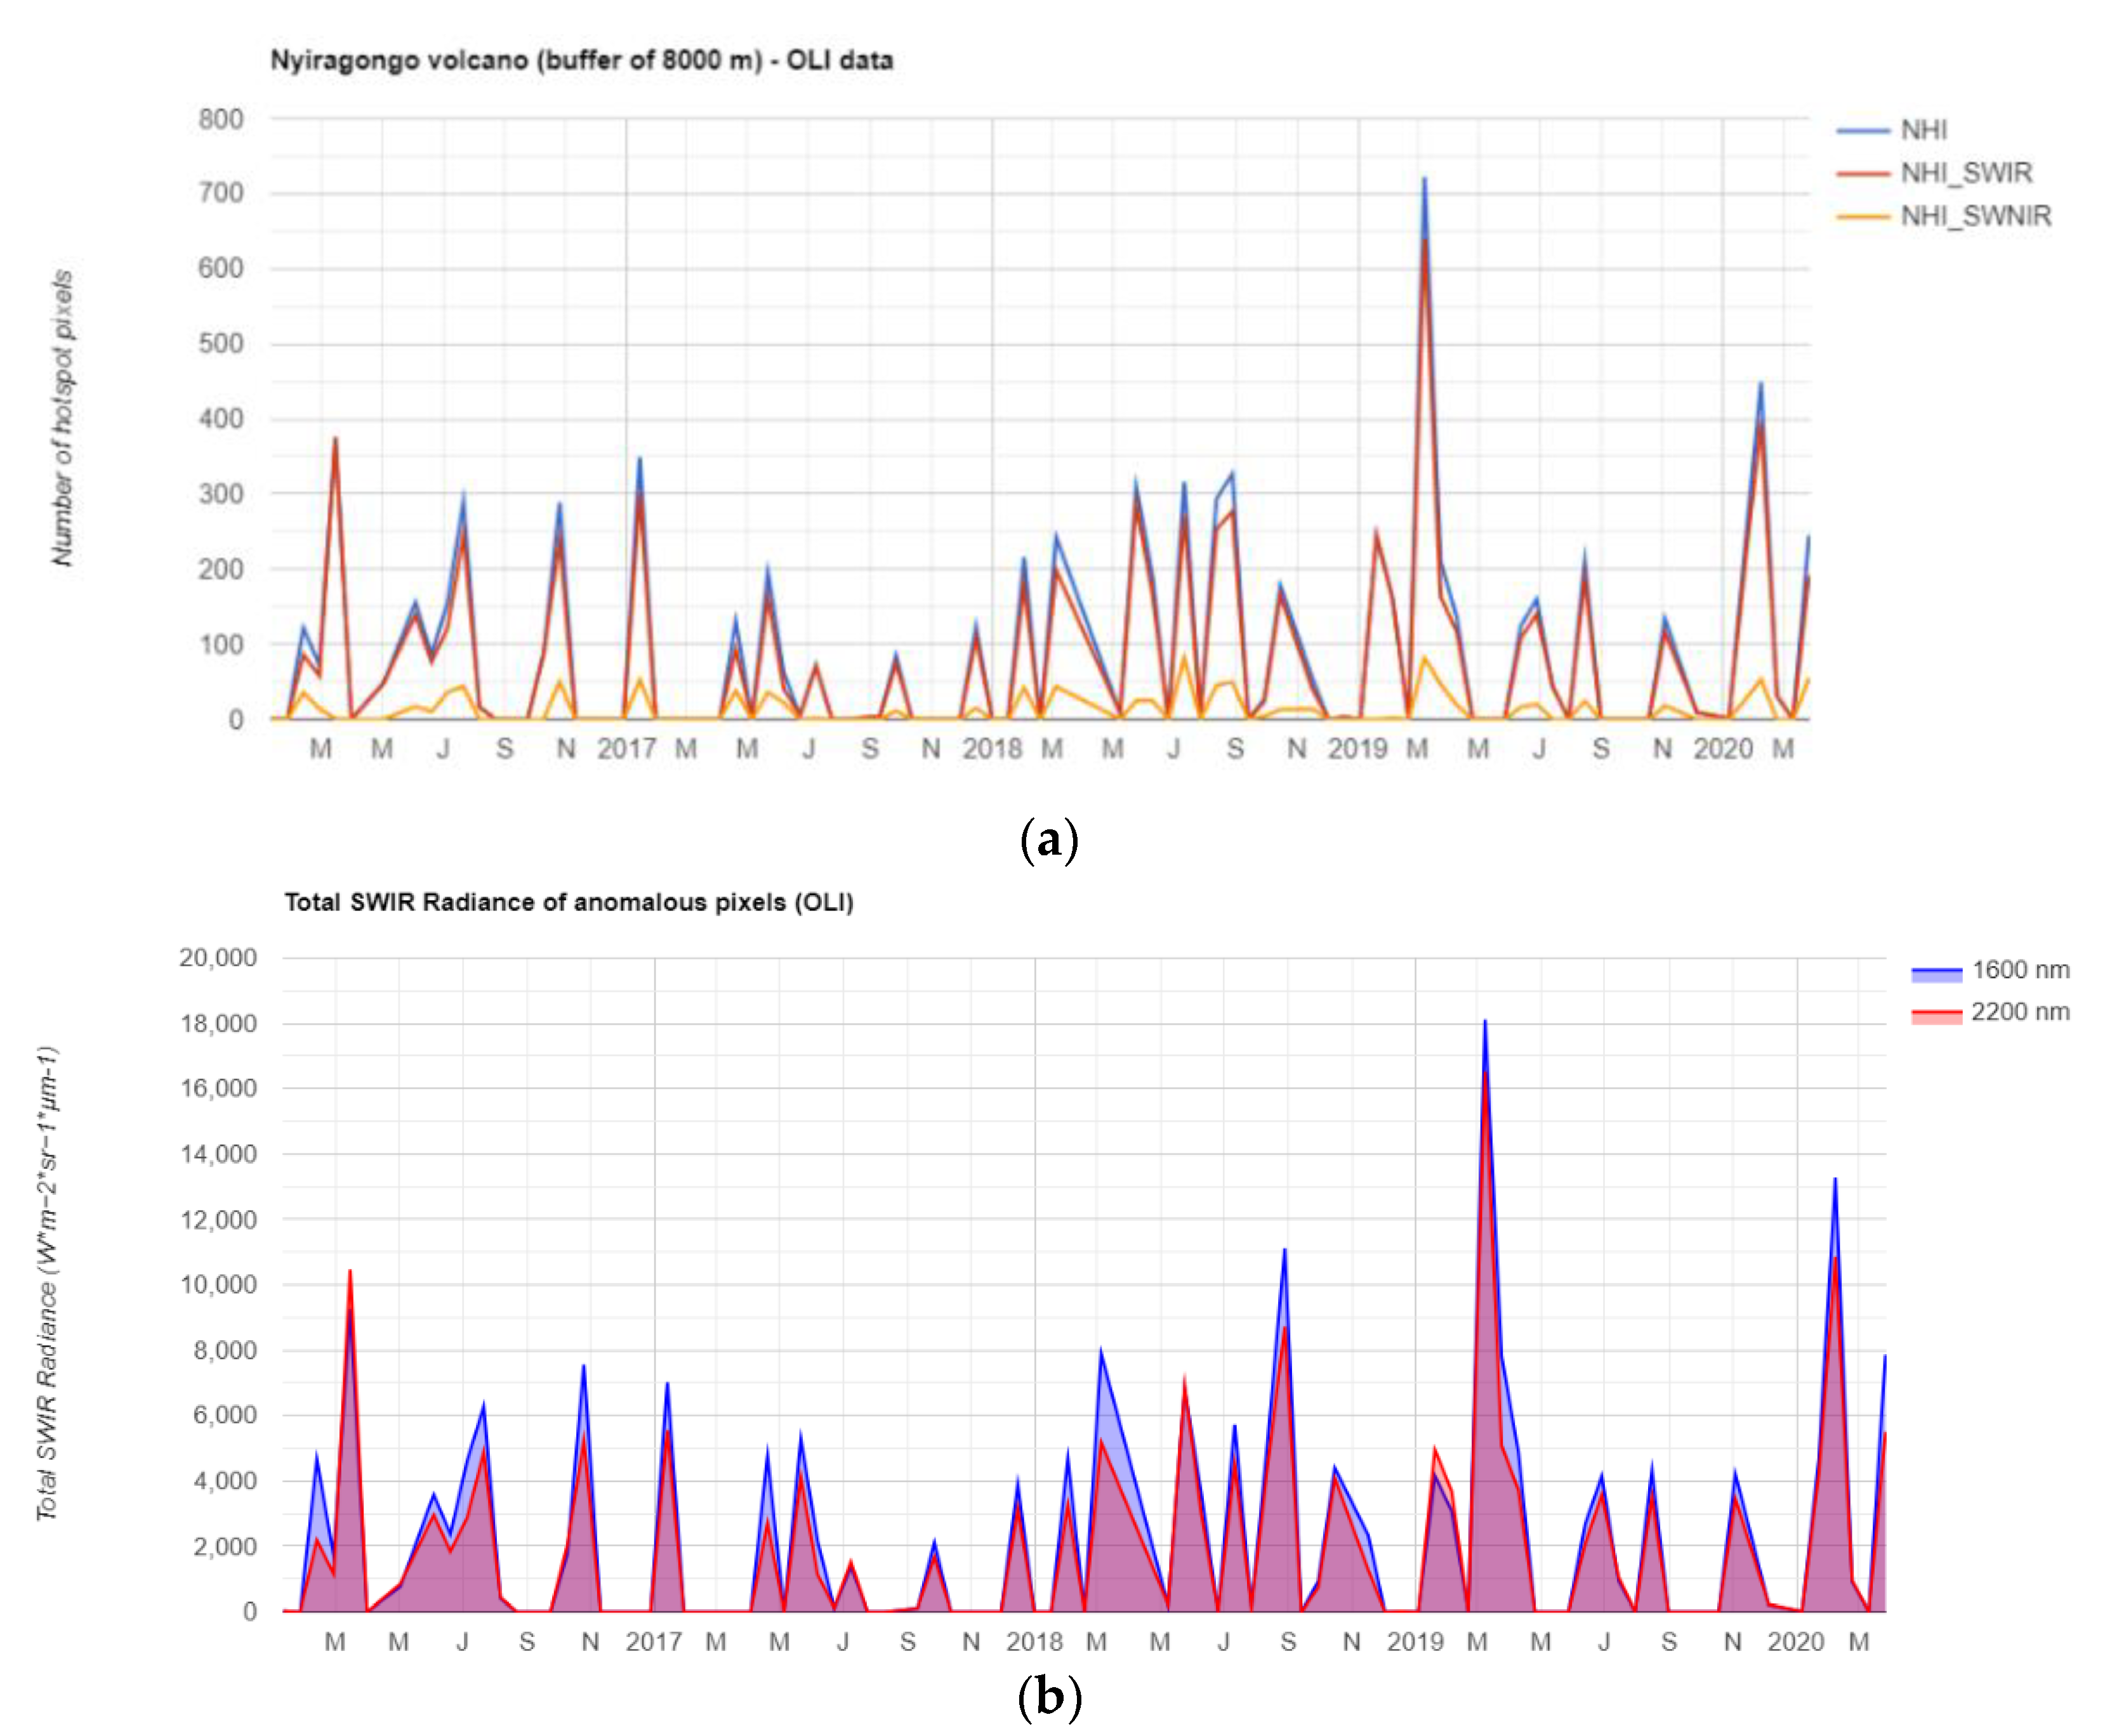
3.2. Assessing Advantages of Data Integration in Monitoring Active Volcanoes

One of the main advantages in using S2-MSI and L8-OLI data is their integration that, if properly exploited, may increase the frequency of observation of active volcanic areas. Nevertheless, due to a number of factors (e.g., differences in spectral response functions), an effective integration of those data is generally not easy to perform, and may require specific analyses (e.g., corrections for atmospheric effects) to provide reliable results (e.g., [55,56,57]).
The NHI tool performs a rough integration of L8-OLI and S2-MSI observations through the computation of the total hot spot area, calculated from the hot spot pixel number and the pixel size. Figure 5 displays the chart of this parameter (see green curve) retrieved at Karangetang (Indonesia), where satellite observations represent an important source of information (e.g., [58]). Moreover, the figure shows the thermal anomaly identified on the S2-MSI scene of 30 December 2018, corresponding to the peak of total hot spot area, overlapped to the topographic map of the volcano. To emphasize advantages of data integration, Figure 6 displays curves from L8-OLI and S2-MSI data in two different colors. It is worth noting that the NHI tool well outlined the different phases of thermal volcanic activity, by combining different satellite observations. This is evident looking for instance at the period January 2017–November 2018, when a small thermal anomaly (~900–2700 m2 in size) affected, with a certain continuity, the target area. On 30 December 2018, a detected thermal anomaly covered a larger area (see map in Figure 5), revealing the presence of a lava flow, SW directed and extending up to about 1100 m elevation, for which we did not find independent ground-based observations.
The tool flagged a similar thermal anomaly on some satellite scenes of January–February and August–November 2019; the smaller hot spot identified from January 2020 marked the reduction of thermal volcanic activity (see Figure 6). It should be stressed that the value of total hot spot area was generally comparable when retrieved from L8-OLI and S2-MSI observations close in time (e.g., as for 30 November 2018, when this parameter ranged in between 28,800 and 29,600 m2). These results indicate that users may analyze the chart of total hotspot area to infer information about changes of thermal volcanic activity, despite some limitations discussed in Section 4.

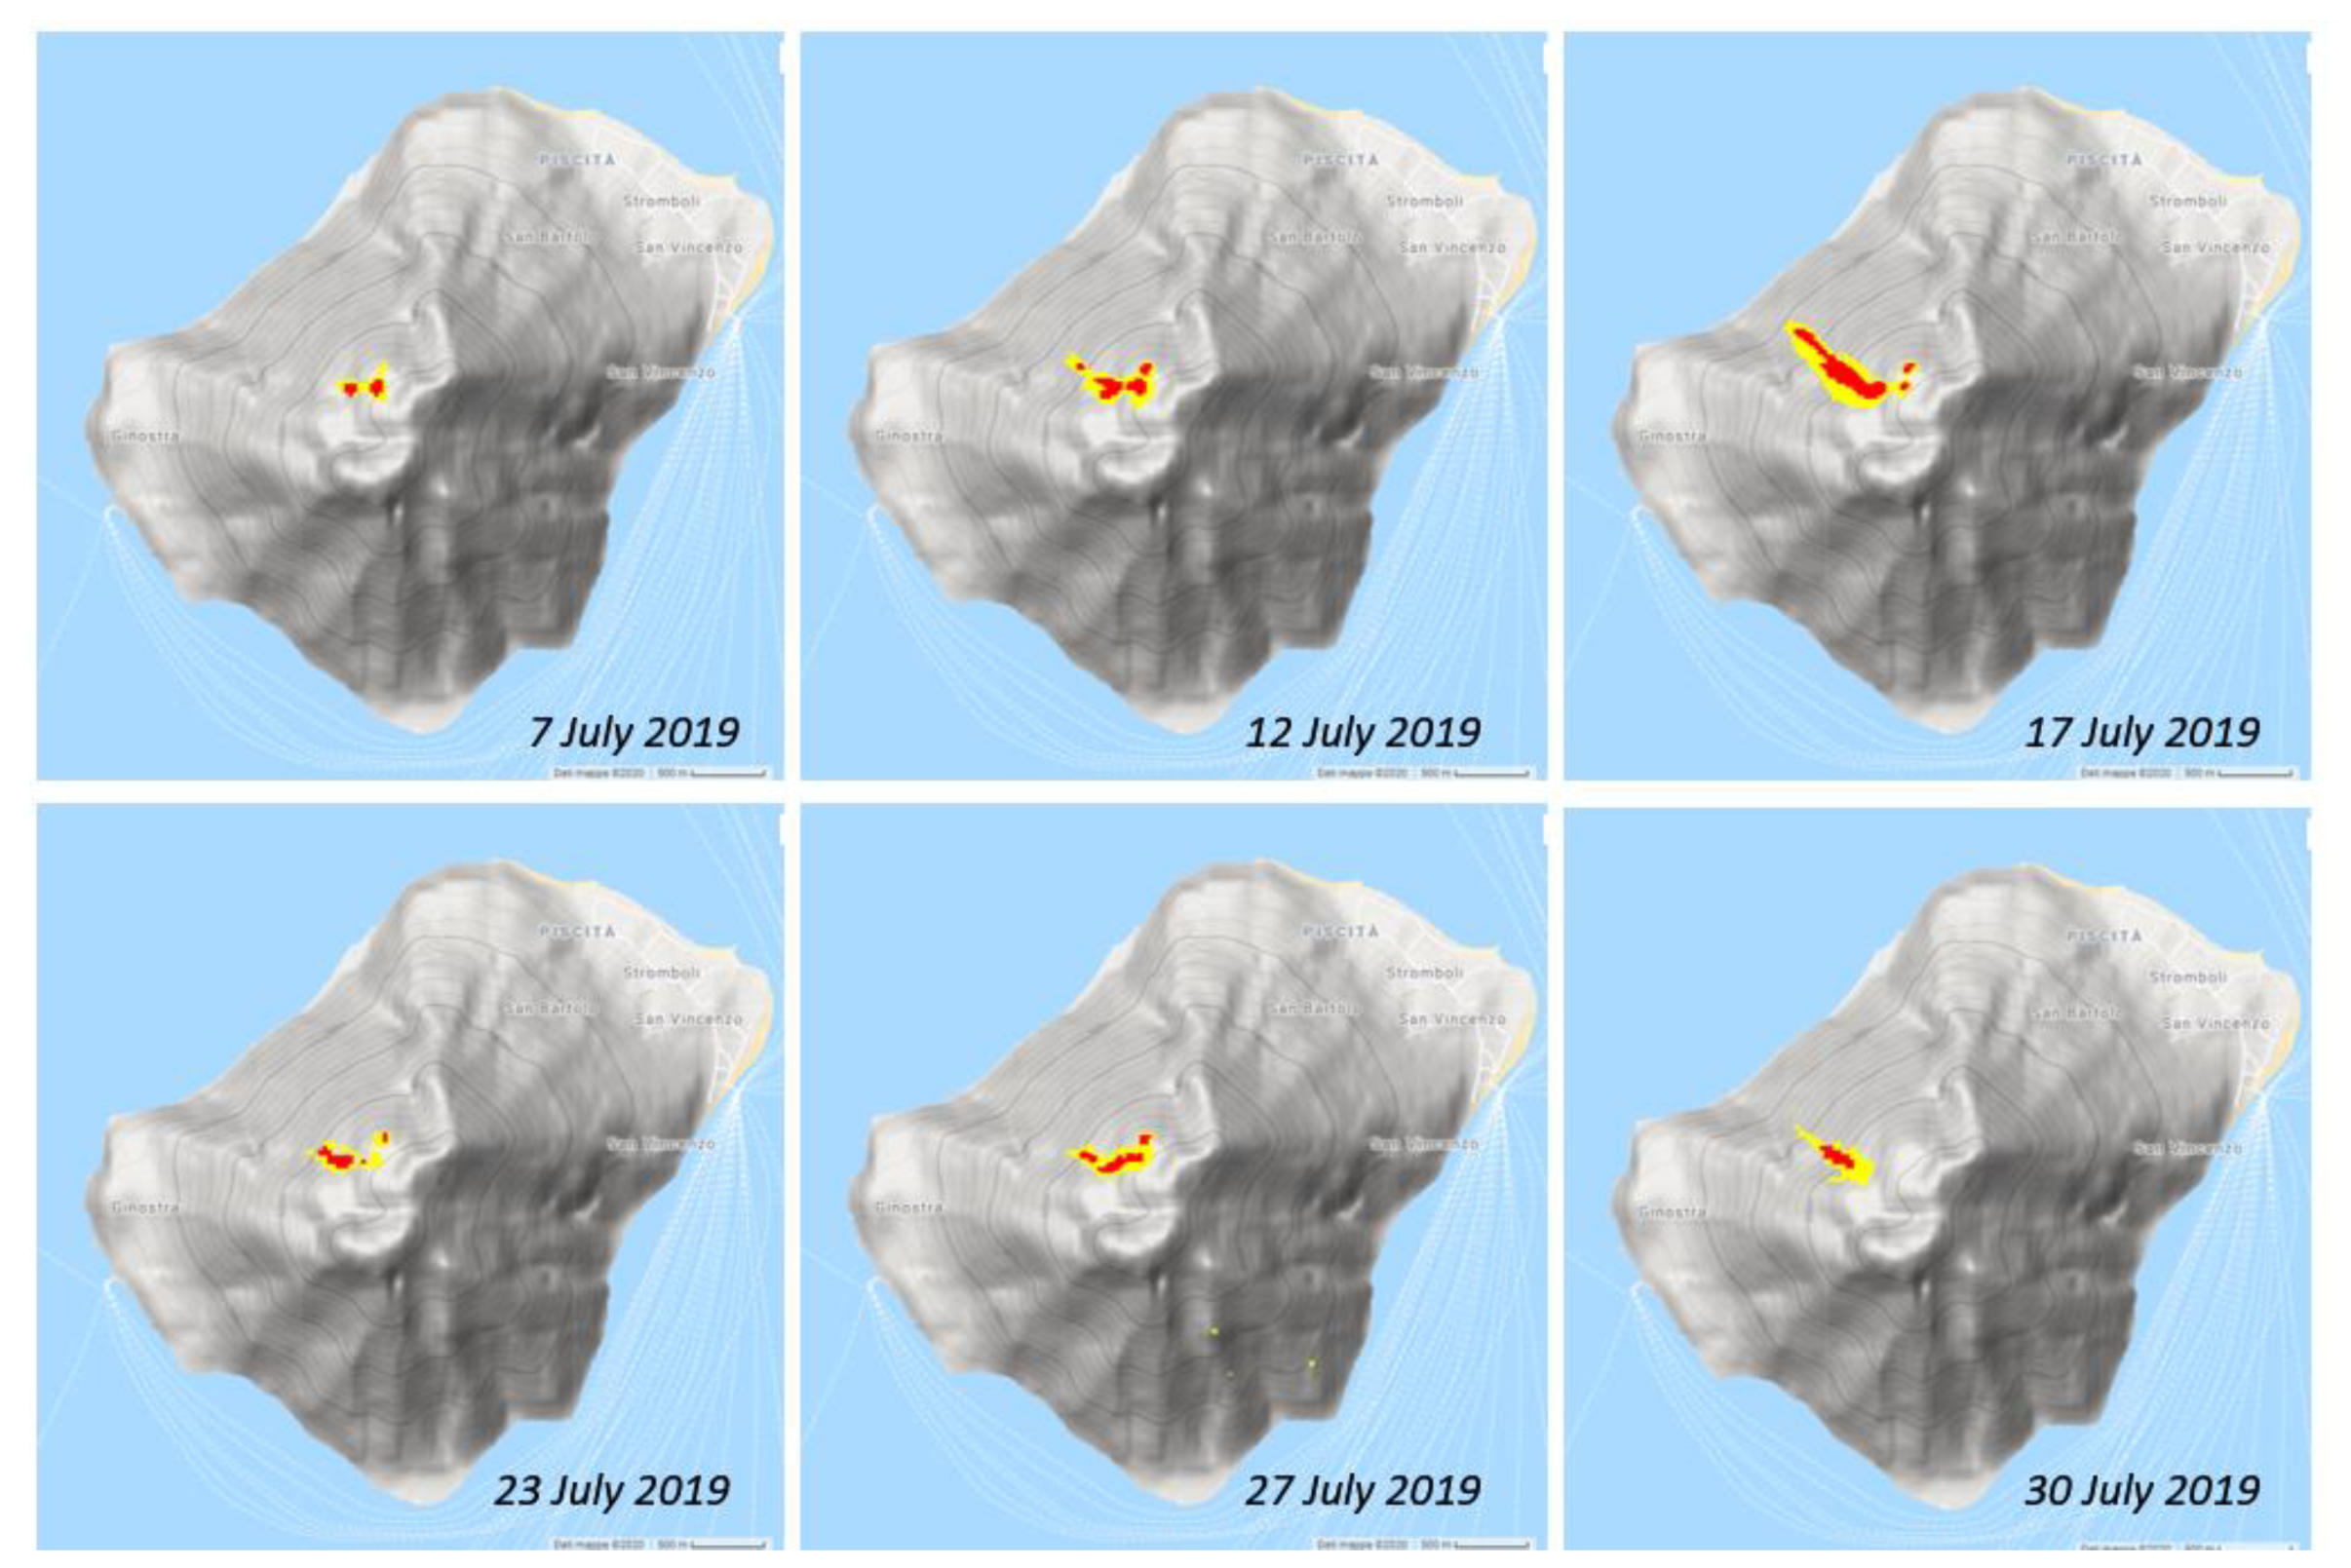
3.3. Lava Flows Monitoring and Mapping

The NHI tool allows users to map and monitor areas inundated by lava integrating L8-OLI and S2-MSI observations. Figure 7 shows a sequence of thermal anomaly maps referring to the recent Stromboli (Italy) eruption of July 2019. This eruptive event, occurring after the strong paroxysm of 3 July (e.g., [35]), was previously analyzed through a satellite multi-sensor approach, which enabled the identification of eruption onset, the mapping of lava flows and the estimate of lava effusion rate [59].
In more detail, the figure shows that in the initial phase of the effusive eruption the lava flow, moving towards Sciara del Fuoco, was between 700 and 800 m elevations. On 12 July, it extended up to 500 m elevation, approaching five days later the Stromboli’s coasts. On 23 July, clouds masked the distal part of the lava flow, which appeared spatially less extended than previous days. On 27 July, the lava flow field was mapped in between 600 and 800 m elevations; on the same day, some small fires probably occurred, as indicated by thermal anomalies flagged on the opposite flank of the volcano (see sparsely hot spot pixels in yellow). Three days later although clouds partially masked the lava flow, it was possible to map its front, which extended up to about 300 m elevation (see map of 30 July).
This example shows that the NHI tool could be used to assess outputs of numerical models simulating lava flow paths, and to support civil protection activities devoted to mitigating the effects of effusive eruptions on neighboring populated areas. The effects of clouds on thermal anomaly identification, the frequency of the combined L8-OLI and S2-MSI observations (see Section 1), and the lag of data availability within the GEE environment, are important factors to take into consideration when the NHI tool is used for these purposes.

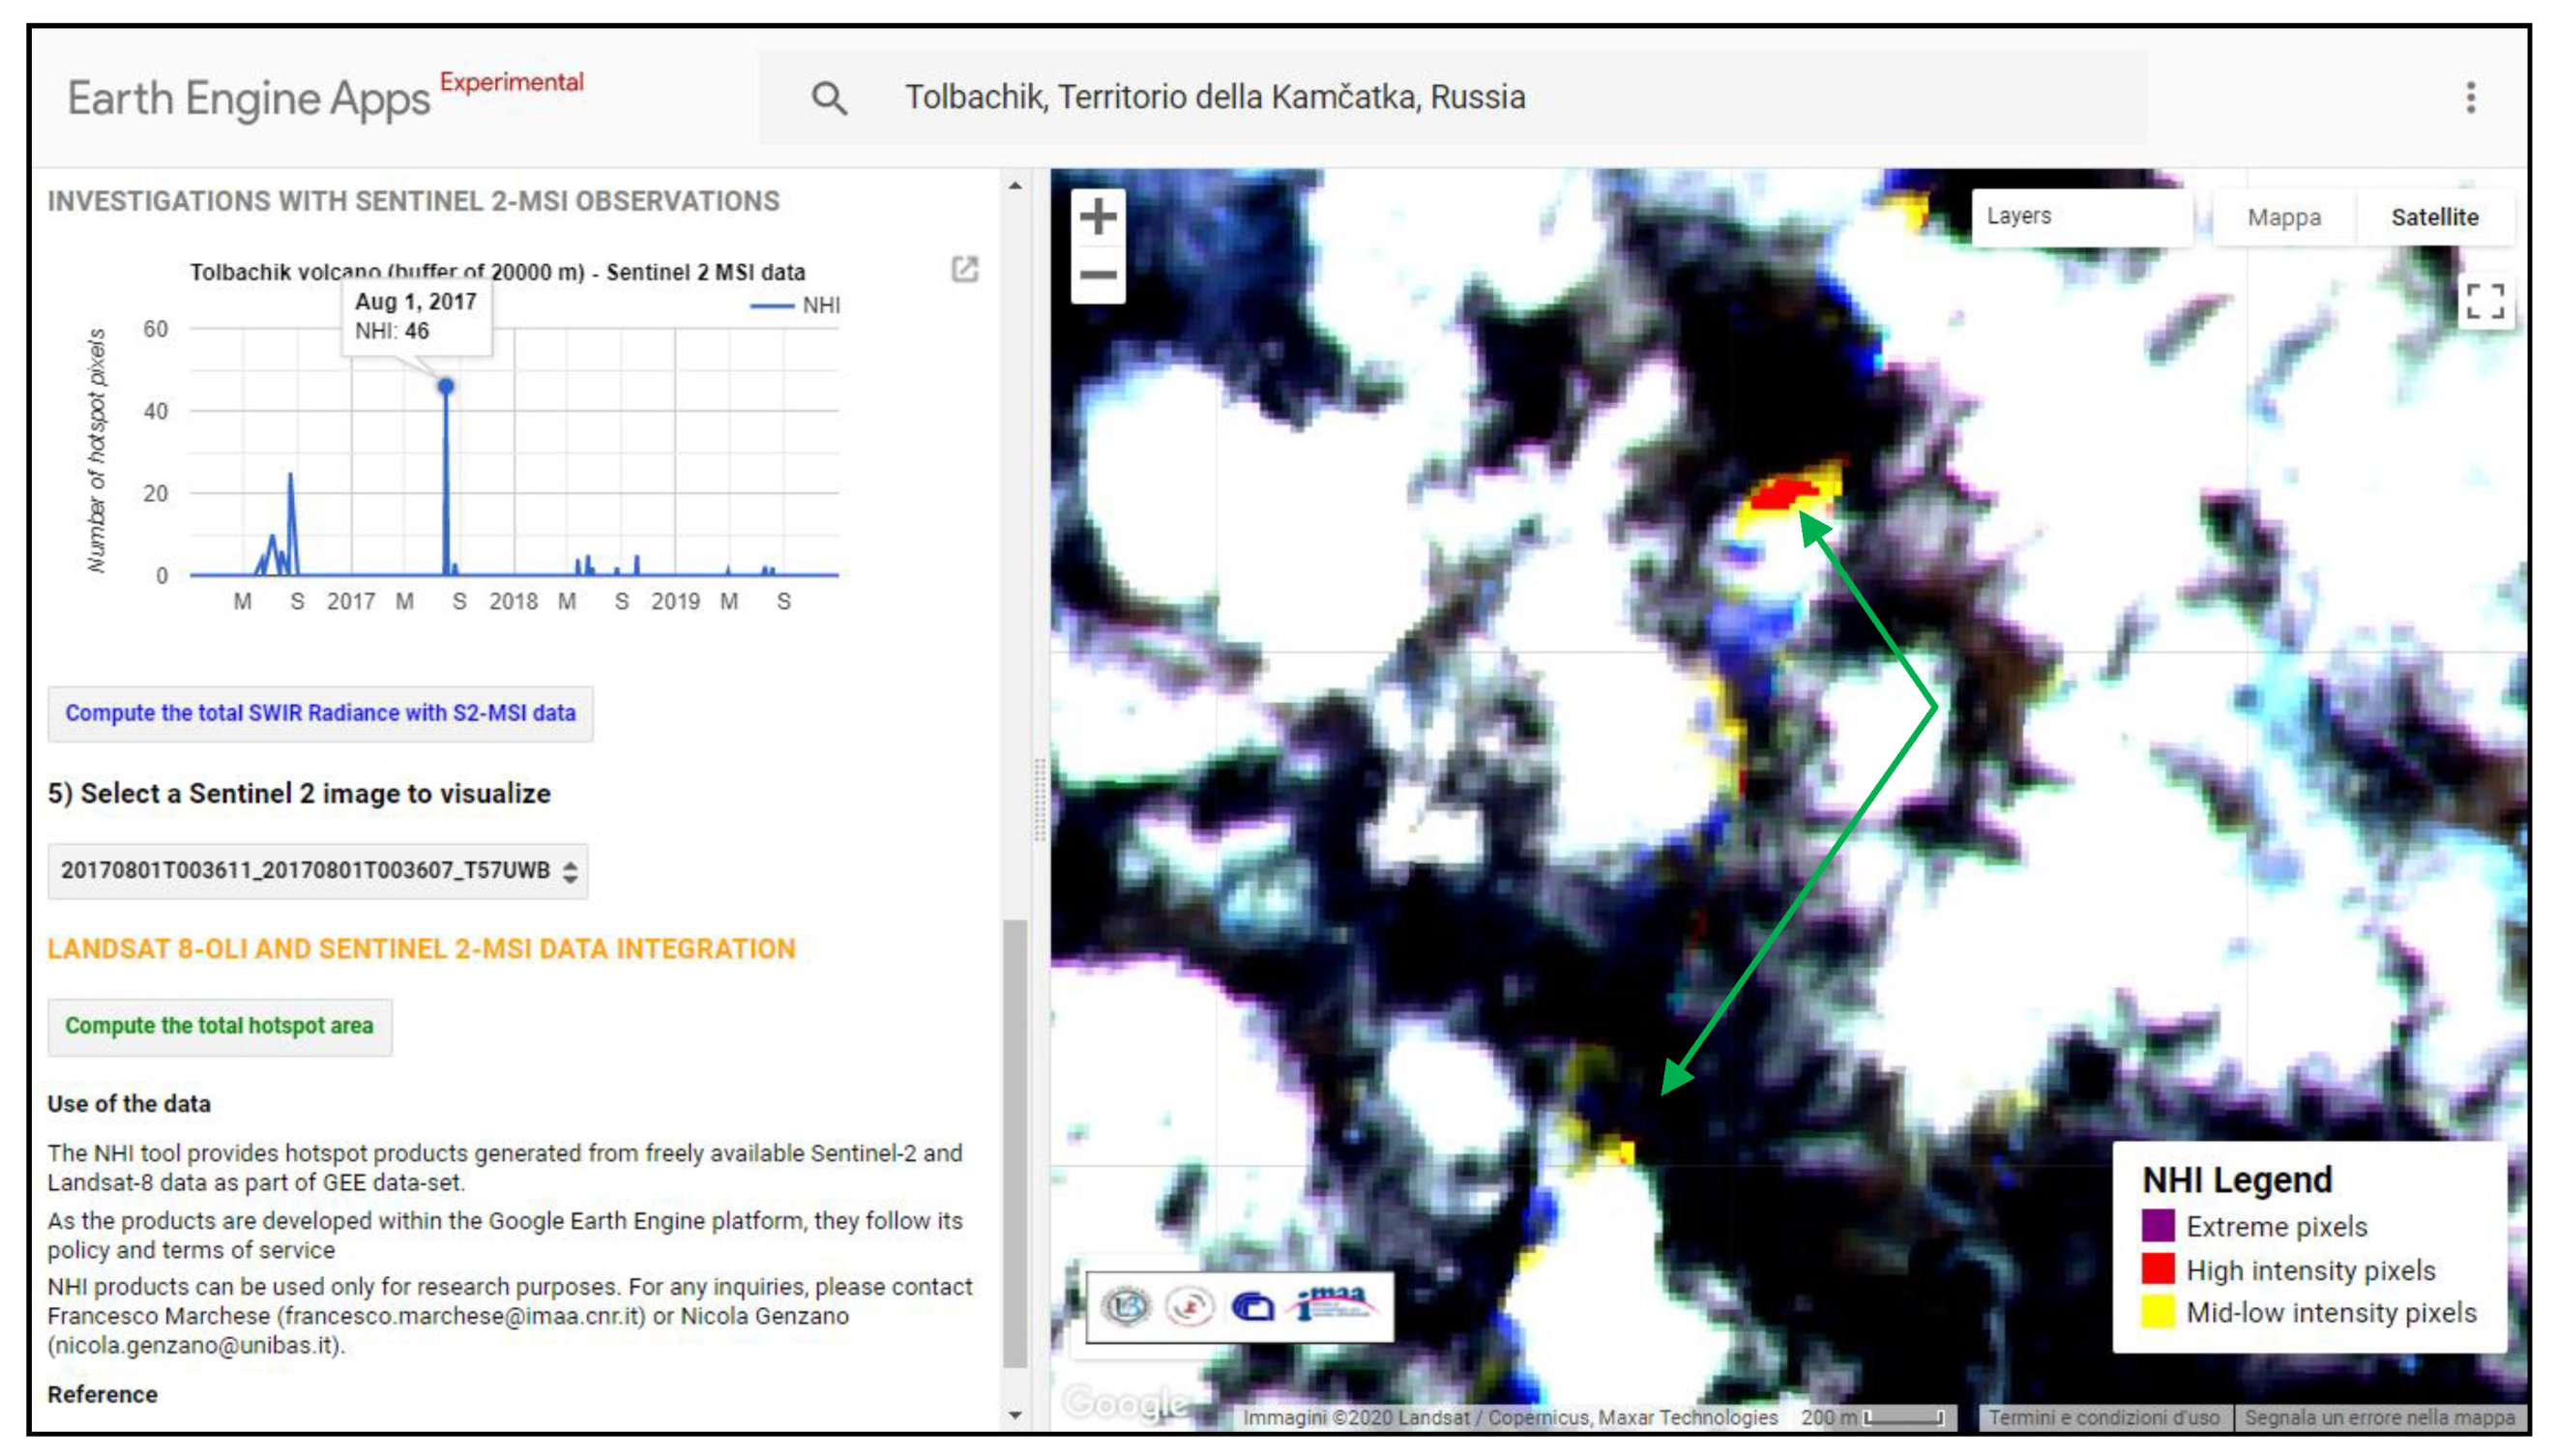
3.4. Localization of Active Vents and Thermal Anomaly Assessment

The accurate localization of active vents, and the assessment of thermal anomalies flagged by other systems, are other relevant advantages offered by the GEE App presented and tested in this work.
Figure 8 emphasizes this potential, displaying the thermal anomaly map from Landsat-8 OLI data of 28 June 2016, covering the Mt. Etna (Sicily; Italy) area. The figure shows the identification of a thermal anomaly of a low-mid intensity level (see yellow pixels) at the Voragine (VOR) crater, where a small vent of ~20–30 m in diameter, opened up on 7 August 2016 emitting high-temperature gases (i.e., up to over 600 °C) [33]. In detail, the chart of hot spot pixel number shows that since the end of June 2016, i.e., after the powerful paroxysms of May, a less intense thermal anomaly affected the Mt. Etna crater area [33]. Thermal volcanic activity showed some intensity fluctuations (see chart of total SWIR radiance on bottom-left side of the figure), increasing a few days before the opening of new degassing vent at VOR. These results are in agreement with the outcomes of a previous study, where RSTVOLC detections, from infrared AVHRR and MODIS records, were assessed through the offline analysis of S2-MSI and L8-OLI data [33]. They show that the NHI tool may be used for an accurate localization of active vents also in periods of a less intense thermal volcanic activity (e.g., in the presence of thermal anomalies of a few MW), starting from alerts of systems monitoring active volcanoes in near-real time, by means of high-temporal resolution satellite data (see Section 1).

3.5. Quantification of the NHI Tool Performance

To quantify the performance of the NHI tool, we analyzed several active volcanoes with recent/no recent eruptions, over the same period April 2013 (Nov 2015 for S2-MSI data)–May 2020 (i.e., the same as Tolbachick in Figure 4). In particular, we estimated the false positive rate (FPR) according to Equation (3), i.e., by the ratio of images with evidences of false detections N i f , revealed by the manual inspection of satellite imagery and information from volcanological reports, and the total number of available images N i for the volcanic area of interest:
F P R = N i f N i
Table 2 shows that the FPR was particularly low when retrieved from L8-OLI data, regardless of used tool version. In more detail, the FPR ranged in between 0.0% at Acatenango (Guatemala) and 1.7% at Campi Flegrei (Italy), where false positives were ascribable to possible fires occurring in the surroundings of Pozzuoli town. The FPR was generally higher from S2-MSI data, reaching about 19.2% at Campi Flegrei when the NHI tool v.1.1 was used. In this high-risk volcanic area, which is characterized by a hydrothermal activity and whose last eruption occurred in 1538 AD (e.g., [60,61]), the tool v.1.2 was the most effective in reducing false positives occurring over cloud-edges and associated to S2-MSI data issues. The NHI tool v.1.3/1.4 was slightly less efficient in minimizing these issues (e.g., see Tolbachick). In general, the capacity of these tool versions in reducing false positives related to S2-MSI data issues was more evident at a higher distance buffer (DB), when both land and sea pixels were analyzed.
Regarding the false negative rate (FNR), we estimated this parameter according to Equation (4), i.e., by the ratio of satellite imagery with missed detections N i m and the number of satellite scenes with evidences of thermal anomalies N i T , revealed by the manual inspection of satellite imagery and the comparison with the RGB product:
F N R = N i m N i T
The first tool version, including only the initial test on SWIR radiance (see Table 1), showed the lowest FNR. The tool v.1.2 was more affected by missed detections. As an example, in areas such as Shishaldin (Alaska), the FNR increased about 25% in comparison with the previous tool version, while at Oldoynio Lengai (OL), which is the only volcano on Earth emitting natrocarbonatite lava [62], the increase in FNR was around 3.5% when compared to v.1.3/1.4 (FNR ≈ 52.5%). Therefore, the current NHI tool release (i.e., v.1.4) seems to offer the best trade-off between reliability and sensitivity, as indicated by the analysis of other active volcanoes (e.g., Mt Etna), which are not reported in Table 2. A different filter is however required to increase the confidence level of detection from S2-MSI data, without losing in sensitivity (e.g., FNR ≈ 44.4% at OL from L8-OLI data).

4. Discussion

By coupling an efficient single image algorithm to the high computational resources of the GEE platform, the NHI tool is capable of providing accurate information about volcanic thermal anomalies, with low processing times. Only a few seconds are, in fact, required to generate the tool outputs; the computational time may increase up to a few minutes when long-time series of satellite observations, at a high distance buffer, are analyzed (e.g., charts of Figure 3 were generated in less than one minute).
In this work, we investigated a number of active volcanoes characterized by a different thermal activity using a different DB as input, based on their relative size. At Campi Flegrei, which is a caldera of about 12 km in diameter [63], we used for instance a DB value of 6 km (see Table 2). The NHI tool helps users in setting the DB through a preview of the selected volcanic area. Nevertheless, in some volcanic regions this parameter may be more difficult to be set properly. As an example, by setting a DB ≥ 3.0 km at Acatenango (Guatemala), whose last eruption occurred in 1972 [64], we retrieved the same results for Fuego volcano, showing frequent eruptions and belonging to the same volcanic complex (Acatenango-Vulcán de Fuego massif). On the other hand, at Kilauea (Hawaii) a high DB value (50 km) was required to investigate the Lower East Rift Zone (LERZ) [65] (see Figure 9). In this case, the developed platform generated only outputs from L8-OLI data because of GEE restrictions (see Section 2).
This study has also shown that the NHI tool performs well in detecting and mapping lava flows, as observed at Nishinoshima (Japan) which erupted in November 2013 after 40 years of dormancy emitting lava [66], even thanks to the spectral test for “extreme pixels” described in Table 1.
In more detail, we observed the underestimation of lava flows/lakes under certain conditions (e.g., pixel saturation effects, presence of clouds), while their slight overestimation was recorded mainly because of data artefacts as shown in Figure 3, and confirmed by the analysis of S2-MSI data. Figure 10 shows the lava flow from Sierra Negra (Ecuador) eruption of 16 July 2018 [67], confirming the low impact of data artefacts on thermal anomaly identification and the improvements achieved using the spectral test for extreme pixels (see pixels in violet in the inner part of lava flow).
Volcanic thermal features of a lower intensity level (e.g., hot fumaroles) may be more difficult to identify with the tool (sensitivity limits of the NHI algorithm will be assessed in a next work). Table 3 details L8-OLI with evidences of thermal anomalies at OL where mid-low intensity hot spots were prevalent, while Figure 11 shows an example of intra-crater thermal anomaly undetected by the tool.
Despite the FNR higher than other areas, such as Suwanoseijima (Japan) where the FNR from L8-OLI data was estimated around 13%, the occurrence of some lava effusions inside the OL crater (e.g., [68]) indicates that events of natrocarbonatite lava, having temperatures in between 500 °C and 600 °C (e.g., [69]), may be detected/assessed by the tool. On the other hand, different satellite-based systems (e.g., those using TIR data) need to be used to identify low-temperature thermal anomalies, as for Campi Flegrei, where fumaroles reach temperatures up to 160 °C–165 °C (e.g., [61,70]).
Among the outputs of the NHI tool, the chart of total SWIR radiance (which is generated without performing any correction for atmospheric effects), such as that of total hot spot area (see Section 3.2), require a careful analysis and interpretation. Figure 12 shows the chart of total SWIR radiance retrieved, from L8-OLI data of January 2016–April 2020, over the Nyiragongo (Africa) volcano, which hosts the largest active lava lake in the world [71]. It can be noted as despite the lower number of pixels flagged by the index in Equation (2) than Equation (1) (Figure 12a), the total SWIR1 radiance was systematically higher than SWIR2 (Figure 12b). This signal behavior, which is different from that recorded in other areas (e.g., see Figure 8), may be ascribed to the most intense hot spot pixels detected only by the index in Equation (2). These pixels yielded the OLI channel 7 saturation and showed radiance values on OLI channel 6 above the nominal saturation and close to the maximum observable radiance (96 W/m2 sr μm) (e.g., [37]). Concerning the chart of total hot spot area, factors such as cloud coverage may lead to a misinterpretation of results even analyzing near contemporaneous satellite observations. In addition, the total hot spot area represents an overestimation of the area actually covered by hot targets (the tool considers each hot spot pixel as covered only by the hot component). Users should be aware of these limitations when the above-mentioned products are used.

Future Perspectives

Thanks to the features of the GEE platforms, further improvements of the NHI tool are possible. These improvements will allows us to take into account the suggestions from users, provided through a feedback module directly linked to the tool; e.g., we could ingest more regions of interest within the tool to overcome limitations in S2-MSI data processing occurring at a high distance buffer.
Some tool improvements under evaluation include: (i) the implementation of new functions to increase the user-friendly experience; (ii) the use of a procedure to correct SWIR radiances for atmospheric effects (e.g., [72]); (iii) the implementation of methods for thermal anomaly characterization; (iv) the ingestion of additional datasets to extend the temporal range of satellite data analyses.
Among the next tool upgrades, the use of Thematic Mapper (TM)/ Enhanced Thematic Mapper plus (ETM+) and ASTER data, could make more than 30 years of satellite observations available to users, enabling the analysis of worldwide volcanoes before the first availability of L8-OLI data. Figure 13 emphasizes this potential, showing the preliminary results of the Mount St. Helens (USA) and Eyjafjallajökull (Iceland) investigations, achieved using Landsat-5 TM and Landsat-7 ETM+ data, respectively. In detail, Figure 13a shows that an intra-crater thermal anomaly affected the Mount St. Helens on 14 October 2014. This feature was generated by a documented lava dome growth inside the crater [73,74], affecting other satellite scenes of 2004–2006 (see chart of hot spot pixel number referring to period 1985–2010). Figure 13b displays the lava flow emitted by the Eyjafjallajökull volcano on 3 April 2010 and generated by an intense effusive eruption which started the previous month after about two centuries of quiescence, previously investigated from space by means of infrared MODIS data [75]. It should be noted that, despite the striping in Landsat-7 ETM+ imagery (e.g., [76]), the analyzed time series (from 1999 to 2011) did not reveal any false detection (see quiescence periods correctly marked by the tool before and after the end of eruption). Thus, the NHI tool seems to perform well in using also TM/ETM+ data, although the impact of other issues (e.g., oversaturation effects [77]) needs to be better assessed. Additionally, even though the malfunctioning of ASTER SWIR detectors does not enable the analysis of satellite imagery acquired after 2008 (see Section 1), the ingestion of ASTER data within the tool could contribute to better analyzing past eruptions, thanks to the better dynamic range in the SWIR region (e.g., [78]).
Although the NHI tool was designed for volcanological applications, a similar GEE App could be developed to investigate and map other hot targets. Figure 14 shows an example of this potential, in reference to the gas flares, with temperatures in between 1600 and 2200 K [79]. In particular, the figure displays the chart of hot spot pixel number retrieved, at the Val d’Agri Oil Center (COVA) in Basilicata region (Southern Italy), from L8-OLI data of 2015-2020. The figure also shows the thermal anomaly identified on a satellite scene of 14 December 2019, corresponding to the peak of hot spot pixels, revealing the presence of two hot areas. In previous studies, gas-flaring activity at COVA was investigated and quantified using nighttime MODIS and Visible Infrared Imaging Radiometer Suite (VIIRS) data [80,81]. Information from L8-OLI/S2-MSI imagery could then integrate observations from other systems, allowing for estimates of the fire radiative power (FRP), and of volume of emitted gas, in daylight conditions (e.g., [82,83]).
Since the NHI algorithm is sensitive to wildfires (e.g., [35]), we could develop a similar GEE App also to map forest fires at local/regional scale. Figure 15 shows forest fires (in red) identified on S2-MSI scene of 15 January 2020, affecting the New South Wales region (Australia). These features were among the numerous, large and devastating fire events occurring during the 2019–2020 Australian bushfire season (e.g., [84,85]). Although these features were slightly underestimated, as indicated by the manual inspection of satellite imagery, and even if other investigations are required to assess NHI performance under different fire regimes, the GEE App of Figure 15 could contribute in assessing risk of wildland–urban interface fires, complementing information from operational fire monitoring systems (e.g., [86]).

5. Conclusions

In this paper, we have presented a powerful tool to analyze, map and monitor volcanic thermal anomalies at global scale, by means of medium–high spatial resolution satellite data.
The NHI tool, even if does not provide automated alerts about ongoing eruptions unlike other systems (e.g., [34]), is currently the only platform which allows for the investigation of more than 1400 active volcanic areas, through the integration of L8-OLI and S2-MSI observations. The tool, whose performance is strictly related to the used algorithm and the GEE computational resources, shows a low false positive rate especially from L8-OLI data, in spite of some limitations (e.g., slight dependence on data issues/artifacts; sensitivity reduction in presence of clouds/plumes).
The next tool upgrades will include a new visualization mode to increase the user-friendly experience, the possible ingestion of some independent satellite products for volcano monitoring available in GEE (e.g., SO2 maps from Sentinel-5P), and the implementation of the prior Landsat-5/7 data collections to extend the temporal range of satellite data analyses. Moreover, the possible use of VIIRS data, available at 500 m spatial resolution in the Imagery resolution (I)-bands within GEE, is also under evaluation. A suite of multi-platform satellite observations will be then developed to analyze both past and ongoing eruptions, with an increased temporal coverage. A similar GEE App could be adapted to other hot targets (e.g., forest fires), having a strong impact on both environment and population.
In conclusion, this paper shows that the NHI tool may highly support scientists, volcano observatories, particularly those in developing countries where the expertise in data processing is often lacking [87], and even simple users (e.g., students), in investigating active volcanoes, complementing information from other systems.

Author Contributions

N.G., F.M. and N.P. writing paper; F.M. and N.G. tool design; N.G. tool development; F.M. and N.G. data analyses; N.P. funding. All authors have read and agreed to the published version of the manuscript.

Funding

This research received no external funding.

Acknowledgments

Sentinel-2 MSI, Landsat-8 OLI and Terra-ASTER data used in this work are available through the Google Earth Engine platform. The authors thank three anonymous reviewers for valuable suggestions aiming at improving the paper quality and express special thanks to Vincenzo Lapenna and Marco Neri for the support in promoting the NHI tool.

Conflicts of Interest

The authors declare no conflict of interest.

References

  1. Volcano Discovery. How Many Volcanic Eruptions Occur Every Year? Available online: https://www.volcanodiscovery.com/volcanology/faq/how-many-eruptions-per-year.html (accessed on 28 April 2020).
  2. Hooper, A.; Prata, F.; Sigmundsson, F. Remote Sens. of volcanic hazards and their precursor. Proc. IEEE 2012, 100, 2908–2930. [Google Scholar] [CrossRef]
  3. Tanguy, J.C.; Ribière, C.; Scarth, A.; Tjetjep, W.S. Victims from volcanic eruptions: A revised database. Bull. Volcanol. 1998, 60, 137–144. [Google Scholar] [CrossRef]
  4. Oppenheimer, C. Climatic, environmental and human consequences of the largest known historic eruption: Tambora volcano (Indonesia) 1815. Prog. Phys. Geogr. 2003, 27, 230–259. [Google Scholar] [CrossRef]
  5. Favalli, M.; Tarquini, S.; Papale, P.; Fornaciai, A.; Boschi, E. Lava flow hazard and risk at Mt. Cameroon volcano. Bull. Volcanol. 2012, 74, 423–439. [Google Scholar] [CrossRef]
  6. Del Negro, C.; Cappello, A.; Bilotta, G.; Ganci, G.; Hérault, A.; Zago, V. Living at the edge of an active volcano: Risk from lava flows on Mt. Etna. Geol. Soc. Am. Bull. 2019, 132, 1615–1625. [Google Scholar] [CrossRef]
  7. USGS Volcano Hazard Programme. Volcanoes can affect the Earth’s Climate. Available online: https://volcanoes.usgs.gov/vhp/gas_climate.html (accessed on 28 May 2020).
  8. Prata, A.J.; Tupper, A. Aviation hazards from volcanoes: The state of the science. Nat. Hazards 2009, 51, 239–244. [Google Scholar] [CrossRef] [Green Version]
  9. Budd, L.; Griggs, S.; Howarth, D.; Ison, S. A fiasco of volcanic proportions? Eyjafjallajökull and the closure of European airspace. Mobilities 2011, 6, 31–40. [Google Scholar] [CrossRef]
  10. Harris, A.J.; Butterworth, A.L.; Carlton, R.W.; Downey, I.; Miller, P.; Navarro, P.; Rothery, D.A. Low-cost volcano surveillance from space: Case studies from Etna, Krafla, Cerro Negro, Fogo, Lascar and Erebus. Bull. Volcanol. 1997, 59, 49–64. [Google Scholar] [CrossRef]
  11. Dean, K.; Servilla, M.; Roach, A.; Foster, B.; Engle, K. Satellite monitoring of remote volcanoes improves study efforts in Alaska. Eos Trans. Am. Geophys. Union 1998, 79, 413–423. [Google Scholar] [CrossRef]
  12. Wright, R.; Flynn, L.; Garbeil, H.; Harris, A.; Pilger, E. Automated volcanic eruption detection using MODIS. Remote Sens. Environ. 2002, 82, 135–155. [Google Scholar] [CrossRef] [Green Version]
  13. Pergola, N.; Marchese, F.; Tramutoli, V. Automated detection of thermal features of active volcanoes by means of infrared AVHRR records. Remote Sens. Environ. 2004, 93, 311–327. [Google Scholar] [CrossRef]
  14. Lombardo, V. AVHotRR: Near-real time routine for volcano monitoring using IR satellite data. Geol. Soc. Lond. Spec. Publ. 2016, 426, 73–92. [Google Scholar] [CrossRef]
  15. Coppola, D.; Laiolo, M.; Cigolini, C.; Delle Donne, D.; Ripepe, M. Enhanced volcanic hot-spot detection using MODIS IR data: Results from the MIROVA system. Geol. Soc. Lond. Spec. Publ. 2015, 426, 181–205. [Google Scholar] [CrossRef]
  16. Kaneko, T.; Yasuda, A.; Takasaki, K.; Nakano, S.; Fujii, T.; Honda, Y.; Kajiwara, K.; Murakami, H. A new infrared volcano monitoring using GCOM-C (SHIKISAI) satellite: Applications to the Asia-Pacific region. Earth Planets Space 2020, 72, 1–16. [Google Scholar] [CrossRef]
  17. MODVOLC, Near-Real Time Satellite Monitoring of Global Volcanism Using MODIS. Available online: http://modis.higp.hawaii.edu/ (accessed on 10 June 2020).
  18. MIROVA—Middle InfraRed Observation of Volcanic Activity, Near Real Time Detection System. Available online: https://www.mirovaweb.it/ (accessed on 10 June 2020).
  19. Coppola, D.; Laiolo, M.; Cigolini, C.; Massimetti, F.; Delle Donne, D.; Ripepe, M.; Arias, H.; Barsotti, S.; Parra, B.C.; Centeno, R.G.; et al. Thermal Remote Sens. for global volcano monitoring: Experiences from the MIROVA system. FrEaS 2019, 7, 362. [Google Scholar]
  20. REALVOLC. Available online: http://vrsserv2.eri.u-tokyo.ac.jp/graph.html (accessed on 10 June 2020).
  21. Alaska Volcano Observatory (AVO). Available online: https://avo.alaska.edu/ (accessed on 28 May 2020).
  22. Kamchatka Volcanic Eruption Response Team (KVERT). Available online: http://www.kscnet.ru/ivs/kvert/index_eng.php (accessed on 10 June 2020).
  23. Pergola, N.; Coviello, I.; Filizzola, C.; Lacava, T.; Marchese, F.; Paciello, R.; Tramutoli, V. A review of RSTVOLC, an original algorithm for automatic detection and near-real-time monitoring of volcanic hot spots from space. Geol. Soc. Lond. Spec. Publ. 2015, 426, 55–72. [Google Scholar] [CrossRef]
  24. Ganci, G.; Vicari, A.; Fortuna, L.; Del Negro, C. The HOTSAT volcano monitoring system based on combined use of SEVIRI and MODIS multispectral data. Ann. Geophys. 2011, 54, 544–550. [Google Scholar]
  25. HOTVOLC. Available online: http://www.obs.univ-bpclermont.fr/SO/televolc/hotvolc/ (accessed on 28 May 2020).
  26. Aster Volcano Archive (AVA). Available online: https://ava.jpl.nasa.gov/index.php (accessed on 28 May 2020).
  27. Reath, K.; Pritchard, M.E.; Moruzzi, S.; Alcott, A.; Coppola, D.; Pieri, D. The AVTOD (ASTER Volcanic Thermal Output Database) Latin America archive. J. Volcanol. Geotherm. Res. 2019, 376, 62–74. [Google Scholar] [CrossRef] [Green Version]
  28. Advanced Spaceborne Thermal Emission and Reflection Radiometer (ASTER). ASTER Users Advisory. Available online: https://asterweb.jpl.nasa.gov/swir-alert.asp (accessed on 28 April 2020).
  29. Ramsey, M.S.; Flynn, I.T. The Spatial and Spectral Resolution of ASTER Infrared Image Data: A Paradigm Shift in Volcanological Remote Sens. Remote Sens. 2020, 12, 738. [Google Scholar] [CrossRef] [Green Version]
  30. Mishra, N.; Helder, D.; Barsi, J.; Markham, B. Continuous calibration improvement in solar reflective bands: Landsat 5 through Landsat 8. Remote Sens. Environ. 2016, 185, 7–15. [Google Scholar] [CrossRef] [Green Version]
  31. Murphy, S.W.; de Souza Filho, C.R.; Wright, R.; Sabatino, G.; Pabon, R.C. HOTMAP: Global hot target detection at moderate spatial resolution. Remote Sens. Environ. 2016, 177, 78–88. [Google Scholar] [CrossRef]
  32. Layana, S.; Aguilera, F.; Rojo, G.; Vergara, Á.; Salazar, P.; Quispe, J.; Urra, P.; Urrutia, D. Volcanic Anomalies Monitoring System (VOLCANOMS), a Low-Cost Volcanic Monitoring System Based on Landsat Images. Remote Sens. 2020, 12, 1589. [Google Scholar] [CrossRef]
  33. Marchese, F.; Neri, M.; Falconieri, A.; Lacava, T.; Mazzeo, G.; Pergola, N.; Tramutoli, V. The Contribution of Multi-Sensor Infrared Satellite Observations to Monitor Mt. Etna (Italy) Activity during May to August 2016. Remote Sens. 2018, 10, 1948. [Google Scholar] [CrossRef] [Green Version]
  34. Valade, S.; Ley, A.; Massimetti, F.; D’Hondt, O.; Laiolo, M.; Coppola, D.; Loibl, D.; Hellwich, O.; Walter, T.R. Towards Global Volcano Monitoring Using Multisensor Sentinel Missions and Artificial Intelligence: The MOUNTS Monitoring System. Remote Sens. 2019, 11, 1528. [Google Scholar] [CrossRef] [Green Version]
  35. Marchese, F.; Genzano, N.; Neri, M.; Falconieri, A.; Mazzeo, G.; Pergola, N. A Multi-Channel Algorithm for Mapping Volcanic Thermal Anomalies by Means of Sentinel-2 MSI and Landsat-8 OLI Data. Remote Sens. 2019, 11, 2876. [Google Scholar] [CrossRef] [Green Version]
  36. Massimetti, F.; Diego, C.; Marco, L.; Sébastien, V.; Cigolini, C.; Ripepe, M. Volcanic Hot-Spot Detection Using SENTINEL-2: A Comparison With MODIS–MIROVA Thermal Data Series. Remote Sens. 2020, 12, 820. [Google Scholar] [CrossRef] [Green Version]
  37. Pahlevan, N.; Chittimalli, S.K.; Balasubramanian, S.V.; Vellucci, V. Sentinel-2/Landsat-8 product consistency and implications for monitoring aquatic systems. Remote Sens. Environ. 2019, 220, 19–29. [Google Scholar] [CrossRef]
  38. Amani, M.; Ghorbanian, A.; Ahmadi, S.A.; Kakooei, M.; Moghimi, A.; Mirmazloumi, S.M.; Moghaddam, S.H.A.; Mahdavi, S.; Ghahremanloo, M.; Parsian, S.; et al. Google Earth Engine Cloud Computing Platform for Remote Sensing Big Data Applications: A Comprehensive Review. IEEE J. Sel. Top. Appl. Earth Obs. Remote Sens. 2020, 13, 5326–5350. [Google Scholar] [CrossRef]
  39. Schroeder, W.; Oliva, P.; Giglio, L.; Quayle, B.; Lorenz, E.; Morelli, F. Active fire detection using Landsat-8/OLI data. Remote Sens. Environ. 2016, 185, 210–220. [Google Scholar] [CrossRef] [Green Version]
  40. Google Earth Engine. Guide, Introduction. Available online: https://developers.google.com/earth-engine (accessed on 28 April 2020).
  41. Gorelick, N.; Hancher, M.; Dixon, M.; Ilyushchenko, S.; Thau, D.; Moore, R. Google Earth Engine: Planetary-scale geospatial analysis for everyone. Remote Sens. Environ. 2017, 202, 18–27. [Google Scholar] [CrossRef]
  42. Institute of Methodologies for Environmental Analysis (IMAA). Open Data, NHI (Normalized Hot Spot Indices): A Tool for Mapping Volcanic Thermal Anomalies at a Global Scale from Space. Available online: http://www.imaa.cnr.it/en/10066-open-data/712-nhi-normalized-hotspot-indices-tool (accessed on 28 April 2020).
  43. Global Volcanism Program, Volcanoes of the World, v. 4.8.6.; Venzke, E (Ed.); Smithsonian Institution. 2013. Available online: https://doi.org/10.5479/si.GVP.VOTW4-2013 (accessed on 28 April 2020).
  44. USGS. Landsat 8 Data Users Handbook. Available online: https://www.usgs.gov/media/files/landsat-8-data-users-handbook (accessed on 30 September 2020).
  45. Ren, H.; Du, C.; Liu, R.; Qin, Q.; Yan, G.; Li, Z.L.; Meng, J. Noise evaluation of early images for Landsat 8 Operational Land Imager. Opt. Express 2014, 22, 27270–27280. [Google Scholar] [CrossRef] [PubMed]
  46. ESA Sentinel Online. Radiometric Performance. Available online: https://earth.esa.int/web/sentinel/technical-guides/sentinel-2-msi/performance (accessed on 28 April 2020).
  47. Skakun, S.; Vermote, E.; Roger, J.C.; Justice, C. Multispectral misregistration of Sentinel-2A images: Analysis and implications for potential applications. IEEE Geosci. Remote Sens. Lett. 2017, 14, 2408–2412. [Google Scholar] [CrossRef] [PubMed]
  48. Morfitt, R.; Barsi, J.; Levy, R.; Markham, B.; Micijevic, E.; Ong, L.; Scaramuzza, P.; Vanderwerff, K. Landsat-8 Operational Land Imager (OLI) radiometric performance on-orbit. Remote Sens. 2015, 7, 2208–2237. [Google Scholar] [CrossRef] [Green Version]
  49. ESA- Sentinel Online, Revisit and Coverage. Available online: https://sentinel.esa.int/web/sentinel/user-guides/sentinel-2-msi/revisit-coverage (accessed on 4 August 2020).
  50. Global Volcanism Program. Report on Tolbachik (Russia) (Venzke, E., Ed.). Bulletin of the Global Volcanism Network 2017, 42:10. Smithsonian Institution. Available online: https://doi.org/10.5479/si.GVP.BGVN201710-300240 (accessed on 2 October 2020).
  51. Dvigalo, V.N.; Svirid, I.Y.; Shevchenko, A.V. The first quantitative estimates of parameters for the Tolbachik Fissure Eruption of 2012–2013 from aerophotogrammetric observations. J. Volcanol. Seismol. 2013, 8, 261–268. [Google Scholar] [CrossRef]
  52. Zelenski, M.; Malik, N.; Taran, Y. Emissions of trace elements during the 2012–2013 effusive eruption of Tolbachik volcano, Kamchatka: Enrichment factors, partition coefficients and aerosol contribution. J. Volcanol. Geotherm. Res. 2014, 285, 136–149. [Google Scholar] [CrossRef]
  53. KVERT, Plosky Tolbachik Volcano. Last VONA/KVERT Releases. Available online: http://www.kscnet.ru/ivs/kvert/volc?name=Plosky%20Tolbachik&lang=en (accessed on 1 June 2020).
  54. ESA-Copernicus, Sentinel 2, L1C Data quality Report. Available online: https://sentinel.esa.int/documents/247904/685211/Sentinel-2_L1C_Data_Quality_Report (accessed on 1 June 2020).
  55. Mandanici, E.; Bitelli, G. Preliminary comparison of sentinel-2 and landsat 8 imagery for a combined use. Remote Sens. 2016, 8, 1014. [Google Scholar] [CrossRef] [Green Version]
  56. Zhang, H.K.; Roy, D.P.; Yan, L.; Li, Z.; Huang, H.; Vermote, E.; Skakun, S.; Roger, J.C. Characterization of Sentinel-2A and Landsat-8 top of atmosphere, surface, and nadir BRDF adjusted reflectance and NDVI differences. Remote Sens. Environ. 2018, 215, 482–494. [Google Scholar] [CrossRef]
  57. Chastain, R.; Housman, I.; Goldstein, J.; Finco, M.; Tenneson, K. Empirical cross sensor comparison of Sentinel-2A and 2B MSI, Landsat-8 OLI, and Landsat-7 ETM+ top of atmosphere spectral characteristics over the conterminous United States. Remote Sens. Environ. 2019, 221, 274–285. [Google Scholar] [CrossRef]
  58. Global Volcanism Program, 2018. Report on Karangetang (Indonesia) (Venzke, E., Ed.). Bulletin of the Global Volcanism Network, 43:5. Smithsonian Institution. Available online: https://doi.org/10.5479/si.GVP.BGVN201805-267020 (accessed on 1 June 2020).
  59. Plank, S.; Marchese, F.; Filizzola, C.; Pergola, N.; Neri, M.; Nolde, M.; Martinis, S. The July/August 2019 Lava Flows at the Sciara del Fuoco, Stromboli–Analysis from Multi-Sensor Infrared Satellite Imagery. Remote Sens. 2019, 11, 2879. [Google Scholar] [CrossRef] [Green Version]
  60. Dvorak, J.J.; Mastrolorenzo, G. The Mechanisms of Recent Vertical Crustal Movements in Campi Flegrei Caldera, Southern Italy; Geological Society of America: Boulder, CO, USA, 1991; Volume 263. [Google Scholar]
  61. Sabbarese, C.; Ambrosino, F.; Chiodini, G.; Giudicepietro, F.; Macedonio, G.; Caliro, S.; De Cesare, W.; Bianco, F.; Pugliese, M.; Roca, V. Continuous radon monitoring during seven years of volcanic unrest at Campi Flegrei caldera (Italy). Sci. Rep. 2020, 10, 9551. [Google Scholar] [CrossRef]
  62. Dawson, J.B.; Pinkerton, H.; Pyle, D.M.; Nyamweru, C. June 1993 eruption of Oldoinyo Lengai, Tanzania: Exceptionally viscous and large carbonatite lava flows and evidence for coexisting silicate and carbonate magmas. Geology 1994, 22, 799–802. [Google Scholar] [CrossRef]
  63. Zuppetta, A.; Sava, A. Stress pattern at Campi Flegrei from focal mechanisms of the 1982–1984 earthquakes (Southern Italy). J. Volcanol. Geotherm. Res. 1991, 48, 127–137. [Google Scholar] [CrossRef]
  64. Global Volcanism Program, 1981. Report on Acatenango (Guatemala) (McClelland, L., Ed.). Scientific Event Alert Network Bulletin, 6:3. Smithsonian Institution. Available online: https://doi.org/10.5479/si.GVP.SEAN198103-342080. (accessed on 3 July 2020).
  65. USGS—Kilauea 2018, Lower East Rift Zone and Summit-Collapse Event. Available online: https://wim.usgs.gov/geonarrative/kilauea2018/ (accessed on 1 June 2020).
  66. Global Volcanism Program. Report on Nishinoshima (Japan). In Bulletin of the Global Volcanism Network 2020; Crafford, A.E., Venzke, E., Eds.; Smithsonian Institution: Washington, DC, USA, 2020. [Google Scholar]
  67. Sennert, S.K. (Ed.) Report on Sierra Negra (Ecuador). In Weekly Volcanic Activity Report; Smithsonian Institution and US Geological Survey: Boulder, CO, USA, 2018. [Google Scholar]
  68. Global Volcanism Program. 2019. Report on Ol Doinyo Lengai (Tanzania) (Crafford, A.E., Venzke, E., Eds.). Bulletin of the Global Volcanism Network, 44:9. Smithsonian Institution. Available online: https://doi.org/10.5479/si.GVP.BGVN201909-222120 (accessed on 23 June 2020).
  69. Kervyn, M.; Ernst, G.G.J.; Harris, A.J.L.; Belton, F.; Mbede, E.; Jacobs, P. Thermal Remote Sens. of the low-intensity carbonatite volcanism of Oldoinyo Lengai, Tanzania. Int. J. Remote Sens. 2008, 29, 6467–6499. [Google Scholar] [CrossRef]
  70. Caputo, T.; Bellucci Sessa, E.; Silvestri, M.; Buongiorno, M.F.; Musacchio, M.; Sansivero, F.; Vilardo, G. Surface temperature multiscale monitoring by thermal infrared satellite and ground images at Campi Flegrei volcanic area (Italy). Remote Sens. 2019, 11, 1007. [Google Scholar] [CrossRef] [Green Version]
  71. Burgi, P.Y.; Darrah, T.H.; Tedesco, D.; Eymold, W.K. Dynamics of the Mount Nyiragongo lava lake. J. Geophys. Res. Solid Earth 2014, 119, 4106–4122. [Google Scholar] [CrossRef] [Green Version]
  72. Norjamaki, I.; Tokola, T. Comparison of atmospheric correction methods in mapping timber volume with multitemporal Landsat images in Kainuu, Finland. Photogramm. Eng. Remote Sens. 2007, 73, 155–163. [Google Scholar] [CrossRef]
  73. Major, J.J.; Dzurisin, D.; Schilling, S.P.; Poland, M.P. Monitoring lava-dome growth during the 2004–2008 Mount St. Helens, Washington, eruption using oblique terrestrial photography. Earth Planet. Sci. Lett. 2009, 286, 243–254. [Google Scholar] [CrossRef]
  74. Vaughan, R.G.; Hook, S.J.; Ramsey, M.S.; Realmuto, V.J.; Schneider, D.J. Monitoring eruptive activity at Mount St. Helens with TIR image data. Geophys. Res. Lett. 2005, 32, 1–4. [Google Scholar] [CrossRef] [Green Version]
  75. Lacava, T.; Marchese, F.; Arcomano, G.; Coviello, I.; Falconieri, A.; Faruolo, M.; Paciello, R.; Pergola, N.; Tramutoli, V. Thermal monitoring of Eyjafjöll volcano eruptions by means of infrared MODIS data. IEEE J. Sel. Top. Appl. Earth Obs. Remote Sens. 2014, 7, 3393–3401. [Google Scholar] [CrossRef]
  76. Brooks, E.B.; Wynne, R.H.; Thomas, V.A. Using window regression to gap-fill Landsat ETM+ post SLC-Off data. Remote Sens. 2018, 10, 1502. [Google Scholar] [CrossRef] [Green Version]
  77. USGS, Landsat Known Issues. Available online: https://www.usgs.gov/land-resources/nli/landsat/landsat-known-issues (accessed on 3 June 2020).
  78. Pieri, D.; Abrams, M. ASTER watches the world’s volcanoes: A new paradigm for volcanological observations from orbit. J. Volcanol. Geotherm. Res. 2003, 135, 13–28. [Google Scholar] [CrossRef]
  79. Elvidge, C.D.; Bazilian, M.D.; Zhizhin, M.; Ghosh, T.; Baugh, K.; Hsu, F.C. The potential role of natural gas flaring in meeting greenhouse gas mitigation targets. Energy Strategy Rev. 2018, 20, 156–162. [Google Scholar] [CrossRef]
  80. Faruolo, M.; Coviello, I.; Filizzola, C.; Lacava, T.; Pergola, N.; Tramutoli, V. A satellite-based analysis of the Val d’Agri Oil Center (southern Italy) gas flaring emissions. Nat. Hazards Earth Syst. Sci. 2014, 14, 2783–2793. [Google Scholar] [CrossRef] [Green Version]
  81. Faruolo, M.; Lacava, T.; Pergola, N.; Tramutoli, V. The VIIRS-Based RST-FLARE Configuration: The Val d’Agri Oil Center Gas Flaring Investigation in Between 2015–2019. Remote Sens. 2020, 12, 819. [Google Scholar] [CrossRef] [Green Version]
  82. Fisher, D.; Wooster, M.J. Shortwave IR adaption of the mid-infrared radiance method of fire radiative power (FRP) retrieval for assessing industrial gas flaring output. Remote Sens. 2018, 10, 305. [Google Scholar] [CrossRef] [Green Version]
  83. Elvidge, C.D.; Zhizhin, M.; Baugh, K.; Hsu, F.C.; Ghosh, T. Methods for global survey of natural gas flaring from visible infrared imaging radiometer suite data. Energies 2016, 9, 14. [Google Scholar] [CrossRef]
  84. Yu, P.; Xu, R.; Abramson, M.J.; Li, S.; Guo, Y. Bushfires in Australia: A serious health emergency under climate change. Lancet Planet. Health 2020, 4, e7–e8. [Google Scholar] [CrossRef] [Green Version]
  85. Nolan, R.H.; Boer, M.M.; Collins, L.; Resco de Dios, V.; Clarke, H.; Jenkins, M.; Belinda, K.; Bradstock, R.A. Causes and consequences of eastern Australia’s 2019-20 season of mega-fires. Global Chang. Biol. 2020, 26, 1039–1041. [Google Scholar] [CrossRef] [Green Version]
  86. Fire Information for Resource Management System (FIRMS). Available online: https://firms.modaps.eosdis.nasa.gov/ (accessed on 28 April 2020).
  87. Anantrasirichai, N.; Albino, F.; Hill, P.; Bull, D.; Biggs, J. Detecting Volcano Deformation in InSAR using Deep learning. arXiv 2018, arXiv:1803.00380. [Google Scholar]
Figure 1. Graphical user interface (GUI) of the Normalized Hot spot Indices (NHI) tool. Gray arrows indicate the three fields required to start elaborations trough the “Start Analysis Button”.
Remotesensing 12 03232 g001
Figure 2. Outputs of the NHI tool: (1) plot of hot spot pixel number versus time; (2) plot of total SWIR radiance. On the right, layers menu and thermal anomaly map (see red/yellow pixels), overlapped to the RGB (Red = Band 12; Green = Band 11; Blue = Band 8A) product from Sentinel-2 MSI data of 17 September 2018, covering the area of the Krakatau (6°06′07.2″S 105°25′22.8″E) volcano (Indonesia).
Remotesensing 12 03232 g002
Figure 3. Thermal activity of the Tolbachik (55°49′48″N; 160°19′48″E) (Russia) volcano investigated by means of the NHI tool. On the left, temporal evolution of hot spot pixel number (blue curve) from satellite data of April 2013–May 2020; on the right, thermal anomaly map of 5 June 2013. In background, the OLI RGB (Red = SWIR2; Green = SWIR1; Blue = NIR) image. White circles indicate some of the areas with missed detections. Yellow, red and violet pixels indicate hot spots of a different intensity level (see NHI legend and Table 1).
Remotesensing 12 03232 g003
Figure 4. Example of false positives (see red/yellow pixels indicated by the green arrows) affecting the area of the Tolbachick volcano, owing to residual multispectral misregistration issues and striping of SWIR bands. In background, the RGB product from Sentinel-2 MSI data of 1 August 2017.
Remotesensing 12 03232 g004
Figure 5. Karangetang (2°46′40″N 125°24′27″E) thermal activity of 1 January 2017–30 April 2020; in green, chart of total hot spot pixel area. On the right, thermal anomaly map from Sentinel-2 MSI data of 30 December 2018.
Remotesensing 12 03232 g005
Figure 6. Plot of total hot spot area retrieved at Karangetang (Indonesia), referring to the same time-period of Figure 5. The plot was generated offline integrating Sentinel-2 MSI (red curve) and Landsat-8 OLI (blue curve) observations.
Remotesensing 12 03232 g006
Figure 7. Thermal anomaly maps from S2-MSI and L8-OLI data of 7–30 July 2019, covering the Stromboli (38°47′38″N 15°12′40″E) volcano (Italy), generated by means of the NHI tool (v.1.4).
Remotesensing 12 03232 g007
Figure 8. Mt. Etna (37°45′03.69″N 14°59′38.51″E) (Sicily; Italy) thermal activity of June–August 2016 investigated through the NHI tool. On the left, temporal trend of hot spot pixels (blue curve) and chart of total SWIR radiance (blue/red curves); on the right, hot spot pixels (in yellow) detected on L8-OLI scene of 28 June 2016, affecting the area where a new vent opened on 7 August 2016.
Remotesensing 12 03232 g008
Figure 9. Lava flow at the lower East rift zone (LERZ) of Kilauea (19°25′15.95″N 155°17′12.34″W) volcano, investigated by setting a distance buffer of 50 km (see white circle). Note that the tool generated only outputs from Landsat-8 OLI data due to Google Earth Engine (GEE) restrictions (see text).
Remotesensing 12 03232 g009
Figure 10. Sierra Negra (0.83°S 91.17°W) thermal activity of April 2013–May 2020. On the left, temporal trend of hot spot pixel (blue curve) retrieved from L8 and S2 data. On the right, thermal anomaly map from Sentinel-2 MSI data of 6 July 2018.
Remotesensing 12 03232 g010
Figure 11. Oldoynio Lengai (2°45′00″S 35°55′12″E) thermal activity of April 2013–May 2020, and thermal anomaly map of 12 May 2018, showing an intra-crater thermal anomaly (indicated by the black arrow) undetected by the tool, regardless of used version.
Remotesensing 12 03232 g011
Figure 12. Nyiragongo (1°31′18.84″S 29°14′59.28″E) thermal activity of January 2016–April 2020 investigated by means of the NHI tool version v.1.3 (a) plot of hot spot pixel number; (b) plot of total SWIR1/SWIR2 radiances.
Remotesensing 12 03232 g012
Figure 13. Preliminary implementation of the NHI algorithm on Landsat TM/ETM+ data, performed under the GEE platform; (a) Mount St. Helens (46°12′0.89″N 122°8′44.17″W) activity investigated using Landsat-5 TM data of 1985–2010. On the right, thermal anomaly map of 14 October 2004; (b) Eyjafjallajökull (63°37′12″N 19°36′48″W) thermal activity of 1999–2014 analyzed using Landsat-7 ETM+ data. On the right, thermal anomaly map of 3 April 2010 generated using the same color code as Figure 3. In background the RGB imagery.
Remotesensing 12 03232 g013aRemotesensing 12 03232 g013b
Figure 14. Thermal anomalies (red/yellow pixels) identified by NHI, under the GEE platform, at Val d’Agri (Southern Italy) Oil Center (Basilicata Region; Southern Italy) from Landsat-8 OLI data of 14 December 2019.
Remotesensing 12 03232 g014
Figure 15. Forest fires (red pixels) identified and mapped by the NHI algorithm, under the GEE environment, on a S2-MSI scene of 15 January 2020 covering the New South Wales region (Australia).
Remotesensing 12 03232 g015
Table 1. Description of NHI tool versions. The test for extreme pixels takes into account the nominal saturation radiances of Short-Wave Infrared (SWIR) channel at 1.6 µm wavelength (e.g., 71.3 W/m2 sr µm; for the Operational Land Imager (OLI)) (see [48,49]); (* tests applied only to pixels flagged by the index in Equation (2)). ND12-8A is a normalized index, using bands 12 and 8A of the Multispectral Instrument (MSI) sensor.
NHI Tool VersionInitial Test on SWIR RadianceTest for Hot Spot Pixels Test for Extreme Pixels Test for MSI Multispectral Misregistration Issues
OLIMSI
v. 1.1L2.2 > 3.0NHISWIR > 0
(mid-low intensity)
OR
NHISWNIR > 0
(high-intensity)
N/AN/A
v. 1.2L0.44 < 80 AND ND12-8A > −0.6
* L0.44 < 80 AND ND12-8A > −0.2
v.1.3/1.4L2.2 > 2.0L1.6 ≥ 71.3
AND
L0.44 < 70
L1.6 ≥ 70 AND
L0.705 < 70
L0.705 < 90 AND ND12-8A > −0.6
* L0.705 < 70 AND ND12-8A > −0.3
Table 2. False positive rate (FPR) of the different NHI tool versions estimated from L8-OLI and S2-MSI data of April 2013–May 2020, at a different distance buffer (DB), with indication of factors generating false detections; N/A not applicable.
Volcano FPRDBFactors
L8-OLIS2-MSI
v1.1v1.2v1.3/1.4
Acatenango (Guatemala)0.0%0.0%0.0%0.0%2.5 kmN/A
Suwanoseijima (Japan)0.0%0.8%0.8%0.8%4 kmdata issues
Nishinoshima (Japan)0.0%N/AN/AN/A4 kmN/A
Shishaldin (USA)0.0%1.1%0.0%0%5 kmN/A
Oldoynio Lengai (Africa)1.2%0.0%0.0%0.0%5 kmfires
Campi Flegrei (Italy)1.7%19.2%7.4%12.3%6 kmfires/data issues
Tolbachick (USA)0.0%12.1%2.1%3.5%20 kmdata issues
Table 3. L8-OLI data of April 2013–May 2020, with evidences of thermal anomalies at Oldoynio Lengai (Tanzania; Africa) revealed by the manual inspection of satellite imagery.
Landsat-8 OLI Data (YYYYMMDD)Detected (Yes/No)
20130523N
20130717N
20130818N
20161029N
20180120N
20180512N
20180528N
20180715Y
20180901Y
20190123N
20190224Y
20190616Y
20190702Y
20190803Y
20190819N
20191006N
20200415Y
20200501Y

