An Investigation of Vertically Distributed Aerosol Optical Properties over Pakistan Using CALIPSO Satellite Data

 ,
,  , , ,
, , ,  and
and 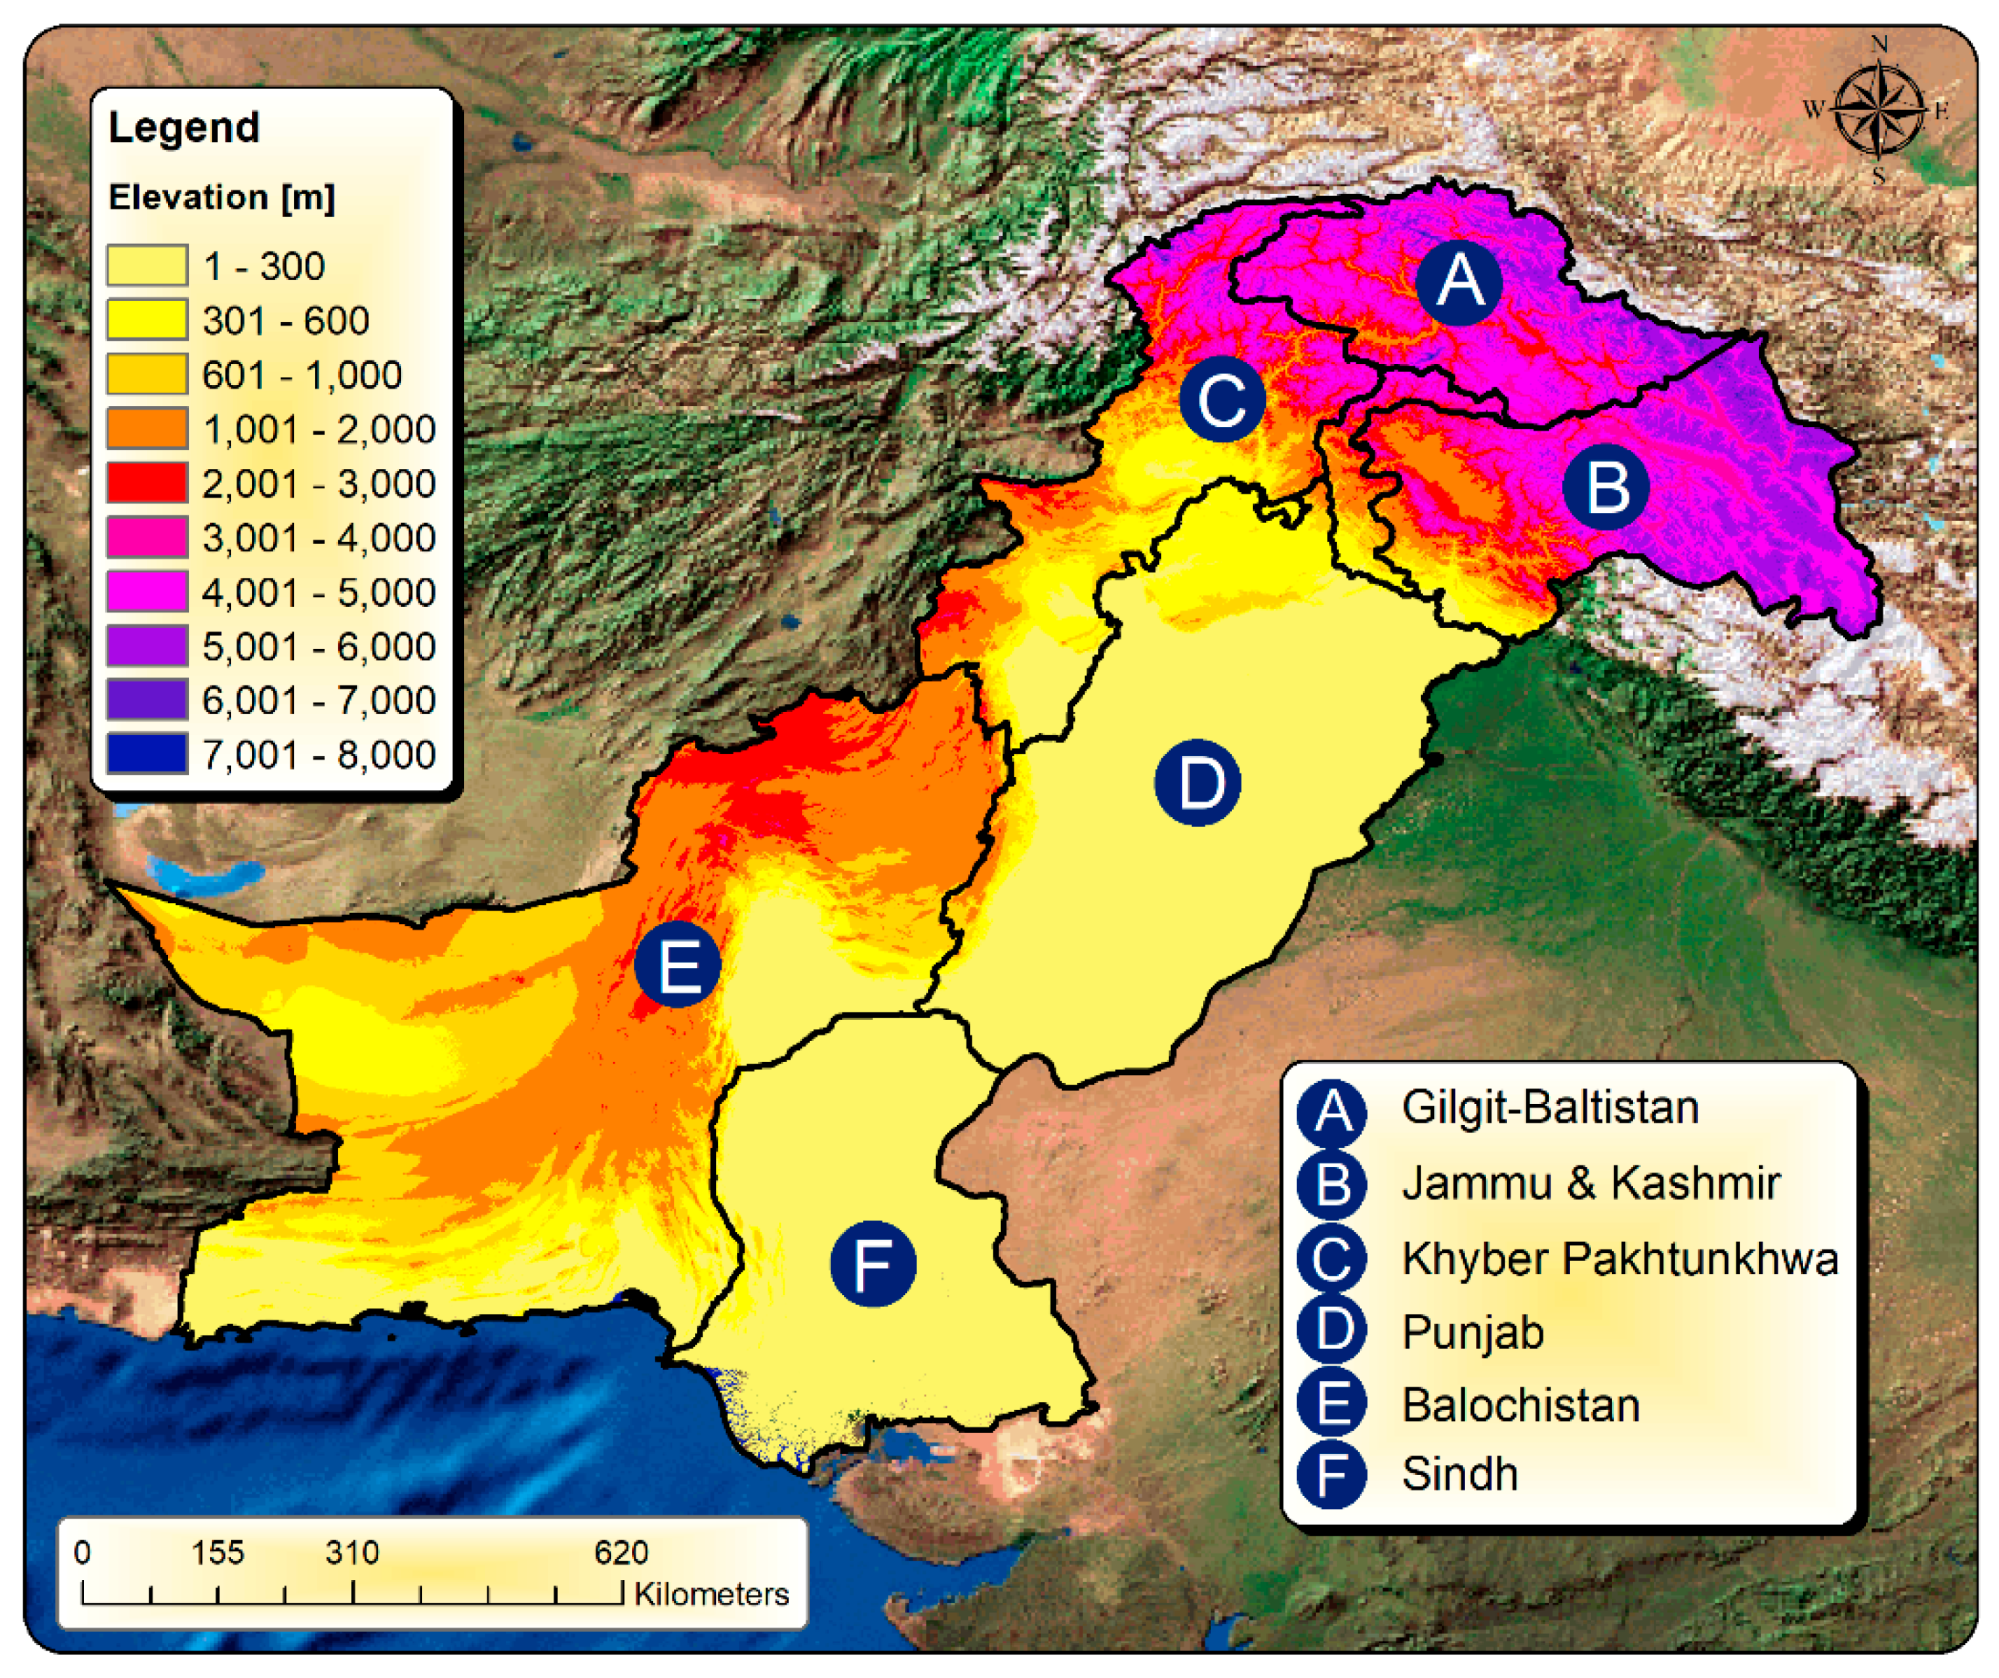
Abstract
:1. Introduction
2. Methodology
2.1. Study Area
2.2. Materials and Methods
3. Results and Discussion
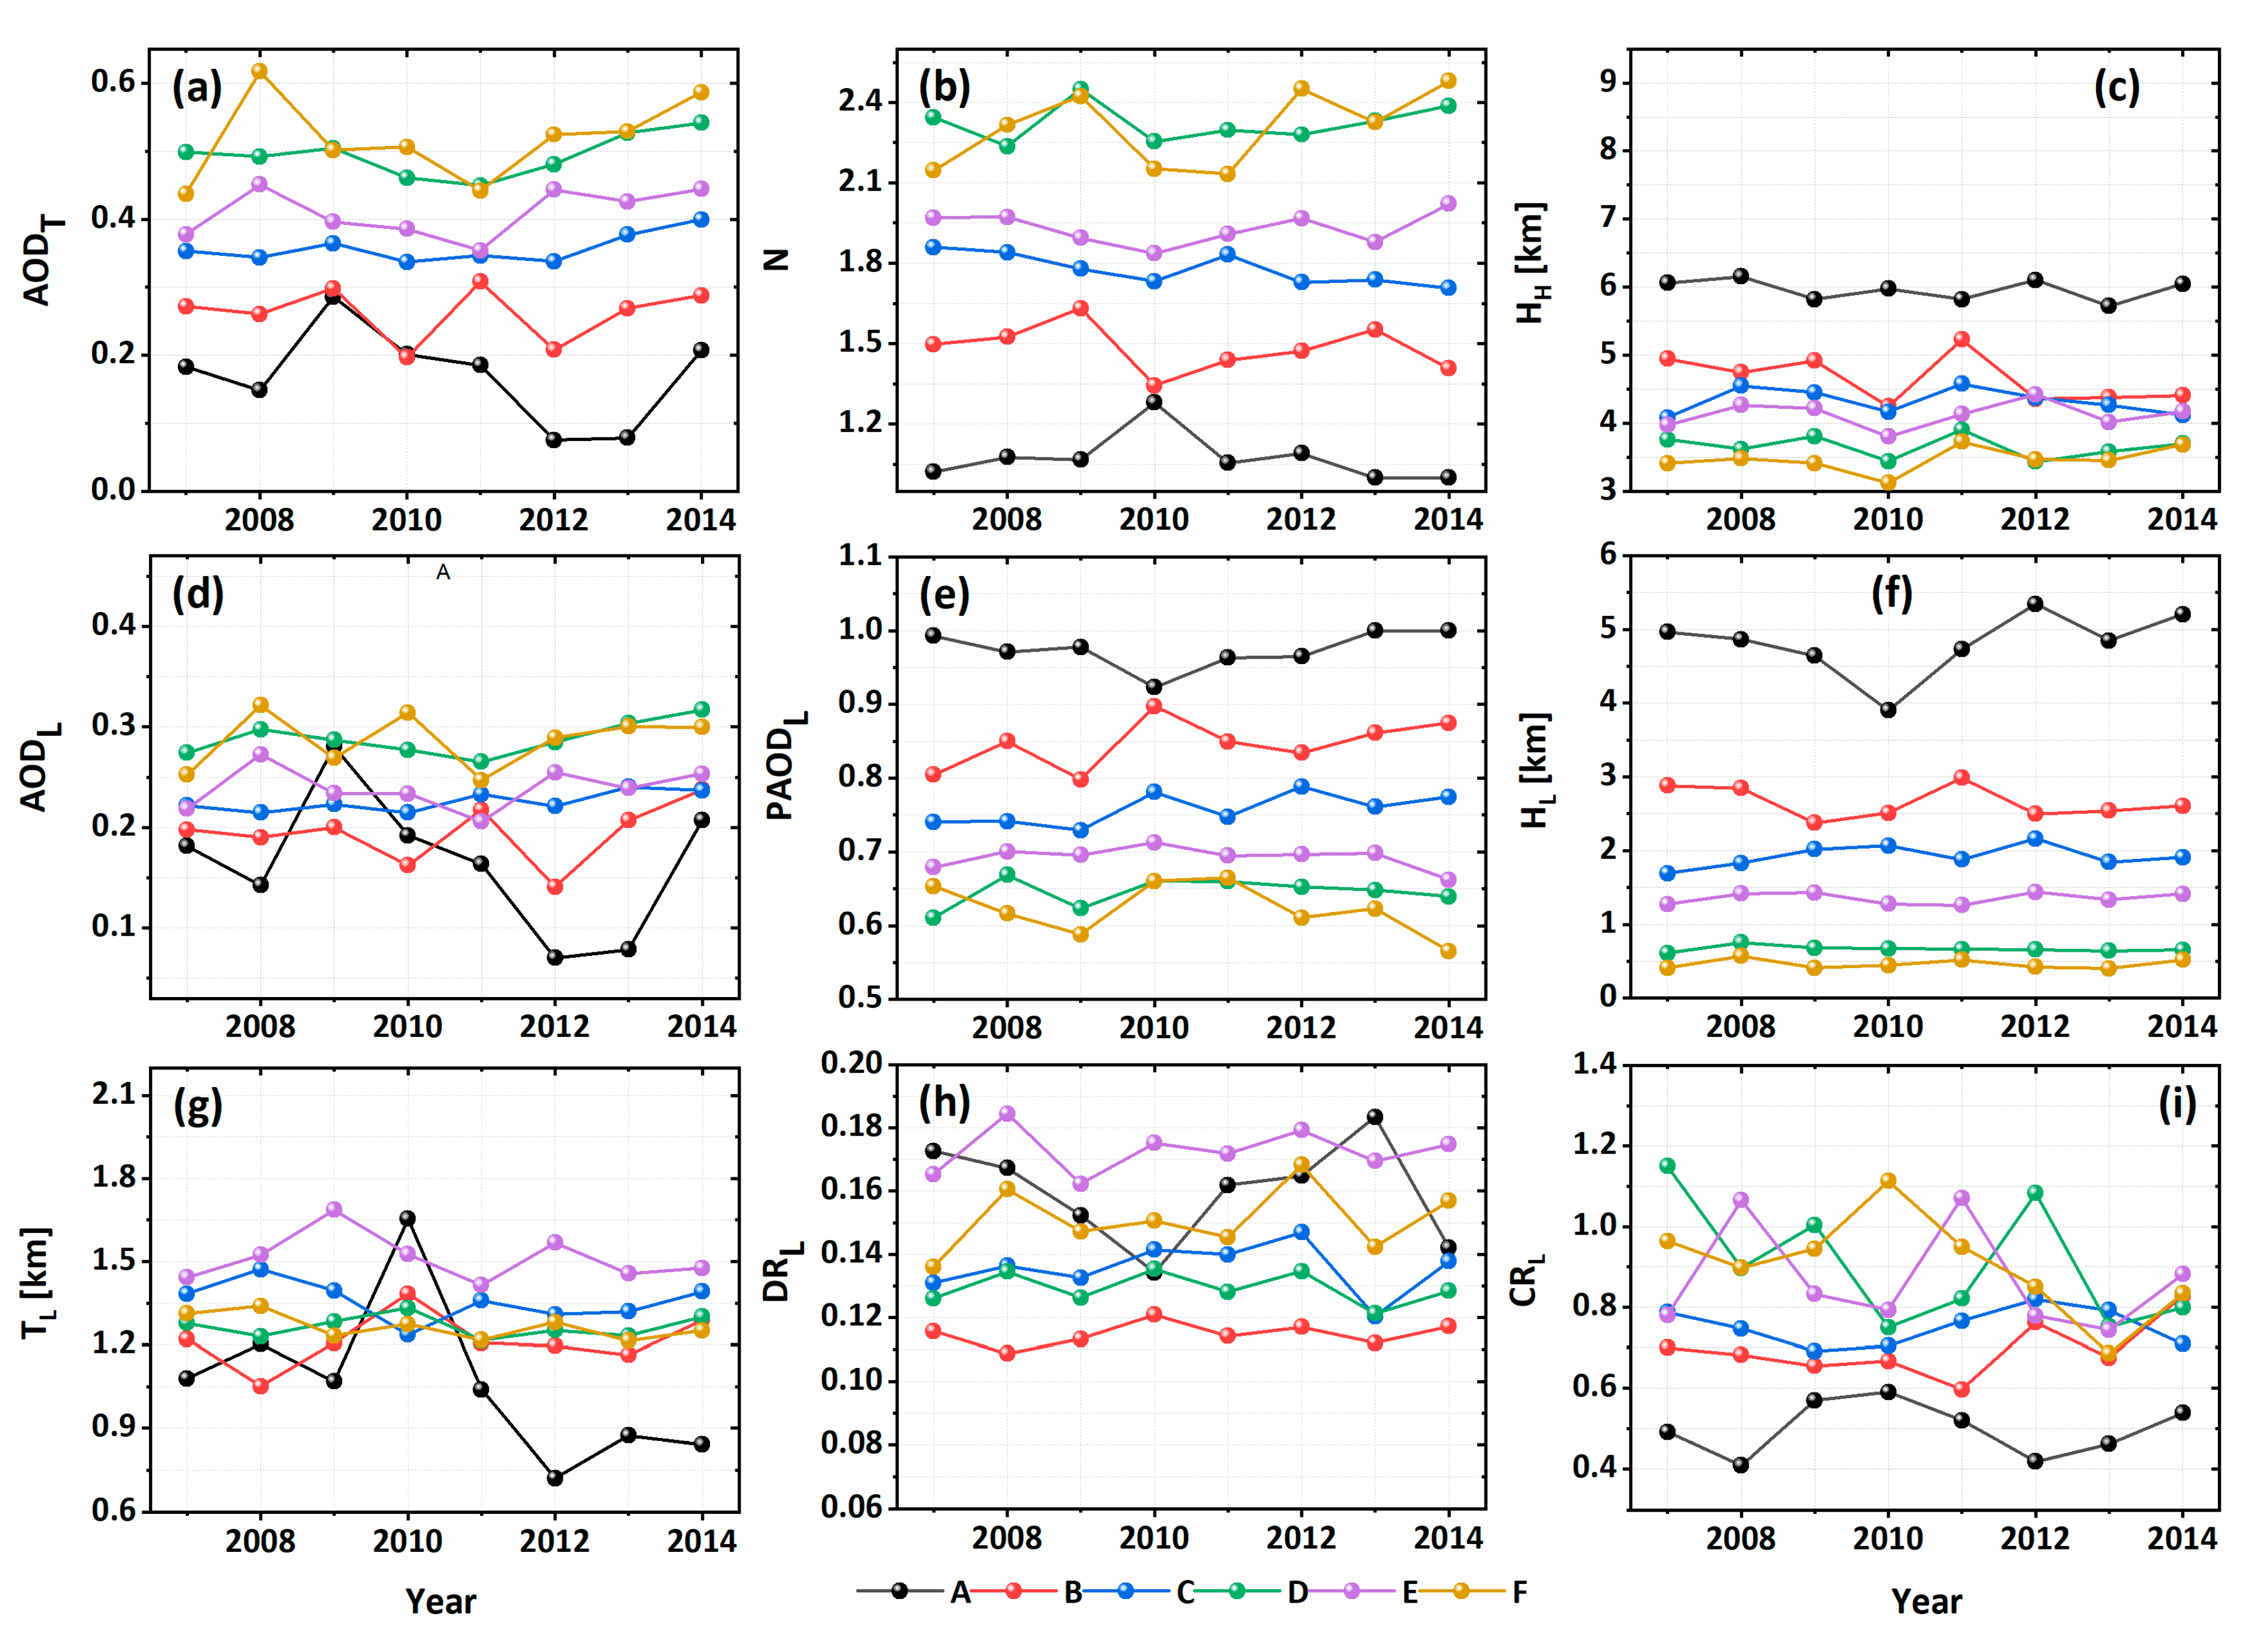
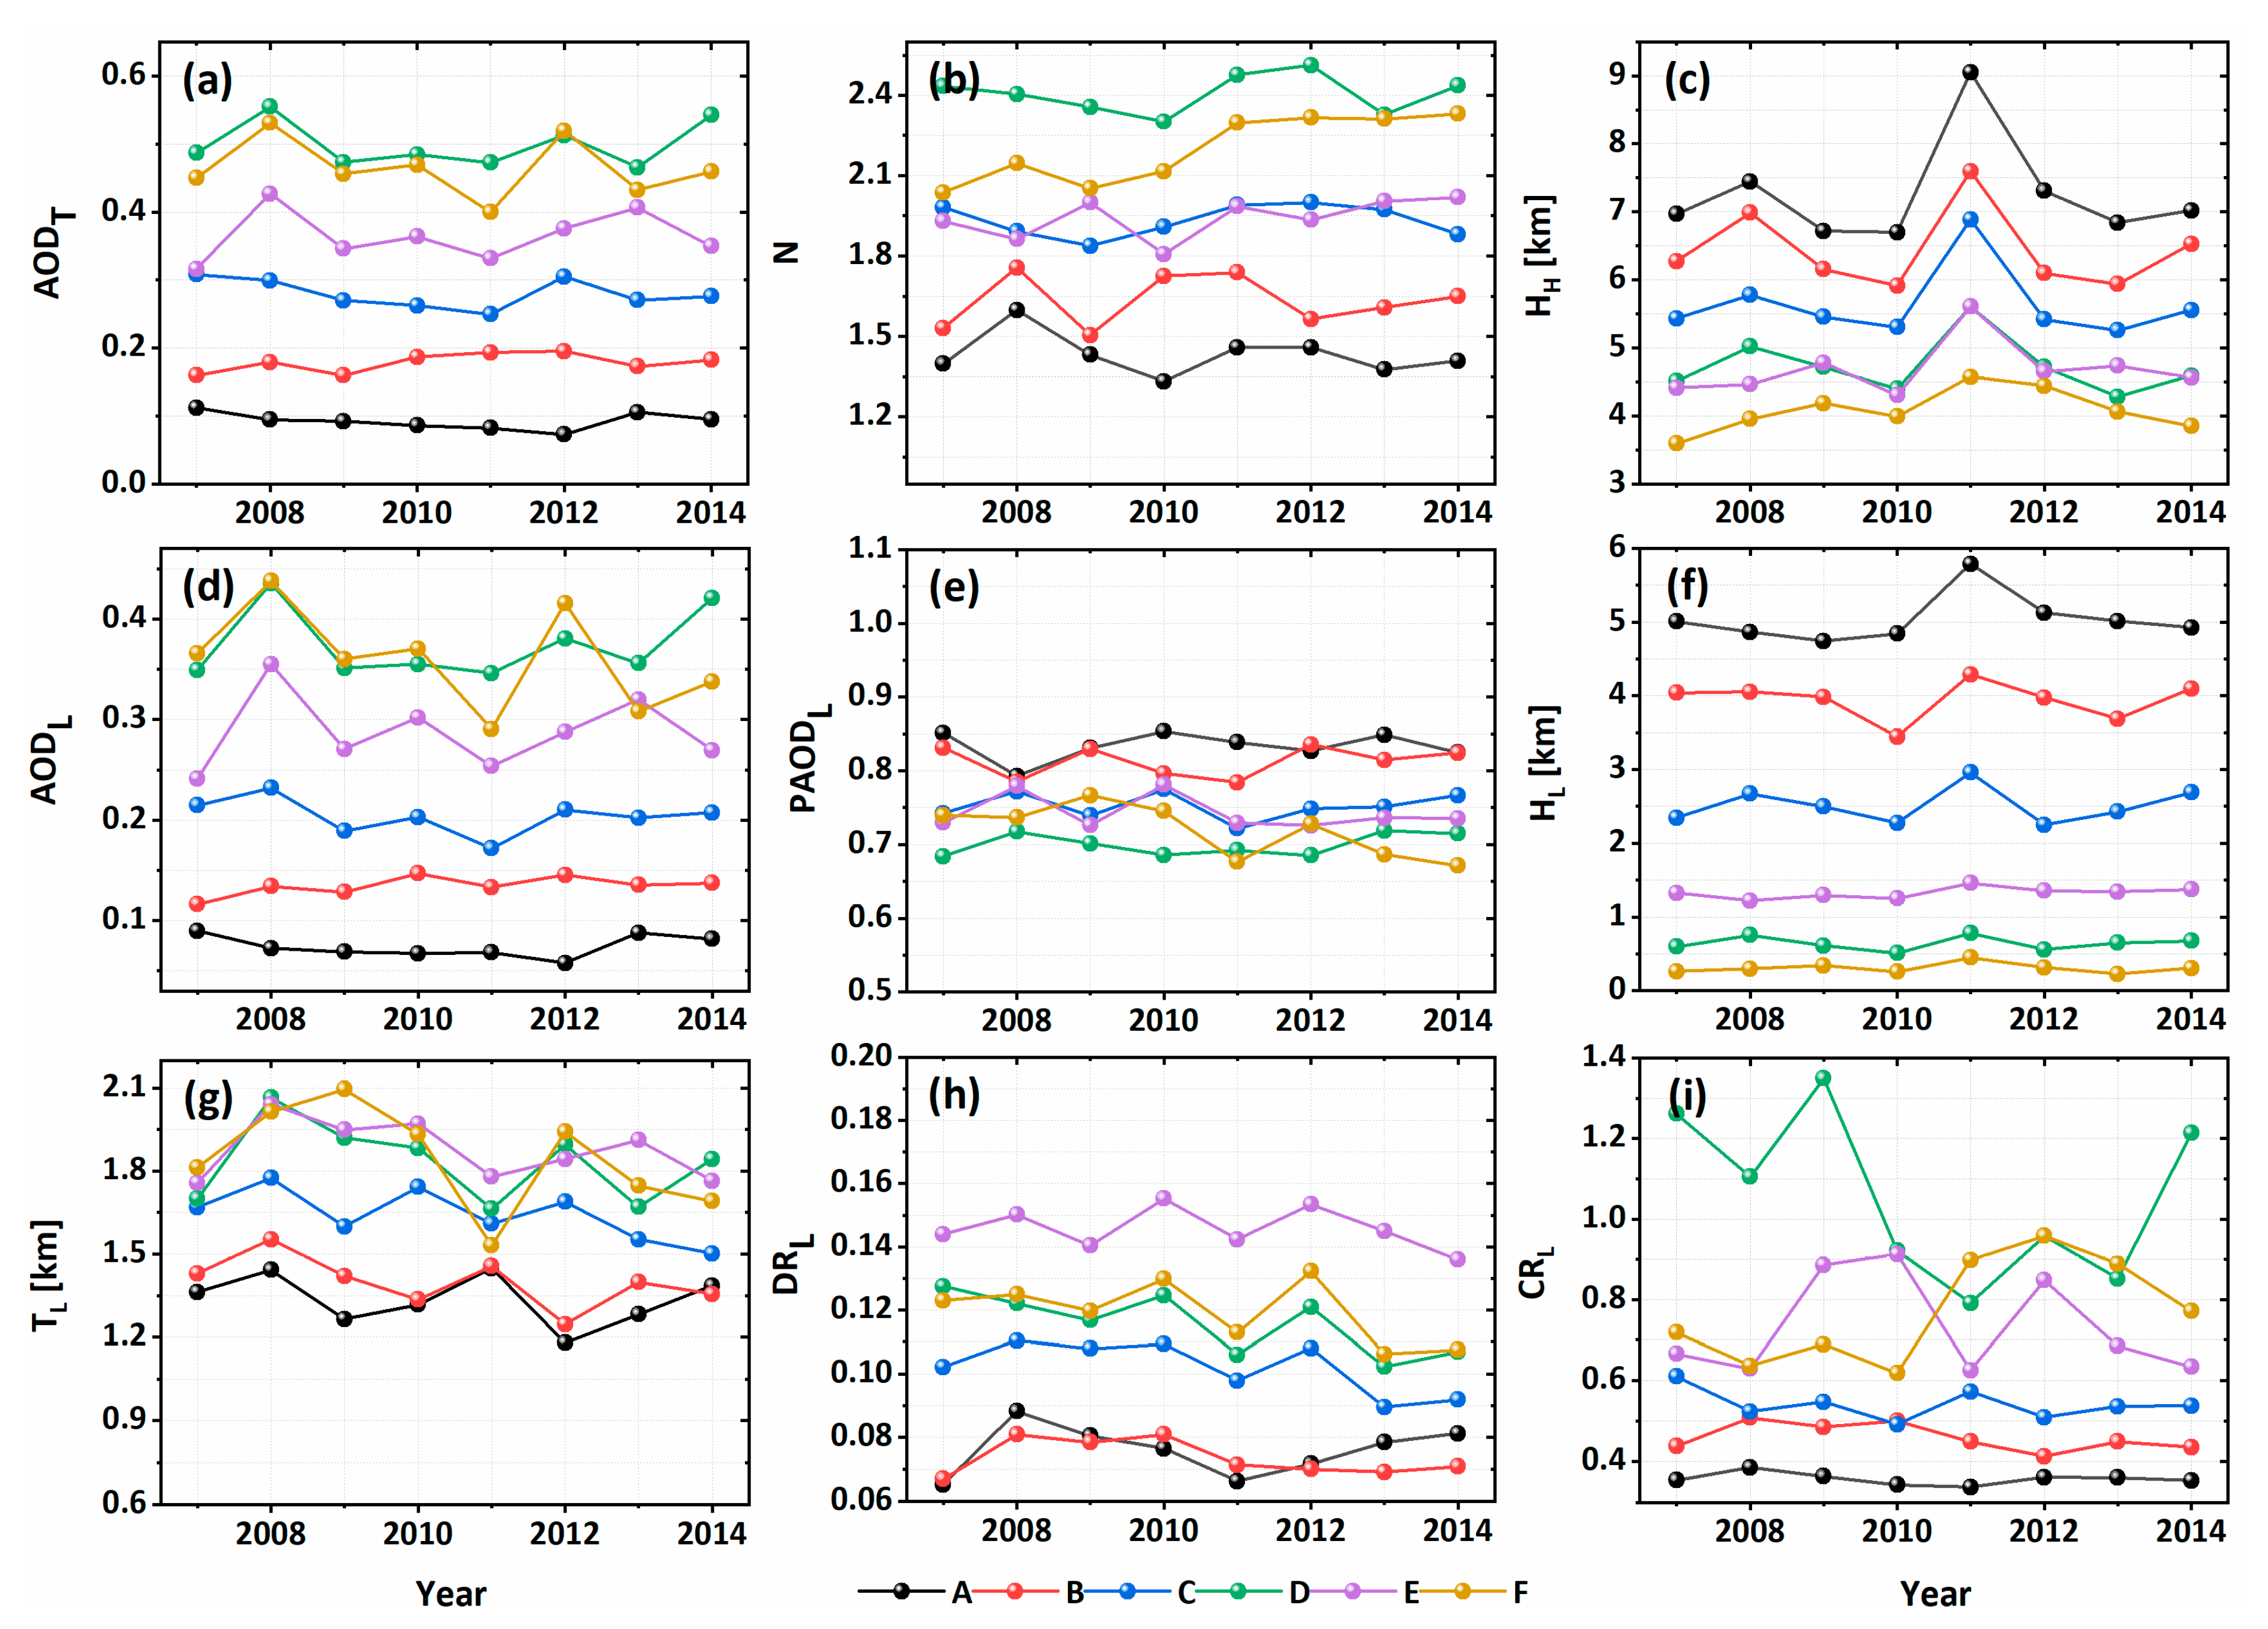
3.1. Interannual Variations in Optical Characteristics of Aerosol Layers
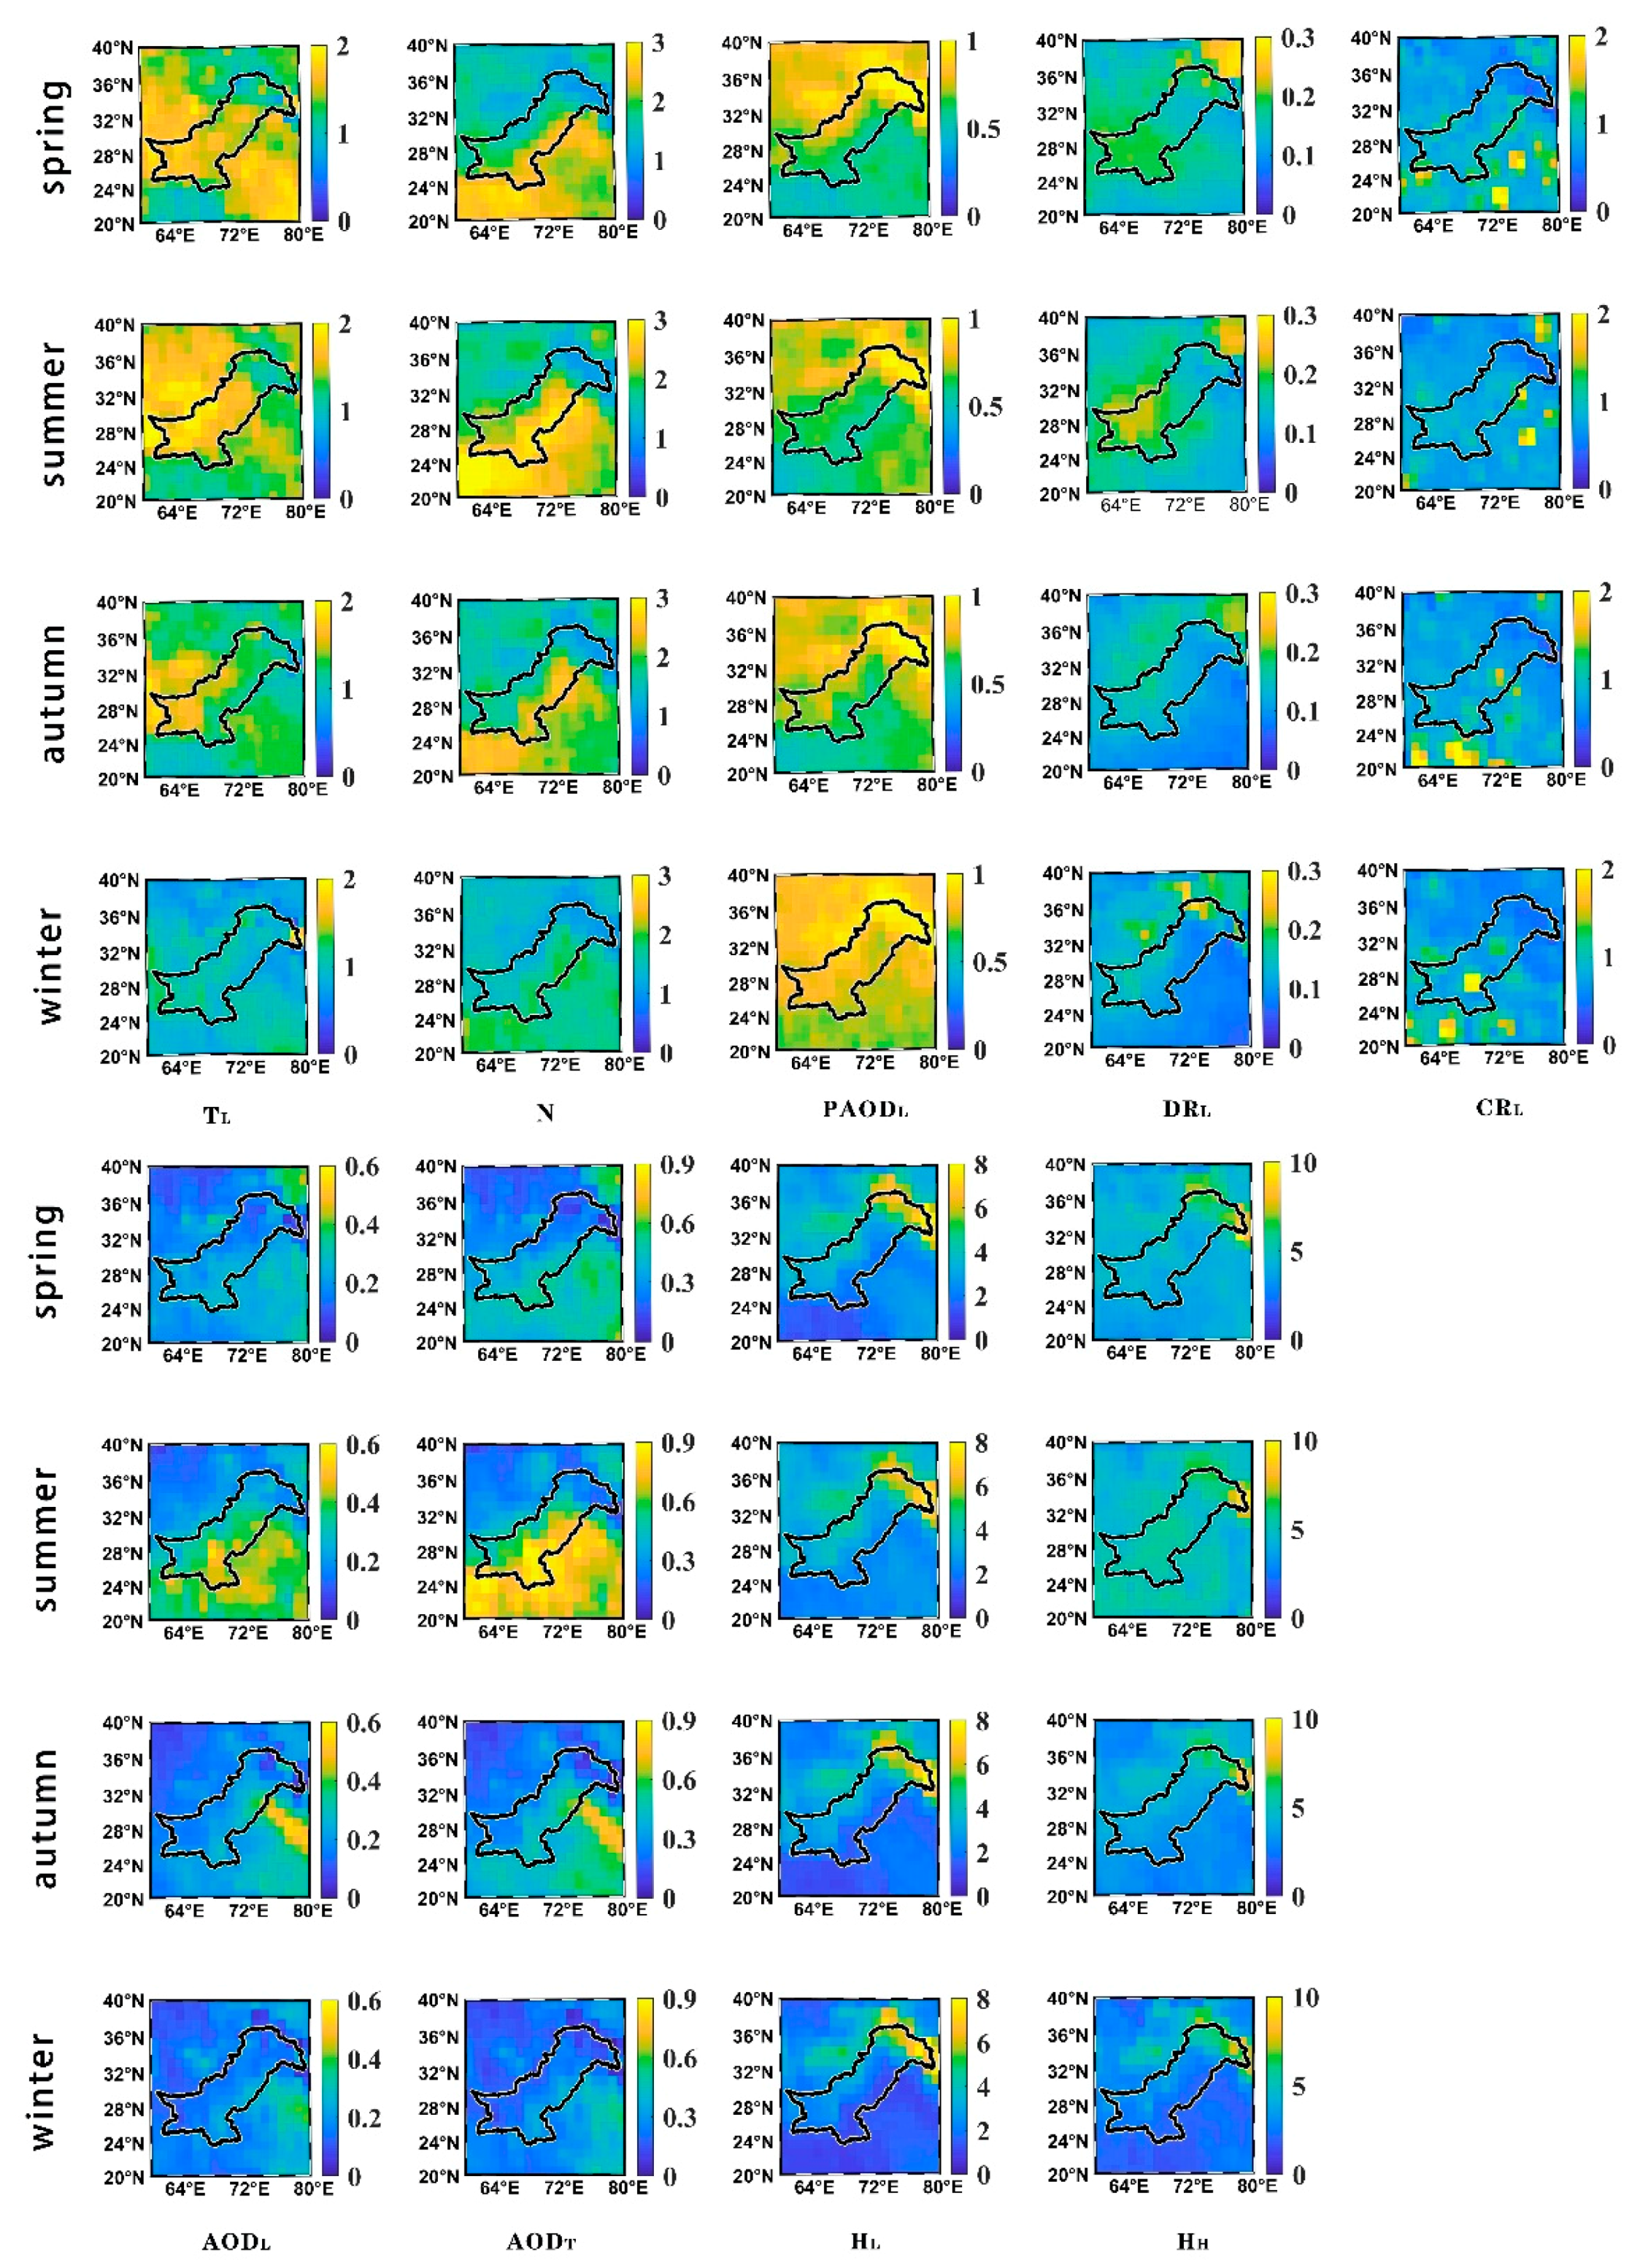
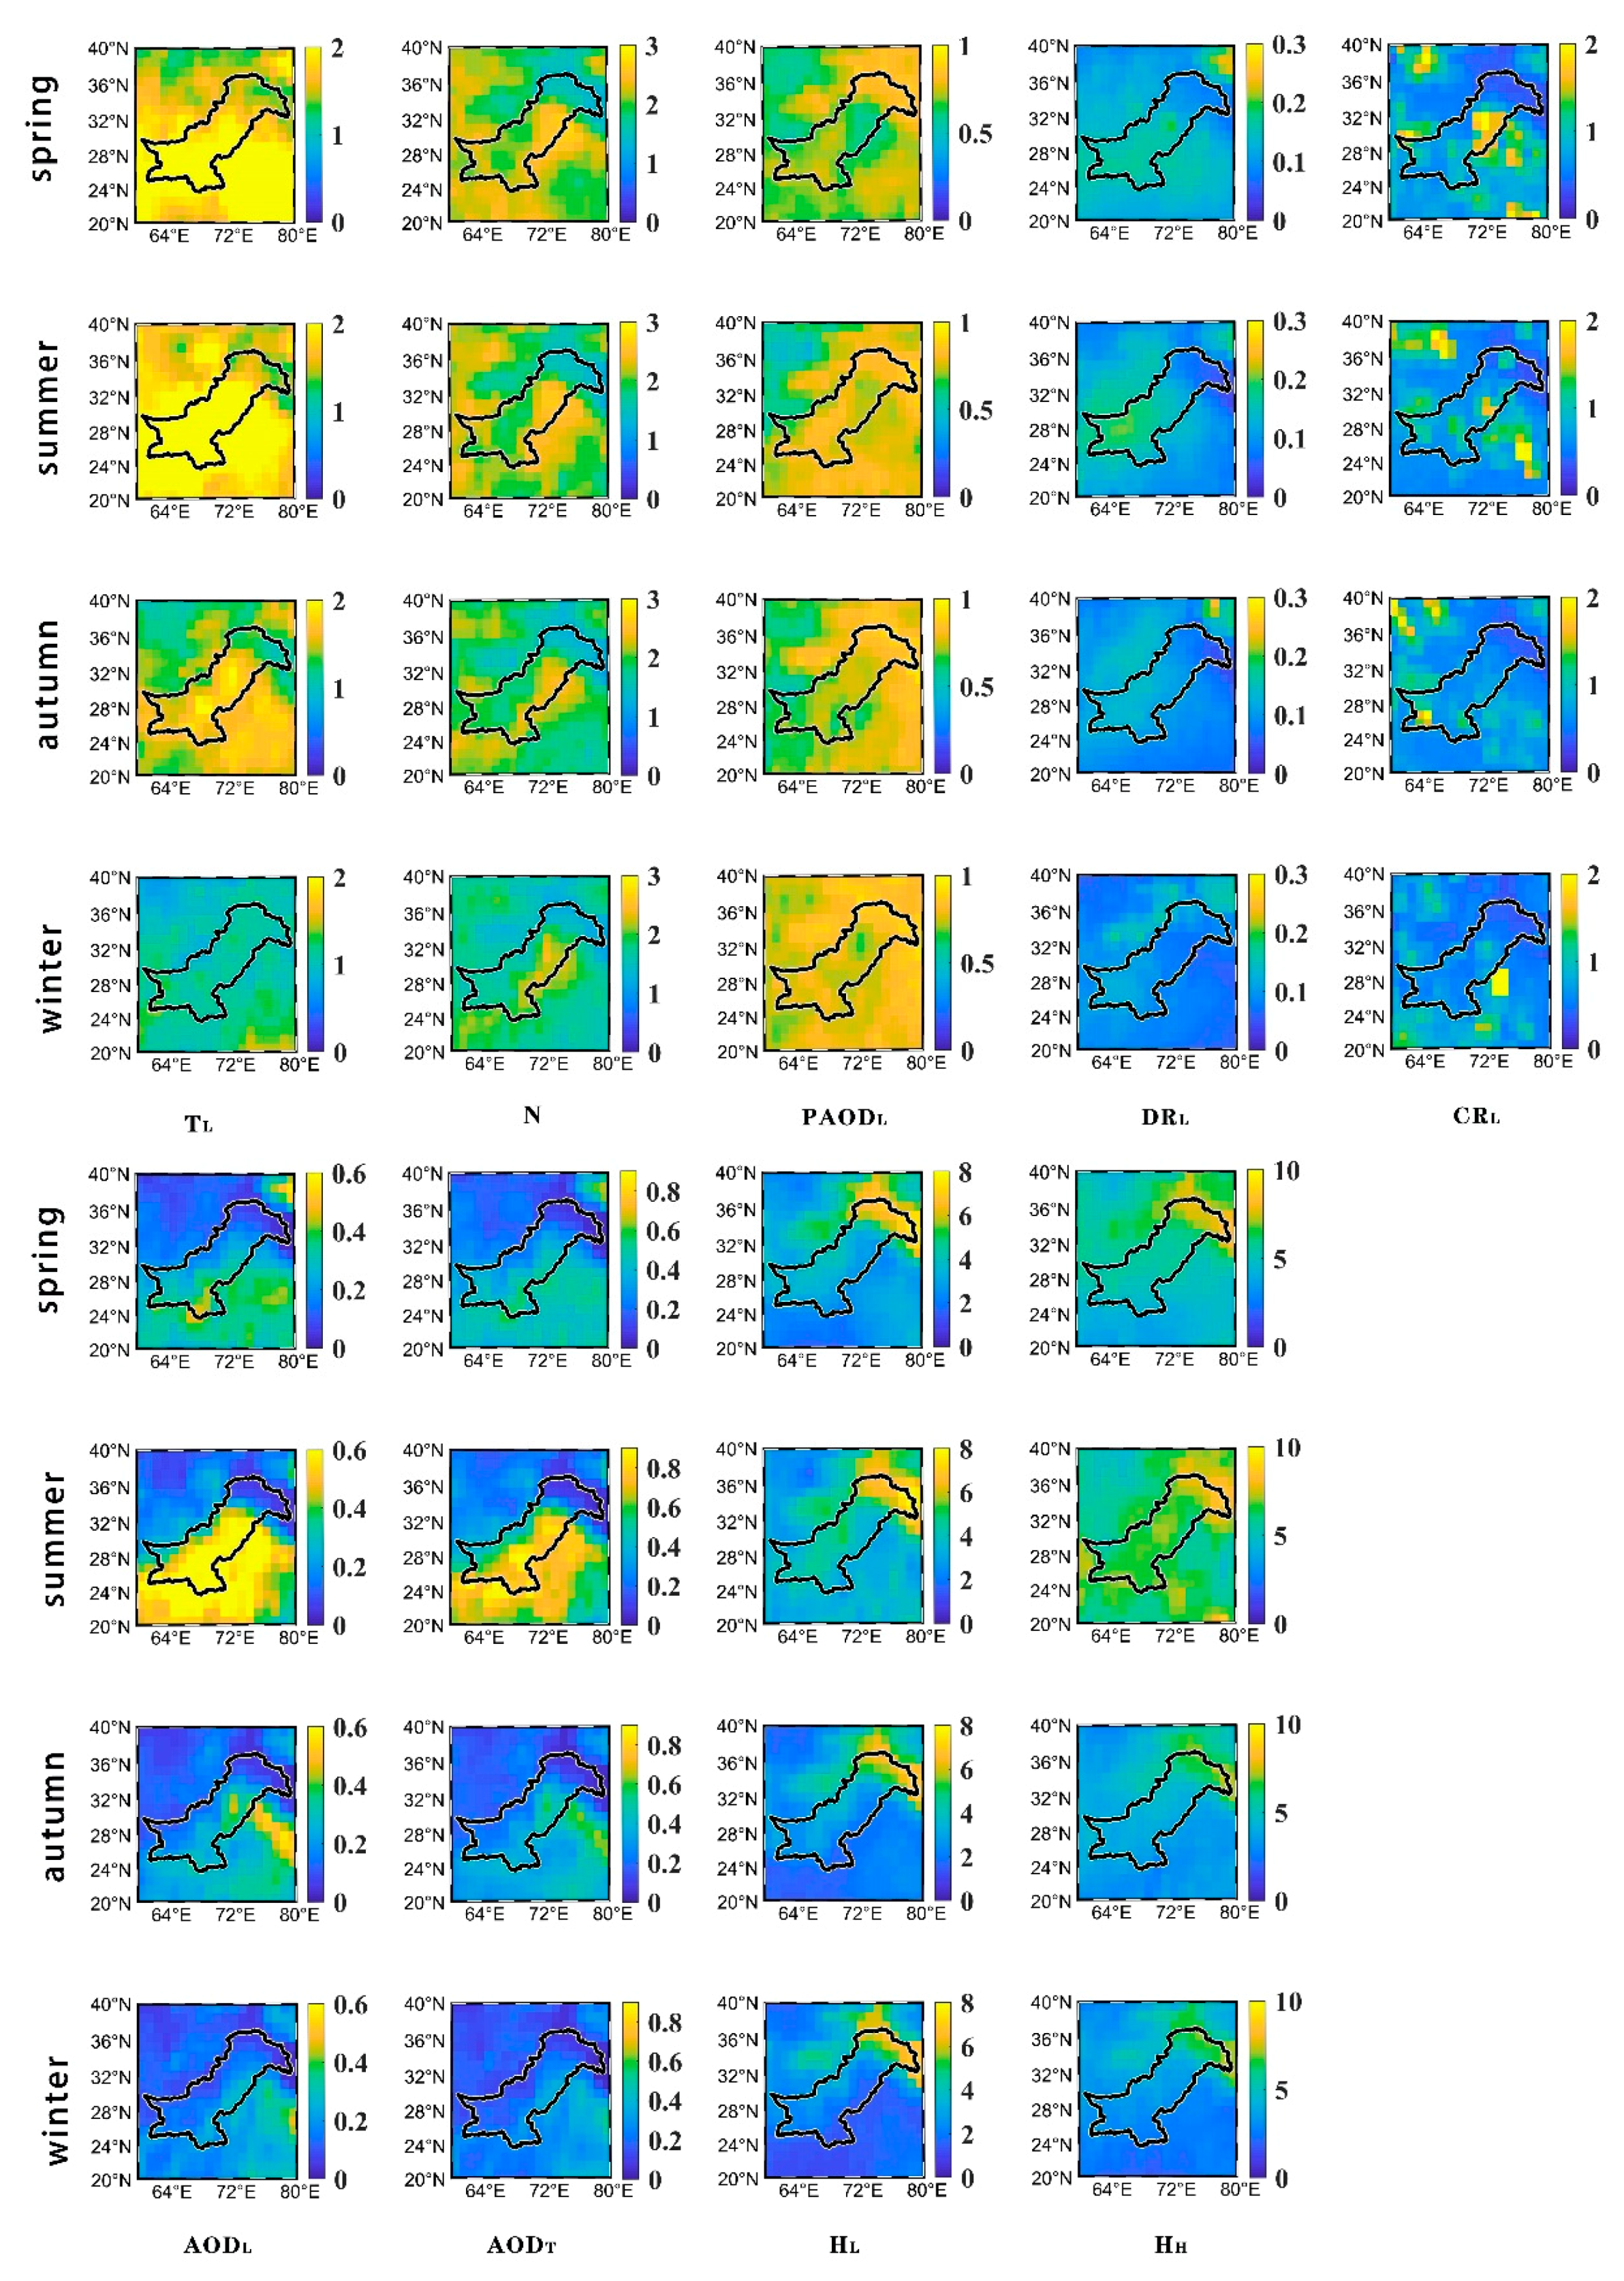
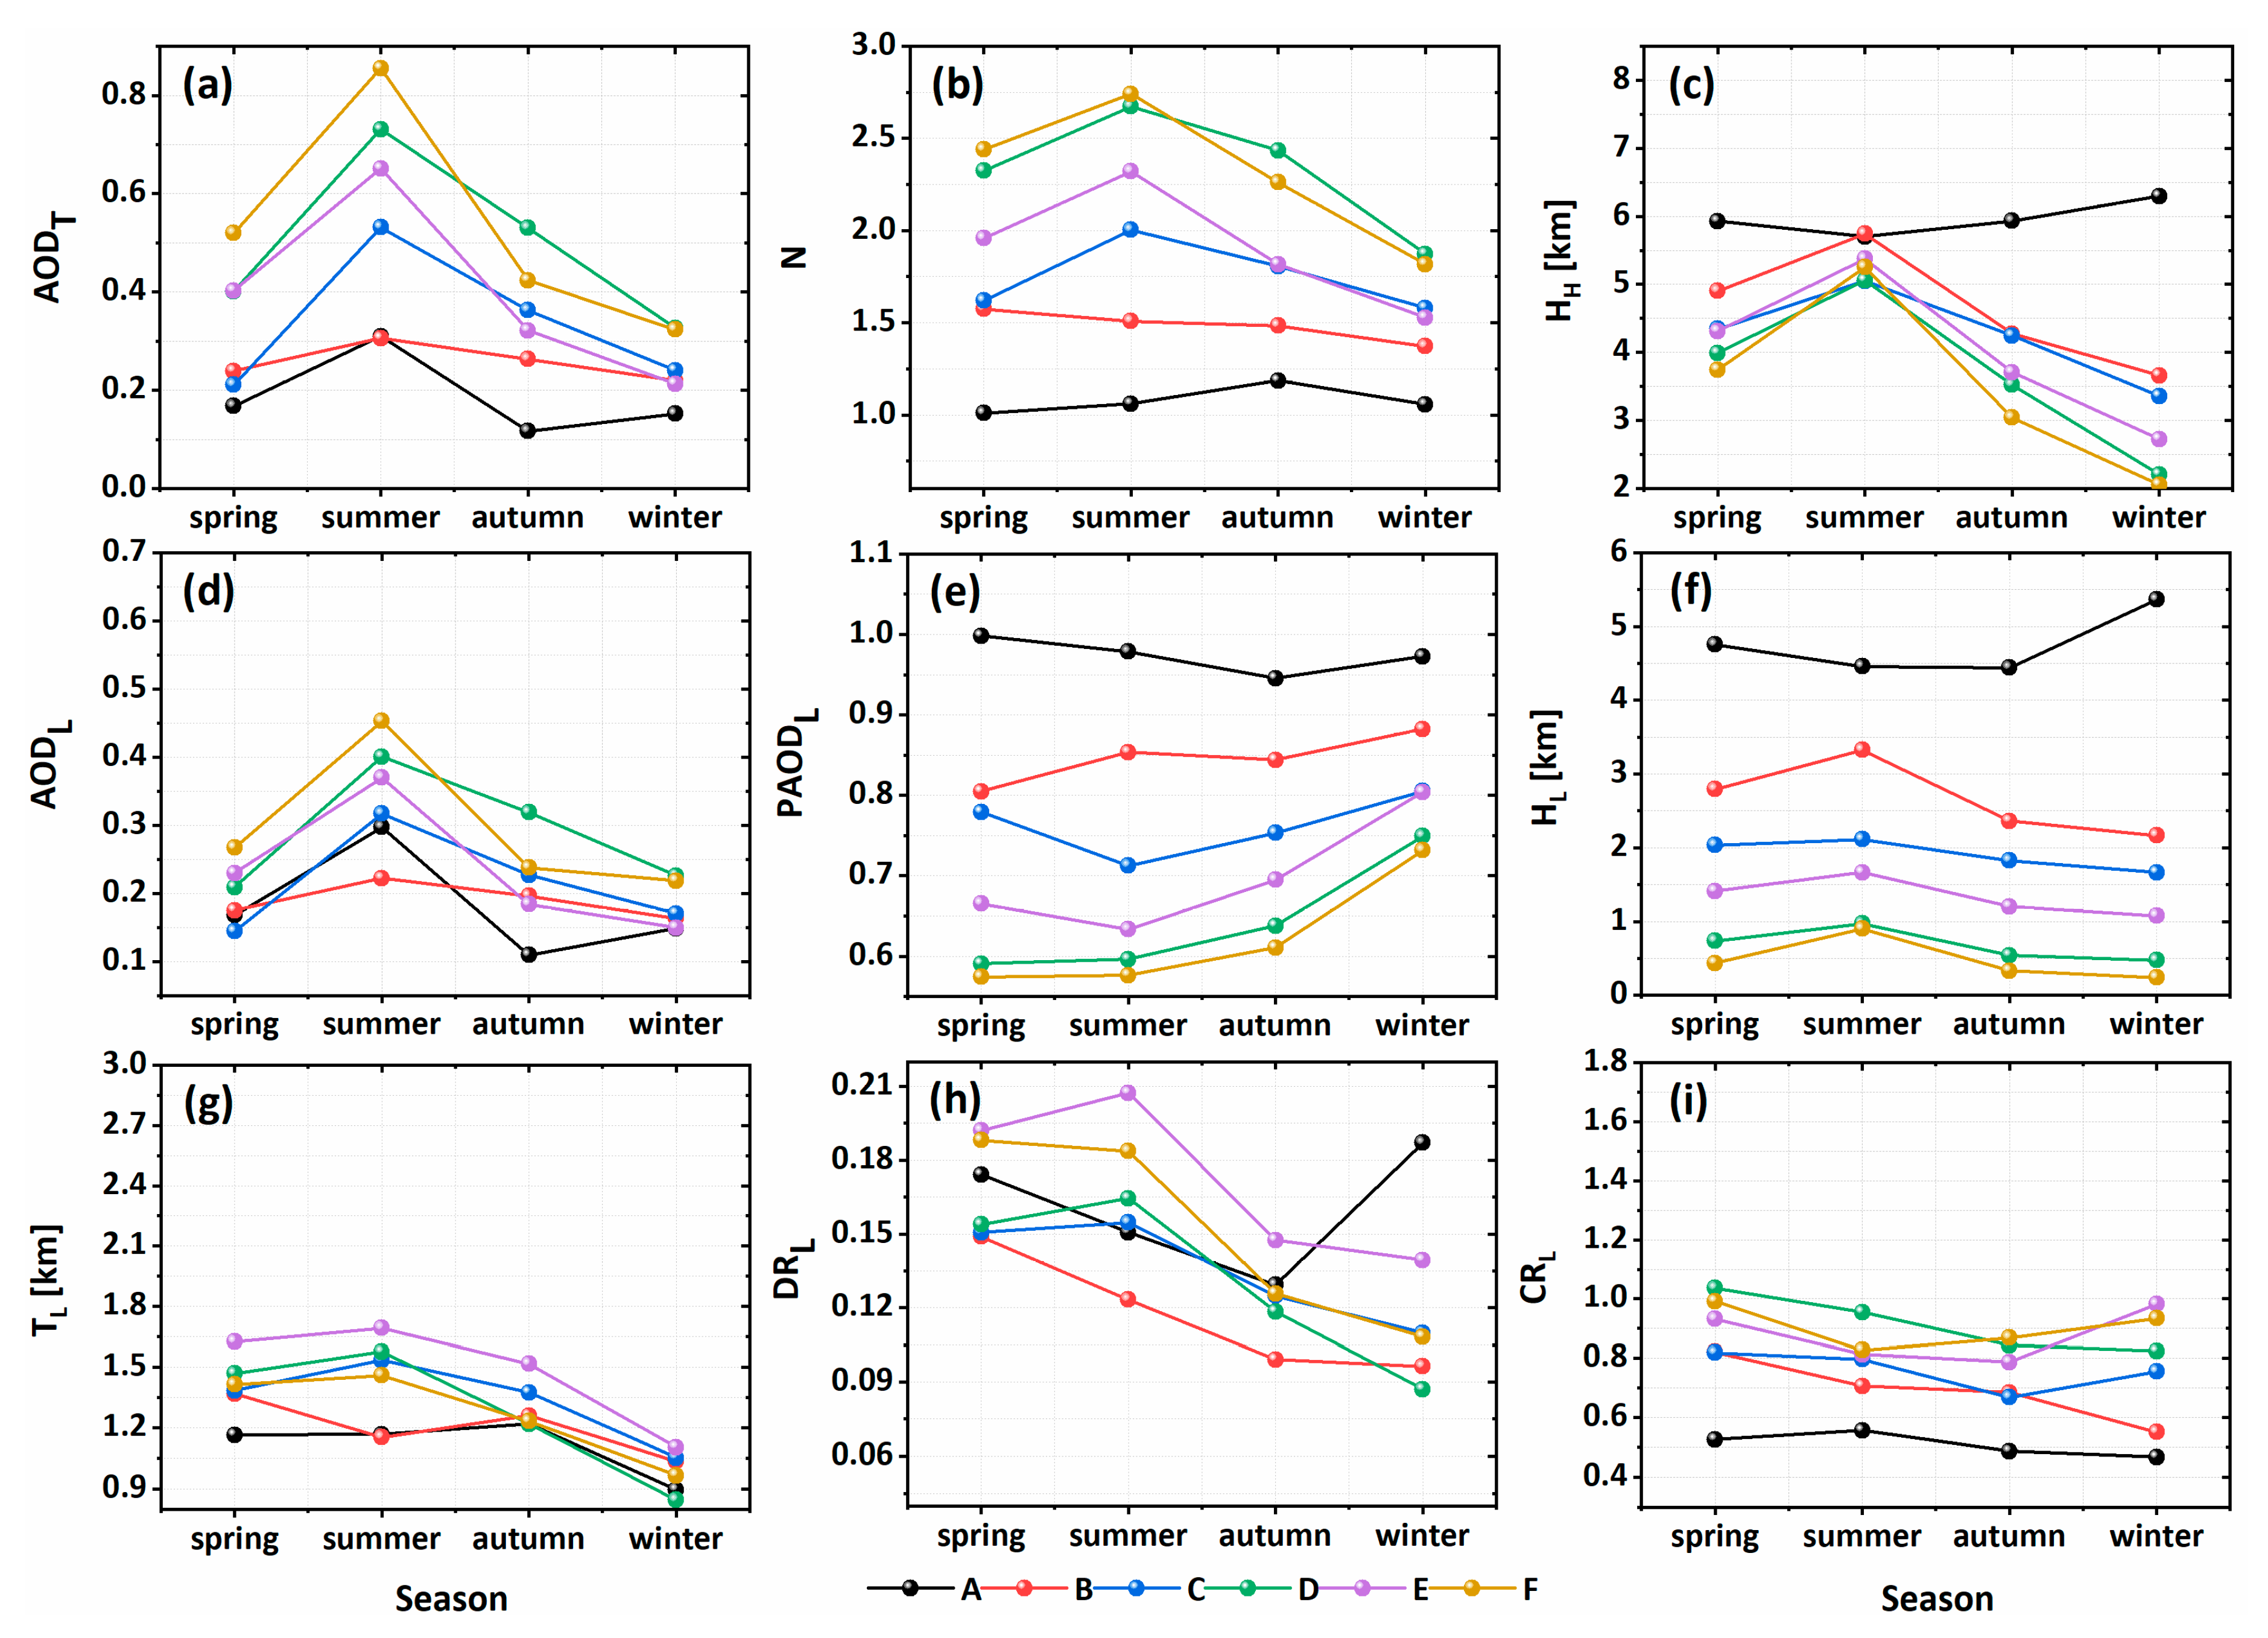
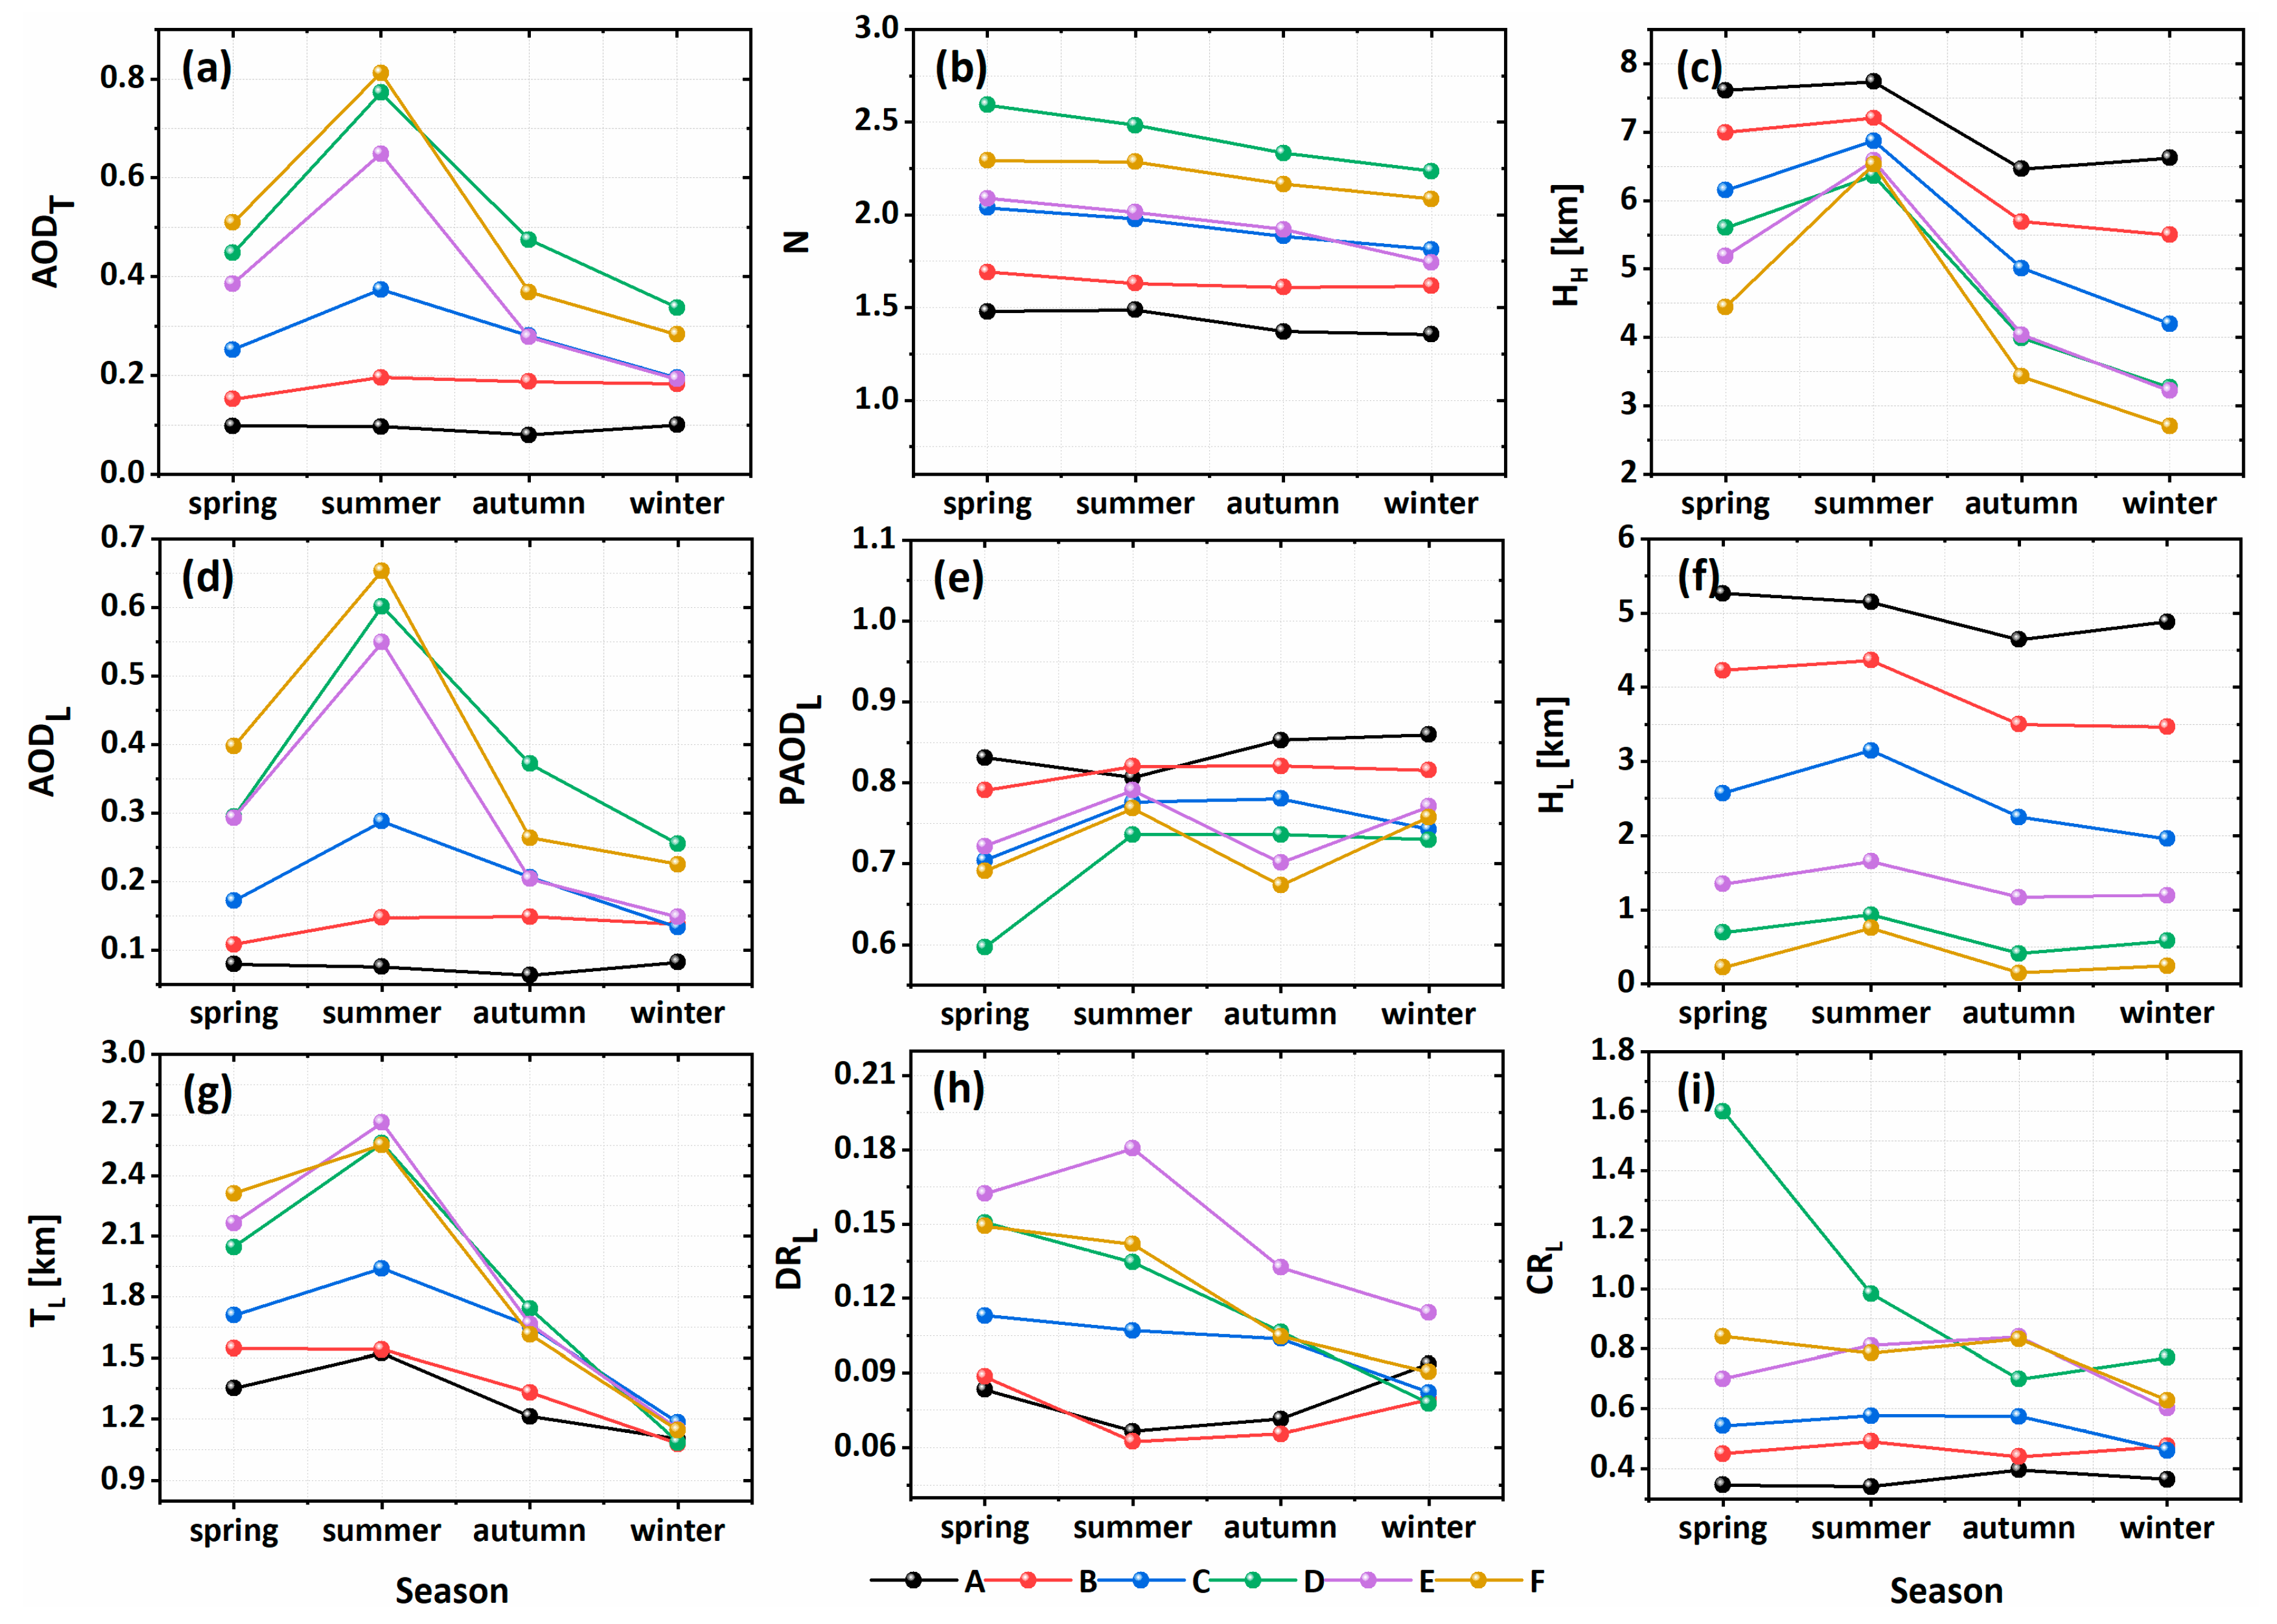
3.2. Seasonal Variation Characteristics of the Aerosol Layers over Pakistan
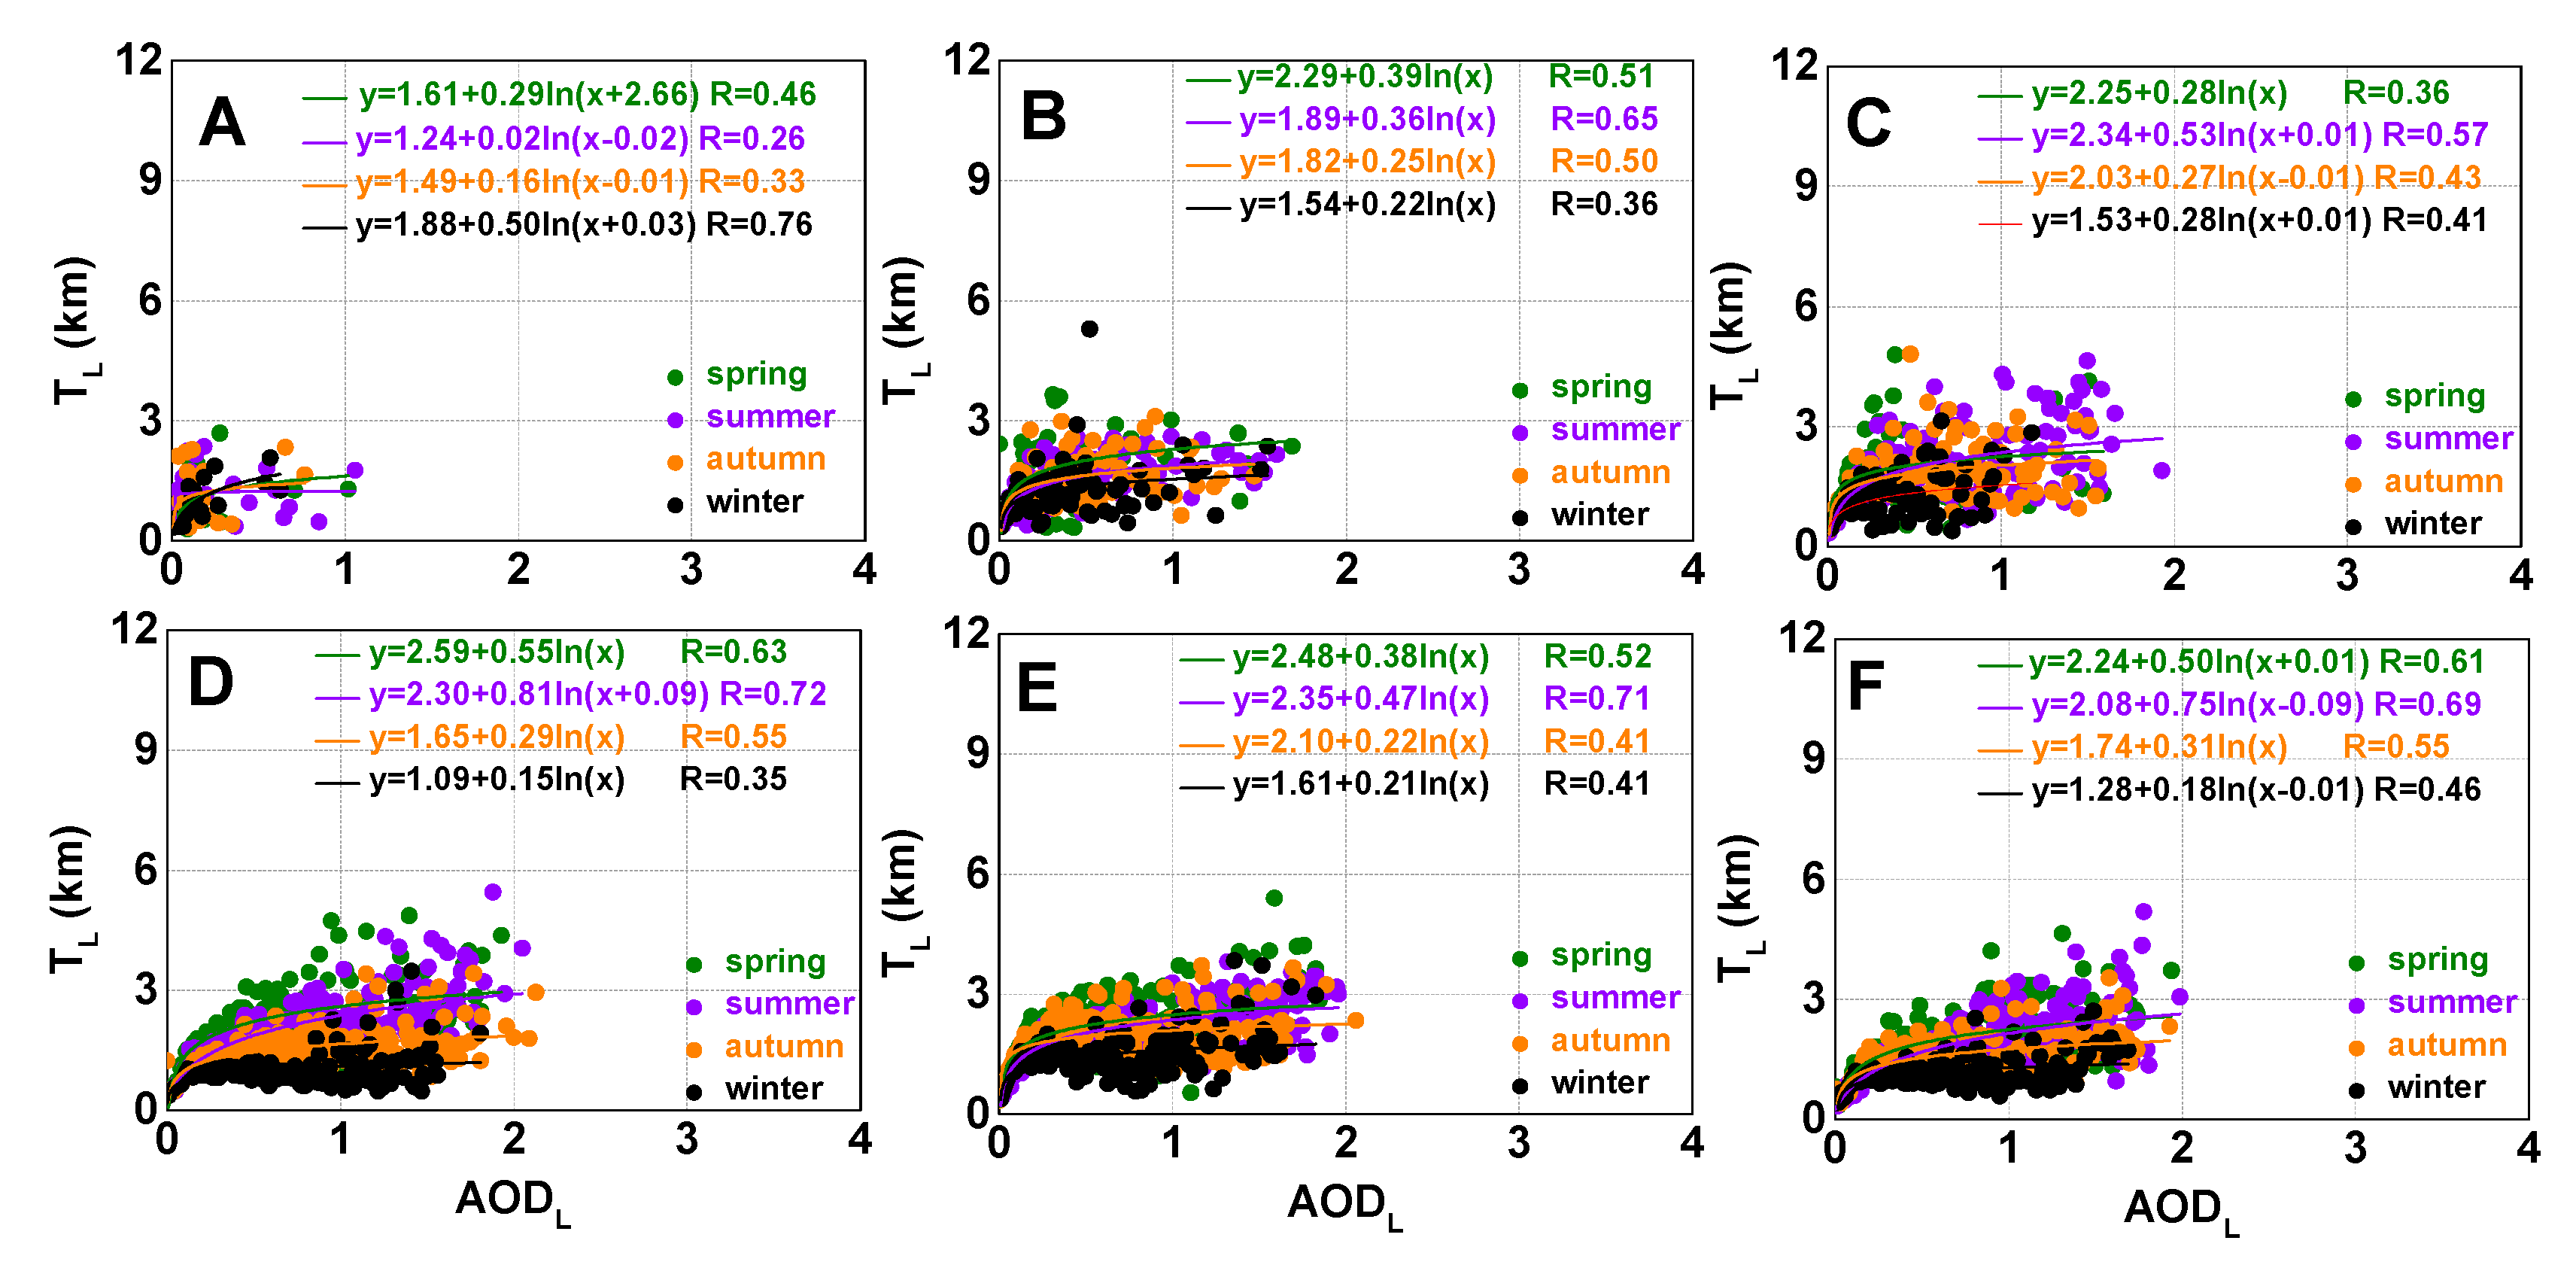
3.3. The Correlation of Aerosol Properties over Pakistan
4. Conclusions
- The annual mean AODT values are slightly higher (~0.1) during the daytime compared to the nighttime. The highest values of AODT were observed during summer and the lowest values were observed during winter which suggested that summer is the most polluted season in Pakistan.
- The higher annual mean values of N were observed over Punjab and Sindh, sequentially succeeded by Balochistan, Khyber-Pakhtunkhwa, Jammu-Kashmir, and Gilgit-Baltistan.
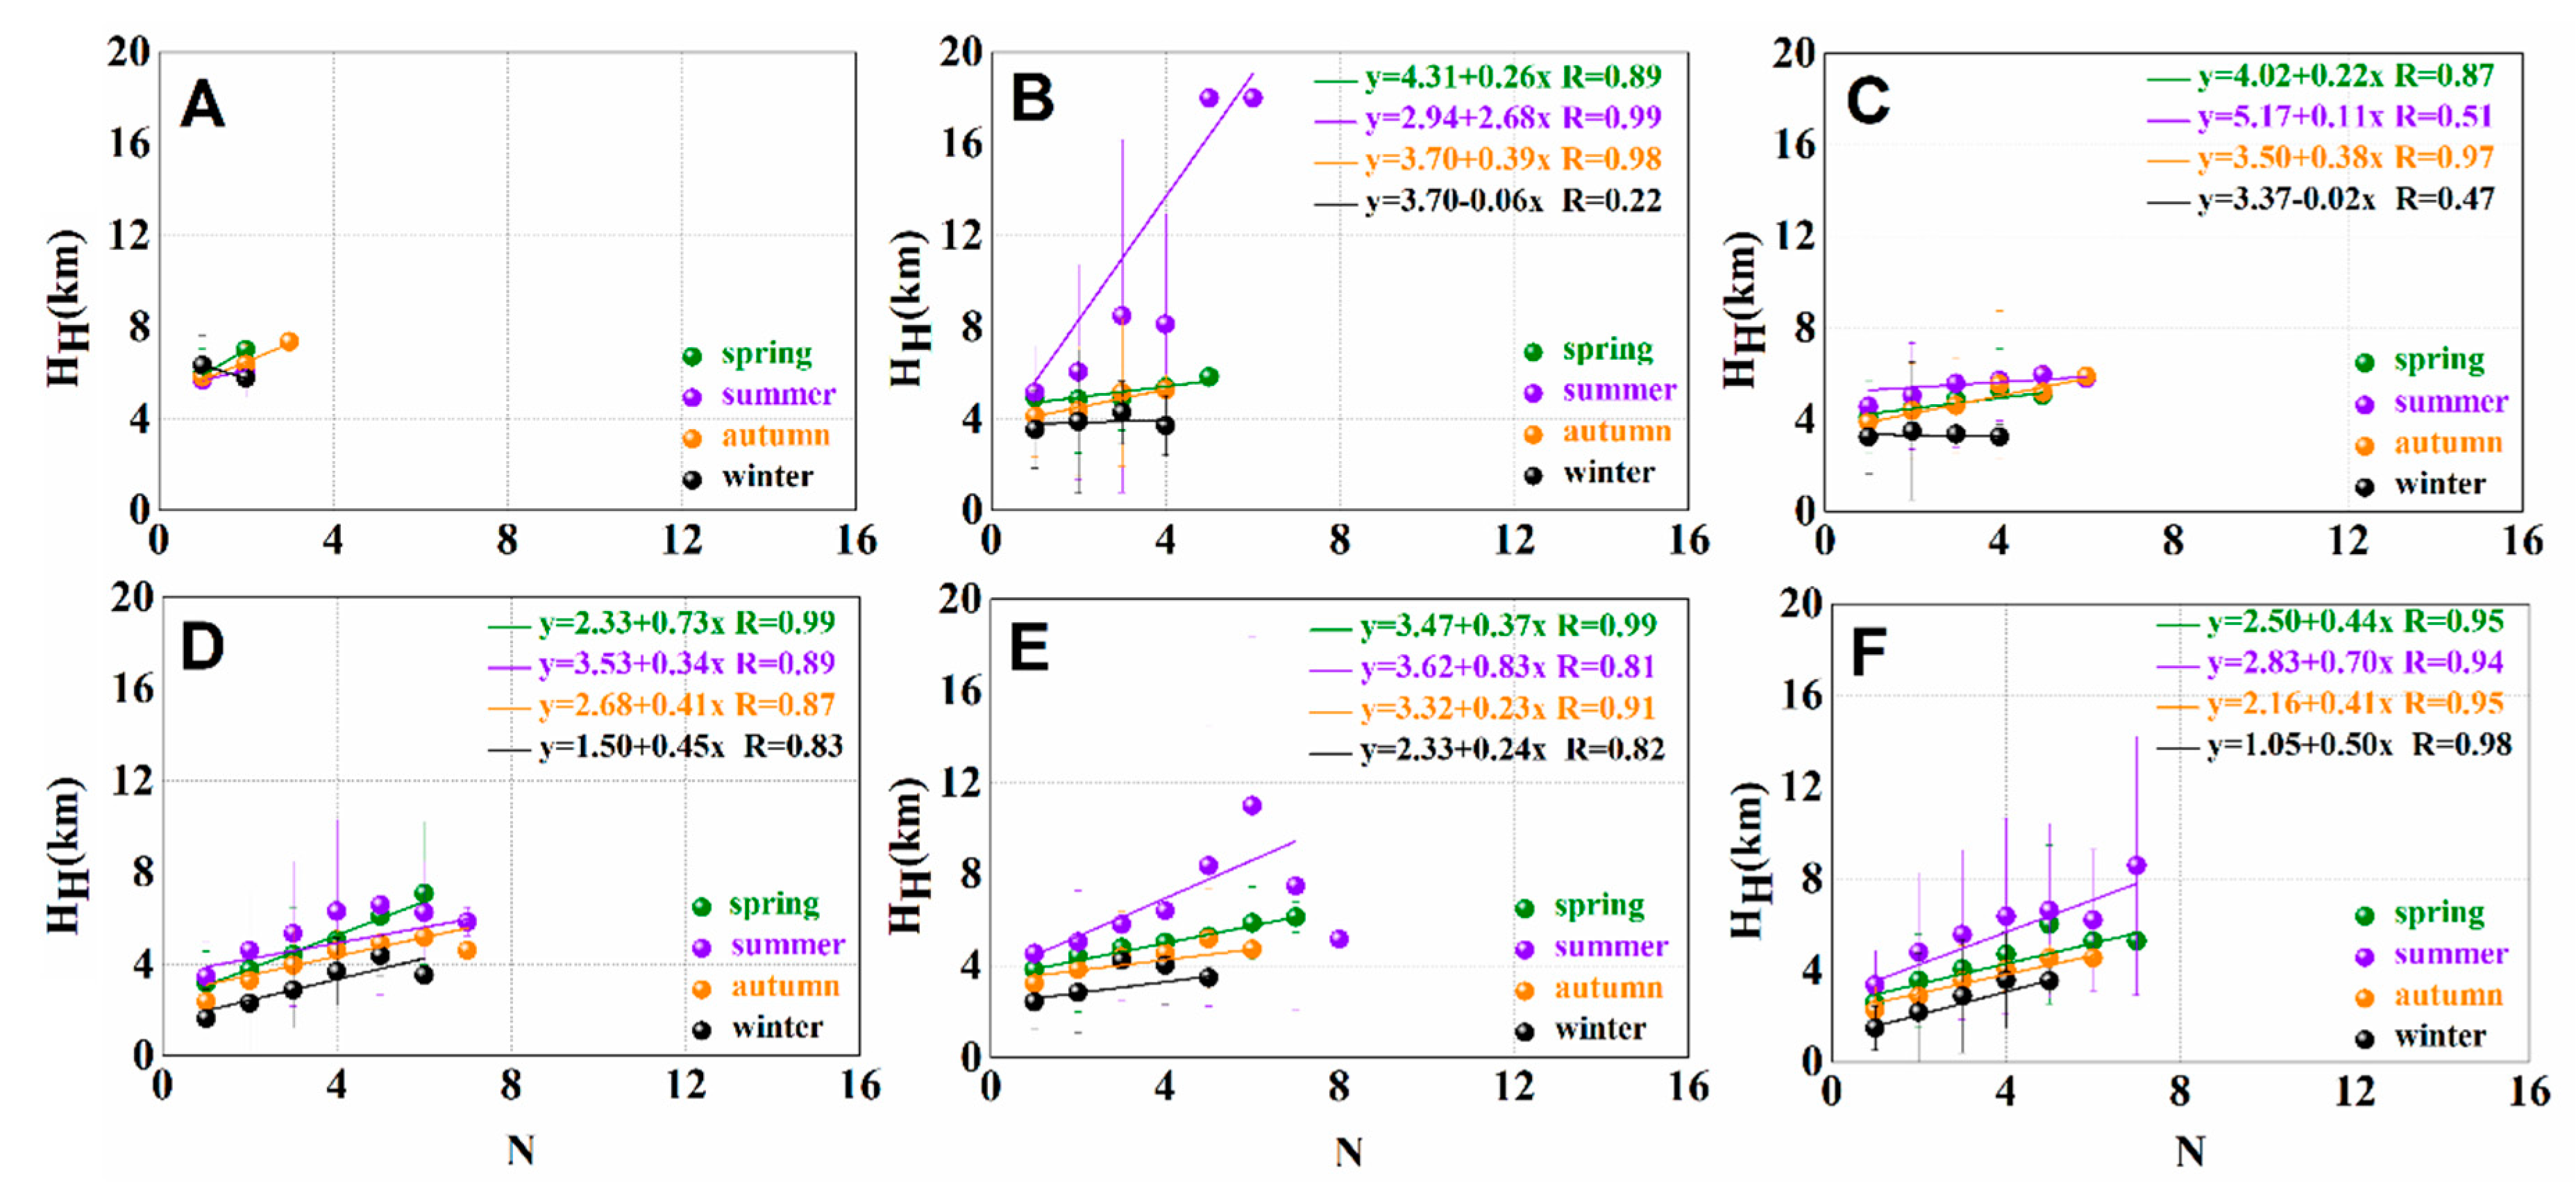
- The HL and HH have shown a positive correlation with the elevation of the geographic location; i.e., higher the elevation, the higher the values of HL and HH, and negative correlation with the aerosol loadings; i.e., higher the values of HL and HH, less amount of aerosols in the atmosphere.
- Aerosol particles exist at lower altitudes over Punjab and Sindh compared to the other regions of Pakistan.
- A large number of aerosol amounts (AODL) is presented in the lowest aerosol layers over Punjab and Sindh compared to the other regions.
- The annual mean values of AODL were observed higher during the nighttime than the daytime.
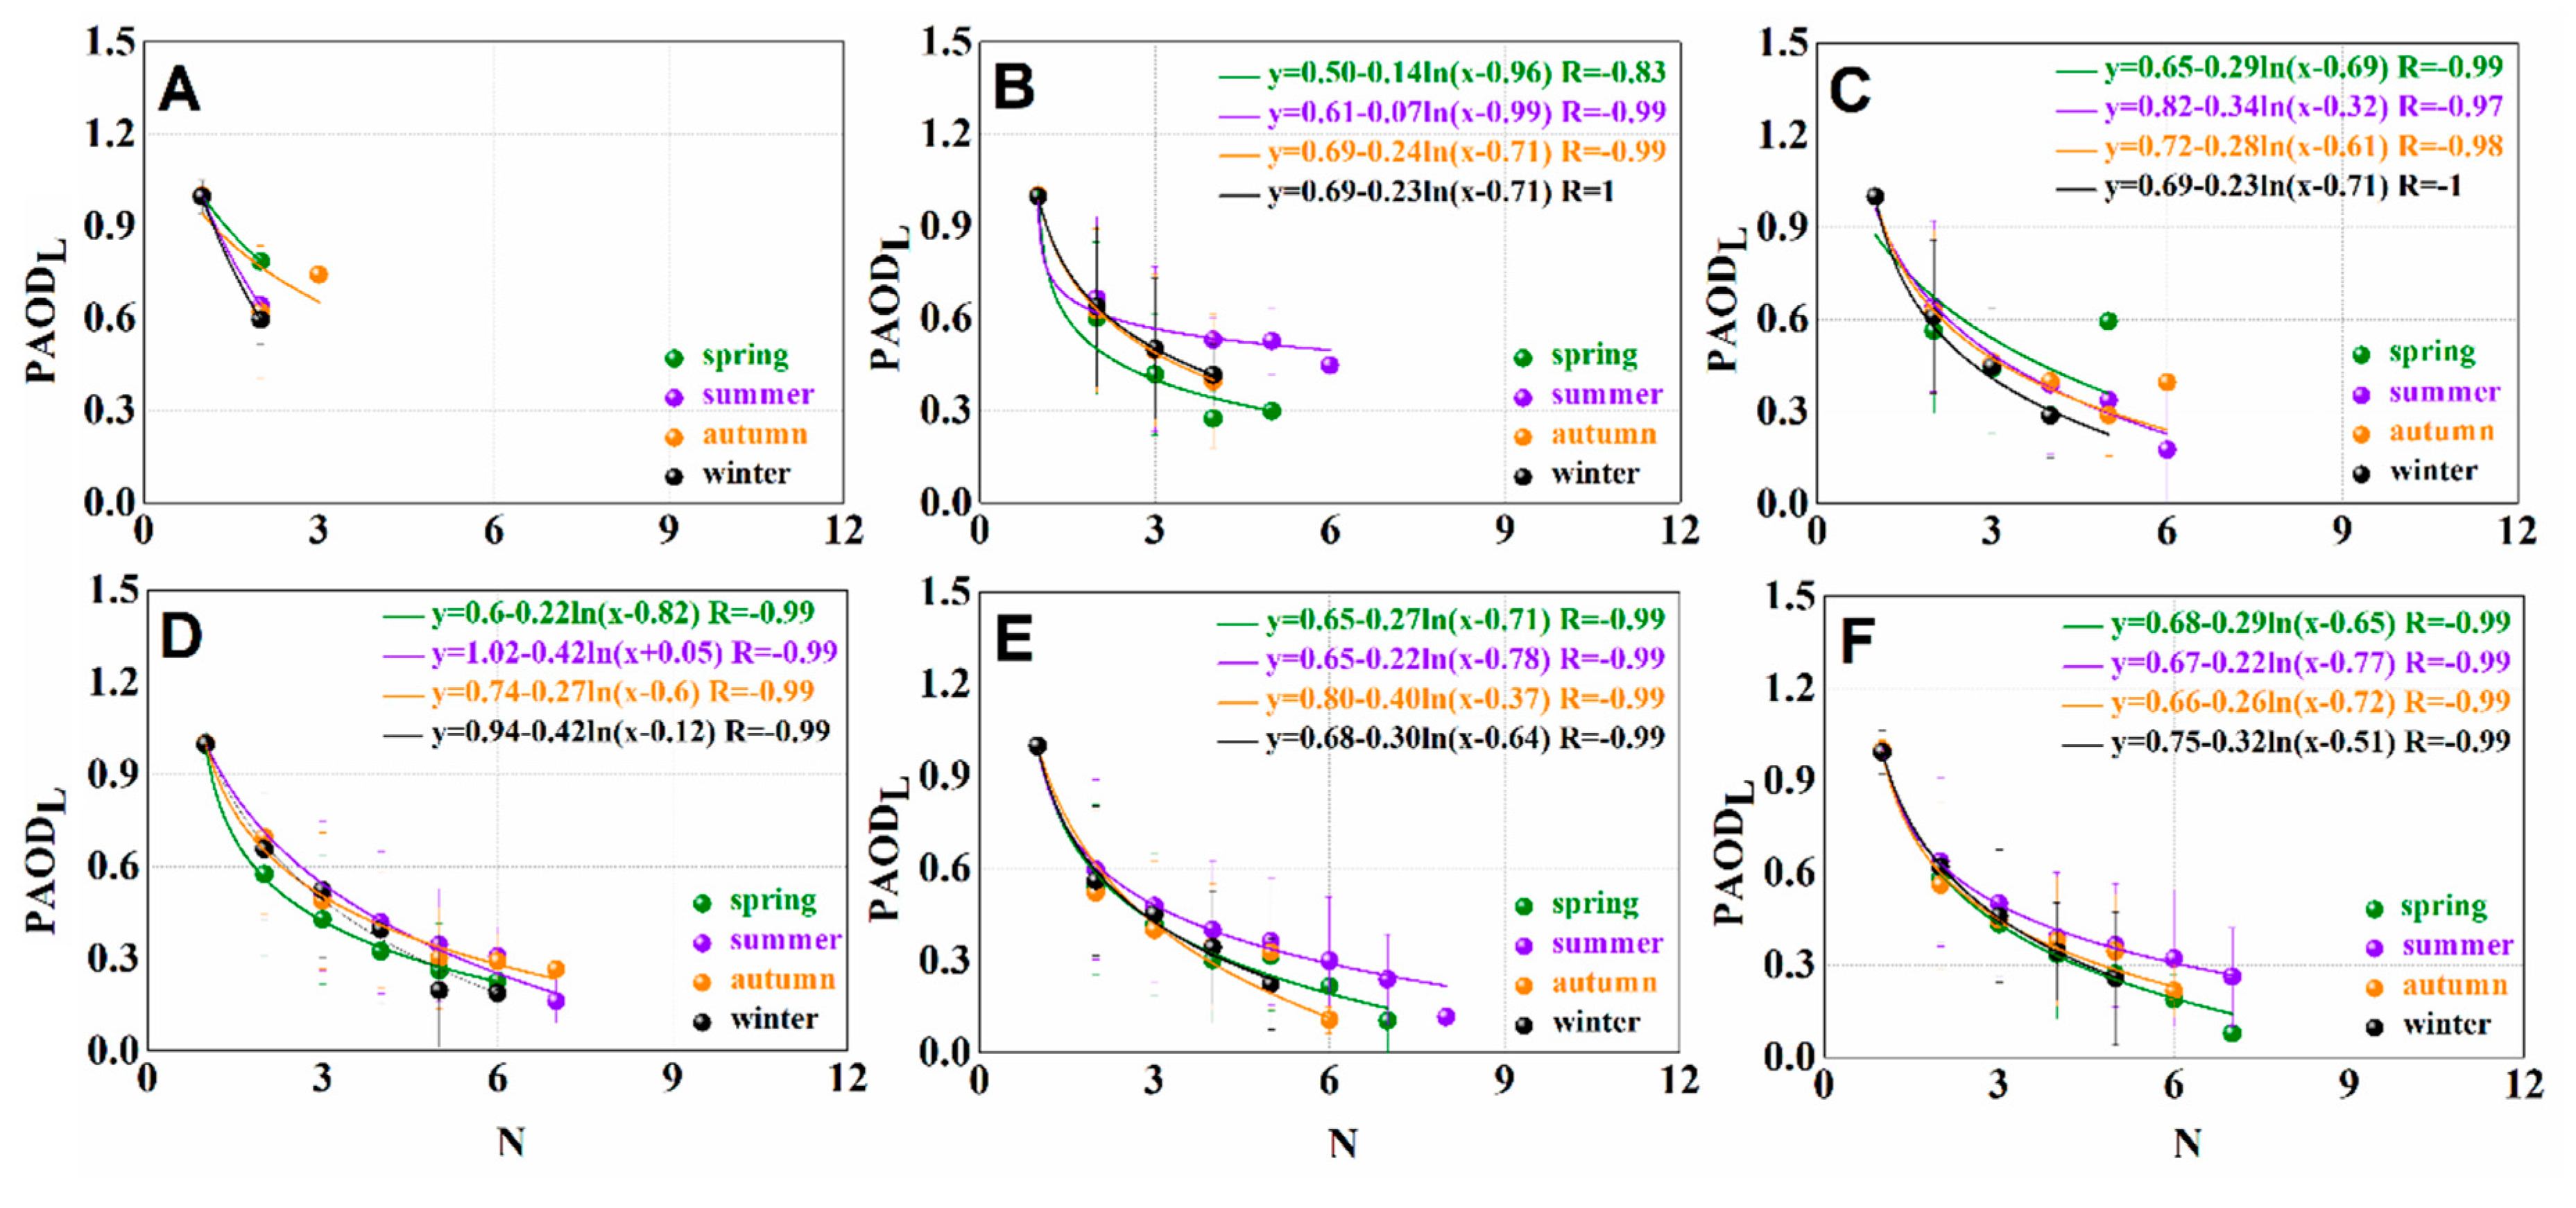
- A large percentage of PAODL was observed over the elevated area compared to the plain areas, however, aerosol particles over the elevated regions are less vulnerable to the public health due to higher values of HL and less aerosol loadings.
- A significant percentage of PAODL during the nighttime compared to the daytime is more vulnerable to the public health in Punjab and Sindh due to a large amount of the aerosols in the lowest aerosol layer (AODL) as well as the lower altitude of the lowest aerosol layer (HL).
- More non-spherical nature of the aerosol particles was observed during the daytime compared to the nighttime in the following order: Balochistan > Gilgit-Baltistan > Sindh > Punjab, and Jammu-Kashmir. A large number of coarse-mode (large size particles) were observed over Punjab > Balochistan > Sindh > Gilgit-Baltistan > Jammu-Kashmir > Khyber-Pakhtunkhwa. Overall, a large number of coarse-mode non-spherical aerosols were presented during spring and summer compared to autumn and winter.
Author Contributions
Funding
Acknowledgments
Conflicts of Interest
References
- Kaufman, Y.J.; Tanré, D.; Boucher, O. A satellite view of aerosols in the climate system. Nature 2002, 419, 215–223. [Google Scholar] [CrossRef] [PubMed]
- Lelieveld, J.; Evans, J.S.; Fnais, M.; Giannadaki, D.; Pozzer, A. The contribution of outdoor air pollution sources to premature mortality on a global scale. Nature 2015, 525, 367–371. [Google Scholar] [CrossRef]
- Pandolfi, M.; Cusack, M.; Alastuey, A.; Querol, X. Variability of aerosol optical properties in the Western Mediterranean Basin. Atmos. Chem. Phys. Discuss. 2011, 11, 8189–8203. [Google Scholar] [CrossRef] [Green Version]
- Che, H.; Zhang, X.-Y.; Xia, X.; Goloub, P.; Holben, B.; Zhao, H.; Wang, Y.; Zhang, X.-C.; Wang, H.; Blarel, L.; et al. Ground-based aerosol climatology of China: Aerosol optical depths from the China Aerosol Remote Sensing Network (CARSNET) 2002–2013. Atmos. Chem. Phys. Discuss. 2015, 15, 7619–7652. [Google Scholar] [CrossRef] [Green Version]
- Ramanathan, V.; Terborgh, J.; Lopez, L.; Núñez, P.; Rao, M.; Shahabuddin, G.; Orihuela, G.; Riveros, M.; Ascanio, R.; Adler, G.H.; et al. Aerosols, Climate, and the Hydrological Cycle. Science 2001, 294, 2119–2124. [Google Scholar] [CrossRef] [Green Version]
- Menon, S.; Hansen, J.; Nazarenko, L.; Luo, Y. Climate Effects of Black Carbon Aerosols in China and India. Science 2002, 297, 2250–2253. [Google Scholar] [CrossRef] [Green Version]
- Edenhofer, O.; Seyboth, K. Intergovernmental Panel on Climate Change (IPCC). Encycl. Energy Nat. Resour. Environ. Econ. 2013, 48–56. [Google Scholar] [CrossRef]
- Pandolfi, M.; Ripoll, A.; Querol, X.; Alastuey, A. Climatology of aerosol optical properties and black carbon mass absorption cross section at a remote high-altitude site in the western Mediterranean Basin. Atmos. Chem. Phys. Discuss. 2014, 14, 6443–6460. [Google Scholar] [CrossRef] [Green Version]
- Bergin, M.; Cass, G.R.; Xu, J.; Fang, C.; Zeng, L.M.; Yu, T.; Salmon, L.G.; Kiang, C.S.; Tang, X.Y.; Zhang, Y.H.; et al. Aerosol radiative, physical, and chemical properties in Beijing during June 1999. J. Geophys. Res. Space Phys. 2001, 106, 17969–17980. [Google Scholar] [CrossRef] [Green Version]
- Che, H.; Zhang, X.; Chen, H.; Damiri, B.; Goloub, P.; Li, Z.; Zhang, X.; Wei, Y.; Zhou, H.; Dong, F.; et al. Instrument calibration and aerosol optical depth validation of the China Aerosol Remote Sensing Network. J. Geophys. Res. Space Phys. 2009, 114, 03206. [Google Scholar] [CrossRef]
- Dubovik, O.; Smirnov, A.; Holben, B.N.; King, M.D.; Kaufman, Y.J.; Eck, T.F.; Slutsker, I. Accuracy assessments of aerosol optical properties retrieved from Aerosol Robotic Network (AERONET) Sun and sky radiance measurements. J. Geophys. Res. Space Phys. 2000, 105, 9791–9806. [Google Scholar] [CrossRef] [Green Version]
- Eck, T.F.; Holben, B.N.; Reid, J.S.; Dubovik, O.; Smirnov, A.; O’Neill, N.T.; Slutsker, I.; Kinne, S. Wavelength dependence of the optical depth of biomass burning, urban, and desert dust aerosols. J. Geophys. Res. Atmos. 1999, 104, 31333–31349. [Google Scholar] [CrossRef]
- Zhang, M.; Liu, J.; Bilal, M.; Zhang, C.; Nazeer, M.; Atique, L.; Han, G.; Gong, W. Aerosol Optical Properties and Contribution to Differentiate Haze and Haze-Free Weather in Wuhan City. Atmosphere 2020, 11, 322. [Google Scholar] [CrossRef] [Green Version]
- Zhang, M.; Ma, Y.; Gong, W.; Zhu, Z. Aerosol Optical Properties of a Haze Episode in Wuhan Based on Ground-Based and Satellite Observations. Atmosphere 2014, 5, 699–719. [Google Scholar] [CrossRef] [Green Version]
- Che, H.; Xia, X.; Zhu, J.; Li, Z.; Dubovik, O.; Holben, B.; Goloub, P.; Chen, H.; Estelles, V.; Cuevas, E.; et al. Column aerosol optical properties and aerosol radiative forcing during a serious haze-fog month over North China Plain in 2013 based on ground-based sunphotometer measurements. Atmos. Chem. Phys. Discuss. 2014, 14, 2125–2138. [Google Scholar] [CrossRef] [Green Version]
- Bilal, M.; Nichol, J.E.; Spak, S. A New Approach for Estimation of Fine Particulate Concentrations Using Satellite Aerosol Optical Depth and Binning of Meteorological Variables. Aerosol Air Qual. Res. 2017, 17, 356–367. [Google Scholar] [CrossRef] [Green Version]
- Bilal, M.; Nichol, J.E.; Chan, P.W. Validation and accuracy assessment of a Simplified Aerosol Retrieval Algorithm (SARA) over Beijing under low and high aerosol loadings and dust storms. Remote. Sens. Environ. 2014, 153, 50–60. [Google Scholar] [CrossRef]
- Magistrale, V. Health Aspects of Air Pollution; Springer Science and Business Media LLC.: Berlin/Heidelberg, Germany, 1992; pp. 25–31. [Google Scholar]
- Kaiser, J. EPIDEMIOLOGY: How Dirty Air Hurts the Heart. Science 2005, 307, 1858b–1859b. [Google Scholar] [CrossRef]
- Tie, X.; Wu, D.; Brasseur, G. Lung cancer mortality and exposure to atmospheric aerosol particles inguangzhou, china. Atmos. Environ. 2009, 43, 2375–2377. [Google Scholar] [CrossRef]
- Smirnov, A.; Holben, B.N.; Eck, T.F.; Slutsker, I.; Chatenet, B.; Pinker, R.T. Diurnal variability of aerosol optical depth observed at AERONET (Aerosol Robotic Network) sites. Geophys. Res. Lett. 2002, 29, 30–31. [Google Scholar] [CrossRef]
- Omar, A.H.; Won, J.; Winker, D.; Yoon, S.; Dubovik, O.; McCormick, M.P. Development of global aerosol models using cluster analysis of Aerosol Robotic Network (AERONET) measurements. J. Geophys. Res. Space Phys. 2005, 110, 10–14. [Google Scholar] [CrossRef]
- Bilal, M.; Nichol, J.; Nazeer, M. Validation of Aqua-MODIS C051 and C006 Operational Aerosol Products Using AERONET Measurements Over Pakistan. IEEE J. Sel. Top. Appl. Earth Obs. Remote. Sens. 2015, 9, 2074–2080. [Google Scholar] [CrossRef]
- Bilal, M.; Nazeer, M.; Nichol, J.E.; Qiu, Z.; Wang, L.; Bleiweiss, M.P.; Shen, X.; Campbell, J.; Lolli, S. Evaluation of Terra-MODIS C6 and C6.1 Aerosol Products against Beijing, XiangHe, and Xinglong AERONET Sites in China during 2004–2014. Remote. Sens. 2019, 11, 486. [Google Scholar] [CrossRef] [Green Version]
- Kleidman, R.G.; O’Neill, N.T.; Remer, L.A.; Kaufman, Y.J.; Eck, T.F.; Tanré, D.; Dubovik, O.; Holben, B.N. Comparison of Moderate Resolution Imaging Spectroradiometer (MODIS) and Aerosol Robotic Network (AERONET) remote-sensing retrievals of aerosol fine mode fraction over ocean. J. Geophys. Res. Space Phys. 2005, 110. [Google Scholar] [CrossRef]
- Mishchenko, M.I.; Geogdzhayev, I.V.; Liu, L.; Ogren, J.; A Lacis, A.; Rossow, W.B.; Hovenier, J.W.; Volten, H.; Muñoz, O. Aerosol retrievals from AVHRR radiances: Effects of particle nonsphericity and absorption and an updated long-term global climatology of aerosol properties. J. Quant. Spectrosc. Radiat. Transf. 2003, 79, 953–972. [Google Scholar] [CrossRef]
- Kosmopoulos, P.; Kaskaoutis, D.; Nastos, P.T.; Kambezidis, H. Seasonal variation of columnar aerosol optical properties over Athens, Greece, based on MODIS data. Remote. Sens. Environ. 2008, 112, 2354–2366. [Google Scholar] [CrossRef]
- Chu, D.A.; Kaufman, Y.J.; Ichoku, C.; Remer, L.A.; Tanré, D.; Holben, B.N. Validation of modis aerosol optical depth retrieval over land. Geophys. Res. Lett. 2002, 29, 8007. [Google Scholar] [CrossRef] [Green Version]
- Remer, L.A.; Kaufman, Y.J.; Ichoku, C.; Mattoo, S.; Chu, D.A.; Holben, B.; Dubovik, O.; Martins, J.V.; Li, R.; Tanré, D.; et al. Validation of MODIS aerosol retrieval over ocean. Geophys. Res. Lett. 2002, 29, MOD3-1–MOD3-4. [Google Scholar] [CrossRef] [Green Version]
- Qiu, R.; Han, G.; Ma, X.; Xu, H.; Shi, T.; Zhang, M. A Comparison of OCO-2 SIF, MODIS GPP, and GOSIF Data from Gross Primary Production (GPP) Estimation and Seasonal Cycles in North America. Remote Sens. 2020, 12, 258. [Google Scholar] [CrossRef] [Green Version]
- Zhang, M.; Liu, J.; Li, W.; Bilal, M.; Zhao, F.; Zhang, C.; Yuan, B.; Khedher, K.M. Evaluation of the Aqua-MODIS C6 and C6.1 Aerosol Optical Depth Products in the Yellow River Basin, China. Atmosphere 2019, 10, 426. [Google Scholar] [CrossRef] [Green Version]
- Jethva, H.; Torres, O.; Ahn, C. Global assessment of OMI aerosol single-scattering albedo using ground-based AERONET inversion. J. Geophys. Res. Atmos. 2014, 119, 9020–9040. [Google Scholar] [CrossRef]
- Zhang, M.; Wang, L.; Gong, W.; Ma, Y.; Liu, B. Aerosol Optical Properties and Direct Radiative Effects over Central China. Remote Sens. 2017, 9, 997. [Google Scholar] [CrossRef] [Green Version]
- Winker, D.M.; Pelon, J. In The calipso mission, Geoscience and Remote Sensing Symposium. In Proceedings of the IEEE International, Toulouse, France, 21–25 July 2003. [Google Scholar]
- Winker, D.; Vaughan, M.A.; Omar, A.; Hu, Y.; Powell, K.A.; Liu, Z.; Hunt, W.H.; Young, S. Overview of the CALIPSO Mission and CALIOP Data Processing Algorithms. J. Atmos. Ocean. Technol. 2009, 26, 2310–2323. [Google Scholar] [CrossRef]
- Winker, D.M.; Pelon, J.R.; McCormick, M.P. The calipso mission: Spaceborne lidar for observation of aerosols and clouds. Bull. Am. Meteorol. Soc. 2010, 91, 1211–1229. [Google Scholar] [CrossRef]
- Winker, D.; Hunt, W.H.; McGill, M.J. Initial performance assessment of CALIOP. Geophys. Res. Lett. 2007, 34, 228–262. [Google Scholar] [CrossRef] [Green Version]
- Winker, D.; Tackett, J.L.; Getzewich, B.J.; Liu, Z.; Vaughan, M.A.; Rogers, R.R. The global 3-D distribution of tropospheric aerosols as characterized by CALIOP. Atmos. Chem. Phys. Discuss. 2013, 13, 3345–3361. [Google Scholar] [CrossRef] [Green Version]
- Nichol, J.E.; Bilal, M. Validation of MODIS 3 km Resolution Aerosol Optical Depth Retrievals Over Asia. Remote Sens. 2016, 8, 328. [Google Scholar] [CrossRef] [Green Version]
- Haq, Z.U.; Tariq, S.; Ali, M.; Mahmood, K.; Batool, S.A.; Rana, A.D. A study of tropospheric NO 2 variability over Pakistan using OMI data. Atmos. Pollut. Res. 2014, 5, 709–720. [Google Scholar] [CrossRef] [Green Version]
- Ali, G.; Bao, Y.; Ullah, W.; Ullah, S.; Guan, Q.; Liu, X.; Li, L.; Lei, Y.; Li, G.; Ma, J. Spatiotemporal Trends of Aerosols over Urban Regions in Pakistan and Their Possible Links to Meteorological Parameters. Atmosphere 2020, 11, 306. [Google Scholar] [CrossRef] [Green Version]
- Tariq, S.; Ali, M. Spatio–temporal distribution of absorbing aerosols over Pakistan retrieved from OMI onboard Aura satellite. Atmos. Pollut. Res. 2015, 6, 254–266. [Google Scholar] [CrossRef] [Green Version]
- Shahid, M.Z.; Liao, H.; Li, J.; Shahid, I.; Lodhi, A.; Mansha, M. Seasonal Variations of Aerosols in Pakistan: Contributions of Domestic Anthropogenic Emissions and Transboundary Transport. Aerosol Air Qual. Res. 2015, 15, 1580–1600. [Google Scholar] [CrossRef] [Green Version]
- Alam, K.; Iqbal, M.J.; Blaschke, T.; Qureshi, S.; Khan, G. Monitoring spatio-temporal variations in aerosols and aerosol–cloud interactions over Pakistan using MODIS data. Adv. Space Res. 2010, 46, 1162–1176. [Google Scholar] [CrossRef]
- Zhang, M.; Liu, J.; Bilal, M.; Zhang, C.; Zhao, F.; Xie, X.; Khedher, K.M. Optical and Physical Characteristics of the Lowest Aerosol Layers over the Yellow River Basin. Atmosphere 2019, 10, 638. [Google Scholar] [CrossRef] [Green Version]
- Begum, B.A.; Biswas, S.K.; Pandit, G.G.; Saradhi, I.V.; Waheed, S.; Siddique, N.; Seneviratne, M.S.; Cohen, D.; Markwitz, A.; Hopke, P.K. Long–range transport of soil dust and smoke pollution in the South Asian region. Atmos. Pollut. Res. 2011, 2, 151–157. [Google Scholar] [CrossRef] [Green Version]
- Alam, K.; Qureshi, S.; Blaschke, T. Monitoring spatio-temporal aerosol patterns over Pakistan based on MODIS, TOMS and MISR satellite data and a HYSPLIT model. Atmos. Environ. 2011, 45, 4641–4651. [Google Scholar] [CrossRef]
- Milroy, C.; Martucci, G.; Lolli, S.; Loaec, S.; Sauvage, L.; Xueref-Rémy, I.; Lavrič, J.V.; Ciais, P.; Feist, D.G.; Biavati, G.; et al. An Assessment of Pseudo-Operational Ground-Based Light Detection and Ranging Sensors to Determine the Boundary-Layer Structure in the Coastal Atmosphere. Adv. Meteorol. 2012, 2012, 1–18. [Google Scholar] [CrossRef] [Green Version]
- Bilal, M.; Nichol, J.E.; Bleiweiss, M.P.; Dubois, D. A Simplified high resolution MODIS Aerosol Retrieval Algorithm (SARA) for use over mixed surfaces. Remote. Sens. Environ. 2013, 136, 135–145. [Google Scholar] [CrossRef]
- Stull, R.B. An Introduction to Boundary Layer Meteorology; Springer: Berlin/Heidelberg, Germany, 1988. [Google Scholar]
- Ranjan, R.R.; Ganguly, N.D.; Joshi, H.P.; Iyer, K.N. Study of aerosol optical depth and precipitable water vapour content at rajkot, a tropical semi-arid station. Indian J. Radio Space Phys. 2007, 36, 27–32. [Google Scholar]
- Sarkar, S.; Chokngamwong, R.; Cervone, G.; Singh, R.; Kafatos, M. Variability of aerosol optical depth and aerosol forcing over India. Adv. Space Res. 2006, 37, 2153–2159. [Google Scholar] [CrossRef]
- Alam, K.; Blaschke, T.; Madl, P.; Mukhtar, A.; Hussain, M.; Trautmann, T.; Rahman, S. Aerosol size distribution and mass concentration measurements in various cities of Pakistan. J. Environ. Monit. 2011, 13, 1944. [Google Scholar] [CrossRef] [PubMed]
- Eck, T.F.; Holben, B.N.; Ward, D.E.; Dubovik, O.; Reid, J.S.; Smirnov, A.; Mukelabai, M.M.; Hsu, N.C.; O’Neill, N.T.; Slutsker, I. Characterization of the optical properties of biomass burning aerosols in Zambia during the 1997 ZIBBEE field campaign. J. Geophys. Res. Space Phys. 2001, 106, 3425–3448. [Google Scholar] [CrossRef]
- Reid, J.S.; Eck, T.F.; Christopher, S.; Hobbs, P.V.; Holben, B. Use of the Ångstrom exponent to estimate the variability of optical and physical properties of aging smoke particles in Brazil. J. Geophys. Res. Space Phys. 1999, 104, 27473–27489. [Google Scholar] [CrossRef]
- Reid, J.S.; Lagrosas, N.D.; Jonsson, H.H.; Reid, E.A.; Atwood, S.A.; Boyd, T.J.; Ghate, V.P.; Xian, P.; Posselt, D.J.; Simpas, J.B. Aerosol meteorology of maritime continent for the 2012 7seas southwest monsoon intensive study—Part 2: Philippine receptor observations of fine-scale aerosol behavior. Atmos. Chem. Phys. 2016, 16, 14057–14078. [Google Scholar] [CrossRef] [Green Version]
- Ali, M.; Tariq, S.; Mahmood, K.; Daud, A.; Batool, A.; Haq, Z.U. A study of aerosol properties over Lahore (Pakistan) by using AERONET data. Asia Pac. J. Atmos. Sci. 2013, 50, 153–162. [Google Scholar] [CrossRef]
- Zhang, M.; Wang, L.; Bilal, M.; Gong, W.; Zhang, Z.; Guo, G. The Characteristics of the Aerosol Optical Depth within the Lowest Aerosol Layer over the Tibetan Plateau from 2007 to 2014. Remote Sens. 2018, 10, 696. [Google Scholar] [CrossRef] [Green Version]


© 2020 by the authors. Licensee MDPI, Basel, Switzerland. This article is an open access article distributed under the terms and conditions of the Creative Commons Attribution (CC BY) license (http://creativecommons.org/licenses/by/4.0/).
Share and Cite
Zhang, M.; Su, B.; Bilal, M.; Atique, L.; Usman, M.; Qiu, Z.; Ali, M.A.; Han, G. An Investigation of Vertically Distributed Aerosol Optical Properties over Pakistan Using CALIPSO Satellite Data. Remote Sens. 2020, 12, 2183. https://doi.org/10.3390/rs12142183
Zhang M, Su B, Bilal M, Atique L, Usman M, Qiu Z, Ali MA, Han G. An Investigation of Vertically Distributed Aerosol Optical Properties over Pakistan Using CALIPSO Satellite Data. Remote Sensing. 2020; 12(14):2183. https://doi.org/10.3390/rs12142183
Chicago/Turabian StyleZhang, Miao, Bo Su, Muhammad Bilal, Luqman Atique, Muhammad Usman, Zhongfeng Qiu, Md. Arfan Ali, and Ge Han. 2020. "An Investigation of Vertically Distributed Aerosol Optical Properties over Pakistan Using CALIPSO Satellite Data" Remote Sensing 12, no. 14: 2183. https://doi.org/10.3390/rs12142183