MODIS-Satellite-Based Analysis of Long-Term Temporal-Spatial Dynamics and Drivers of Algal Blooms in a Plateau Lake Dianchi, China

Abstract
:
1. Introduction
2. Data and Methods
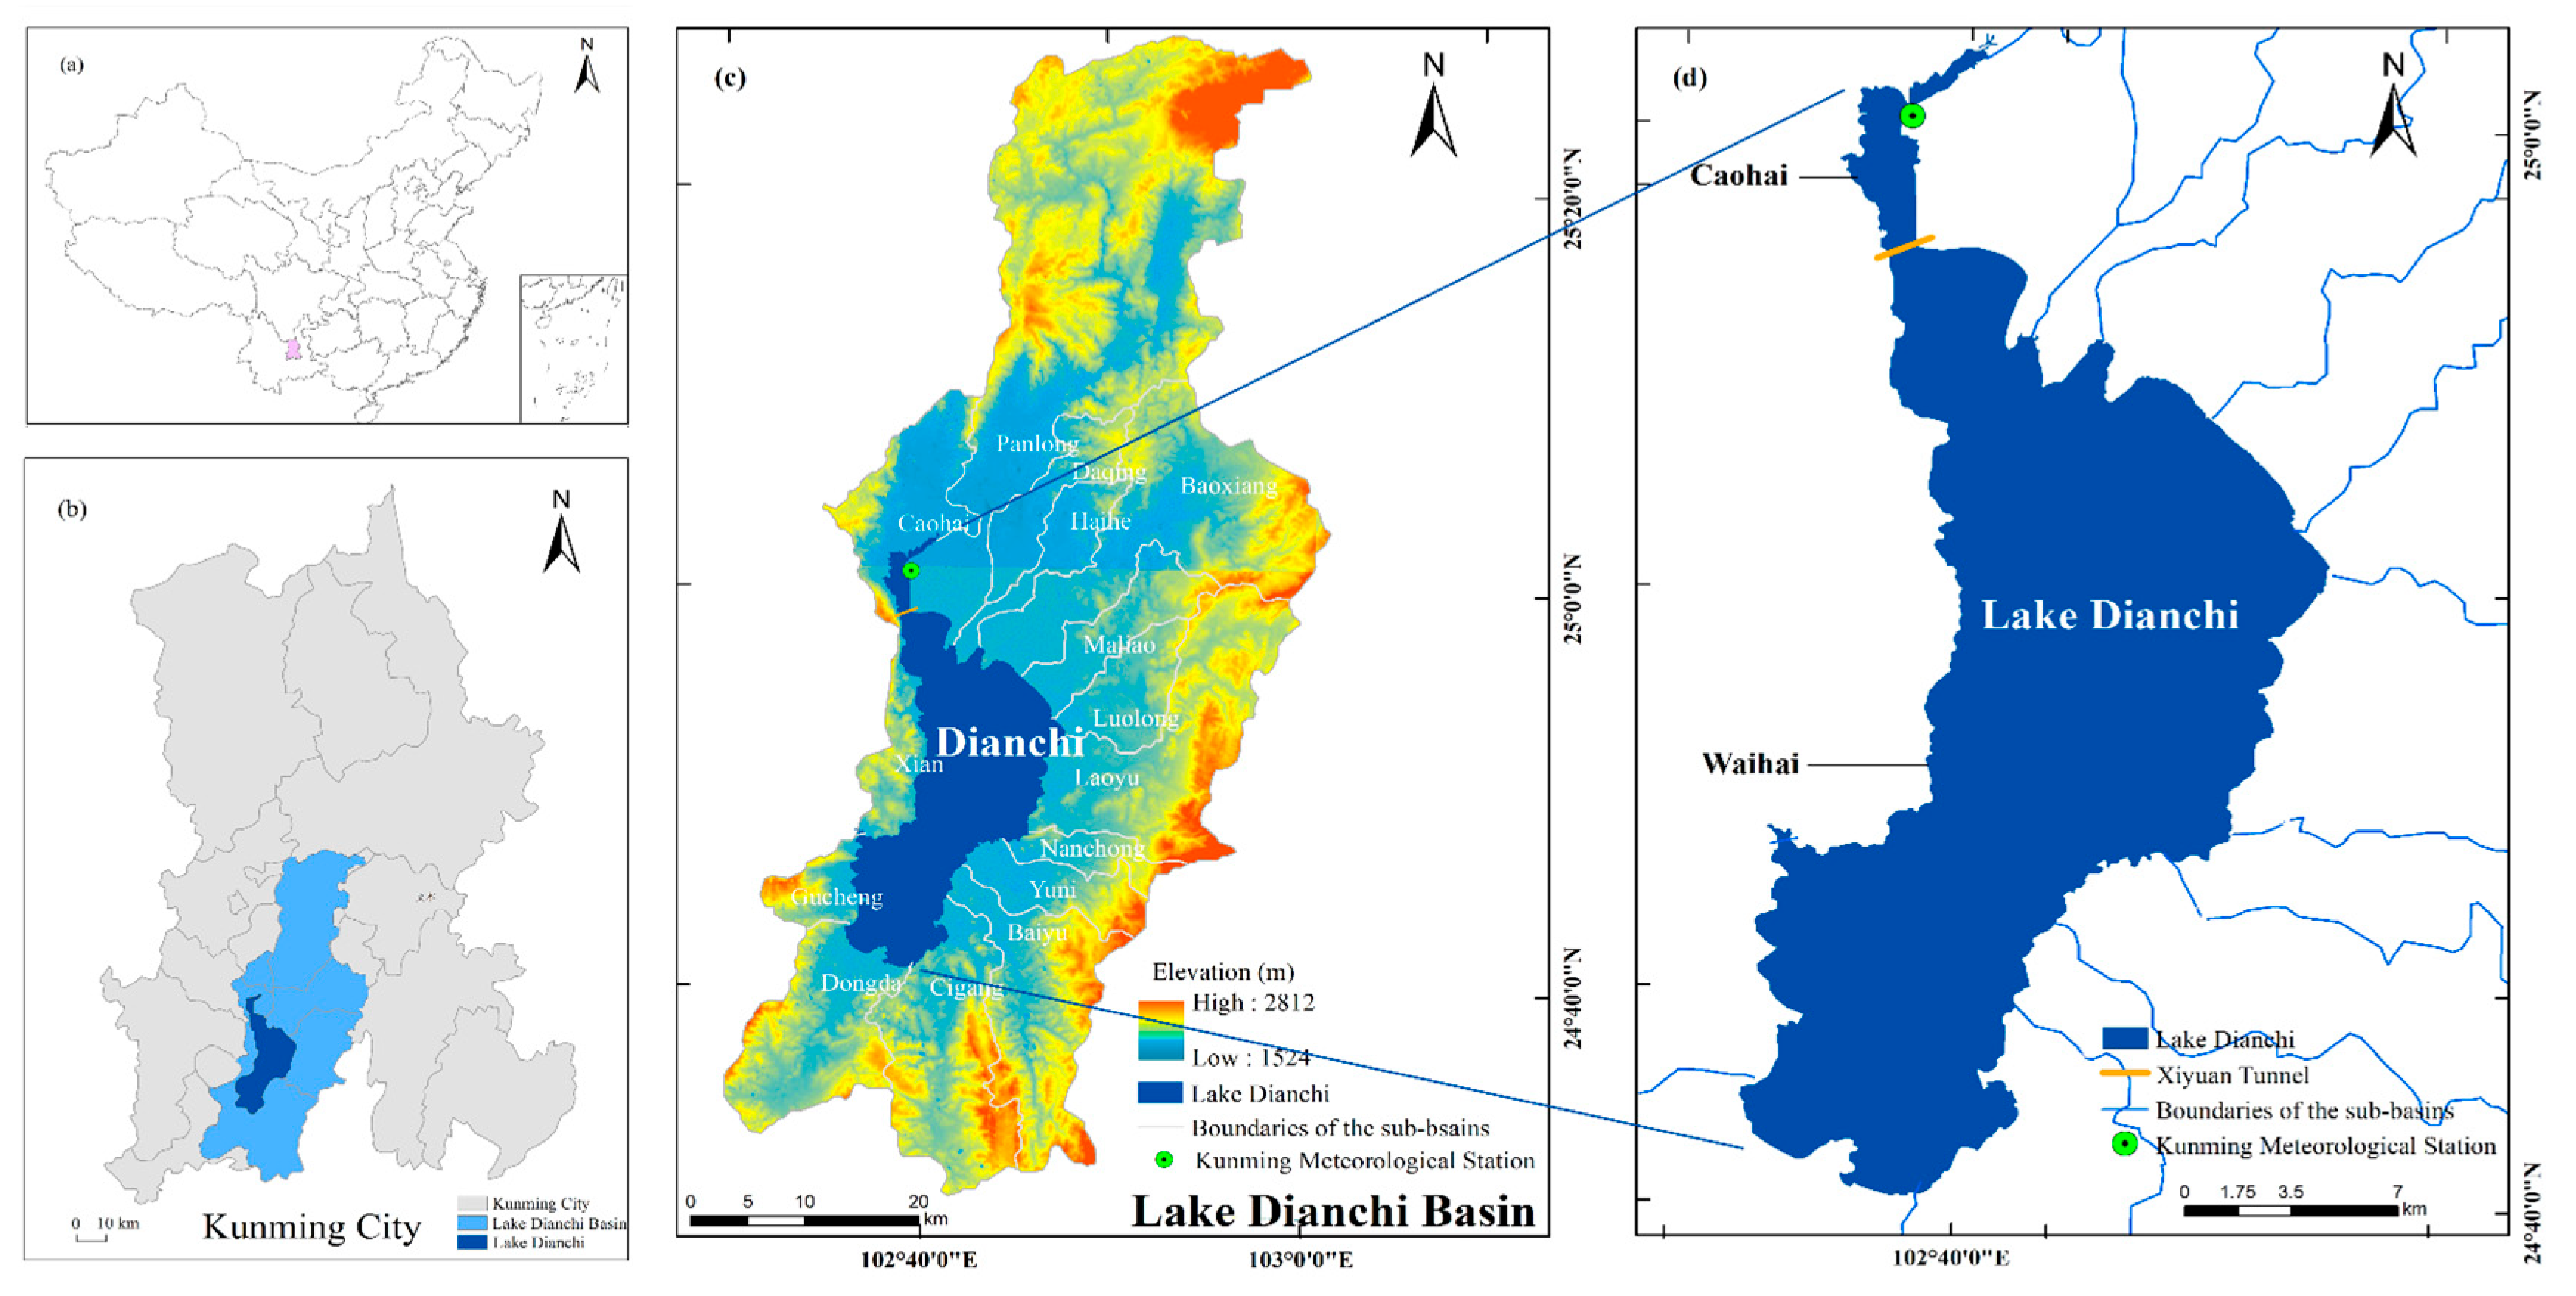
2.1. Study Site
2.2. Satellite and Other Data
2.2.1. Satellite Data Acquisition and Pre-Processing
2.2.2. Other Data
2.3. Algal Bloom Area Calculation Methods
2.3.1. FAI Algorithm
2.3.2. Thresholds of Pure-Algae and None-Algae Pixels
2.3.3. Calculation of Algal Coverage of Mixed Pixels via APA
2.4. Temporal-Spatial Characteristic Determination
2.5. Statistical Methods
3. Results
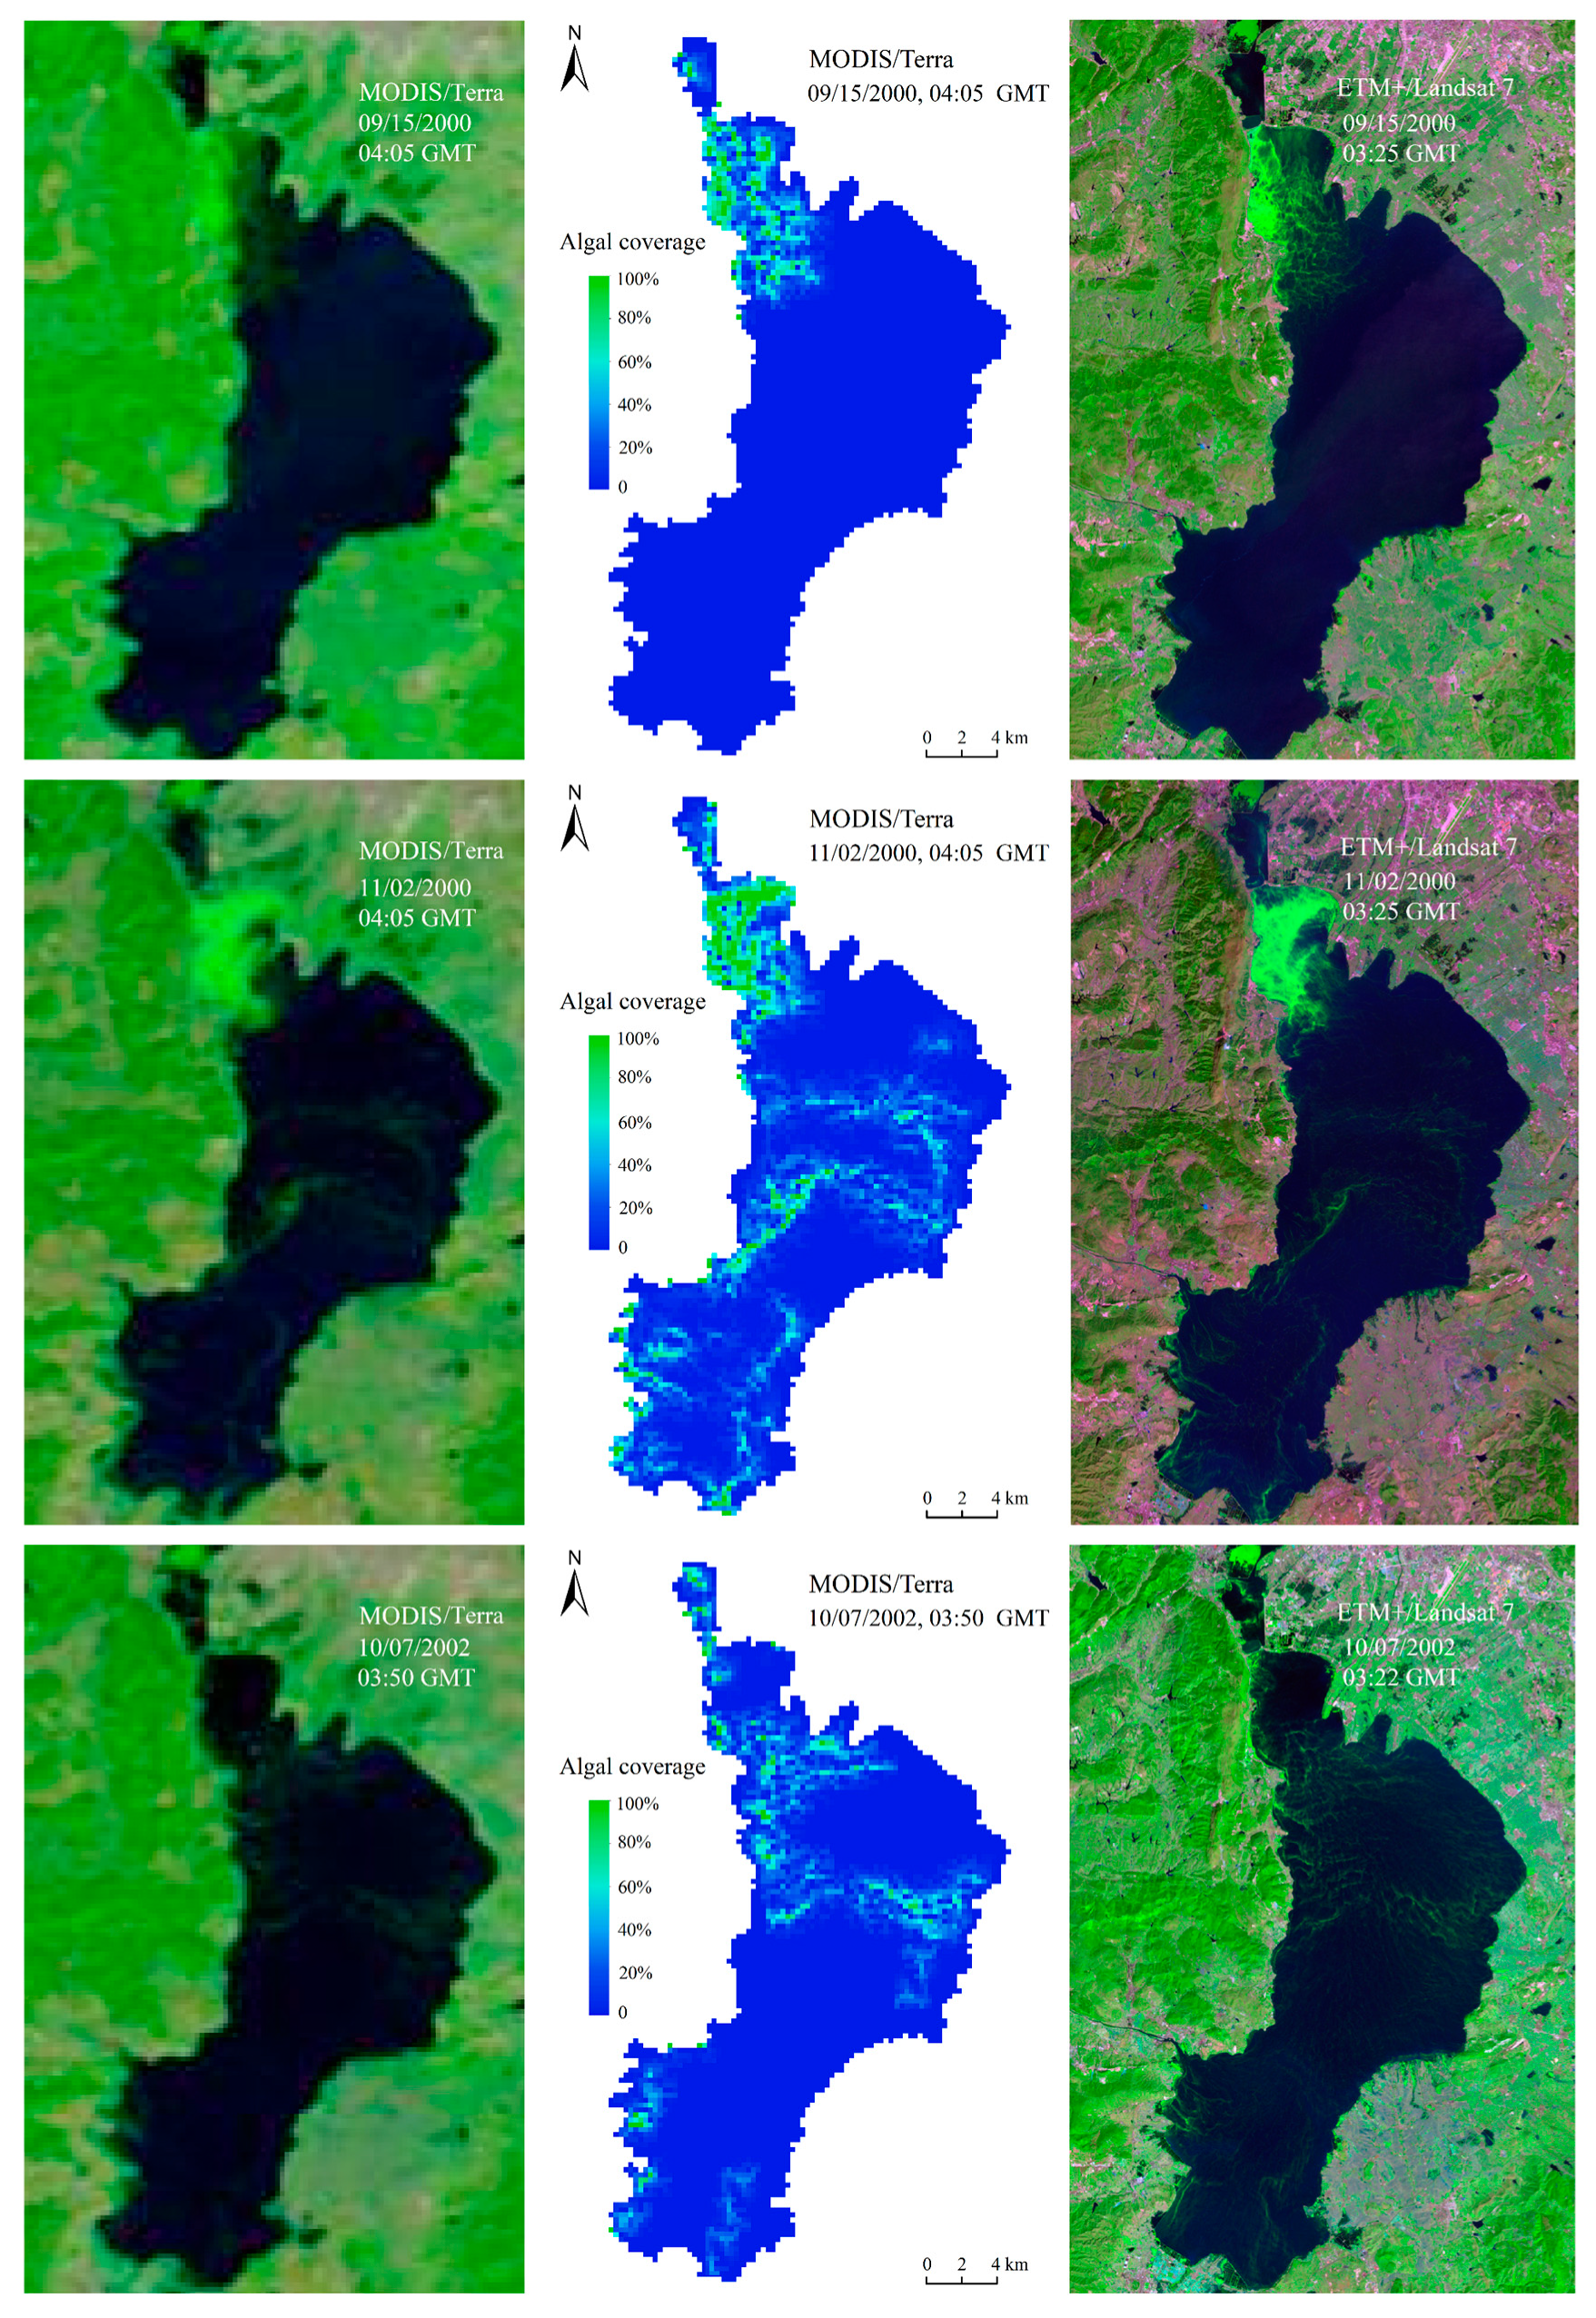
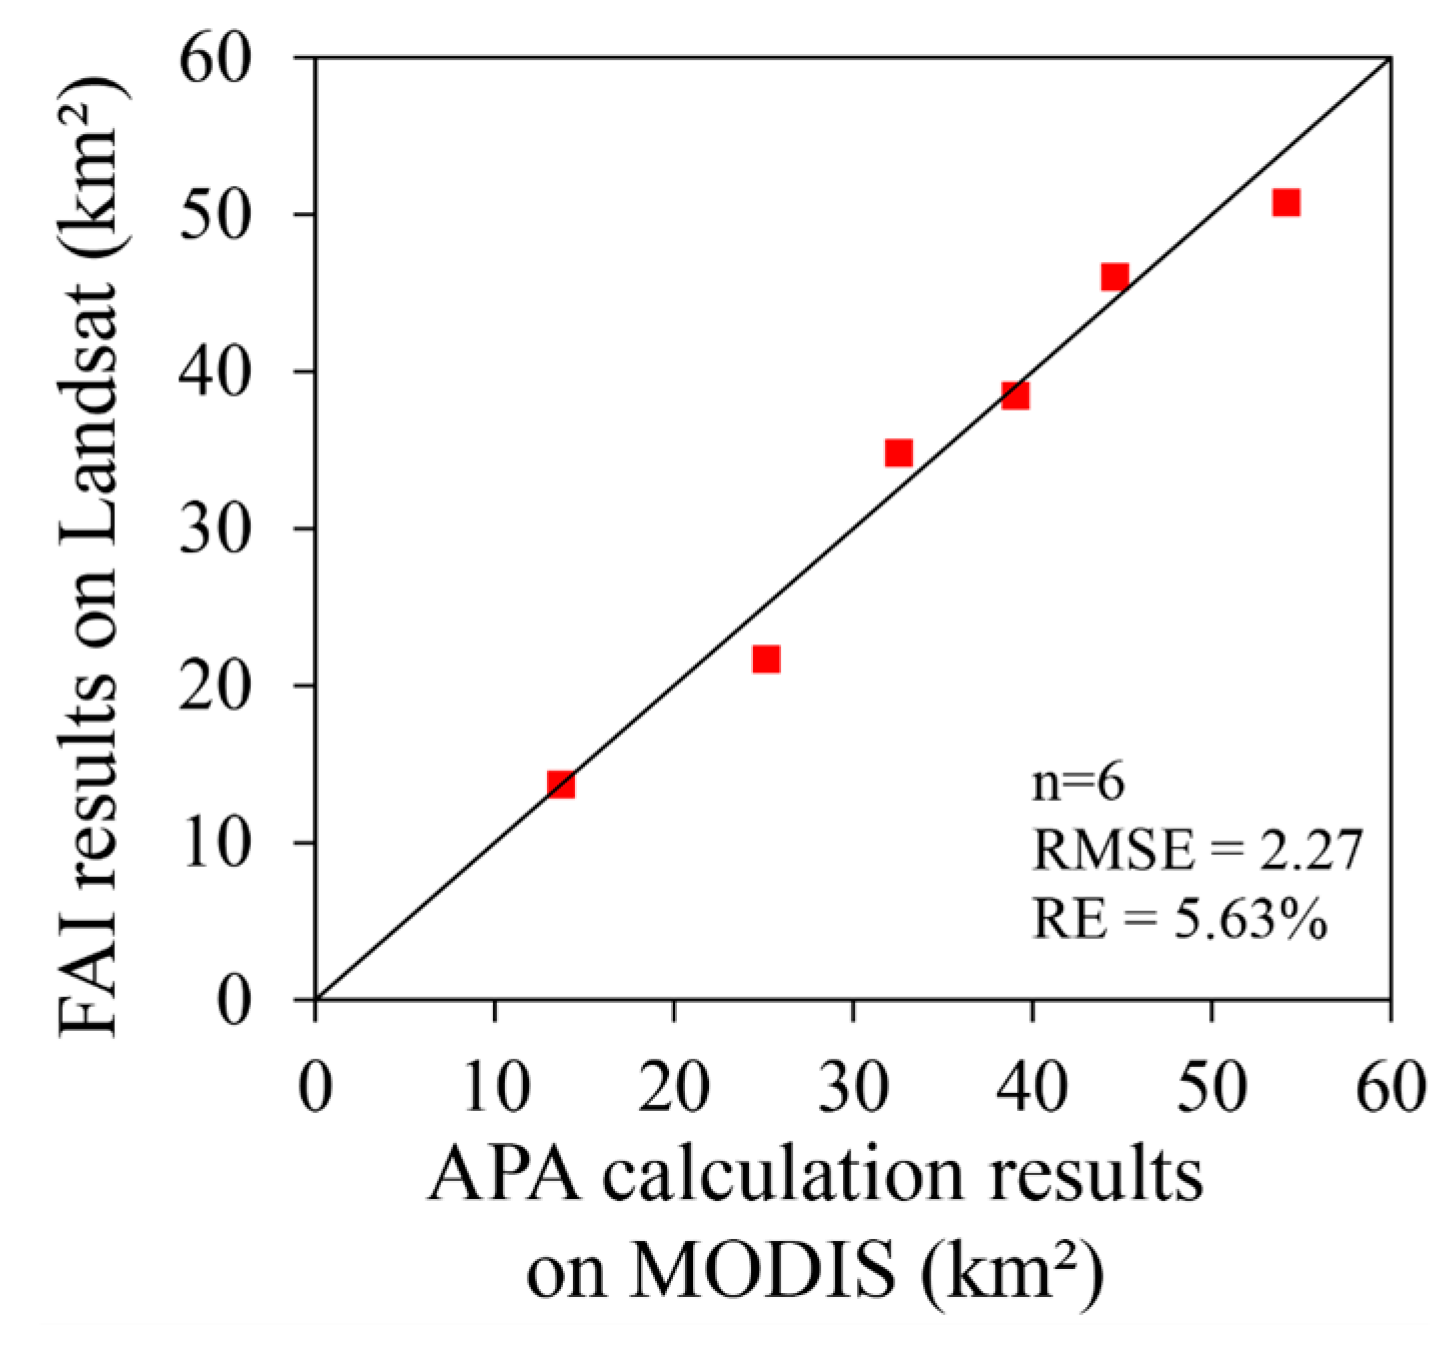
3.1. Validation of the APA
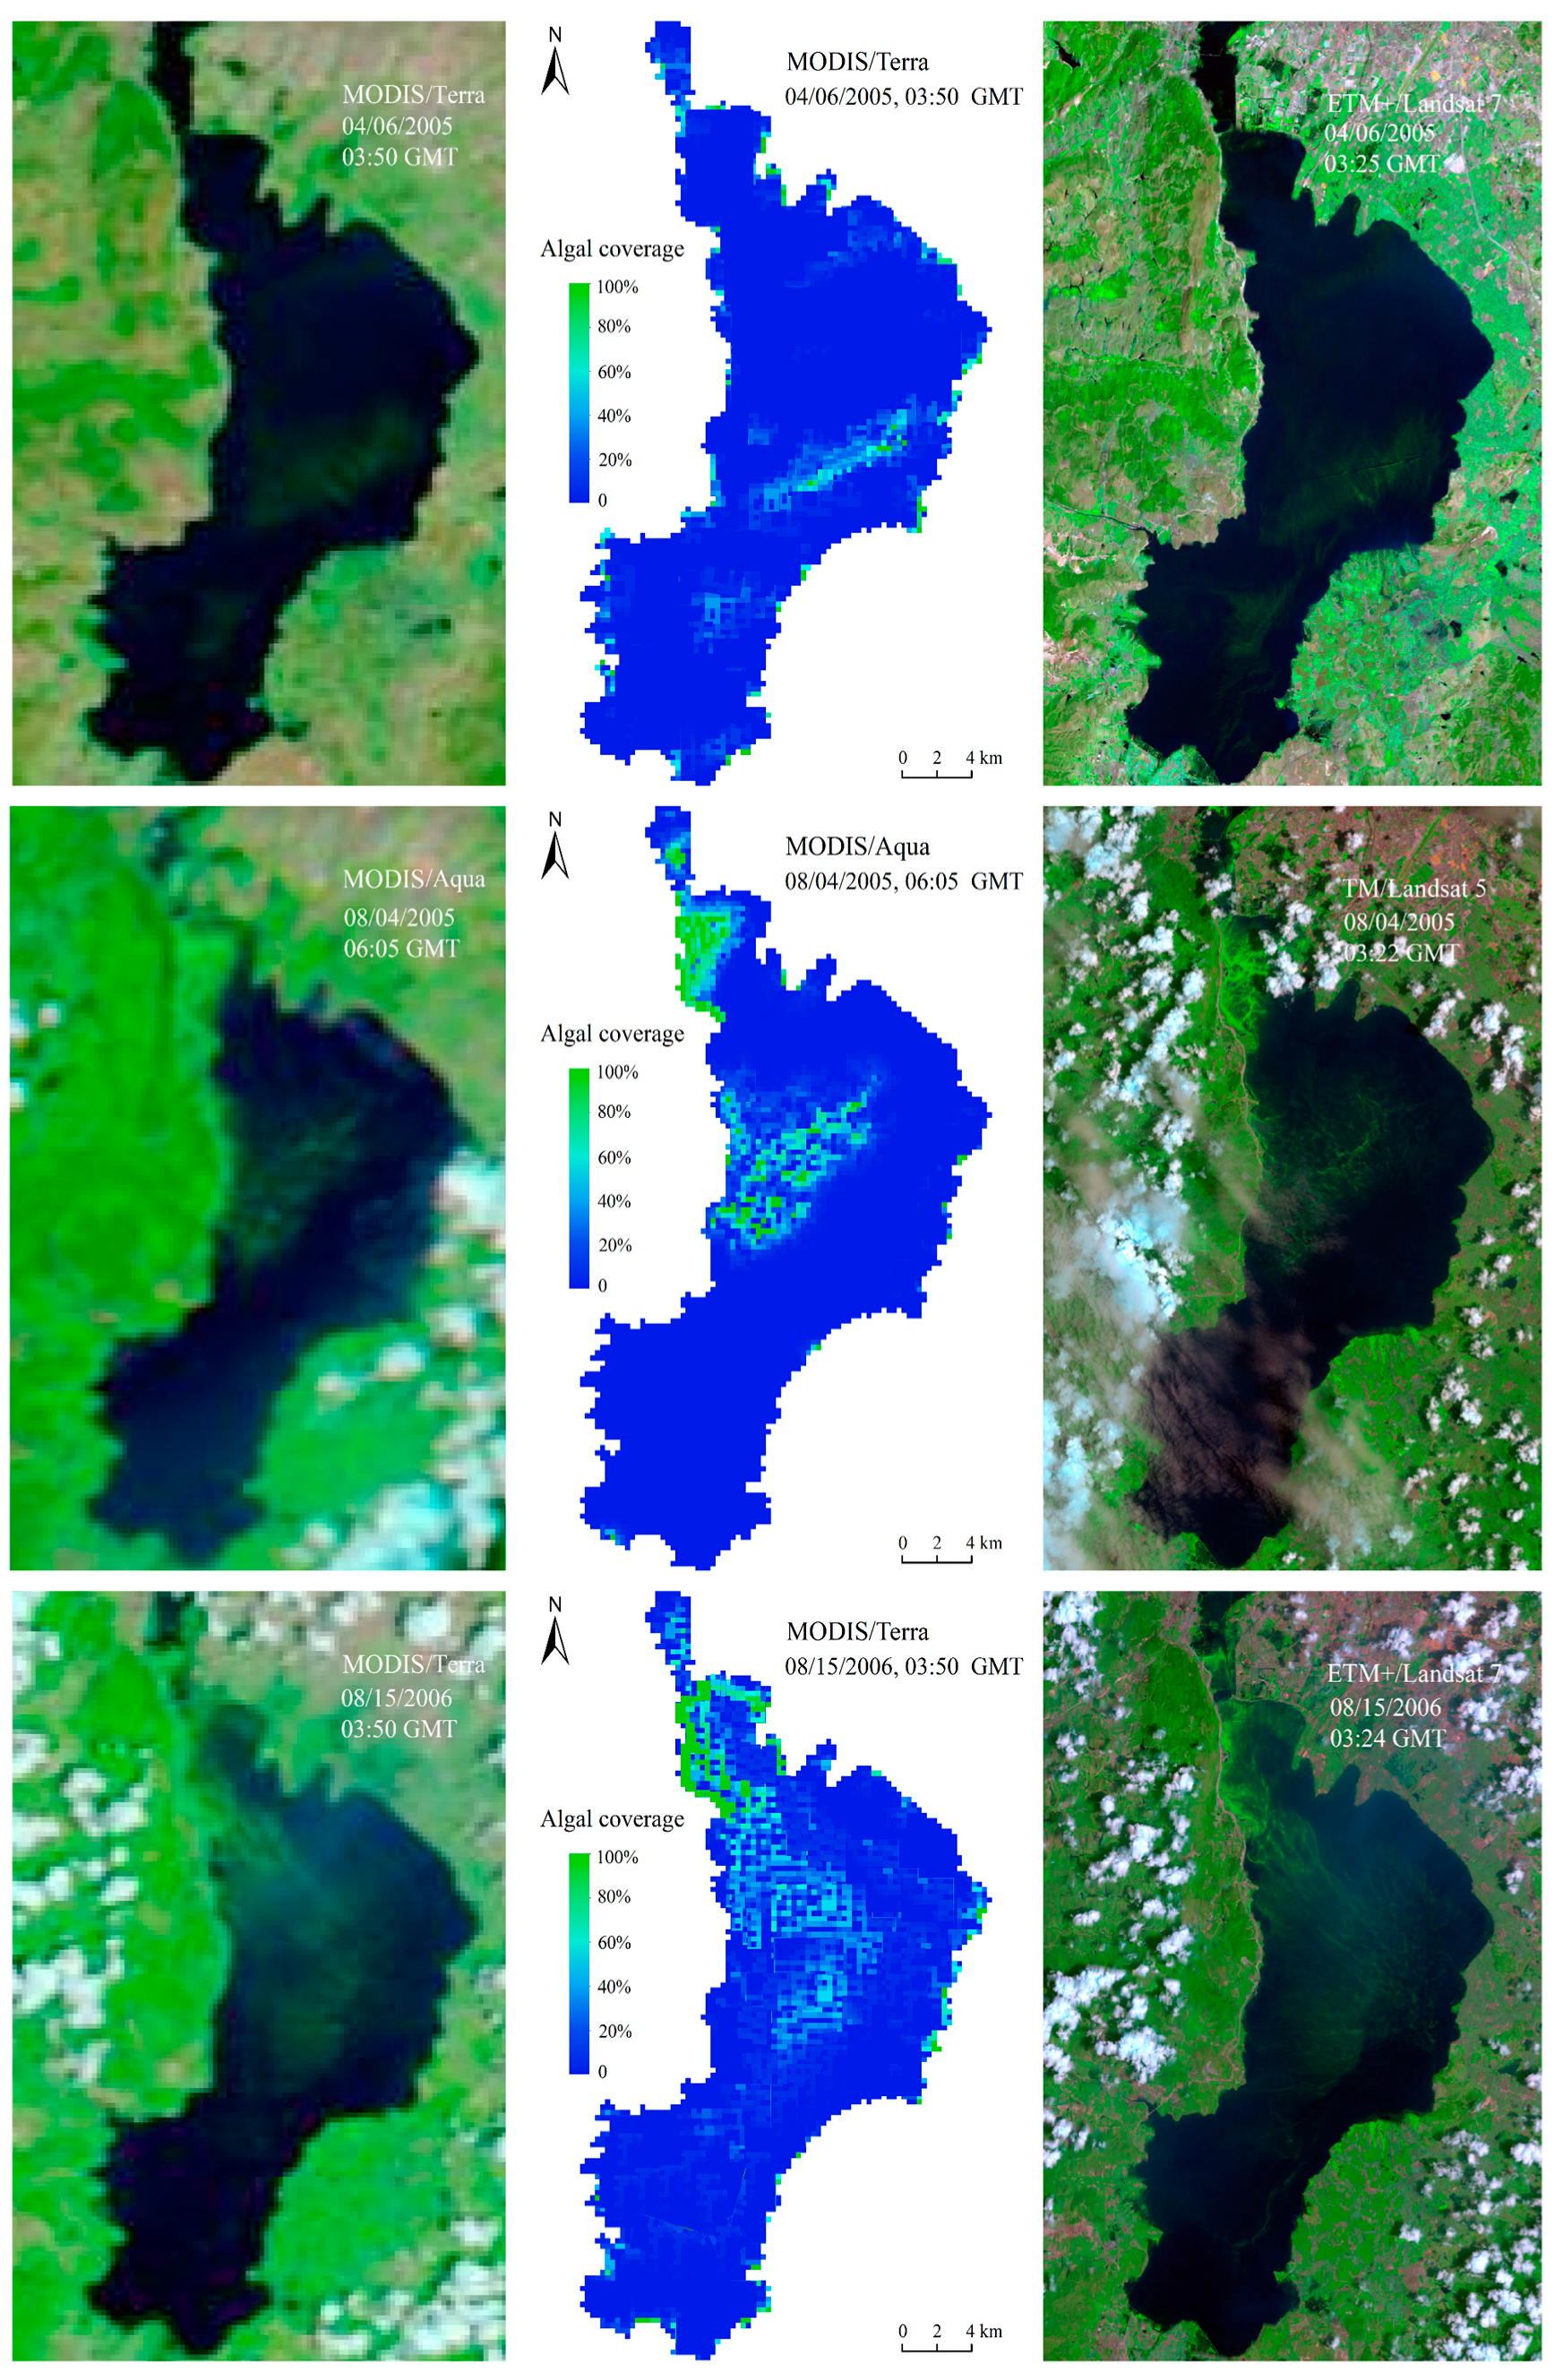
3.2. Spatial-Temporal Distribution of Algal Blooms
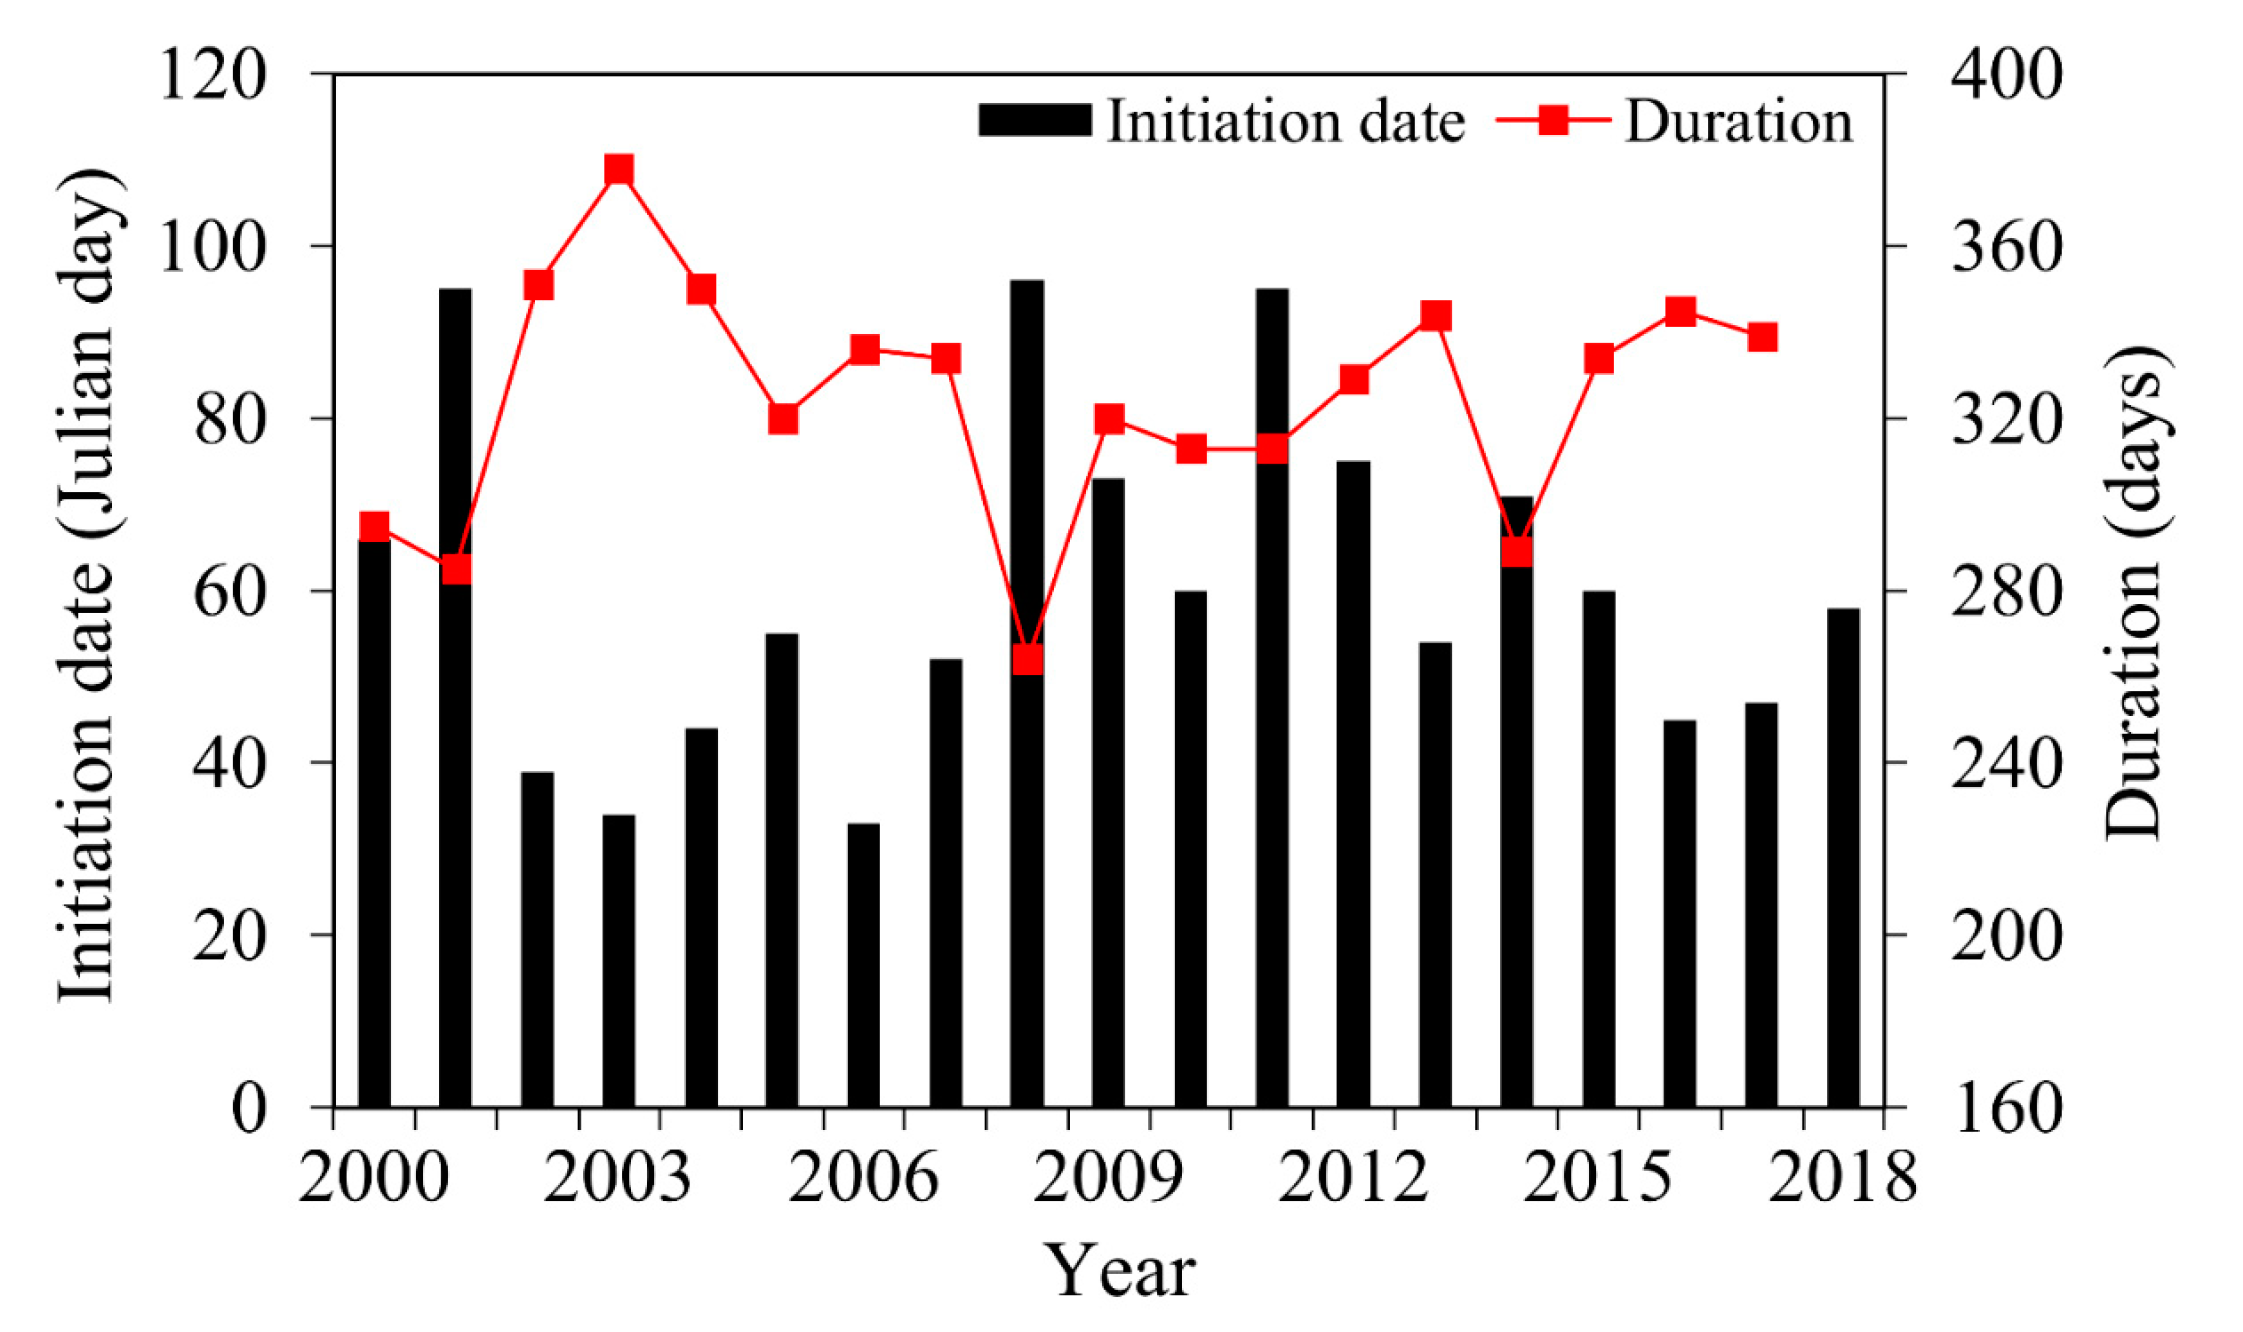
3.2.1. Distributions of Algal Bloom Initiation Date and Duration
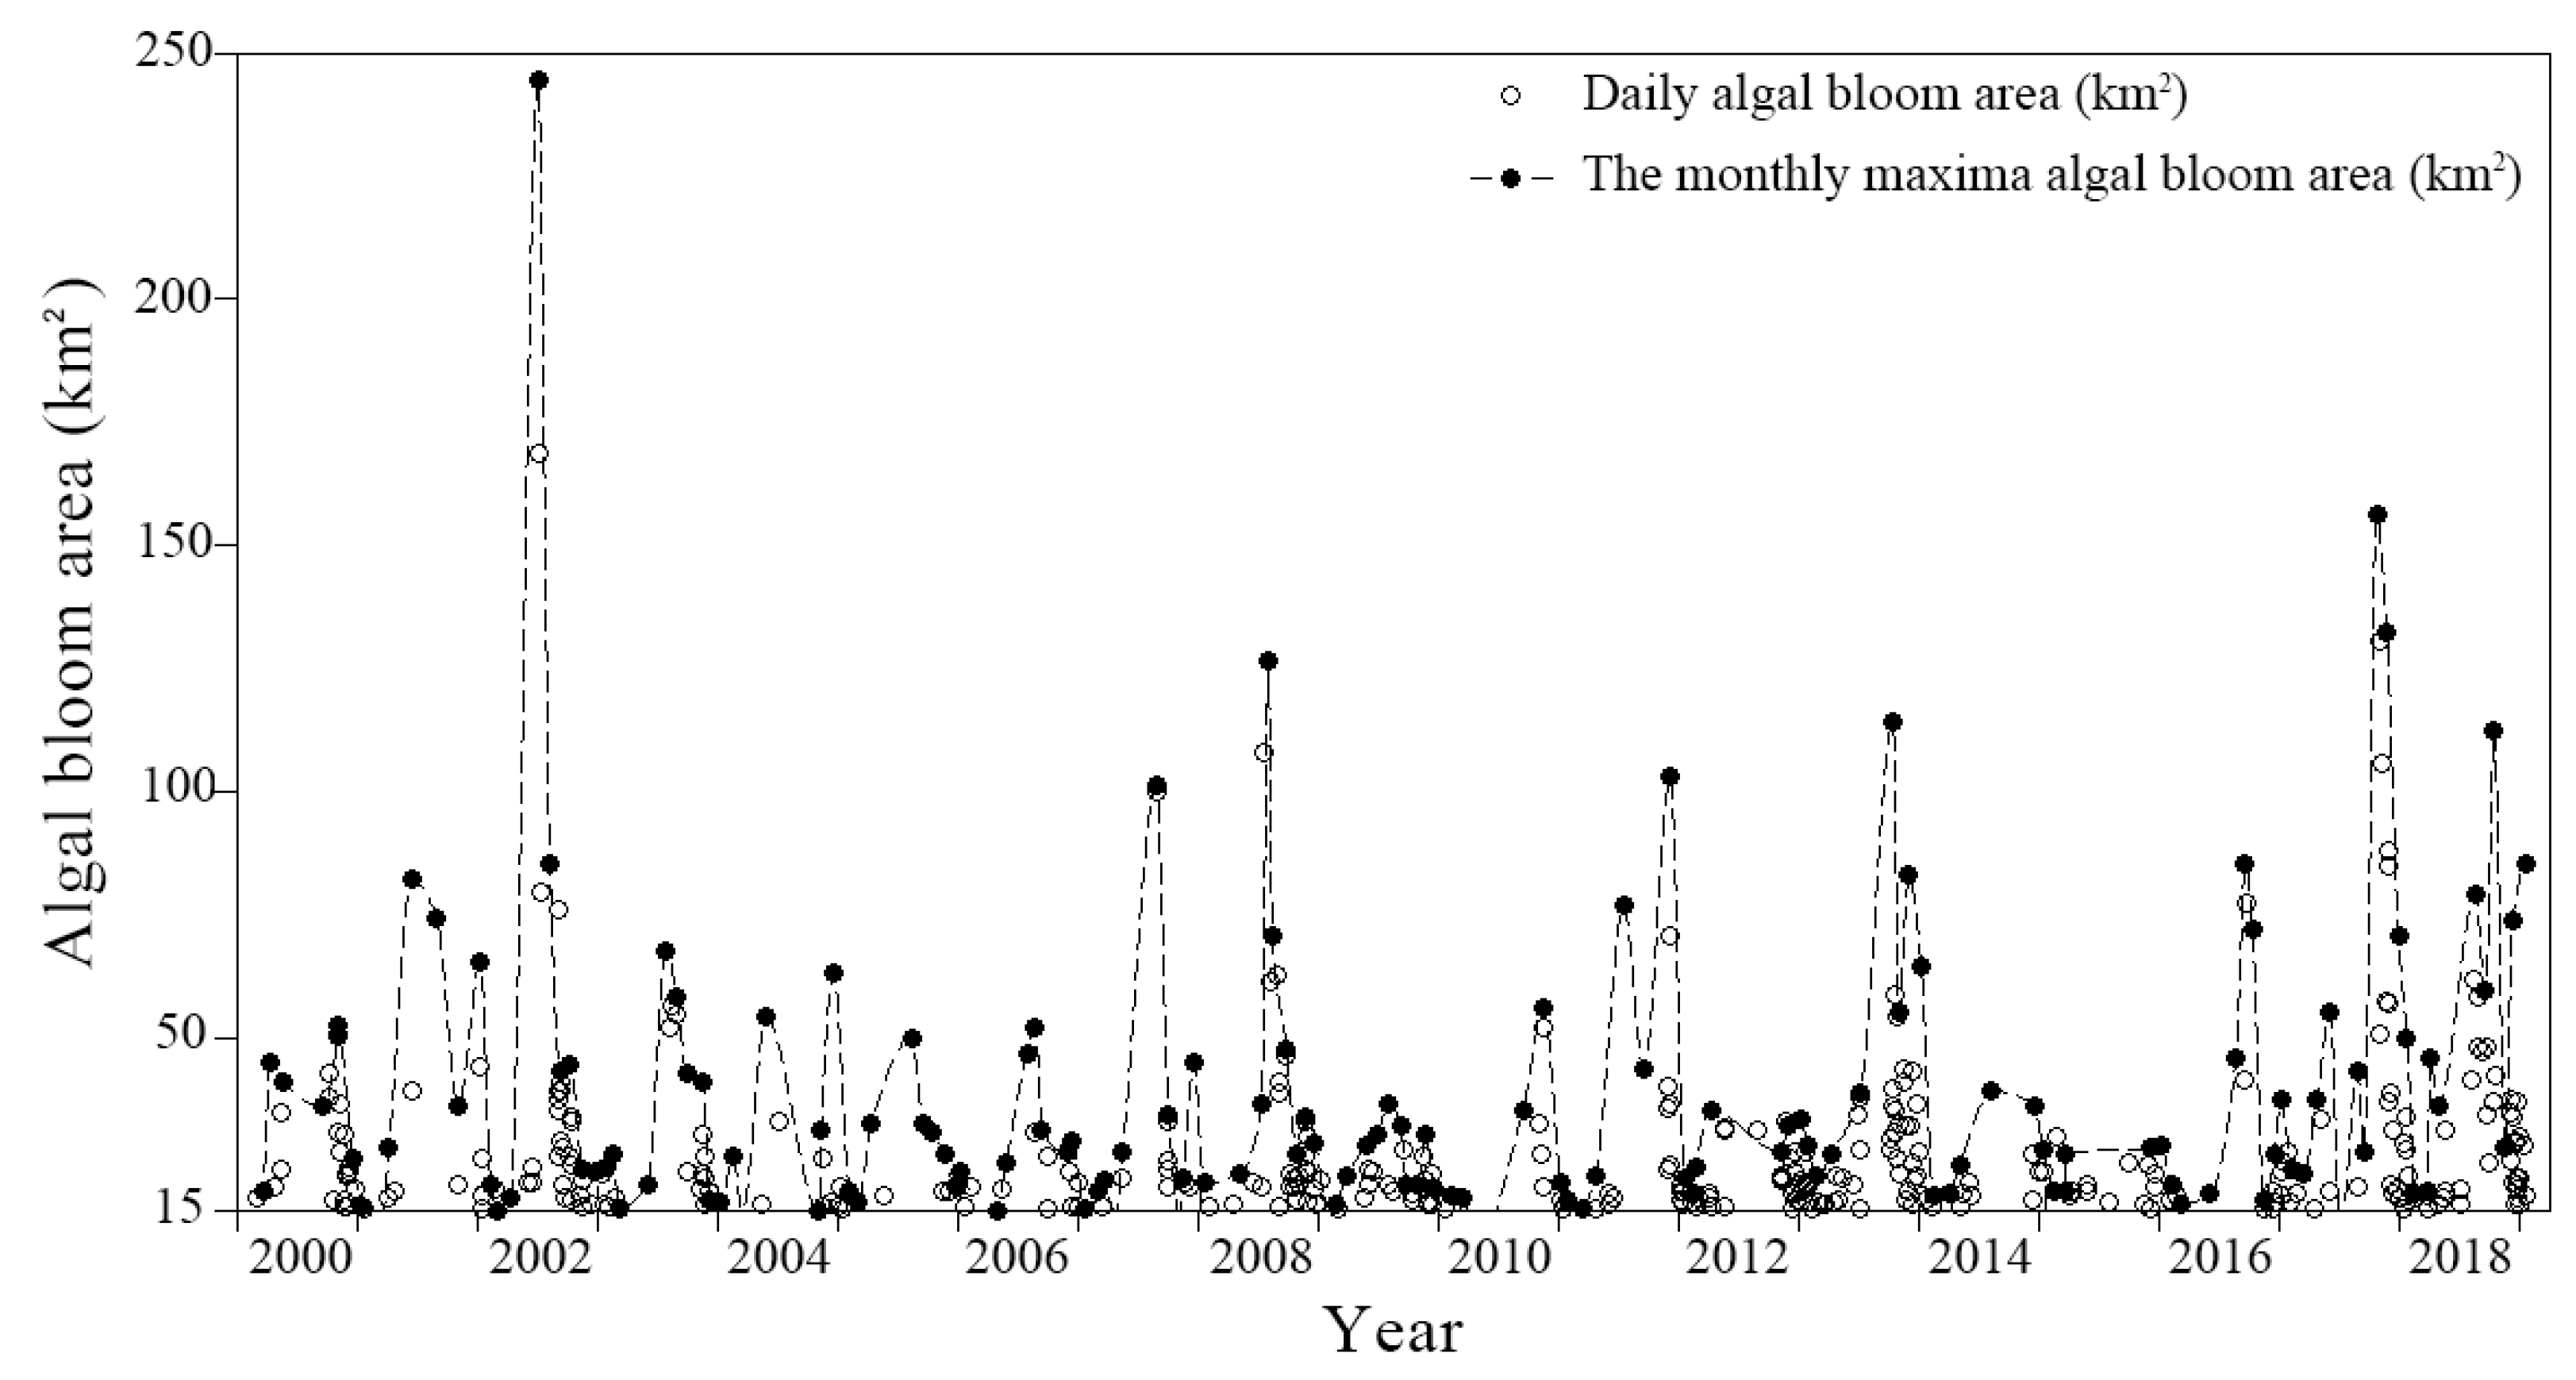
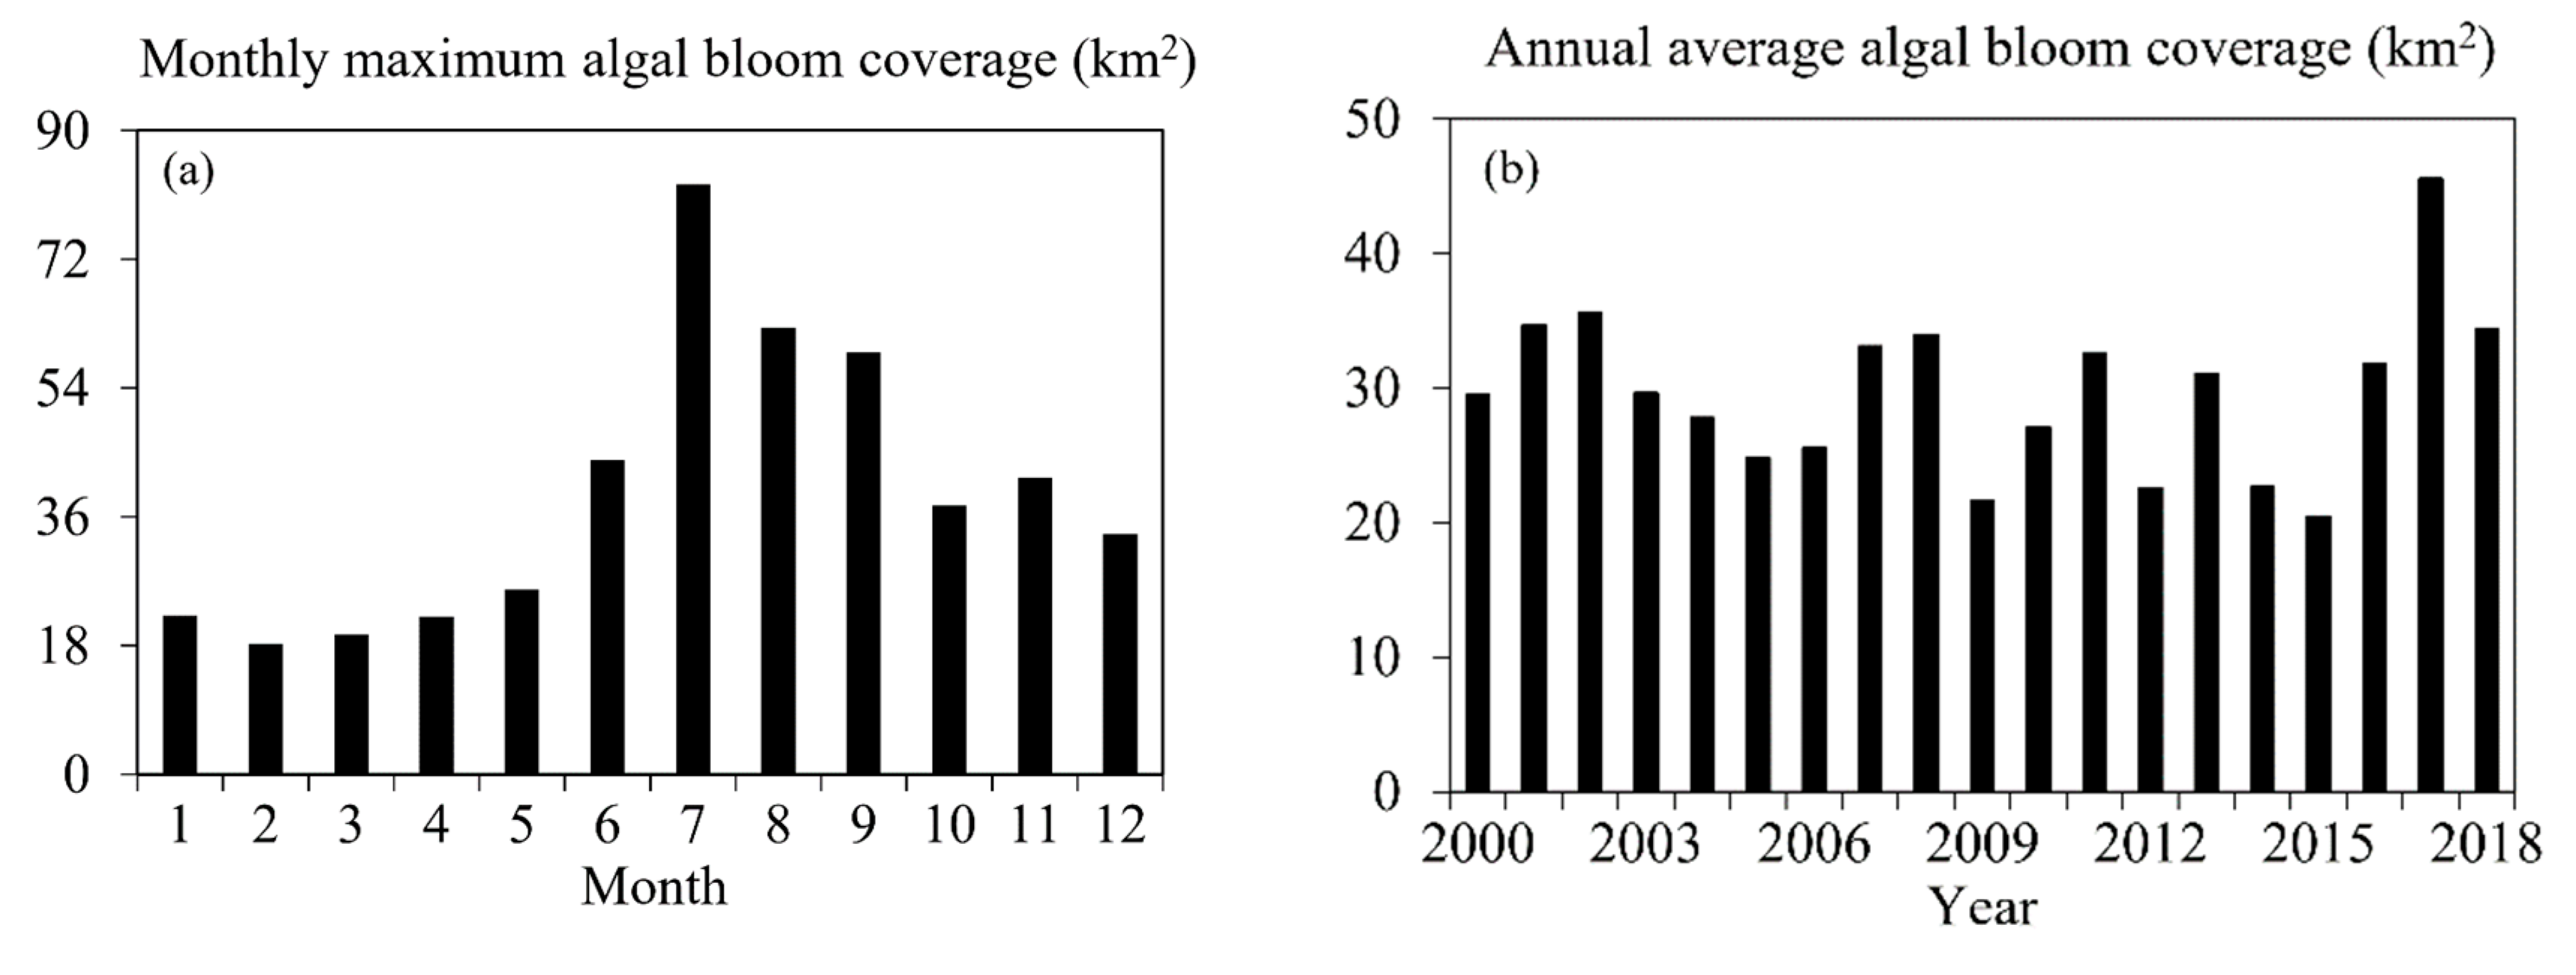
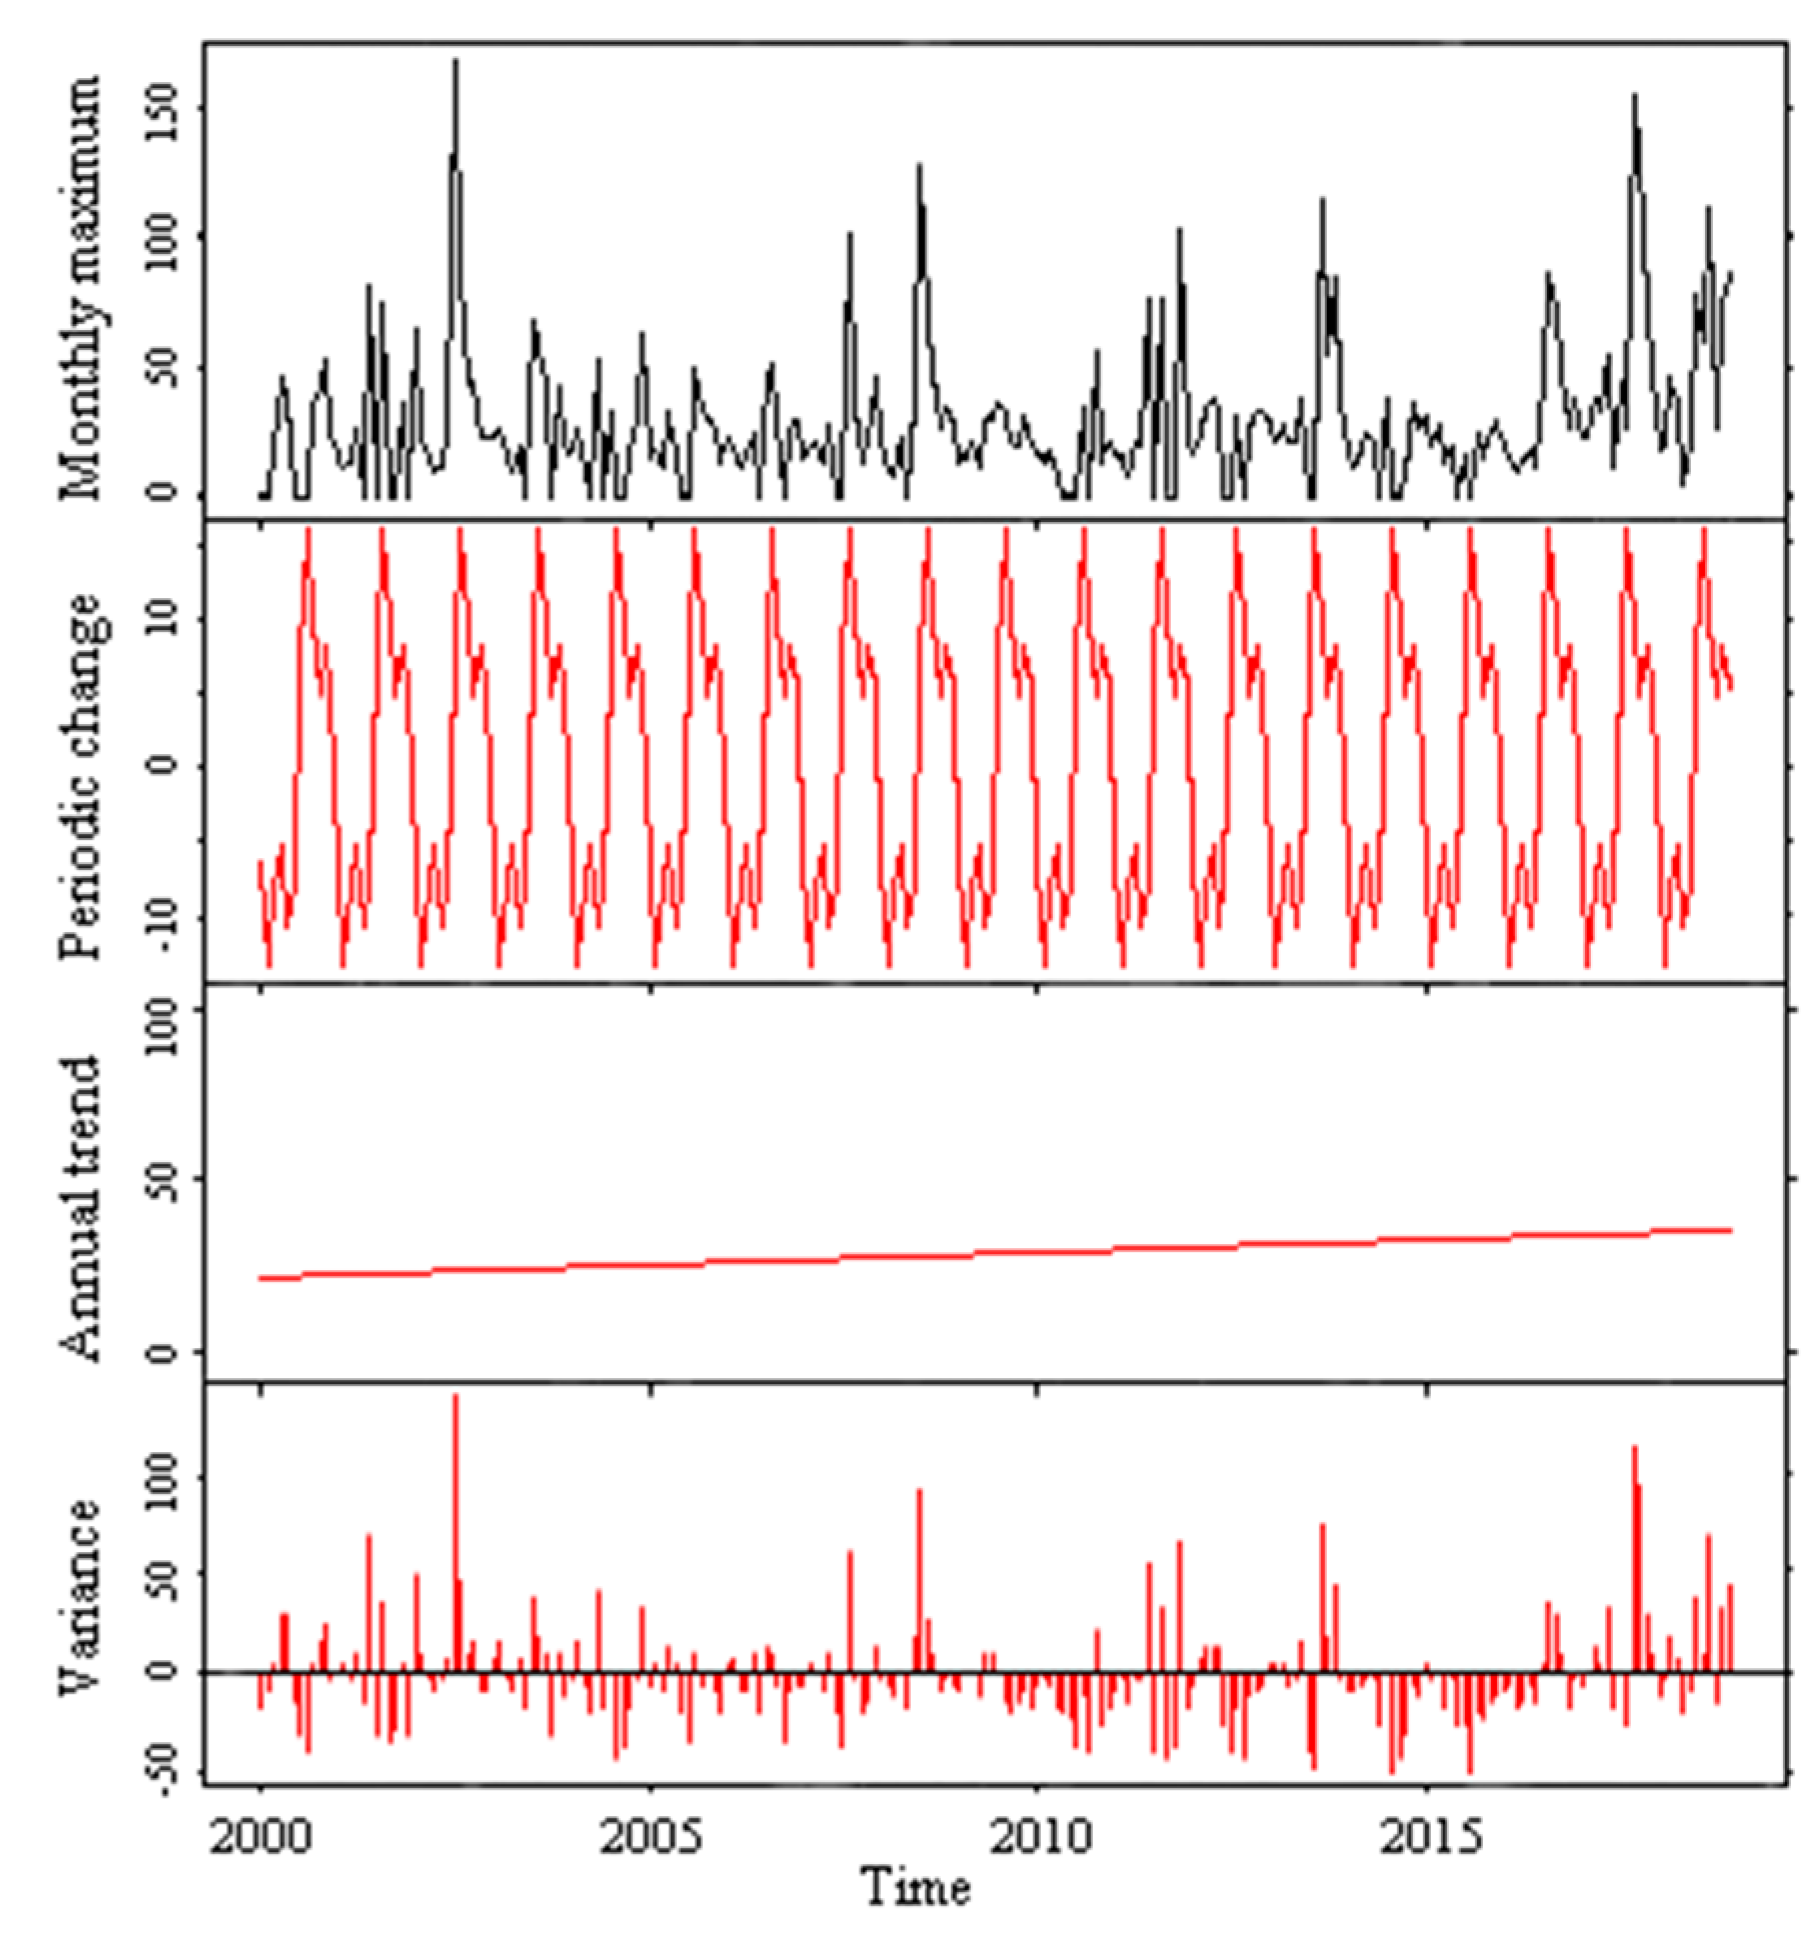
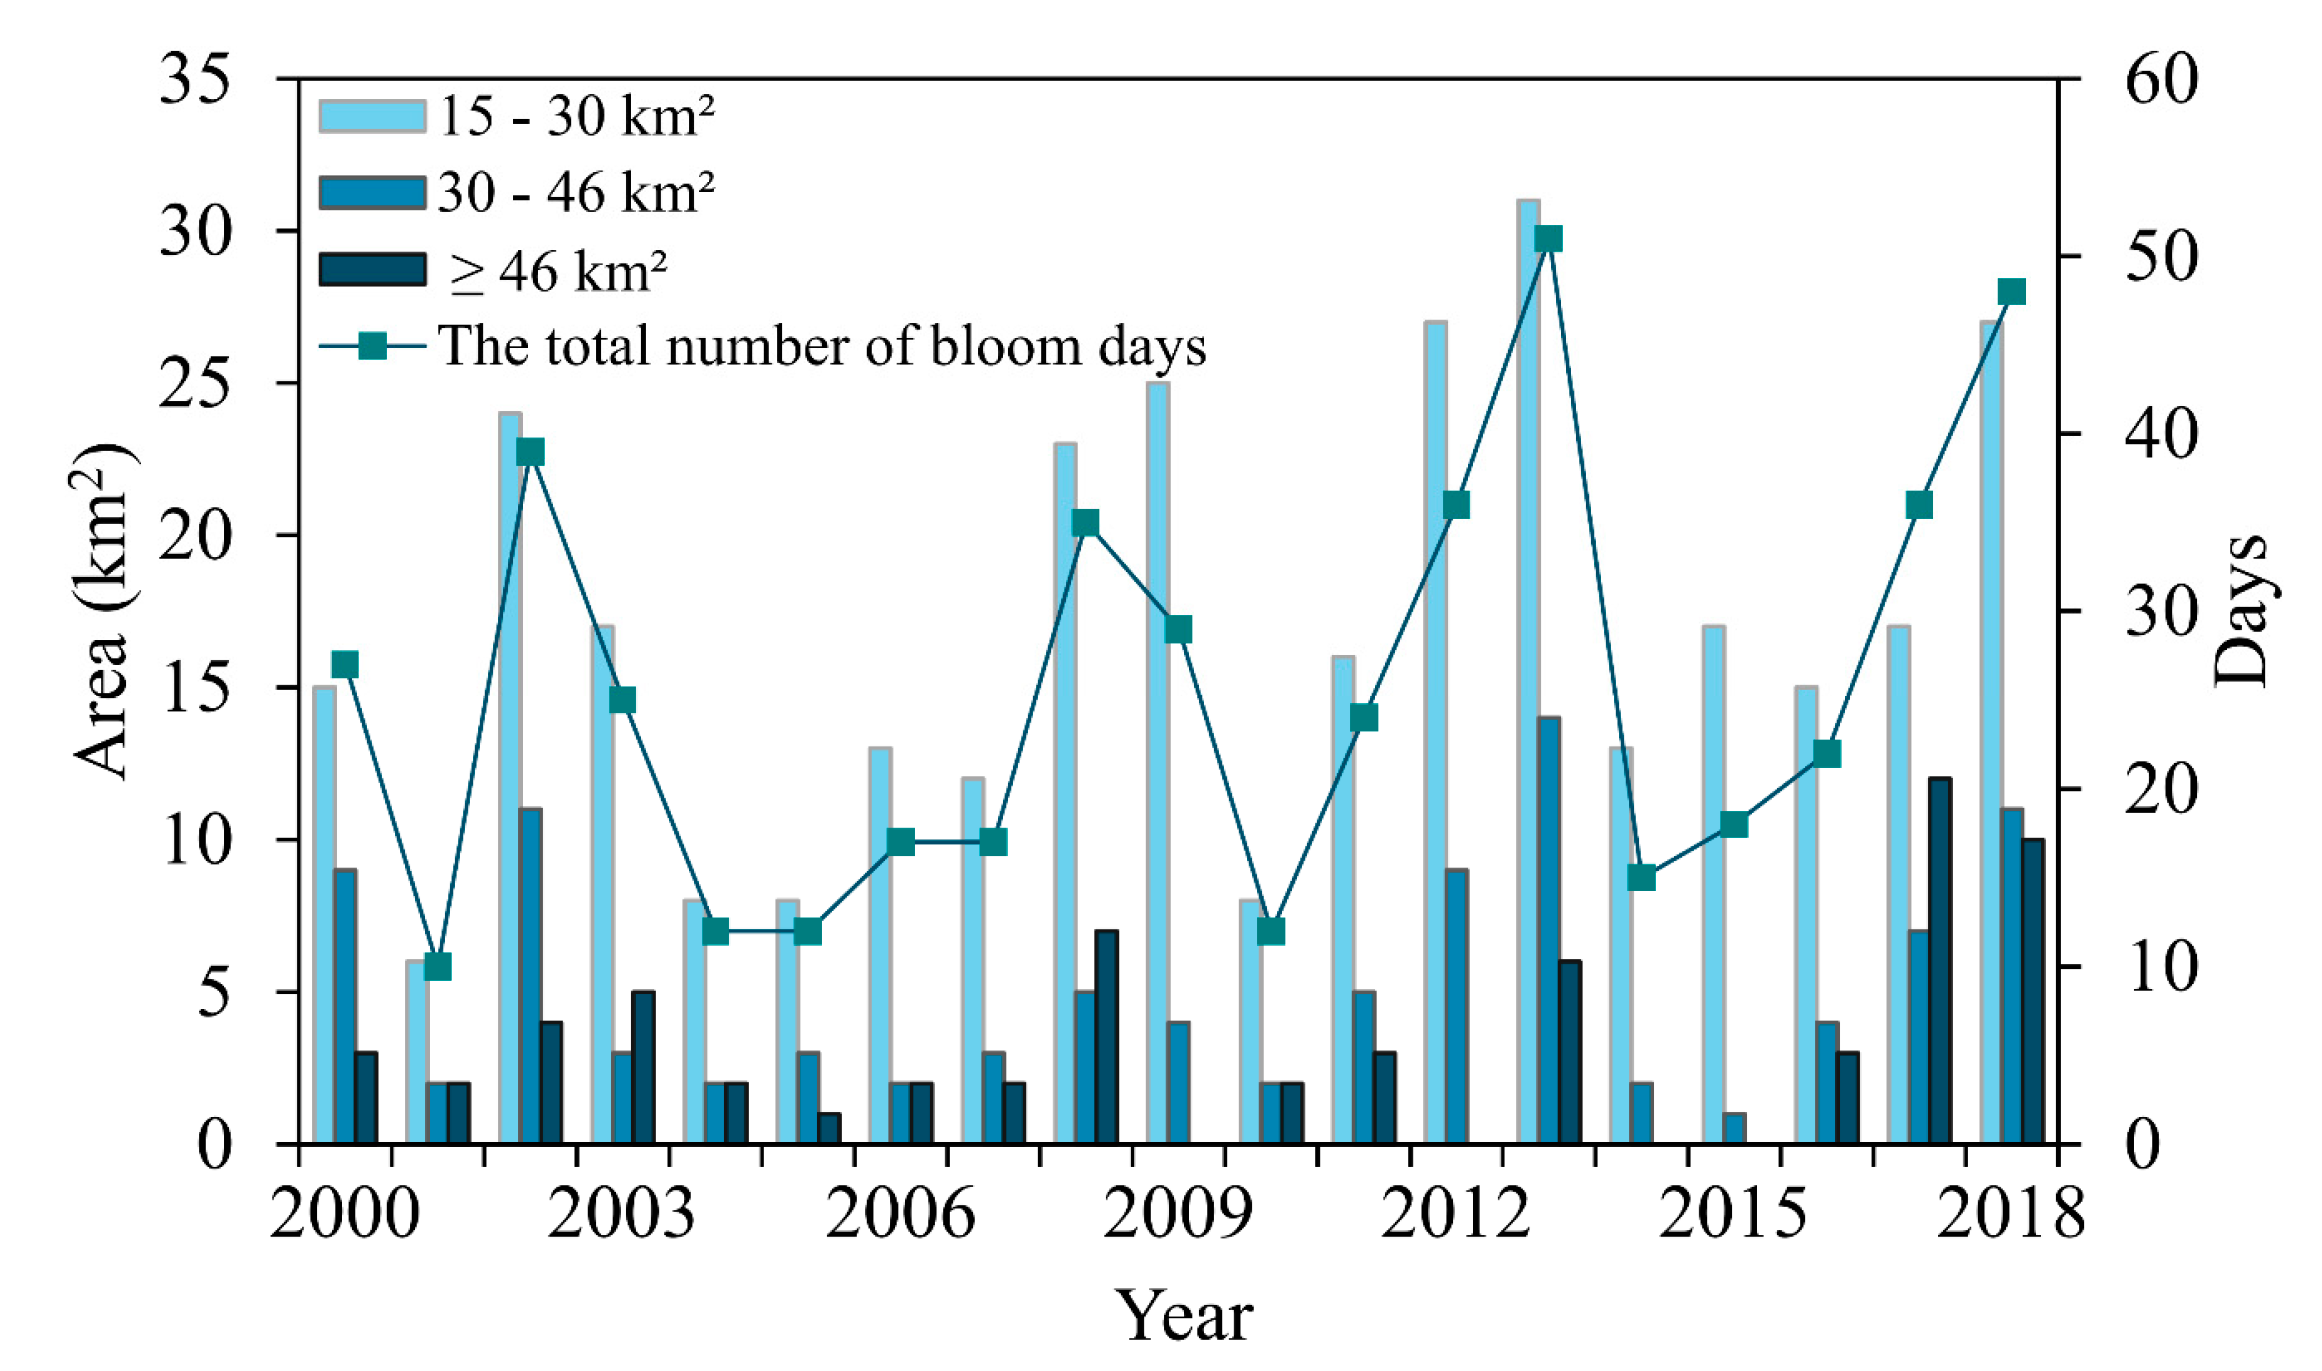
3.2.2. Temporal Variation of the Algal Bloom Areas
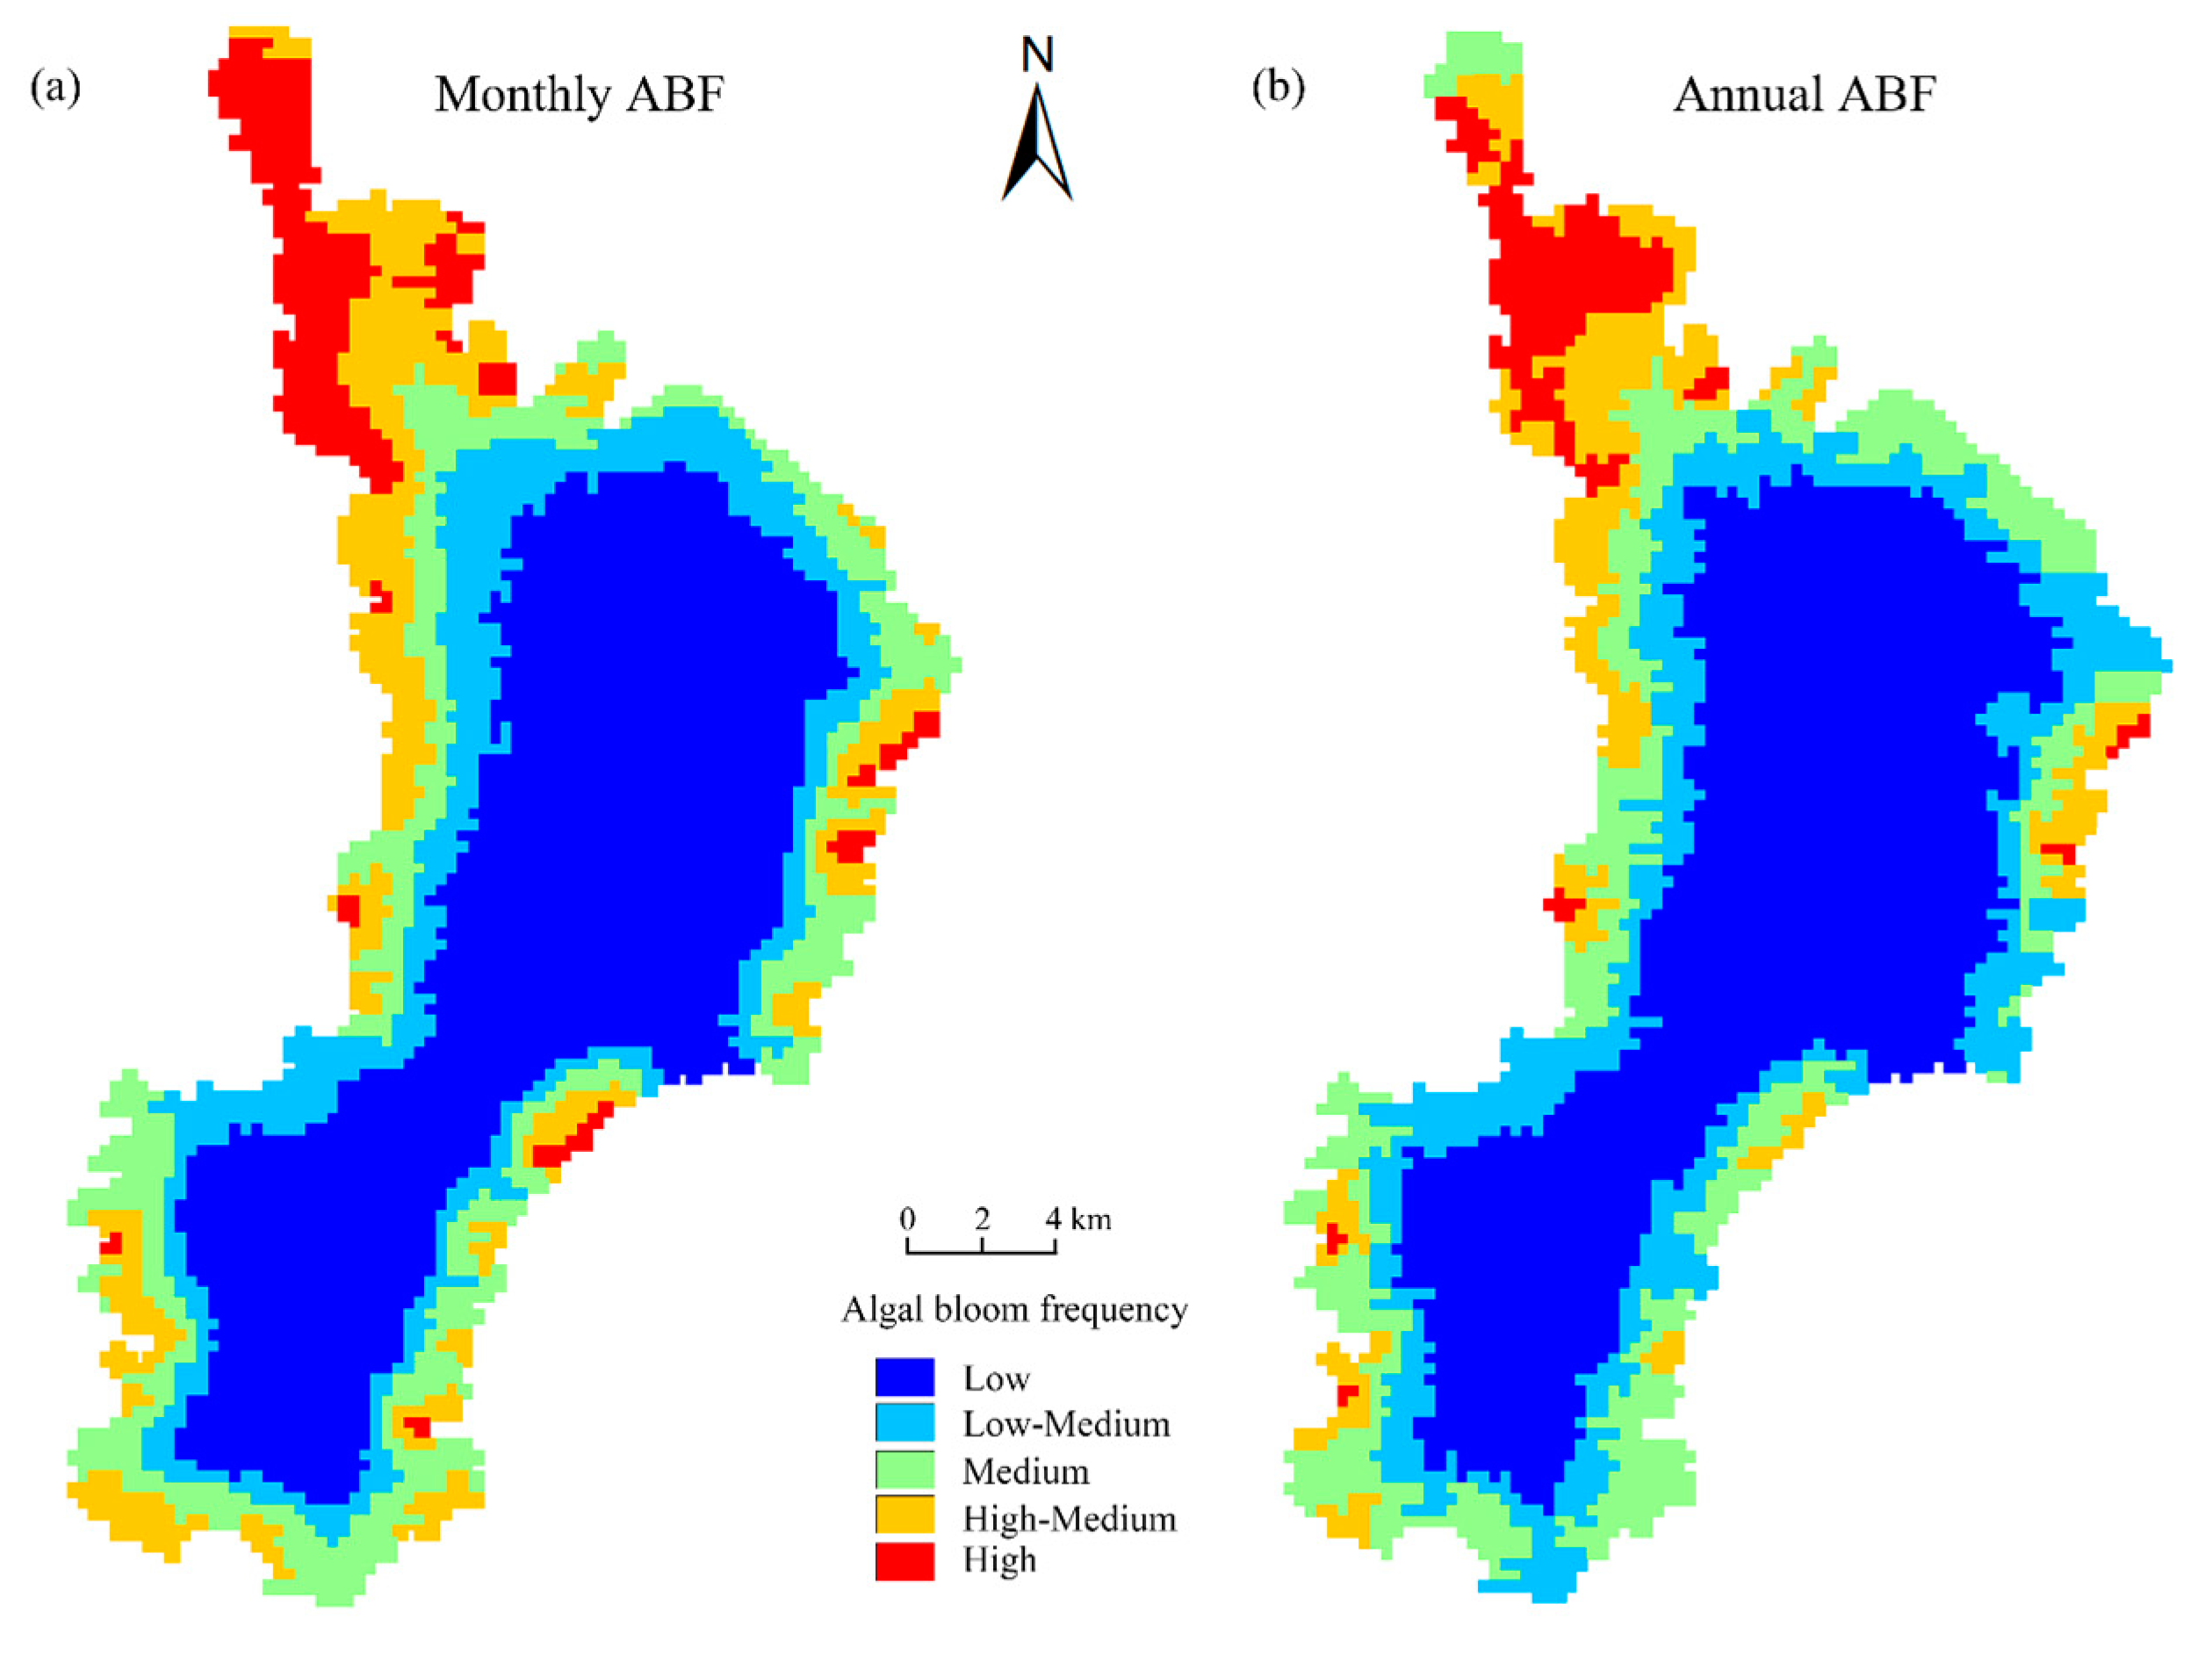
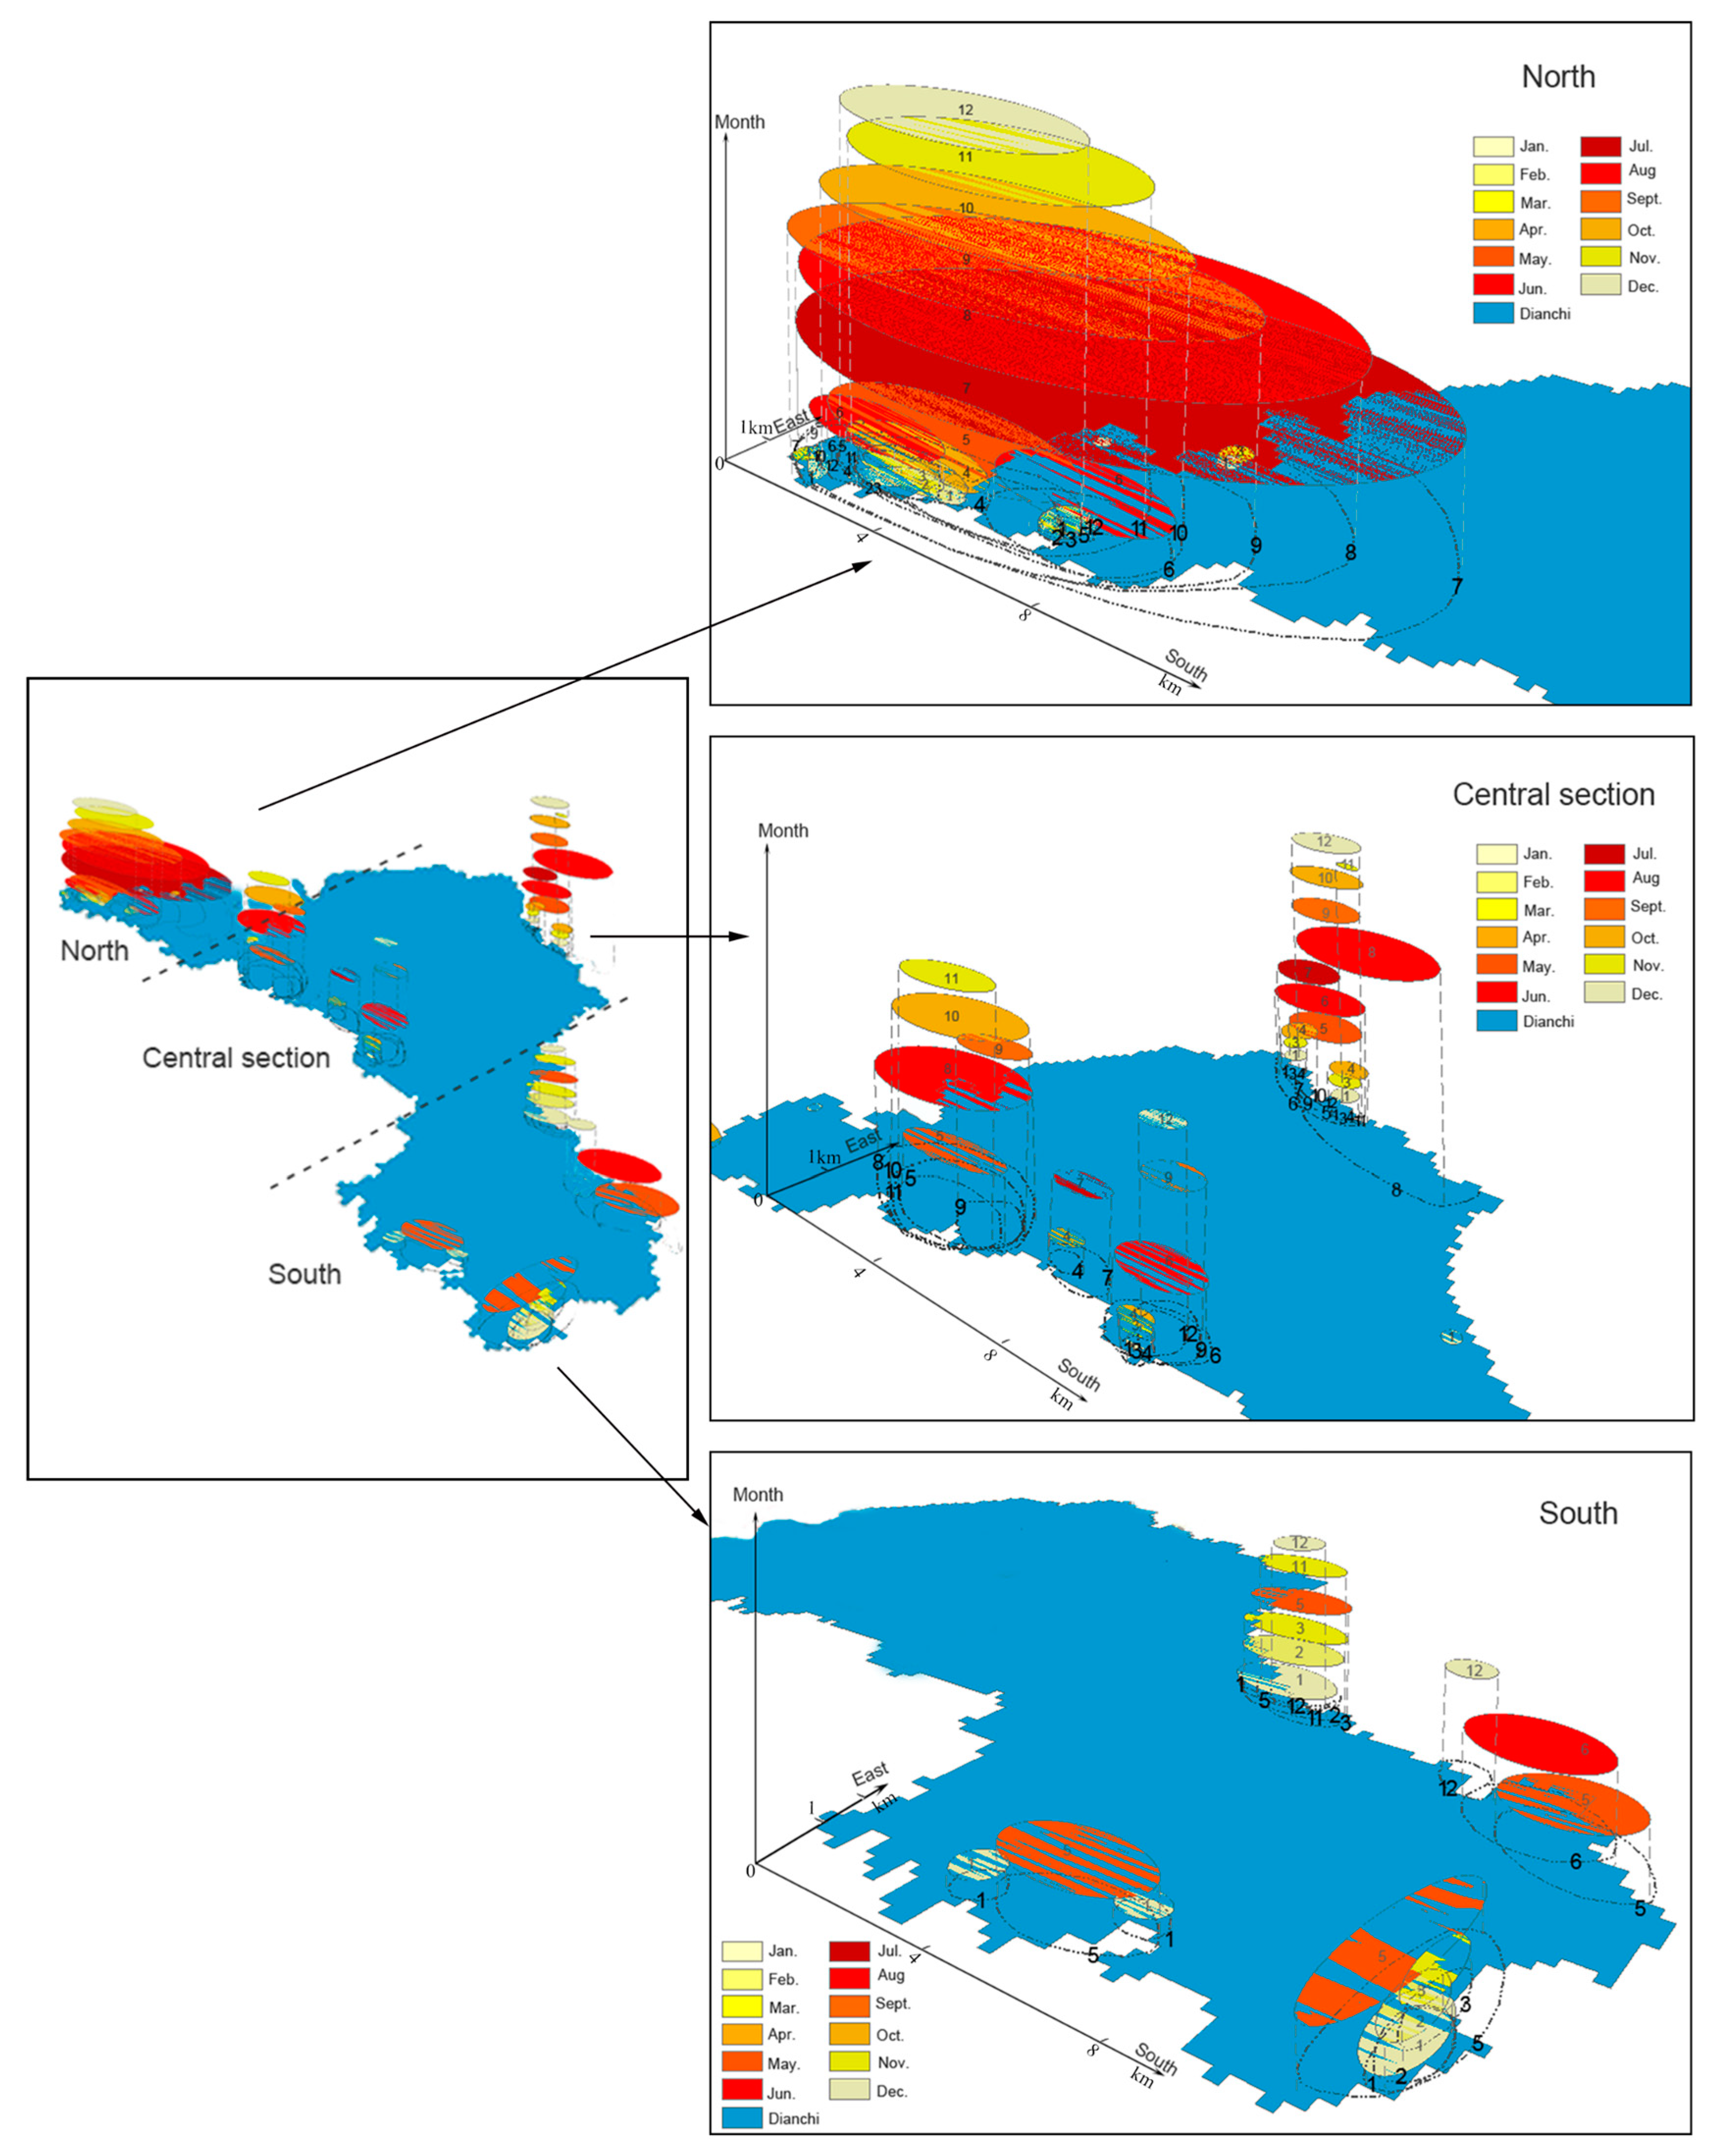
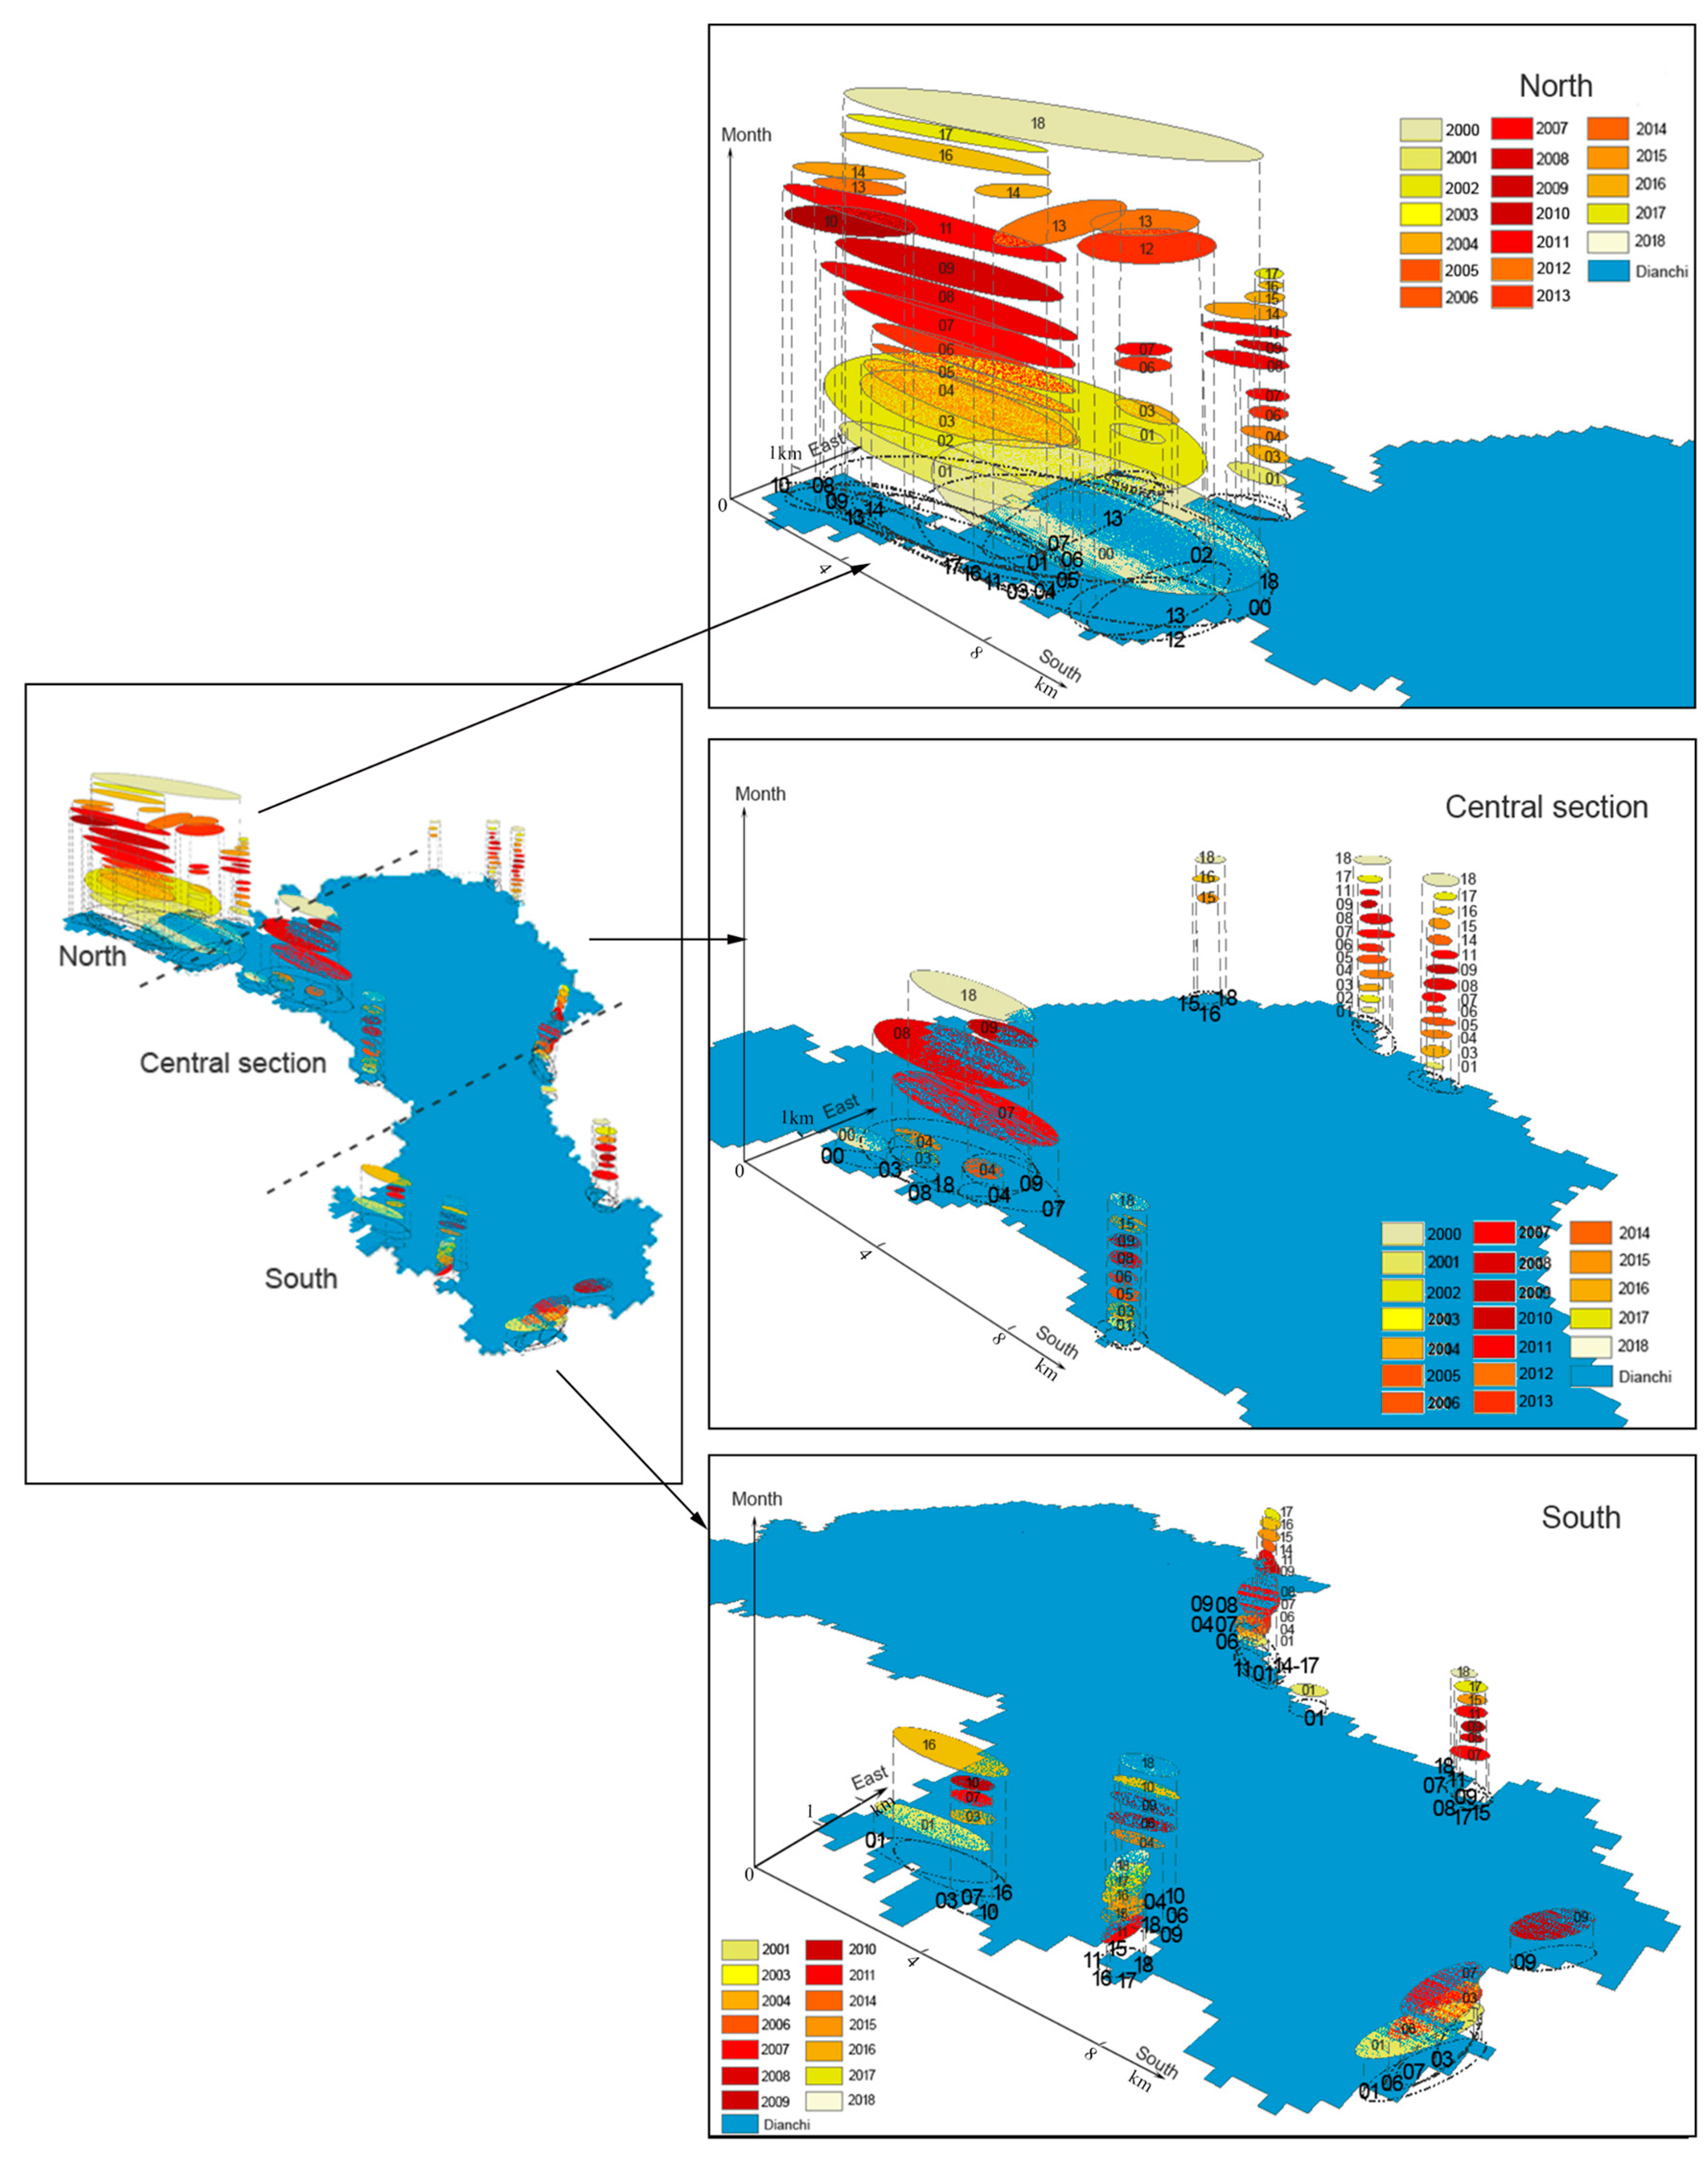
3.2.3. Temporal-Spatial Distributions of Pixel-Algae Frequency
3.3. Influencing Factors of Algal Blooms
3.3.1. Daily Influencing Factors of Algal Blooms
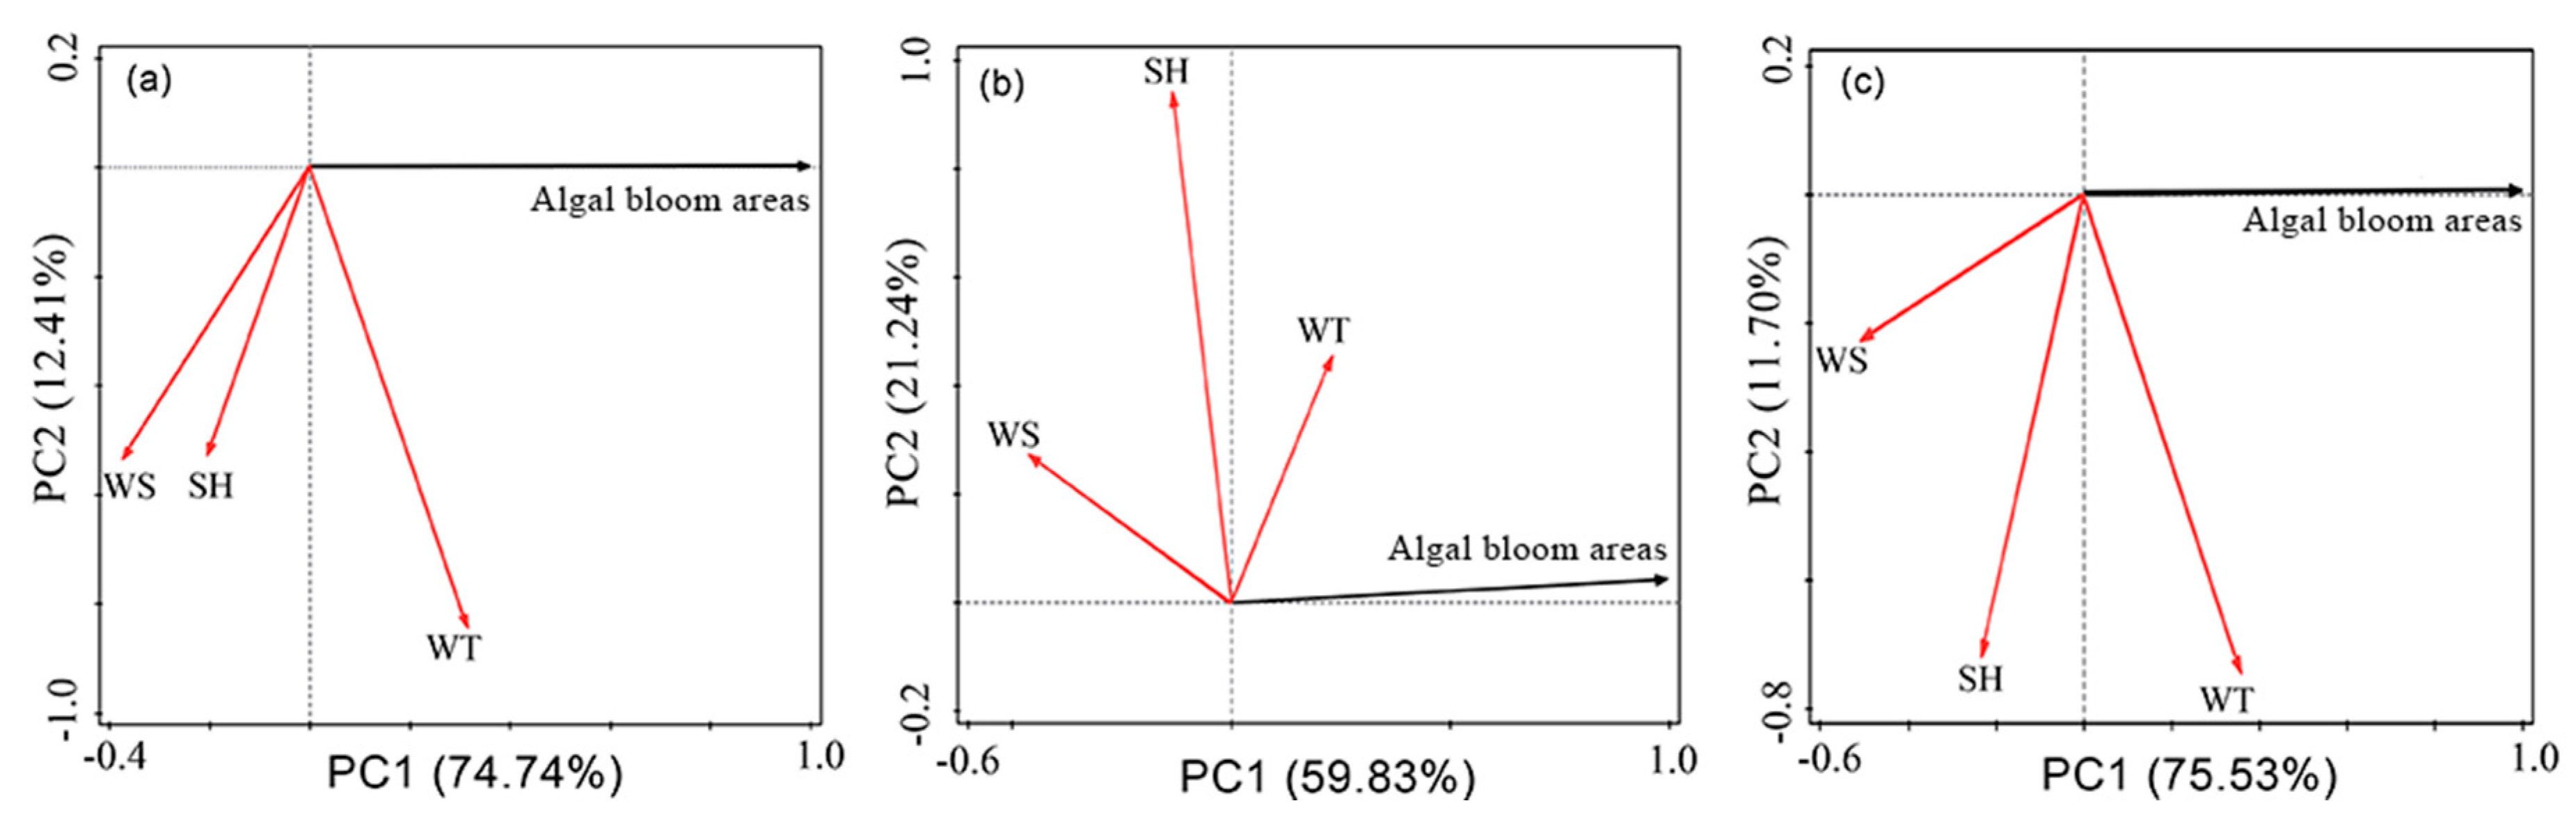
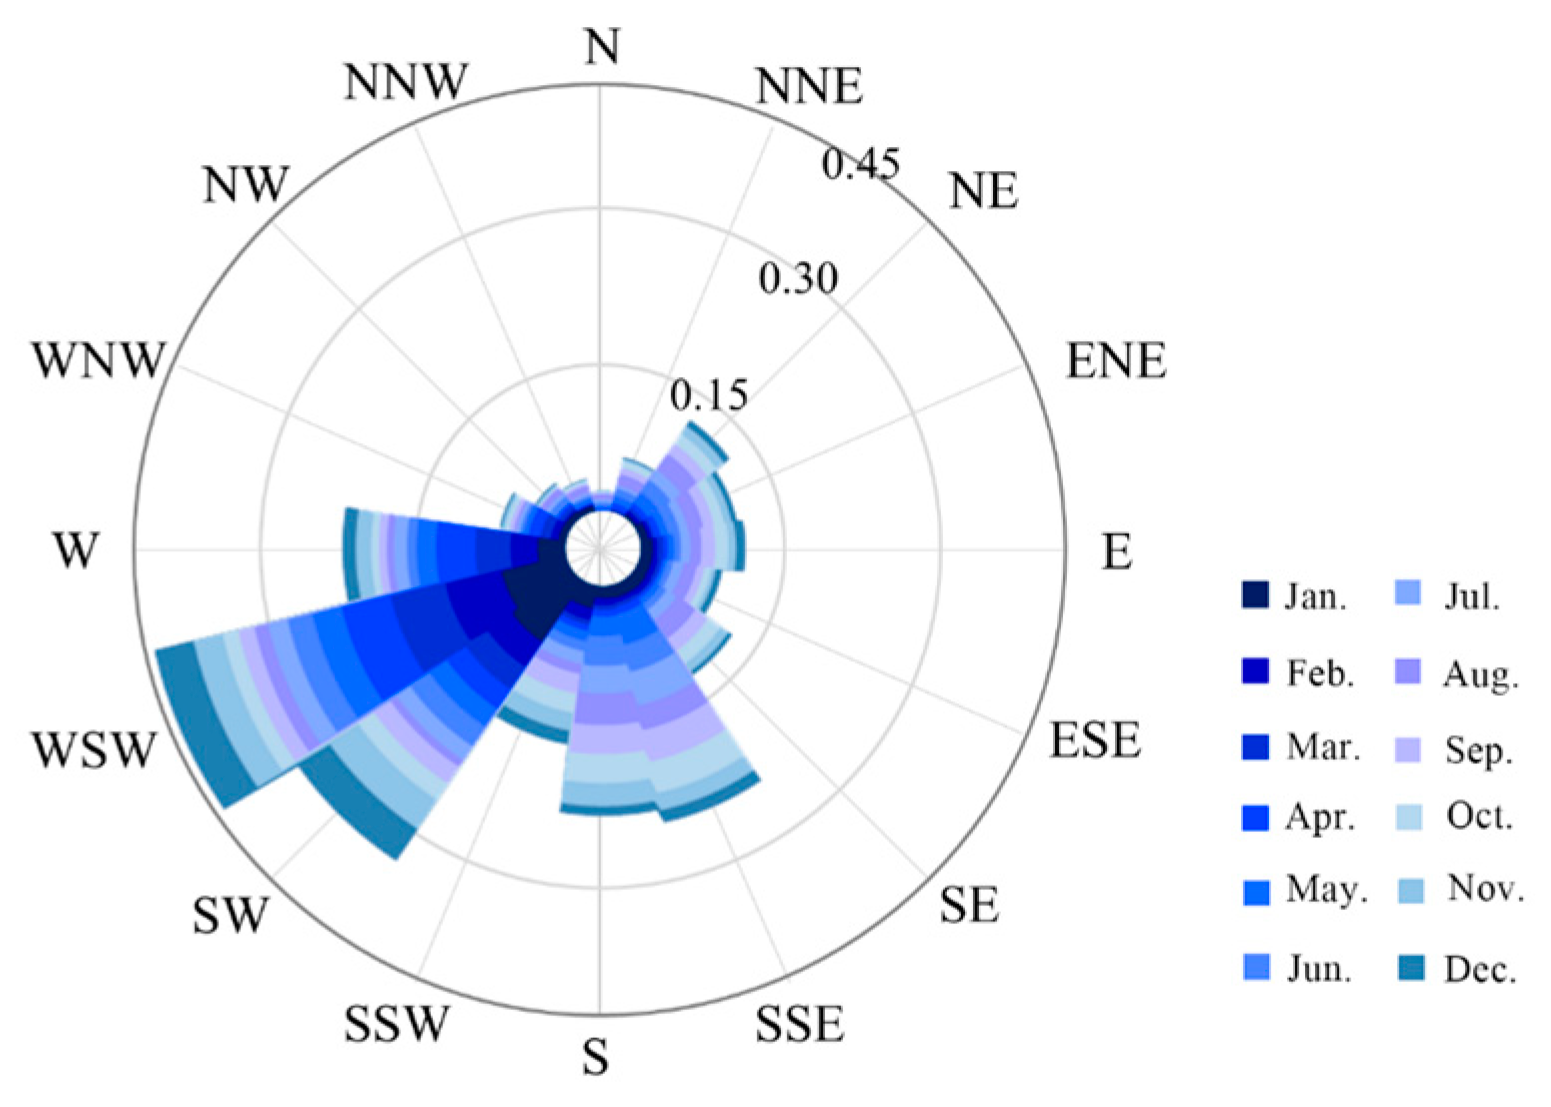
3.3.2. Monthly Influencing Factors of Algal Blooms
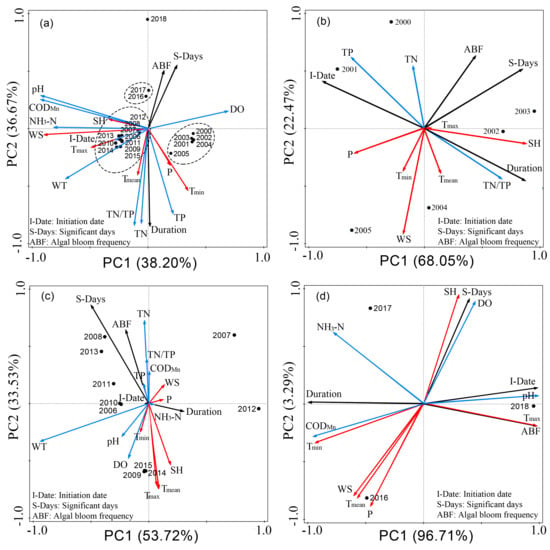
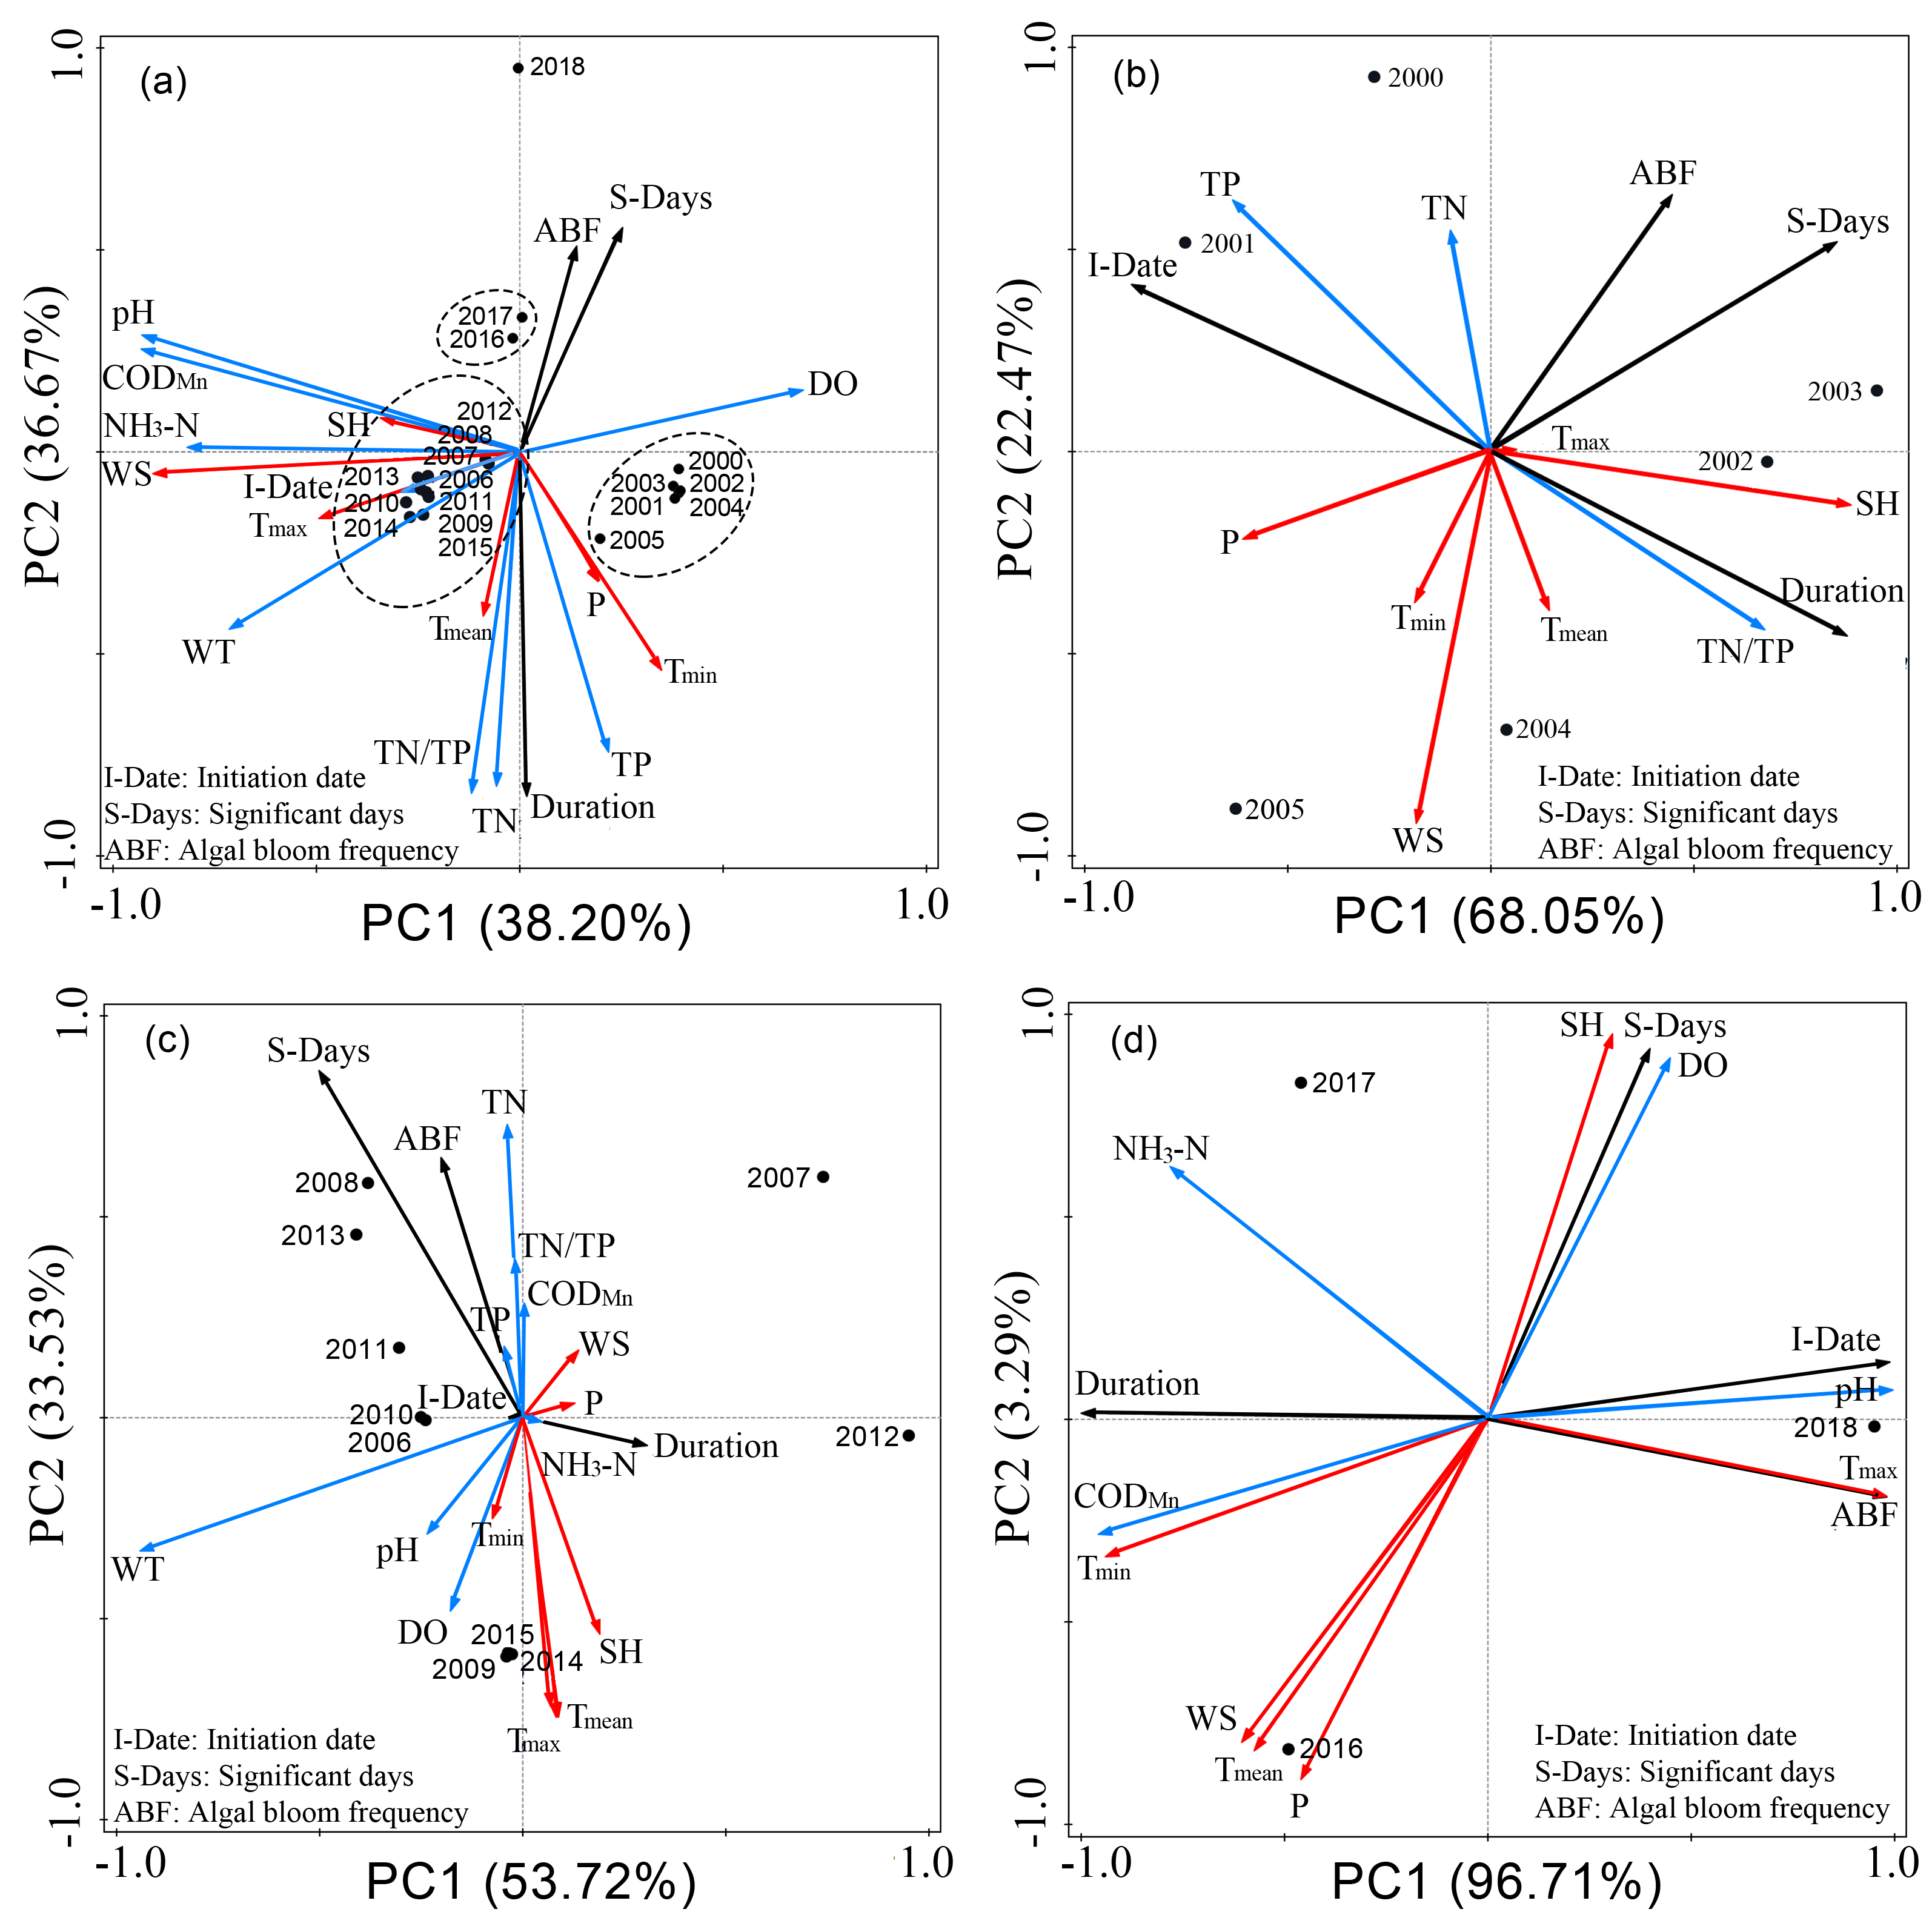
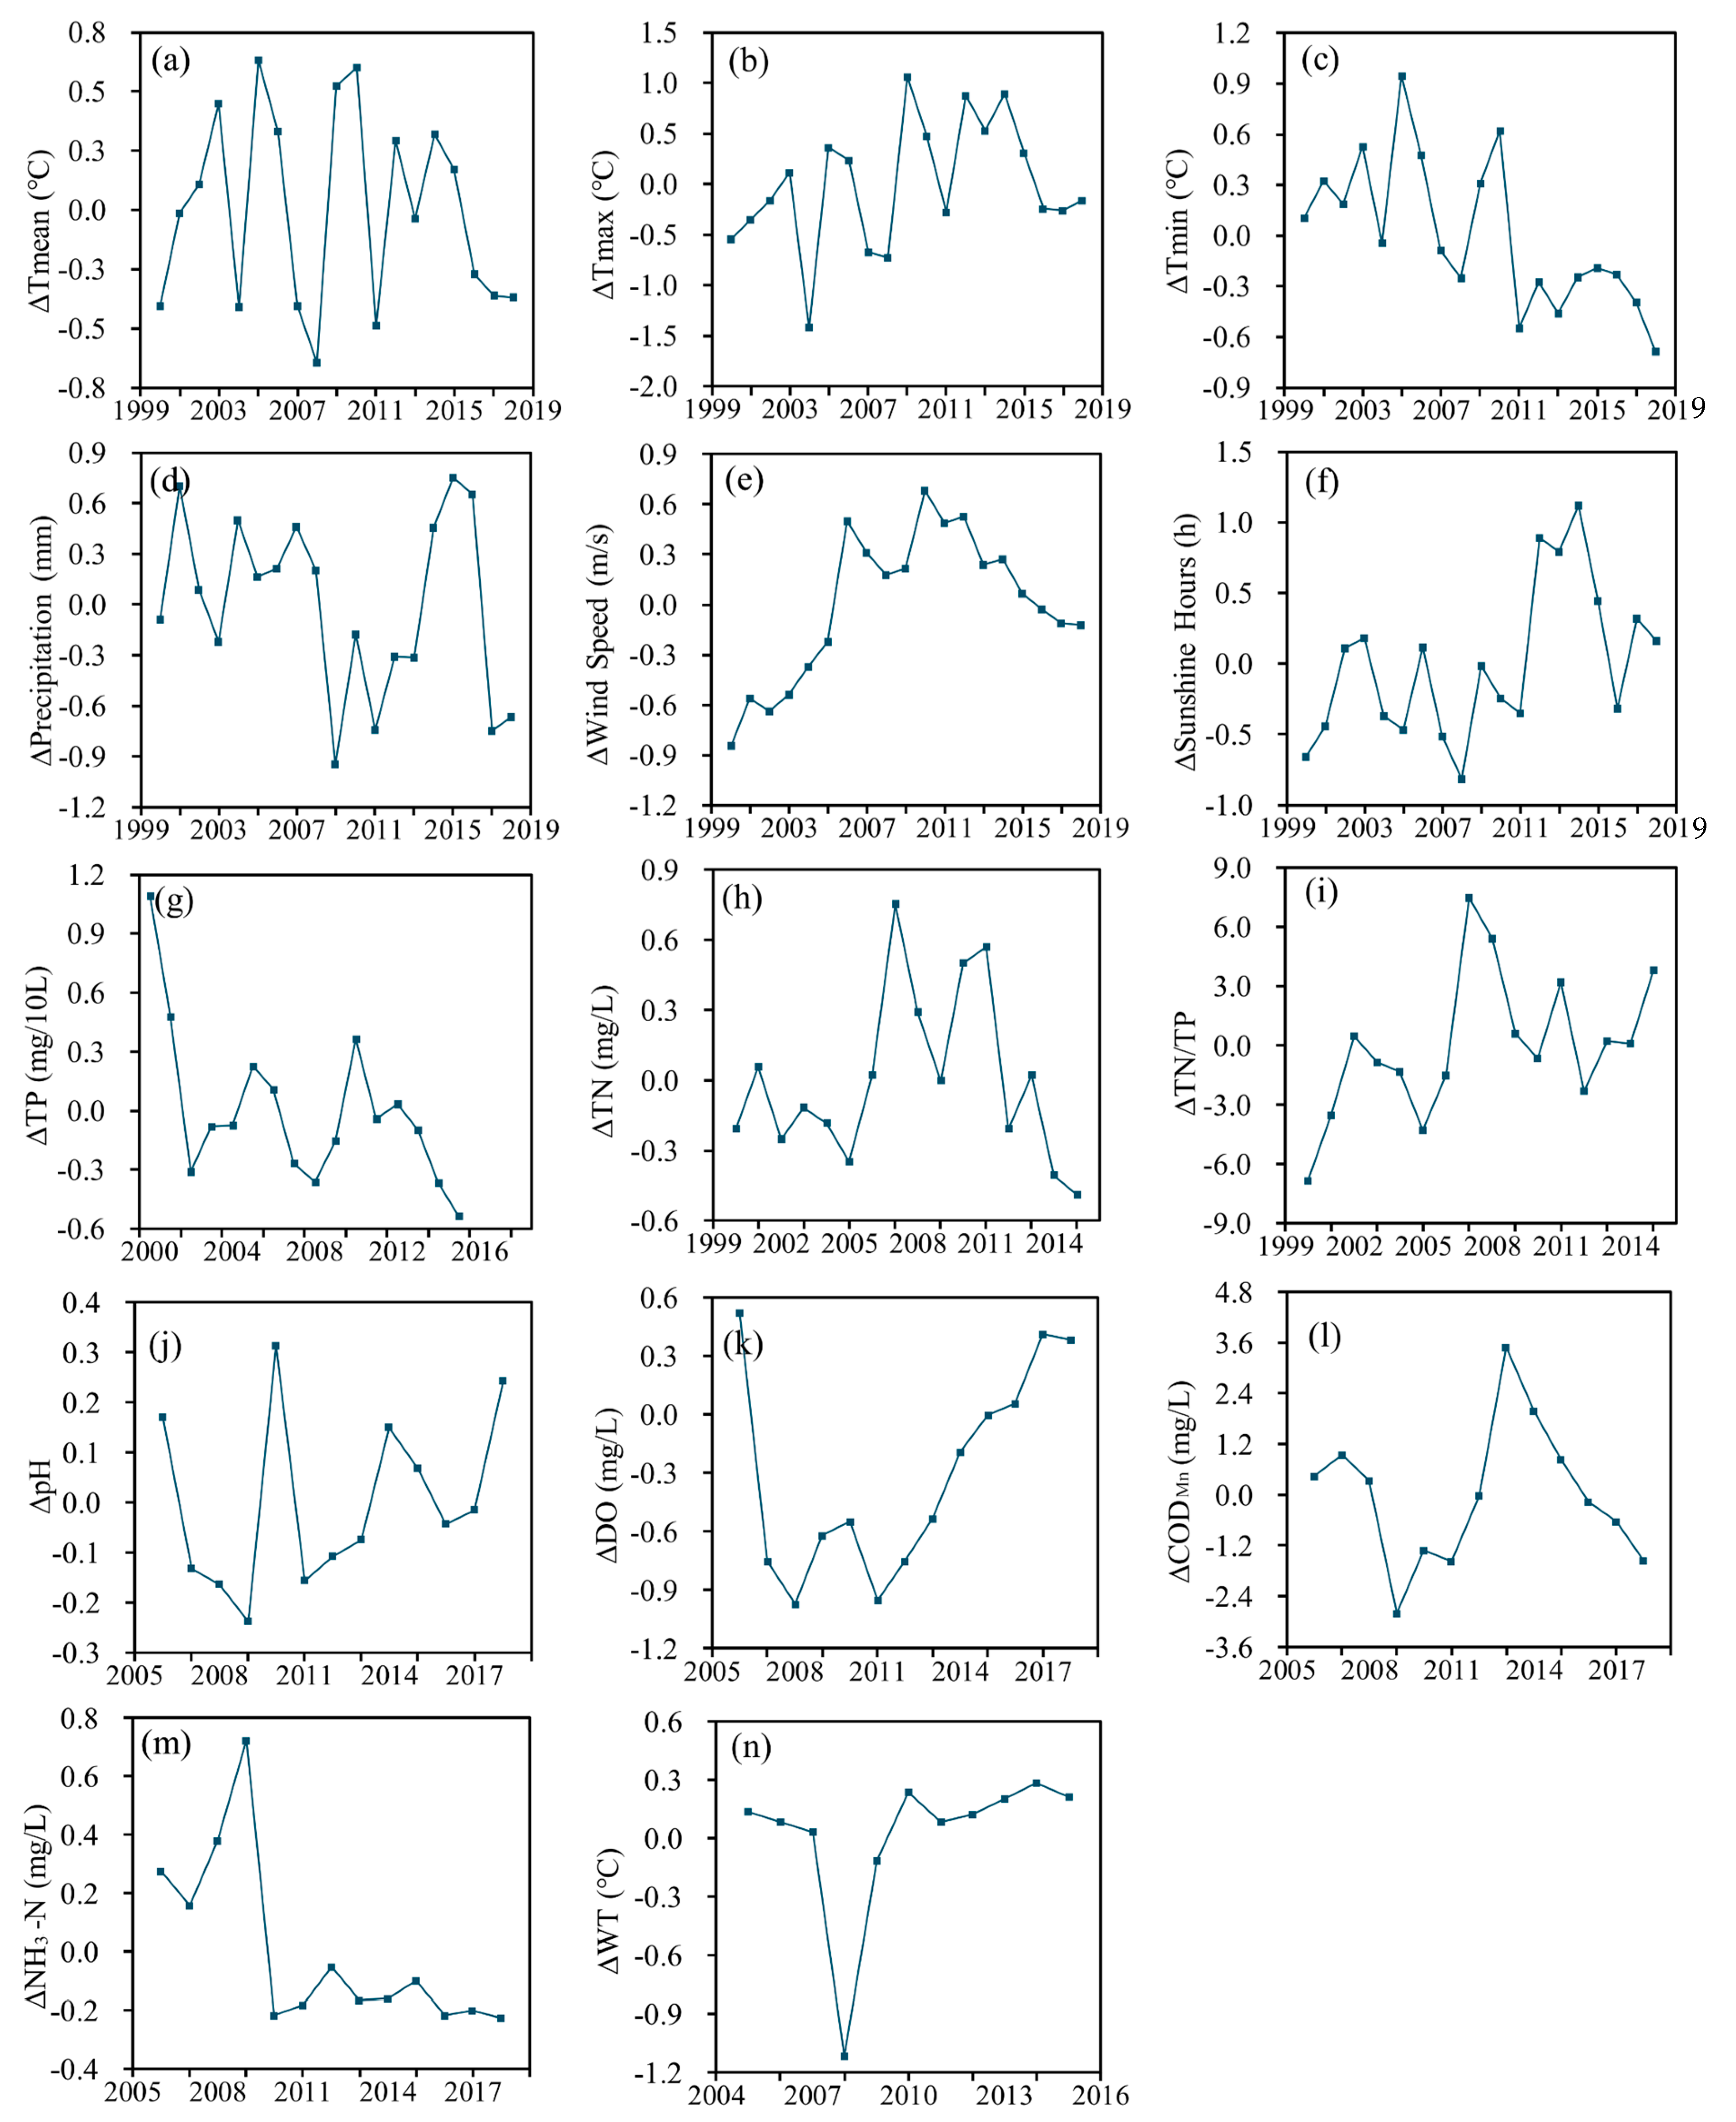
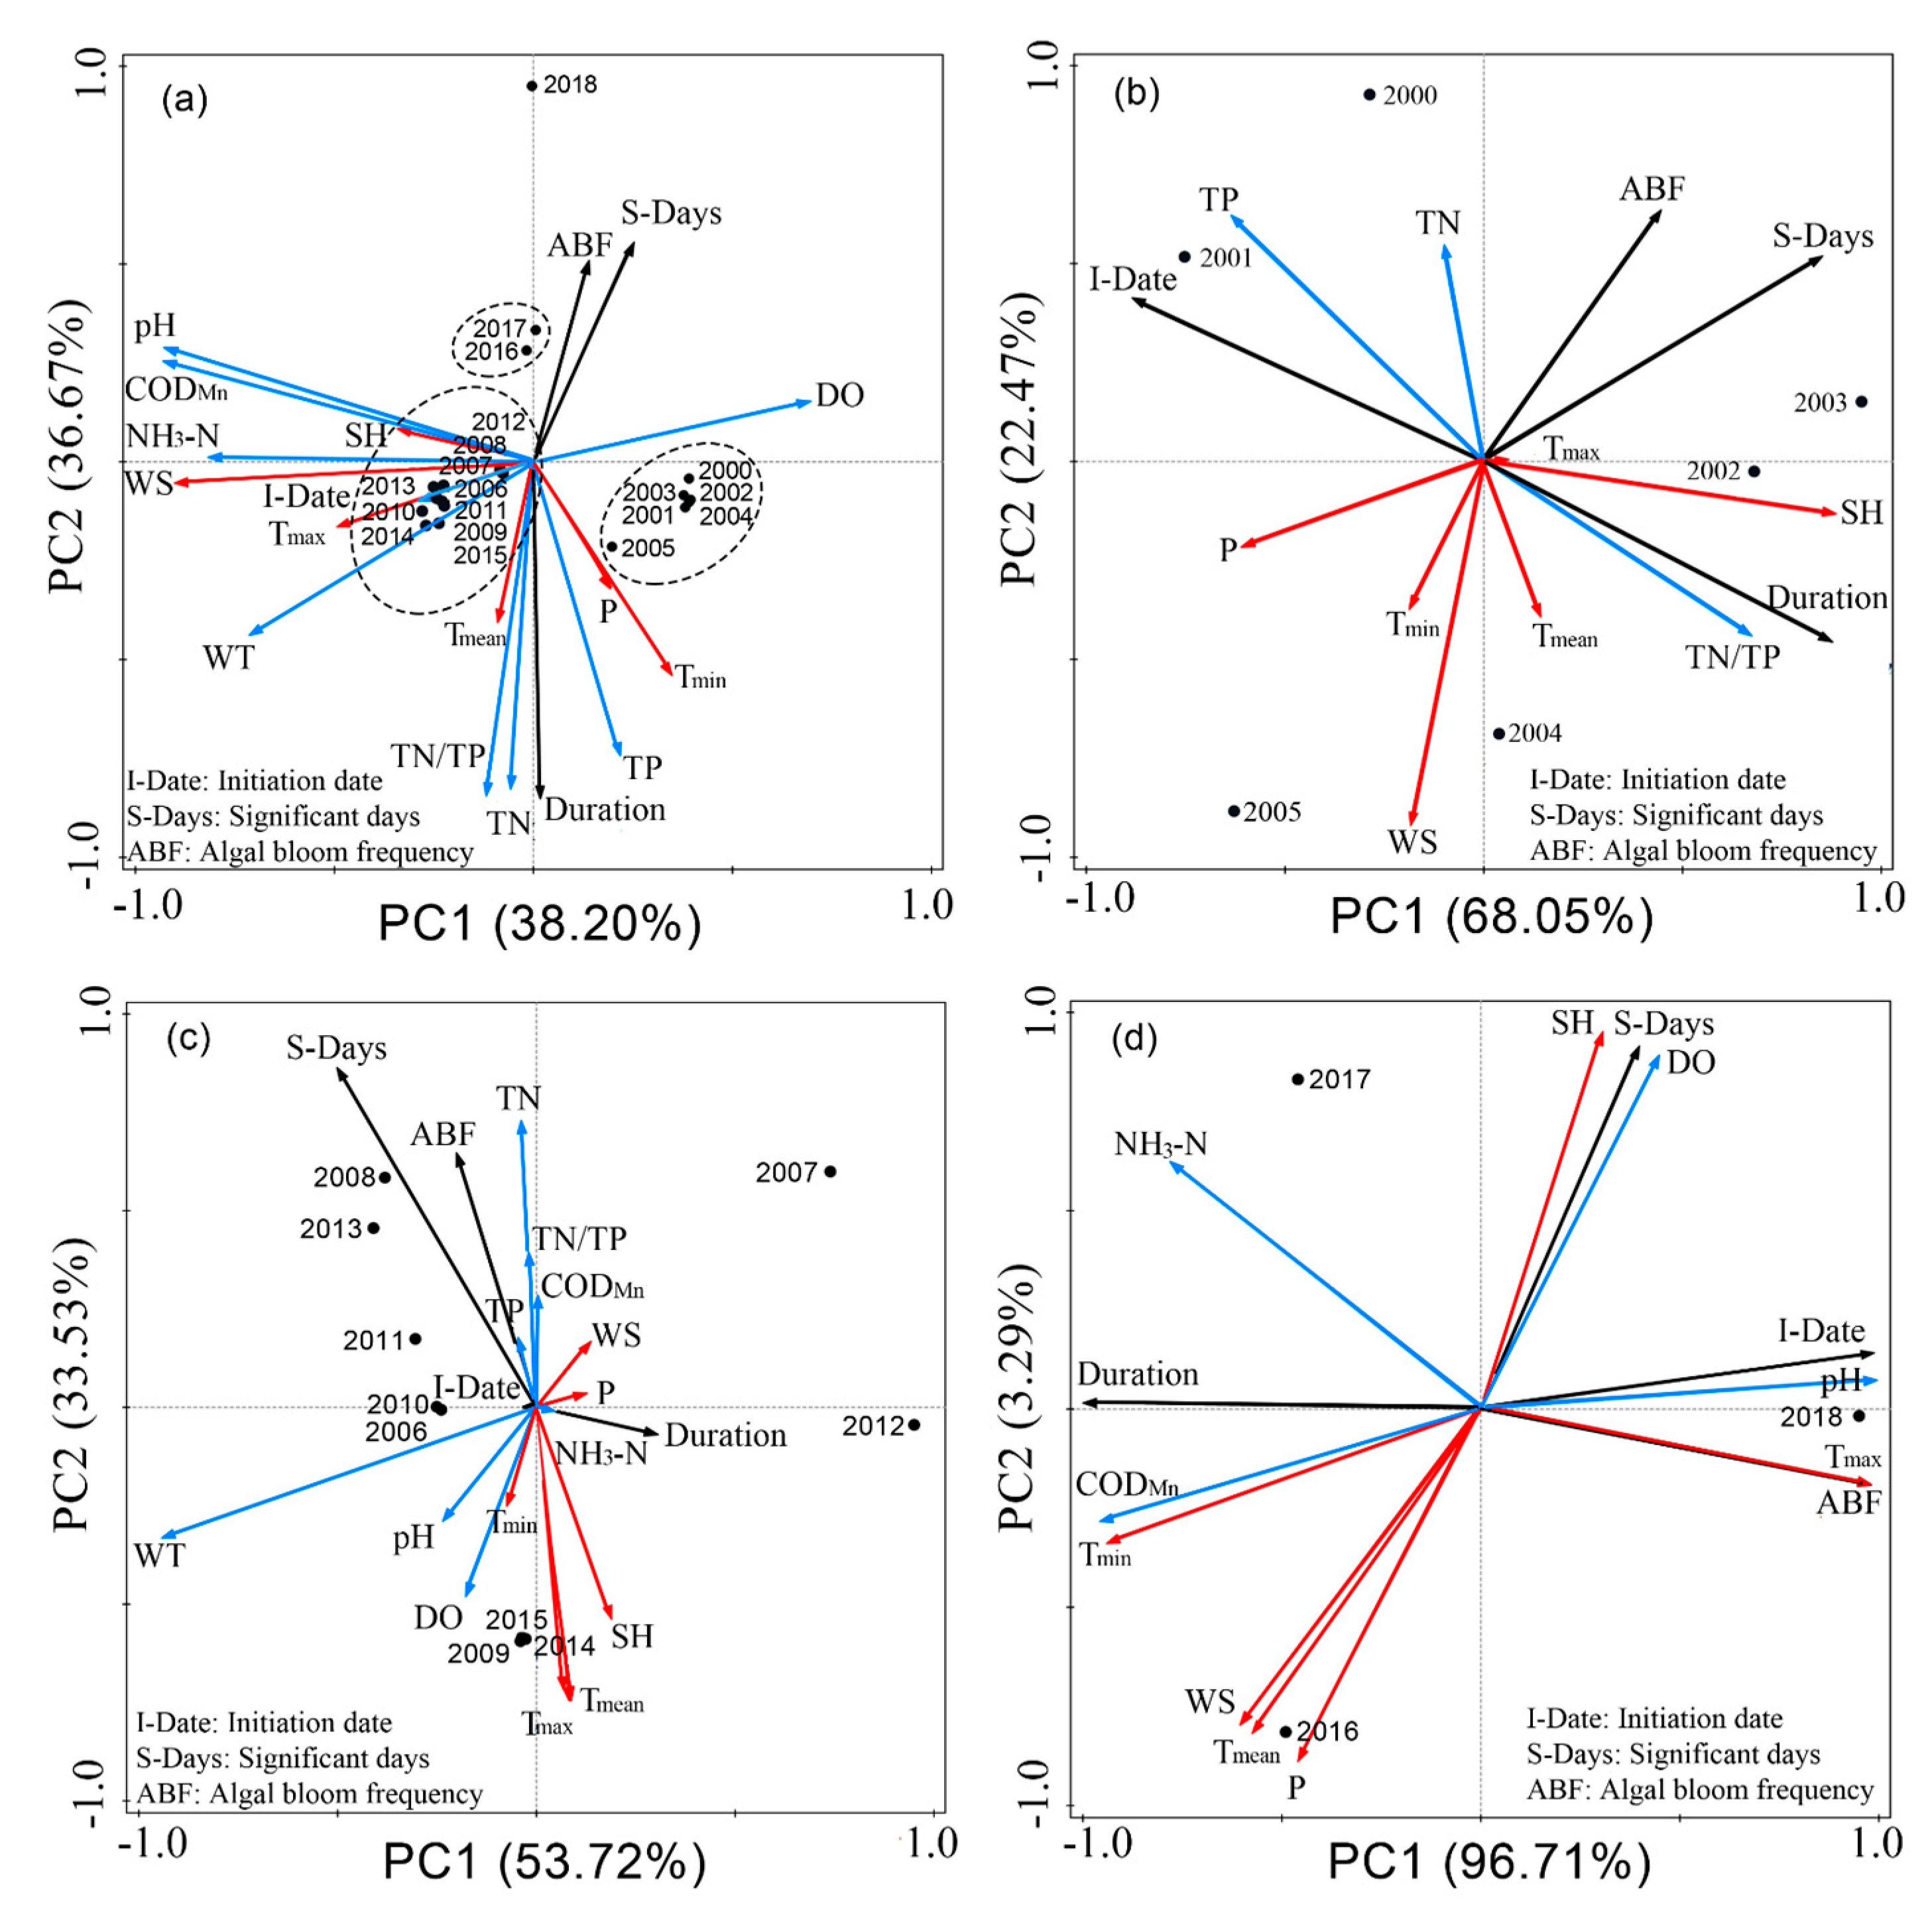
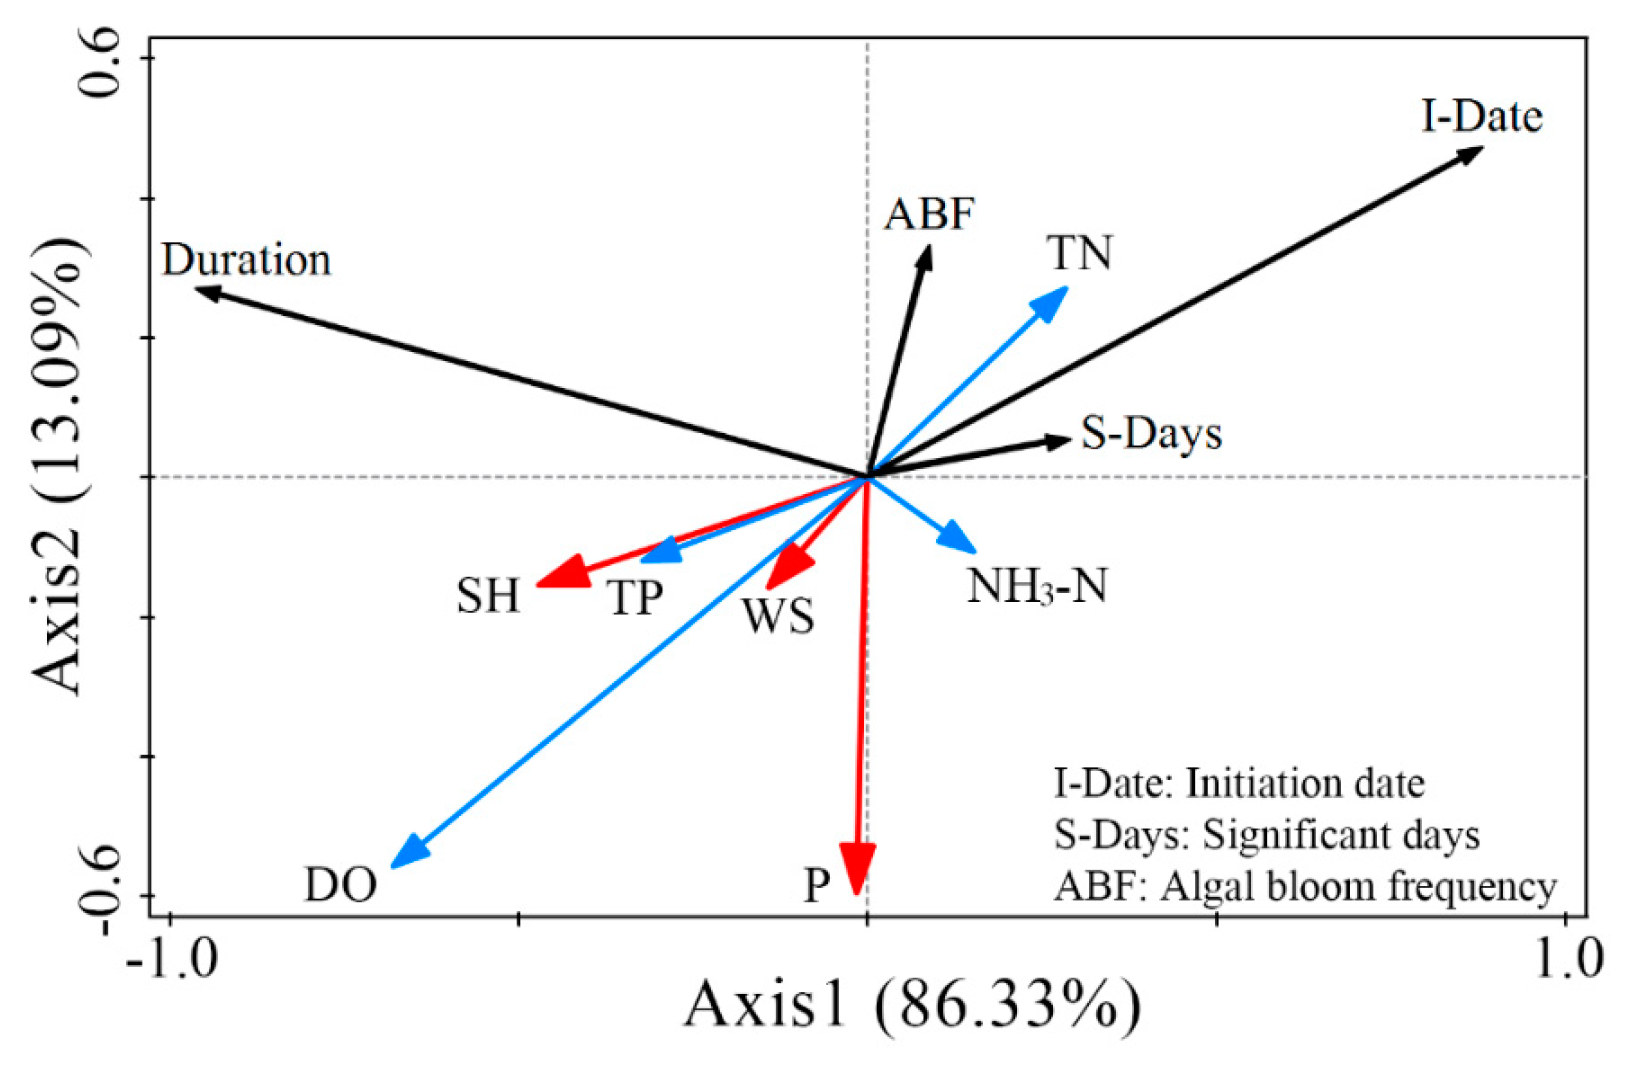
3.3.3. Yearly Influencing Factors of Algal Blooms
4. Discussions
4.1. Meteorological and Water Quality Drivers
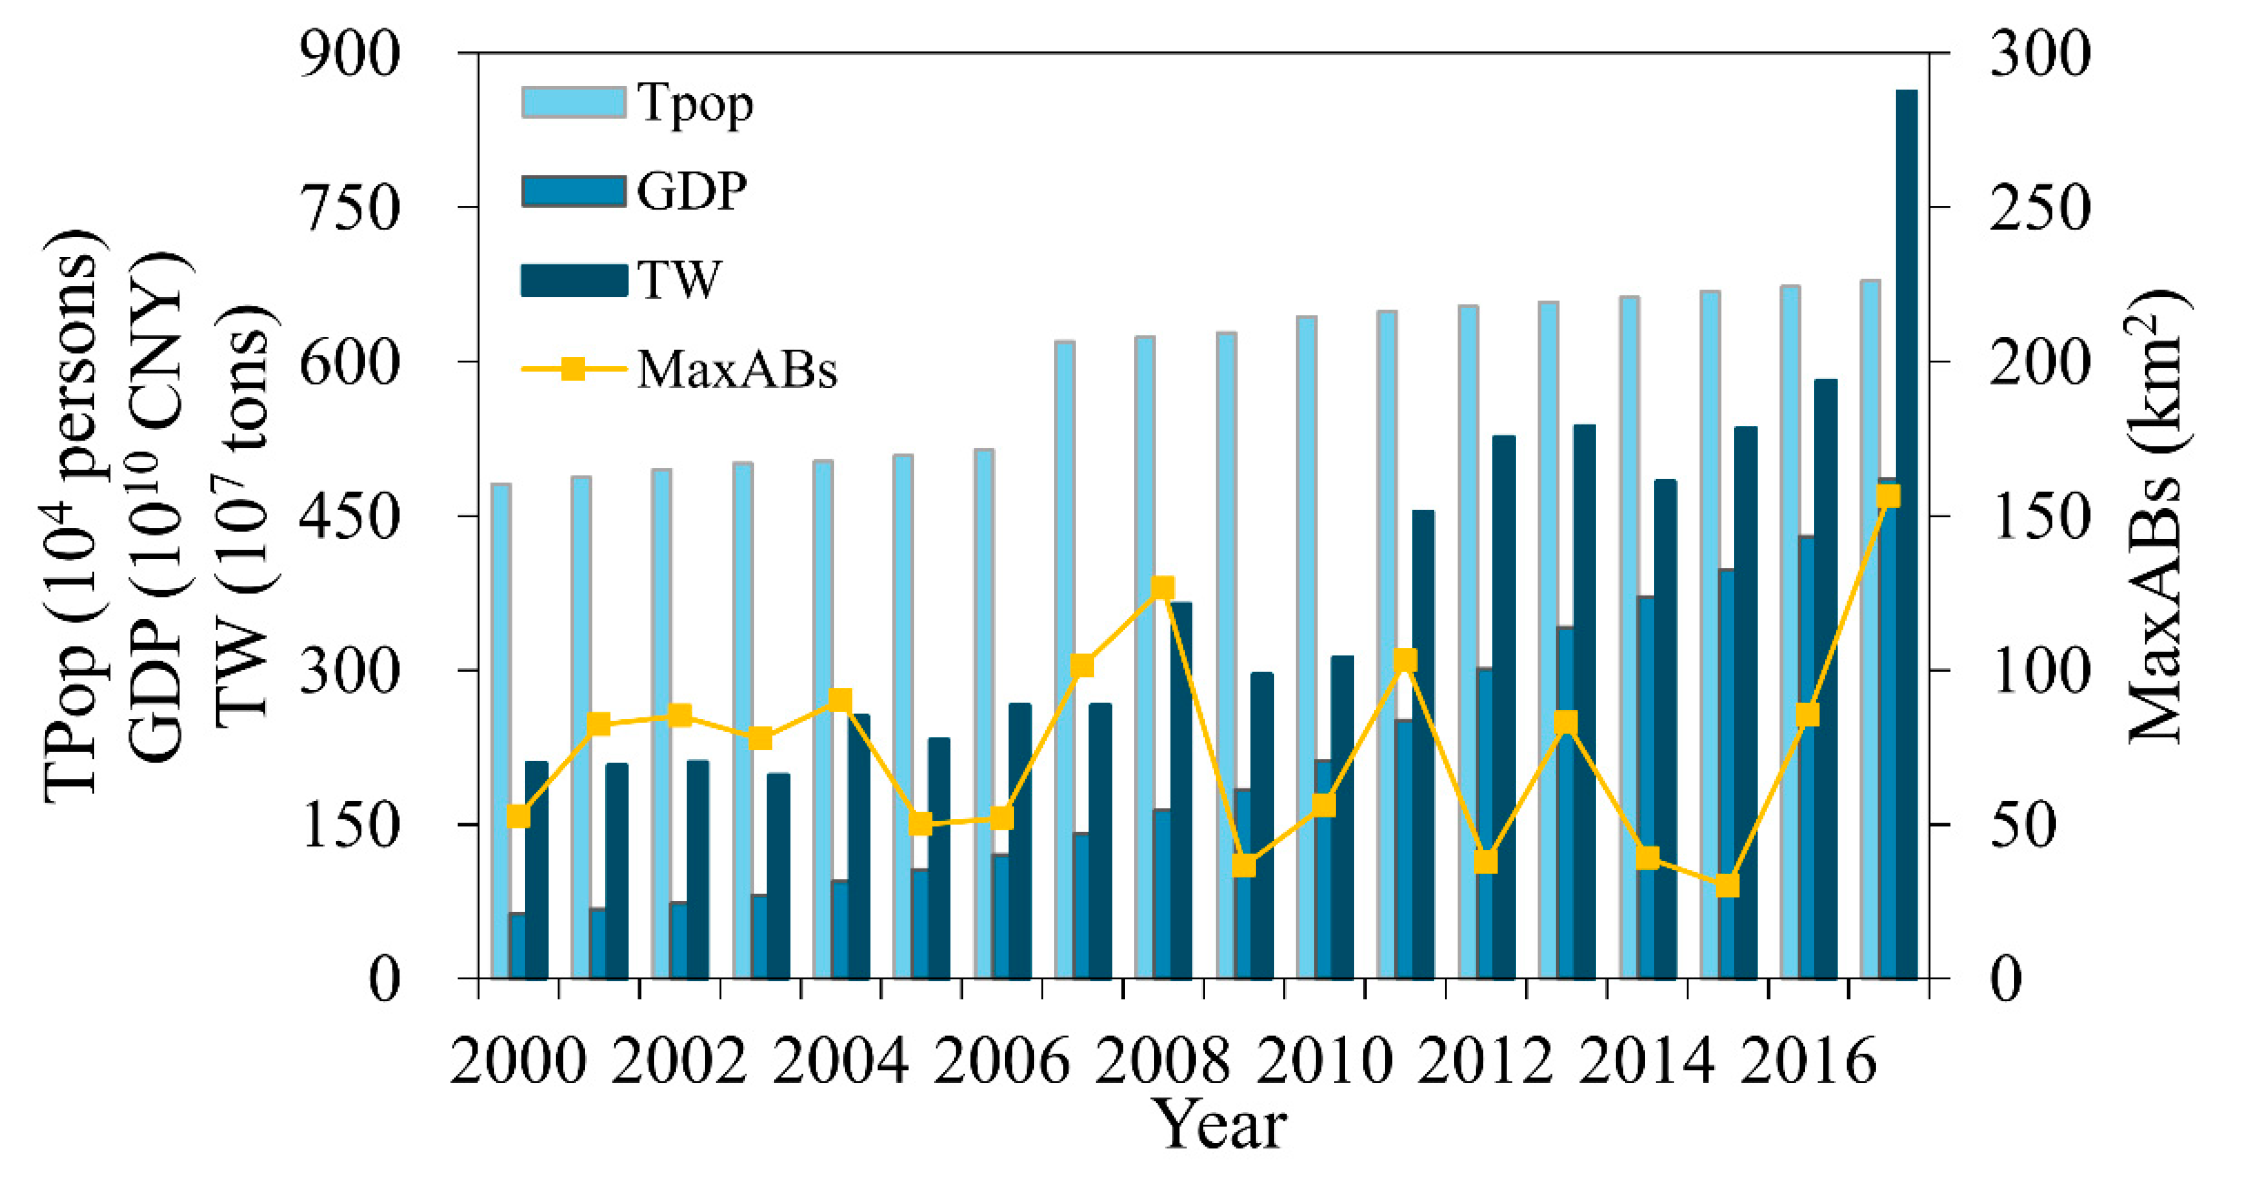
4.2. Human Activities
5. Conclusions
Author Contributions
Funding
Acknowledgments
Conflicts of Interest
References
- Wu, Z.; Liu, Y.; Liang, Z.; Wu, S.; Guo, H. Internal cycling, not external loading, decides the nutrient limitation in eutrophic lake: A dynamic model with temporal Bayesian hierarchical inference. Water Res. 2017, 116, 231–240. [Google Scholar] [CrossRef] [PubMed]
- Pan, M.; Gao, L. Influence of socio-economic development of Dianchi Lake Basin on water quality change of Dianchi Lake. Chin. Eng. Sci. 2010, 12, 117–122. [Google Scholar]
- Li, X.; Janssen, A.B.G.; de Klein, J.J.M.; Kroeze, C.; Strokal, M.; Ma, L.; Zheng, Y. Modeling nutrients in Lake Dianchi (China) and its watershed. Agric. Water Manag. 2019, 212, 48–59. [Google Scholar] [CrossRef]
- Zhang, T.; Zeng, W.H.; Wang, S.R.; Ni, Z.K. Temporal and spatial changes of water quality and management strategies of Dianchi Lake in southwest China. Hydrol. Earth Syst. Sci. Discuss. 2013, 10, 15409–15432. [Google Scholar] [CrossRef]
- Wang, J.H.; Yang, C.; He, L.Q.; Dao, G.H.; Du, J.S.; Han, Y.P.; Wu, G.X.; Wu, Q.Y.; Hu, H.Y. Meteorological factors and water quality changes of Plateau Lake Dianchi in China (1990–2015) and their joint influences on cyanobacterial blooms. Sci. Total Environ. 2019, 665, 406–418. [Google Scholar] [CrossRef]
- Liu, Y.; Li, Y.; Yang, X.; Zhang, J.; Guan, J.; Wang, J.; Zhang, H.; Xu, C. Analysis of pollution in Dianchi Lake and consideration of its application in crop planting. Procedia Environ. Sci. 2012, 12, 174–183. [Google Scholar] [CrossRef]
- Li, Z.; Zheng, Y.; Zhang, D. Impacts of 20-year socio-economic development on aquatic environment of Lake Dianchi Basin. J. Lake Sci. 2012, 24, 875–882. [Google Scholar] [Green Version]
- Paerl, H.W.; Ustach, J.F. Blue-green algal scums: An explanation for their occurrence during freshwater blooms. Limnol. Oceanogr. 1982, 27, 212–217. [Google Scholar] [CrossRef]
- Li, Y.; Zhang, M.; Wang, R. The temporal and spation variation of the cyanobacteria which caused the water bloom in the Dianchi Lake, Kunming, China. J. Yunnan Univ. 2005, 27, 272–276. [Google Scholar]
- Huang, C.; Wang, X.; Yang, H.; Li, Y.; Wang, Y.; Chen, X.; Xu, L. Satellite data regarding the eutrophication response to human activities in the plateau lake Dianchi in China from 1974 to 2009. Sci. Total Environ. 2014, 485–486, 1–11. [Google Scholar] [CrossRef]
- Merel, S.; Walker, D.; Chicana, R.; Snyder, S.; Baures, E.; Thomas, O. State of knowledge and concerns on cyanobacterial blooms and cyanotoxins. Environ. Int. 2013, 59, 303–327. [Google Scholar] [CrossRef] [PubMed]
- Yu, G.; Jiang, Y.; Song, G.; Tan, W.; Zhu, M.; Li, R. Variation of Microcystis and microcystins coupling nitrogen and phosphorus nutrients in Lake Erhai, a drinking-water source in Southwest Plateau, China. Environ. Sci. Pollut. Res. Int. 2014, 21, 9887–9898. [Google Scholar] [CrossRef] [PubMed]
- Jiang, D. Spatio-Temporal Variation and Driving Factor Analysis of Algae Blooms in Dianchi Lake Based on GIS/RS. Master’s Thesis, Southwest University, Chongqing, China, 2015. [Google Scholar]
- Brooks, B.W.; Lazorchak, J.M.; Howard, M.D.; Johnson, M.V.; Morton, S.L.; Perkins, D.A.; Reavie, E.D.; Scott, G.I.; Smith, S.A.; Steevens, J.A. Are harmful algal blooms becoming the greatest inland water quality threat to public health and aquatic ecosystems? Environ. Toxicol. Chem. 2016, 35, 6–13. [Google Scholar] [CrossRef] [PubMed]
- Li, H.; Hou, G.; Dakui, F.; Xiao, B.; Song, L.; Liu, Y. Prediction and elucidation of the population dynamics of Microcystis spp. in Lake Dianchi (China) by means of artificial neural networks. Ecol. Inform. 2007, 2, 184–192. [Google Scholar] [CrossRef]
- Christiansen, G.; Fastner, J.; Erhard, M.; Borner, T.; Dittmann, E. Microcystin biosynthesis in Planktothrix: Genes, evolution, and manipulation. J. Bacteriol. 2003, 185, 564–572. [Google Scholar] [CrossRef]
- Wu, Y.; Li, L.; Gan, N.; Zheng, L.; Ma, H.; Shan, K.; Liu, J.; Xiao, B.; Song, L. Seasonal dynamics of water bloom-forming Microcystis morphospecies and the associated extracellular microcystin concentrations in large, shallow, eutrophic Dianchi Lake. J. Environ. Sci. 2014, 26, 1921–1929. [Google Scholar] [CrossRef]
- Ma, H.; Wu, Y.; Gan, N.; Zheng, L.; Li, T.; Song, L. Growth inhibitory effect of Microcystis on Aphanizomenon flos-aquae isolated from cyanobacteria bloom in Lake Dianchi, China. Harmful Algae 2015, 42, 43–51. [Google Scholar] [CrossRef]
- Wang, S.; Zhu, L.; Li, Q.; Li, G.; Li, L.; Song, L.; Gan, N. Distribution and population dynamics of potential anatoxin-a-producing cyanobacteria in Lake Dianchi, China. Harmful Algae 2015, 48, 63–68. [Google Scholar] [CrossRef]
- Cirés, S.; Wörmer, L.; Timón, J.; Wiedner, C.; Quesada, A. Cylindrospermopsin production and release by the potentially invasive cyanobacterium Aphanizomenon ovalisporum under temperature and light gradients. Harmful Algae 2011, 10, 668–675. [Google Scholar] [CrossRef]
- Zhao, C.S.; Shao, N.F.; Yang, S.T.; Ren, H.; Ge, Y.R.; Zhang, Z.S.; Feng, P.; Liu, W.L. Quantitative assessment of the effects of human activities on phytoplankton communities in lakes and reservoirs. Sci. Total Environ. 2019, 665, 213–225. [Google Scholar] [CrossRef]
- Wang, J.; He, L.; Yang, C.; Dao, G.; Du, J.; Han, Y.; Wu, G.; Wu, Q.; Hu, H. Comparison of algal bloom related meteorological and water quality factors and algal bloom conditions among Lakes Taihu, Chaohu, and Dianchi (1981–2015). J. Lake Sci. 2018, 30, 897–906. [Google Scholar]
- Shan, K.; Li, L.; Wang, X.; Wu, Y.; Hu, L.; Yu, G.; Song, L. Modelling ecosystem structure and trophic interactions in a typical cyanobacterial bloom-dominated shallow Lake Dianchi, China. Ecol. Model. 2014, 291, 82–95. [Google Scholar] [CrossRef]
- Li, G.; Li, L.; Pan, M.; Xie, Z.; Li, Z.; Xiao, B.; Liu, G.; Chen, J.; Song, L. The degradation cause and pattern characteristics of Lake Dianchi ecosystem and new restoration of ecoregion and step-by-step implementation. J. Lake Sci. 2014, 26, 485–496. [Google Scholar]
- Liu, Y.; Wang, Z.; Guo, H.; Yu, S.; Sheng, H. Modelling the effect of weather conditions on cyanobacterial bloom outbreaks in Lake Dianchi: A rough decision-adjusted logistic regression model. Environ. Model. Assess. 2013, 18, 199–207. [Google Scholar] [CrossRef]
- Sheng, H.; Liu, H.; Wang, C.; Guo, H.; Liu, Y.; Yang, Y. Analysis of cyanobacteria bloom in the Waihai part of Dianchi Lake, China. Ecol. Inform. 2012, 10, 37–48. [Google Scholar] [CrossRef]
- Zhou, Q.; Zhang, Y.; Lin, D.; Shan, K.; Luo, Y.; Zhao, L.; Tan, Z.; Song, L. The relationships of meteorological factors and nutrient levels with phytoplankton biomass in a shallow eutrophic lake dominated by cyanobacteria, Lake Dianchi from 1991 to 2013. Environ. Sci. Pollut. Res. Int. 2016, 23, 15616–15626. [Google Scholar] [CrossRef]
- Cao, X.; Wang, Y.; He, J.; Luo, X.; Zheng, Z. Phosphorus mobility among sediments, water and cyanobacteria enhanced by cyanobacteria blooms in eutrophic Lake Dianchi. Environ. Pollut. 2016, 219, 580–587. [Google Scholar] [CrossRef]
- Shi, K.; Zhang, Y.; Zhang, Y.; Li, N.; Qin, B.; Zhu, G.; Zhou, Y. Phenology of phytoplankton blooms in a trophic lake observed from long-term MODIS data. Environ. Sci. Technol. 2019, 53, 2324–2331. [Google Scholar] [CrossRef]
- Hu, M.; Zhang, Y.; Ma, R.; Zhang, Y. Spatial and temporal dynamics of floating algal blooms in Lake Chaohu in 2016 and their environmental drivers. Environ. Sci. 2018, 39, 4925–4937. [Google Scholar]
- Tao, M.; Duan, H.; Cao, Z.; Loiselle, S.; Ma, R. A hybrid EOF algorithm to improve MODIS cyanobacteria phycocyanin data quality in a highly Turbid lake: Bloom and nonbloom condition. IEEE J. Sel. Top. Appl. Earth Obs. Remote Sens. 2017, 10, 4430–4444. [Google Scholar] [CrossRef]
- Shi, K.; Zhang, Y.; Zhou, Y.; Liu, X.; Zhu, G.; Qin, B.; Gao, G. Long-term MODIS observations of cyanobacterial dynamics in Lake Taihu: Responses to nutrient enrichment and meteorological factors. Sci. Rep. 2017, 7, 40326. [Google Scholar] [CrossRef] [PubMed] [Green Version]
- Liang, Q.; Zhang, Y.; Ma, R.; Loiselle, S.; Li, J.; Hu, M. A MODIS-based novel method to distinguish surface cyanobacterial scums and aquatic macrophytes in Lake Taihu. Remote Sens. 2017, 9, 133. [Google Scholar] [CrossRef]
- Li, J.; Zhang, Y.; Ma, R.; Duan, H.; Loiselle, S.; Xue, K.; Liang, Q. Satellite-based estimation of column-integrated algal biomass in nonalgae bloom conditions: A case study of Lake Chaohu, China. IEEE J. Sel. Top. Appl. Earth Obs. Remote Sens. 2017, 10, 450–462. [Google Scholar] [CrossRef]
- Zhang, J.; Chen, L.; Chen, X. Monitoring the cyanobacterial blooms on remote sensing in Lake Erhai by FAI. J. Lake Sci. 2016, 28, 718–725. [Google Scholar]
- Woźniak, M.; Bradtke, K.; Darecki, M.; Krężel, A. Empirical model for phycocyanin concentration estimation as an indicator of cyanobacterial bloom in the optically complex coastal waters of the Baltic Sea. Remote Sens. 2016, 8, 212. [Google Scholar] [CrossRef]
- Lu, W.; Yu, L.; Ou, X.; Li, F. Relationship between occurrence frequency of cyanobacteria bloom and meteorological factors in Lake Dianchi. J. Lake Sci. 2017, 29, 534–545. [Google Scholar]
- Zhu, L. Remote sensing monitoring and annual statistical analysis of blue algae bloom in Dianchi Lake based on HJ-1CCD. In Proceedings of the 16th China Forum on Environmental Remote Sensing Application Technology, Nanning, China, 28 March–1 April 2012; p. 7. [Google Scholar]
- Zhao, D.; Li, J.; Hu, R.; Shen, Q.; Zhang, F. Landsat-satellite-based analysis of spatial–temporal dynamics and drivers of CyanoHABs in the plateau Lake Dianchi. Int. J. Remote Sens. 2018, 39, 8552–8571. [Google Scholar] [CrossRef]
- Hu, C. A novel ocean color index to detect floating algae in the global oceans. Remote Sens. Environ. 2009, 113, 2118–2129. [Google Scholar] [CrossRef]
- Hu, C.; Lee, Z.; Ma, R.; Yu, K.; Li, D.; Shang, S. Moderate resolution imaging spectroradiometer (MODIS) observations of cyanobacteria blooms in Taihu Lake, China. J. Geophys. Res. 2010, 115, C04002. [Google Scholar] [CrossRef]
- Oyama, Y.; Fukushima, T.; Matsushita, B.; Matsuzaki, H.; Kamiya, K.; Kobinata, H. Monitoring levels of cyanobacterial blooms using the visual cyanobacteria index (VCI) and floating algae index (FAI). Int. J. Appl. Earth Obs. Geoinf. 2015, 38, 335–348. [Google Scholar] [CrossRef]
- Tang, X.; Shen, M.; Duan, H. Temporal and spatial distribution of algal blooms in Lake Chaohu, 2000–2015. J. Lake Sci. 2017, 29, 276–284. [Google Scholar]
- Zhang, Y.; Ma, R.; Duan, H.; Loiselle, S.A.; Xu, J.; Ma, M. A novel algorithm to estimate algal bloom coverage to subpixel resolution in Lake Taihu. IEEE J. Sel. Top. Appl. Earth Obs. Remote Sens. 2014, 7, 3060–3068. [Google Scholar] [CrossRef]
- Zhang, Y.; Ma, R.; Duan, H.; Loiselle, S.; Xu, J. Satellite analysis to identify changes and drivers of CyanoHABs dynamics in Lake Taihu. Water Sci. Technol. Water Supply 2016, 16, 1451–1466. [Google Scholar] [CrossRef]
- Zhang, Y.; Ma, R.; Zhang, M.; Duan, H.; Loiselle, S.; Xu, J. Fourteen-year record (2000–2013) of the spatial and temporal dynamics of floating algae blooms in Lake Chaohu, observed from time series of MODIS images. Remote Sens. 2015, 7, 10523–10542. [Google Scholar] [CrossRef]
- Gao, W.; Howarth, R.W.; Swaney, D.P.; Hong, B.; Guo, H.C. Enhanced N input to Lake Dianchi Basin from 1980 to 2010: Drivers and consequences. Sci. Total Environ. 2015, 505, 376–384. [Google Scholar] [CrossRef]
- Gong, A.; Song, T.; Lin, Z. Cause of concrete carbonization erosion in Xiyuan Tunnel, Dianchi. Sci. Water Resour. 2007, 25, 110–112. [Google Scholar]
- Vermote, E.F.; Tanré, D.; Deuze, J.L.; Herman, M.; Morcette, J.J. Second simulation of the satellite signal in the solar spectrum, 6S: An overview. IEEE Trans. Geosci. Remote Sens. 1997, 35, 675–686. [Google Scholar] [CrossRef]
- Torbick, N.; Ziniti, B.; Stommel, E.; Linder, E.; Andrew, A.; Caller, T.; Haney, J.; Bradley, W.; Henegan, P.L.; Xun, S. Assessing cyanobacterial harmful algal blooms as risk factors for amyotrophic lateral sclerosis. Neurotox. Res. 2017, 33, 227. [Google Scholar] [CrossRef]
- Chun, Y.; Ko, Y.G.; Do, T.; Jung, Y.; Kim, S.W.; Chun, Y.J.; Choi, U.S. Electrorheological properties of algae dispersed suspension: New application of harmful algae. Colloids Surf. A 2018, 539, 354–363. [Google Scholar] [CrossRef]
- Knutson, C.M.; McLaughlin, E.M.; Barney, B.M. Effect of temperature control on green algae grown under continuous culture. Algal Res. 2018, 35, 301–308. [Google Scholar] [CrossRef]
- Wang, S.; Gao, Y.; Li, Q.; Gao, J.; Zhai, S.; Zhou, Y.; Cheng, Y. Long-term and inter-monthly dynamics of aquatic vegetation and its relation with environmental factors in Taihu Lake, China. Sci. Total Environ. 2019, 651, 367–380. [Google Scholar] [CrossRef] [PubMed]
- Guo, W.; Yang, F.; Li, Y.; Wang, S. New insights into the source of decadal increase in chemical oxygen demand associated with dissolved organic carbon in Dianchi Lake. Sci. Total Environ. 2017, 603–604, 699–708. [Google Scholar] [CrossRef] [PubMed]
- Liu, J.; Yang, Y.; Gao, J.; Jiang, J. Characteristics of cyanobacteria bloom grading and its temporal and spatial variation in Taihu Lake. Resour. Environ. Yangtze Basin 2011, 20, 156–160. [Google Scholar]
- He, Y.; Xiong, Q.; Luo, X.; Li, T.; Yu, L. Study on spatio-temporal changes of water bloom in Dianchi Lake based on NDVI. Ecol. Environ. Sci. 2019, 28, 555–563. [Google Scholar]
- Li, X.; Zhao, K.; Cong, G.; Jensen, C.S.; Wei, W. Deep representation learning for trajectory similarity computation. In Proceedings of the 2018 IEEE 34th International Conference on Data Engineering (ICDE), Paris, France, 16–19 April 2018. [Google Scholar]
- Gad, M.A.; Elshehaly, M.H.; Gračanin, D.; Elmongui, H.G. A tracking analyst for large 3D spatiotemporal data from multiple sources (case study: Tracking volcanic eruptions in the atmosphere). Comput. Geosci. 2018, 111, 283–293. [Google Scholar] [CrossRef]
- Yang, Y.; Chen, J.; Tong, T.; Li, B.; He, T.; Liu, Y.; Xie, S. Eutrophication influences methanotrophic activity, abundance and community structure in freshwater lakes. Sci. Total Environ. 2019, 662, 863–872. [Google Scholar] [CrossRef]
- Shan, K.; Song, L.; Chen, W.; Li, L.; Liu, L.; Wu, Y.; Jia, Y.; Zhou, Q.; Peng, L. Analysis of environmental drivers influencing interspecific variations and associations among bloom-forming cyanobacteria in large, shallow eutrophic lakes. Harmful Algae 2019, 84, 84–94. [Google Scholar] [CrossRef]
- Yang, K.; Yu, Z.; Luo, Y.; Yang, Y.; Zhao, L.; Zhou, X. Spatial and temporal variations in the relationship between lake water surface temperatures and water quality—A case study of Dianchi Lake. Sci. Total Environ. 2018, 624, 859–871. [Google Scholar] [CrossRef]
- Kong, F.; Gao, G. Hypothesis on cyanobacteria bloom-forming mechanism in large shallow eutrophic lakes. Acta Ecol. Sin. 2005, 25, 589–595. [Google Scholar]
- Zhou, Q.; Chen, W.; Shan, K.; Zheng, L.; Song, L. Influence of sunlight on the proliferation of cyanobacterial blooms and its potential applications in Lake Taihu, China. J. Environ. Sci. 2014, 26, 626–635. [Google Scholar] [CrossRef]
- Bormans, M.; Sherman, B.S.; Webster, I.T. Is buoyancy regulation in cyanobacteria an adaptation to exploit separation of light and nutrients? Mar. Freshw. Res. 1999, 50, 897–906. [Google Scholar] [CrossRef]
- Xiao, Y.; Gan, N.; Liu, J.; Zheng, L.; Song, L. Heterogeneity of buoyancy in response to light between two buoyant types of cyanobacterium Microcystis. Hydrobiologia 2011, 679, 297–311. [Google Scholar] [CrossRef]
- Wu, T.; Qin, B.; Zhu, G.; Luo, L.; Ding, Y.; Bian, G. Dynamics of cyanobacterial bloom formation during short-term hydrodynamic fluctuation in a large shallow, eutrophic, and wind-exposed Lake Taihu, China. Environ. Sci. Pollut. Res. Int. 2013, 20, 8546–8556. [Google Scholar] [CrossRef] [PubMed]
- Qin, B.; Li, W.; Zhu, G.; Zhang, Y.; Wu, T.; Gao, G. Cyanobacterial bloom management through integrated monitoring and forecasting in large shallow eutrophic Lake Taihu (China). J. Hazard. Mater. 2015, 287, 356–363. [Google Scholar] [CrossRef] [PubMed]
- Bresciani, M.; Adamo, M.; Carolis, G.D.; Matta, E.; Pasquariello, G.; Vaičiūtė, D.; Giardino, C. Monitoring blooms and surface accumulation of cyanobacteria in the Curonian Lagoon by combining MERIS and ASAR data. Remote Sens. Environ. 2014, 146, 124–135. [Google Scholar] [CrossRef]
- Zhang, M.; Duan, H.; Shi, X.; Yu, Y.; Kong, F. Contributions of meteorology to the phenology of cyanobacterial blooms: Implications for future climate change. Water Res. 2012, 46, 442–452. [Google Scholar] [CrossRef] [PubMed]
- Wang, W.; Li, Y.; Xu, X.; Du, W.; Wu, X. Study on spatial distribution characteristics of nutrients in Dianchi Lake in summer. Water Resour. Power 2016, 34, 36–39. [Google Scholar]
- Zhang, M.; Zhang, Y.; Yang, Z.; Wei, L.; Yang, W.; Chen, C.; Kong, F. Spatial and seasonal shifts in bloom-forming cyanobacteria in Lake Chaohu: Patterns and driving factors. Phycol. Res. 2016, 64, 44–55. [Google Scholar] [CrossRef]
- Kosten, S.; Huszar, V.L.M.; Bécares, E.; Costa, L.S.; Donk, E.; Hansson, L.-A.; Jeppesen, E.; Kruk, C.; Lacerot, G.; Mazzeo, N.; et al. Warmer climates boost cyanobacterial dominance in shallow lakes. Glob. Chang. Biol. 2012, 18, 118–126. [Google Scholar] [CrossRef]
- An, K.-G.; Jones, J.R. Factors regulating bluegreen dominance in a reservoir directly influenced by the Asian monsoon. Hydrobiologia 2000, 432, 37–48. [Google Scholar] [CrossRef]
- Liu, Z.; Liu, X.; He, B.; Nie, J.; Peng, J.; Zhao, L. Spatio-temporal change of water chemical elements in Lake Dianchi, China. Water Environ. J. 2009, 23, 235–244. [Google Scholar] [CrossRef]
- Ibelings, B.W.; Bormans, M.; Fastner, J.; Visser, P.M. CYANOCOST special issue on cyanobacterial blooms: Synopsis—A critical review of the management options for their prevention, control and mitigation. Aquat. Ecol. 2016, 50, 595–605. [Google Scholar] [CrossRef]
- Paerl, H.W.; Otten, T.G. Harmful cyanobacterial blooms: Causes, consequences, and controls. Microb. Ecol. 2013, 65, 995–1010. [Google Scholar] [CrossRef] [PubMed]
- Sun, J.; Cao, X.; Huang, Y. Relationships between spatial-temporal trends of water quality and the human activities in Lake Dianchi. J. Lake Sci. 2012, 24, 347–354. [Google Scholar] [Green Version]
- Reichwaldt, E.S.; Ghadouani, A. Effects of rainfall patterns on toxic cyanobacterial blooms in a changing climate: Between simplistic scenarios and complex dynamics. Water Res. 2012, 46, 1372–1393. [Google Scholar] [CrossRef]
- Zhang, C.; Lai, S.; Gao, X.; Liu, H. A review of the potential impacts of climate change on water environment in lakes and reservoirs. J. Lake Sci. 2016, 28, 691–700. [Google Scholar] [Green Version]
- Hai, X.U.; Paerl, H.W.; Qin, B.; Zhu, G.; Gao, G. Nitrogen and phosphorus inputs control phytoplankton growth in eutrophic Lake Taihu, China. Limnol. Oceanogr. 2010, 55, 420–432. [Google Scholar]
- Zhou, J.; Liu, Y.; Guo, H.; He, D. Combining the SWAT model with sequential uncertainty fitting algorithm for streamflow prediction and uncertainty analysis for the Lake Dianchi Basin, China. Hydrol. Process. 2014, 28, 521–533. [Google Scholar] [CrossRef]


| Category | Parameter | Abb. a | Unit | Available Time Span | Data Type | Data Source |
|---|---|---|---|---|---|---|
| Meteorological factors | Mean air temperature | Tmean | ℃ | 2000–2018 | Daily; monthly; yearly | CMDC b |
| Maximum air temperature | Tmax | ℃ | ||||
| Minimum air temperature | Tmin | ℃ | ||||
| Wind speed | WS | m/s | ||||
| Wind direction | WD | – | ||||
| Sunshine hours | SH | H | ||||
| 20–20 h Precipitation | P | mm | ||||
| Water quality factors | Total nitrogen | TN | mg/L | 2000–2015 | Monthly; yearly | Guo et al., 2017; Wang et al., 2019 [5,55] |
| Total phosphorus | TP | mg/L | ||||
| Nitrogen–phosphorus ratio | TN/TP | – | ||||
| pH | pH | – | 2006–2018 | Weekly; monthly; yearly | CNEMC c | |
| Dissolved oxygen | DO | mg/L | ||||
| Chemical oxygen demand | CODMn | mg/L | ||||
| Ammonia-nitrogen | NH3–N | mg/L | ||||
| Water temperature | WT | ℃ | 2005–2015 | Monthly; yearly | Wang et al., 2019 [5] | |
| Socioeconomic factors | Total population | TPop | 104 persons | 2000–2017 | Yearly | YSY d |
| Gross domestic product | GDP | 1010 CNY | ||||
| Total wastewater discharge | TW | 107 tons |
| Method | Content | Software |
|---|---|---|
| Root mean square error (RMSE) Relative error (RE) | Validation of the APA | Excel |
| Ward’s minimum variance Hot spot analysis Trajectory data mining | Temporal-spatial distributions of pixel-bloom frequency | RStudio ArcGIS |
| principal component analysis (PCA) redundancy analysis (RDA) | Influencing drivers of algal blooms at daily, monthly, and inter–annual scales | Canoco |
| Year | Initiation Date | End Date | Duration (Days) |
|---|---|---|---|
| 2000 | 2000066 | 2001022 | 295 |
| 2001 | 2001095 | 2002014 | 285 |
| 2002 | 2002039 | 2003025 | 351 |
| 2003 | 2003034 | 2003347 | 378 |
| 2004 | 2004044 | 2005030 | 350 |
| 2005 | 2005055 | 2006010 | 320 |
| 2006 | 2006033 | 2007013 | 336 |
| 2007 | 2007052 | 2008023 | 334 |
| 2008 | 2008096 | 2008359 | 264 |
| 2009 | 2009073 | 2010028 | 320 |
| 2010 | 2010060 | 2011008 | 313 |
| 2011 | 2011095 | 2012043 | 313 |
| 2012 | 2012075 | 2013038 | 329 |
| 2013 | 2013054 | 2014023 | 344 |
| 2014 | 2014071 | 2015028 | 289 |
| 2015 | 2015060 | 2016029 | 334 |
| 2016 | 2016045 | 2017024 | 345 |
| 2017 | 2017047 | 2018021 | 339 |
| 2018 | 2018058 | –– |
© 2019 by the authors. Licensee MDPI, Basel, Switzerland. This article is an open access article distributed under the terms and conditions of the Creative Commons Attribution (CC BY) license (http://creativecommons.org/licenses/by/4.0/).
Share and Cite
Jing, Y.; Zhang, Y.; Hu, M.; Chu, Q.; Ma, R. MODIS-Satellite-Based Analysis of Long-Term Temporal-Spatial Dynamics and Drivers of Algal Blooms in a Plateau Lake Dianchi, China. Remote Sens. 2019, 11, 2582. https://doi.org/10.3390/rs11212582
Jing Y, Zhang Y, Hu M, Chu Q, Ma R. MODIS-Satellite-Based Analysis of Long-Term Temporal-Spatial Dynamics and Drivers of Algal Blooms in a Plateau Lake Dianchi, China. Remote Sensing. 2019; 11(21):2582. https://doi.org/10.3390/rs11212582
Chicago/Turabian StyleJing, Yuanyuan, Yuchao Zhang, Minqi Hu, Qiao Chu, and Ronghua Ma. 2019. "MODIS-Satellite-Based Analysis of Long-Term Temporal-Spatial Dynamics and Drivers of Algal Blooms in a Plateau Lake Dianchi, China" Remote Sensing 11, no. 21: 2582. https://doi.org/10.3390/rs11212582