Performance Evaluation of a Potential Component of an Early Flood Warning System—A Case Study of the 2012 Flood, Lower Niger River Basin, Nigeria


Abstract
:
1. Introduction
2. Data and Methods
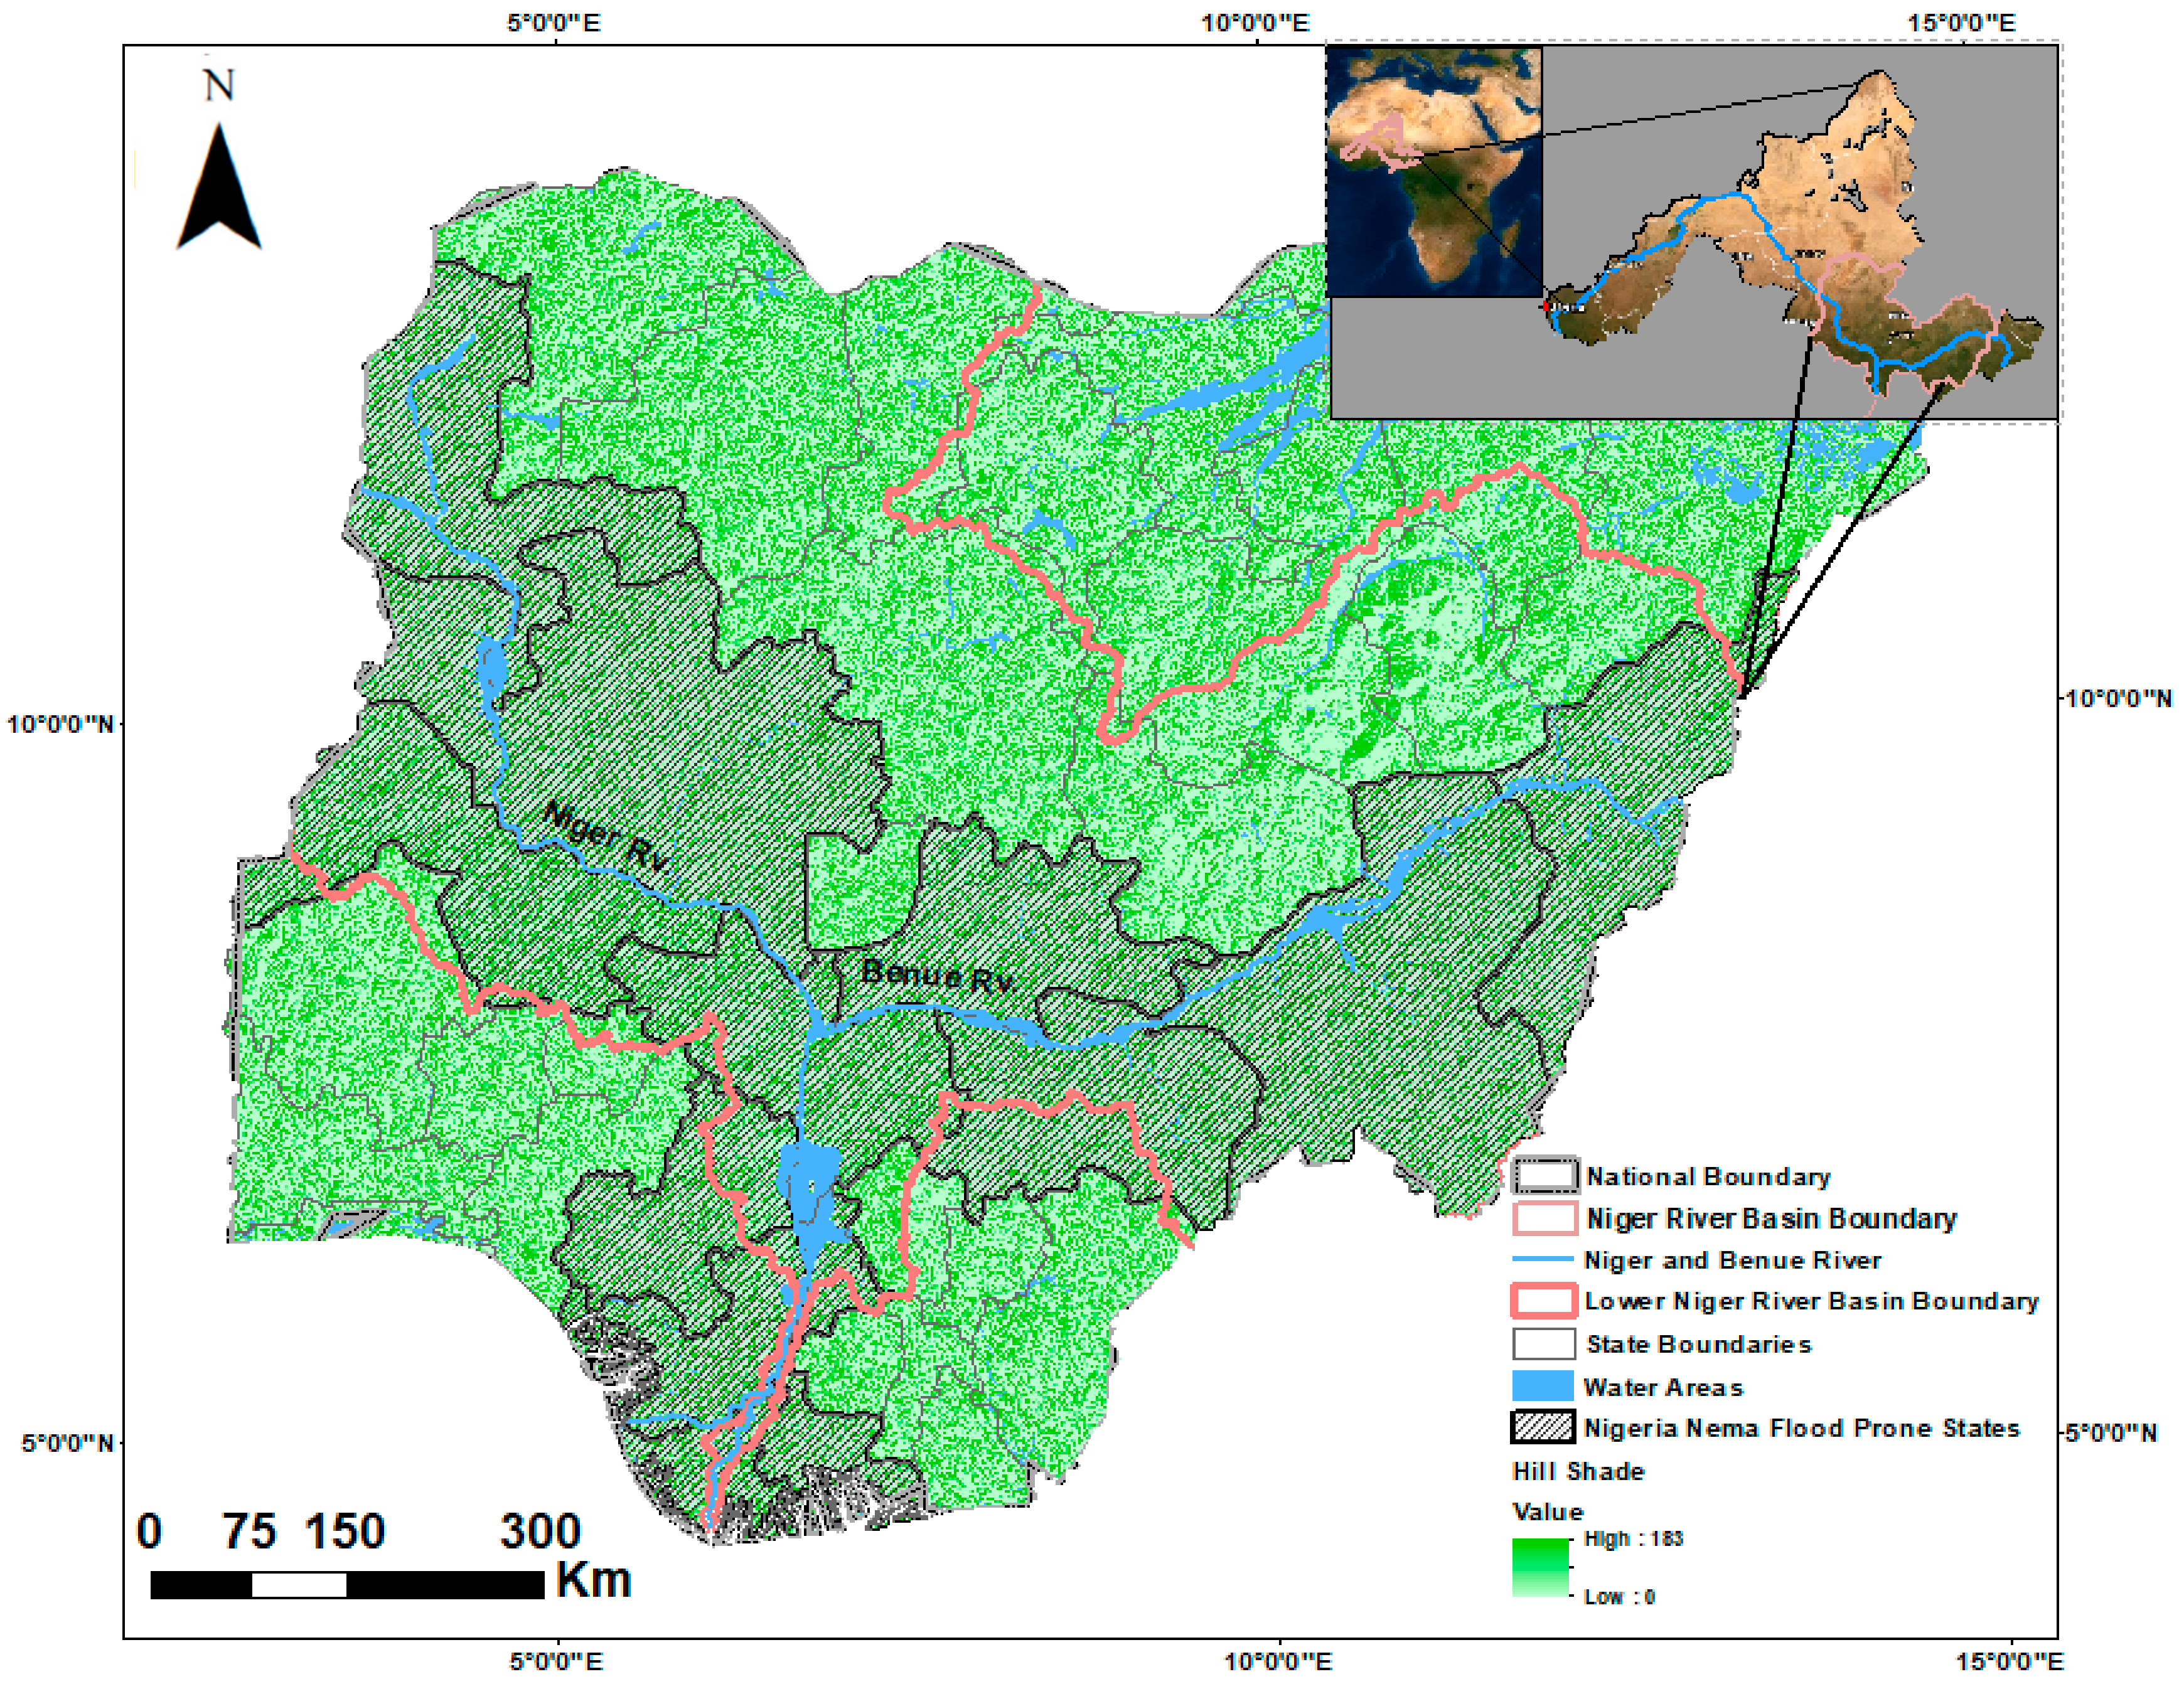
2.1. Study Area
2.2. Datasets
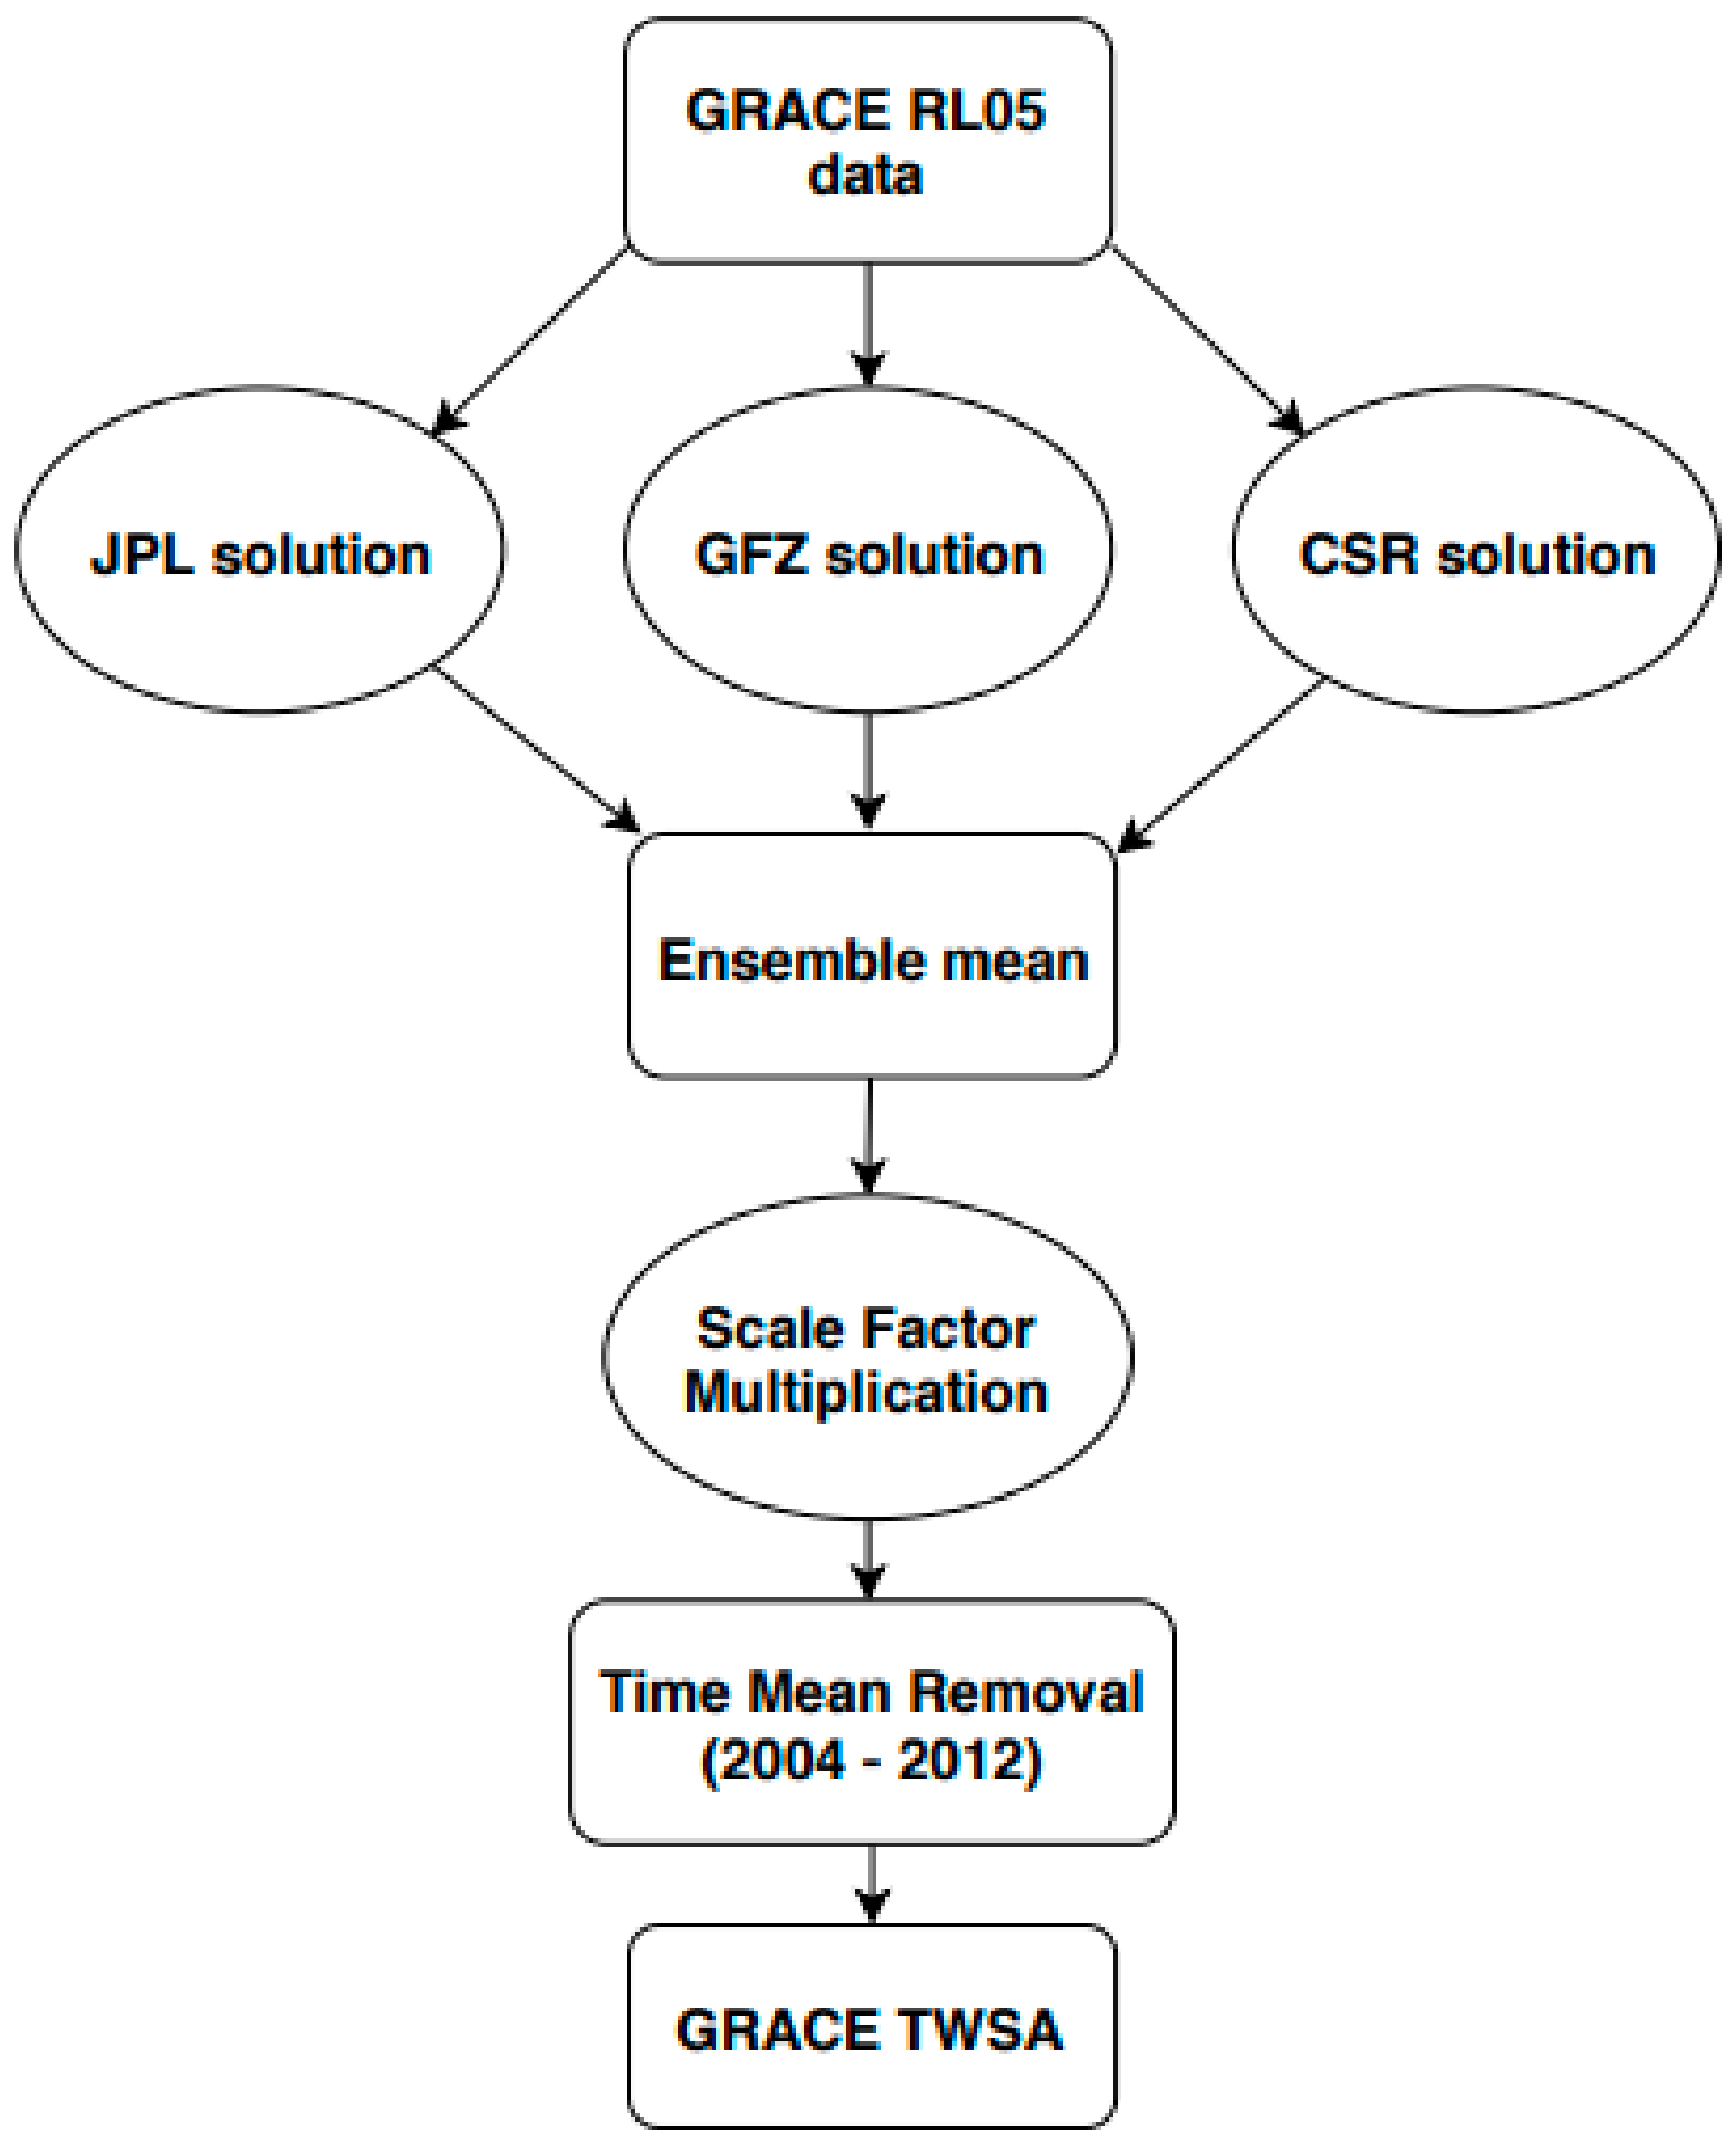
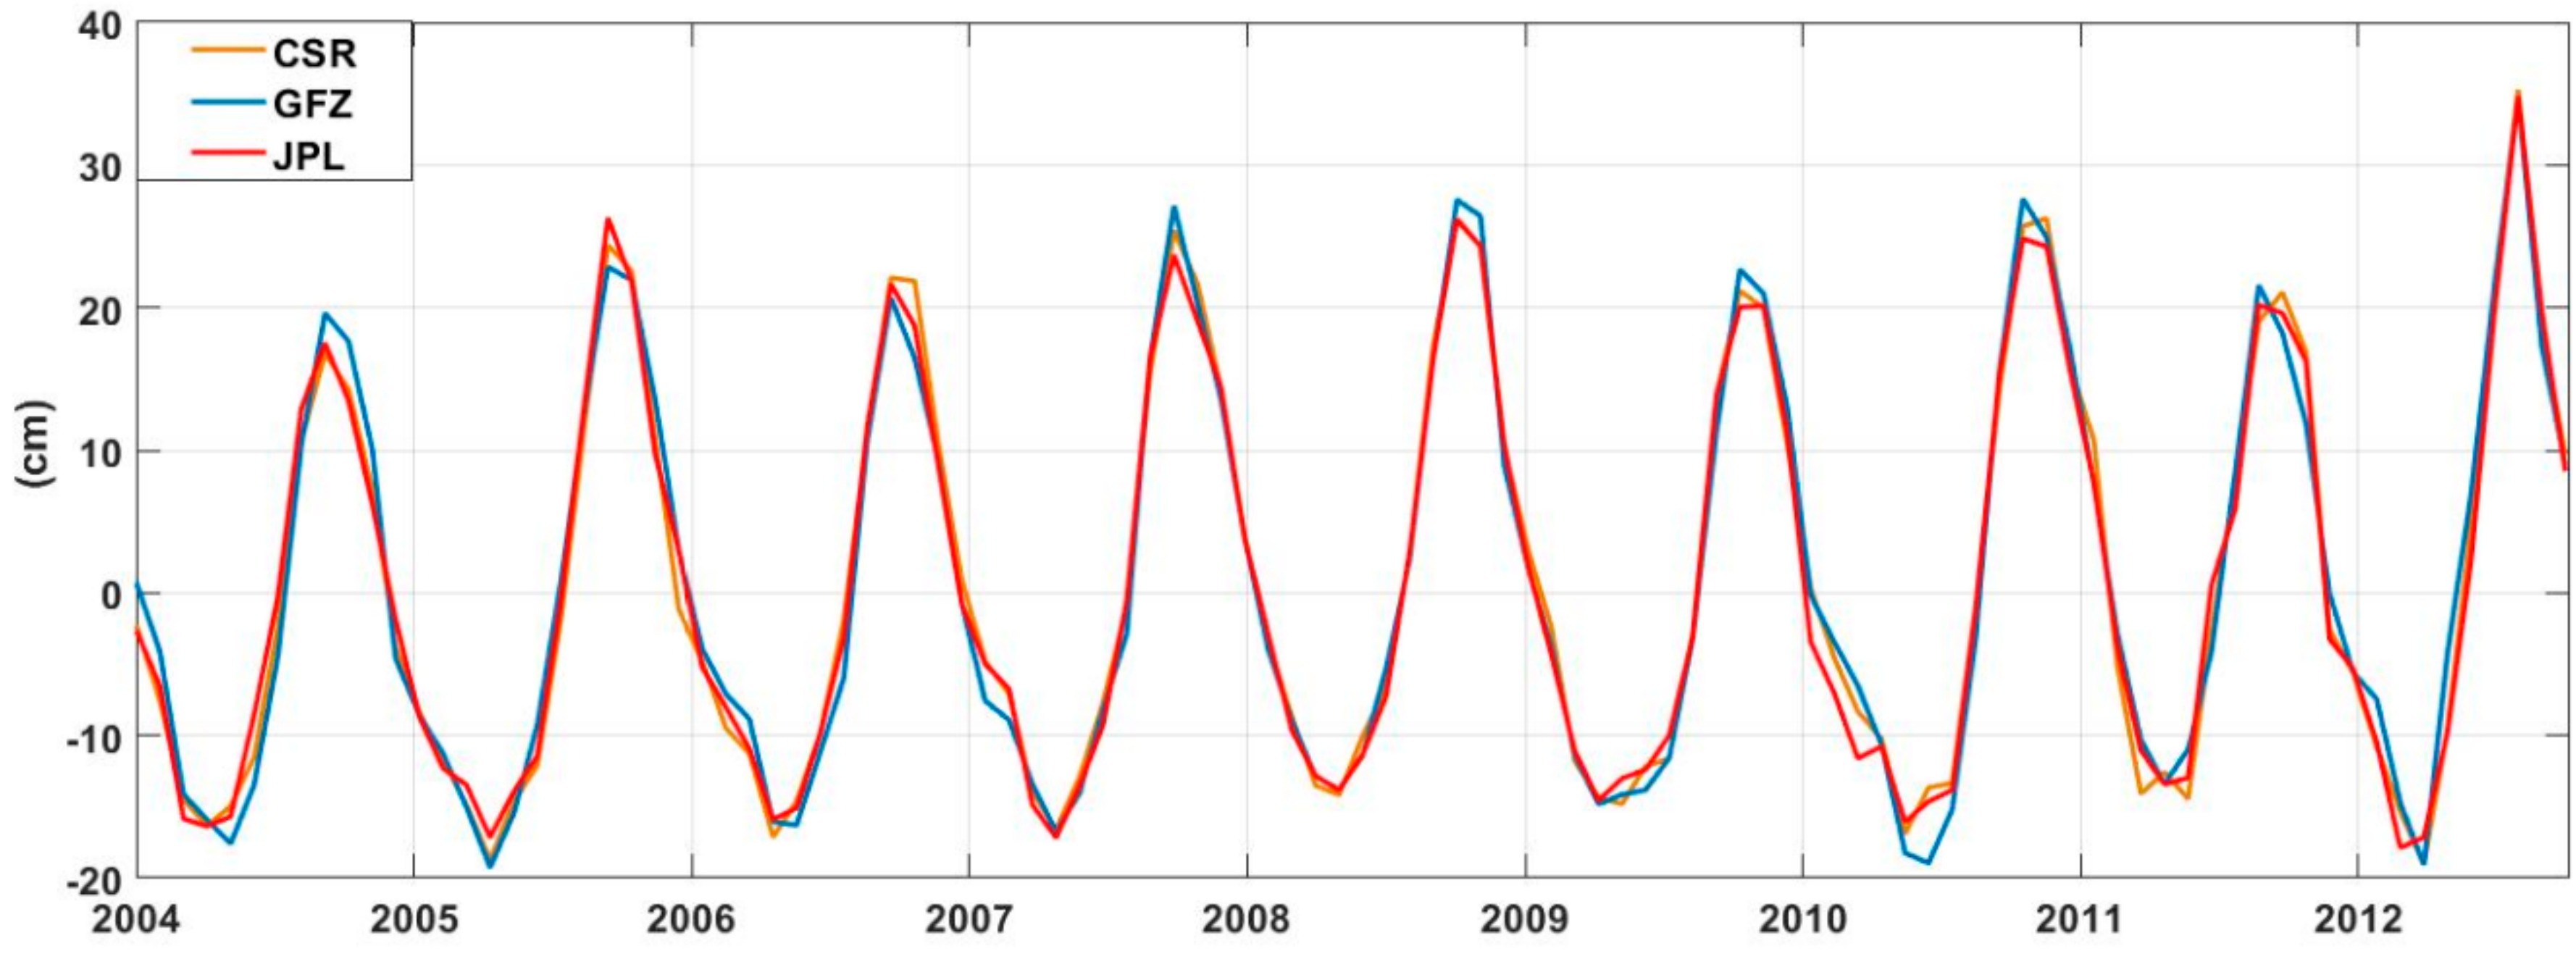
2.2.1. GRACE Terrestrial Water Storage Anomaly Products
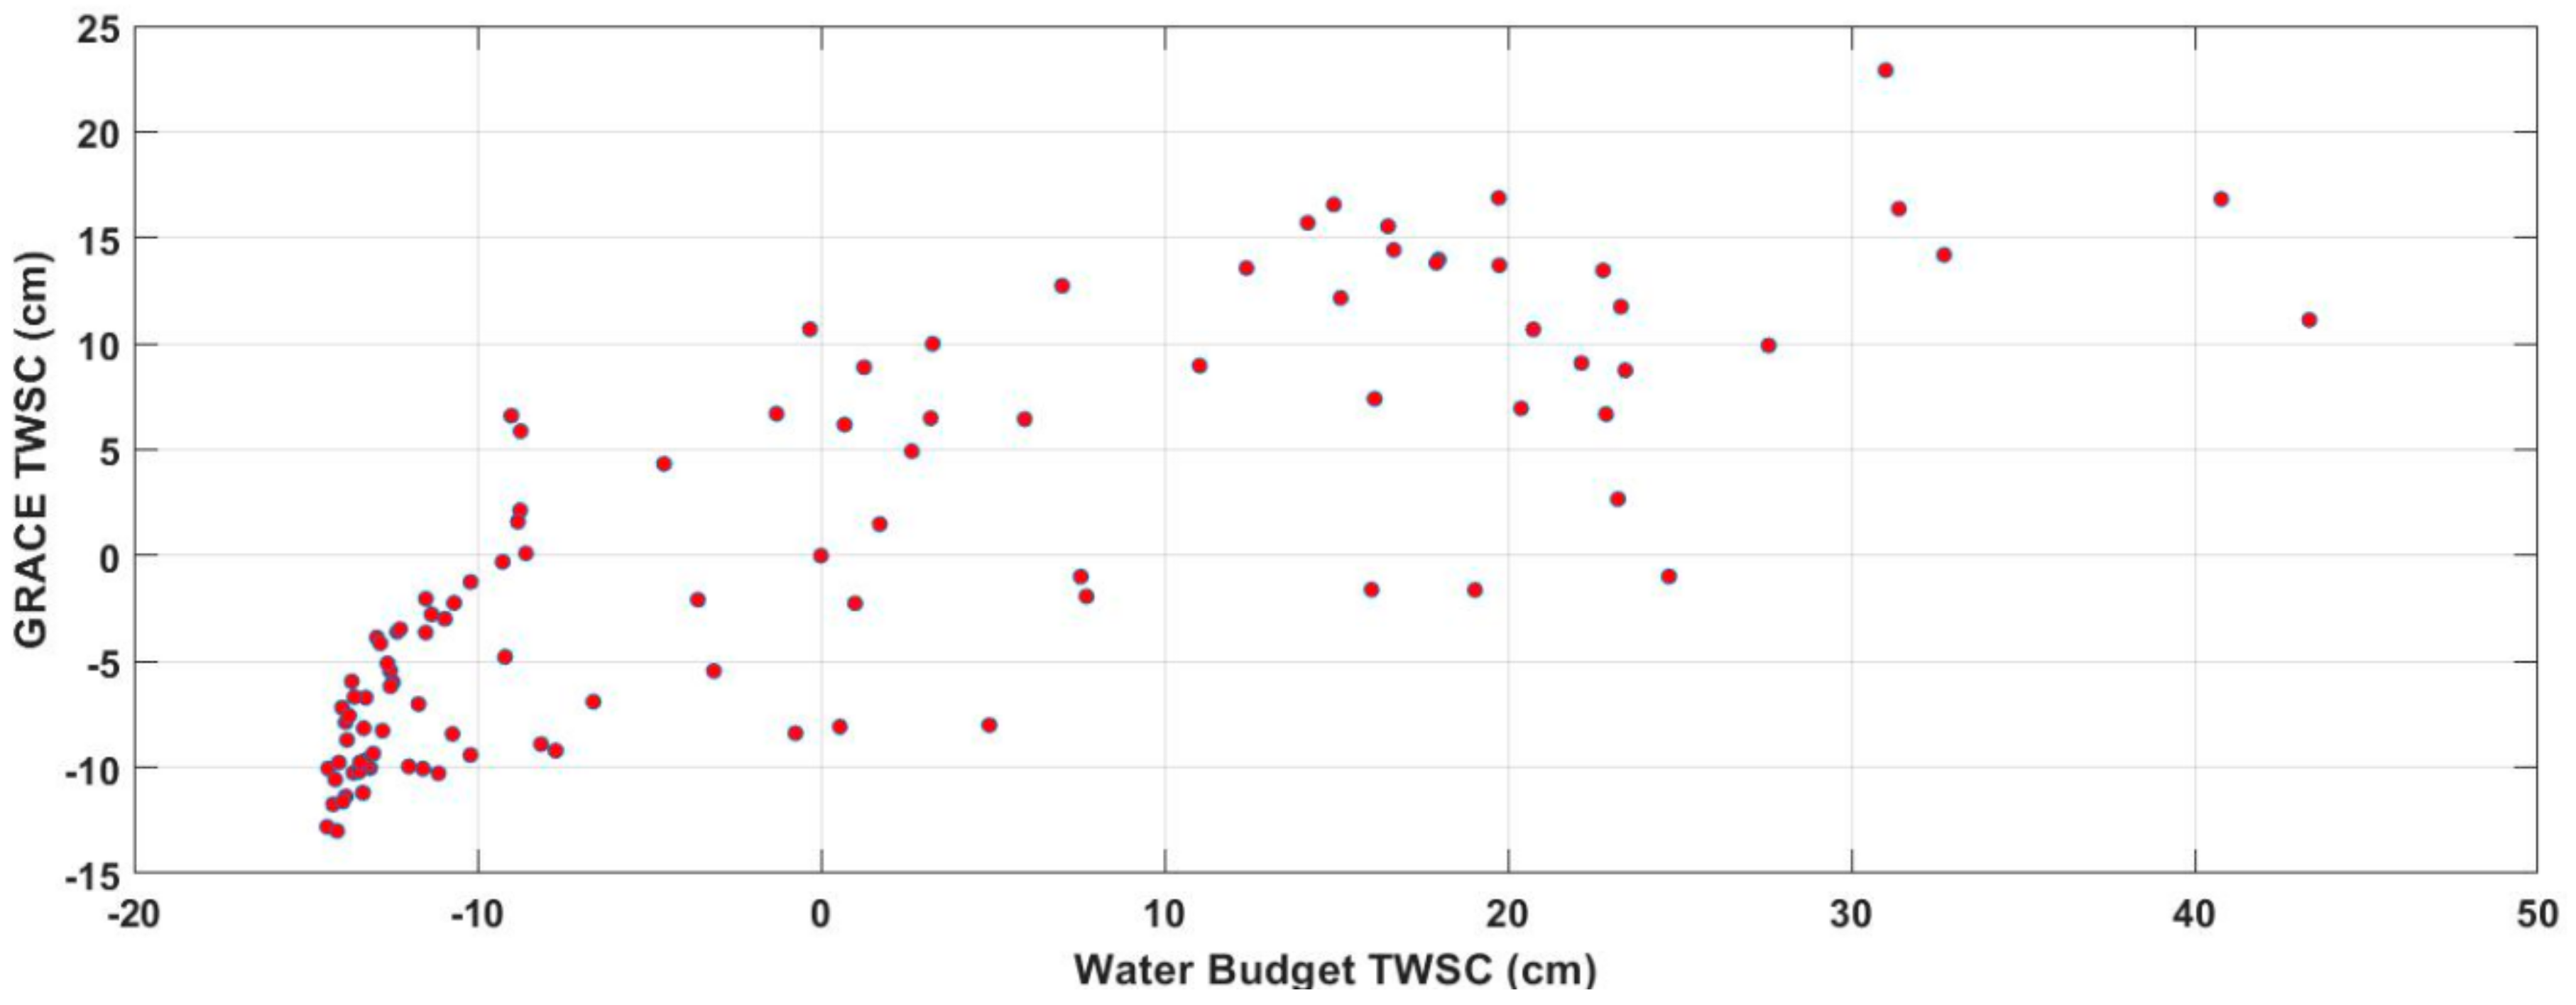
2.2.2. Evaluation of GRACE and Water Budget Terrestrial Water Storage Change (TWSC)
2.2.3. Global Precipitation Climatology Centre (GPCC)
2.2.4. Dartmouth Flood Observatory
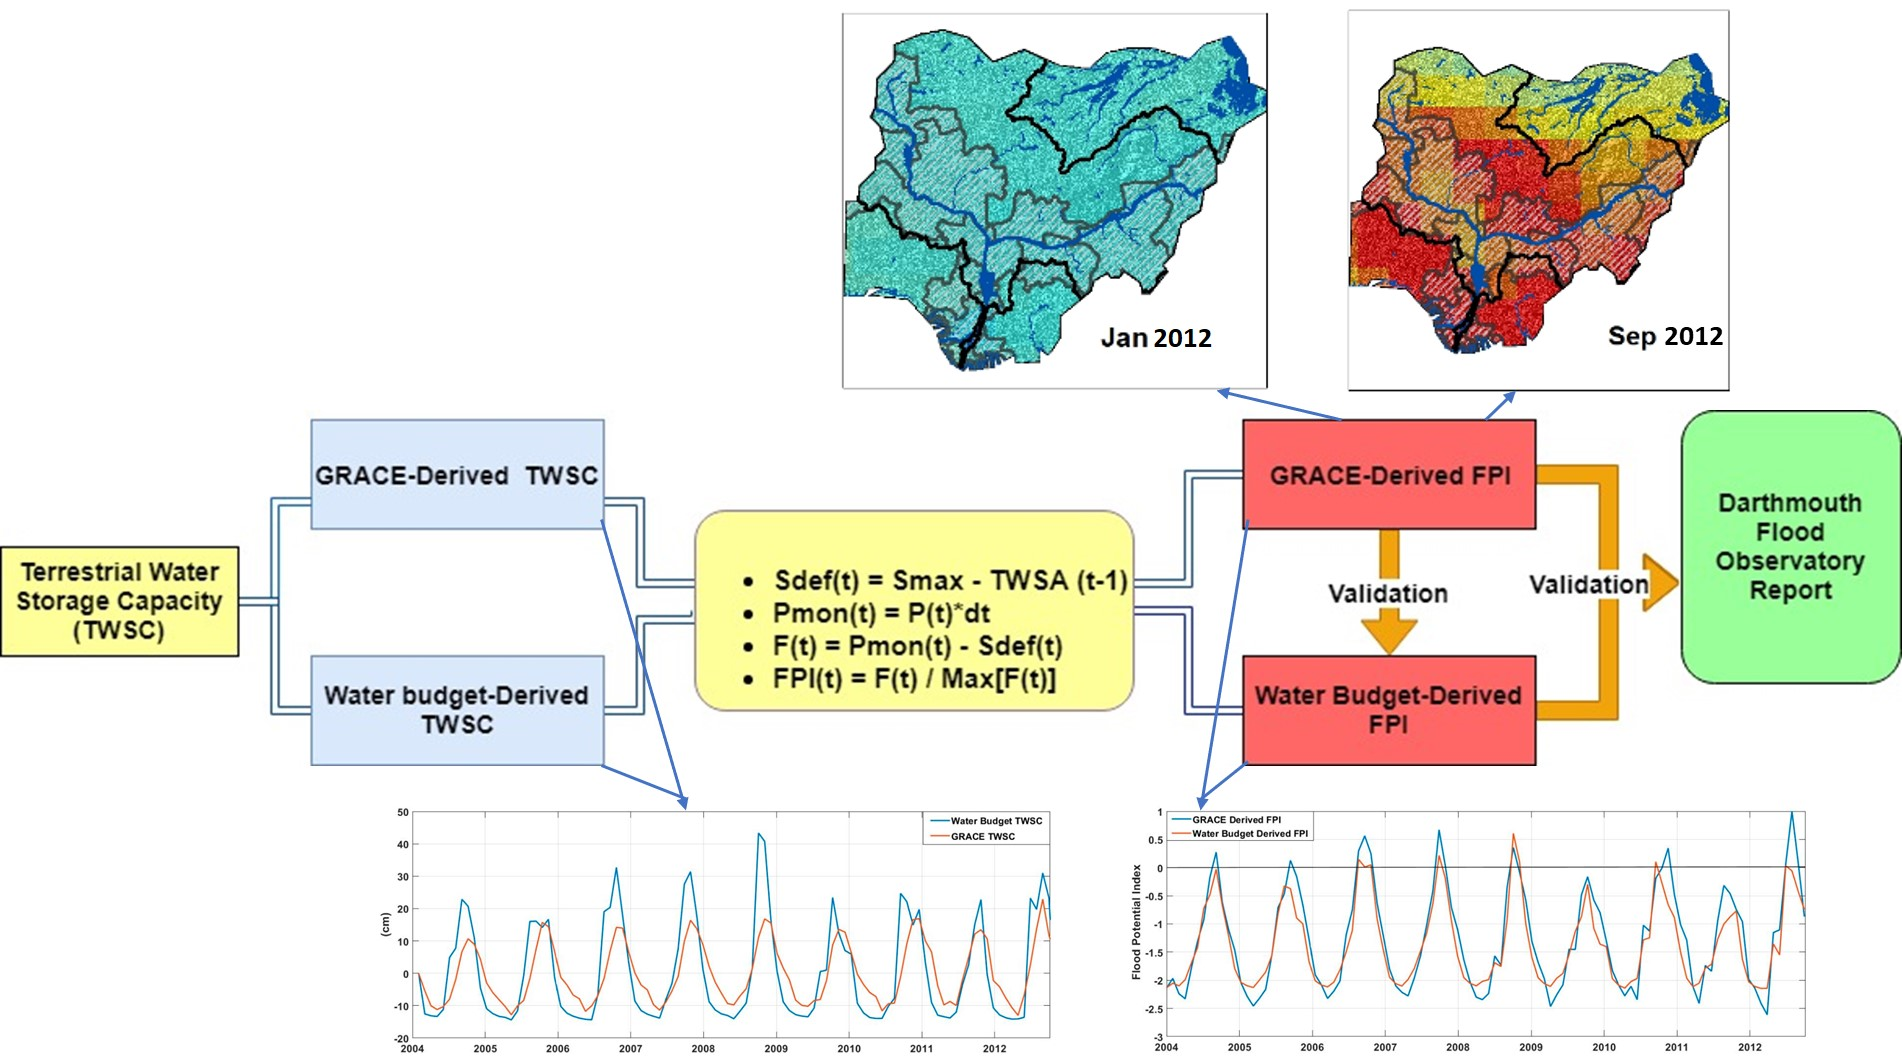
2.3. Methods
2.3.1. GRACE-Derived Flood Potential Index
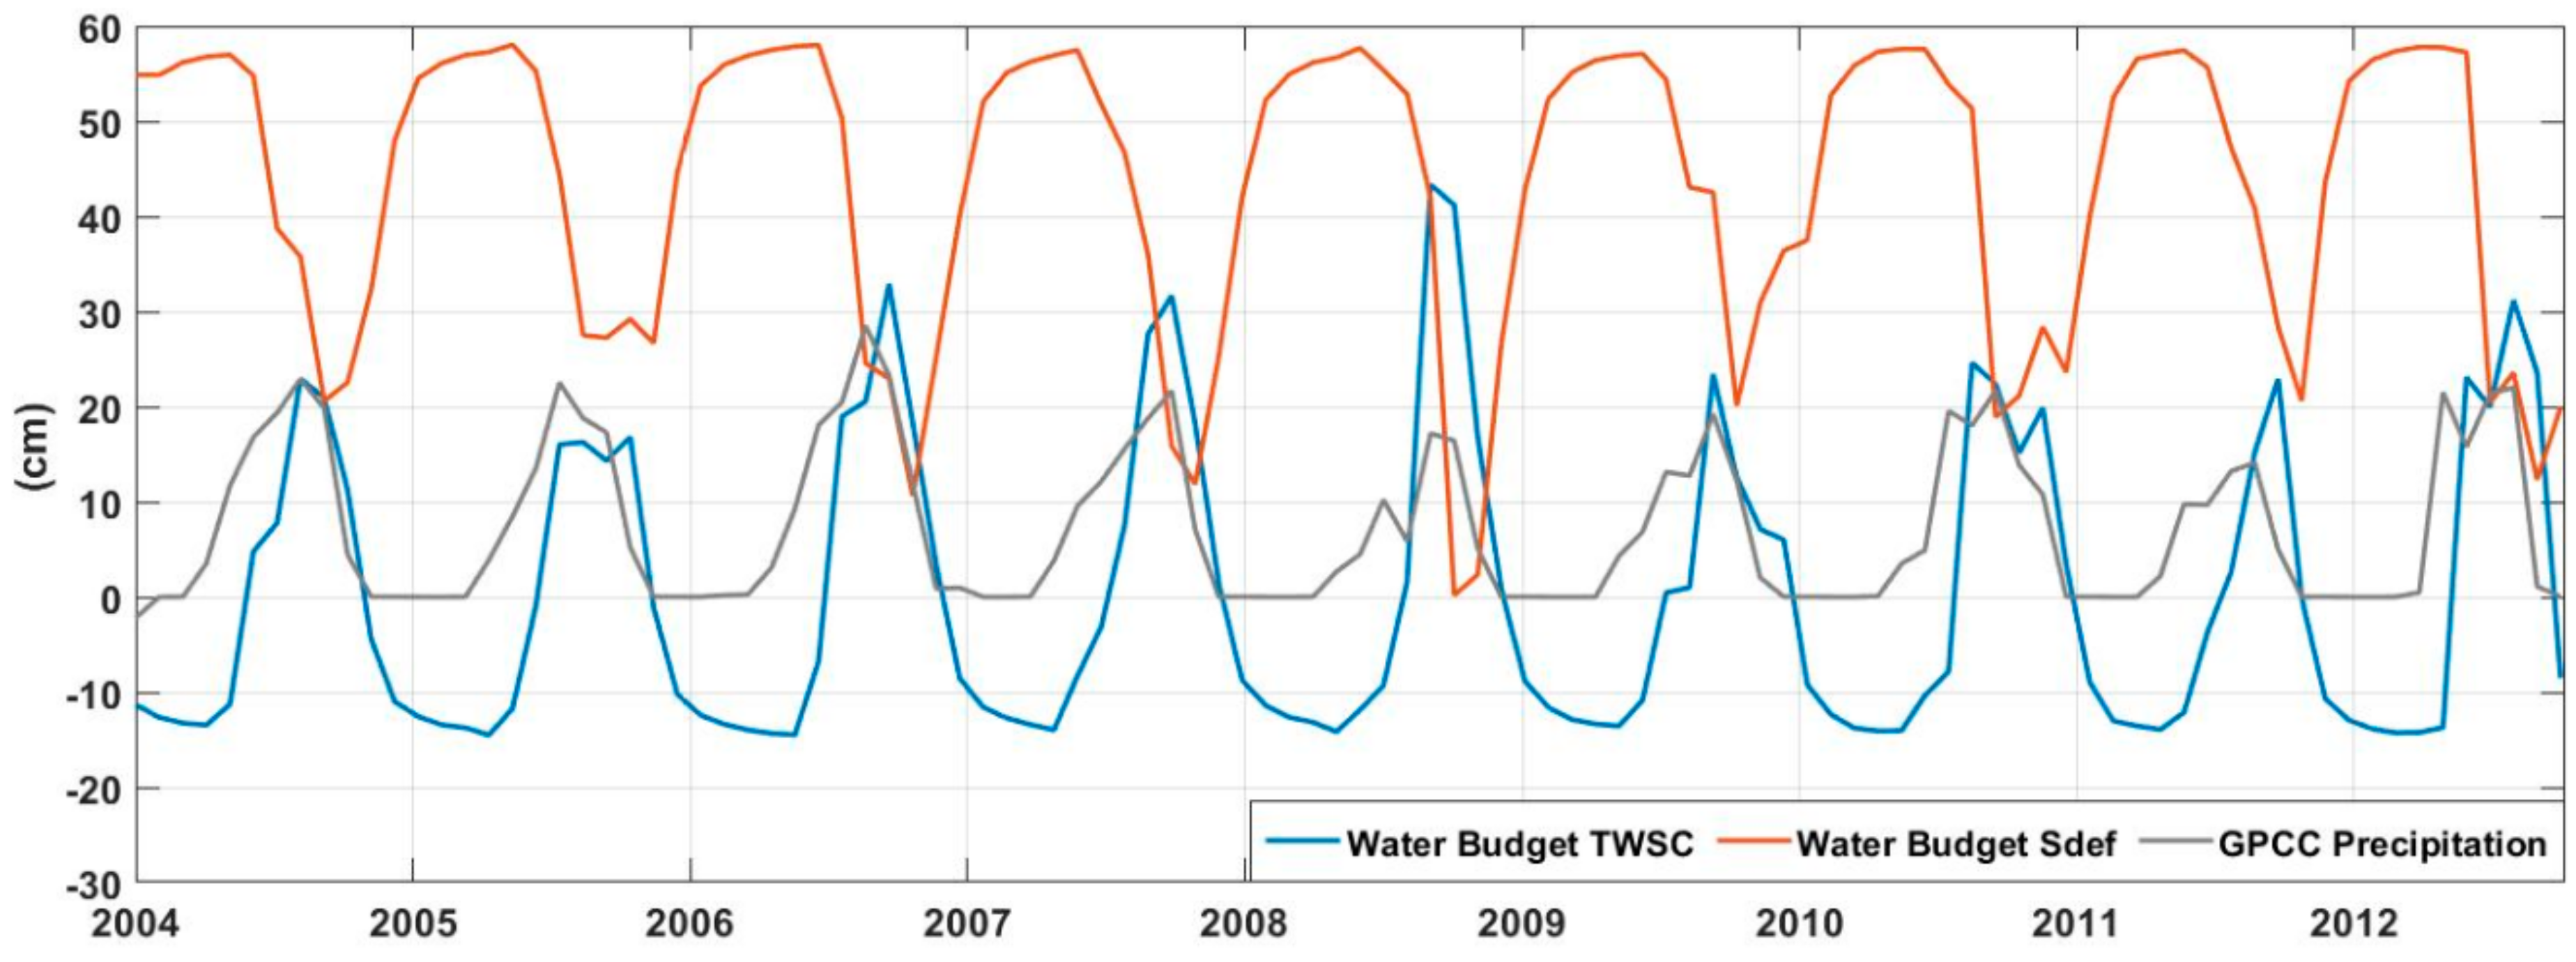
2.3.2. Water Budget-Derived Flood Potential Index
3. Results
3.1. Analysis of GRACE TWSA and Validation
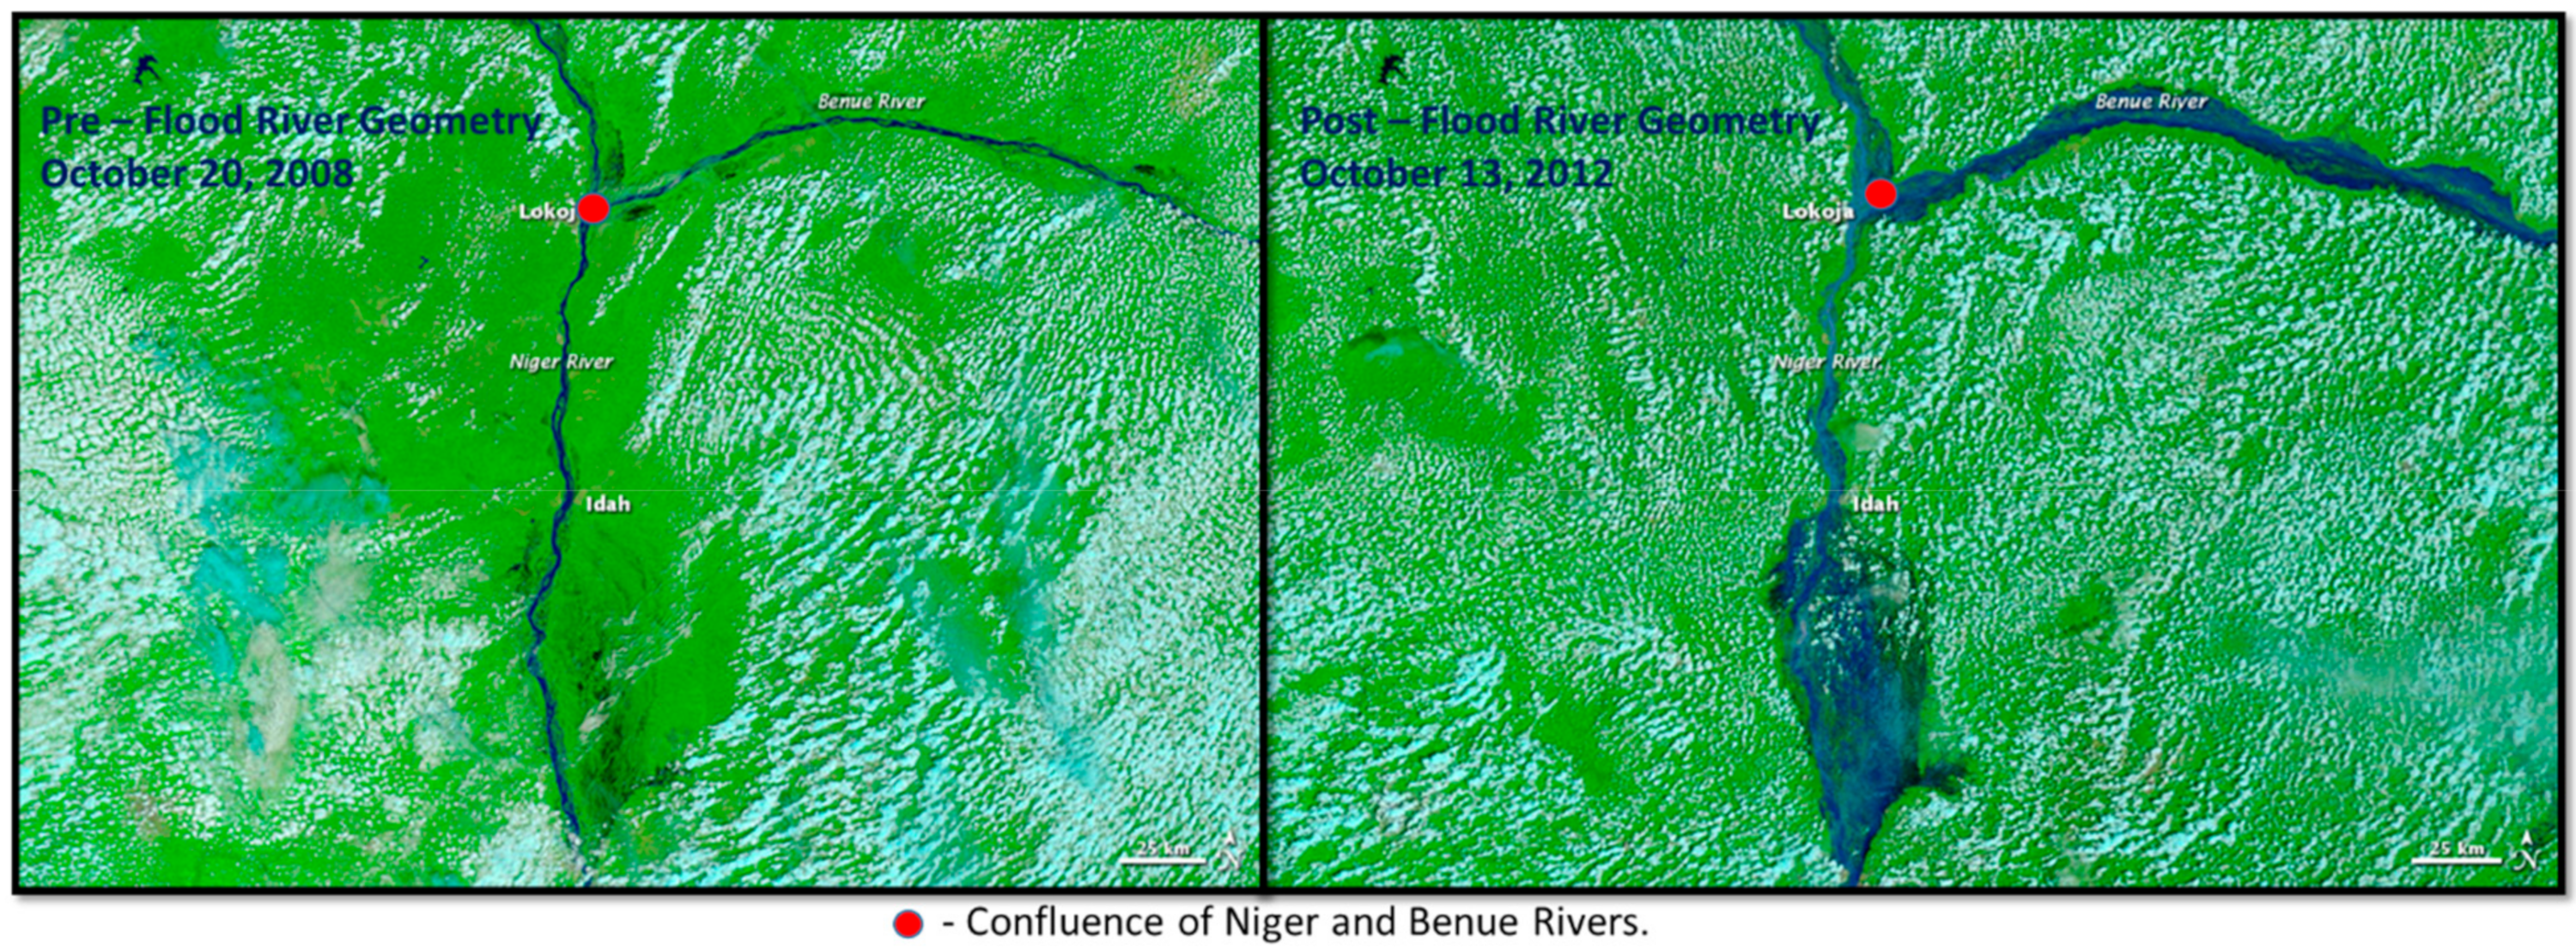
3.2. Hydrological State of the LNRB
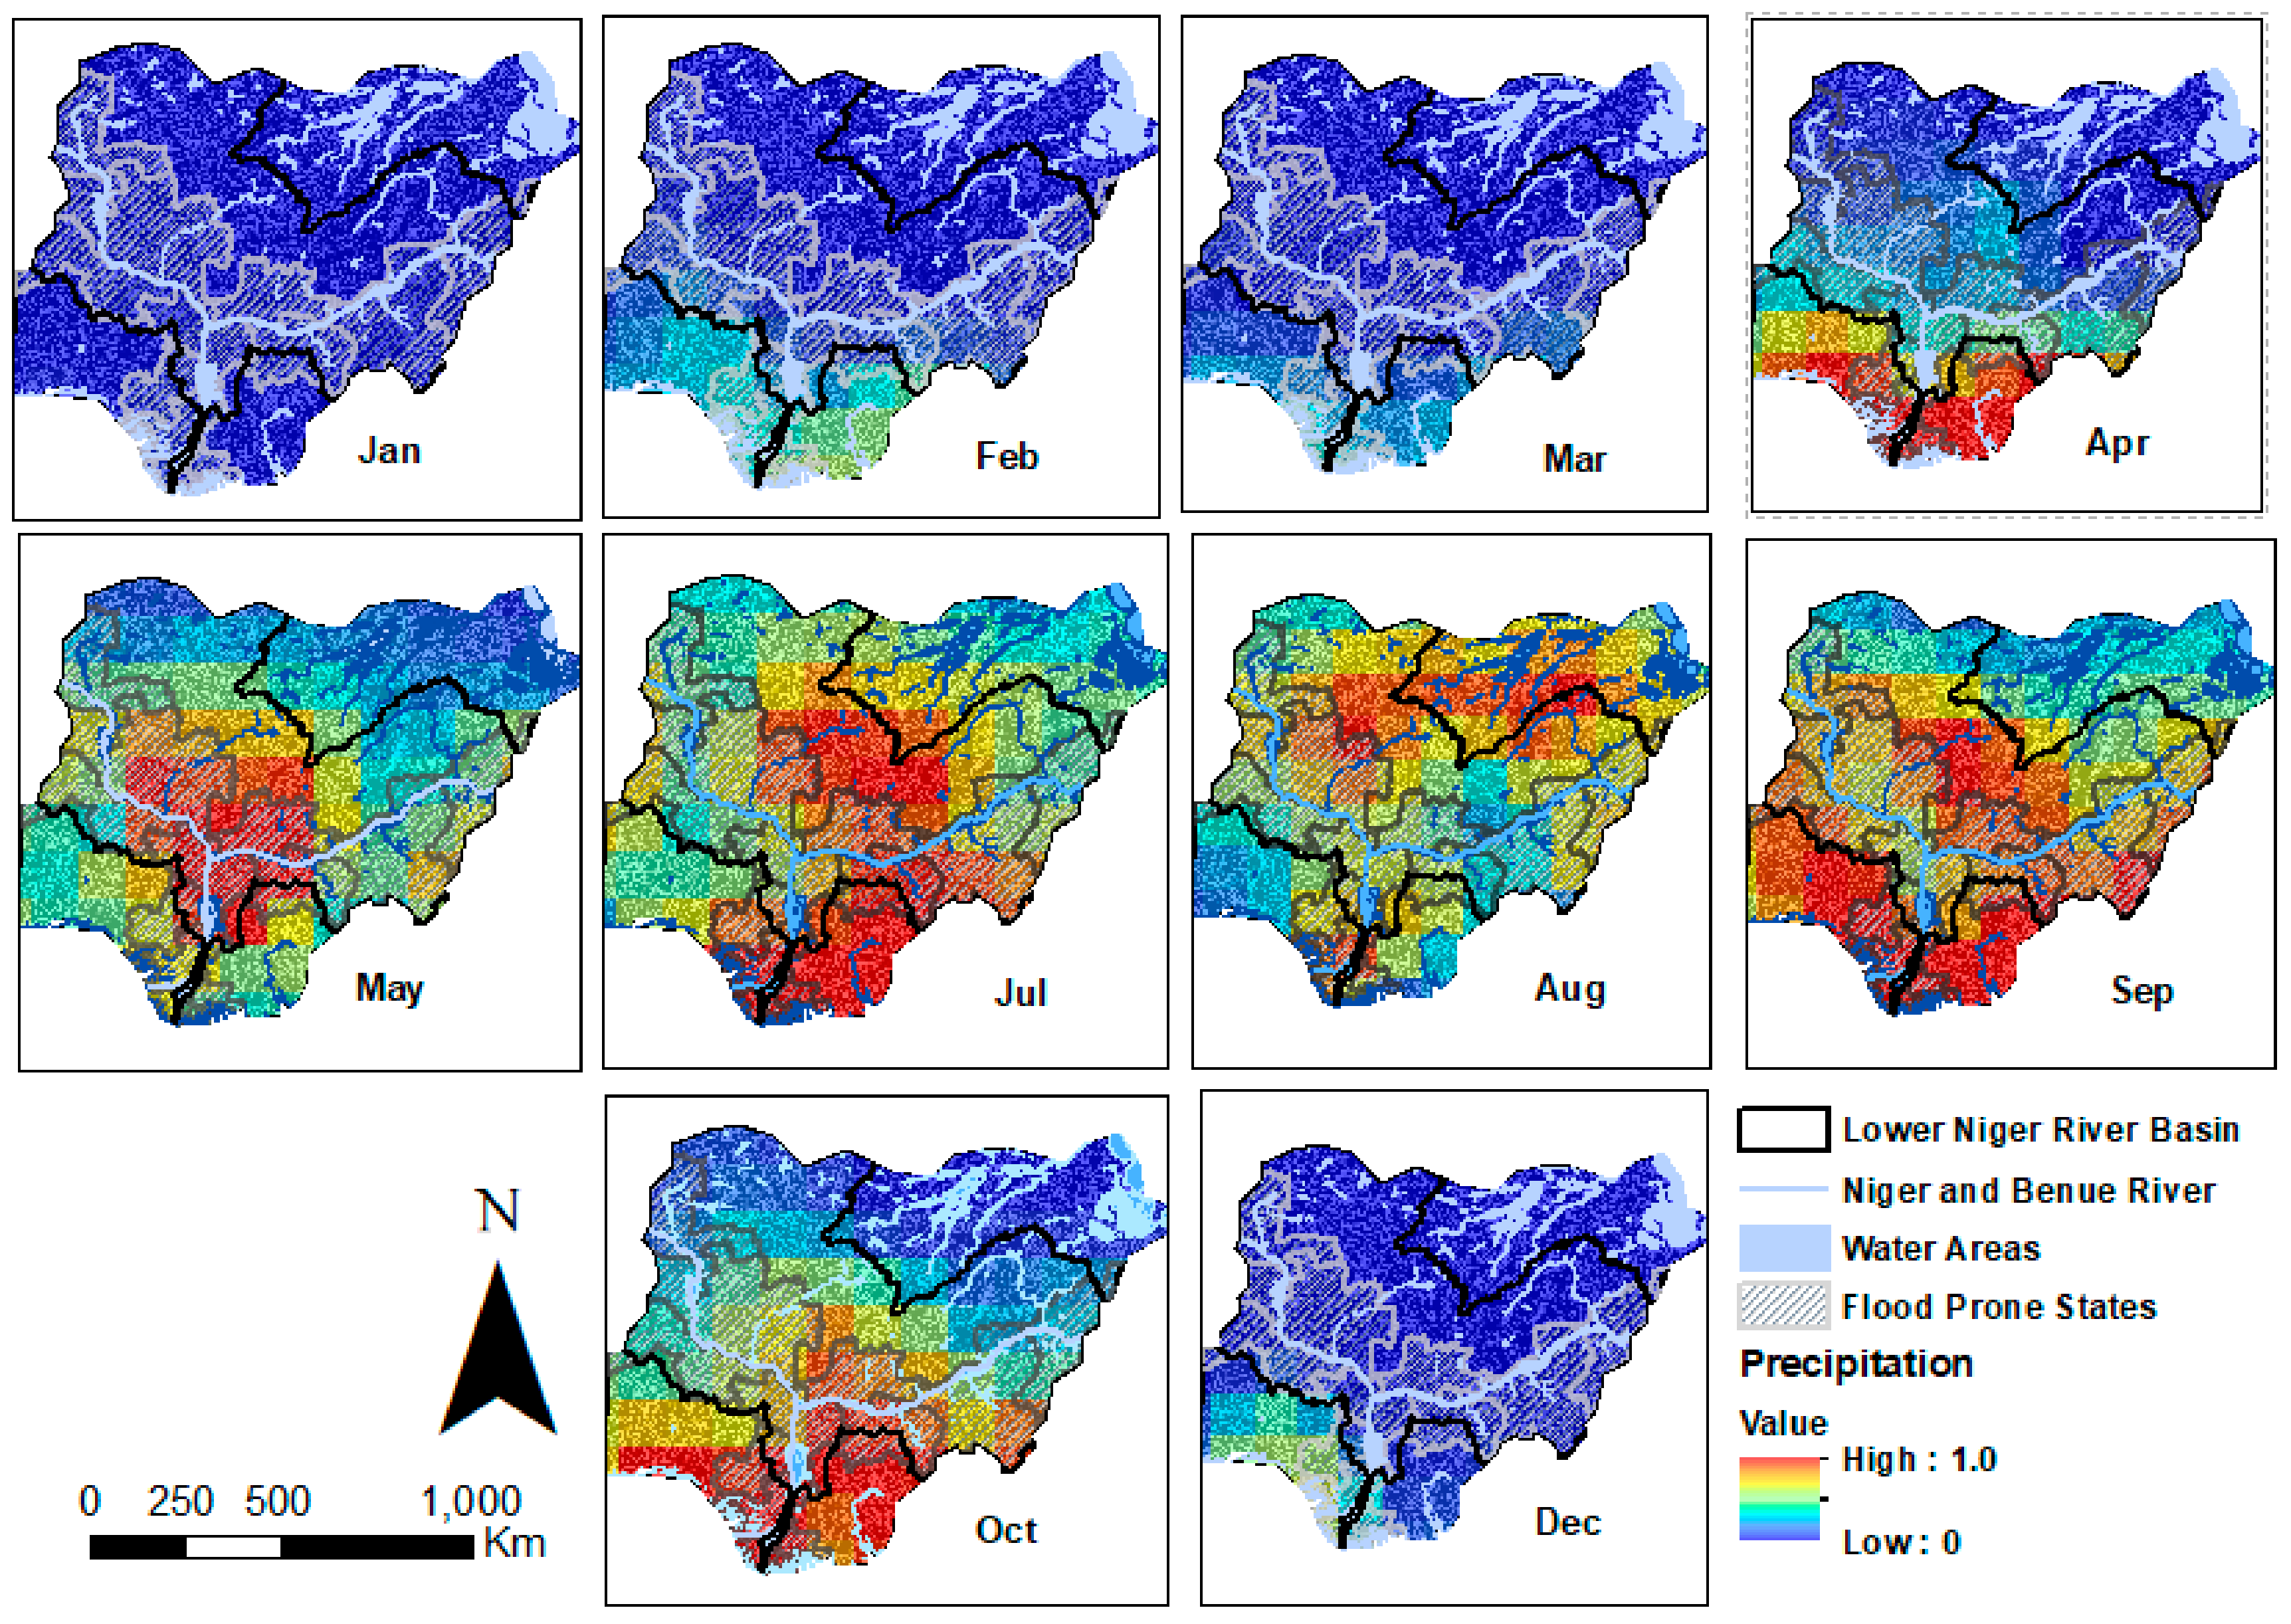
3.2.1. Precipitation within the LNRB
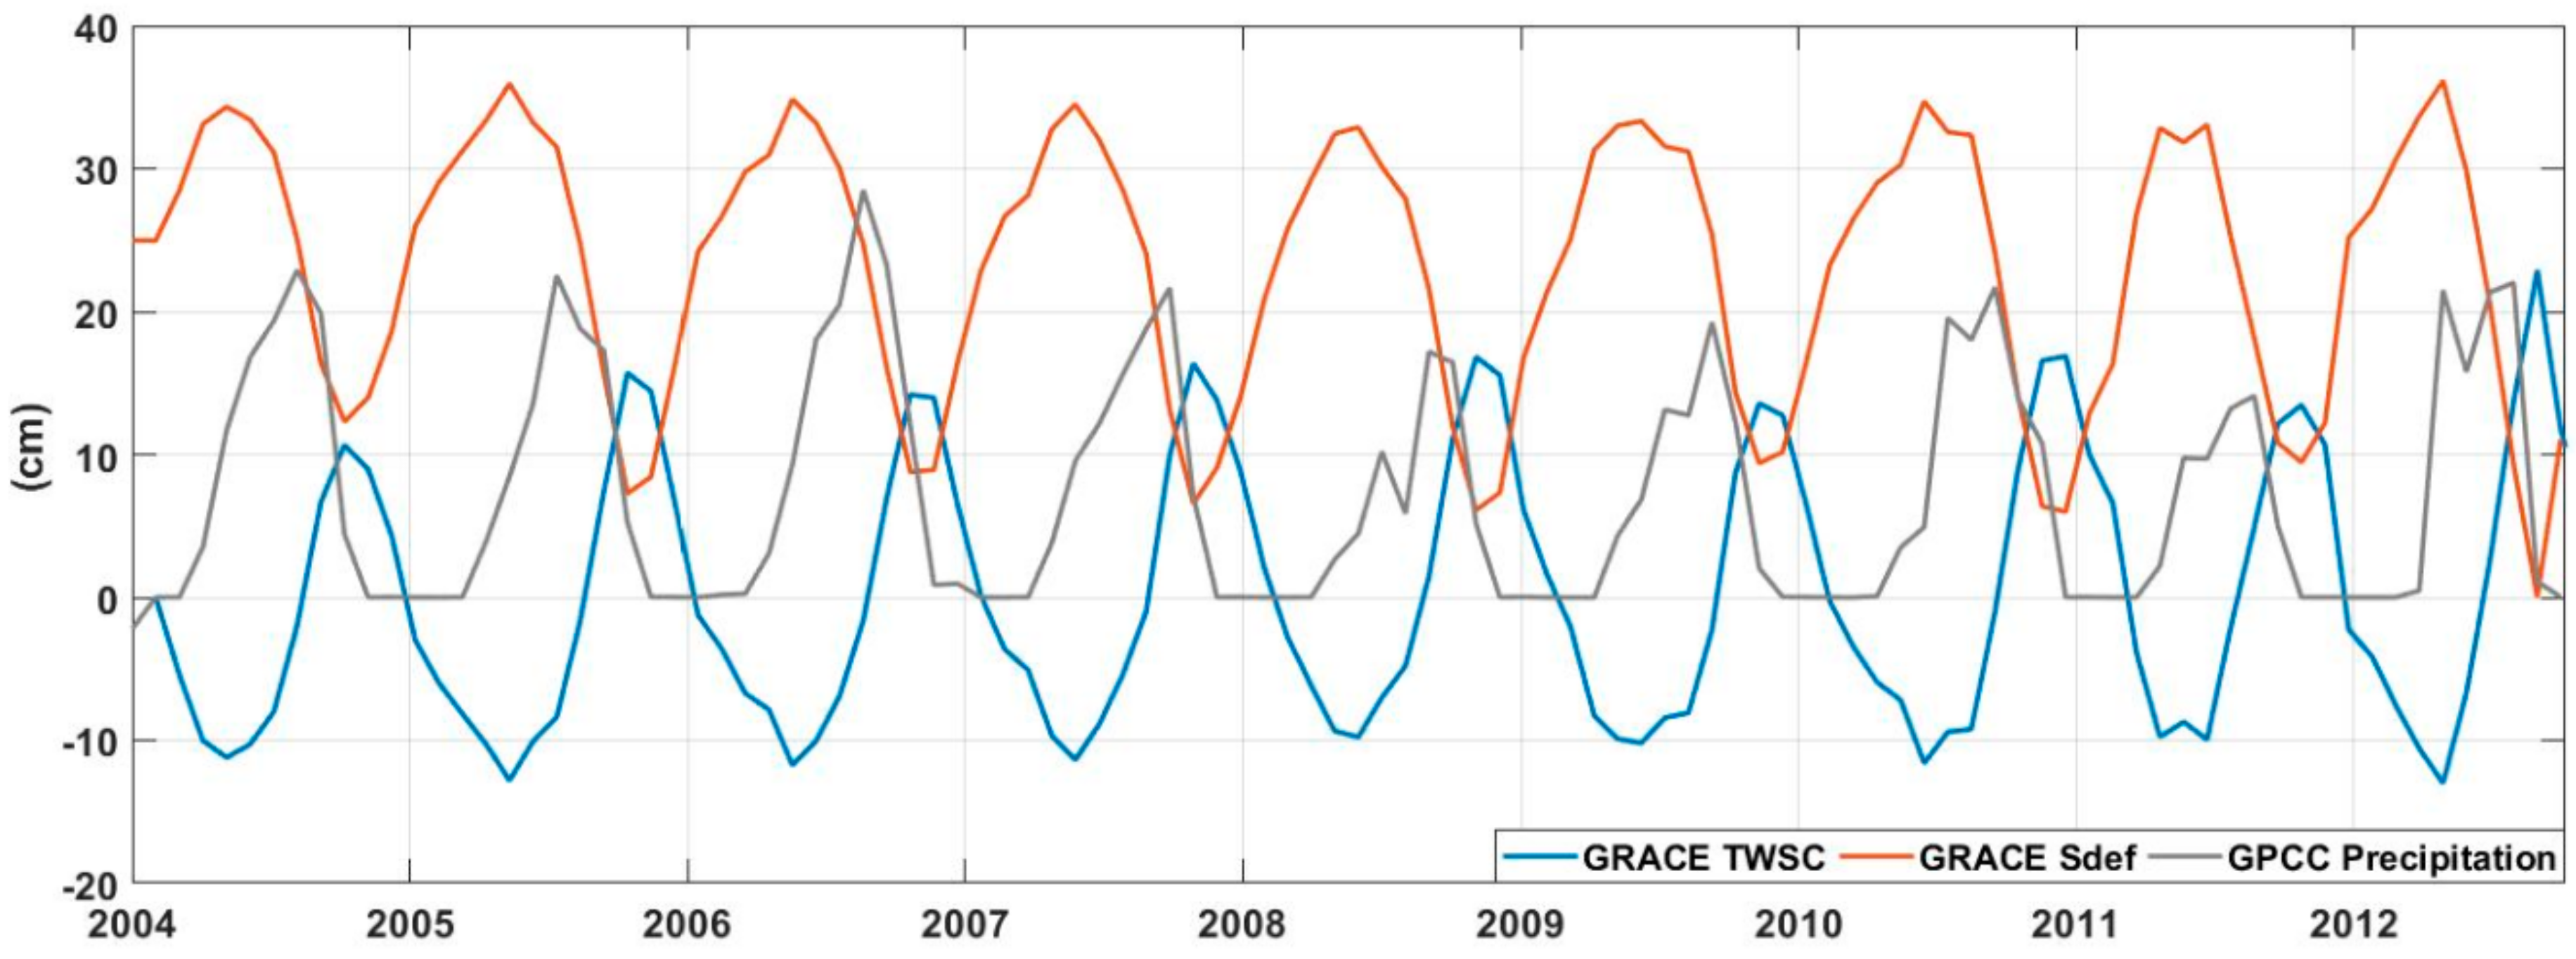
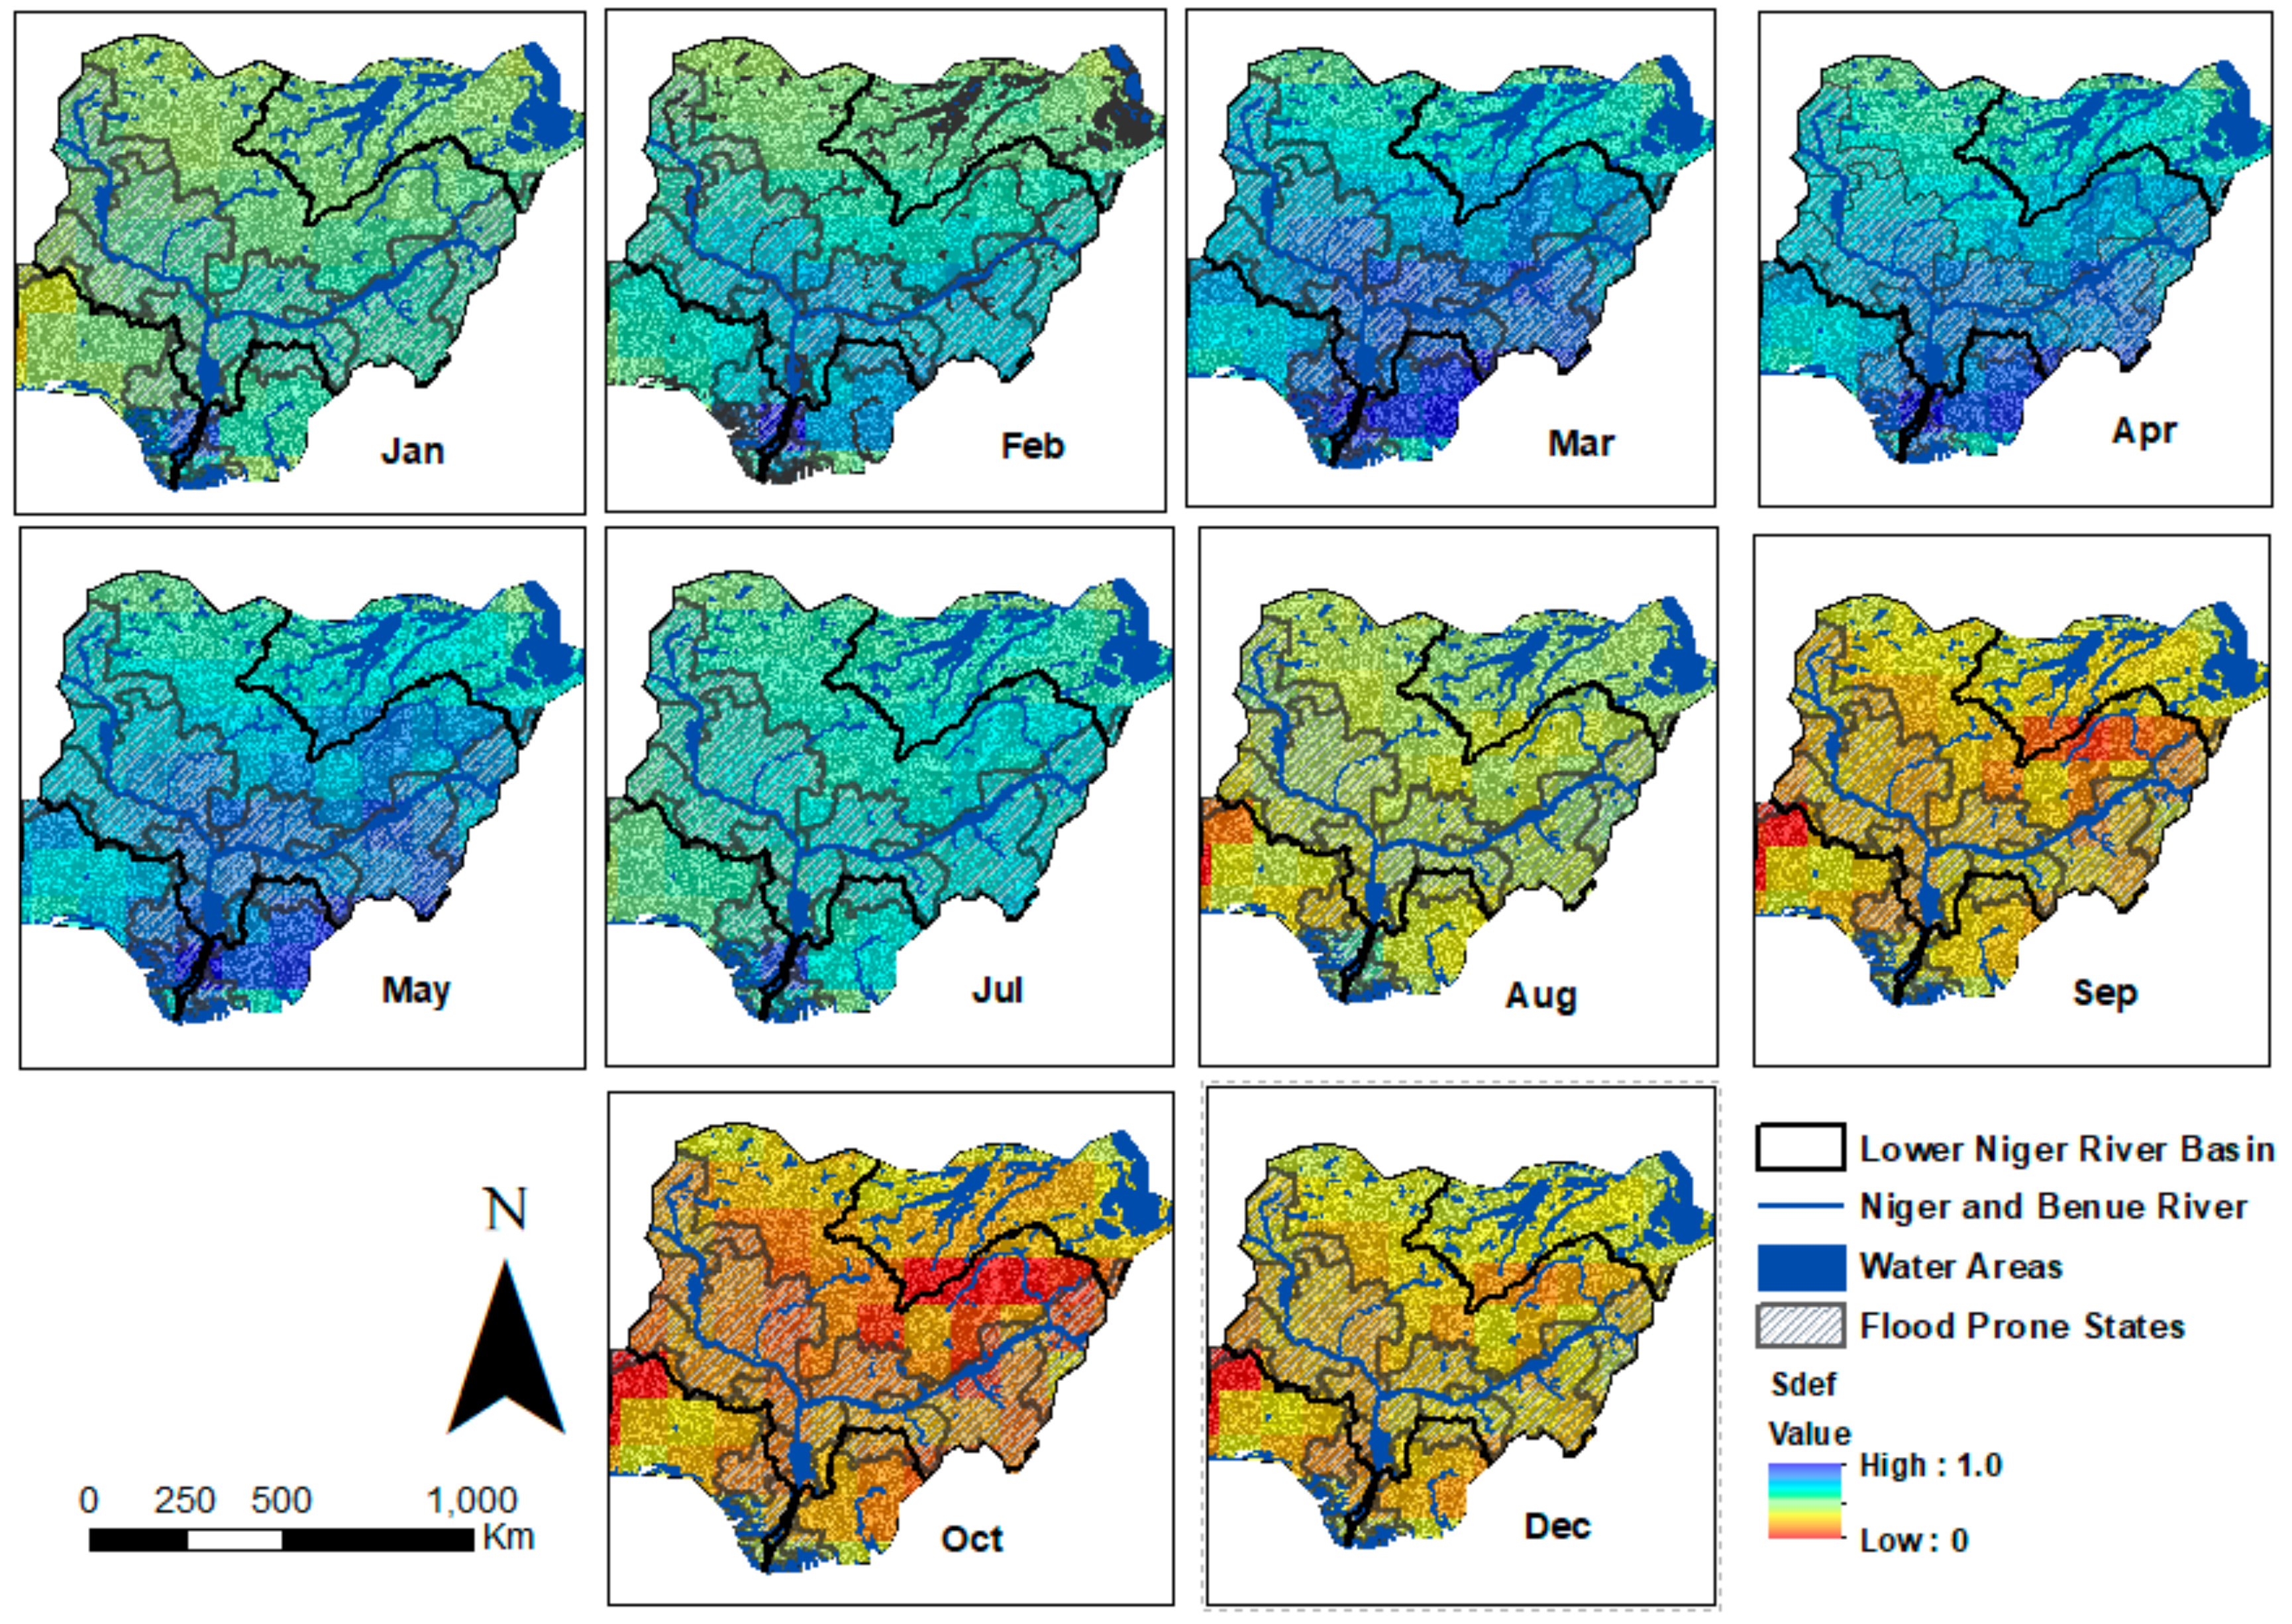
3.2.2. GRACE-Based Storage Deficit within the LNRB
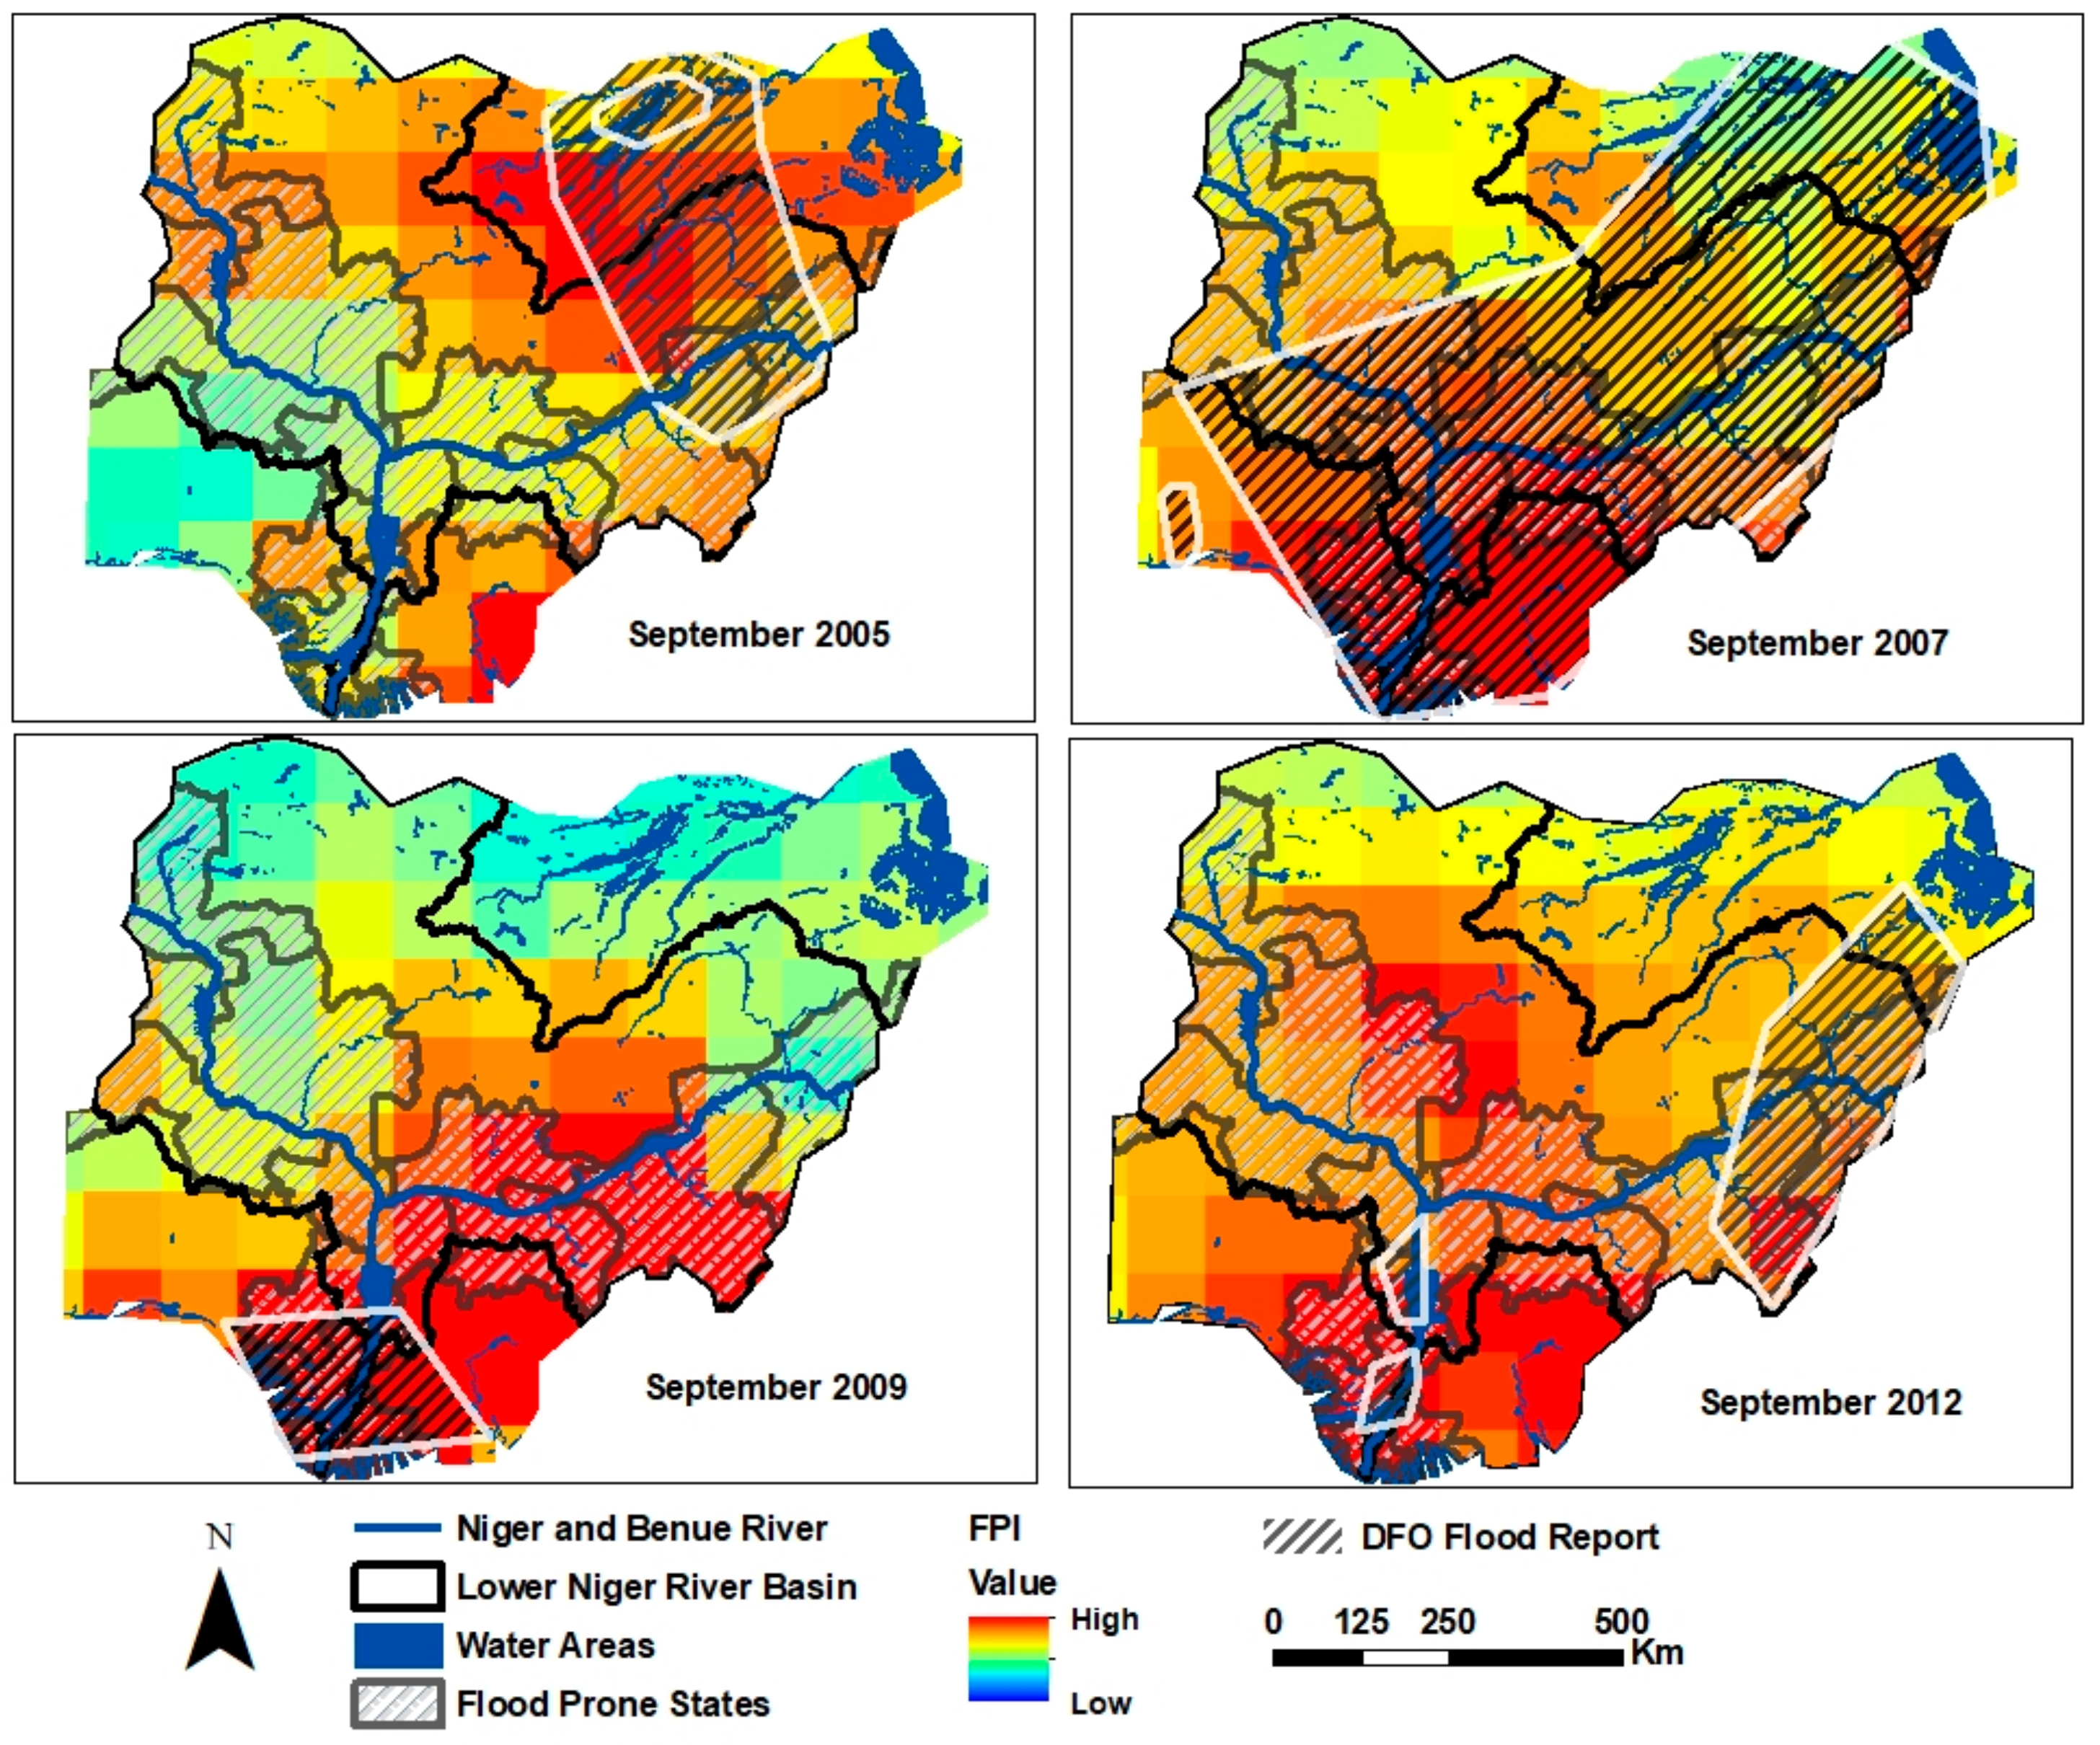
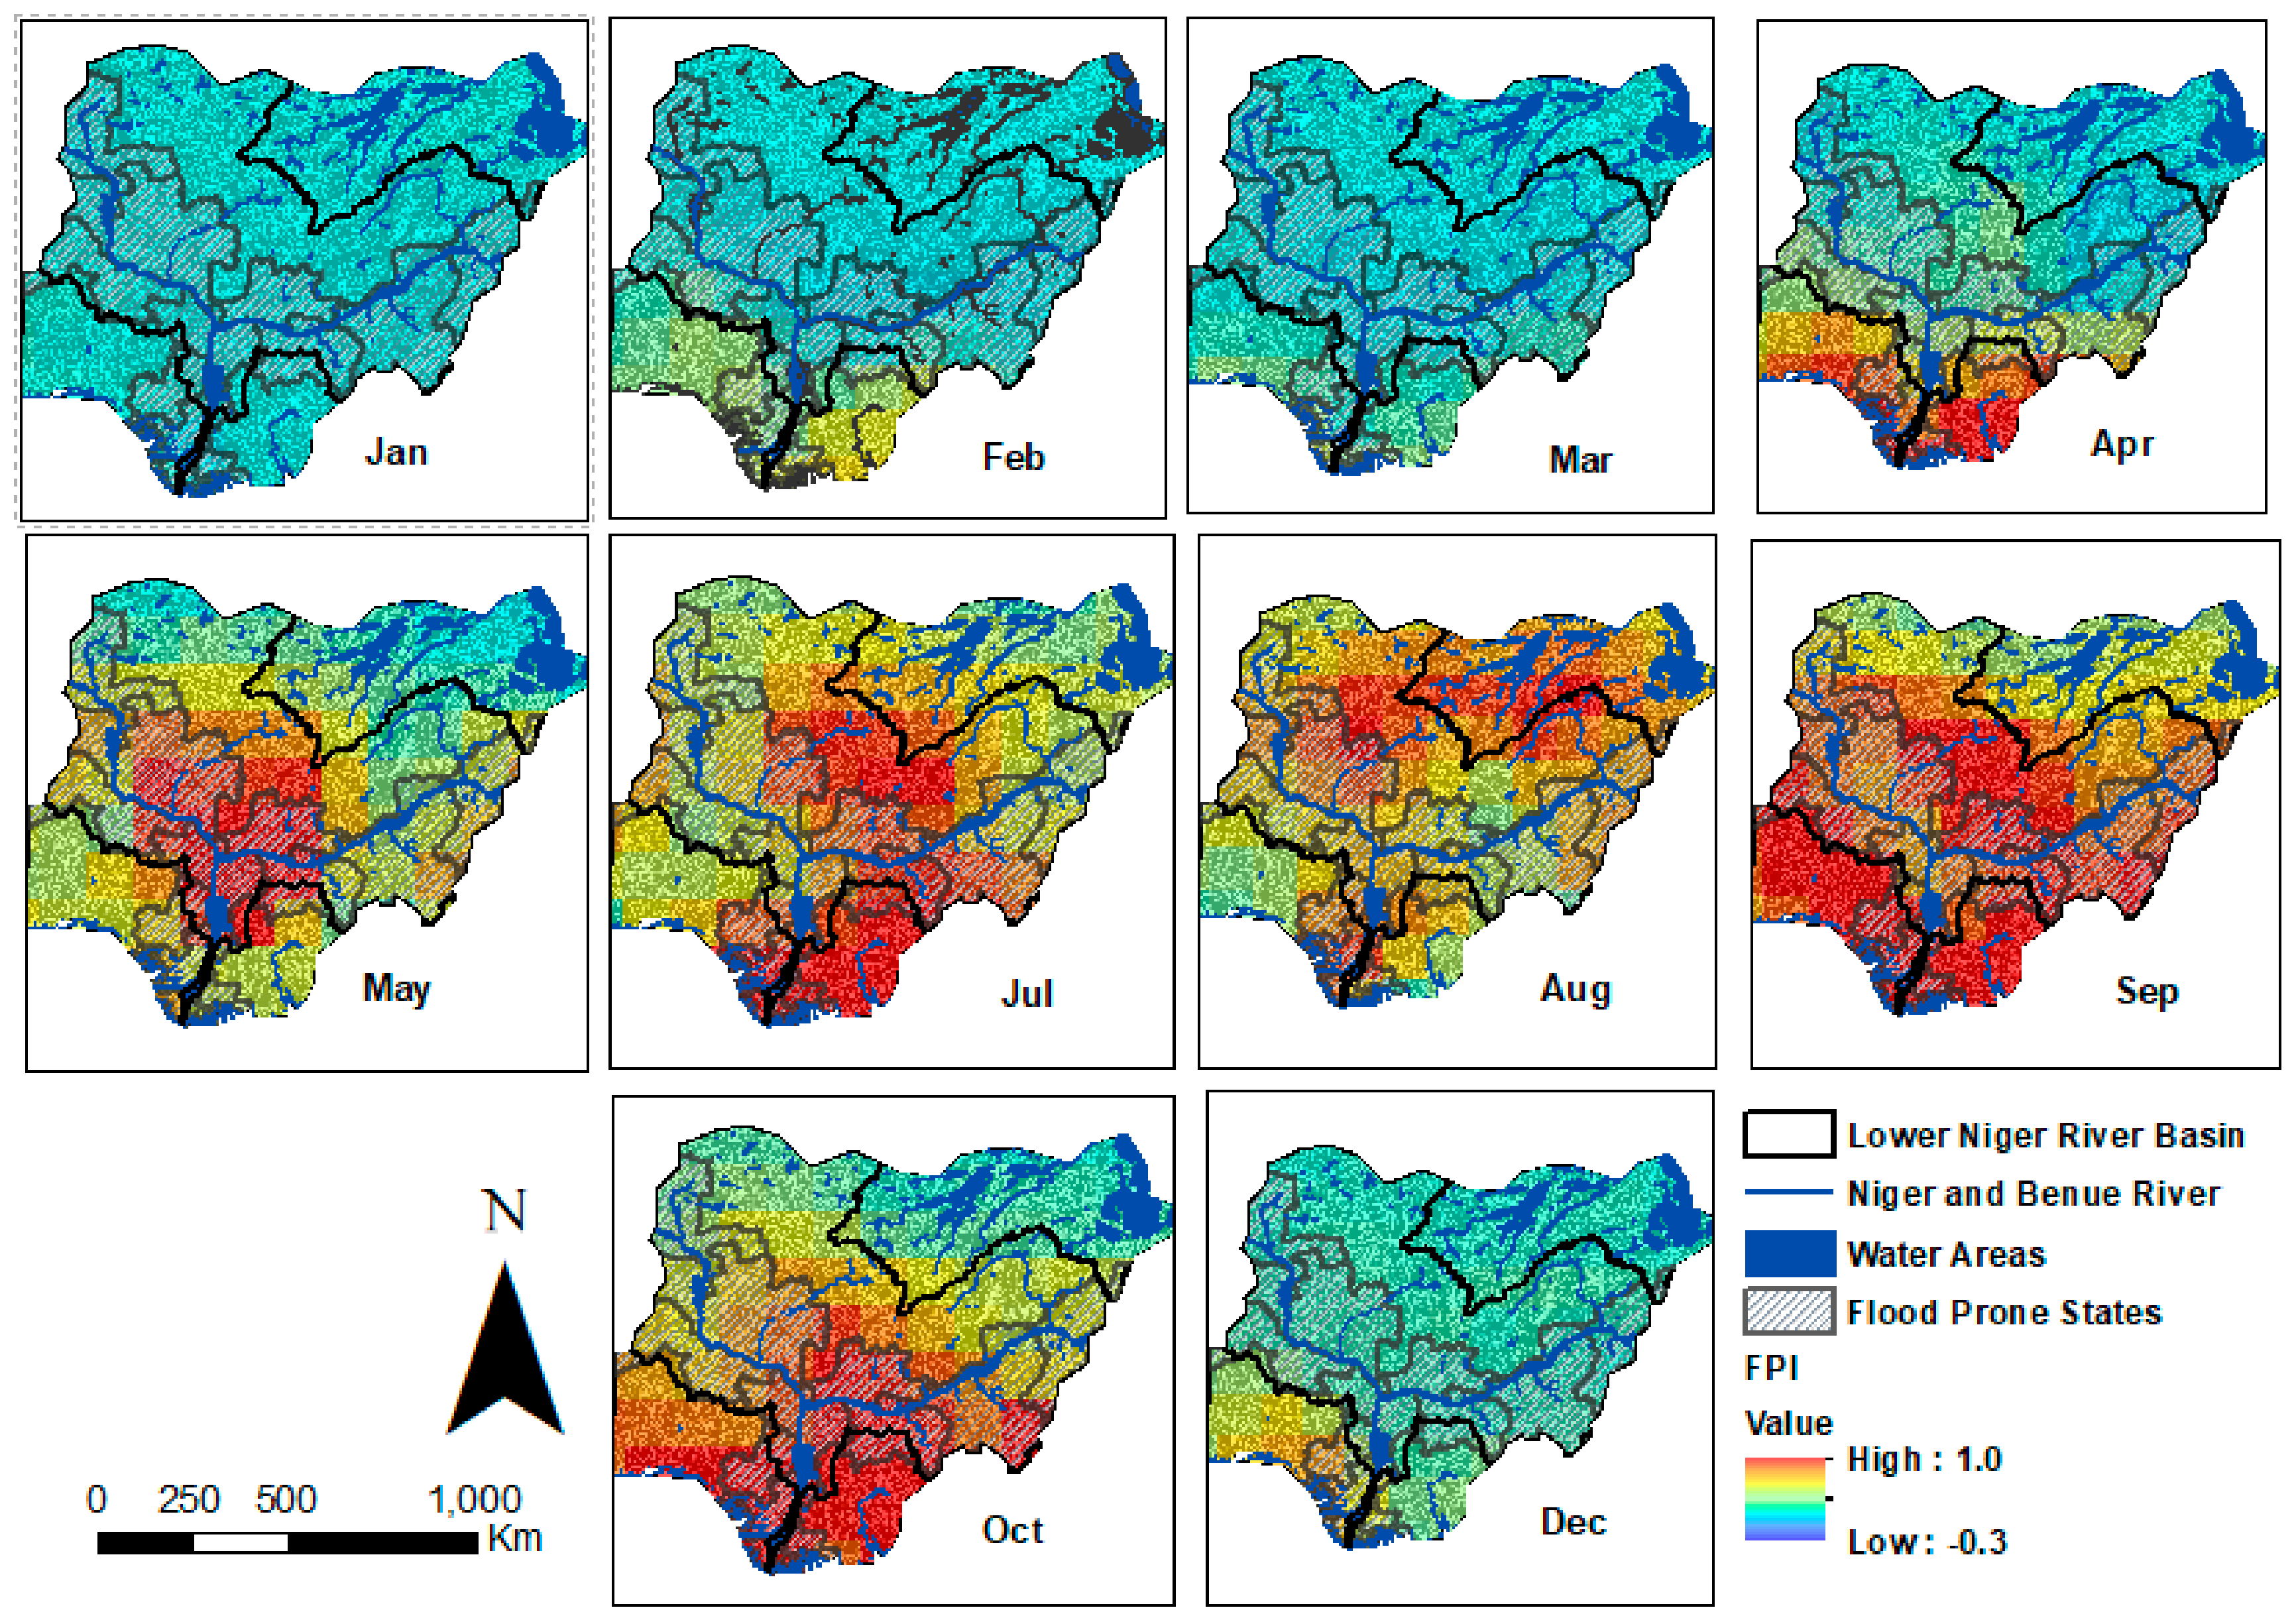
3.2.3. GRACE Flood Potential Index (FPI)
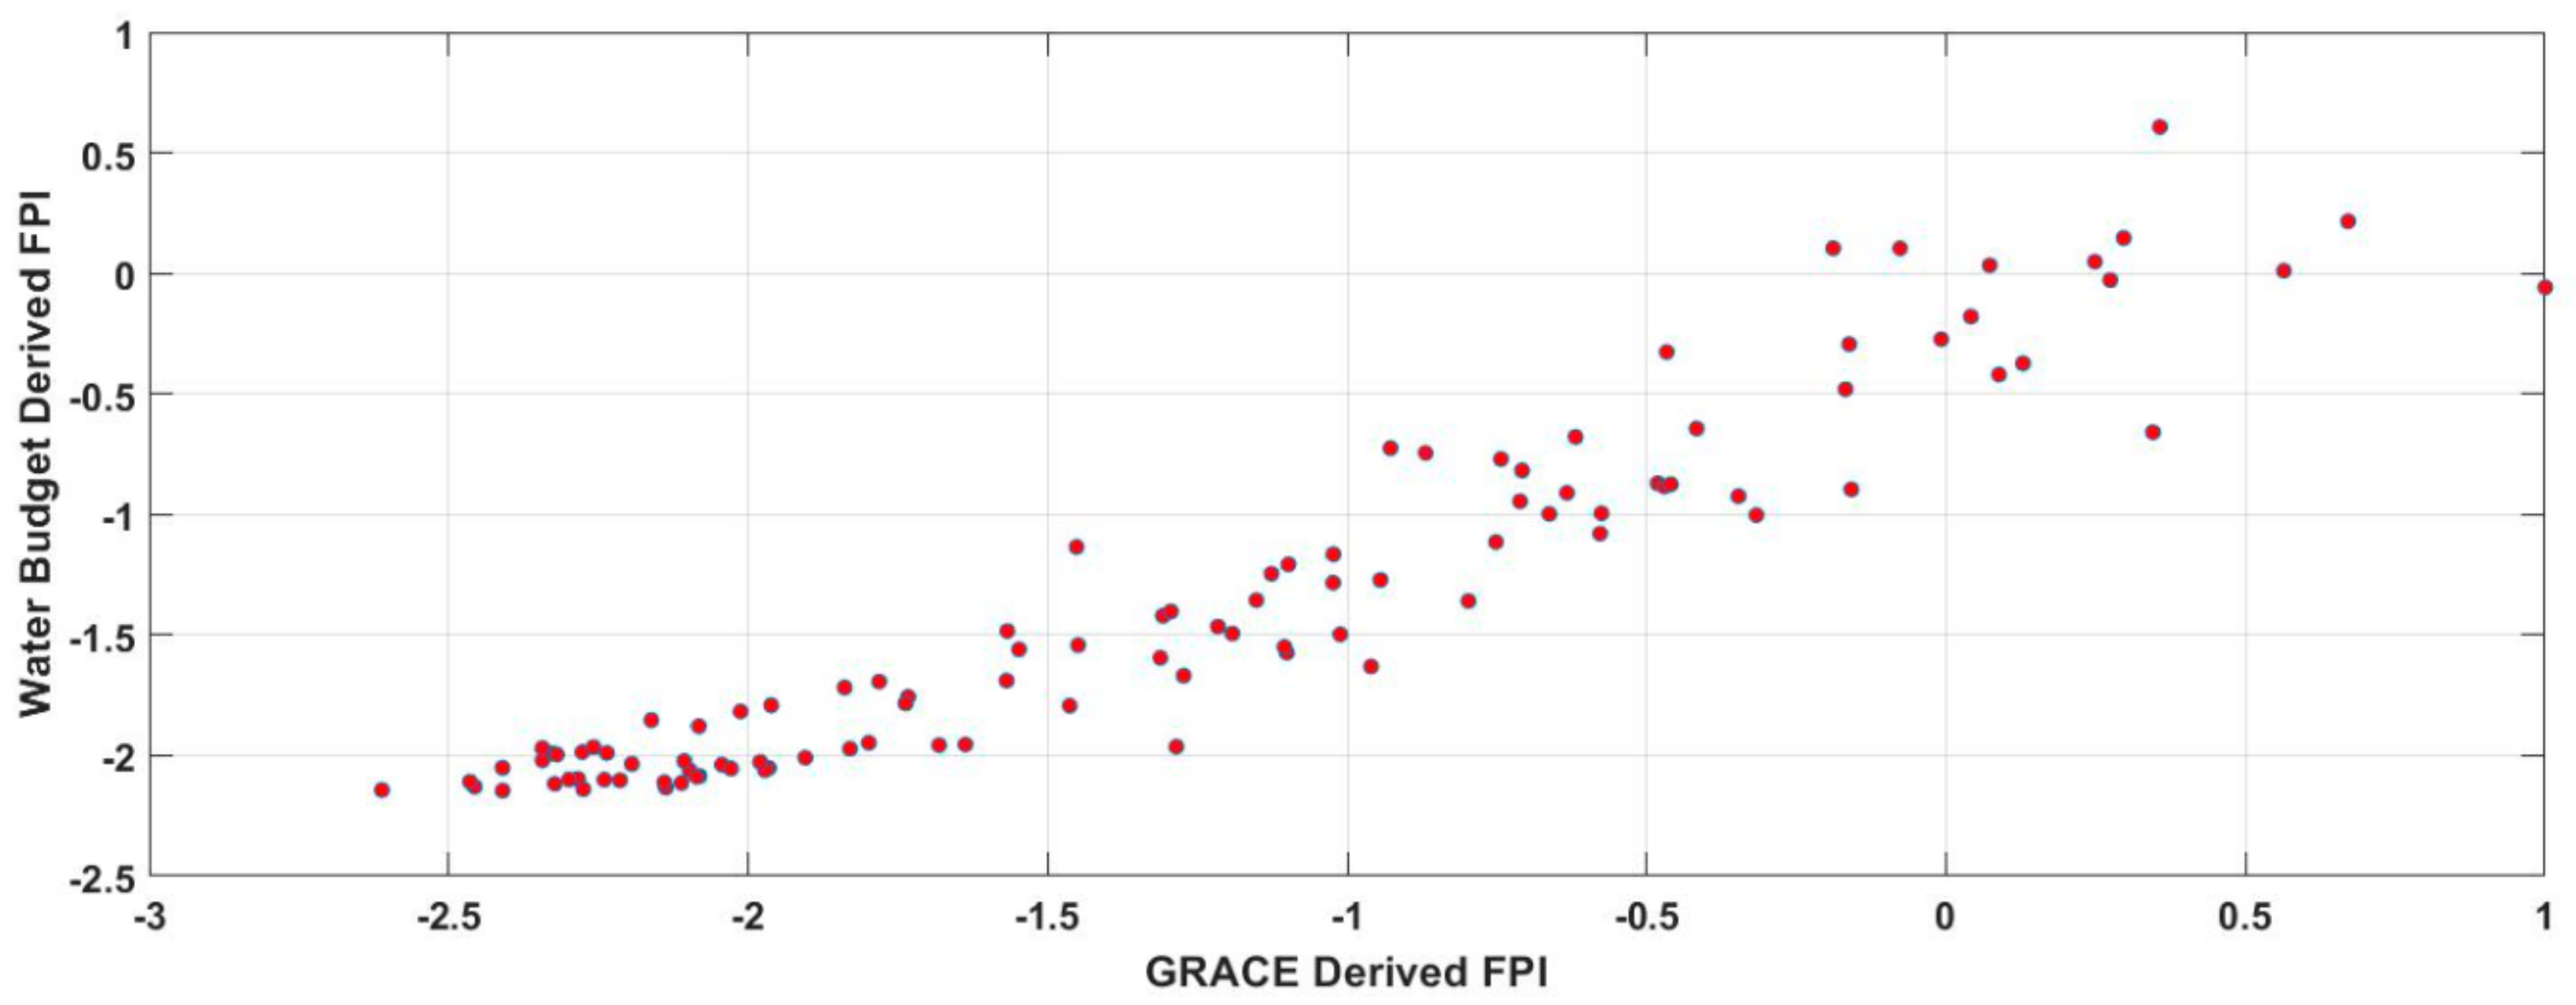
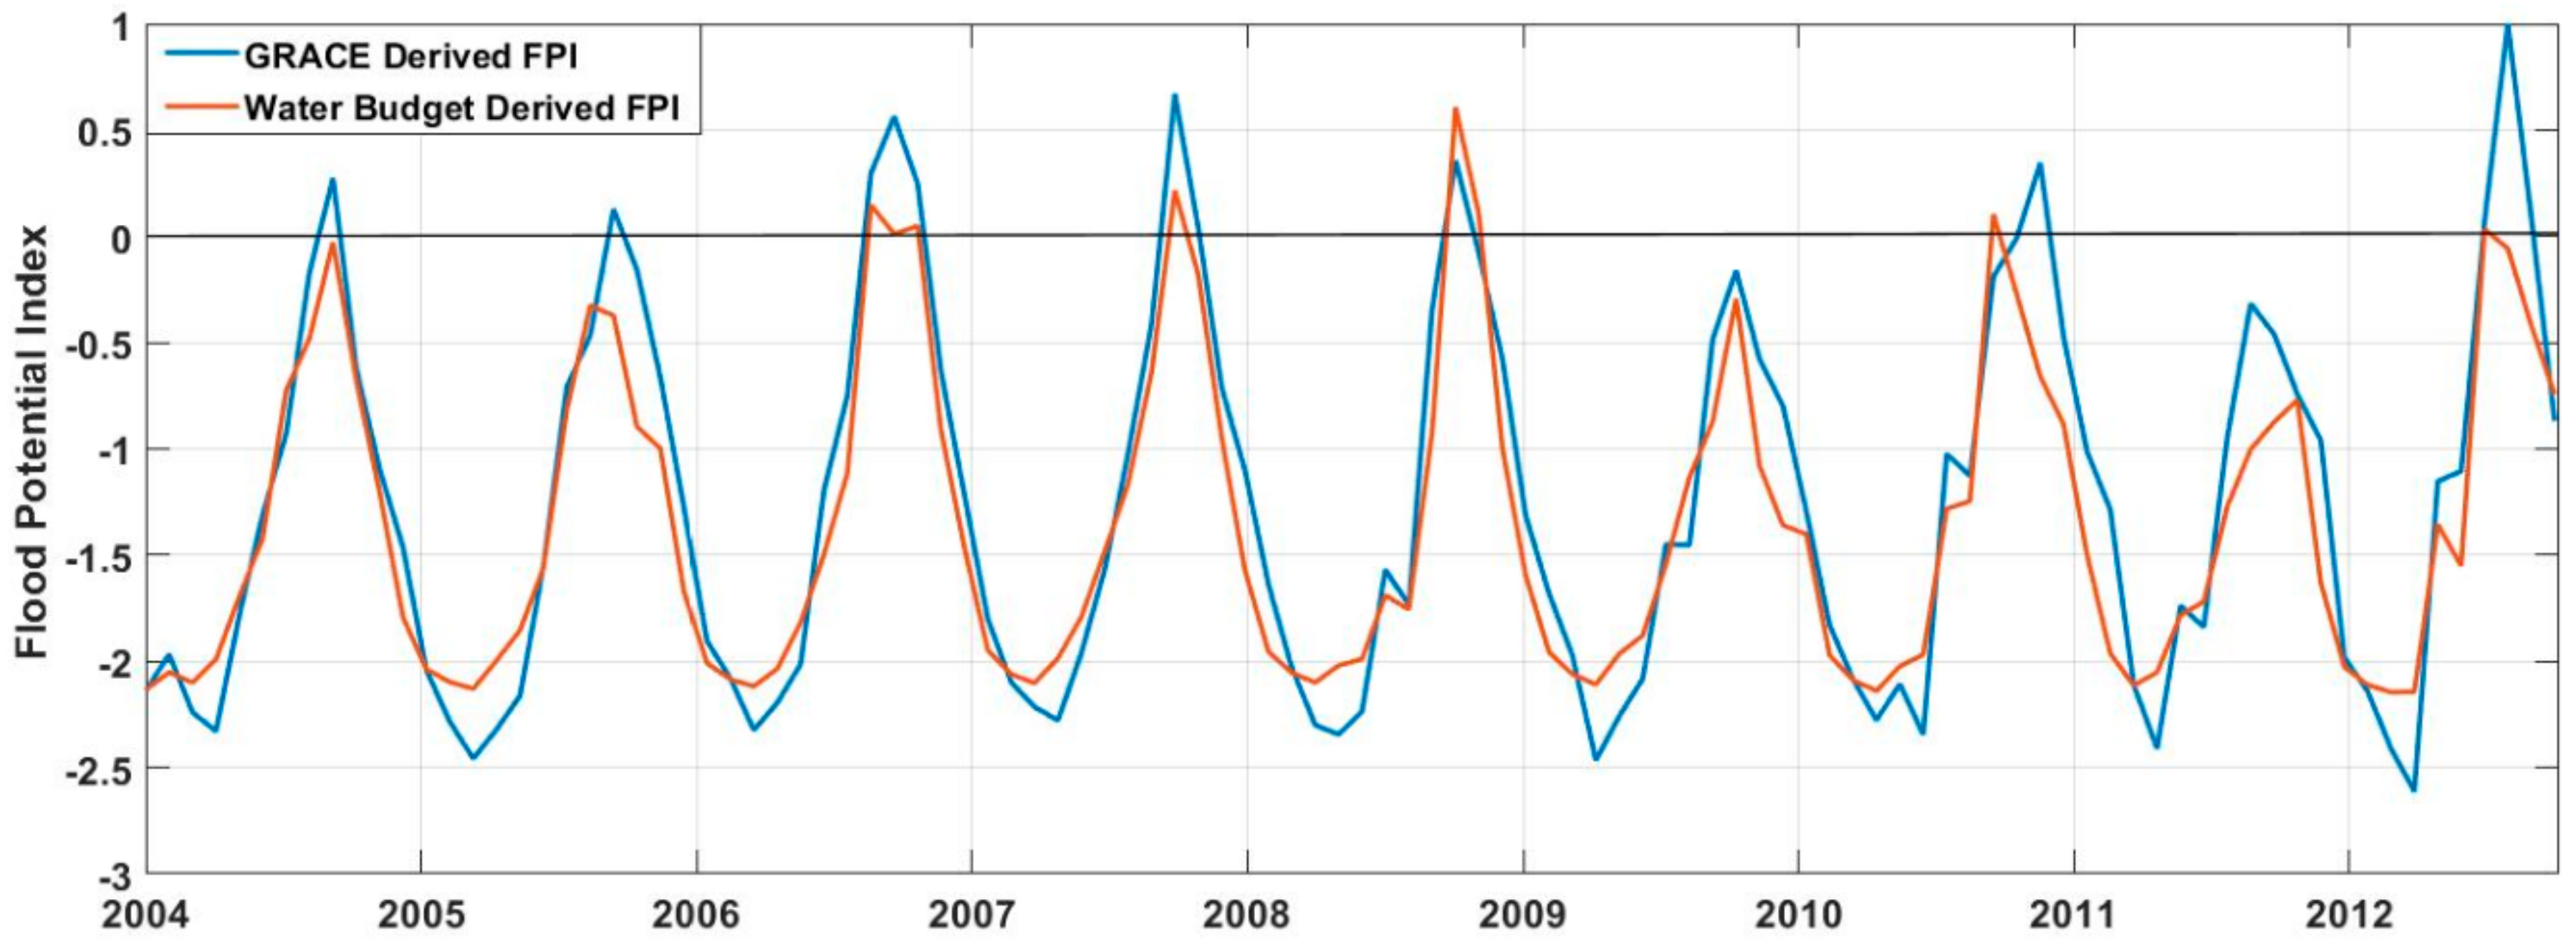
3.2.4. GRACE-Based RFPI Validation
Statistical Test for GRACE and Water Budget Flood Potential Index
4. Discussion
5. Conclusions
Author Contributions
Funding
Acknowledgments
Conflicts of Interest
References
- Folorunsho, R.; Awosika, L.F. Flood Mitigation in Lagos, Nigeria through Wise Management of Solid Waste: A Case of Ikoyi and Victoria Islands, Nigeria. Paper Presented at the UNESCO—CSI Workshop Maputo, Maputo, Mozambique, 19–23 November 2001. [Google Scholar]
- Olajuyigbe, A.; Rotowa, O.; Durojaye, E. An assessment of flood hazard in Nigeria: The case of mile 12, Lagos. Mediterr. J. Soc. Sci. 2012, 3, 367–375. [Google Scholar]
- Bartholmes, J.C.; Thielen, J.; Ramos, M.H.; Gentilini, S. The European flood alert system EFAS – Part 2: Statistical skill assessment of probabilistic and deterministic operational forecasts. Hydrol. Earth Syst. Sci. 2009, 13, 141–153. [Google Scholar] [CrossRef]
- Scawthorn, C. Modeling flood events in the US. In Proceedings of the Euro Conference on Global Change and Catastrophe Risk Management, HASA, Laxenburg, Austria, 6–9 June 1999. [Google Scholar]
- Tariq, M.A.U.R. Risk-Based Planning and Optimization of Flood Management Measures in Developing Countries: Case Pakistan. Ph.D. Thesis, VSSD, Delft University of Technology, Delft, The Netherlands, 2012. [Google Scholar]
- Victor, K. Remote Sensing of Floods and Flood-Prone Areas: An Overview. J. Coast. Res. 2015, 31, 1005–1013. [Google Scholar]
- Nasreddine, B.; Feng, Z.; Luca, B.; Yanbo, H.; Yumin, T. Near-Real-Time Flood Forecasting Based on Satellite Precipitation Products. Remote Sens. 2019, 11, 252. [Google Scholar] [CrossRef]
- Sheffield, J.E.F.; Wood, N.; Chaney, K.; Guan, S.; Sadri, X.; Yuan, L.; Olang, A.; Amani, A.; Ali, S.; Demuth, L. A Drought Monitoring and Forecasting System for Sub-Sahara African Water Resources and Food Security. Bull. Amer. Meteor. Soc. 2014, 95, 861–882. [Google Scholar] [CrossRef]
- Zhang, X.; Tang, Q.; Liu, X.; Leng, G.; Li, Z. Soil Moisture Drought Monitoring and Forecasting Using Satellite and Climate Model Data over Southwestern China. J. Hydrometeor. 2017, 18, 23. [Google Scholar] [CrossRef]
- Hossain, F.; Anagnostou, E.N. Assessment of current passive-microwave- and infrared-based satellite rainfall remote sensing for flood prediction. J. Geophys. Res. Atmos. 2005, 110, D07102. [Google Scholar] [CrossRef]
- Brakenridge, R.; Anderson, E. Modis-Based Flood Detection, Mapping and Measurement: The Potential for Operational Hydrological Applications. In Transboundary Floods: Reducing Risks Through Flood Management; Marsalek, J., Stancalie, G., Balint, G., Eds.; Nato Science Series IV: Earth and Environmental Sciences; Springer: Dordrecht, The Netherlands, 2006; pp. 1–12. [Google Scholar]
- Zhan, X.; Ryu, D.; Crow, W. Improving Flood Prediction Through the Assimilation of AMSR-E Soil Moisture Retrievals into a Hydrologic Model; American Geophysical Union, Fall Meeting Moscone Center: San Francisco, CA, USA, 2006; abstract ID: H23E-1545. [Google Scholar]
- Adam, D. Gravity measurement: Amazing GRACE. Nature 2002, 416, 10–11. [Google Scholar] [CrossRef] [PubMed]
- Chen, J.L.; Wilson, C.R.; Tapley, B.D.; Ries, J.C. Low degree gravitational changes from GRACE: Validation and interpretation. Geophys. Res. Lett. 2004, 31, L22607. [Google Scholar] [CrossRef]
- Longuevergne, L.; Scanlon, B.R.; Wilson, C.R. GRACE Hydrological estimates for small basins: Evaluating processing approaches on the High Plains Aquifer, USA. Water Resour. Res. 2010, 46, W11517. [Google Scholar] [CrossRef]
- Reager, J.T.; Thomas, B.F.; Famiglietti, J.S. River basin flood potential inferred using GRACE gravity observations at several months lead-time. Nat. Geosci. 2014, 7, 588–592. [Google Scholar] [CrossRef]
- Reager, J.T.; Famiglietti, J.S. Global terrestrial water storage capacity and flood potential using GRACE. Geophys. Res. Lett. 2009, 36, L23402. [Google Scholar] [CrossRef]
- Molodtsova, T.; Molodtsov, S.; Kirilenko, A.; Zhang, X.; VanLooy, J. Evaluating flood potential with GRACE in the United States. Nat. Hazards Earth Syst. Sci. 2016, 16, 1011–1018. [Google Scholar] [CrossRef] [Green Version]
- Sun, Z.; Zhu, X.; Pan, Y.; Zhang, J. Assessing Terrestrial Water Storage and Flood Potential Using GRACE Data in the Yangtze River Basin, China. Remote Sens. 2017, 9, 1011. [Google Scholar] [CrossRef]
- IFRCS—International Federation of Red Cross and Red Crescent Emergency Appeal; Nigeria: Floods. Available online: http://reliefweb.int/sites/reliefweb.int/files/resources/MDRNG01401.pdf (accessed on 10 January 2019).
- Kwari, J.W.; Paul, M.K.; Shekarau, L.B. The Impacts of Flooding on Socio-Economic Development and Agriculture in Northern Nigeria: A Case Study of 2012 Flooding in Yola and Numan Areas of Adamawa State Nigeria. Int. J. Sci. Eng. Res. 2015, 6, 1433–1442. [Google Scholar]
- Mazawaje, D.F.; Tsenbeya, I.T.; Ismaila, A.B. Analysis of the determinants of floods in Numan Town, Nigeria. J. Environ. Sci. Eng. 2014, B3, 264–273. [Google Scholar] [CrossRef]
- NASA Earth Observatory—Flooding in Nigeria. Available online: https://earthobservatory.nasa.gov/images/79404/flooding-in-nigeria (accessed on 20 August 2019).
- Swenson, S.C. GRACE Monthly Land Water Mass Grids NETCDF RELEASE 5.0 Ver. 5.0. PO. DAAC, CA, USA, 2012. Available online: http://dx.doi.org/10.5067/TELND-NC005 (accessed on 20 September 2018).
- Velicogna, I.; Wahr, J. Measurements of time-variable gravity show mass loss in Antarctica. Science 2016, 311, 1754–1756. [Google Scholar] [CrossRef] [PubMed]
- EartH2Observe project, Plymouth Marine Laboratory Remote Sensing Group, European Union’s Seventh Programme for Research, Technological Development and Demonstration under Grant Agreement No. 603608. Available online: https://wci.earth2observe.eu/ (accessed on 10 October 2018).
- Schneider, U.; Becker, A.; Finger, P.; Meyer-Christoffer, A.; Rudolf, B.; Ziese, M. GPCC Full Data Reanalysis Version 6.0 at 1.0° Monthly Land-Surface Precipitation from Rain-Gauges built on GTS-based and Historic Data 2011. Available online: https://opendata.dwd.de/climate_environment/GPCC/html/fulldata_v6_doi_download.html (accessed on 23 September 2018). [CrossRef]
- Sakumura, C.; Bettadpur, S.; Bruinsma, S. Ensemble prediction and intercomparison analysis of GRACE time-variable gravity field models. Geophys. Res. Lett. 2014, 41, 1389–1397. [Google Scholar] [CrossRef]
- NASA-JPL. GRACE D-103133 Gravity Recovery and Climate Experiment Level-3 Data Product User Handbook; NASA-JPL: Pasadena, CA, USA, 2019. [Google Scholar]
- DFO (Dartmouth Flood Observatory), Global Active Archive of Large Flood Events. Available online: http://www.dartmouth.edu/~floods/Archives/ (accessed on 14 December 2018).
- Climate-Data.Org. Climate Adamawa. Available online: https://en.climate-data.org/africa/niger/zinder/adamawa-349376/ (accessed on 22 February 2019).


| Country | Date | Death Toll | Number of People Affected | Number of People Displaced | Cause(s) | Cost of Damage |
|---|---|---|---|---|---|---|
| Pakistan | September | 455 | >5,000,000 | 350,000 | Heavy monsoon rains | N/A |
| Nigeria | July–October | 363 | 7,000,000 | 2,100,000 | Heavy rains and water release from Dam | US $7.2 billion |
| North Korea | July–September | 330 | N/A | 241,547 | Torrential rains and tropical storm Khanun | N/A |
| Russia | July | 171 | 30,000 | 13,000 | Heavy rainfall | N/A |
| Philippines | August | 95 | 1,230,000 | 15,134 | Torrential rains | US $14.31 million |
| China | July | 79 | >1,600,000 | 56,933 | Heavy rainfall | US $1.6 billion |
| India | August | 35 | >12,000 | N/A | Monsoon rainfall | US $89 million |
| Nepal | May | 26 | N/A | N/A | Flooding from the outburst of a landslide dam | N/A |
| Years | Flood Potential Index | |
|---|---|---|
| September | GRACE-Based FPI | Water Budget-Based FPI |
| 2005 | 0.2 | −0.3 |
| 2006 | 0.6 | 0.2 |
| 2007 | 0.7 | 0.3 |
| 2009 | −0.3 | −0.2 |
| 2010 | 0.4 | 0.2 |
| 2012 | 0.9 | 0.1 |
| Year | Flood Prone States | FPI |
|---|---|---|
| 2012 | Adamawa | 1 |
| Anambra | 0.5 | |
| Bayelsa | 0.4 | |
| Benue | 0.8 | |
| Delta | 0.5 | |
| Edo | 0.4 | |
| Kebbi | 0.5 | |
| Kogi | 0.7 | |
| Kwara | 0.5 | |
| Nassarawa | 0.4 | |
| Niger | 0.8 | |
| Rivers | 0.7 | |
| Taraba | 0.6 |
© 2019 by the authors. Licensee MDPI, Basel, Switzerland. This article is an open access article distributed under the terms and conditions of the Creative Commons Attribution (CC BY) license (http://creativecommons.org/licenses/by/4.0/).
Share and Cite
Idowu, D.; Zhou, W. Performance Evaluation of a Potential Component of an Early Flood Warning System—A Case Study of the 2012 Flood, Lower Niger River Basin, Nigeria. Remote Sens. 2019, 11, 1970. https://doi.org/10.3390/rs11171970
Idowu D, Zhou W. Performance Evaluation of a Potential Component of an Early Flood Warning System—A Case Study of the 2012 Flood, Lower Niger River Basin, Nigeria. Remote Sensing. 2019; 11(17):1970. https://doi.org/10.3390/rs11171970
Chicago/Turabian StyleIdowu, Dorcas, and Wendy Zhou. 2019. "Performance Evaluation of a Potential Component of an Early Flood Warning System—A Case Study of the 2012 Flood, Lower Niger River Basin, Nigeria" Remote Sensing 11, no. 17: 1970. https://doi.org/10.3390/rs11171970