Next Issue
Volume 11, September-2
Previous Issue
Volume 11, August-2
 
 
remotesensing-logo

Journal Browser

Journal Browser

Remote Sens., Volume 11, Issue 17 (September-1 2019) – 114 articles

Cover Story (view full-size image): 
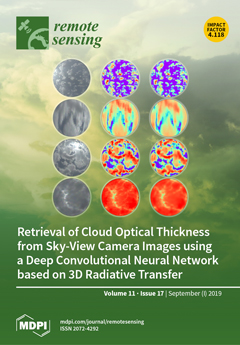
Observation of the spatial distribution of cloud optical thickness (COT) is useful for the prediction and diagnosis of photovoltaic power generation. Using deep learning techniques, a convolutional neural network (CNN) has been trained based on synthetic spectral radiance data generated using a 3D atmospheric radiative transfer model, which enables the quick estimation of the COT distribution from the image of a ground-mounted radiometrically calibrated digital camera. The CNN retrieves the COT spatial distribution using spectral features and spatial contexts. Evaluation of the method using synthetic data and a comparison with the existing method shows promising results. Shown on the cover page are (left) synthetic camera images, (middle) ground truth COT, and (right) COT estimated by CNN. View this paper.
  • Issues are regarded as officially published after their release is announced to the table of contents alert mailing list.
  • You may sign up for e-mail alerts to receive table of contents of newly released issues.
  • PDF is the official format for papers published in both, html and pdf forms. To view the papers in pdf format, click on the "PDF Full-text" link, and use the free Adobe Reader to open them.
Order results
Result details
Section
Select all
Export citation of selected articles as:
16 pages, 2459 KiB  
Article
Performance of Selected Ionospheric Models in Multi-Global Navigation Satellite System Single-Frequency Positioning over China
by Ahao Wang, Junping Chen, Yize Zhang, Lingdong Meng and Jiexian Wang
Remote Sens. 2019, 11(17), 2070; https://doi.org/10.3390/rs11172070 - 03 Sep 2019
Cited by 19 | Viewed by 3250
Abstract
Ionospheric delay as the major error source needs to be properly handled in multi-GNSS (Global Navigation Satellite System) single-frequency positioning and the different ionospheric models exhibit apparent performance difference. In this study, two single-frequency positioning solutions with different ionospheric corrections are utilized to [...] Read more.
Ionospheric delay as the major error source needs to be properly handled in multi-GNSS (Global Navigation Satellite System) single-frequency positioning and the different ionospheric models exhibit apparent performance difference. In this study, two single-frequency positioning solutions with different ionospheric corrections are utilized to comprehensively analyze the ionospheric delay effects on multi-frequency and multi-constellation positioning performance, including standard point positioning (SPP) and ionosphere-constrained precise point positioning (PPP). The four ionospheric models studied are the GPS broadcast ionospheric model (GPS-Klo), the BDS (BeiDou Navigation Satellite System) broadcast ionospheric model (BDS-Klo), the BDS ionospheric grid model (BDS-Grid) and the Global Ionosphere Maps (GIM) model. Datasets are collected from 10 stations over one month in 2019. The solar remained calm and the ionosphere was stable during the test period. The experimental results show that for single-frequency SPP, the GIM model achieves the best accuracy, and the positioning accuracy of the BDS-Klo and BDS-Grid model is much better than the solution with GPS-Klo model in the N and U components. For the single-frequency PPP performance, the average convergence time of the ionosphere-constrained PPP is much reduced compared with the traditional PPP approach, where the improvements are of 11.2%, 11.9%, 21.3% and 39.6% in the GPS-Klo-, BDS-Klo-, BDS-Grid- and GIM-constrained GPS + GLONASS + BDS single-frequency PPP solutions, respectively. Furthermore, the positioning accuracy of the BDS-Grid- and GIM-constrained PPP is generally the same as the ionosphere-free combined single-frequency PPP. Through the combination of GPS, GLONASS and BDS, the positioning accuracy and convergence performance for all single-system single-frequency SPP/PPP solutions can be effectively improved. Full article
Show Figures

Figure 1

18 pages, 2682 KiB  
Article
Integrating SEBAL with in-Field Crop Water Status Measurement for Precision Irrigation Applications—A Case Study
by Stefano Gobbo, Stefano Lo Presti, Marco Martello, Lorenza Panunzi, Antonio Berti and Francesco Morari
Remote Sens. 2019, 11(17), 2069; https://doi.org/10.3390/rs11172069 - 03 Sep 2019
Cited by 22 | Viewed by 4461
Abstract
The surface energy balance algorithm for land (SEBAL) has been demonstrated to provide accurate estimates of crop evapotranspiration (ET) and yield at different spatial scales even under highly heterogeneous conditions. However, validation of the SEBAL using in-field direct and indirect measurements of plant [...] Read more.
The surface energy balance algorithm for land (SEBAL) has been demonstrated to provide accurate estimates of crop evapotranspiration (ET) and yield at different spatial scales even under highly heterogeneous conditions. However, validation of the SEBAL using in-field direct and indirect measurements of plant water status is a necessary step before deploying the algorithm as an irrigation scheduling tool. To this end, a study was conducted in a maize field located near the Venice Lagoon area in Italy. The experimental area was irrigated using a 274 m long variable rate irrigation (VRI) system with 25-m sections. Three irrigation management zones (IMZs; high, medium and low irrigation requirement zones) were defined combining soil texture and normalized difference vegetation index (NDVI) data. Soil moisture sensors were installed in the different IMZs and used to schedule irrigation. In addition, SEBAL-based actual evapotranspiration (ETr) and biomass estimates were calculated throughout the season. VRI management allowed crop water demand to be matched, saving up to 42 mm (−16%) of water when compared to uniform irrigation rates. The high irrigation amounts applied during the growing season to avoid water stress resulted in no significant differences among the IMZs. SEBAL-based biomass estimates agreed with in-season measurements at 72, 105 and 112 days after planting (DAP; r2 = 0.87). Seasonal ET matched the spatial variability observed in the measured yield map at harvest. Moreover, the SEBAL-derived yield map largely agreed with the measured yield map with relative errors of 0.3% among the IMZs and of 1% (0.21 t ha−1) for the whole field. While the FAO method-based stress coefficient (Ks) never dropped below the optimum condition (Ks = 1) for all the IMZs and the uniform zone, SEBAL Ks was sensitive to changes in water status and remained below 1 during most of the growing season. Using SEBAL to capture the daily spatial variation in crop water needs and growth would enable the definition of transient, dynamic IMZs. This allows farmers to apply proper irrigation amounts increasing water use efficiency. Full article
Show Figures

Figure 1

19 pages, 4025 KiB  
Article
Remote Sensing Estimation of Lake Total Phosphorus Concentration Based on MODIS: A Case Study of Lake Hongze
by Junfeng Xiong, Chen Lin, Ronghua Ma and Zhigang Cao
Remote Sens. 2019, 11(17), 2068; https://doi.org/10.3390/rs11172068 - 03 Sep 2019
Cited by 38 | Viewed by 5185
Abstract
Phosphorus (P) is an important substance for the growth of phytoplankton and an efficient index to assess the water quality. However, estimation of the TP concentration in waters by remote sensing must be associated with optical substances such as the chlorophyll-a (Chla) and [...] Read more.
Phosphorus (P) is an important substance for the growth of phytoplankton and an efficient index to assess the water quality. However, estimation of the TP concentration in waters by remote sensing must be associated with optical substances such as the chlorophyll-a (Chla) and the suspended particulate matter (SPM). Based on the good correlation between the suspended inorganic matter (SPIM) and P in Lake Hongze, we used the direct and indirect derivation methods to develop algorithms for the total phosphorus (TP) estimation with the MODIS/Aqua data. Results demonstrate that the direct derivation algorithm based on 645 nm and 1240 nm of the MODIS/Aqua performs a satisfied accuracy (R2 = 0.75, RMSE = 0.029mg/L, MRE = 39% for the training dataset, R2 = 0.68, RMSE = 0.033mg/L, MRE = 47% for the validate dataset), which is better than that of the indirect derivation algorithm. The 645 nm and 1240 nm of MODIS are the main characteristic band of the SPM, so that algorithm can effectively reflect the P variations in Lake Hongze. Additionally, the ratio of the TP to the SPM is positively correlated with the accuracy of the algorithm as well. The proportion of the SPIM in the SPM has a complex effect on the accuracy of the algorithm. When the SPIM accounts for 78%, the algorithm achieves the highest accuracy. Furthermore, the performance of this direct derivation algorithm was examined in two inland lakes in China (Lake Nanyi and Lake Chaohu), it derived the expected P distribution in Lake Nanyi whereas the algorithm failed in Lake Chaohu. Different water properties influence significantly the accuracy of this direct derivation algorithm, while the TP, Chla, and suspended particular inorganic matter (SPOM) of Lake Chaohu are much higher than those of the other two lakes, thus it is difficult to estimate the TP concentration by a simple band combination in Lake Chaohu. Although the algorithm depends on the dataset used in the development, it usually presents a good estimation for those waters where the SPIM dominated, especially when the SPIM accounts for 60% to 80% of the SPM. This research proposed a direct derivation algorithm for the TP estimation for the turbid lake and will provide a theoretical and practical reference for extending the optical remote sensing application and the TP empirical algorithm of Lake Hongze’s help for the local government management water quality. Full article
(This article belongs to the Special Issue Satellite Monitoring of Water Quality and Water Environment)
Show Figures

Graphical abstract

19 pages, 14147 KiB  
Article
SAR-to-Optical Image Translation Based on Conditional Generative Adversarial Networks—Optimization, Opportunities and Limits
by Mario Fuentes Reyes, Stefan Auer, Nina Merkle, Corentin Henry and Michael Schmitt
Remote Sens. 2019, 11(17), 2067; https://doi.org/10.3390/rs11172067 - 03 Sep 2019
Cited by 107 | Viewed by 10922
Abstract
Due to its all time capability, synthetic aperture radar (SAR) remote sensing plays an important role in Earth observation. The ability to interpret the data is limited, even for experts, as the human eye is not familiar to the impact of distance-dependent imaging, [...] Read more.
Due to its all time capability, synthetic aperture radar (SAR) remote sensing plays an important role in Earth observation. The ability to interpret the data is limited, even for experts, as the human eye is not familiar to the impact of distance-dependent imaging, signal intensities detected in the radar spectrum as well as image characteristics related to speckle or steps of post-processing. This paper is concerned with machine learning for SAR-to-optical image-to-image translation in order to support the interpretation and analysis of original data. A conditional adversarial network is adopted and optimized in order to generate alternative SAR image representations based on the combination of SAR images (starting point) and optical images (reference) for training. Following this strategy, the focus is set on the value of empirical knowledge for initialization, the impact of results on follow-up applications, and the discussion of opportunities/drawbacks related to this application of deep learning. Case study results are shown for high resolution (SAR: TerraSAR-X, optical: ALOS PRISM) and low resolution (Sentinel-1 and -2) data. The properties of the alternative image representation are evaluated based on feedback from experts in SAR remote sensing and the impact on road extraction as an example for follow-up applications. The results provide the basis to explain fundamental limitations affecting the SAR-to-optical image translation idea but also indicate benefits from alternative SAR image representations. Full article
(This article belongs to the Special Issue Advances in Remote Sensing Image Fusion)
Show Figures

Graphical abstract

23 pages, 3447 KiB  
Article
Estimating Nitrogen from Structural Crop Traits at Field Scale—A Novel Approach Versus Spectral Vegetation Indices
by Nora Tilly and Georg Bareth
Remote Sens. 2019, 11(17), 2066; https://doi.org/10.3390/rs11172066 - 03 Sep 2019
Cited by 11 | Viewed by 4137
Abstract
A sufficient nitrogen (N) supply is mandatory for healthy crop growth, but negative consequences of N losses into the environment are known. Hence, deeply understanding and monitoring crop growth for an optimized N management is advisable. In this context, remote sensing facilitates the [...] Read more.
A sufficient nitrogen (N) supply is mandatory for healthy crop growth, but negative consequences of N losses into the environment are known. Hence, deeply understanding and monitoring crop growth for an optimized N management is advisable. In this context, remote sensing facilitates the capturing of crop traits. While several studies on estimating biomass from spectral and structural data can be found, N is so far only estimated from spectral features. It is well known that N is negatively related to dry biomass, which, in turn, can be estimated from crop height. Based on this indirect link, the present study aims at estimating N concentration at field scale in a two-step model: first, using crop height to estimate biomass, and second, using the modeled biomass to estimate N concentration. For comparison, N concentration was estimated from spectral data. The data was captured on a spring barley field experiment in two growing seasons. Crop surface height was measured with a terrestrial laser scanner, seven vegetation indices were calculated from field spectrometer measurements, and dry biomass and N concentration were destructively sampled. In the validation, better results were obtained with the models based on structural data (R2 < 0.85) than on spectral data (R2 < 0.70). A brief look at the N concentration of different plant organs showed stronger dependencies on structural data (R2: 0.40–0.81) than on spectral data (R2: 0.18–0.68). Overall, this first study shows the potential of crop-specific across‑season two-step models based on structural data for estimating crop N concentration at field scale. The validity of the models for in-season estimations requires further research. Full article
(This article belongs to the Special Issue Remote Sensing for Precision Nitrogen Management)
Show Figures

Graphical abstract

28 pages, 7729 KiB  
Article
CNN-Based Land Cover Classification Combining Stratified Segmentation and Fusion of Point Cloud and Very High-Spatial Resolution Remote Sensing Image Data
by Keqi Zhou, Dongping Ming, Xianwei Lv, Ju Fang and Min Wang
Remote Sens. 2019, 11(17), 2065; https://doi.org/10.3390/rs11172065 - 02 Sep 2019
Cited by 37 | Viewed by 5535
Abstract
Traditional and convolutional neural network (CNN)-based geographic object-based image analysis (GeOBIA) land-cover classification methods prosper in remote sensing and generate numerous distinguished achievements. However, a bottleneck emerges and hinders further improvements in classification results, due to the insufficiency of information provided by very [...] Read more.
Traditional and convolutional neural network (CNN)-based geographic object-based image analysis (GeOBIA) land-cover classification methods prosper in remote sensing and generate numerous distinguished achievements. However, a bottleneck emerges and hinders further improvements in classification results, due to the insufficiency of information provided by very high-spatial resolution images (VHSRIs). To be specific, the phenomenon of different objects with similar spectrum and the lack of topographic information (heights) are natural drawbacks of VHSRIs. Thus, multisource data steps into people’s sight and shows a promising future. Firstly, for data fusion, this paper proposed a standard normalized digital surface model (StdnDSM) method which was actually a digital elevation model derived from a digital terrain model (DTM) and digital surface model (DSM) to break through the bottleneck by fusing VHSRI and cloud points. It smoothed and improved the fusion of point cloud and VHSRIs and thus performed well in follow-up classification. The fusion data then were utilized to perform multiresolution segmentation (MRS) and worked as training data for the CNN. Moreover, the grey-level co-occurrence matrix (GLCM) was introduced for a stratified MRS. Secondly, for data processing, the stratified MRS was more efficient than unstratified MRS, and its outcome result was theoretically more rational and explainable than traditional global segmentation. Eventually, classes of segmented polygons were determined by majority voting. Compared to pixel-based and traditional object-based classification methods, majority voting strategy has stronger robustness and avoids misclassifications caused by minor misclassified centre points. Experimental analysis results suggested that the proposed method was promising for object-based classification. Full article
Show Figures

Figure 1

21 pages, 21384 KiB  
Article
Measuring and Predicting Urban Expansion in the Angkor Region of Cambodia
by Jie Liu, Hongge Ren, Xinyuan Wang, Zeeshan Shirazi and Bin Quan
Remote Sens. 2019, 11(17), 2064; https://doi.org/10.3390/rs11172064 - 02 Sep 2019
Cited by 5 | Viewed by 5884
Abstract
Recent increases in urbanization and tourism threaten the viability of UNESCO world heritage sites across the globe. The Angkor world heritage site located in southern Cambodia is now facing such a challenge. Over the past two decades, Angkor has seen over 300,000% growth [...] Read more.
Recent increases in urbanization and tourism threaten the viability of UNESCO world heritage sites across the globe. The Angkor world heritage site located in southern Cambodia is now facing such a challenge. Over the past two decades, Angkor has seen over 300,000% growth in international tourist arrivals, which has led to uncontrolled development of the nearby city of Siem Reap. This study uses remote sensing and GIS to comprehend the process of urban expansion during the past 14 years, and has applied the CA-Markov model to predict future urban expansion. This paper analyzes the urban pressure on the Angkor site at different scales. The results reveal that the urban area of Siem Reap city increased from 28.23 km2 in 2004 to 73.56 km2 in 2017, an increase of 160%. Urban growth mainly represented a transit-oriented pattern of expansion, and it was also observed that land surfaces, such as arable land, forests, and grasslands, were transformed into urban residential land. The total constructed land area in the core and buffer zones increased by 12.99 km2 from 2004 to 2017, and 72% of the total increase was in the buffer zone. It is predicted that the built-up area in Siem Reap is expected to cover 135.09 km2 by 2025 and 159.14 km2 by 2030. The number of monuments that are most likely be affected by urban expansion is expected to increase from 9 in 2017 to 14 in 2025 and 17 in 2030. The urban area in Siem Reap has increased dramatically over the past decade and monuments continue to be decimated by urban expansion. This paper urges closer attention and urgent actions to minimize the urban pressure on the Angkor site in the future. Full article
Show Figures

Figure 1

23 pages, 14858 KiB  
Article
Spatiotemporal Characterization of Mangrove Phenology and Disturbance Response: The Bangladesh Sundarban
by Christopher Small and Daniel Sousa
Remote Sens. 2019, 11(17), 2063; https://doi.org/10.3390/rs11172063 - 02 Sep 2019
Cited by 17 | Viewed by 3880
Abstract
This work presents a spatiotemporal analysis of the phenology and disturbance response in the Sundarban mangrove forest on the Ganges-Brahmaputra Delta in Bangladesh. The methodological approach is based on an Empirical Orthogonal Function (EOF) analysis of the new Harmonized Landsat Sentinel-2 (HLS) BRDF [...] Read more.
This work presents a spatiotemporal analysis of the phenology and disturbance response in the Sundarban mangrove forest on the Ganges-Brahmaputra Delta in Bangladesh. The methodological approach is based on an Empirical Orthogonal Function (EOF) analysis of the new Harmonized Landsat Sentinel-2 (HLS) BRDF and atmospherically corrected reflectance time series, preceded by a Robust Principal Component Analysis (RPCA) separation of Low Rank and Sparse components of the image time series. Low Rank components are spatially and temporally pervasive while Sparse components are transient and localized. The RPCA clearly separates subtle spatial variations in the annual cycle of monsoon-modulated greening and senescence of the mangrove forest from the spatiotemporally complex agricultural phenology surrounding the Sundarban. A 3 endmember temporal mixture model maps spatially coherent differences in the 2018 greening-senescence cycle of the mangrove which are both concordant and discordant with existing species composition maps. The discordant patterns suggest a phenological response to environmental factors like surface hydrology. On decadal time scales, a standard EOF analysis of vegetation fraction maps from annual post-monsoon Landsat imagery is sufficient to isolate locations of shoreline advance and retreat related to changes in sedimentation and erosion, as well as cyclone-induced defoliation and recovery. Full article
(This article belongs to the Section Biogeosciences Remote Sensing)
Show Figures

Graphical abstract

11 pages, 3613 KiB  
Letter
Global Ionospheric Model Accuracy Analysis Using Shipborne Kinematic GPS Data in the Arctic Circle
by Di Wang, Xiaowen Luo, Jinling Wang, Jinyao Gao, Tao Zhang, Ziyin Wu, Chunguo Yang and Zhaocai Wu
Remote Sens. 2019, 11(17), 2062; https://doi.org/10.3390/rs11172062 - 02 Sep 2019
Cited by 5 | Viewed by 3198
Abstract
The global ionospheric model built by the International Global Navigation Satellite System (GNSS) Service (IGS) using GNSS reference stations all over the world is currently the most widely used ionospheric product on a global scale. Therefore, analysis and evaluation of this ionospheric product’s [...] Read more.
The global ionospheric model built by the International Global Navigation Satellite System (GNSS) Service (IGS) using GNSS reference stations all over the world is currently the most widely used ionospheric product on a global scale. Therefore, analysis and evaluation of this ionospheric product’s accuracy and reliability are essential for the practical use of the product. In contrast to the traditional way of assessing global ionospheric models with ground-based static measurements, our study used shipborne kinematic global positioning system (GPS) measurements collected over 18 days to perform a preliminary analysis and evaluation of the accuracy of the global ionospheric models; our study took place in the Arctic Circle. The data from the International GNSS Service stations near the Arctic Circle were used to verify the ionospheric total electron contents derived from the kinematic data. The results suggested that the global ionospheric model had an approximate regional accuracy of 12 total electron content units (TECu) within the Arctic Circle and deviated from the actual ionospheric total electron content value by about 4 TECu. Full article
(This article belongs to the Section Atmospheric Remote Sensing)
Show Figures

Graphical abstract

24 pages, 6103 KiB  
Article
Accelerated MCMC for Satellite-Based Measurements of Atmospheric CO2
by Otto Lamminpää, Jonathan Hobbs, Jenný Brynjarsdóttir, Marko Laine, Amy Braverman, Hannakaisa Lindqvist and Johanna Tamminen
Remote Sens. 2019, 11(17), 2061; https://doi.org/10.3390/rs11172061 - 02 Sep 2019
Cited by 5 | Viewed by 4166
Abstract
Markov Chain Monte Carlo (MCMC) is a powerful and promising tool for assessing the uncertainties in the Orbiting Carbon Observatory 2 (OCO-2) satellite’s carbon dioxide measurements. Previous research in comparing MCMC and Optimal Estimation (OE) for the OCO-2 retrieval has highlighted the issues [...] Read more.
Markov Chain Monte Carlo (MCMC) is a powerful and promising tool for assessing the uncertainties in the Orbiting Carbon Observatory 2 (OCO-2) satellite’s carbon dioxide measurements. Previous research in comparing MCMC and Optimal Estimation (OE) for the OCO-2 retrieval has highlighted the issues of slow convergence of MCMC, and furthermore OE and MCMC not necessarily agreeing with the simulated ground truth. In this work, we exploit the inherent low information content of the OCO-2 measurement and use the Likelihood-Informed Subspace (LIS) dimension reduction to significantly speed up the convergence of MCMC. We demonstrate the strength of this analysis method by assessing the non-Gaussian shape of the retrieval’s posterior distribution, and the effect of operational OCO-2 prior covariance’s aerosol parameters on the retrieval. We further show that in our test cases we can use this analysis to improve the retrieval to retrieve the simulated true state significantly more accurately and to characterize the non-Gaussian form of the posterior distribution of the retrieval problem. Full article
(This article belongs to the Special Issue Remote Sensing of Carbon Dioxide and Methane in Earth’s Atmosphere)
Show Figures

Graphical abstract

17 pages, 8268 KiB  
Article
Automated Cloud and Cloud-Shadow Masking for Landsat 8 Using Multitemporal Images in a Variety of Environments
by Danang Surya Candra, Stuart Phinn and Peter Scarth
Remote Sens. 2019, 11(17), 2060; https://doi.org/10.3390/rs11172060 - 02 Sep 2019
Cited by 16 | Viewed by 5254
Abstract
Landsat 8 images have been widely used for many applications, but cloud and cloud-shadow cover issues remain. In this study, multitemporal cloud masking (MCM), designed to detect cloud and cloud-shadow for Landsat 8 in tropical environments, was improved for application in sub-tropical environments, [...] Read more.
Landsat 8 images have been widely used for many applications, but cloud and cloud-shadow cover issues remain. In this study, multitemporal cloud masking (MCM), designed to detect cloud and cloud-shadow for Landsat 8 in tropical environments, was improved for application in sub-tropical environments, with the greatest improvement in cloud masking. We added a haze optimized transformation (HOT) test and thermal band in the previous MCM algorithm to improve the algorithm in the detection of haze, thin-cirrus cloud, and thick cloud. We also improved the previous MCM in the detection of cloud-shadow by adding a blue band. In the visual assessment, the algorithm can detect a thick cloud, haze, thin-cirrus cloud, and cloud-shadow accurately. In the statistical assessment, the average user’s accuracy and producer’s accuracy of cloud masking results across the different land cover in the selected area was 98.03% and 98.98%, respectively. On the other hand, the average user’s accuracy and producer’s accuracy of cloud-shadow masking results was 97.97% and 96.66%, respectively. Compared to the Landsat 8 cloud cover assessment (L8 CCA) algorithm, MCM has better accuracies, especially in cloud-shadow masking. Our preliminary tests showed that the new MCM algorithm can detect cloud and cloud-shadow for Landsat 8 in a variety of environments. Full article
(This article belongs to the Special Issue Remote Sensing: 10th Anniversary)
Show Figures

Graphical abstract

27 pages, 12037 KiB  
Article
Remote Sensing of Ice Phenology and Dynamics of Europe’s Largest Coastal Lagoon (The Curonian Lagoon)
by Rasa Idzelytė, Igor E. Kozlov and Georg Umgiesser
Remote Sens. 2019, 11(17), 2059; https://doi.org/10.3390/rs11172059 - 02 Sep 2019
Cited by 11 | Viewed by 3405
Abstract
A first-ever spatially detailed record of ice cover conditions in the Curonian Lagoon (CL), Europe’s largest coastal lagoon located in the southeastern Baltic Sea, is presented. The multi-mission synthetic aperture radar (SAR) measurements acquired in 2002–2017 by Envisat ASAR, RADARSAT-2, Sentinel-1 A/B, and [...] Read more.
A first-ever spatially detailed record of ice cover conditions in the Curonian Lagoon (CL), Europe’s largest coastal lagoon located in the southeastern Baltic Sea, is presented. The multi-mission synthetic aperture radar (SAR) measurements acquired in 2002–2017 by Envisat ASAR, RADARSAT-2, Sentinel-1 A/B, and supplemented by the cloud-free moderate imaging spectroradiometer (MODIS) data, are used to document the ice cover properties in the CL. As shown, satellite observations reveal a better performance over in situ records in defining the key stages of ice formation and decay in the CL. Using advantages of both data sources, an updated ice season duration (ISD) record is obtained to adequately describe the ice cover season in the CL. High-resolution ISD maps provide important spatial details of ice growth and decay in the CL. As found, ice cover resides longest in the south-eastern CL and along the eastern coast, including the Nemunas Delta, while the shortest ice season is observed in the northern CL. During the melting season, the ice melt pattern is clearly shaped by the direction of prevailing winds, and ice drift velocities obtained from a limited number of observations range within 0.03–0.14 m/s. The pronounced shortening of the ice season duration in the CL is observed at a rate of 1.6–2.3 days year‒1 during 2002–2017, which is much higher than reported for the nearby Baltic Sea regions. While the timing of the freeze onset and full freezing has not changed much, the dates of the final melt onset and last observation of ice have a clear decreasing pattern toward an earlier ice break-up and complete melt-off due to an increase of air temperature strongly linked to the North Atlantic Oscillation (NAO). Notably, the correlation between the ISD, air temperature, and winter NAO index is substantially higher when considering the lagoon-averaged ISD values derived from satellite observations compared to those derived from coastal records. The latter clearly demonstrated the richness of the satellite observations that should definitely be exploited in regional ice monitoring programs. Full article
Show Figures

Figure 1

25 pages, 12616 KiB  
Article
Detection of Small Target Using Schatten 1/2 Quasi-Norm Regularization with Reweighted Sparse Enhancement in Complex Infrared Scenes
by Fei Zhou, Yiquan Wu, Yimian Dai and Peng Wang
Remote Sens. 2019, 11(17), 2058; https://doi.org/10.3390/rs11172058 - 02 Sep 2019
Cited by 24 | Viewed by 2741
Abstract
In uniform infrared scenes with single sparse high-contrast small targets, most existing small target detection algorithms perform well. However, when encountering multiple and/or structurally sparse targets in complex backgrounds, these methods potentially lead to high missing and false alarm rate. In this paper, [...] Read more.
In uniform infrared scenes with single sparse high-contrast small targets, most existing small target detection algorithms perform well. However, when encountering multiple and/or structurally sparse targets in complex backgrounds, these methods potentially lead to high missing and false alarm rate. In this paper, a novel and robust infrared single-frame small target detection is proposed via an effective integration of Schatten 1/2 quasi-norm regularization and reweighted sparse enhancement (RS1/2NIPI). Initially, to achieve a tighter approximation to the original low-rank regularized assumption, a nonconvex low-rank regularizer termed as Schatten 1/2 quasi-norm (S1/2N) is utilized to replace the traditional convex-relaxed nuclear norm. Then, a reweighted l1 norm with adaptive penalty serving as sparse enhancement strategy is employed in our model for suppressing non-target residuals. Finally, the small target detection task is reformulated as a problem of nonconvex low-rank matrix recovery with sparse reweighting. The resulted model falls into the workable scope of inexact augment Lagrangian algorithm, in which the S1/2N minimization subproblem can be efficiently solved by the designed softening half-thresholding operator. Extensive experimental results on several real infrared scene datasets validate the superiority of the proposed method over the state-of-the-arts with respect to background interference suppression and target extraction. Full article
(This article belongs to the Section Remote Sensing Image Processing)
Show Figures

Graphical abstract

20 pages, 4536 KiB  
Article
A Robust Rule-Based Ensemble Framework Using Mean-Shift Segmentation for Hyperspectral Image Classification
by Majid Shadman Roodposhti, Arko Lucieer, Asim Anees and Brett A. Bryan
Remote Sens. 2019, 11(17), 2057; https://doi.org/10.3390/rs11172057 - 01 Sep 2019
Cited by 7 | Viewed by 3799
Abstract
This paper assesses the performance of DoTRules—a dictionary of trusted rules—as a supervised rule-based ensemble framework based on the mean-shift segmentation for hyperspectral image classification. The proposed ensemble framework consists of multiple rule sets with rules constructed based on different class frequencies and [...] Read more.
This paper assesses the performance of DoTRules—a dictionary of trusted rules—as a supervised rule-based ensemble framework based on the mean-shift segmentation for hyperspectral image classification. The proposed ensemble framework consists of multiple rule sets with rules constructed based on different class frequencies and sequences of occurrences. Shannon entropy was derived for assessing the uncertainty of every rule and the subsequent filtering of unreliable rules. DoTRules is not only a transparent approach for image classification but also a tool to map rule uncertainty, where rule uncertainty assessment can be applied as an estimate of classification accuracy prior to image classification. In this research, the proposed image classification framework is implemented using three world reference hyperspectral image datasets. We found that the overall accuracy of classification using the proposed ensemble framework was superior to state-of-the-art ensemble algorithms, as well as two non-ensemble algorithms, at multiple training sample sizes. We believe DoTRules can be applied more generally to the classification of discrete data such as hyperspectral satellite imagery products. Full article
(This article belongs to the Special Issue Image Segmentation for Environmental Monitoring)
Show Figures

Graphical abstract

17 pages, 5970 KiB  
Letter
Snow Depth Estimation with GNSS-R Dual Receiver Observation
by Kegen Yu, Shuyao Wang, Yunwei Li, Xin Chang and Jiancheng Li
Remote Sens. 2019, 11(17), 2056; https://doi.org/10.3390/rs11172056 - 01 Sep 2019
Cited by 10 | Viewed by 3688
Abstract
Two estimation methods using a dual GNSS (Global Navigation Satellite System) receiver system are proposed. The dual-frequency combination method combines the carrier phase observations of dual-frequency signals, whereas the single-frequency combination method combines the pseudorange and carrier phase observations of a single-frequency signal, [...] Read more.
Two estimation methods using a dual GNSS (Global Navigation Satellite System) receiver system are proposed. The dual-frequency combination method combines the carrier phase observations of dual-frequency signals, whereas the single-frequency combination method combines the pseudorange and carrier phase observations of a single-frequency signal, both of which are geometry-free strictly combination and free of the effect of ionospheric delay. Theoretical models are established in the offline phase to describe the relationship between the spectral peak frequency of the combined sequence and the antenna height. A field experiment was conducted recently and the data processing results show that the root mean squared error (RMSE) of the dual-frequency combination method is 5.04 cm with GPS signals and 6.26 cm with BDS signals, which are slightly greater than the RMSE of 4.16 cm produced by the single-frequency combination method of L1 band with GPS signals. The results also demonstrate that the proposed two combination methods and the SNR method achieve similar performance. A dual receiver system enables the better use of GNSS signal carrier phase observations for snow depth estimation, achieving increased data utilization. Full article
Show Figures

Graphical abstract

36 pages, 23464 KiB  
Article
Large-Scale Remote Sensing Image Retrieval Based on Semi-Supervised Adversarial Hashing
by Xu Tang, Chao Liu, Jingjing Ma, Xiangrong Zhang, Fang Liu and Licheng Jiao
Remote Sens. 2019, 11(17), 2055; https://doi.org/10.3390/rs11172055 - 01 Sep 2019
Cited by 32 | Viewed by 3750
Abstract
Remote sensing image retrieval (RSIR), a superior content organization technique, plays an important role in the remote sensing (RS) community. With the number of RS images increases explosively, not only the retrieval precision but also the retrieval efficiency is emphasized in the large-scale [...] Read more.
Remote sensing image retrieval (RSIR), a superior content organization technique, plays an important role in the remote sensing (RS) community. With the number of RS images increases explosively, not only the retrieval precision but also the retrieval efficiency is emphasized in the large-scale RSIR scenario. Therefore, the approximate nearest neighborhood (ANN) search attracts the researchers’ attention increasingly. In this paper, we propose a new hash learning method, named semi-supervised deep adversarial hashing (SDAH), to accomplish the ANN for the large-scale RSIR task. The assumption of our model is that the RS images have been represented by the proper visual features. First, a residual auto-encoder (RAE) is developed to generate the class variable and hash code. Second, two multi-layer networks are constructed to regularize the obtained latent vectors using the prior distribution. These two modules mentioned are integrated under the generator adversarial framework. Through the minimax learning, the class variable would be a one-hot-like vector while the hash code would be the binary-like vector. Finally, a specific hashing function is formulated to enhance the quality of the generated hash code. The effectiveness of the hash codes learned by our SDAH model was proved by the positive experimental results counted on three public RS image archives. Compared with the existing hash learning methods, the proposed method reaches improved performance. Full article
(This article belongs to the Special Issue Content-Based Remote Sensing Image Retrieval)
Show Figures

Graphical abstract

27 pages, 5965 KiB  
Article
Development and Intercomparison Study of an Atmospheric Motion Vector Retrieval Algorithm for GEO-KOMPSAT-2A
by Soo Min Oh, Régis Borde, Manuel Carranza and In-Chul Shin
Remote Sens. 2019, 11(17), 2054; https://doi.org/10.3390/rs11172054 - 01 Sep 2019
Cited by 11 | Viewed by 3275
Abstract
We derived an atmospheric motion vector (AMV) algorithm for the Geostationary Korea Multipurpose Satellite (GEO-KOMPSAT-2A; GK-2A) launched on 4 December 2018, using the Advanced Himawari Imager (AHI) onboard Himawari-8, which is very similar to the Advanced Meteorological Imager onboard GK-2A. This study clearly [...] Read more.
We derived an atmospheric motion vector (AMV) algorithm for the Geostationary Korea Multipurpose Satellite (GEO-KOMPSAT-2A; GK-2A) launched on 4 December 2018, using the Advanced Himawari Imager (AHI) onboard Himawari-8, which is very similar to the Advanced Meteorological Imager onboard GK-2A. This study clearly describes the main steps in our algorithm and optimizes it for the target box size and height assignment methods by comparing AMVs with numerical weather prediction (NWP) and rawinsonde profiles for July 2016 and January 2017. Target box size sensitivity tests were performed from 8 × 8 to 48 × 48 pixels for three infrared channels and from 16 × 16 to 96 × 96 pixels for one visible channel. The results show that the smaller box increases the speed, whereas the larger one slows the speed without quality control. The best target box sizes were found to be 16 × 16 for CH07, 08, and 13, and 48 × 48 pixels for CH03. Height assignment sensitivity tests were performed for several methods, such as the cross-correlation coefficient (CCC), equivalent blackbody temperature (EBBT), infrared/water vapor (IR/WV) intercept, and CO2 slicing methods for a cloudy target as well as normalized total contribution (NTC) and normalized total cumulative contribution (NTCC) for a clear-air target. For a cloudy target, the CCC method is influenced by the quality of the cloud’s top pressure. Better results were found when using EBBT and IR/WV intercept methods together rather than individually. Furthermore, CO2 slicing had the best statistics. For a clear-air target, the combined use of NTC and NTCC had the best statistics. Additionally, the mean vector difference, root-mean-square (RMS) vector difference, bias, and RMS error (RMSE) between GK-2A AMVs and NWP or rawinsonde were smaller by approximately 18.2% on average than in the case of the Communication, Ocean and Meteorology Satellite (COMS) AMVs. In addition, we verified the similarity between GK-2A and Meteosat Third Generation (MTG) AMVs using the AHI of Himawari-8 from 21 July 2016. This similarity can provide evidence that the GK-2A algorithm works properly because the GK-2A AMV algorithm borrows many methods of the MTG AMV algorithm for geostationary data and inversion layer corrections. The Pearson correlation coefficients in the speed, direction, and height of the prescribed GK-2A and MTG AMVs were larger than 0.97, and the corresponding bias/RMSE were0.07/2.19 m/s, 0.21/14.8°, and 2.61/62.9 hPa, respectively, considering common quality indicator with forecast (CQIF) > 80. Full article
(This article belongs to the Special Issue Satellite-Derived Wind Observations)
Show Figures

Graphical abstract

19 pages, 6592 KiB  
Article
Extracting Raft Aquaculture Areas from Remote Sensing Images via an Improved U-Net with a PSE Structure
by Binge Cui, Dong Fei, Guanghui Shao, Yan Lu and Jialan Chu
Remote Sens. 2019, 11(17), 2053; https://doi.org/10.3390/rs11172053 - 01 Sep 2019
Cited by 52 | Viewed by 4619
Abstract
Remote sensing has become a primary technology for monitoring raft aquaculture products. However, due to the complexity of the marine aquaculture environment, the boundaries of the raft aquaculture areas in remote sensing images are often blurred, which will result in ‘adhesion’ phenomenon in [...] Read more.
Remote sensing has become a primary technology for monitoring raft aquaculture products. However, due to the complexity of the marine aquaculture environment, the boundaries of the raft aquaculture areas in remote sensing images are often blurred, which will result in ‘adhesion’ phenomenon in the raft aquaculture areas extraction. The fully convolutional network (FCN) based methods have made great progress in the field of remote sensing in recent years. In this paper, we proposed an FCN-based end-to-end raft aquaculture areas extraction model (which is called UPS-Net) to overcome the ‘adhesion’ phenomenon. The UPS-Net contains an improved U-Net and a PSE structure. The improved U-Net can simultaneously capture boundary and contextual information of raft aquaculture areas from remote sensing images. The PSE structure can adaptively fuse the boundary and contextual information to reduce the ‘adhesion’ phenomenon. We selected laver raft aquaculture areas in eastern Lianyungang in China as the research region to verify the effectiveness of our model. The experimental results show that compared with several state-of-the-art models, the proposed UPS-Net model performs better at extracting raft aquaculture areas and can significantly reduce the ‘adhesion’ phenomenon. Full article
(This article belongs to the Section Ocean Remote Sensing)
Show Figures

Graphical abstract

52 pages, 13183 KiB  
Article
Mapping with Pléiades—End-to-End Workflow
by Roland Perko, Hannes Raggam and Peter M. Roth
Remote Sens. 2019, 11(17), 2052; https://doi.org/10.3390/rs11172052 - 01 Sep 2019
Cited by 20 | Viewed by 7322
Abstract
In this work, we introduce an end-to-end workflow for very high-resolution satellite-based mapping, building the basis for important 3D mapping products: (1) digital surface model, (2) digital terrain model, (3) normalized digital surface model and (4) ortho-rectified image mosaic. In particular, we describe [...] Read more.
In this work, we introduce an end-to-end workflow for very high-resolution satellite-based mapping, building the basis for important 3D mapping products: (1) digital surface model, (2) digital terrain model, (3) normalized digital surface model and (4) ortho-rectified image mosaic. In particular, we describe all underlying principles for satellite-based 3D mapping and propose methods that extract these products from multi-view stereo satellite imagery. Our workflow is demonstrated for the Pléiades satellite constellation, however, the applied building blocks are more general and thus also applicable for different setups. Besides introducing the overall end-to-end workflow, we need also to tackle single building blocks: optimization of sensor models represented by rational polynomials, epipolar rectification, image matching, spatial point intersection, data fusion, digital terrain model derivation, ortho rectification and ortho mosaicing. For each of these steps, extensions to the state-of-the-art are proposed and discussed in detail. In addition, a novel approach for terrain model generation is introduced. The second aim of the study is a detailed assessment of the resulting output products. Thus, a variety of data sets showing different acquisition scenarios are gathered, allover comprising 24 Pléiades images. First, the accuracies of the 2D and 3D geo-location are analyzed. Second, surface and terrain models are evaluated, including a critical look on the underlying error metrics and discussing the differences of single stereo, tri-stereo and multi-view data sets. Overall, 3D accuracies in the range of 0.2 to 0.3 m in planimetry and 0.2 to 0.4 m in height are achieved w.r.t. ground control points. Retrieved surface models show normalized median absolute deviations around 0.9 m in comparison to reference LiDAR data. Multi-view stereo outperforms single stereo in terms of accuracy and completeness of the resulting surface models. Full article
(This article belongs to the Special Issue 3D Reconstruction Based on Aerial and Satellite Imagery)
Show Figures

Graphical abstract

30 pages, 5817 KiB  
Article
Synergy of Satellite, In Situ and Modelled Data for Addressing the Scarcity of Water Quality Information for Eutrophication Assessment and Monitoring of Swedish Coastal Waters
by Susanne Kratzer, Dmytro Kyryliuk, Moa Edman, Petra Philipson and Steve W. Lyon
Remote Sens. 2019, 11(17), 2051; https://doi.org/10.3390/rs11172051 - 31 Aug 2019
Cited by 12 | Viewed by 3156
Abstract
Monthly CHL-a and Secchi Depth (SD) data derived from the full mission data of the Medium Resolution Imaging Spectrometer (MERIS; 2002–2012) were analysed along a horizontal transect from the inner Bråviken bay and out into the open sea. The CHL-a values were calibrated [...] Read more.
Monthly CHL-a and Secchi Depth (SD) data derived from the full mission data of the Medium Resolution Imaging Spectrometer (MERIS; 2002–2012) were analysed along a horizontal transect from the inner Bråviken bay and out into the open sea. The CHL-a values were calibrated using an algorithm derived from Swedish lakes. Then, calibrated Chl-a and Secchi Depth (SD) estimates were extracted from MERIS data along the transect and compared to conventional monitoring data as well as to data from the Swedish Coastal zone Model (SCM), providing physico-biogeochemical parameters such as temperature, nutrients, Chlorophyll-a (CHL-a) and Secchi depth (SD). A high negative correlation was observed between satellite-derived CHL-a and SD (ρ = −0.91), similar to the in situ relationship established for several coastal gradients in the Baltic proper. We also demonstrate that the validated MERIS-based estimates and data from the SCM showed strong correlations for the variables CHL-a, SD and total nitrogen (TOTN), which improved significantly when analysed on a monthly basis across basins. The relationship between satellite-derived CHL-a and modelled TOTN was also evaluated on a monthly basis using least-square linear regression models. The predictive power of the models was strong for the period May-November (R2: 0.58–0.87), and the regression algorithm for summer was almost identical to the algorithm generated from in situ data in Himmerfjärden bay. The strong correlation between SD and modelled TOTN confirms that SD is a robust and reliable indicator to evaluate changes in eutrophication in the Baltic proper which can be assessed using remote sensing data. Amongst all three assessed methods, only MERIS CHL-a was able to correctly depict the pattern of phytoplankton phenology that is typical for the Baltic proper. The approach of combining satellite data and physio-biogeochemical models could serve as a powerful tool and value-adding complement to the scarcely available in situ data from national monitoring programs. In particular, satellite data will help to reduce uncertainties in long-term monitoring data due to its improved measurement frequency. Full article
Show Figures

Graphical abstract

18 pages, 1980 KiB  
Article
The Value of Sentinel-2 Spectral Bands for the Assessment of Winter Wheat Growth and Development
by Andrew Revill, Anna Florence, Alasdair MacArthur, Stephen P. Hoad, Robert M. Rees and Mathew Williams
Remote Sens. 2019, 11(17), 2050; https://doi.org/10.3390/rs11172050 - 31 Aug 2019
Cited by 31 | Viewed by 6359
Abstract
Leaf Area Index (LAI) and chlorophyll content are strongly related to plant development and productivity. Spatial and temporal estimates of these variables are essential for efficient and precise crop management. The availability of open-access data from the European Space Agency’s (ESA) Sentinel-2 satellite—delivering [...] Read more.
Leaf Area Index (LAI) and chlorophyll content are strongly related to plant development and productivity. Spatial and temporal estimates of these variables are essential for efficient and precise crop management. The availability of open-access data from the European Space Agency’s (ESA) Sentinel-2 satellite—delivering global coverage with an average 5-day revisit frequency at a spatial resolution of up to 10 metres—could provide estimates of these variables at unprecedented (i.e., sub-field) resolution. Using synthetic data, past research has demonstrated the potential of Sentinel-2 for estimating crop variables. Nonetheless, research involving a robust analysis of the Sentinel-2 bands for supporting agricultural applications is limited. We evaluated the potential of Sentinel-2 data for retrieving winter wheat LAI, leaf chlorophyll content (LCC) and canopy chlorophyll content (CCC). In coordination with destructive and non-destructive ground measurements, we acquired multispectral data from an Unmanned Aerial Vehicle (UAV)-mounted sensor measuring key Sentinel-2 spectral bands (443 to 865 nm). We applied Gaussian processes regression (GPR) machine learning to determine the most informative Sentinel-2 bands for retrieving each of the variables. We further evaluated the GPR model performance when propagating observation uncertainty. When applying the best-performing GPR models without propagating uncertainty, the retrievals had a high agreement with ground measurements—the mean R2 and normalised root-mean-square error (NRMSE) were 0.89 and 8.8%, respectively. When propagating uncertainty, the mean R2 and NRMSE were 0.82 and 11.9%, respectively. When accounting for measurement uncertainty in the estimation of LAI and CCC, the number of most informative Sentinel-2 bands was reduced from four to only two—the red-edge (705 nm) and near-infrared (865 nm) bands. This research demonstrates the value of the Sentinel-2 spectral characteristics for retrieving critical variables that can support more sustainable crop management practices. Full article
Show Figures

Graphical abstract

31 pages, 27866 KiB  
Article
Supervised Distance-Based Feature Selection for Hyperspectral Target Detection
by Amir Moeini Rad, Ali Akbar Abkar and Barat Mojaradi
Remote Sens. 2019, 11(17), 2049; https://doi.org/10.3390/rs11172049 - 30 Aug 2019
Cited by 5 | Viewed by 2708
Abstract
Feature/band selection (FS/BS) for target detection (TD) attempts to select features/bands that increase the discrimination between the target and the image background. Moreover, TD usually suffers from background interference. Therefore, bands that help detectors to effectively suppress the background and magnify the target [...] Read more.
Feature/band selection (FS/BS) for target detection (TD) attempts to select features/bands that increase the discrimination between the target and the image background. Moreover, TD usually suffers from background interference. Therefore, bands that help detectors to effectively suppress the background and magnify the target signal are considered to be more useful. In this regard, three supervised distance-based filter FS methods are proposed in this paper. The first method is based on the TD concept. It uses the image autocorrelation matrix and the target signature in the detection space (DS) for FS. Features that increase the first-norm distance between the target energy and the mean energy of the background in DS are selected as optimal. The other two methods use background modeling via image clustering. The cluster mean spectra, along with the target spectrum, are then transferred into DS. Orthogonal subspace projection distance (OSPD) and first-norm distance (FND) are used as two FS criteria to select optimal features. Two datasets, HyMap RIT and SIM.GA, are used for the experiments. Several measures, i.e., true positives (TPs), false alarms (FAs), target detection accuracy (TDA), total negative score (TNS), and the receiver operating characteristics (ROC) area under the curve (AUC) are employed to evaluate the proposed methods and to investigate the impact of FS on the TD performance. The experimental results show that our proposed FS methods, as compared with five existing FS methods, have improving impacts on common target detectors and help them to yield better results. Full article
(This article belongs to the Section Remote Sensing Image Processing)
Show Figures

Graphical abstract

17 pages, 4778 KiB  
Letter
PLANHEAT’s Satellite-Derived Heating and Cooling Degrees Dataset for Energy Demand Mapping and Planning
by Panagiotis Sismanidis, Iphigenia Keramitsoglou, Stefano Barberis, Hrvoje Dorotić, Benjamin Bechtel and Chris T. Kiranoudis
Remote Sens. 2019, 11(17), 2048; https://doi.org/10.3390/rs11172048 - 30 Aug 2019
Cited by 2 | Viewed by 3361
Abstract
The urban heat island (UHI) effect influences the heating and cooling (H&C) energy demand of buildings and should be taken into account in H&C energy demand simulations. To provide information about this effect, the PLANHEAT integrated tool—which is a GIS-based, open-source software tool [...] Read more.
The urban heat island (UHI) effect influences the heating and cooling (H&C) energy demand of buildings and should be taken into account in H&C energy demand simulations. To provide information about this effect, the PLANHEAT integrated tool—which is a GIS-based, open-source software tool for selecting, simulating and comparing alternative low-carbon and economically sustainable H&C scenarios—includes a dataset of 1 × 1 km hourly heating and cooling degrees (HD and CD, respectively). HD and CD are energy demand proxies that are defined as the deviation of the outdoor surface air temperature from a base temperature, above or below which a building is assumed to need heating or cooling, respectively. PLANHEAT’s HD and CD are calculated from a dataset of gridded surface air temperatures that have been derived using satellite thermal data from Meteosat-10 Spinning Enhanced Visible and Near-Infrared Imager (SEVIRI). This article describes the method for producing this dataset and presents the results for Antwerp (Belgium), which is one of the three validation cities of PLANHEAT. The results demonstrate the spatial and temporal information of PLANHEAT’s HD and CD dataset, while the accuracy assessment reveals that they agree well with reference values retrieved from in situ surface air temperatures. This dataset is an example of application-oriented research that provides location-specific results with practical utility. Full article
(This article belongs to the Special Issue Application of Remote Sensing in Urban Climatology)
Show Figures

Graphical abstract

34 pages, 12627 KiB  
Article
Refugee Camp Monitoring and Environmental Change Assessment of Kutupalong, Bangladesh, Based on Radar Imagery of Sentinel-1 and ALOS-2
by Andreas Braun, Falah Fakhri and Volker Hochschild
Remote Sens. 2019, 11(17), 2047; https://doi.org/10.3390/rs11172047 - 30 Aug 2019
Cited by 34 | Viewed by 7687
Abstract
Approximately one million refugees of the Rohingya minority population in Myanmar crossed the border to Bangladesh on 25 August 2017, seeking shelter from systematic oppression and persecution. This led to a dramatic expansion of the Kutupalong refugee camp within a couple of months [...] Read more.
Approximately one million refugees of the Rohingya minority population in Myanmar crossed the border to Bangladesh on 25 August 2017, seeking shelter from systematic oppression and persecution. This led to a dramatic expansion of the Kutupalong refugee camp within a couple of months and a decrease of vegetation in the surrounding forests. As many humanitarian organizations demand frameworks for camp monitoring and environmental impact analysis, this study suggests a workflow based on spaceborne radar imagery to measure the expansion of settlements and the decrease of forests. Eleven image pairs of Sentinel-1 and ALOS-2, as well as a digital elevation model, were used for a supervised land cover classification. These were trained on automatically-derived reference areas retrieved from multispectral images to reduce required user input and increase transferability. Results show an overall decrease of vegetation of 1500 hectares, of which 20% were used to expand the camp and 80% were deforested, which matches findings from other studies of this case. The time-series analysis reduced the impact of seasonal variations on the results, and accuracies between 88% and 95% were achieved. The most important input variables for the classification were vegetation indices based on synthetic aperture radar (SAR) backscatter intensity, but topographic parameters also played a role. Full article
Show Figures

Graphical abstract

24 pages, 11147 KiB  
Article
UAV-Based Slope Failure Detection Using Deep-Learning Convolutional Neural Networks
by Omid Ghorbanzadeh, Sansar Raj Meena, Thomas Blaschke and Jagannath Aryal
Remote Sens. 2019, 11(17), 2046; https://doi.org/10.3390/rs11172046 - 30 Aug 2019
Cited by 79 | Viewed by 7226
Abstract
Slope failures occur when parts of a slope collapse abruptly under the influence of gravity, often triggered by a rainfall event or earthquake. The resulting slope failures often cause problems in mountainous or hilly regions, and the detection of slope failure is therefore [...] Read more.
Slope failures occur when parts of a slope collapse abruptly under the influence of gravity, often triggered by a rainfall event or earthquake. The resulting slope failures often cause problems in mountainous or hilly regions, and the detection of slope failure is therefore an important topic for research. Most of the methods currently used for mapping and modelling slope failures rely on classification algorithms or feature extraction, but the spatial complexity of slope failures, the uncertainties inherent in expert knowledge, and problems in transferability, all combine to inhibit slope failure detection. In an attempt to overcome some of these problems we have analyzed the potential of deep learning convolutional neural networks (CNNs) for slope failure detection, in an area along a road section in the northern Himalayas, India. We used optical data from unmanned aerial vehicles (UAVs) over two separate study areas. Different CNN designs were used to produce eight different slope failure distribution maps, which were then compared with manually extracted slope failure polygons using different accuracy assessment metrics such as the precision, F-score, and mean intersection-over-union (mIOU). A slope failure inventory data set was produced for each of the study areas using a frequency-area distribution (FAD). The CNN approach that was found to perform best (precision accuracy assessment of almost 90% precision, F-score 85%, mIOU 74%) was one that used a window size of 64 × 64 pixels for the sample patches, and included slope data as an additional input layer. The additional information from the slope data helped to discriminate between slope failure areas and roads, which had similar spectral characteristics in the optical imagery. We concluded that the effectiveness of CNNs for slope failure detection was strongly dependent on their design (i.e., the window size selected for the sample patch, the data used, and the training strategies), but that CNNs are currently only designed by trial and error. While CNNs can be powerful tools, such trial and error strategies make it difficult to explain why a particular pooling or layer numbering works better than any other. Full article
(This article belongs to the Special Issue Mass Movement and Soil Erosion Monitoring Using Remote Sensing)
Show Figures

Graphical abstract

18 pages, 7110 KiB  
Article
Riverine Plastic Litter Monitoring Using Unmanned Aerial Vehicles (UAVs)
by Marlein Geraeds, Tim van Emmerik, Robin de Vries and Mohd Shahrizal bin Ab Razak
Remote Sens. 2019, 11(17), 2045; https://doi.org/10.3390/rs11172045 - 30 Aug 2019
Cited by 83 | Viewed by 12626
Abstract
Plastic debris has become an abundant pollutant in marine, coastal and riverine environments, posing a large threat to aquatic life. Effective measures to mitigate and prevent marine plastic pollution require a thorough understanding of its origin and eventual fate. Several models have estimated [...] Read more.
Plastic debris has become an abundant pollutant in marine, coastal and riverine environments, posing a large threat to aquatic life. Effective measures to mitigate and prevent marine plastic pollution require a thorough understanding of its origin and eventual fate. Several models have estimated that land-based sources are the main source of marine plastic pollution, although field data to substantiate these estimates remain limited. Current methodologies to measure riverine plastic transport require the availability of infrastructure and accessible riverbanks, but, to obtain measurements on a higher spatial and temporal scale, new monitoring methods are required. This paper presents a new methodology for quantifying riverine plastic debris using Unmanned Aerial Vehicles (UAVs), including a first application on Klang River, Malaysia. Additional plastic measurements were done in parallel with the UAV-based approach to make comparisons between the two methods. The spatiotemporal distribution of the plastics obtained with both methods show similar patterns and variations. With this, we show that UAV-based monitoring methods are a promising alternative for currently available approaches for monitoring riverine plastic transport, especially in remote and inaccessible areas. Full article
(This article belongs to the Section Environmental Remote Sensing)
Show Figures

Graphical abstract

26 pages, 22361 KiB  
Article
Time Series of Landsat Imagery Shows Vegetation Recovery in Two Fragile Karst Watersheds in Southwest China from 1988 to 2016
by Jie Pei, Li Wang, Xiaoyue Wang, Zheng Niu, Maggi Kelly, Xiao-Peng Song, Ni Huang, Jing Geng, Haifeng Tian, Yang Yu, Shiguang Xu, Lei Wang, Qing Ying and Jianhua Cao
Remote Sens. 2019, 11(17), 2044; https://doi.org/10.3390/rs11172044 - 30 Aug 2019
Cited by 30 | Viewed by 4220
Abstract
Since the implementation of China’s afforestation and conservation projects during recent decades, an increasing number of studies have reported greening trends in the karst regions of southwest China using coarse-resolution satellite imagery, but small-scale changes in the heterogenous landscapes remain largely unknown. Focusing [...] Read more.
Since the implementation of China’s afforestation and conservation projects during recent decades, an increasing number of studies have reported greening trends in the karst regions of southwest China using coarse-resolution satellite imagery, but small-scale changes in the heterogenous landscapes remain largely unknown. Focusing on two typical karst regions in the Nandong and Xiaojiang watersheds in Yunnan province, we processed 2,497 Landsat scenes from 1988 to 2016 using the Google Earth Engine cloud platform and analyzed vegetation trends and associated drivers. We found that both watersheds experienced significant increasing trends in annual fractional vegetation cover, at a rate of 0.0027 year−1 and 0.0020 year−1, respectively. Notably, the greening trends have been intensifying during the conservation period (2001–2016) even under unfavorable climate conditions. Human-induced ecological engineering was the primary factor for the increased greenness. Moreover, vegetation change responded differently to variations in topographic gradients and lithological types. Relatively more vegetation recovery was found in regions with moderate slopes and elevation, and pure limestone, limestone and dolomite interbedded layer as well as impure carbonate rocks than non-karst rocks. Partial correlation analysis of vegetation trends and temperature and precipitation trends suggested that climate change played a minor role in vegetation recovery. Our findings contribute to an improved understanding of the mechanisms behind vegetation changes in karst areas and may provide scientific supports for local afforestation and conservation policies. Full article
Show Figures

Graphical abstract

17 pages, 7198 KiB  
Article
A New Vegetation Index to Detect Periodically Submerged Mangrove Forest Using Single-Tide Sentinel-2 Imagery
by Mingming Jia, Zongming Wang, Chao Wang, Dehua Mao and Yuanzhi Zhang
Remote Sens. 2019, 11(17), 2043; https://doi.org/10.3390/rs11172043 - 29 Aug 2019
Cited by 101 | Viewed by 10475
Abstract
Mangrove forests are tropical trees and shrubs that grow in sheltered intertidal zones. Accurate mapping of mangrove forests is a great challenge for remote sensing because mangroves are periodically submerged by tidal floods. Traditionally, multi-tides images were needed to remove the influence of [...] Read more.
Mangrove forests are tropical trees and shrubs that grow in sheltered intertidal zones. Accurate mapping of mangrove forests is a great challenge for remote sensing because mangroves are periodically submerged by tidal floods. Traditionally, multi-tides images were needed to remove the influence of water; however, such images are often unavailable due to rainy climates and uncertain local tidal conditions. Therefore, extracting mangrove forests from a single-tide imagery is of great importance. In this study, reflectance of red-edge bands in Sentinel-2 imagery were utilized to establish a new vegetation index that is sensitive to submerged mangrove forests. Specifically, red and short-wave near infrared bands were used to build a linear baseline; the average reflectance value of four red-edge bands above the baseline is defined as the Mangrove Forest Index (MFI). To evaluate MFI, capabilities of detecting mangrove forests were quantitatively assessed between MFI and four widely used vegetation indices (VIs). Additionally, the practical roles of MFI were validated by applying it to three mangrove forest sites globally. Results showed that: (1) theoretically, Jensen–Shannon divergence demonstrated that a submerged mangrove forest and water pixels have the largest distance in MFI compared to other VIs. In addition, the boxplot showed that all submerged mangrove forests could be separated from the water background in the MFI image. Furthermore, in the MFI image, to separate mangrove forests and water, the threshold is a constant that is equal to zero. (2) Practically, after applying the MFI to three global sites, 99–102% of submerged mangrove forests were successfully extracted by MFI. Although there are still some uncertainties and limitations, the MFI offers great benefits in accurately mapping mangrove forests as well as other coastal and aquatic vegetation worldwide. Full article
(This article belongs to the Special Issue Remote Sensing of Mangroves)
Show Figures

Graphical abstract

43 pages, 9784 KiB  
Review
Modeling 3D Free-geometry Volumetric Sources Associated to Geological and Anthropogenic Hazards from Space and Terrestrial Geodetic Data
by Antonio G. Camacho and José Fernández
Remote Sens. 2019, 11(17), 2042; https://doi.org/10.3390/rs11172042 - 29 Aug 2019
Cited by 4 | Viewed by 3471
Abstract
Recent decades have shown an explosion in the quantity and quality of geodetic data, mainly space-based geodetic data, that are being applied to geological and anthropogenic hazards. This has produced the need for new approaches for analyzing, modeling and interpreting these geodetic data. [...] Read more.
Recent decades have shown an explosion in the quantity and quality of geodetic data, mainly space-based geodetic data, that are being applied to geological and anthropogenic hazards. This has produced the need for new approaches for analyzing, modeling and interpreting these geodetic data. Typically, modeling of deformation and gravity changes follows an inverse approach using analytical or numerical solutions, where normally regular geometries (point sources, disks, prolate or oblate spheroids, etc.) are assumed at the initial stages and the inversion is carried out in a linear context. Here we review an original methodology for the simultaneous, nonlinear inversion of gravity changes and/or surface deformation (measured with different techniques) to determine 3D (three-dimensional) bodies, without any a priori assumption about their geometries, embedded into an elastic or poroelastic medium. Such a fully nonlinear inversion has led to interesting results in volcanic environments and in the study of water tables variation due to its exploitation. This methodology can be used to invert geodetic remote sensing data or terrestrial data alone, or in combination. Full article
Show Figures

Figure 1

20 pages, 12659 KiB  
Article
Analysis of Changes and Potential Characteristics of Cultivated Land Productivity Based on MODIS EVI: A Case Study of Jiangsu Province, China
by Weiyi Xu, Jiaxin Jin, Xiaobin Jin, Yuanyuan Xiao, Jie Ren, Jing Liu, Rui Sun and Yinkang Zhou
Remote Sens. 2019, 11(17), 2041; https://doi.org/10.3390/rs11172041 - 29 Aug 2019
Cited by 28 | Viewed by 4024
Abstract
Cultivated land productivity is a basic guarantee of food security. This study extracted the multiple cropping index (MCI) and most active days (MAD, i.e., days when the EVI exceeded a threshold) based on crop growth EVI curves to analyse the changes and potential [...] Read more.
Cultivated land productivity is a basic guarantee of food security. This study extracted the multiple cropping index (MCI) and most active days (MAD, i.e., days when the EVI exceeded a threshold) based on crop growth EVI curves to analyse the changes and potential characteristics of cultivated land productivity in Jiangsu Province during 2001–2017. The results are as follows: (1) The MCI of 83.8% of cultivated land remained unchanged in Jiangsu, the cultivated land with changed MCI (16.2%) was mainly concentrated in the southern and eastern coastal areas of Jiangsu, and the main cropping systems were single and double seasons. (2) The changes in cultivated land productivity were significant and had an obvious spatial distribution. The areas where the productivity of single cropping system changed occupied 67.8% of the total cultivated land of single cropping system, and the decreased areas (46.5%) were concentrated in southern Jiangsu. (3) For double cropping systems, the percentages of the changed productivity areas accounting for cultivated land were 82.7% and 73.3%. The decreased areas were distributed in central Jiangsu. In addition, the productivity of the first crop showed an overall (72%) increasing trend and increased areas (40.8%) of the second crop were found in northern Jiangsu. (4) During 2001–2017, cultivated land productivity greatly improved in Jiangsu. In the areas where productivity increased, the proportions of cultivated land with productivity potential space greater than 20% in single and double cropping systems were greater than 60% and 90%, respectively. In the areas where productivity decreased, greater than 25% and 75% of cultivated land had potential space in greater than 80% of the single and double cropping systems, respectively. This result shows that productivity still has much room for development in Jiangsu. This study provides new insight for studying cultivated land productivity and provides references for guiding agricultural production. Full article
Show Figures

Graphical abstract

Previous Issue
Back to TopTop