Article

Measuring Eco-Efficiency of Agriculture in China

1
Key Laboratory of Western China’s Environmental Systems (Ministry of Education), College of Earth and Environmental Sciences, Lanzhou University, Lanzhou 730000, China
2
Institute for Circular Economy in Western China, Lanzhou University, Lanzhou 730000, China
3
Scientific Information Center for Resources and Environment, Lanzhou Branch of the National Science Library, Chinese Academy of Sciences, Tianshui Middle Road 8#, Lanzhou 730000, China
*
Author to whom correspondence should be addressed.
Sustainability 2016, 8(4), 398; https://doi.org/10.3390/su8040398
Submission received: 1 March 2016 / Revised: 14 April 2016 / Accepted: 18 April 2016 / Published: 21 April 2016
(This article belongs to the Section Environmental Sustainability and Applications)

Abstract

:
Eco-efficiency is a tool for sustainability analysis that indicates how to carry out economic activities effectively. This paper assesses agricultural eco-efficiency using data envelopment analysis (DEA) and the Theil index approach. Using basic data of 31 provinces in China during 2003–2013, we analyzed the agricultural eco-efficiency development level and spatial pattern in China. The results show that the agricultural eco-efficiency of only four provinces has been relatively efficient in the entire study period, namely, Zhejiang, Hainan, Chongqing, and Tibet. The results also show that agricultural eco-efficiency was higher mainly in south of the Qinling Mountains-Huaihe River Line and north of the Yangtze River area, that agricultural eco-efficiency is mainly affected by pure technical efficiency, and that highly efficient areas are mainly concentrated in the densely populated areas, i.e., the economic developed areas (except Tibet). The Theil index results show that the agricultural eco-efficiency difference weakened between provinces in China, as did western and northeast regions, but eastern and central regions show a slight upward trend.

1. Introduction

Agriculture is the foundation of human society’s existence and development. The vital role of agriculture in providing food and fiber to a rising human population has made this productive activity a privileged field for sustainability analysis. Dating back to ancient times, the function of agriculture was primarily to provide food [1,2,3]. Later, at the dawn of economic development, agriculture came to additionally provide industrial raw materials and labor [3,4]. In today’s world, the function of agriculture is enriched because human demands have turned from basic materials to the esthetic, including leisure, tourism, and other forms of entertainment.
During the second half of the 20th century, the focus of China’s agricultural policies was to expand food production faster than population growth and to maintain 100% grain self-sufficiency, with little regard to the negative environmental consequences of these policies. Since 1979, China’s agriculture has been developed rapidly and has made tremendous achievements; using only 7 percent of the world’s arable land, it provides most of the food for 22 percent of the world’s current population [5]. However, the ecological system, which is the key supporting system for agricultural production, has degraded due to the extensive calculation method, the improper use of fertilizer, pesticides, mulch usage, and other climatic factors. The present study shows that the inefficient utilization of land, water, and other fossil resources is the main reason for environmental non-point source pollutions. The ecological degradation induced by non-point source pollution not only impedes the sustainable development of agriculture itself, but also will jeopardize the ecological system at a larger scale and lead to potential food safety risk [6,7,8]. Sustainable management of agriculture will become necessary [5,9]. The amount of agricultural pollutants comprises 33–50 percent of the total amount of pollutants in China [10,11]. One of the main reasons for agricultural non-point pollution is inefficient utilization and redundancy inputs of fossil resources in the process of agricultural production [12]. Therefore, since the year 2000, China’s agricultural policies have progressively paid greater attention to reducing environmental and ecosystem impacts while maintaining high levels of food self-sufficiency; in the past five years, China has been introducing measures to advance sustainable intensification. Thus, the estimation of agricultural ecological efficiency, which refers to the ability of regions to produce more agricultural goods and services with fewer impacts on the environment and consumer fewer natural resources, is very important for designing related policy aims to improve the sustainability of agricultural production.
The first national pollution census bulletin shows that China’s agricultural emissions of chemical oxygen demand, total nitrogen, and total phosphorus are respectively 13.24 million tons, 2.71 million tons, and 0.28 million tons. According to the estimates of the Asian development bank, China’s agricultural resources and environmental destruction caused a direct economic loss, namely, a reduction of 0.5–1 percent in GDP [13]. Since the year 2000, China’s agricultural policies have progressively paid greater attention to reducing environmental and ecosystem impacts [5,14]. The 16th National Congress of the Communist Party of China put forward the ecological civilization, promoting the development process of ecological agriculture. However, compared with developed countries such as Sweden, Germany, Britain, and Japan, China still has a long way to go in ecological agriculture [15,16,17] to improve agricultural eco-efficiency.
The concept of economic and ecological efficiency, more popularly known as eco-efficiency, was put forward by Schaltegger and Sturm in the 1990s [18]. Generally speaking, eco-efficiency refers to the ability of firms, industries, regions, or economies to produce more goods and services with fewer impacts on the environment and requiring less consumption of natural resources, thus bringing together economic and ecological issues. Later, it was employed and popularized as a way of encouraging companies to become simultaneously more competitive and more environmentally responsible by the World Business Council for Sustainable Development (WBCSD) [19]. Consequently, eco-efficiency indicators value the economic and environmental performance of companies jointly. Eco-efficiency starts at firm level with recommendations to reduce material requirements, the energy intensity of commodities and services, and toxic dispersion and to maximize the sustainable use of renewable resources. However, as human societies aspire to satisfy increasing levels of consumption and the simultaneous attainment of reasonable environmental quality, the eco-efficiency concept should be extended to an economy-wide, macro level, beyond the business sector and production patterns. Furthermore, in recent years, eco-efficiency has attracted attention from policymakers, researchers, and managers. While humans face the challenge of upholding longer-term sustainability, researchers are providing sound information to improve the design of their environmental policies; therefore, eco-efficiency assessment has been developed conceptually. In practice, it has become increasingly associated with environmental impact assessment index. Eco-efficiency can be assessed by using ratios that relate the economic value of goods and services produced to the environmental pressures or impacts involved in production processes [20,21]. In recent years, more sophisticated approaches to assessing eco-efficiency have been developed, such as the analytic hierarchy process (AHP), the fuzzy evaluation method (FEM), the neural network, and DEA, [22,23,24], but DEA is the most widely used. There are a lot of studies which have focused on China’s industrial [25,26,27,28,29] and environmental system [30,31,32]. The fact that agriculture manages the largest amount of natural resources of all economic activities explains the practical relevance of assessing the economic and ecological efficiency of agriculture operations. However, we find that few studies have focused on the China’s agricultural eco-efficiency, which is very important for designing relevant policy for further improving the overall agricultural efficiency. The paper used the DEA approach and the Theil index analysis to evaluate regional agricultural eco-efficiency and the regional differences during 2003–2013 to serve as the basis for future policy scenarios.

2. Materials and Methods

2.1. The SBM Model

Data envelopment analysis (DEA), which is a non-parametric frontier methodology, aimed at evaluating the relative efficiencies of a set of homogeneous decision-making units (DMUs) featuring multiple inputs and outputs by means of a variety of mathematical programming models, has long been serving as a methodology to evaluate economic, energy, environmental, and ecological efficiency [33,34,35]. As one of most popular DEA models, the slacks-based measure (SBM) model, which was proposed by Tone in 2001 [36,37], considers the input and output of each decision-making unit (DMUs) and provides an effective solution for the slack problem. Unlike traditional DEA models, which take into account the slackness problems of inputs and outputs caused by the radial and angular choices, the slack variables are directly added into the target function [38]. The SBM model is thus non-radial and deals with input/output slacks directly, eliminating the radial and oriented deviation [39]. During an ecological or environmental efficiency (or performance) estimation, the problem of undesired outputs will be inevitably encountered. This situation cannot satisfy the “maximum outputs” hypothesis of traditional DEA efficiency estimation. Therefore, undesirable outputs must be specially treated to expand the traditional DEA efficiency model. In order to further consider the relations between input, output, and undesirable outputs to better solve the slack problem of efficiency evaluation, Tone put forward the inclusion of the undesirable output SBM model in 2003. The SBM model:
min ρ * = 1 1 m i = 1 m s i x i 0 t 1 + 1 s 1 + s 2 ( r = 1 s 1 s r g y r 0 g + r = 1 s 2 s r b y r 0 b ) s . t . x 0 = X λ + s y 0 g = Y g λ s g y 0 b = Y b λ + s b s 0 , s g 0 , s b 0 , λ 0 X = [ x 1 , x 2 x n ] R m × n Y g = [ y 1 g , y 2 g y n g ] R s 1 × n Y b = [ y 1 b , y 2 b y n b ] R s 2 × n
s represents slack variable of input and output, s, sg, and sb are slack variables denoting input excess, link excess, and output shortfall, respectively. We take, s, sg, and sb as variable when evaluating the overall eco-efficiency of DMU. s, sg, and sb are strictly decreasing. xi0 represents the observed input of DMU i, yr0 represents the observed output of DMU r, and m represents the number of decision-making units. X, Yg and Yb are the matrices of the input, good output, and bad output, respectively, while X, Yg and Yb are all strictly larger than zero. λ represents the constant vector. ρ * represents agricultural eco-efficiency, ρ * [ 0 , 1 ] , ρ * = 1 , shows production units completely efficient, and s = s g = s b = 0 ; ρ * < 1 shows a production unit’s efficiency loss. We can improve eco-efficiency by optimizing the inputs and outputs. The SBM model is different from the traditional CCR model and the BBC model. The SBM model, putting the slack variable in the objective function, not only solved the problem input slack but also solved the efficiency evaluation in the presence of the undesirable output.
Eco-efficiency consists of two parts (pure technical efficiency and scale efficiency), it is generally believed that eco-efficiency is the product of pure technical efficiency and scale efficiency. The efficiency value calculated in SBM-CCR is the “eco-efficiency,” whereas the efficiency value computed by SBM-BCC is “pure technical efficiency.” The pure technical efficiency and scale efficiency explain the main source of inefficiency in DMUs. It may be the technical problems associated with the quantity and the combination of input and output factors or the whole operational scale.

2.2. The Theil Index

The Theil index is a statistic used to measure economic inequality and other economic phenomena and was the first used to study the income gap. Now, it has also been used to measure the imbalance of regional development. The Theil index is used to calculate regional differences in Chinese agricultural eco-efficiency in this paper. The Theil index is as follows:
T = 1 N i = 1 N ( x i x × L N x i x )
T represents the Theil index of regional agricultural eco-efficiency; xi represents i province agricultural eco-efficiency; and x ¯ represents the average of regional agricultural eco-efficiency.

2.3. Data Selection and DMU

In order to characterize the agricultural eco-efficiency, we must also choose some structural variables. In the process of agricultural production, input means agricultural production and produce products (or value), while waste and emissions (or other undesirable outputs) are unavoidable [25,40]. Therefore, this research, according to the eco-efficiency evaluation criteria of the WBCSD, refers to some of the latest research on the eco-efficiency evaluation [40,41,42,43,44], combined with the availability of data, to construct evaluation index system.
The research area is Mainland China, excluding the Hong Kong Special Administrative Region, the Macao Special Administrative Region, and the Taiwan province. In this paper, we used the dataset of 31 provincial-level regions, including four regions, the eastern region (Beijing, Tianjin, Hebei, Shanghai, Jiangsu, Zhejiang, Fujian, Shandong, Guangdong, and Hainan); the northeast region (Heilongjiang, Jilin, and Liaoning); the central region (Shanxi, Anhui, Jiangxi, Henan, Hunan, and Hubei); and the western region (Inner Mongolia, Guangxi, Chongqing, Sichuan, Guizhou, Yunnan, Tibet, Shaanxi, Gansu, Qinghai, Ningxia, and Xinjiang). For this paper, we chose six input indices, namely, the sowing area, the agricultural labor force, agricultural water consumption, the total power of agricultural machinery, fertilizer input, and agricultural film input. We also chose two output indices, namely, the added value of agriculture and undesirable outputs. Undesirable outputs include total phosphorus, total nitrogen, waste agricultural plastic film, and so on. The paper focused on the period of 2003–2013. All the data in this paper was collected from the China Rural Statistical Yearbook (2004–2014) [45]. The pollutant discharge coefficient was collected from the first national pollution census manual. The China Rural Statistical Yearbook does not contain statistics regarding agricultural undesirable output, so we calculated the agricultural undesirable output according to the relevant input data. The undesirable outputs calculation is as follows:
C j i = i = 1 3 N r × K j i
Cji represents the amount of the i pollutants in j provinces; and Kji represents the residual coefficient of i input in the agricultural production environment in the j province; the pollutant discharge coefficient was collected from the first national pollution census manual; and Nr represents the input that can produce the undesirable output.
Since DMUs are the basis of DEA, it is very important to reasonably determine the DMUs. For the national level, we define every year as the DMUs; for the provincial level, we define each province as the DMUs.

3. Results

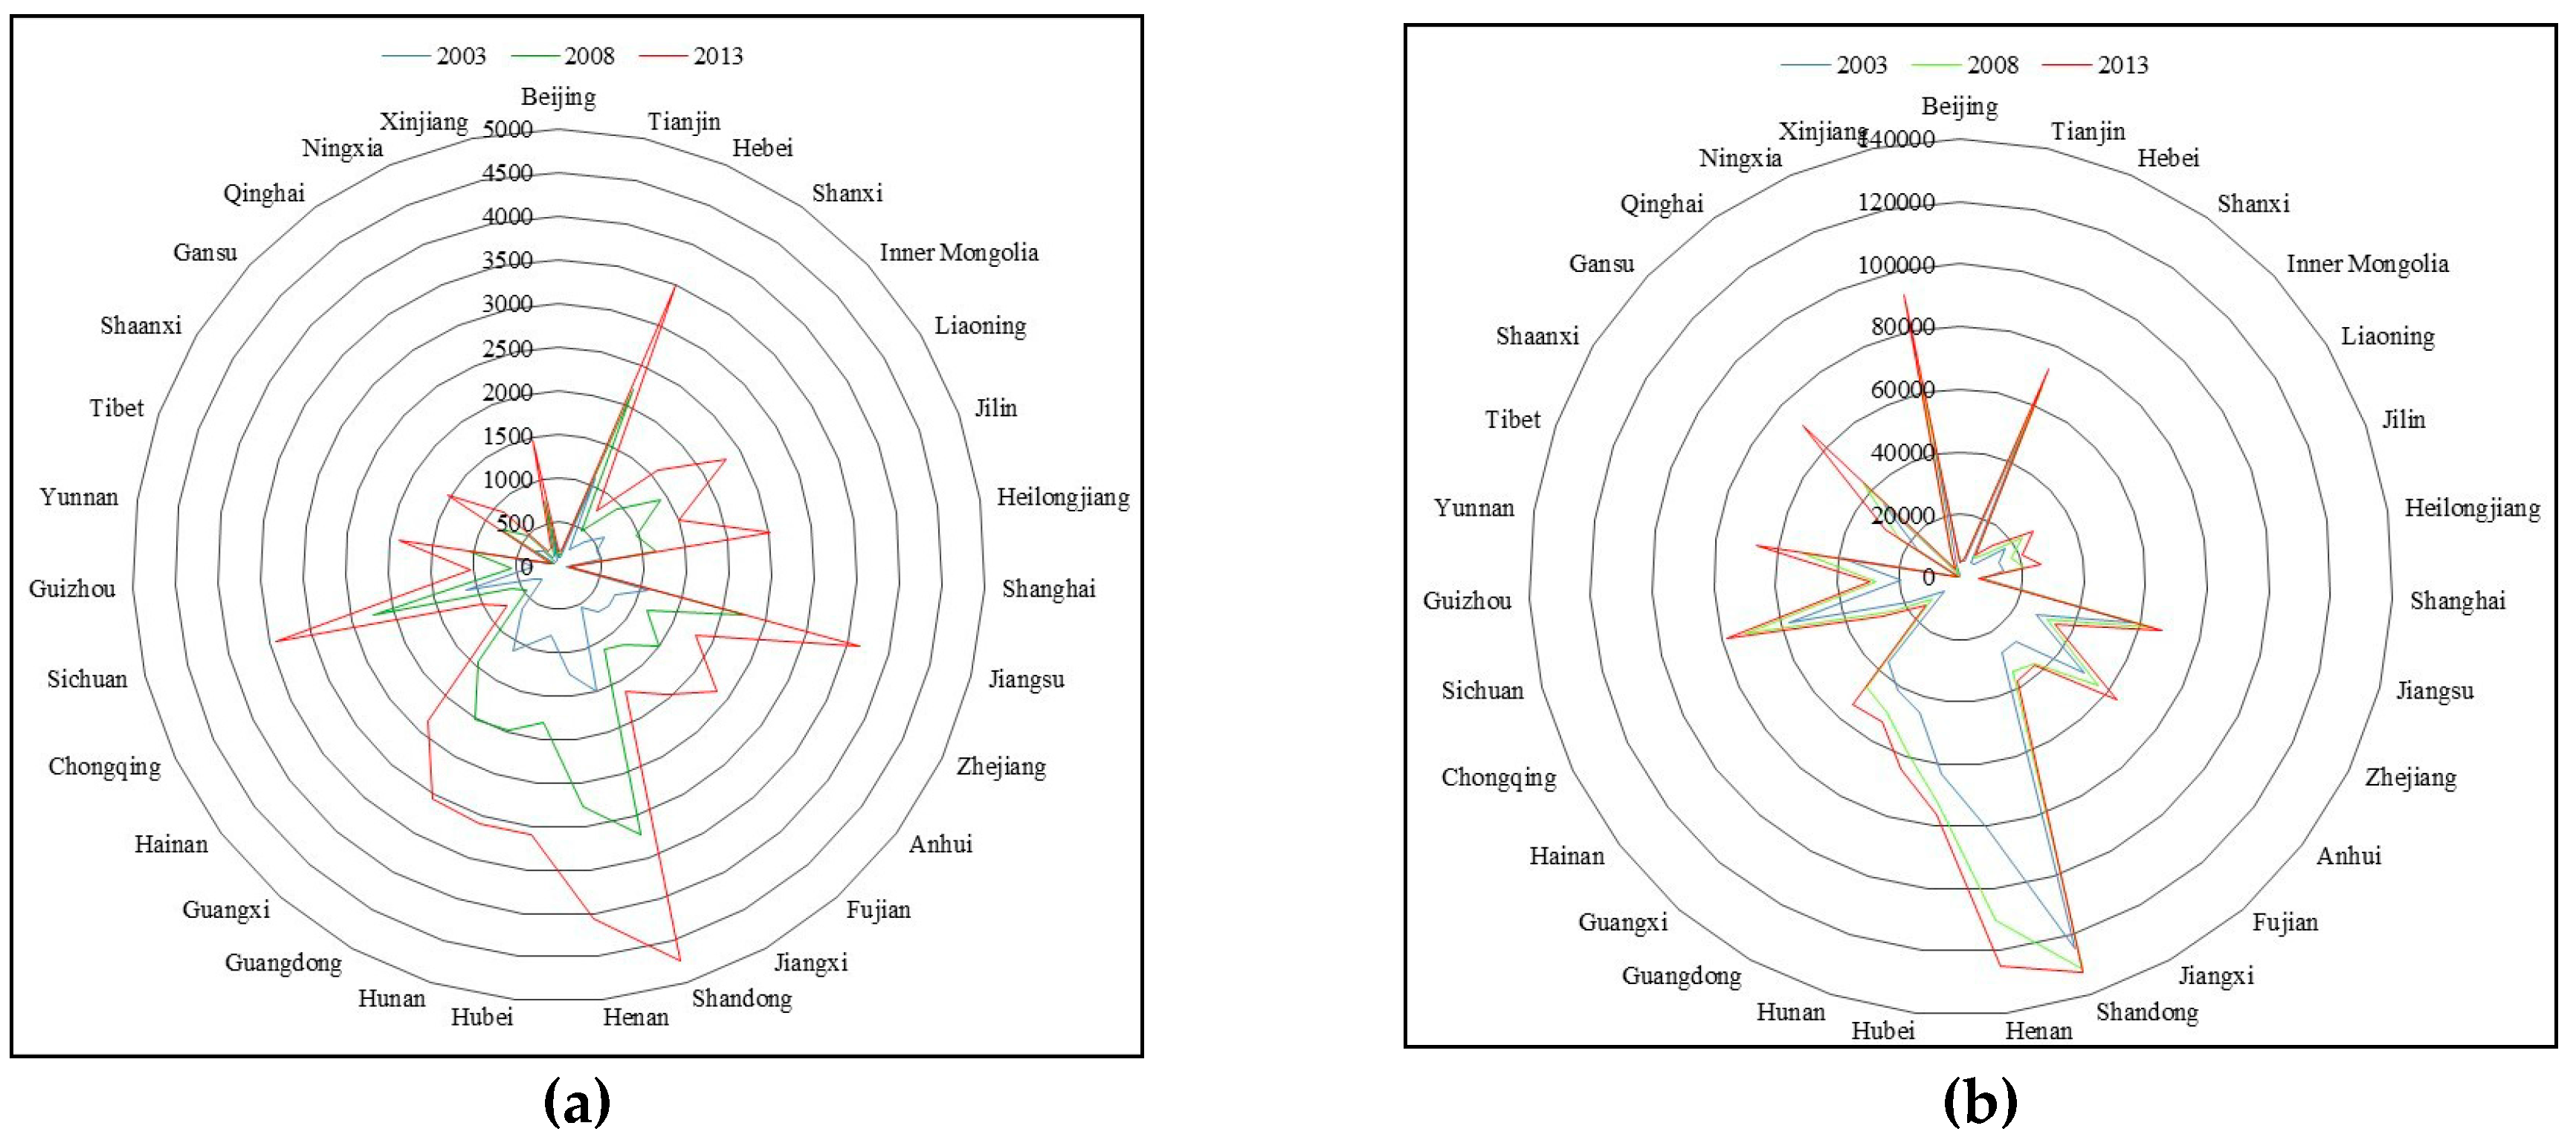
3.1. Overview of Agriculture Development in China

Since 1978, along with fast economic growth, the Chinese agricultural sector has made great achievements due to the implementation of the family-contract responsibility system, the increase in agricultural input, and the improvement in agricultural technology. Meanwhile, the pollutant emissions increased rapidly in the agricultural sector. By 2013, the added value of the agricultural sector increased more than three times from 2003 (from 1724.7 billion yuan in 2003 to 5695.7 billion yuan in 2013), and the amount of agricultural pollutant increased 1.5 times from 2003 (from 950.21 kilotons in 2003 to 1350.97 kilotons in 2013).
From the Chinese provinces’ added value of agriculture descriptive statistical features from 2003 to 2013 as shown in Figure 1a, we found that the high added value of agriculture are mainly concentrated in the provinces of Shandong, Henan, Jiangsu, Hebei, Sichuan, etc. The province with the highest added value of agriculture is the Shandong province, increasing from 150.9 billion yuan in 2003 to 474.3 billion yuan in 2013 (214.3 percent). Shandong province is one of China’s major agricultural provinces. At present, Shandong is accelerating the development of efficient agricultural facilities to strengthen the level of the export-oriented agricultural industry and is striving to build a high-quality, ecological, and secure framework for a modernized agricultural industry. The province with the lowest added value of agriculture is the Tibet province, increasing from 5.6 billion yuan in 2003 to 8.7 billion yuan in 2013, (54.5 percent). Tibet is located in the Qinghai–Tibet plateau as a typical fragile ecological environment area in China. The Tibetan plateau has seen limited development and prohibited development zones; its main function is the national or regional ecological function areas. The province with the fastest growth rate of the added value of agriculture is the Shaanxi province, increasing 3.81 times from 2003 to 2013, and added value of agriculture grew by 39 percent from 2003 to 2013 in Shanghai. From the Chinese agricultural pollutants’ descriptive statistical features from 2003 to 2013, as shown in Figure 1b, we found that the highest agricultural pollutants are mainly concentrated in the provinces of Shandong, Henan, Xinjiang, Sichuan, and Hebei. The highest agricultural pollutants is the Shandong province; agricultural pollutant generation increased from 124.4 kilotons in 2003 to 132.4 kilotons in 2013. The least amount of agricultural pollutants is the Tibet province; agricultural pollutant generation increased from 397.1 tons in 2003 to 827.1 tons in 2013. The fastest growth rate of agricultural pollutants is the Qinghai province; it increased 3.05 times from 2003 to 2013, and agricultural pollutants decreased by 18.6 percent from 2003 to 2013 in Shanghai.
Shandong, Henan, Hebei, and other provinces with agricultural added value were the forefront of the country, while emissions of agricultural pollutants is also the forefront of the country. The provinces with high emissions of agricultural pollutants mainly concentrated in the western region, but their agricultural added value is relatively low. The northeast provinces had lower emissions of agricultural pollutants, but their agricultural added value is relatively high.

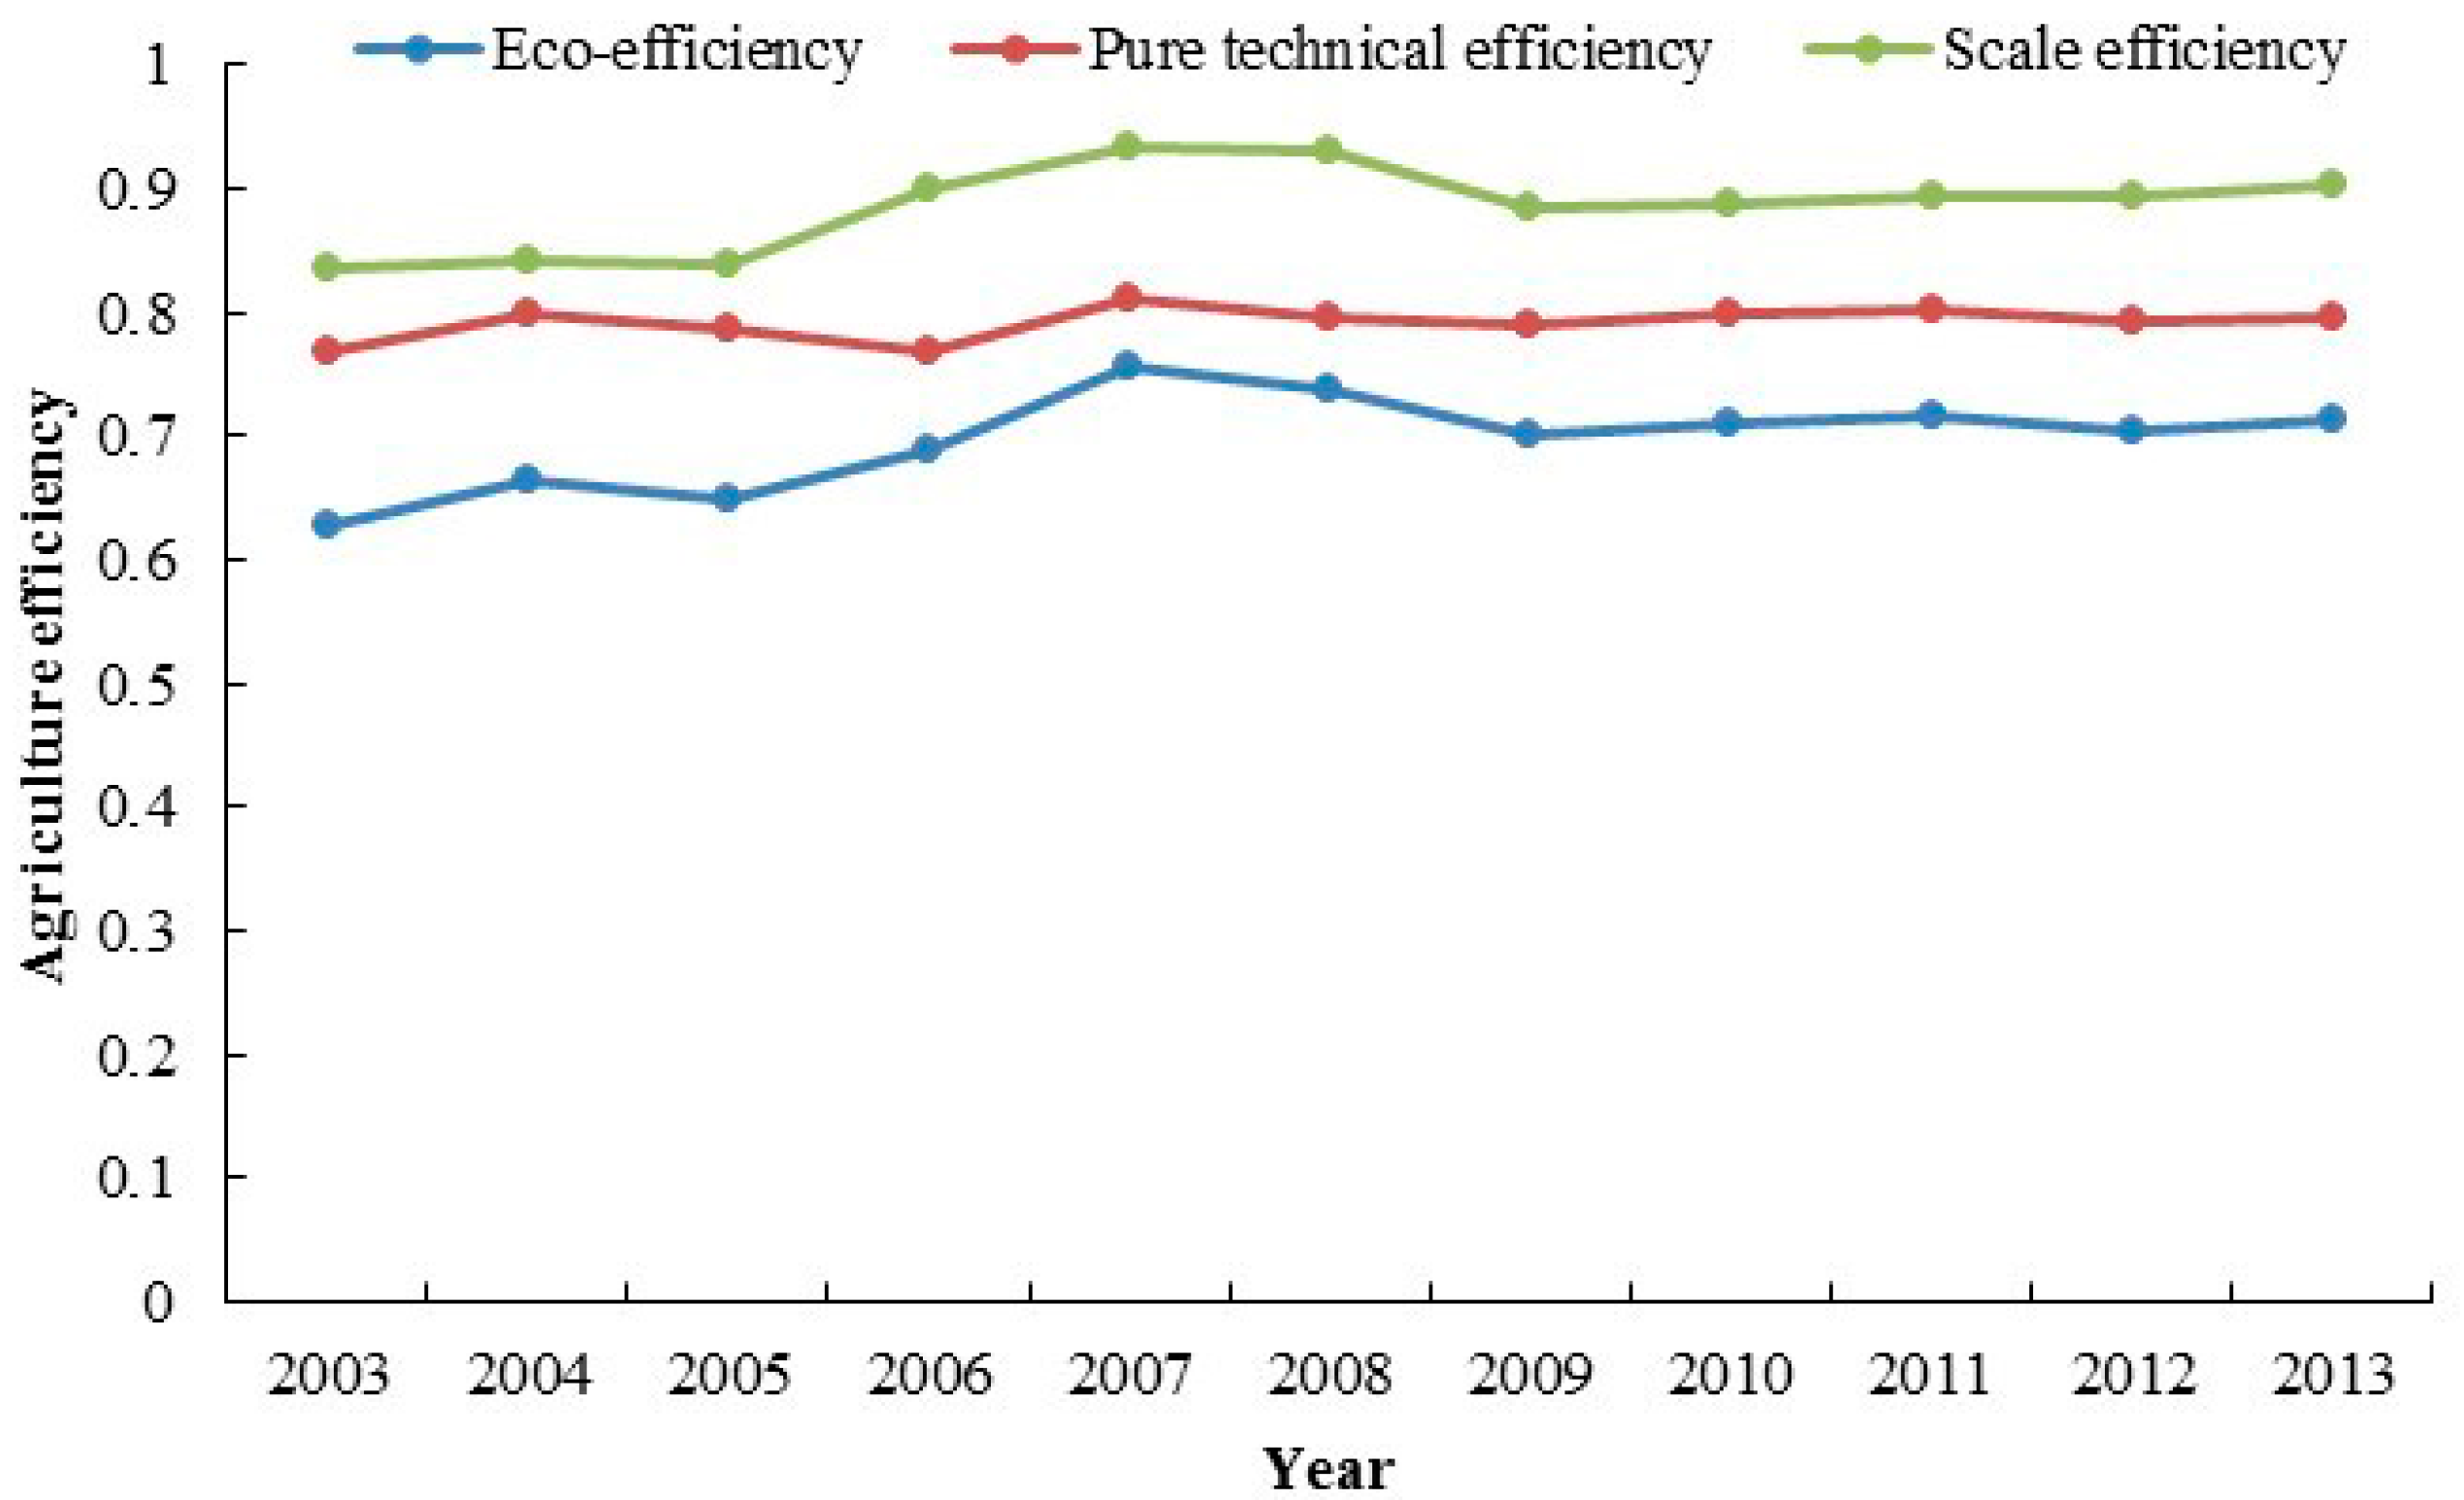
3.2. Agriculture Efficiency in China

Using the dataset and the variables described above, we used DEA solver pro 12.0 and the SBM model to calculate the agricultural eco-efficiency, pure technical efficiency, and scale efficiency, respectively. As shown in Figure 2, the agricultural eco-efficiency, pure technical efficiency, and scale efficiency had volatile, interchanging trend intervals of increases and decreases over the entire research period. Overall, however, eco-efficiency, pure technical efficiency, and scale efficiency showed an upward trend. Change trends can be divided into three stages. The first stage is from 2003 to 2007: This stage’s agricultural eco-efficiency, pure technical efficiency, and scale efficiency showed an upward trend. The second stage is from 2008 to 2009: This stage’s agricultural eco-efficiency, pure technical efficiency, and scale efficiency showed a downward trend. The third stage is from 2010 to 2013: This stage’s agricultural eco-efficiency, pure technical efficiency, and scale efficiency have an upward trend. The average value for agricultural eco-efficiency, pure technical efficiency, and scale efficiency was 0.69, 0.79, and 0.89, respectively. The distance to the efficient frontier face within 32.23 percent, 20.8 percent, and 11.42 percent of the gap show that agricultural efficiency has improvement room in China. The highest values for agricultural eco-efficiency, pure technical efficiency, and scale efficiency were 0.76, 0.82, and 0.93 in 2007, respectively. The agricultural efficiency had an upward trend because the main document from the central government has paid continuous attention to agriculture, rural areas, farmers, two-type society, and ecological civilization construction from 2003 to 2013. This document has promoted the coordinated development of the agricultural environment and agricultural resources, improved agricultural eco-efficiency, significantly developed the modern agriculture technology, improved the intensive agricultural production level, and formed a scale effect. Agricultural efficiency showed a rapid rise from 2006 to 2008 because of the Chinese government’s implementation of the “two-breaks-three-subsidies” policy of agriculture, (reducing or remitting agricultural taxes and taxes on special farm produce, the implementation of direct subsidies, seed subsidies, and the purchase of large agricultural subsidies to grain farmers). There was then a rapid decline from 2008 to 2009, because freezing rain and snow disasters, the financial crisis in 2008, and the rise in price of agricultural production materials, chemical fertilizer, agricultural machinery, and other production materials prices led to a reduction in agricultural input, causing agricultural efficiency to decline.
The results given in Figure 3a–c provide eco-efficiency performance indicators of 31 provinces. The minimum values for the agricultural eco-efficiency, pure technical efficiency, and scale efficiency was 0.2624, 0.3135, and 0.8427, respectively; the maximum value is 1, 1, and 1, respectively. A comparison of the average of the agricultural efficiency indicates that the average scale efficiency of all of the DMUs was higher than the average of eco-efficiency and pure technical efficiency. In the entire research period, only four provinces performed relatively efficiently, namely, Zhejiang, Hainan, Chongqing, and Tibet, which means that all of their pure technical efficiency and scale efficiency values were 1, indicating that the resource utilization of such DMU, whether in technique or scale, reaches the fittest. The rest of the 27 provinces need to improve in the matching relation between the input factors to improve agricultural eco-efficiency. The agricultural eco-efficiency values of Liaoning, Shandong, Qinghai, Guangdong, Sichuan, Shanghai, Fujian, Jiangsu, Hubei, and Henan were all higher than the national average level, whereas those of Beijing, Guangxi, Shaanxi, Jilin, Hebei, Jiangxi, Hunan, Tianjin, Inner Mongolia, Heilongjiang, Anhui, Xinjiang, Yunnan, Guizhou, Shanxi, Gansu, and Ningxia were lower than the national average level. The pure technical efficiency results indicated that twelve provinces performed relatively efficiently, namely, Beijing, Liaoning, Shanghai, Jiangsu, Zhejiang, Fujian, Shandong, Henan, Guangdong, Hainan, Chongqing, Sichuan, and Tibet. The scale efficiency results show only four provinces performing relatively efficiently, namely, Zhejiang, Hainan, Chongqing, and Tibet.
Using the SBM model, there are only four provinces in which agricultural eco-efficiency performed relatively efficiently, namely, Zhejiang, Hainan, Chongqing, and Tibet. This result implies that the pure technical efficiency and scale efficiency are 1 in Zhejiang, Hainan, Chongqing and Tibet. Provinces such as Beijing, Liaoning, Shanghai, Jiangsu, Fujian, Shandong, Henan, Guangdong, and Sichuan have relative pure technical efficiency without showing ideal scale efficiency, which implies that these provinces’ inefficiency is mainly due to the factors concerning operational scale. If these provinces can expand their production scale, they should be able to improve the eco-efficiency. The rest of the 18 provinces should improve the allocation of input and output factors to improve pure technical efficiency and expand operational scale to upgrade scale efficiency in order to boost the eco-efficiency. While examining the relationship between eco-efficiency, pure technical efficiency, and scale efficiency, provinces with higher eco-efficiency often present higher pure technical efficiency and scale efficiency.

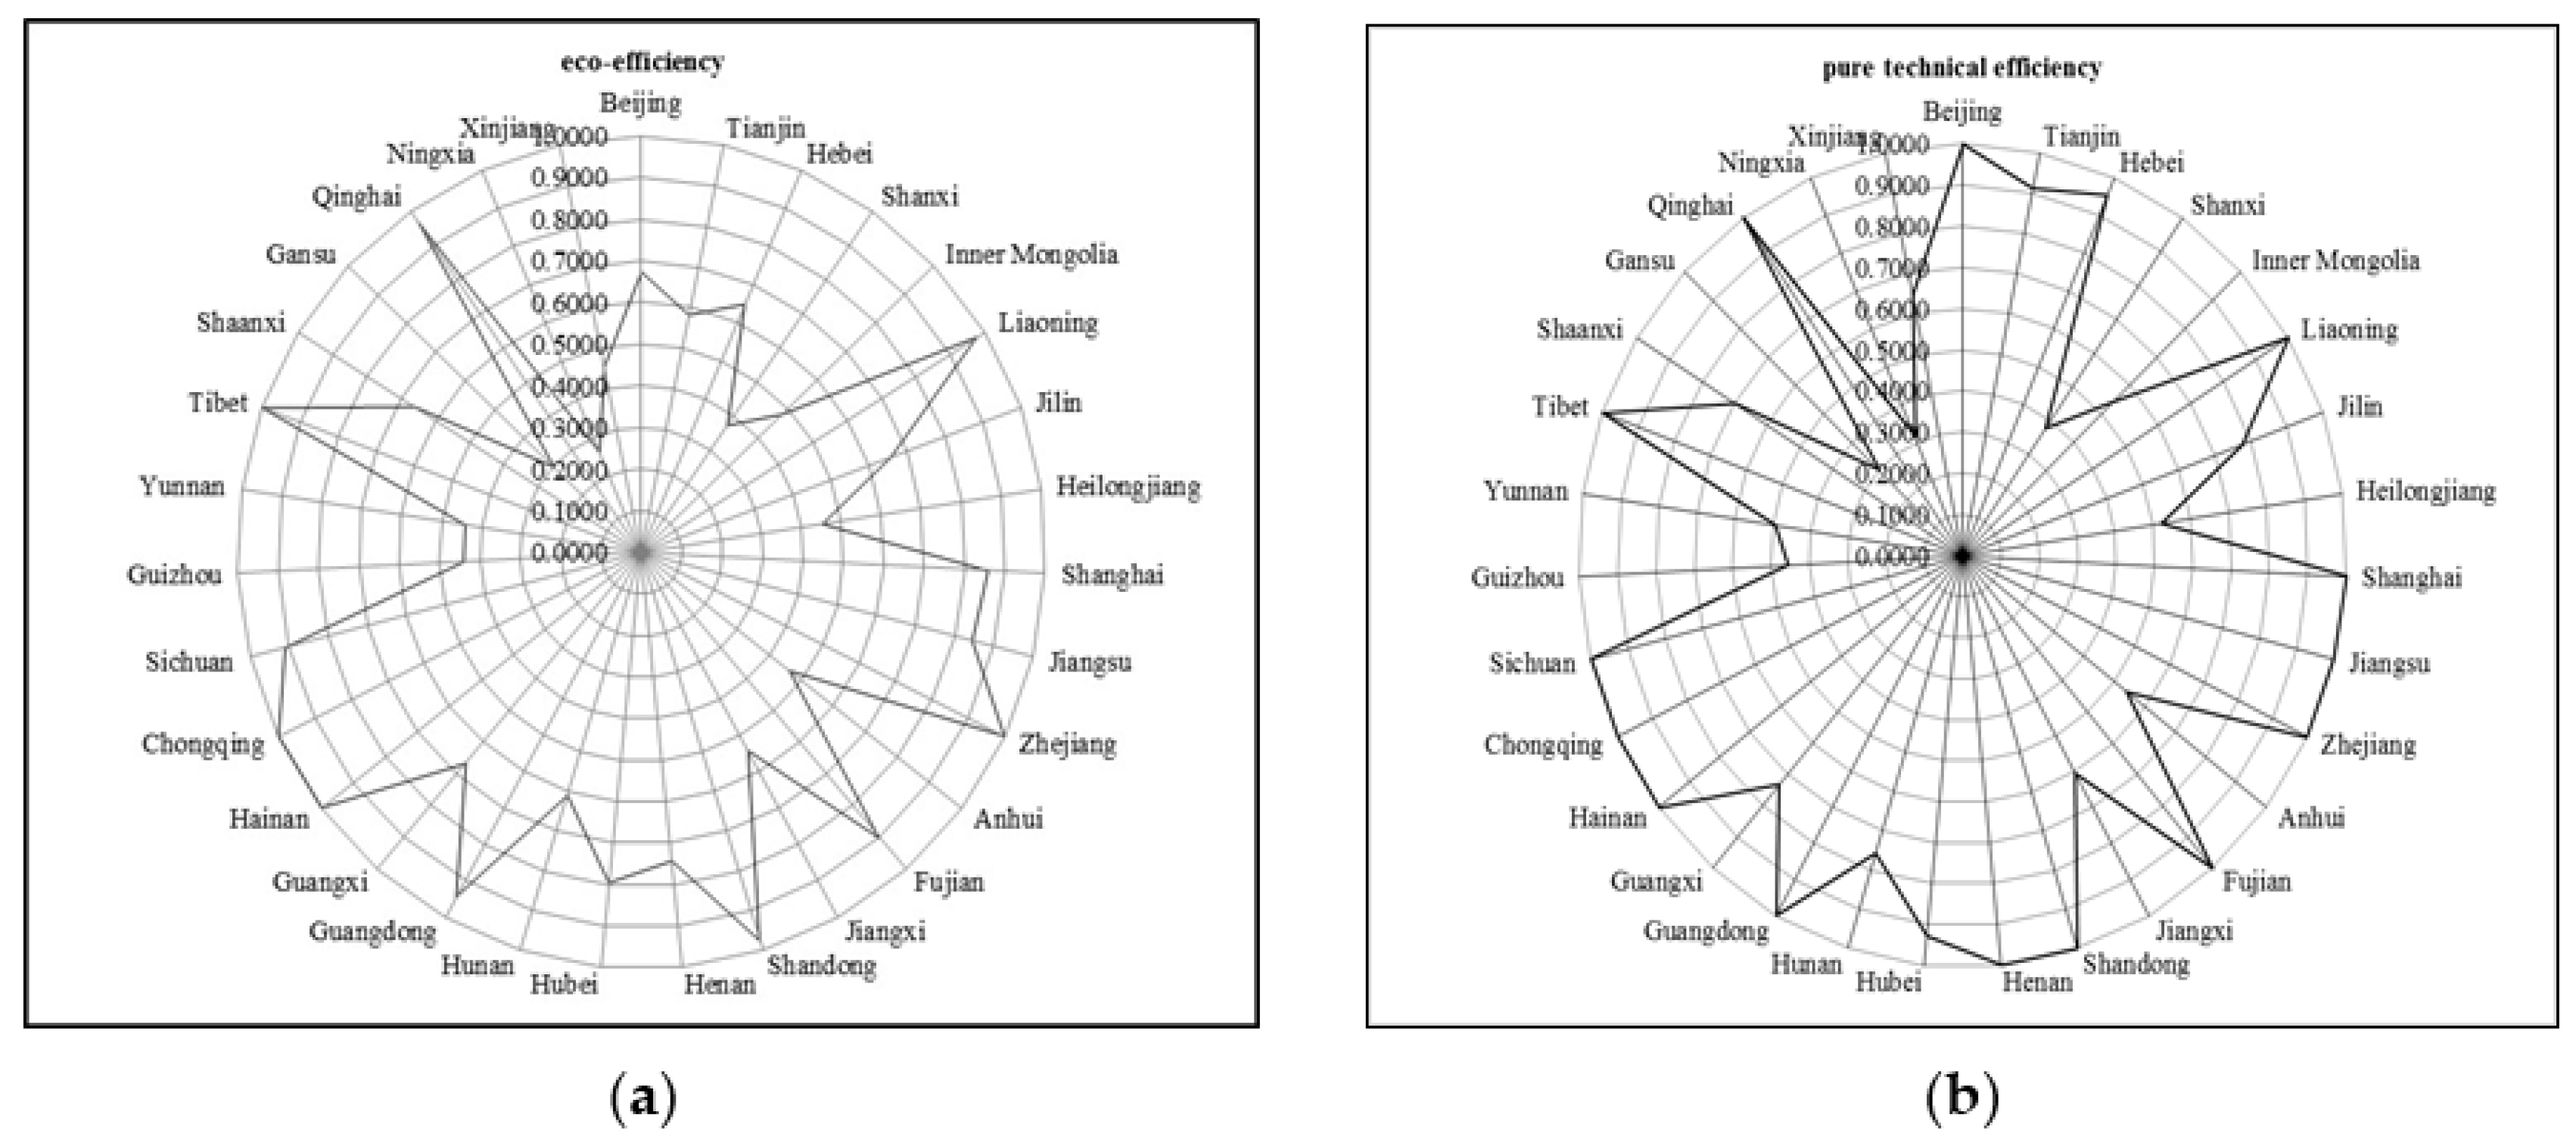
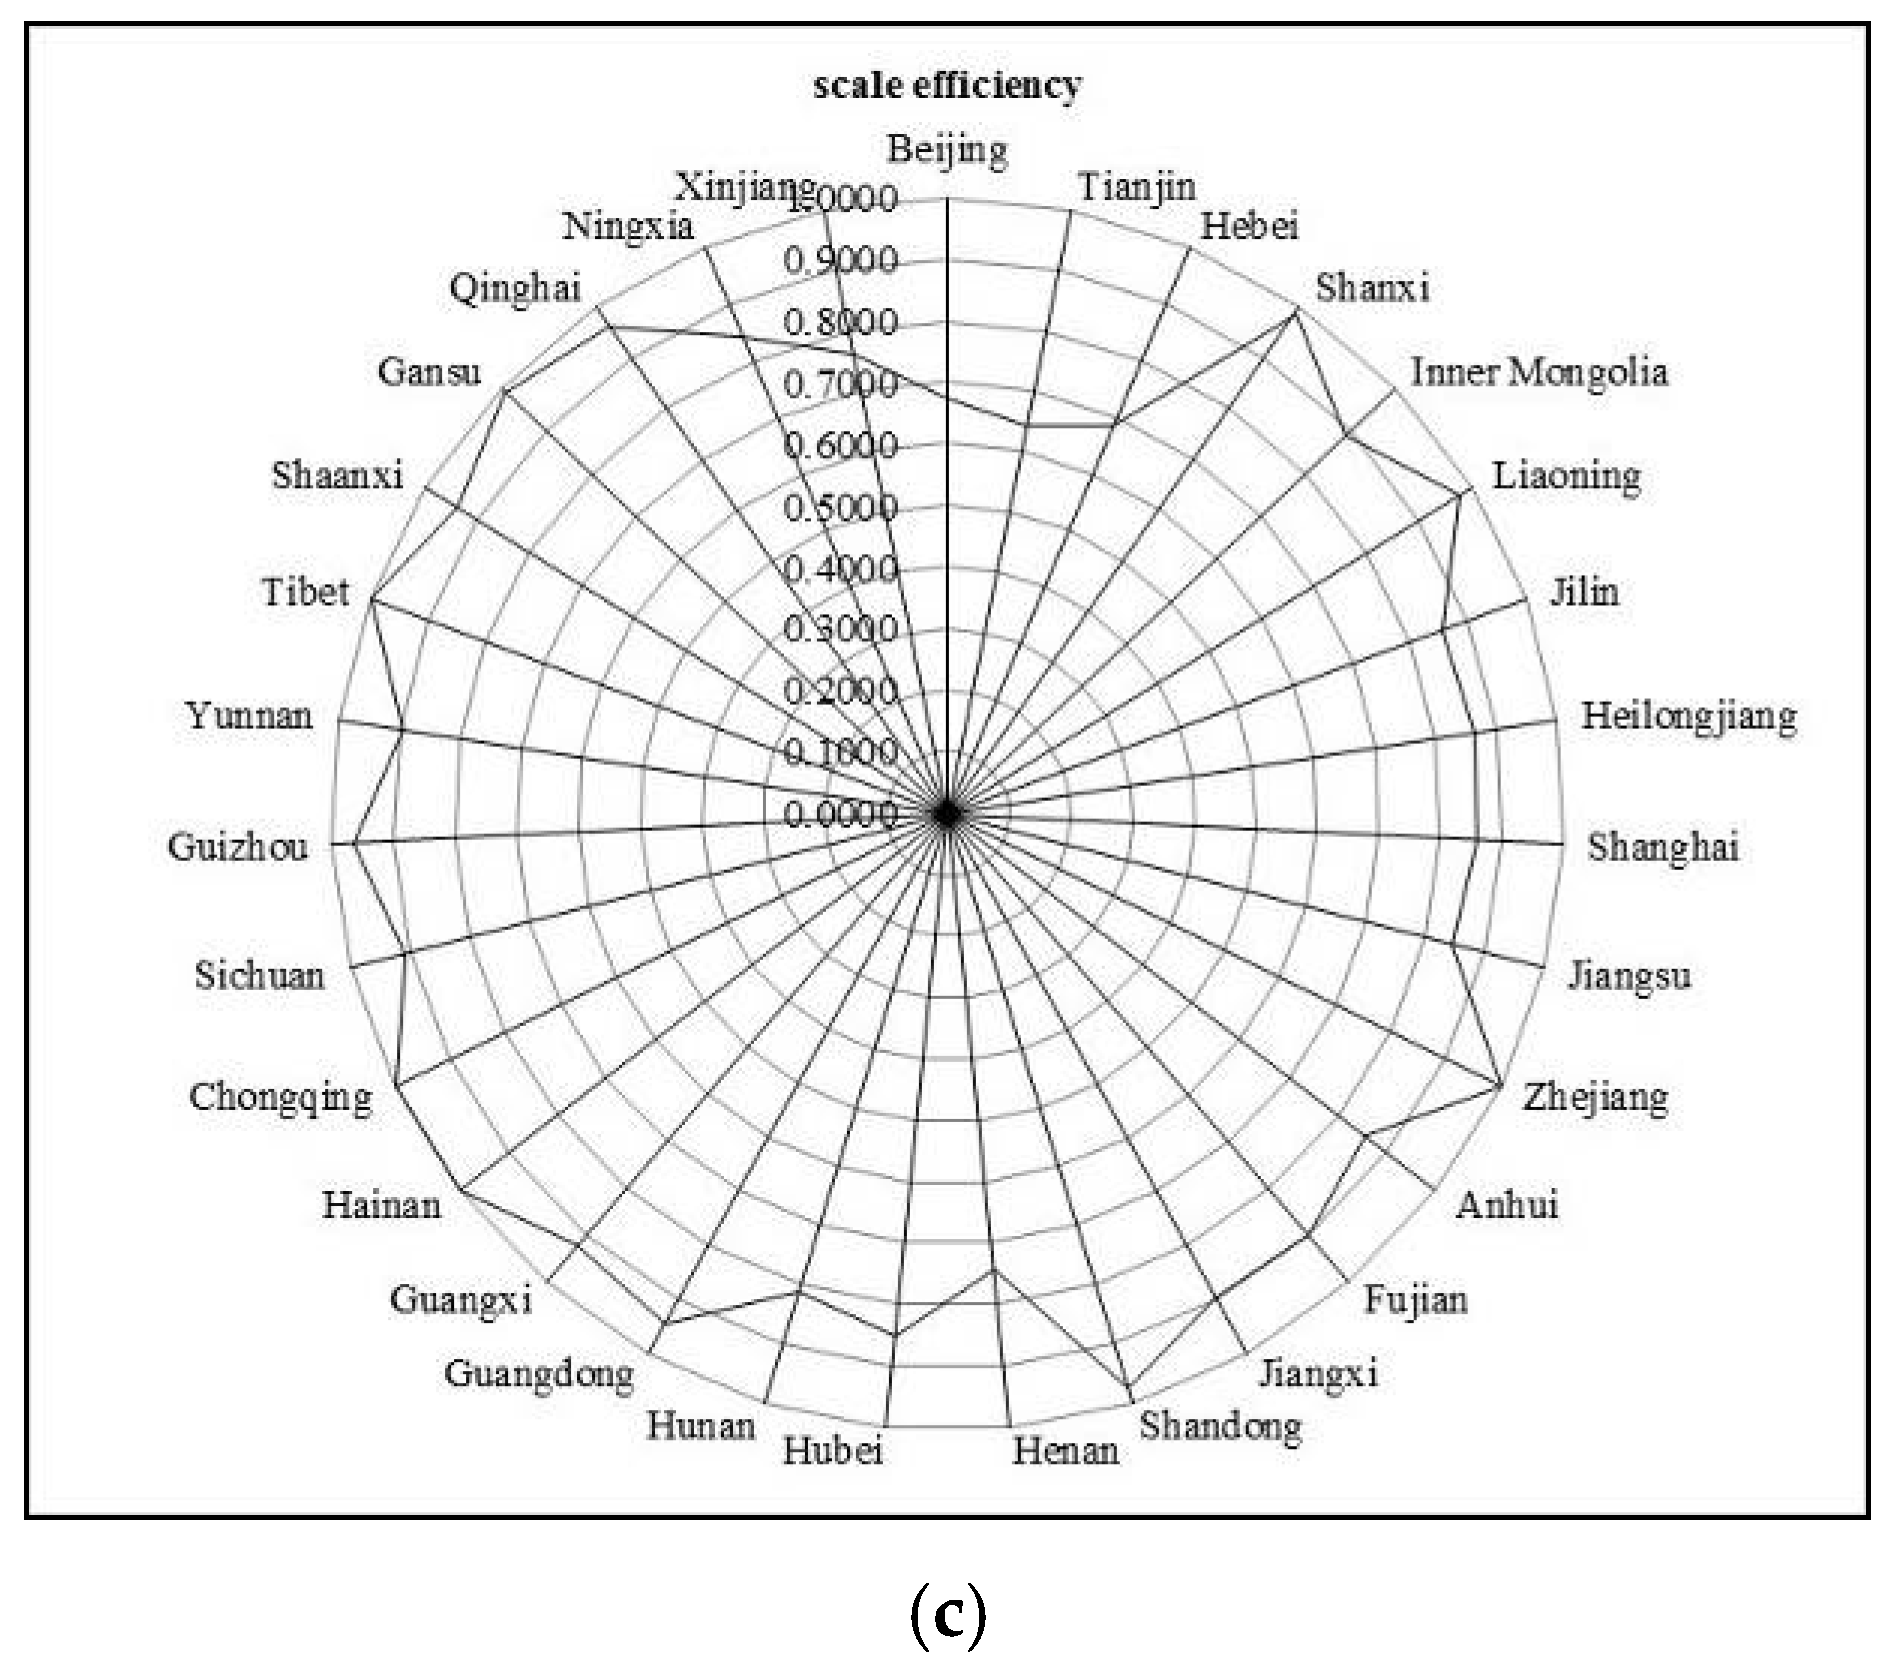
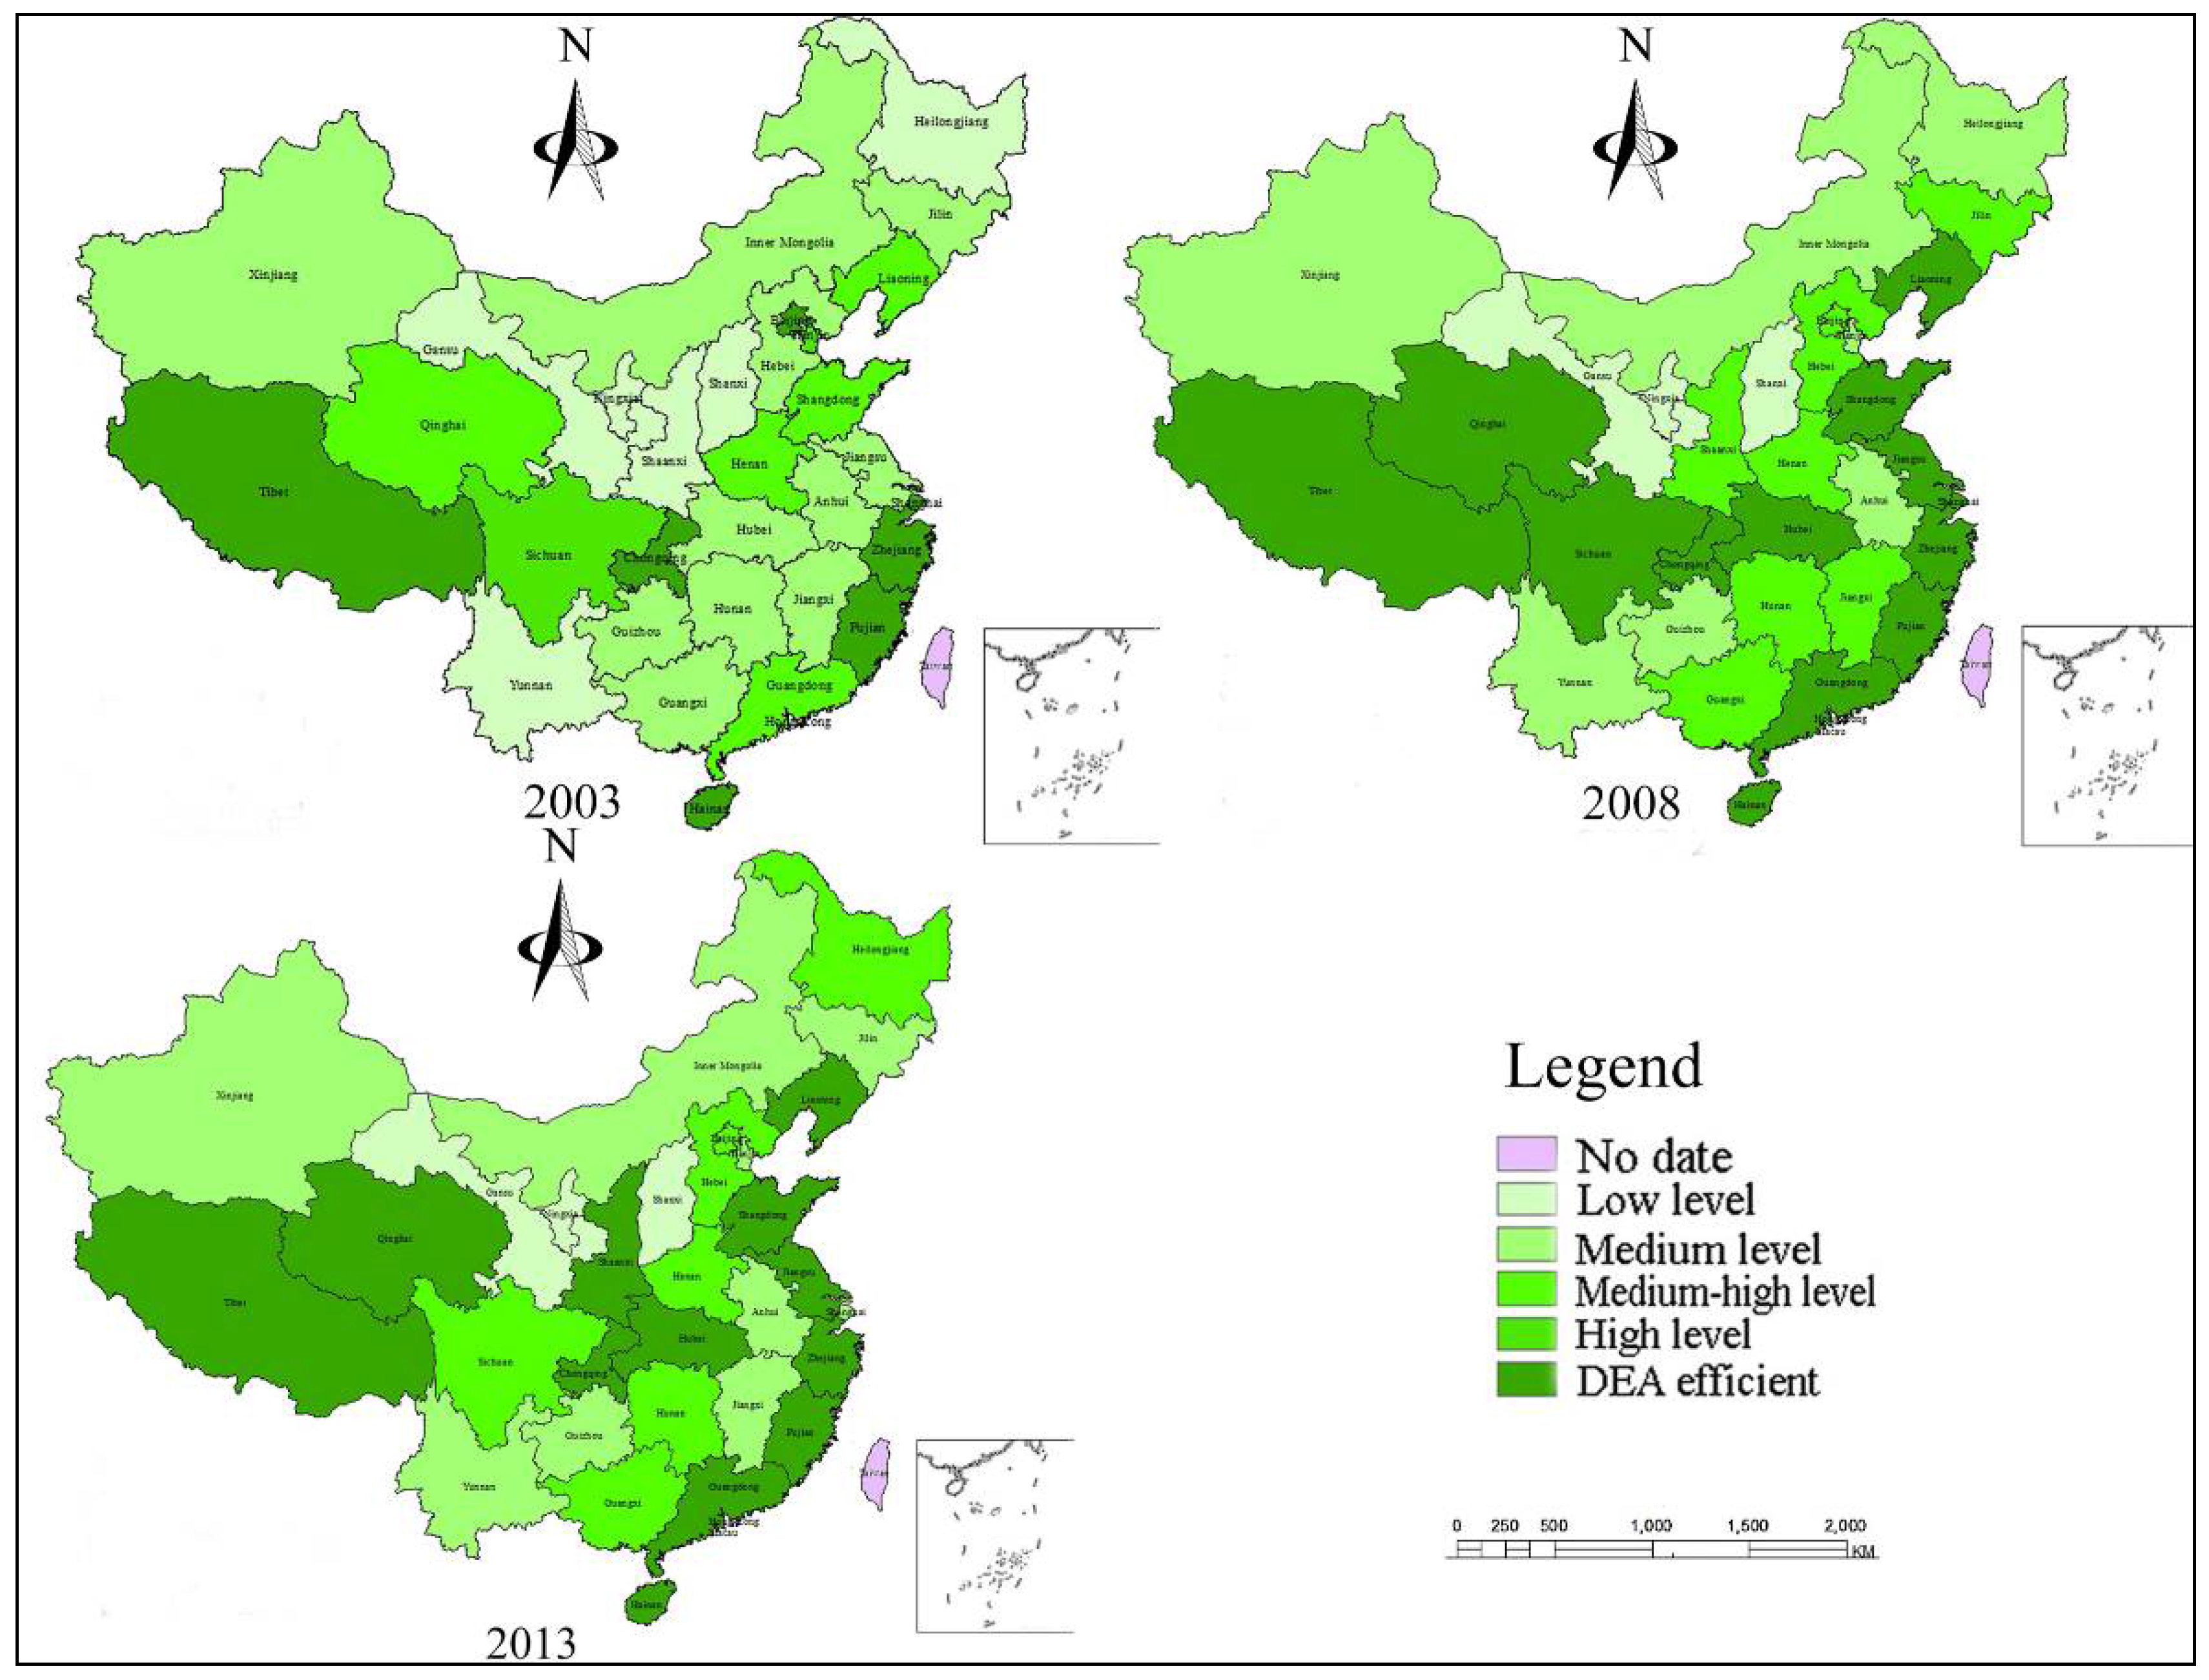
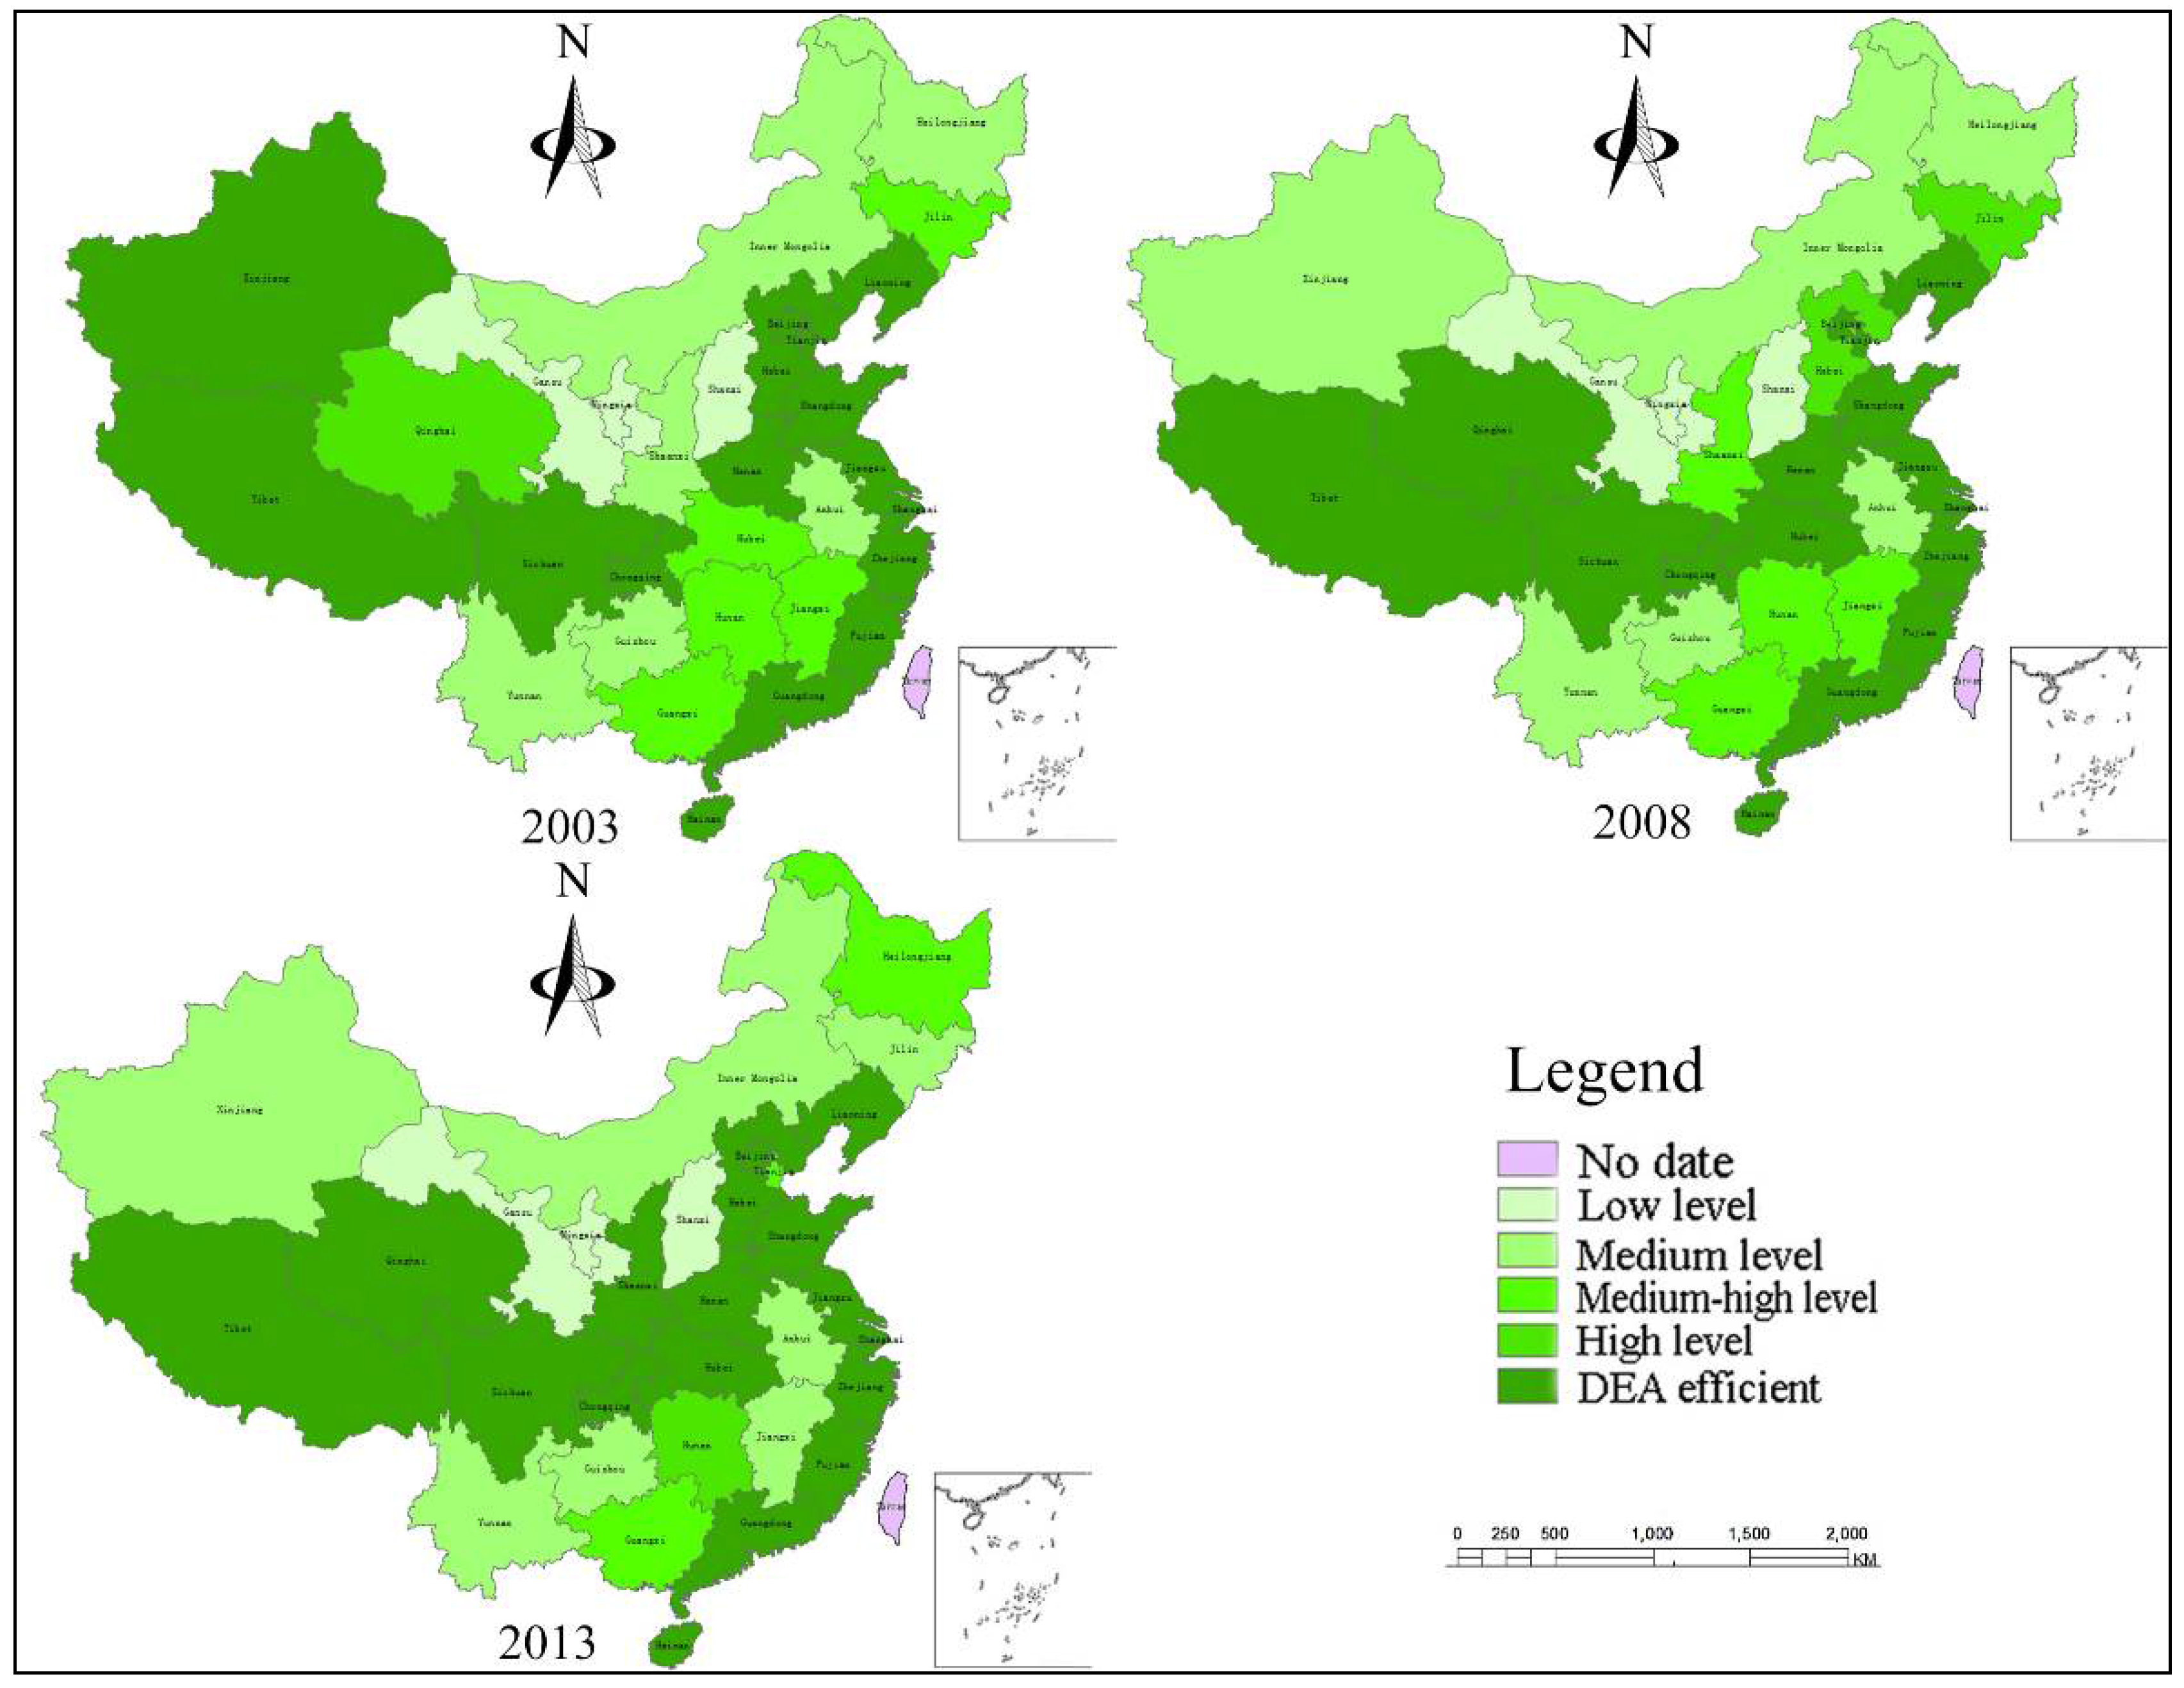
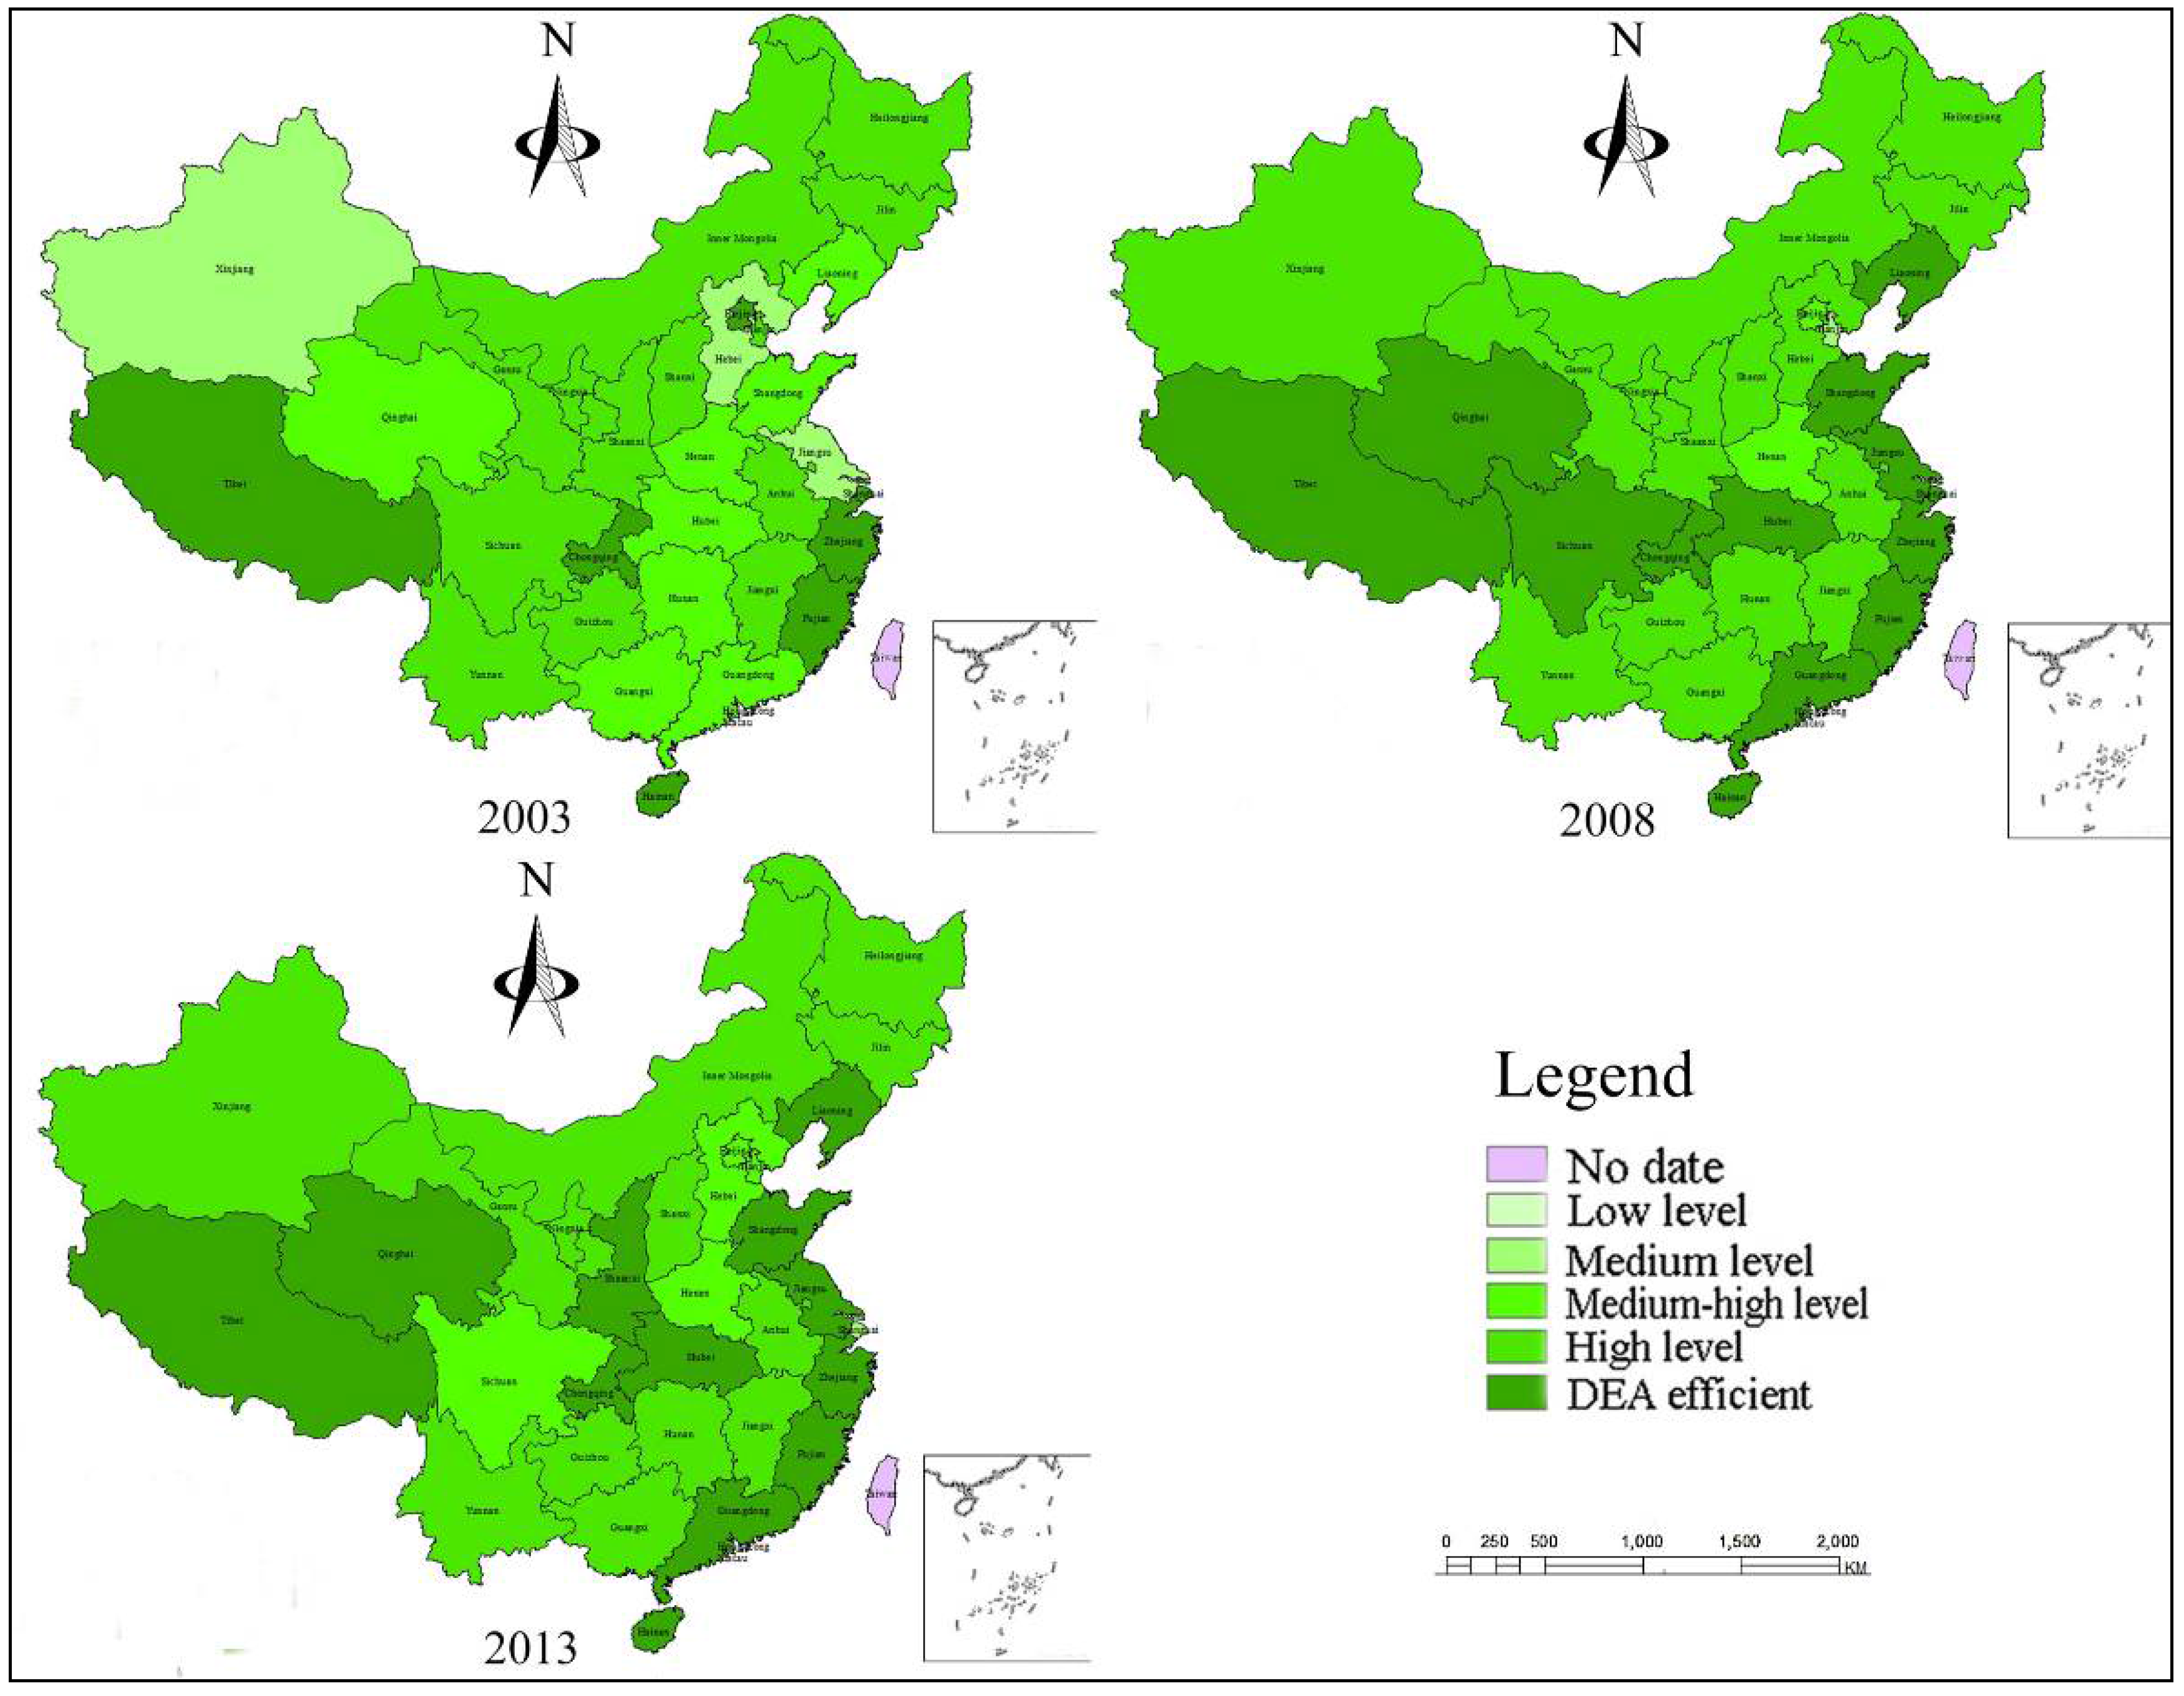
3.3. Spatial Variation of Agricultural Efficiency in China

Table 1 shows the results of agricultural eco-efficiency, pure technical efficiency, and scale efficiency from 2003 to 2013. For the entire study period, only four provinces were eco-efficient, namely, Zhejiang, Hainan, Chongqing, and Tibet. Most of the agricultural eco-efficiency values for the provinces are relatively low. Eco-efficient DMUs are not only pure technical efficient but are also scale efficient.
In order to examine the spatial variation of the agricultural efficiency, we used GIS software to analyze the spatial distribution of agricultural efficiency. We used different colors to represent different levels (DEA Efficient, High Level, Medium-high Level, Medium Level, Low Level) of agricultural efficiency (Table 2).
Figure 4 shows that there are seven provinces agricultural eco-efficient, namely, Beijing, Shanghai, Zhejiang, Fujian, Chongqing, Hainan, and Tibet in 2003. Since 2003, the main document from the national central government has paid continuous attention to agricultural issues; by 2008, agricultural eco-efficiency was reached in 13 provinces, namely, Liaoning, Shandong, Jiangsu, Shanghai, Zhejiang, Fujian, Guangdong, Hainan, Hubei, Chongqing, Sichuan, Qinghai, and Tibet. Compared with 2008, the agricultural eco-efficiency of Sichuan and Shanghai reduced in 2013, but Shaanxi became agriculture eco-efficient in 2013. All in all, agricultural eco-efficiency DEA efficient and highly efficient regions are mainly concentrated in the eastern region, except for a few mid-western provinces.
Figure 4 shows that the eastern region is more eco-efficient than the northeast, central, and western provinces. Regional differences of agricultural eco-efficiency have a similar pattern of economic development, population distribution, and cultivated land distribution in China. Relatively economically developed provinces, generally, have better ecological agriculture, advanced technology, higher management levels, and a higher quality of human resources [25] and thus use agricultural production material more efficiently and discharge fewer undesirable outputs. Tibet and Qinghai belong to a part of the Tibetan Plateau, where agricultural resources are relatively few, so the precision of agricultural production has been improving in order to raise agricultural output; at the same time, the Qinghai and Tibetan areas belong to a protected development zone in China’s agricultural sustainable development partition. Therefore, Qinghai and Tibet have been agriculturally eco-efficient.
In Figure 4 and Figure 5, we find that regional differences of agricultural eco-efficiency present a similar pattern in regional differences in agricultural pure technical efficiency in China. We find increasingly more agricultural pure technical efficient DMUs, primarily concentrated in Liaoning, Hebei, Beijing, Shandong, Jiangsu, Shanghai, Zhejiang, Fujian, Guangdong, Hainan, Henan, Hubei, Chongqing, Sichuan, Qinghai, and Tibet. These provinces see rapid economic development, and science and technology update quickly, so these provinces have a higher agricultural pure technical efficiency. Figure 6 shows that agricultural scale efficiency has been at a higher level in China from 2003 to 2013. We find that the main influence factor of agricultural eco-efficiency is the agricultural pure technical efficiency. Only via the rational cooperative relationship of the variety of input elements in the process of agricultural production can it quickly improve the agricultural eco-efficiency.
According to the various provinces’ average agricultural eco-efficiency over the research period, we find that Chinese provinces with higher agricultural eco-efficiency are mainly concentrated in the eastern coastal area, south of the Qinling Mountains-Huaihe River Line, and north of the Yangtze River area; areas low in agricultural efficiency are concentrated in Northern and Southern China. In addition, from the Chinese agriculture comprehensive regionalization point of view, the agricultural eco-efficiency of traditional major grain-producing areas is lower than that of non-primary areas.

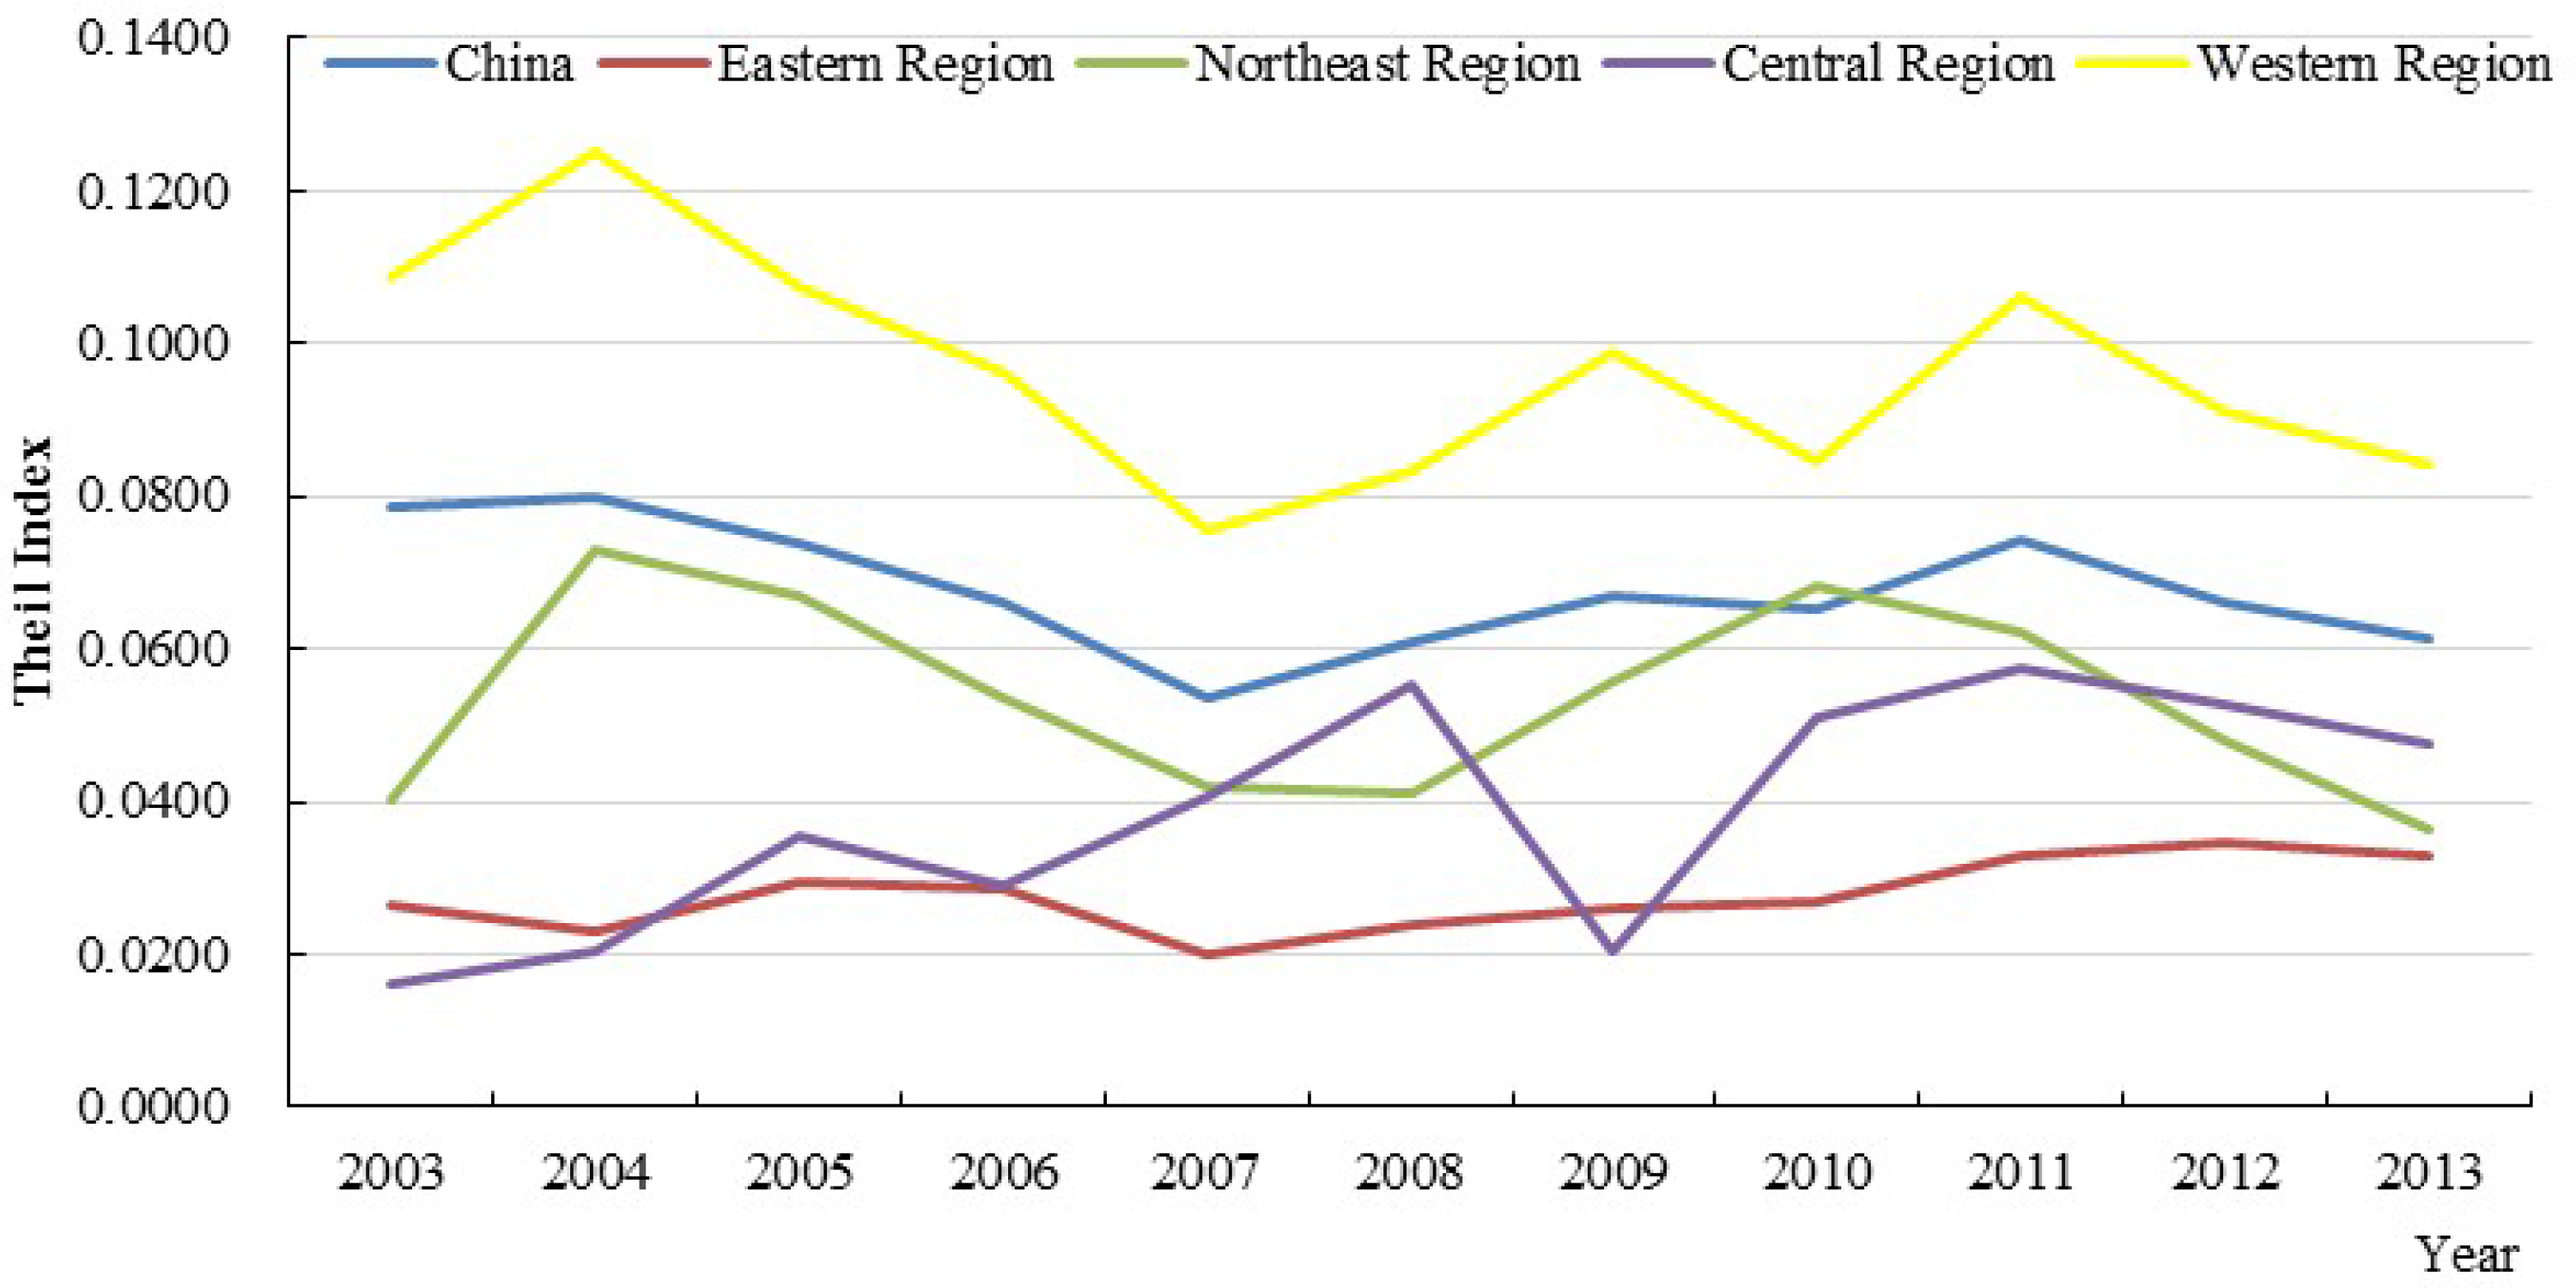
3.4. Regional Differentiation of Agricultural Eco-Efficiency in China

As shown in Figure 7, the Theil index of agricultural eco-efficiency was the lowest in the eastern region in the entire research period, but the overall performance was a small upward trend. The Theil index rose from 0.0266 in 2003 to 0.0329 in 2013, showing that the differentiation in agricultural eco-efficiency has an obvious tendency towards provinces in the eastern region. This is because the economic and technical differences in eastern provinces is larger; the Theil index of agricultural eco-efficiency largely fluctuates in the central region, where the Theil index rose from 0.0159 in 2003 to 0.0477 in 2013. The differentiation in agricultural eco-efficiency saw an upward trend between provinces of the central region, and the differentiation in the central region was larger than that of the eastern region. The Theil index of agricultural eco-efficiency in the northeast region demonstrated an “M” type of trend: The overall performance was declining, the Theil index dropped from 0.0402 in 2003 to 0.0364 in 2013, which shows that differentiation of the agricultural eco-efficiency had a downward trend between provinces of the northeast region. The Theil index of agricultural eco-efficiency was relatively high in the western region; however, the overall performance had a downward trend; the Theil index dropped from 0.1087 in 2003 to 0.0841 in 2013, larger than that of the northeast region. This is because the western region is China’s traditional agricultural planting area, the basic conditions of agricultural relatively poor, and, especially, Qinghai and Tibet are not suitable for the development of large-scale agricultural production.
Agricultural eco-efficiency was influenced by the technological level, the scale of production, the national macro policy, the improvement of agricultural infrastructure, and so on. Overall, the Theil index of the western region was the largest, with an average Theil index of 0.0965. The second largest was the northeast region and the central region, with an average Theil index of 0.0534 and 0.0387. The eastern region was 0.0277; however, the Theil index of the central and eastern regions has shown a small upward trend.
The Theil index of China’s agricultural eco-efficiency has a downward trend. The nationwide Theil index is higher than the eastern, central, and northeast regions, dropping from 0.0785 in 2003 to 0.0614 in 2013. The nationwide Theil index trend is basically identical to the western and northeast regions. The results show that the nationwide Theil index is greatly influenced by the Theil index of the western and northeast regions.

4. Summaries and Conclusions

This paper addressed agricultural eco-efficiency by taking various undesirable outputs into account and using them to contain undesirable outputs of non-radial and non-angle of the DEA-SBM model and further identified the regional differences of agricultural eco-efficiency by adopting the Theil Index during 2003–2013 in China. Using the real data of 31 provinces, an empirical study was employed to illustrate the eco-efficiency of regional agricultural systems in China. This study would gain deeper insights into agricultural eco-efficiency, and give a further guide on policy making of regional ecological agriculture development in China. In general, with the rapid development of agriculture modernization, the amount of undesirable outputs has been continuously increasing, which will lead to greater pressure on environment friendly agricultural production, which can occur through the development of ecological agriculture and thus a reduction in agricultural undesirable output. However, the ecological agriculture development level is still low, especially compared with developed countries.
The paper also provided evidence and suggestions with respect to China’s agricultural development. The results show that agricultural eco-efficiency rose rising from 2003 to 2013 in China. The results also show that agricultural eco-efficiency increased from 7 provinces in 2003 to 12 provinces in 2013, and the spatial difference of agricultural eco-efficiency slowed. The results indicate that regional agricultural eco-efficiency presents a similar pattern of regional agricultural pure technical efficiency, and agricultural scale efficiency increased from 2003 to 2013 in China. The conflicting results of pure technical efficiency and scale efficiency indicate that China needs timely updates in its agricultural, technological, and rational institutional arrangement to improve its agricultural technology level and production methods and to achieve reduction intensity of undesirable outputs. The results show that provinces with higher Chinese agricultural eco-efficiency are mainly concentrated in the eastern coastal area, south of the Qinling Mountains-Huaihe River Line, and north of the Yangtze River area. In traditional major grain-producing areas, agricultural eco-efficiency is lower than non-primary areas.
The Theil index analysis helps to understand the regional differences in agricultural eco-efficiency. Results indicate that China’s agricultural eco-efficiency spatial differences between provinces is generally narrowing, creating a gradual equalization on regional agricultural development; spatial differences in agricultural eco-efficiency maximum values occur between the western provinces, but the Theil index of the western region is declining; the northeast region is less eco-efficient than the western region, with a Theil index showing a smaller downward trend; the spatial difference in agricultural eco-efficiency is increasing in the eastern and central regions, but the difference in the central region is more obvious.
The integrated approach applied in this paper is suggested as a tool to evaluate the eco-efficiency and to grasp the regional differences in draft policy scenarios for the sustainable management of agriculture. We believe that our research results will provide useful assistance to policy makers. China should draw lessons from foreign developed countries of agricultural policy and abandon the price support system. The ecological environment should become the core content of the agricultural subsidy policy in order to achieve an ecological subsidy shift away from a price subsidy.

Acknowledgments

The authors would like to acknowledge the financial support from the Natural Science Foundation of China (41471462 and 41301652), the Specialized Research Fund for the Doctoral Program of Higher Education (20120211120026), and the Fundamental Research Funds for the Central Universities (lzujbky-2014-280 and lzujbky-2015-147).

Author Contributions

Jiaxing Pang contributed to the data collection, data processing, and drafting of the paper; Xingpeng Chen and Zilong Zhang conceived and designed the study, conducted data analysis, and revised the paper; Hengji Li contributed to data analysis and revised the paper.

Conflicts of Interest

The authors declare no conflict of interest.

References

  1. Wu, W.B.; Verburg, P.H.; Tang, H.J. Climate change and the food production system: Impacts and adaptation in China. Reg. Environ. Chang. 2014, 14, 1–5. [Google Scholar] [CrossRef]
  2. Li, Z.G.; Liu, Z.H.; Anderson, W.; Yang, P.; Wu, W.B.; Tang, H.J.; You, L.Z. Chinese Rice Production Area Adaptations to Climate Changes, 1949–2010. Environ. Sci. Technol. 2015, 49, 2032–2037. [Google Scholar] [CrossRef] [PubMed]
  3. Peng, J.; Liu, Z.C.; Liu, Y.X.; Hu, X.X.; Wang, A. Multifunctionality assessment of urban agriculture in Beijing City, China. Sci. Total Environ. 2015, 537, 343–351. [Google Scholar] [CrossRef] [PubMed]
  4. Liu, Y.S.; Fang, F.; Li, Y.H. Key issues of land use in China and implications for policy making. Land Use Policy 2014, 40, 6–12. [Google Scholar] [CrossRef]
  5. Lu, Y.L.; Chadwick, D.; Norse, D.; Powlsond, D.; Shi, W.M. Sustainable intensification of China’s agriculture: The key role of nutrient management and climate change mitigation and adaptation. Agric. Ecosyst. Environ. 2015, 209, 1–4. [Google Scholar] [CrossRef]
  6. Liu, G.D.; Wu, W.L.; Zhang, J. Regional differentiation of non-point source pollution of agriculture-derived nitrate nitrogen in groundwater in northern China. Agric. Ecosyst. Environ. 2005, 107, 211–220. [Google Scholar] [CrossRef]
  7. Shi, X.P.; Heerink, N.; Qu, F.T. Does off-farm employment contribute to agriculture-based environmental pollution? New insights from a village-level analysis in Jiangxi Province, China. China Econ. Rev. 2011, 22, 524–533. [Google Scholar] [CrossRef]
  8. Smith, L.E.D.; Siciliano, G. A comprehensive review of constraints to improved management of fertilizers in China and mitigation of diffuse water pollution from agriculture. Agric. Ecosyst. Environ. 2015, 209, 15–25. [Google Scholar] [CrossRef]
  9. Sattari, S.Z.; van Ittersum, M.K.; Giller, K.E.; Zhang, F.; Bouwman, A.F. Key role of China and its agriculture in global sustainable phosphorus management. Environ. Res. Lett. 2014, 9. Article 5. [Google Scholar] [CrossRef]
  10. Lv, Z.Y.; Niu, L.A.; Hao, J.M.; Hu, J.; Sheng, G.C. Problems Faced by Ecological Environment of Agriculture in China and Their Improving Countermeasures. Chin. Agric. Sci. Bull. 2009, 25, 218–224. [Google Scholar]
  11. Liu, G.P.; Zhou, Y.C.; Fang, Y.; Shang, Q.; Chen, J. Current situation and Countermeasures of agricultural pollution in China. Stud. Int. Technol. Econ. 2006, 9, 17–21. [Google Scholar]
  12. Zhang, Z.L.; Lu, C.Y.; Chen, X.P.; Xue, B. Spatio-temporal evolution of agricultural eco-efficiency in loess plateau of east Gansu province: A case study of Qingyang City. Chin. Sci. Geogr. Sin. 2014, 34, 472–478. [Google Scholar]
  13. Guiping, L.; Yongchun, Z.; Yan, F.; Qi, S.; Jie, C. China’s agriculture pollution status and countermeasures. Int. Tech. Econ. Res. 2006, 10, 17–21. [Google Scholar]
  14. Qin, Y.W.; Yan, H.M.; Liu, J.Y.; Dong, J.W.; Chen, J.Q.; Xiao, X.M. Impacts of ecological restoration projects on agricultural productivity in China. J. Geogr. Sci. 2013, 23, 404–416. [Google Scholar] [CrossRef]
  15. Goodland, R. Sustainable ecological agriculture in China. Ecol. Econ. 2013, 89, 203–203. [Google Scholar] [CrossRef]
  16. Wang, H.X.; Qin, L.H.; Huang, L.L.; Zhang, L. Ecological agriculture in China: Principles and applications. In Advances in Agronomy; Sparks, D.L., Ed.; Elsevier Academic Press Inc.: San Diego, CA, USA, 2007; Volume 94, pp. 181–208. [Google Scholar]
  17. Sanders, R. A market road to sustainable agriculture? Ecological agriculture, green food and organic agriculture in China. Dev. Chang. 2006, 37, 201–226. [Google Scholar] [CrossRef]
  18. Willard, B. The Sustainability Advantage: Seven Business Case Benefits of a Triple Bottom Line; New Society Publishers: Gabriola Island, BC, Canada, 2002. [Google Scholar]
  19. World Business Council for Sustainable Development. Measuring Eco-Efficiency: A Guide to Reporting Company Performance; WBCSD: Geneva, Switzerland, 2000. [Google Scholar]
  20. Figge, F.; Hahn, T. Sustainable Value Added—measuring corporate contributions to sustainability beyond eco-efficiency. Ecol. Econ. 2004, 48, 173–187. [Google Scholar] [CrossRef]
  21. Huppes, G.; Ishikawa, M. A framework for quantified eco-efficiency analysis. J. Ind. Ecol. 2005, 9, 25–41. [Google Scholar] [CrossRef]
  22. Chen, R.Y. RFM-based eco-efficiency analysis using Takagi-Sugeno fuzzy and AHP approach. Environ. Impact Assess. Rev. 2009, 29, 157–164. [Google Scholar] [CrossRef]
  23. Golak, S.; Burchart-Korol, D.; Czaplicka-Kolarz, K.; Wieczorek, T. Application of neural network for the prediction of eco-efficiency. In Advances in Neural Networks-Isnn 2011; Liu, D., Zhang, H., Polycarpou, M., Alippi, C., He, H., Eds.; Springer-Verlag Berlin: Berlin, Germany, 2011; Volume 6677, pp. 380–387. [Google Scholar]
  24. Korhonen, P.J.; Luptacik, M. Eco-efficiency analysis of power plants: An extension of data envelopment analysis. Eur. J. Oper. Res. 2004, 154, 437–446. [Google Scholar] [CrossRef]
  25. Zhang, B.; Bi, J.; Fan, Z.Y.; Yuan, Z.W.; Ge, J.J. Eco-efficiency analysis of industrial system in China: A data envelopment analysis approach. Ecol. Econ. 2008, 68, 306–316. [Google Scholar] [CrossRef]
  26. Yang, W.; Jin, F.J.; Wang, C.J.; Lv, C. Industrial eco-efficiency and its spatial-temporal differentiation in China. Front. Environ. Sci. Eng. 2012, 6, 559–568. [Google Scholar] [CrossRef]
  27. Mao, J.S.; Zeng, R.; Du, Y.C.; Jiang, P. Eco-efficiency of industry sectors for China. Huanjing Kexue 2010, 31, 2788–2794. [Google Scholar] [PubMed]
  28. Wang, G.M.; Cote, R. Integrating eco-efficiency and eco-effectiveness into the design of sustainable industrial systems in China. Int. J. Sustain. Dev. World Ecol. 2011, 18, 65–77. [Google Scholar] [CrossRef]
  29. Zhang, X.M.; Han, G.A. On the Industrial Development of China’s Western Region Based on Eco-Efficiency; Aussino Acad Publ House: Marrickville, Australia, 2009; pp. 351–355. [Google Scholar]
  30. Liu, Y.Y.; Sun, C.Z.; Xu, S.G. Eco-efficiency assessment of water systems in China. Water Resour. Manag. 2013, 27, 4927–4939. [Google Scholar] [CrossRef]
  31. Huang, J.H.; Yang, X.G.; Cheng, G.; Wang, S.Y. A comprehensive eco-efficiency model and dynamics of regional eco-efficiency in China. J. Clean. Prod. 2014, 67, 228–238. [Google Scholar] [CrossRef]
  32. Huang, H.P. Eco-efficiency-based Evaluation of the Resource and Environmental Performances of Jiangxi Province, China. In Advances in Environmental Engineering; Zhang, G.D., Cheng, S.G., Eds.; Trans Tech Publications Ltd.: Stafa-Zurich, Switzerland, 2012; Volume 599, pp. 175–181. [Google Scholar]
  33. Liu, J.S.; Lu, L.Y.Y.; Lu, W.M.; Lin, B.J.Y. A survey of DEA applications. Omega Int. J. Manag. Sci. 2013, 41, 893–902. [Google Scholar] [CrossRef]
  34. Song, M.L.; An, Q.X.; Zhang, W.; Wang, Z.Y.; Wu, J. Environmental efficiency evaluation based on data envelopment analysis: A review. Renew. Sustain. Energy Rev. 2012, 16, 4465–4469. [Google Scholar] [CrossRef]
  35. Zhang, Z.L.; Chen, X.P.; Heck, P. Emergy-based regional socio-economic metabolism analysis: An application of data envelopment analysis and decomposition analysis. Sustainability 2014, 6, 8618–8638. [Google Scholar] [CrossRef]
  36. Tone, K. A slacks-based measure of efficiency in data envelopment analysis. Eur. J. Oper. Res. 2001, 130, 498–509. [Google Scholar] [CrossRef]
  37. Tone, K. A slacks-based measure of super-efficiency in data envelopment analysis. Eur. J. Oper. Res. 2002, 143, 32–41. [Google Scholar] [CrossRef]
  38. Li, H.; Shi, J.F. Energy efficiency analysis on Chinese industrial sectors: An improved Super-SBM model with undesirable outputs. J. Clean. Product. 2014, 65, 97–107. [Google Scholar] [CrossRef]
  39. Song, M.L.; Song, Y.Q.; An, Q.X.; Yu, H.Y. Review of environmental efficiency and its influencing factors in China: 1998–2009. Renew. Sustain. Energy Rev. 2013, 20, 8–14. [Google Scholar] [CrossRef]
  40. Picazo-Tadeo, A.J.; Gomez-Limon, J.A.; Reig-Martinez, E. Assessing farming eco-efficiency: A Data Envelopment Analysis approach. J. Environ. Manag. 2011, 92, 1154–1164. [Google Scholar] [CrossRef] [PubMed]
  41. Rosano-Pena, C.; Guarnieri, P.; Sobreiro, V.A.; Serrano, A.L.M.; Kimura, H. A measure of sustainability of Brazilian agribusiness using directional distance functions and data envelopment analysis. Int. J. Sustain. Dev. World Ecol. 2014, 21, 210–222. [Google Scholar] [CrossRef]
  42. Atici, K.B.; Podinovski, V.V. Using data envelopment analysis for the assessment of technical efficiency of units with different specialisations: An application to agriculture. Omega Int. J. Manag. Sci. 2015, 54, 72–83. [Google Scholar] [CrossRef] [Green Version]
  43. Sun, Y.L.; Li, Y.X.; Wang, G.L. The Evaluation Method and Application of Sustainable Development of Agriculture Based on DEA; Aussino Acad Publ House: Marrickville, Australia, 2010; pp. 1–10. [Google Scholar]
  44. Adhikari, C.B.; Bjorndal, T. Analyses of technical efficiency using SDF and DEA models: Evidence from Nepalese agriculture. Appl. Econ. 2012, 44, 3297–3308. [Google Scholar] [CrossRef]
  45. National Bureau of Statistics of the People’s Republic of China. China Rural Statistical Yearbooks 2004–2014; China Statistical Press: Beijing, China, 2004–2014.
Figure 1. Added value of agriculture (a) and agricultural pollutants (b) in China.
Sustainability 08 00398 g001
Figure 2. China’s agricultural efficiency from 2003 to 2013.
Sustainability 08 00398 g002
Figure 3. The provincial agricultural eco-efficiency radar map (a); the provincial agricultural pure technical efficiency radar map (b); the provincial agricultural scale efficiency radar map (c).
Sustainability 08 00398 g003aSustainability 08 00398 g003b
Figure 4. Chinese agricultural eco-efficiency spatial distribution pattern.
Sustainability 08 00398 g004
Figure 5. Chinese agricultural pure technical efficiency spatial distribution pattern.
Sustainability 08 00398 g005
Figure 6. Chinese agricultural scale efficiency spatial distribution pattern.
Sustainability 08 00398 g006
Figure 7. The Theil index of agricultural eco-efficiency from 2003 to 2013.
Sustainability 08 00398 g007
Table 1. Results of provincial agricultural efficiency analysis.
NAMEEco-EfficiencyPure Technical EfficiencyScale Efficiency
200320082013200320082013200320082013
Beijing1.00000.61970.64231.00001.00001.00001.00000.61970.6423
Tianjin0.85250.51170.47630.99990.99980.67550.85260.51180.7051
Hebei0.55030.69240.68731.00000.82031.00000.55030.84410.6873
Shanxi0.34850.31890.38680.35500.32560.38810.98170.97940.9967
Inner Mongolia0.40060.53910.48290.46710.59150.51250.85760.91140.9422
Liaoning0.75161.00001.00001.00001.00001.00000.75161.00001.0000
Jilin0.58830.72210.55500.68070.80740.58820.86430.89440.9436
Heilongjiang0.36550.48700.60610.44240.54050.66550.82620.90100.9107
Shanghai1.00001.00000.55491.00001.00001.00001.00001.00000.5549
Jiangsu0.51051.00001.00001.00001.00001.00000.51051.00001.0000
Zhejiang1.00001.00001.00001.00001.00001.00001.00001.00001.0000
Anhui0.49940.49970.45340.57840.54060.51760.86340.92430.8760
Fujian1.00001.00001.00001.00001.00001.00001.00001.00001.0000
Jiangxi0.50600.62210.57380.60200.63990.59790.84050.97220.9597
Shandong0.72851.00001.00001.00001.00001.00000.72851.00001.0000
Henan0.65030.75840.62691.00001.00001.00000.65030.75840.6269
Hubei0.51601.00001.00000.66991.00001.00000.77031.00001.0000
Hunan0.46910.70590.66610.62740.76610.80950.74770.92140.8229
Guangdong0.71091.00001.00001.00001.00001.00000.71091.00001.0000
Guangxi0.46470.74460.70950.61420.74910.71170.75660.99400.9969
Hainan1.00001.00001.00001.00001.00001.00001.00001.00001.0000
Chongqing1.00001.00001.00001.00001.00001.00001.00001.00001.0000
Sichuan0.81001.00000.71581.00001.00001.00000.81001.00000.7158
Guizhou0.41350.45340.49920.44070.46470.51330.93830.97570.9725
Yunnan0.36600.49920.47560.42080.54120.50780.86980.92240.9366
Tibet1.00001.00001.00001.00001.00001.00001.00001.00001.0000
Shaanxi0.37920.70421.00000.40710.74521.00000.93150.94501.0000
Gansu0.26100.31740.31570.26120.31970.32050.99920.99280.9850
Qinghai0.61151.00001.00000.99871.00001.00000.61231.00001.0000
Ningxia0.20880.29530.29460.22210.36030.34190.94010.81960.8617
Xinjiang0.50810.42060.43181.00000.44920.49140.50810.93630.8787
Table 2. Classification of agricultural efficiency grade in China.
Low LevelMedium LevelMedium-High LevelHigh LevelDEA Efficient
Agricultural Efficiency(0, 0.4](0.4, 0.6](0.6, 0.8](0.8, 1]1

