1. Introduction
Market fluctuations are noticeably observed in modern conditions of uncertainty, disbalance and disproportions between the expected and actual state of the market. A reaction of enterprises on these processes is manifested by the adaptation to such conditions, an active search for new instruments and methods, which allow a company to ensure steady development, to confine the competitive positions and to reduce exogenous and endogenous risks appearing during the economic activity of market entities. One of such instruments providing the steady development of an enterprise consists of diversification, which is directed toward expanding the domain of company operation. Diversification of sales activity is a process of extended use of innovative tools, mechanisms, methods and models for achieving marketing goals and determining optimal sales channels and the optimal distribution of products in each sales channel. Diversification provides an instrument for varying the enterprise operation and constructive optimal decision-making to improve enterprise conditions.
Today, more and more companies choose multichannel distribution systems; the use of such systems has increased greatly in recent years [
1]. It was emphasized in [
2] that the increasing complexity of the competitive environment requires new approaches to stating company strategy and tactics. Enterprises diversify their sales activities to vary the use of distribution channels and to reduce a risk of profit deficiency caused by exploiting only a few sales channels or by cooperation with undisciplined intermediaries.
In this paper, we present three models of sales activity diversification of a company.
Section 2 includes a review of existing approaches to the selection of sales channels, the conceptual discussion and presentation of models. The potential of sales channels and the peculiarities of their use are discussed in
Section 3. The second approach to the optimal quantitative distribution of production between distribution channels based on profit maximization is considered in
Section 4. The third model of the optimal distribution of production between distribution channels based on risk minimization is described in
Section 5. The proposed models are tested and compared to actual data of the company; a comparison of predicted income is presented in
Section 6. The advantages and peculiarities of each model are discussed in
Section 7. Conclusions are reported in
Section 8.
2. Theoretical Framework
The problem of the optimal selection of sales channels has attracted considerable interest of many researchers. Coughlan
et al. [
3] discussed the structure, function, framework, development, maintenance and management of distribution channels to attain significant competitive advantages. Developing relationships between sales channels and control mechanisms in such channels was reviewed in [
4,
5]. Nevin [
5] emphasized that to be effective in designing channels, marketing managers need to understand the alternative mechanisms for controlling the individual channel members. Different kinds of consumers and their behavior on a market to provide the effective selling distribution were analyzed in [
6,
7]. Various aspects of sales channels choice by consumers have also been studied in [
8,
9,
10]. Sutton and Klein [
11] considered the optimization of marketing instruments to drive profitable sales channels of an enterprise. They underlined the need of optimizing the performance of each marketing channel (which channels perform better than others?) and of identifying risks and critical success factors to hit performance targets. Ingene and Parry [
12] analyzed channel performance, channel strategy and mathematical models of sales channels. Evaluating channel choice, Magrath and Hardy [
13] considered three groups of criteria: efficiency (cost, capacity), effectiveness (coverage, control, competence) and adaptability (flexibility, vitality). Criteria characterizing producers, markets, purchasing peculiarities, goods, intermediaries, customers, behavior of sales channels participants,
etc., were examined in [
14,
15,
16,
17,
18]. Kotler [
19] described economical, control and adaptive criteria of channels’ evaluation. Criteria for selecting and evaluating intermediaries in indirect sales channels were discussed in [
19,
20,
21]. Rolnicki [
22] provides a comprehensive list of channel member selection criteria, including reputation, business and managerial stability, financial strength, type of market coverage, sales competency,
etc. Various aspects of the sustainability of distribution channels were discussed by Dent [
23]. Different profit-maximization models for distribution channels were proposed in [
24]. Several examples of using the linear programming methods in management were presented by Anderson
et al. [
25]. A game-theoretical approach to modeling distribution channels was used in [
26,
27].
At the present time, the problem of selecting the best sales channels and arranging the movement of goods in them is still investigated incompletely, especially taking into account the specificity of Ukrainian economic relations. This determines the need of system research ensuring the steady development of sales activity of enterprises based on diversification principles. Choosing optimal sales channels, enterprises have to deal with a set of questions and problems. To solve these problems, the authors have proposed three approaches to the diversification of sales activity of a company. The presented complex of criteria has been formulated by the authors based on the large amount of literature on this topic, taking into account the practice of sales activity in Ukraine and previous authors’ investigations. Three models considered in the paper present a new solution of a problem of sales channels’ selection using the present-day mathematical technique. The mathematical tools are known in the literature, but the authors have implemented and adapted these models to existing conditions of enterprise functioning and development taking into account special features of proposed qualitative and quantitative characteristic criteria for comparing direct and indirect sales channels.
The choice of a model depends on the production type, the product life cycle stage, the goals of an enterprise (maximal profit or minimal risk) and other parameters. The model of determining the sales channel potential assumes comparing the sales channels based on qualitative and quantitative characteristic criteria, which reflect the peculiarities of cooperation between a company and intermediaries or take into account the sales results of individual direct sales channels. The second model of the optimal quantitative distribution of production between sales channels is based on profit maximization. This approach not only takes into account the evaluation of the prescribed parameters of sales channels, but also provides the high profitability of each assortment item and of the whole enterprise. The third model of the optimal distribution of production between sales channels accounts for the experience of collaboration between the enterprise and sales channels during the past period and ensures the minimal risk and appropriate profitability for each sales channel.
3. The Model of Determining the Sales Channel Potential
Based on the research mentioned above, the practice of economic entities and our own study [
16], the qualitative-quantitative criteria were elaborated for evaluating and comparing the direct and indirect sales channels. The importance of elaborating such criteria was also emphasized by Magrath and Hardy [
13]: “Products or services must be graded, assembled, bundled, converted, augmented, promoted, displayed, sold, warranted, repaired, transported, and so on. Any channel of distribution can be compared in terms of its inherent ability to fulfill such functions”.
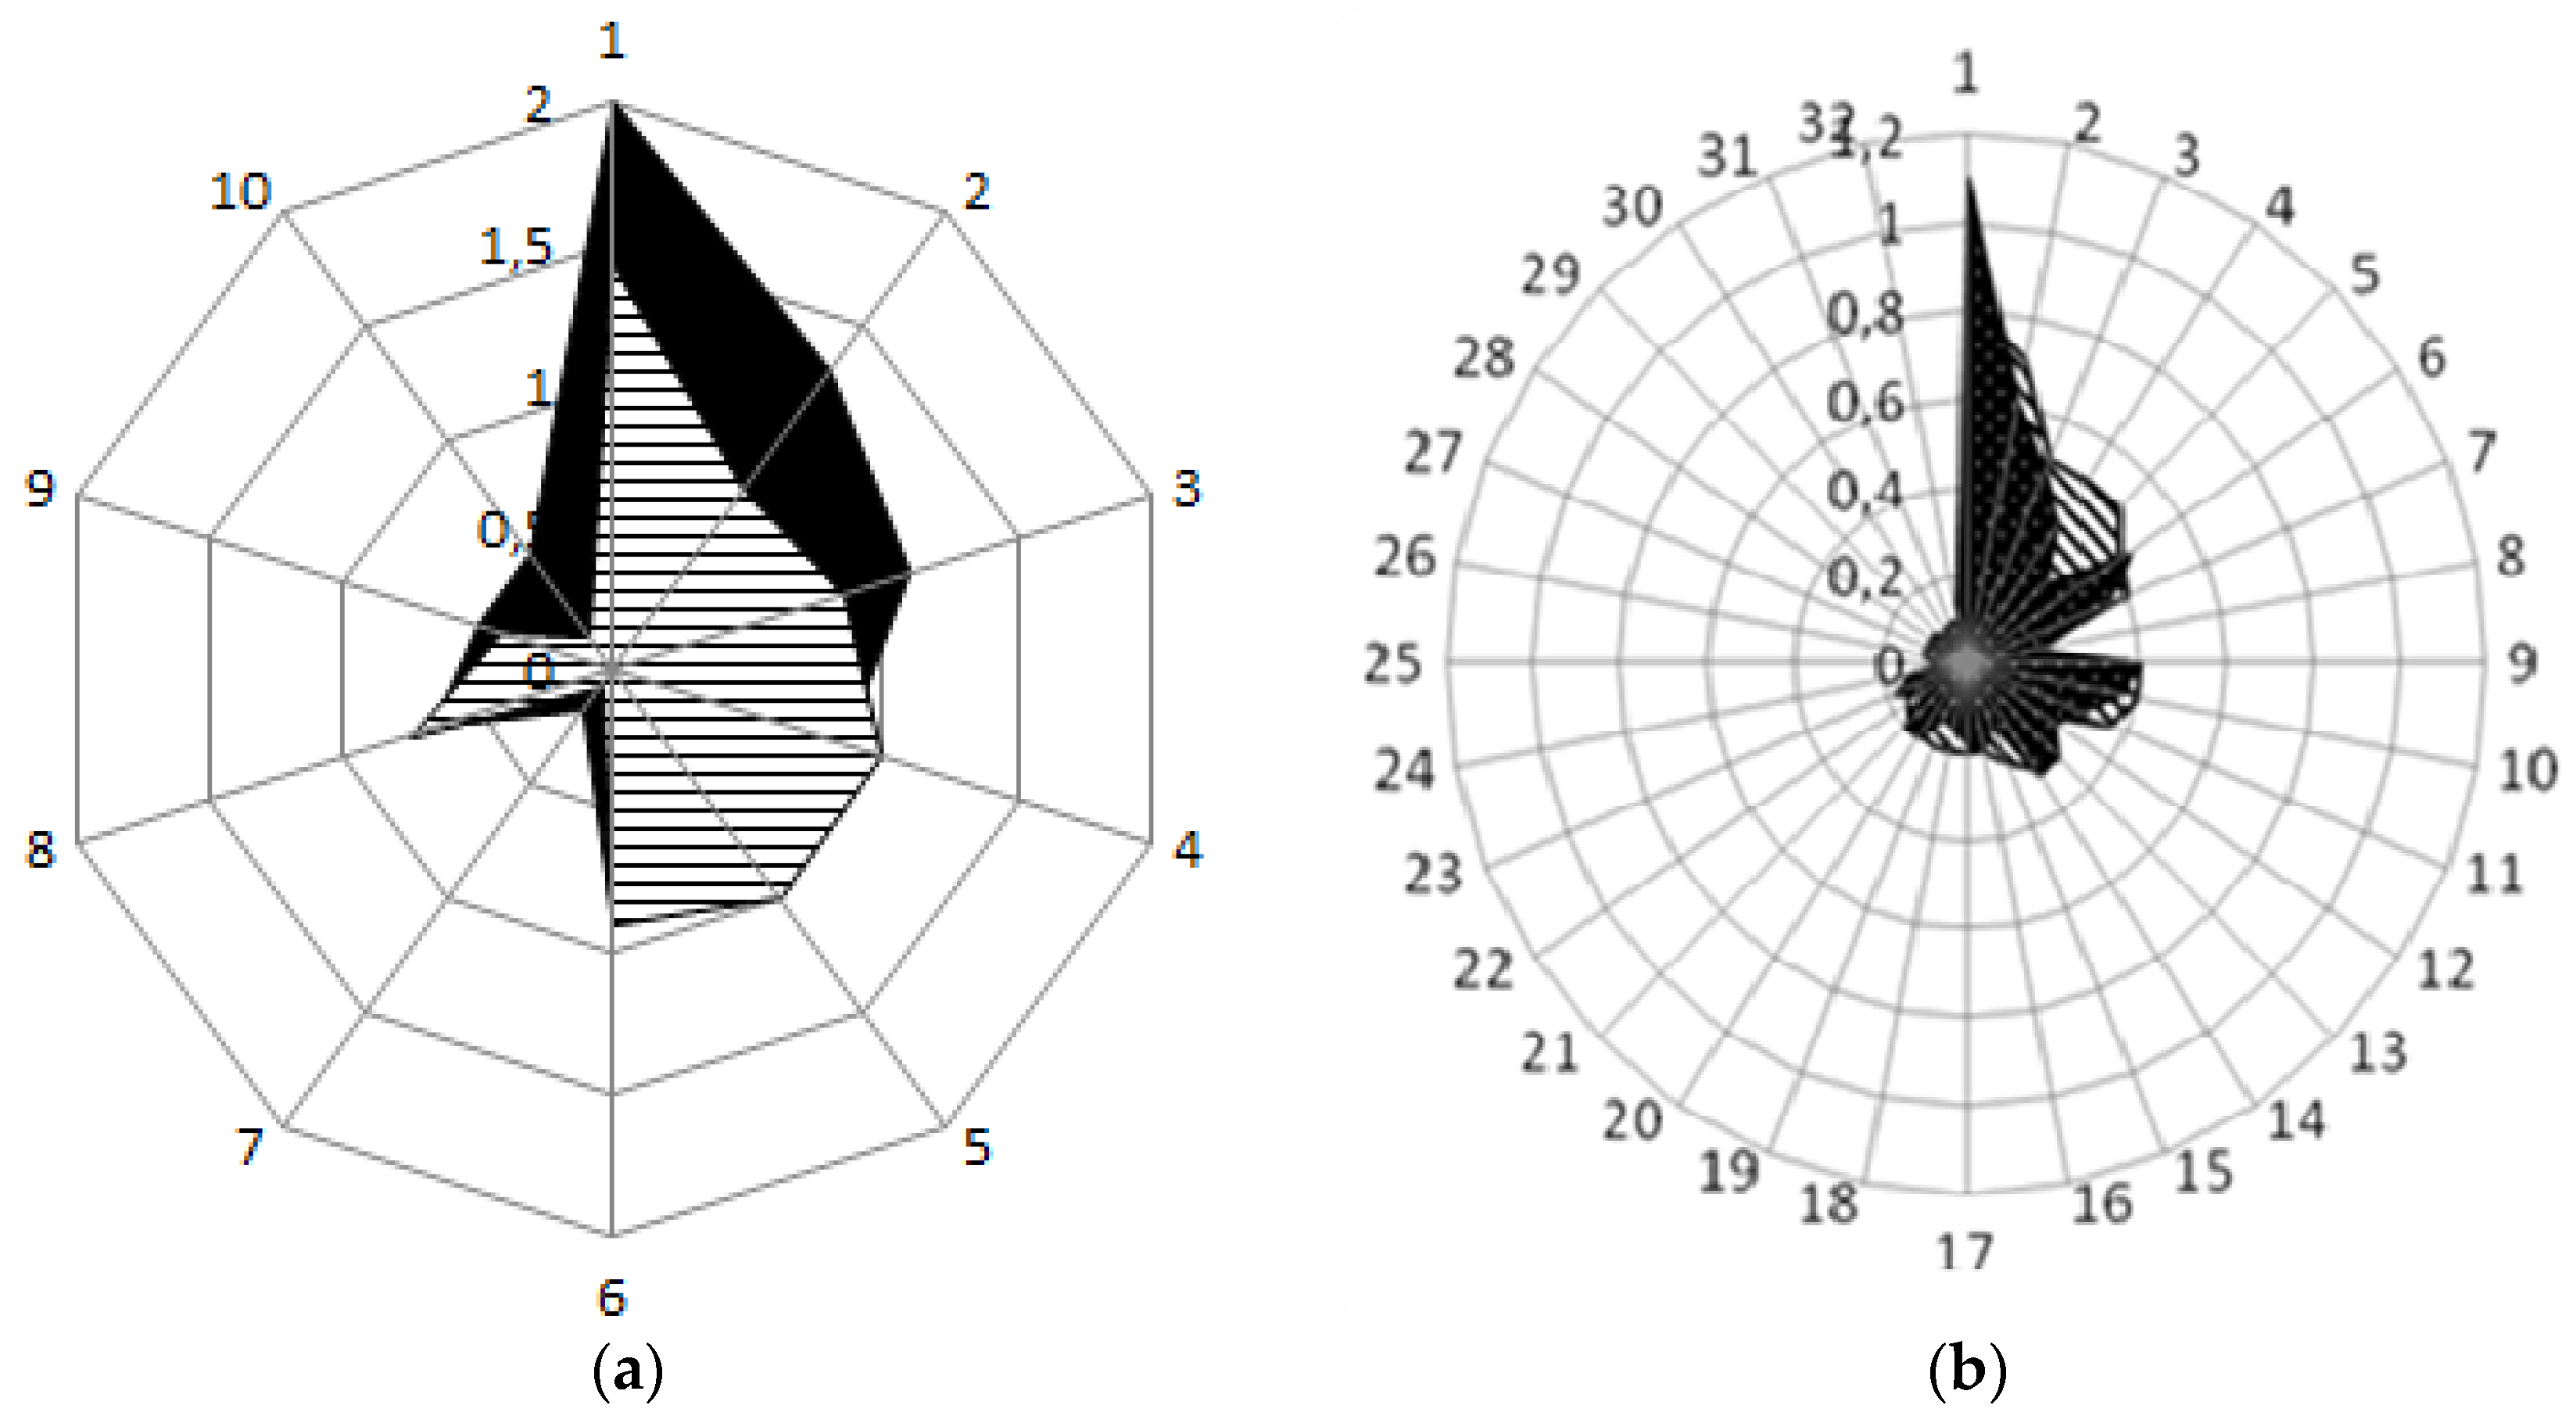
As an example, Svitovyr, LLC (Lviv, Ukraine), was considered. The characteristic criteria of comparing direct sales channels are presented in
Table 1. We also give recommendations for their calculation. The obtained criteria will be used to compare the direct channels’ potentials using the improved radar method (see
Figure 1a).
Recommendations for the calculation of the qualitative and quantitative characteristic criteria for direct channels:
- (1)
The channel having the largest total production turnover gets 10 points; the points of other channels are calculated proportionally to the leading channel.
- (2)
The channel having the largest increase of sales volume gets 10 points; the points of other channels are calculated proportionally to the leading channel.
- (3)
The direct channel having the maximum value of the ratio gets 10 points; the points of other channels are calculated proportionally to the leading channel.
- (4)
Independent experts interview top-management representatives of direct sales channels forming the expert opinion according to a 10-point grading scale.
- (5)
The direct channel having the lowest markup rate gets 10 points. Points for other channels are calculated subtracting 0.5 points for every additional 5% of markup rate.
- (6)
The direct channel having the shortest period of goods delivery from the producer to a consumer gets 10 points. Points for other channels are calculated subtracting 0.5 points for every additional day.
- (7)
A secret shopper evaluates sales personnel according to the 10-point grading scale.
- (8)
.
- (9)
The leading direct channel gets 10 points; the points of other channels are calculated proportionally to the leading channel.
- (10)
.
The qualitative and quantitative characteristic criteria of comparing indirect sales channels of Svitovyr, LLC (Lviv, Ukraine), are presented in
Table 2. We briefly characterize these criteria and give recommendations for their calculation. It should be emphasized that the number of qualitative and quantitative characteristic criteria for indirect distribution channels should be substantially larger than that for direct channels, as the manufacturer has less possibilities of control and influence on the intermediary behavior. The obtained criteria will be used to compare the indirect channels’ potentials using the improved radar method (see
Figure 1b).
Recommendations for the calculation of qualitative and quantitative characteristic criteria for indirect channels:
- (1)
The intermediary having the largest year turnover of the producer production gets 10 points; the points of other indirect sales channels are calculated proportionally to the leading channel.
- (2)
Data from the last two years are compared. The intermediary having the largest sales increase gets 10 points; the points of other indirect sales channels are calculated proportionally to the leading channel.
- (3)
The intermediary having the least credit debt gets 10 points. For each additional 1000 UAH, 0.5 points are subtracted.
- (4)
The direct channel having the maximum value of the ratio gets 10 points; the points of other indirect sales channels are calculated proportionally to the leading channel.
- (5)
The intermediary having the largest increase in sales gets 10 points; the points of other sales channels are calculated proportionally to the leading channel.
- (6)
The intermediary having no debts during the last year gets 10 point. 0.5 points are subtracted for each debt month.
- (7)
Independent experts give the number of points according to a 10-point grading scale.
- (8)
.
- (9)
The indirect sales channel having the lowest markup rate gets 10 points. Points for other channels are calculated subtracting 0.5 points for every additional 5% of markup rate.
- (10)
The intermediary having the lowest discount gets 10 points; 0.5 point are subtracted for each additional percentage.
- (11)
Independent experts interview top-management representatives of an indirect sales channel forming the expert opinion according to a 10-point grading scale.
- (12)
Independent experts give the number of points according to a 10-point grading scale.
- (13)
The intermediary having the lowest freight charges gets 10 points; 0.5 point are subtracted for each additional 1000 UAH.
- (14)
The intermediary with the largest year turnover gets 10 points; the points of other indirect sales channels are calculated proportionally to the leading channel.
- (15)
A secret shopper evaluates sales personnel according to a 10-point grading scale.
- (16)
The intermediary having the largest frequency of promotions gets 10 points; the points of other sales channels are calculated proportionally to the leading channel.
- (17)
The intermediary having the least increase in sales of the analogical production of competitors gets 10 points. The points of other channels are calculated subtracting 0.5 points for each additional 5% increase.
- (18)
The duration of intermediary activity is compared; the leading indirect channel gets 10 points; the points of other indirect sales channels are calculated proportionally to the leading channel.
- (19)
The part of producer’s costs in joint promotions is compared to that of the intermediary. The channel in which the part of producer’s costs is the lowest gets 10 points; the points of other indirect sales channels are calculated proportionally to the leading channel.
- (20)
The intermediary having the shortest period of product delivery from the producer to a consumer gets 10 points. Points of other channels are calculated subtracting 0.5 points for each additional day.
- (21)
The indirect channel having the largest ratio gets 10 points; the points of other indirect sales channels are calculated proportionally to the leading channel.
- (22)
The Marketing Department and Sales Department give the number of points according to a 10-point scale.
- (23)
Independent experts give the number of points according to a 10-point grading scale.
- (24)
Independent experts give the number of points according to a 10-point grading scale.
- (25)
.
- (26)
The dates of the last investment in fixed assets are compared. The indirect channel with the last investment gets 10 points. The points of other channels are calculated by subtracting one point for each year earlier than the leading channel.
- (27)
The use of ecological modes of transport and the use of rendering plant facilities are estimated. The indirect channel having at least one of the abovementioned items gets 10 points.
- (28)
The indirect sales channel having no returns gets 10 points. The points for other channels are calculated subtracting one point for each return.
- (29)
Independent experts give the number of points according to a 10-point grading scale.
- (30)
.
- (31)
The dates of the last purchase are compared. The indirect channel with the latest purchase gets 10 points. The points of other channels are calculated subtracting 0.5 points for each month earlier than the leading channel.
- (32)
Volumes of the last purchase are compared. The indirect channel with the largest purchase volume gets 10 points; the points of other indirect sales channels are calculated proportionally to the leading channel.
On the basis of the described criteria, the direct and indirect channels’ potentials will be compared. The existing radar method [
28,
29], which does not account for the criterion weights, involves building a circle with a radius equal to 10 conventional units. Next, a graphical cyclogram is constructed at the radial axis at which the criteria values are marked. These marks are connected creating a polygon (the number of axes is equal to the number of criteria). The proposed improved radar method [
16] consists of building a circle with a radius equal to the maximum value of all of the criteria, sorting the criteria into groups according to the weight decrease and according to points adjusted by the weight coefficient. It should be mentioned that the recommended values of criteria weights reflect their significance and are set based on the experience of enterprise activity. At the radial axis of the graphical cyclogram, the criteria values corrected by their weights are marked. The area
of the obtained polygon is determined as follows:
where
n is the number of criteria,
is the value of the
i-th characteristic criterion and
denotes the weight coefficient of the
i-th criterion.
Comparison of sales channels is carried out using the generalized characteristic index
which is calculated as:
In this equation,
is the area of a circle with a radius equal to the maximal value of all of the weighted criteria (
). The greater is the value of
, the more profitable is the sales channel (see
Figure 1).
Based on graphical evaluation of the direct and indirect sales channels of Svitovyr, using the improved radar method, the correspondence between the actual and reference values of the characteristics of sales channels are presented in
Table 3.
The analysis of the obtained results for Svitovyr allows us to conclude that exhibition sales has the largest potential among the direct sales channels, as its level of correspondence between the actual and reference values of the characteristics is equal to 0.125. According to this model, specialized hypermarket has the largest potential among the indirect sales channels, as its level of correspondence between the actual and reference values of the characteristics is equal to 0.067.
The recommended percentage of production distribution between the direct sales channels calculated on the basis of generalized characteristic indices is the following: 55% for exhibition sales and 45% for internet sales; whereas the recommended percentage of production distribution between the indirect sales channels is the following: 67% for specialized hypermarket and 33% for distribution network.
Actual values of income per unit and actual sales volumes of three-phase and single-phase transformers for direct and indirect distribution channels of Svitovyr, LLC (Lviv, Ukraine), are presented in
Table 4.
The recommended sales volumes for the three-phase and single-phase transformers obtained on the basis of the considered model are shown in
Table 5.
The actual annual income of Svitovyr from sales of two types of transformers is 2,196,843 UAH; after redistribution of production between sales channels, it will be 2,313,626 UAH,
i.e., it will be larger by 116,783 UAH or by 5.32%. The advantage of such a redistribution for the three-phase transformer will be also discussed in
Section 6. It should be mentioned that the model of determining the sales channels’ potential does not assume the redistribution of the product from direct channels to indirect and
vice versa. The models discussed below allow such a redistribution.
4. The Model of the Optimal Distribution of Production between Sales Channels Based on Profit Maximization
The model of determining the sales channel potential described in the previous section can be used for further investigation of sales activity diversification of an enterprise. The results obtained for the generalized characteristic indices will be used to formulate the constraints in the linear optimization problem discussed in this section. The objective function of the optimal distribution of production between sales channels should guarantee the maximal profit:
where:
is the profit for the i-th assortment item using the j-th sales channel;
is the price of the production unit for the i-th assortment item with the use of the j-th sales channel;
denotes the discount for the intermediary when the j-th sales channel is used, %;
is the prime cost of the i-th assortment item;
are the costs of warranty repair and guarantee maintenance of the production unit guarantee for the i-th assortment item when the j-th sales channel is used;
stands for expected logistics costs per i-th output unit with the use of the j-th sales channel;
are the administrative costs for the i-th assortment item when the j-th sales channel is used;
denotes the stimulation costs of intermediary for the i-th assortment item in the j-th sales channel;
is the production volume of the i-th assortment item when the j-th sales channel is used;
- m
is the number of assortment items;
- n
is the number of sales channels.
Now, we formulate a system of constraints of the linear optimization problem:
(1). In the proposed optimization model, the planned output volume of every assortment item is equal to or less than the initial output one
as its increase leads to the corresponding cost increase. Hence:
(2). Expert interview of sales channels managers of Svitovyr has shown that the channels will continue the collaboration with this enterprise under conservation of at least 25% of actual sales volume. Such a constraint is written as:
where
is the actual sales of the
i-th assortment item in the
j-th sales channel.
(3). To take into account the potential of each direct and indirect sales channel, we use the results of their evaluation obtained in
Section 2 by the improved radar method, which allows us to calculate the profitability of each channel. Mathematically, this constraint has the following form:
where
is the ratio of the generalized characteristic index
of the direct sales channel (see Equations (2) and (7));
is the number of direct channels.
Similarly, for indirect sales channels, we have:
where
is the ratio of the generalized characteristic index
.
(4). The standard constraint of the optimization problems of such a type is the requirement of the non-negativity of sales volumes:
Actual data necessary for formulating and solving the corresponding optimization problem for direct and indirect sales channels of Svitovyr can be found in
Table 4. Based on these data, the objective function is stated as:
The constraints are the following:
The solution of the optimization problem Equations (11) and (12) ensuring profit maximization was obtained using the simplex method realized by the computer program [
30]. The solution results are presented in
Table 6.
The actual annual income of Svitovyr from two analyzed types of transformers is 2,196,843 UAH; after optimization, it will be 2,358,439 UAH. The proposed redistribution of production between the sales channels allows the enterprise to raise the annual income by 161,596 UAH, i.e., by 7.35%.
5. The Model of the Optimal Distribution of Production between Sales Channels Based on Risk Minimization
The model considered in the previous section takes into account only the last annual income, but it is worthwhile to account for annual incomes for several previous years, as the experience of preceding years may be essential for decision-making. Every enterprise tends to maximize its income, but there appears the admissible risk that the company owner is ready to incur. According to [
31,
32], risk is incorporated into different types of decision models, and there are different types of risk management strategies: risk sharing, risk pooling and risk diversification. Some enterprises are of the opinion that it is better to restrict slightly their income to a certain level, but to minimize their risks (“safety first” objectives [
31,
32]).
In this section, we investigate the diversification of marketing activity from the viewpoint of minimal risk and formulate the new model of the optimal distribution of product between the sales channels based on risk minimization. Steady development of an enterprise is also possible under the use of such a strategy. The solution of the formulated problem can be obtained by adapting Markowitz’s portfolio theory [
33,
34] to risk estimation under conditions of using the specified sales channels. This approach allows us not only to compare the sales channels from the viewpoint of their profitability, but also to investigate their risk level.
To illuminate the proposed approach, we present the information of Svitovyr about the profitability of three-phase transformer (
Table 7) and single-phase transformer (
Table 8) in direct (exhibition sales, internet sales) and indirect (specialized hypermarket, distribution network) sales channels during 2010–2014.
The use of Markowitz’s portfolio theory for the investigation of the optimal integration of sales channels based on risk minimization is motivated by its origin approach to the mathematical formulation of the relation between profitability and risk.
The general stages of implementation of the optimal production distribution between sales channels based on risk minimization are the following:
- (1)
Gathering data about profitability of the selected assortment item in the i-th sales channel within the span of some period.
- (2)
Determining the mean value of profitability of every sales channel.
- (3)
Calculating the covariance between profitability of sales channels:
where
N is the number of periods (years).
- (4)
Arranging a symmetric covariance matrix of the profitability of sales channels:
where
.
- (5)
Finding the inverse matrix A(cov)−1.
- (6)
Calculating the mean squared deviation based on the percentage relation between the sales channels. The essence of the considered model of the optimal production distribution between the sales channels consists of risk minimization. If
denotes the part of the production distributed using the
i-th sales channel, then the mean squared deviation, which reflects the risk level of the sales channel, is written as:
where
X is the vector with components
;
XT is the transpose of the vector
X;
denotes the matrix inverse to the covariance matrix.
The problem formulation, including the objective function and constraints according to the Markowitz model [
35]:
- (7)
Solving the optimization problem (finding the optimal production distribution between sales channels that ensures minimal risk).
We will illustrate the described approach by the study of the profitability of sales channels for Svitovyr. The necessary input data for the formulation of the optimization problem are presented in
Table 9 for the three-phase transformer.
The covariance matrix takes the form:
The inverse matrix is calculated as:
The objective function of the optimization problems is written as:
The constraints are the following:
The convexity property of a quadratic form ensures that any local minimum must be a global minimum. A quadratic optimization problem is convex if and only if the inverse covariance matrix in the objective function is positively defined,
i.e., its eigenvalues are positive. In our case, the characteristic polynomial of the inverse covariance matrix:
has the following roots:
Hence, the objective function is positively defined.
The problem is solved using the Lagrange multipliers: to find the minimum of the function:
The conditions of existence of an extremum read:
From system Equation (26), we obtain:
Inserting these values of
in the constraint Equation (21), we get that
hence, the optimal production distribution (for the three-phase transformer) between the sales channels of Svitovyr will be the following:
i.e., 33% for Exhibition sales, 21% for internet sales, 24% for specialized hypermarket and 22% for distribution network. Based on data presented in
Table 7, a similar optimization problem can be also solved for the single-phase transformer.
6. Comparison of Predicted Income
Analyzing three models of the diversification of sales activity shows that every model gives the possibility to optimize the product distribution between sales channels. The owner or top-managers, which have the right of decision-making, decide about the global strategy of enterprise development taking into account the peculiarities of the competitive position, the market environment situation,
etc. Table 10 shows the prediction results for sales of the three-phase transformer on the bases of the three discussed models of distribution channels’ diversification.
As can be seen from the presented calculations, all three models predict the excess of the total income in comparison with the actual income (by the example of the three-phase transformer); this testifies that every model can be used. The largest total income is predicted by the model based on profit maximization, whereas the model based on risk minimization predicts the least total income (though larger than the actual one). The model of determining sales channels potential predicts that the product redistribution between sales channels allows the firm to increase the annual income by 67,834 UAH or by 5.39%. According to the model based on profit maximization, the annual income will increase by 119,400 UAH or by 9.48%. The model of optimal production distribution between sales channels based on risk minimization forecasts the increase of annual income by 63,012 UAH or by 5%.
7. Verification and Comparison of Models
The model of determining the sales channel potential is a general-purpose tool for all kinds and types of enterprises (large, medium, small). This model is simple in use, reveals the sales channel potential, covers a wide spectrum of estimated parameters and takes into account the weight of each parameter. The use of the model lays down no special technical requirements. The processing of results is conducted by simple analytical methods using graphical tools (Excel environment or some analogue). The considered model includes qualitative and quantitative characteristic criteria. We have proposed the quantitative measurement of qualitative criteria using expert estimation. Such an estimation assumes that independent experts synthesize information by quantitative evaluation of a criterion that characterizes the compared sales channels. For example, a level of service and a level of production presentation by sales personnel is evaluated by a secret shopper according to the 10-point grading scale. Similarly, the competence and professionalism of management personnel is estimated on the basis of the interview of top-management representatives according to a 10-point grading scale. For Svitovyr, LLC (Lviv, Ukraine), such an estimation was carried out in 2014. The shortcoming of this model consists of the possibility of giving rise to inadequate or “warped” information; the more so as the data volume required for getting relevant data in each sales channel is sufficiently large. To ensure a well-grounded and balanced management decision, such studies should be conducted systematically, in the dynamics, immediately determining undesirable changes in sales channels.
The model of the optimal distribution of production between sales channels based on profit maximization ensures the maximal profit of an enterprise by choosing the most profitable sales channel. The advantages of this model are the following: the accuracy of the obtained results, a high level of their processing, the possibility of formulating additional constraints according to the needs and interests of a company, the possibility of comparing current and potential sales channels, the possibility of changing undisciplined intermediaries and redistributing production into more profitable direct and indirect sales channels. The shortcomings of the considered model are connected with the need to have specialists in linear programming, the risk of sales channel “overestimation” and the failure to take account of dynamic conditions.
The model of the optimal distribution of production between sales channels based on risk minimization is helpful for enterprises of those countries, the economy of which develops under indeterminate and chaotic conditions. This model can also be used when the product life cycle is at an initial stage and when an enterprise tries to enter into a new market where gathering information is complicated and there is high probability of product “aversion” by customers. The advantages of this model consist of the balance of risks and profits in the selection of the optimal sales channel and in elimination of the influence of subjective factors. The shortcomings of this model are connected with the threat of profit deficiency due to “underestimation” of the future sales channel potential and with the need of invoking experts-mathematicians to formulate a one-off optimization problem or the need for employing one’s own specialists in this field.
8. Conclusions
Steady development of an enterprise is ensured by harmonious, synchronous and complementary realization of all of the directions of company activity. Our paper is devoted to one of such directions: sales activity. Mathematical modeling provides the tools for the optimal choice of sales channels based on diversification. Three models of such a choice have been proposed: the model of determining sales channels’ potential, the model based on profit maximization and the model of the optimal production distribution between sales channels based on risk minimization. The first model allows us to throw light on the potential of sales channel, to show the peculiarities of its use and to introduce the qualitative and quantitative characteristic criteria for comparing direct and indirect sales channels.
To ensure steady development of a company, it is necessary not only to determine the key parameters of sales channels, but also to provide high profitability of every assortment item, as well as high profitability of the whole enterprise. The second model solves this problem as a problem of linear optimization. At the same time, the second model takes into account only current profitability and does not consider the comparison with the previous periods. This aspect is investigated by the third model based on accounting for the experience of the previous periods and risk minimization. The use of every model forecasts larger income than that brought by the current product distribution. The proposed models can be used by individual enterprises, as well as by consulting companies that offer facility for analysis and optimization of sales activity.


 , internet sales;
  , exhibition sales; nomenclature for Figure 1b:
  , specialized hypermarket;
  , distribution network.

