Article

What’s the Score? Walkable Environments and Subsidized Households

1
Department of Architecture and Landscape Architecture, North Dakota State University, 711 2nd Avenue North, Office #308, Fargo, ND 58102, USA
2
Department of Landscape Architecture and Urban Planning, Texas A&M University, A340 Langford Architecture Center, 3137 TAMU, College Station, TX 77843, USA
*
Author to whom correspondence should be addressed.
Sustainability 2016, 8(4), 396; https://doi.org/10.3390/su8040396
Submission received: 5 March 2016 / Revised: 18 April 2016 / Accepted: 19 April 2016 / Published: 21 April 2016

Abstract

:
Neighborhood walkability can influence individual health, social interactions, and environmental quality, but the relationships between subsidized households and their walkable environment have not been sufficiently examined in previous empirical studies. Focusing on two types of subsidized housing developments (Low-Income Housing Tax Credit (LIHTC) and Public Housing (PH)) in Austin, Texas, this study evaluates the neighborhood walkability of place-based subsidized households, utilizing objectively measured Walk Score and walking-related built environment data. We also used U.S. Census block group data to account for the socio-demographic covariates. Based on various data, we employed bivariate and multivariate analyses to specify the relationships between subsidized households and their neighborhood walkable environment. The results of our bivariate analyses show that LIHTC households tend to be located in car-dependent neighborhoods and have more undesirable walking-related built environment conditions compared with non-LIHTC neighborhoods. Our regression results also represent that LIHTC households are more likely to be exposed to neighborhoods with low Walk Score, less sidewalk coverage, and more highways and major roads, while there are no significant associations for PH households. These findings imply that more attention and effort toward reducing the inequitable distributions of walkable neighborhood features supporting rather than hindering healthy lifestyles must be provided to subsidized households.

1. Introduction

During the 2000s, the movement toward walkable neighborhoods was formed by planners and researchers in order to achieve sustainability goals [1]. This movement has gathered momentum as the issues of neighborhood walkability have become linked to those of economic, environmental, and public health benefits [2]. Walkable neighborhoods produce economic, environmental, and neighborhood advantages including increase in property values, decrease in traffic-related air pollution, and strengthened social integration in neighborhoods [3,4,5,6]. Beyond the creation of socioeconomic benefits, several public health studies have reported that neighborhood walkability offers various public health benefits, especially the prevention or control of many chronic diseases as well as the reduction of healthcare costs. These health benefits are attributed to the fact that walking is usually the most easily undertaken form of physical activity [7,8]. Most of all, there is consensus among researchers that walkable neighborhoods are particularly significant for disadvantaged populations because minorities and low-income groups tend to be vulnerable to inactivity-related diseases [9,10,11].
To provide affordable housing, decent homes, and suitable living environments for socioeconomically disadvantaged populations, the U.S. government has implemented subsidized housing programs [12]. Under the objectives of these programs, policy makers and city planners in the U.S. have focused on promoting suitable built and socioeconomic environments for subsidized households beyond simply providing the necessary quantity of housing stock [13]. Although various place-based subsidized housing programs have achieved some success in ensuring enough affordable housing and decent homes [14], the development efforts of those programs have tended to be concentrated in socioeconomically distressed neighborhoods where access to various socioeconomic opportunities are limited [12,13,14,15]. This induced doubt about the efficiency of subsidized housing programs, especially in terms of the locational patterns of subsidized households. Furthermore, questions also remain concerning how successful subsidized housing programs are at supporting walkable environments for disadvantaged households.
The neighborhoods where people live affect their socioeconomic and health opportunities for improved life outcomes [16,17,18]. Given the significance of the neighborhood environment, placing affordable housing in neighborhoods where people can take advantage of socioeconomic, environmental, and health benefits is important. Previous studies regarding the quality of life among residents have found that disadvantaged neighborhoods are more likely to be characterized by poor educational and job opportunities, inactive lifestyles, and high exposure to crime, while privileged neighborhoods tend to have the opposite characteristics [5,15]. Several studies examining the relationships between the spatial location of subsidized households and the socioeconomic characteristics showed that subsidized housing developments are clustered in neighborhoods facing multiple disadvantages including higher minority populations, poverty, unemployment, teenage school dropouts, crime rates, and relatively lower incomes [12,14,15,19,20,21]. In terms of the associations between natural environments and the spatial location of subsidized households, a recent study conducted by Kim and Woo (2015) reported that Low-Income Housing Tax Credit (LIHTC) households are more likely to be located in unhealthy natural environmental conditions, such as a lack of green vegetation and steep slopes, that may hinder opportunities for healthy lifestyles and improved life outcomes [22]. However, we have a limited understanding about whether subsidized housing programs help the least advantaged populations experience the benefits of neighborhood walkability. Considering the various benefits of walkable neighborhoods, there are surprisingly few studies looking at the associations between subsidized households and walkable neighborhoods. If there are clear discrepancies between the spatial location of place-based subsidized households and walkable neighborhoods, it might cast doubt on the validity of subsidized housing programs, especially in terms of providing suitable living environments to support public health benefits for subsidized households.
Using spatial analytic techniques and identifying Street Smart Walk Scores for neighborhoods in Austin, Texas, we attempt to answer the following research questions: (1) whether LIHTC neighborhoods have better walking-related built environmental characteristics than non-LIHTC neighborhoods have; (2) whether LIHTC households are more likely to be located in walkable neighborhoods; and (3) how the results to research questions (1) and (2) are different when applied to public housing (PH) neighborhoods than when based on LIHTC neighborhoods. We utilize a spatial analytic approach using geographic information system (GIS) techniques to measure walking-related built environmental characteristics within block groups. Such characteristics include sidewalk and bike lane coverages, highways, and major roads. We also generate Street Smart Scores for each block group by averaging Walk Score values for thousands of geocoded streets within a block group. This study uses U.S. Census block group data for the socio-demographic variables that are used as the confounding factors in multivariate analyses. By analyzing the spatial patterns of walking-related built environmental characteristics and Street Smart Walk Scores at the block group level, we examine whether both LIHTC and PH households are located in walkable environments.

2. Literature Review

2.1. Spatial Location of Placed-Based Subsidized Households in the US

Traditional U.S. PH programs were the major supplier of low-income housing between the late 1930s and the mid-1980s, providing over one million affordable housing units [18,23,24]. However, support for PH projects eroded after the 1980s when planners and policymakers began to consider whether the implementation of the program built, owned, and managed by the public sector may be best left behind the private sector [23]. PH projects have been criticized because these developments may accelerate poverty concentration by providing increasing quantities of affordable housing units in disadvantaged neighborhoods where PH units are already located [22,23,25,26]. For instance, Newman and Schnare (1997) empirically examined the relationships between various types of subsidized housing in the 1990s and their spatial characteristics and location [12]. They found that public housing units, compared to other subsidized housing units (e.g., LIHTC, certificated and voucher, state rental assistance programs, etc.), are disproportionately located in neighborhoods where incomes are low and unemployment and poverty rates are high.
In response to the locational concerns of PH projects, the LIHTC program was established by the Tax Reform Act in 1986. Since its establishment, LIHTC developments has overtaken PH developments to become the largest subsidized housing tool in the U.S. [22,27]. Although the LIHTC program is one of the Federal housing assistance programs, the characteristics of the program are different from other traditional PH programs. While PH housing units are developed, constructed, and managed by the public sector, LIHTC housing units are provided based on a partnership between the government and housing developers to create a channel of private investment in providing affordable housing units [28]. For this reason, it has been deemed a more effective tool to create higher quality housing units and to pursue the mixing of incomes in neighborhoods. Furthermore, LIHTC developments have been encouraged to achieve income diversity among residents by focusing on both moderate- and low-income families, while other place-based subsidized housing developments tend to serve primarily low-income families.
However, there has been a growing concern about the spatial location of LIHTC households, especially the question of whether LIHTC developments can provide suitable living environments for subsidized households. Planners’ concern regarding the locational issues of LIHTC as well as other place-based subsidized housing may be based on two theoretical perspectives: the political economy of race perspective and the urban ecology perspective. The political economy of race perspective suggests that racism and the choices made by local elites are the key factors in determining the location of subsidized housing [29]. Specifically, neighborhoods that house the politically weakest groups in society—particularly, distressed neighborhoods with higher minority populations—tend to have subsidized housing developments because such housing units are often deemed undesirable additions to privileged neighborhoods [25]. Furthermore, the urban ecology perspective suggests that neighborhoods close to the central business district (CBD) are often undesirable residential areas and that desirability increases as one moves from these areas to the urban periphery [29,30]. Because wealthier residents and various businesses move to the urban periphery, many properties in urban neighborhoods decrease in value and are sometimes abandoned; hence, such central city neighborhoods with cheap vacant land are attractive for subsidized housing developments [25].
Additionally, researchers have used a growing body of empirical evidence to quantify the relationships between the location of subsidized households and various socioeconomic environments in neighborhoods. Freeman [14] investigated the associations between the spatial location of LIHTC households and neighborhood socio-demographic characteristics in 100 metropolitan regions in the U.S. Based on the descriptive statistics, he found that LIHTC households tend to be sited in distressed neighborhoods with higher African-American and poverty rates as well as lower median incomes and median housing values. Most recently, Woo and Kim [18] also estimated the relationships between the location of place-based subsidized households and various neighborhood socioeconomic characteristics in Austin, Texas. By employing the location quotient and multivariate analysis, they found that both PH and LIHTC households are more likely to be located in disadvantaged neighborhoods; these neighborhoods tend to have high minority populations, poverty, unemployment, female-headed family, government aid in the form of welfare, and low incomes. They also found that the spatial location of LIHTC households is significantly related to concentrated crime incidents in neighborhoods. As a supplement to these studies, many other previous studies empirically and theoretically proved that place-based subsidized households are sited in socioeconomically disadvantaged neighborhoods [31,32,33,34].
In focusing their research on the socioeconomic conditions of neighborhoods in which place-based subsidized households are located, planners and researchers have overlooked the significance of walkable neighborhood amenities for subsidized households. Given that disadvantaged populations tend to be vulnerable to inactivity-related diseases [9,10,11], walkable conditions in neighborhoods may play a key role in promoting individual health as well as neighborhood sustainability. Beyond specifying socioeconomic conditions in neighborhoods where subsidized households are located, our study will address the gap in research into neighborhood walkability by estimating the associations between place-based subsidized households (i.e., PH and LIHTC households) and their walkable environments in neighborhoods.

2.2. Walkable Neighborhood Amenities

A growing number of studies regarding neighborhood walkability have addressed the valuable and varied benefits associated with walkable neighborhoods, including individual health, social interaction or cohesiveness, and environmental health. This section describes several health, social, and environmental implications of walkable communities and also emphasizes why living in such neighborhoods is especially important for socioeconomically disadvantaged populations. In addition, we address how the geography of walkability lines up with issues relating to gentrification and inner city neighborhoods characterized by a predominately young adult population.
Walking or bicycling are important and common forms of daily physical activity. Those activities can be facilitated in a controlled place like a gym or a fitness center that involves expenses such as fees, travel costs, etc., but they are also readily accessible and free in neighborhood streets [35]. Neighborhood characteristics that encourage people to engage in outdoor walking activities include walkability features like great street connectivity, close proximity of destinations, high residential density, mixed land use, etc. [36]. Previous studies have found that the physical attributes of walkable neighborhoods are consistently associated with transport-related walking, recreational walking [36,37] and physical activity [38,39]. In a recent study utilizing pre- and post-move retrospective surveys of 449 residents living in Austin, TX, USA, the changes in their physical activities were examined by comparison t-tests [40]. The findings from their study showed that total physical activity and outdoor walking in particular increased significantly after they moved to a walkable community, while traveling by private automobile decreased dramatically. A study conducted with 1200 adults living in Belgium also examined the association between neighborhood walkability and physical activity [37]. The results from their study indicated that living in a highly walkable neighborhood was associated with more walking and bicycling for transportation and with walking for recreation or exercise. Furthermore, several studies have demonstrated the negative impacts of living in less walkable neighborhoods on adults’ health-related outcomes, such as body mass index (BMI) [39,41,42,43,44]. A study utilizing 1228 adults’ survey data and neighborhood walkability index data measured within a 1-kilometer network buffer around their home evaluated the association between neighborhood walkability and BMI. Their study found that adults’ BMI decreased by 0.23 points if the neighborhood walkability index increased by 5% [45]. Moreover, one study utilizing objective measures of suburban sprawl (which has the opposite characteristics of walkable neighborhoods) showed that sprawl significantly contributed to the prevalence of chronic diseases in adults [46].
The features of walkable neighborhoods are also associated with social interactions or sense of community among residents [47,48,49]. In a study examining the effects of neighborhood design on sense of community, two different neighborhoods, one a traditional neighborhood with walkable neighborhood features and the other a modern suburban neighborhood in Portland, Oregon, were compared [47]. This study revealed that residents living in the traditional or walkable neighborhood had a higher sense of community than those of the modern suburban neighborhood. Similar findings from a study based on a sample of 279 Irish adults found that residents living in walkable neighborhoods were more likely to know their neighbors, trust others, and be socially engaged compared with those living in car-oriented suburbs [49]. In addition to previous studies that are mostly cross-sectional, a few longitudinal studies also showed the substantial effects of walkable neighborhoods on social capital [50,51,52,53]. For example, a U.S. longitudinal study examined the impact of moving to a walkable neighborhood, Mueller, Austin, TX, on residents’ social interactions and cohesion [54]. Findings from the study showed that residents reported a higher level of social interactions and emotional ties after moving to Mueller due to the changes in community environments that facilitate more opportunities to meet their neighbors and socialize with them.
In addition to the positive effects of walkable neighborhoods on individual health and social interactions, several studies have linked the characteristics of walkable neighborhoods to environmental benefits associated with air quality. The shorter distance between destinations resulting from the land use mix of walkable neighborhoods is associated with a decrease in vehicle miles traveled [55,56,57]. The fewer vehicle miles traveled in turn helps improve environmental health by reducing emissions of oxides of nitrogen (NOx) and volatile organic compounds (VOC) [58]. Several cross-sectional studies also showed the significant relationships between the vehicle emissions and the features of walkable neighborhoods (greater street connectivity, residential density, and mixed land use) [58,59,60]. A U.S. study utilizing a walkability index generated by a composite measure of residential density, intersection density, land use mix, and retail floor area for each census block group found that 5% increase in neighborhood walkability led to 5.6% fewer grams of NOx emitted and 5.5% fewer grams of VOC emitted [45].
Numerous benefits of walkable neighborhood amenities may play a key role in attracting people to neighborhoods—particularly, inner city neighborhoods. In addition to the benefits mentioned above (individual health, social cohesion, and environmental conservation), people living in inner city areas with high walkability may take advantage of shorter travel time to work, greater access to public transit, and an abundance of retail destinations [61,62], as well as cultural amenities, urban lifestyle, and nightlife [63,64]. For these reasons, walkable neighborhood amenities and a vibrant inner city economy can lead to population increases within the inner city and thus contribute to gentrification. Furthermore, it can result in a concentration of young adults within the central areas of a city—a phenomenon referred to as youthification [64]. The presence of walkable and lifestyle amenities in inner city neighborhoods attracts young adults because of their growing urban lifestyle preferences. For instance, studies have shown decreases in driver’s licensure and increases in public transit use, walking, and cycling among young adults, which is cited as evidence of their growing urban lifestyle preferences [65]. Additionally, the economic reality encourages young adults to move into inner city neighborhoods because of the possibility of staying in smaller housing units at a lower total cost, compared to buying a single-family housing unit in suburbs. In the case of more desirable urban locations with higher rents, young people can trade off potentially higher housing costs for walkable and lifestyle amenities, as well as lower transportation costs [63,64,66]. In this context, a recent study conducted by Moos (2015) showed that gentrified areas are more likely to be occupied by young age residents. In this sense, the relationship between the location of walkable neighborhoods and different age groups needs to be thoroughly examined.
The numerous amenities of walkable neighborhoods, however, may not be available to socio-economically disadvantaged populations. Low-income people are generally less likely to engage in physical activity due to few physical activity resources in their neighborhoods [67,68] and therefore are more likely to have relatively deleterious health-related outcomes such as obesity, hypertension, and cardiovascular disease [9,69,70,71]. At the same time, low-income people may have low car ownership and thereby walking may be the dominant travel mode for them. In this sense, it is important to provide low-income people with walkable neighborhood amenities for their health-related outcomes and to assist subsidized or affordable housing in walkable neighborhoods.

2.3. Measuring Walkable Neighborhoods

Previous studies examining neighborhood walkability are often based on perceived assessments and objective measurements of the built environment [72,73]. When it comes to perceived assessments, residents are surveyed about their perceptions of the accessibility, safety, attractiveness, and aesthetics of the built environments of neighborhoods to measure the neighborhood walkability. In contrast, objective measurements are based on a geospatial analysis to specify walkable neighborhood amenities, especially in terms of street connectivity, sidewalk density, and proximity to a destination. Particularly, Walk Score, which measures the accessibility of neighborhood amenities as an objective proxy of neighborhood walkability, has been widely utilized by researchers, realtors, and planning professionals since walkscore.com was founded in 2007 [3,74,75]. While the classic Walk Score is measured by straight-line distances to various neighborhood amenities without considering the physical conditions of built environments, such as street connectivity (i.e., intersection density and block length), the Street Smart Walk Score evaluates accessibility to neighborhood amenities based on street network distance and street connectivity metrics [73]. The algorithm of Street Smart Walk Score depends on the distance to nine categories of amenities (grocery stores, restaurants/bars, shopping places, coffee shops, banks, parks, schools, book stores, and entertainment facilities) and calculates scores based on counts of amenities, weighted by category type priority—more important amenities weigh more than less important amenities in the same category [61,73]. For instance, a greater weight is assigned to grocery stores than banks, parks, coffee shops, and book stores [76]. The score is also adjusted based on the distance decay function, which means that neighborhood amenities lose their weight with greater distance [76]. The score is then normalized into a score ranging from 0 to 100. Additionally, the score is further rewarded or penalized by street connectivity, such as intersection density and block length in neighborhoods.
Given the simplicity and public availability of Walk Score, it is not surprising that there are several studies using Walk Score to specify walkable neighborhood amenities over other objective measurements and perceived assessments. Additionally, several studies show that Walk Score can be a valid and reliable measure of estimating neighborhood walkability [61,62,77,78,79]. For instance, Carr, Dunsiger and Marcus [62] evaluated the validity and reliability of Walk Score to identify neighborhood walkability based on GIS objective measurements and perceived assessments in Rhode Island. By employing the Pearson’s correlation test, they showed that there were significant positive relationships between Walk Scores and various neighborhood walkability indicators (street connectivity, residential density, and access to public transit provisions) as well as between Walk Scores and perceived measurements (summed score of various physical activity environment). Additionally, Duncan, Aldstadt, Whalen, Melly and Gortmaker [61] tested the validity of Walk Score in four U.S. metropolitan areas by using the Spearman’s correlation test. They found that there were strong and significant correlations between Walk Scores and objective neighborhood walkability indicators, such as density of retail destinations, intersection density, and population density. However, they also cautioned that only moderate correlations were identified between Walk Scores and highway density, although highway density may have a key role in hindering walking travel in neighborhoods.
Walk Score may have some limitations in measuring neighborhood walkability because its algorithm primarily focuses on neighborhood accessibility to destinations and does not comprehensively consider some built environment conditions that affect walking travel [73]. Thus, as a supplement to the Walk Score to identify neighborhood walkability, we also included physical conditions of built environments, such as sidewalk density, bike lane density, highway density, and major road density, to further bolster the measurement of walkable neighborhoods. These physical conditions of built environments are consistently associated with walkable neighborhoods and active travel behaviors, as revealed by several previous studies [1,73,80,81,82].

3. Data and Methodology
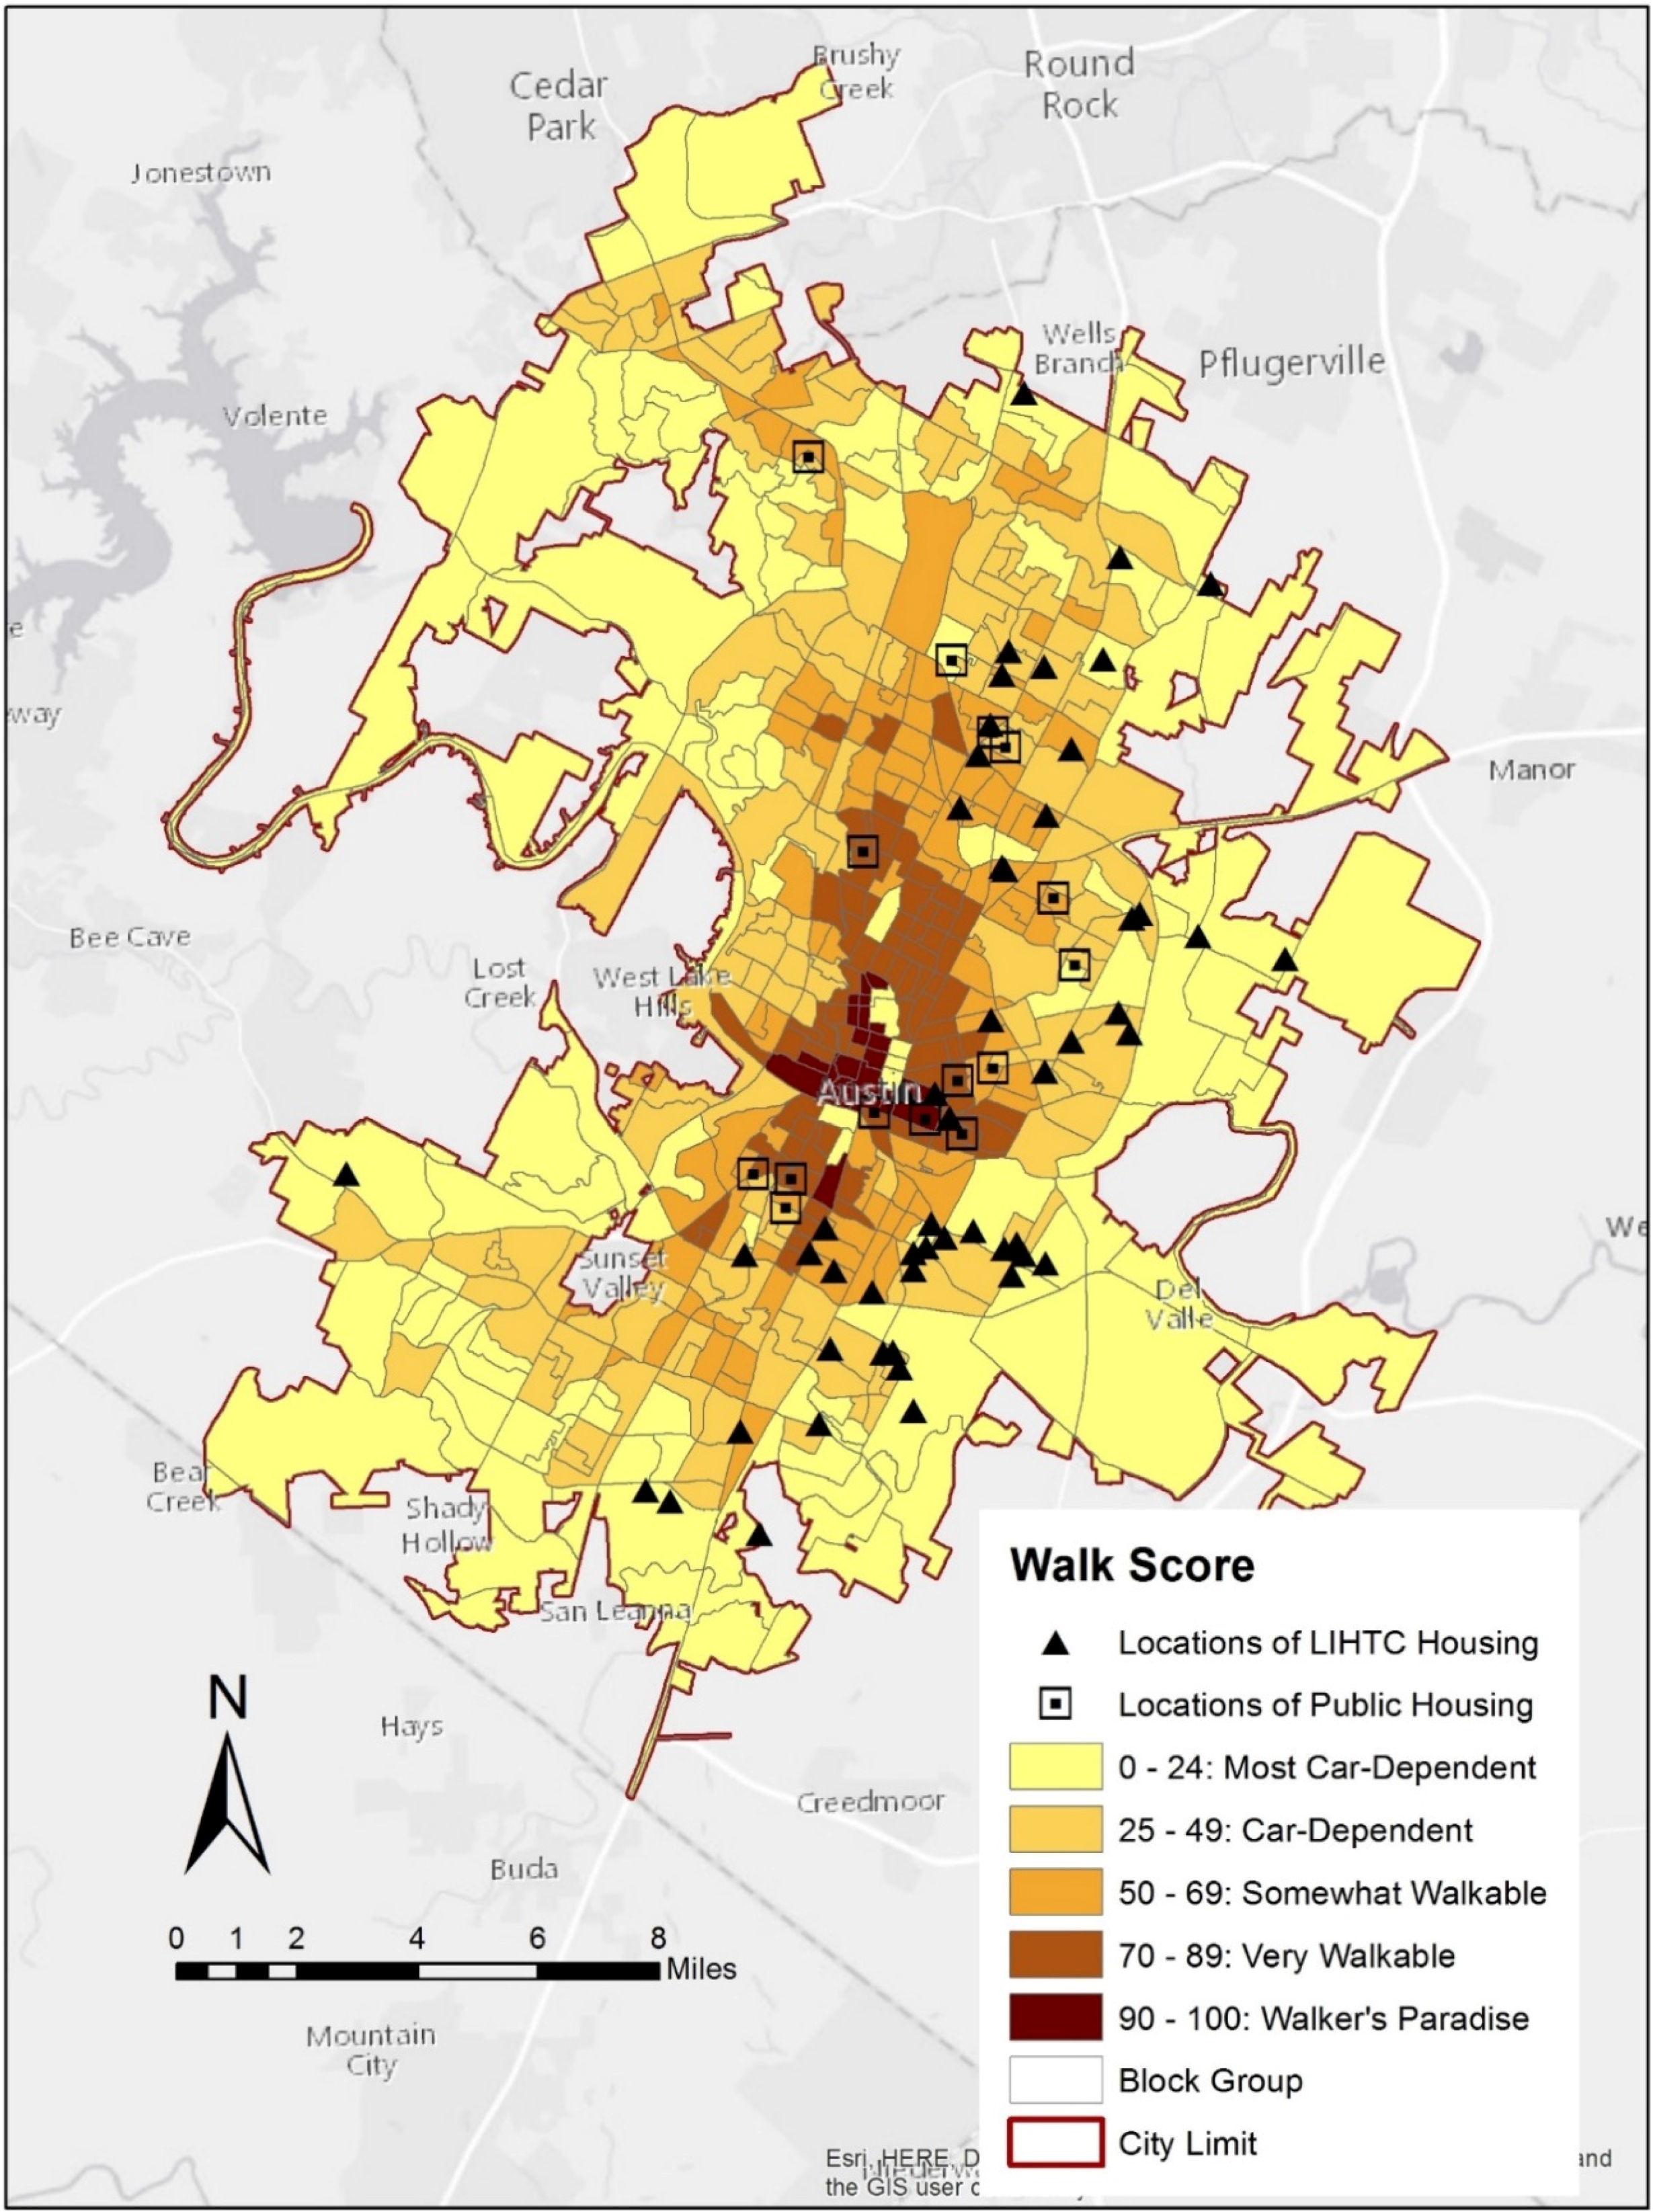
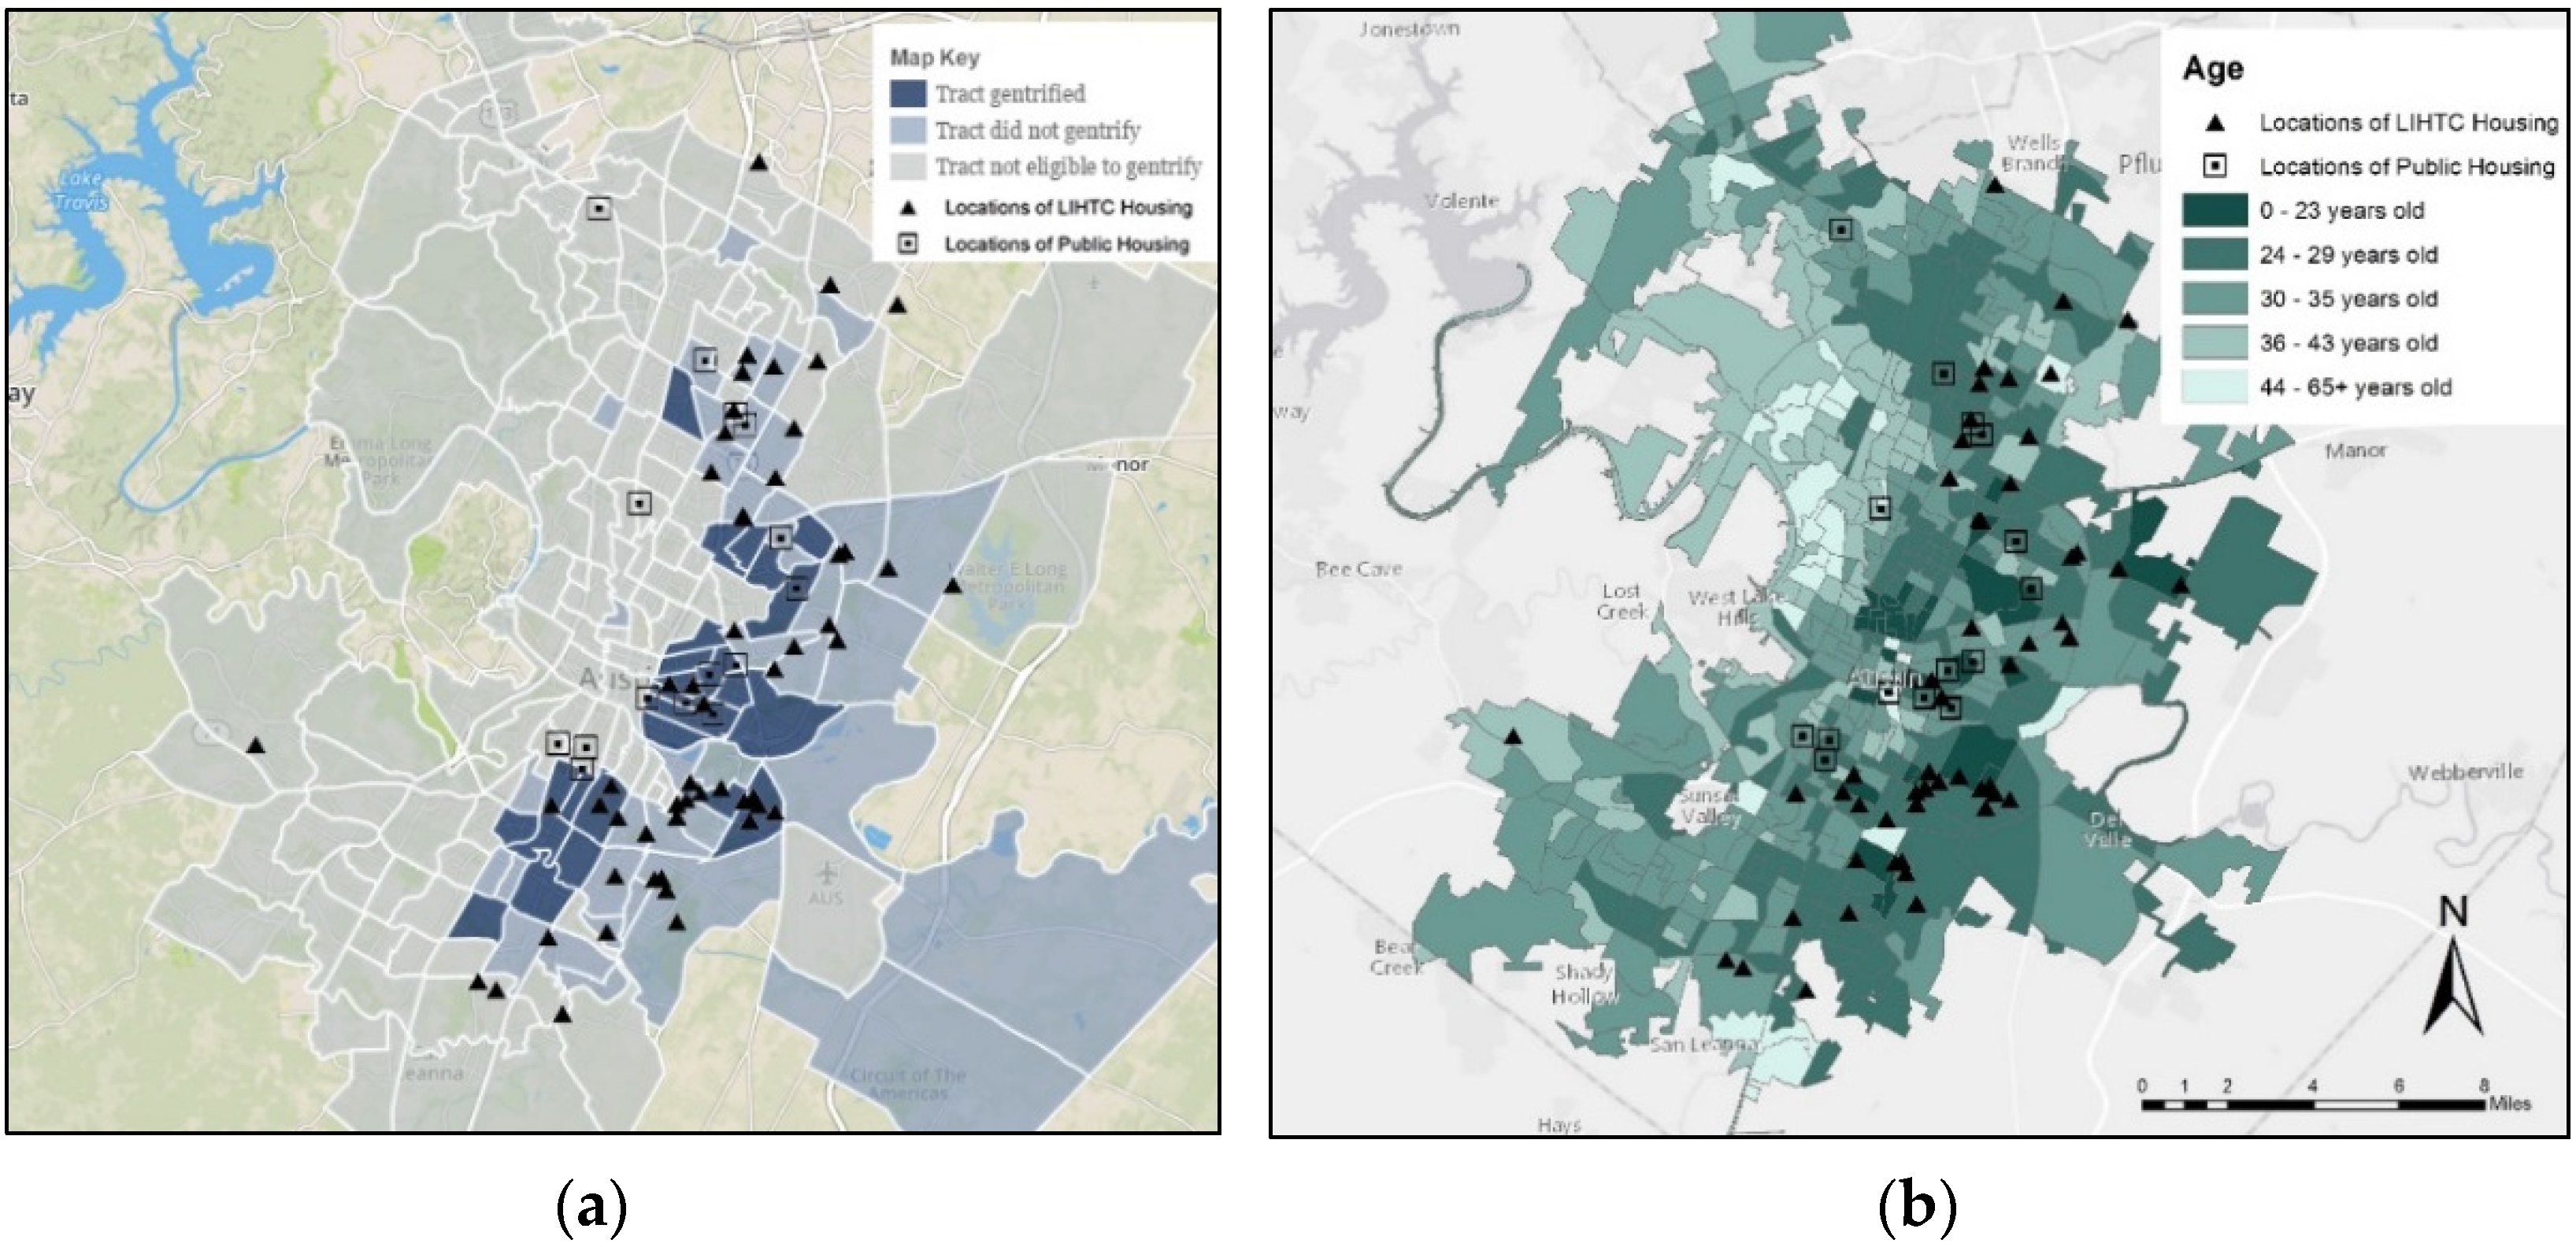
3.1. Study Setting

The study area is the city of Austin, Texas, which is demographically diverse (48.7% non-Hispanic White, 35% Hispanic, 7.7% African-American, 6.3% Asian, and 2.2% Other out of a total population of 790,390 as of the 2010 U.S. Census) [83]. Austin has been ranked No. 4 nationally in terms of population growth since 2010 and No. 2 when it comes to metros, with the best job growth prospects over the next three years [84]. The overall trend in poverty rate in Austin over the past 10–20 years remains relatively unchanged between 1990 and 2010: 17.9% in 1990, 14.4% in 2000, and 18.4% in 2010, which also indicates that Austin has been stable economically and less affected by the economic recession in 2008 [85]. Meanwhile, the median household income of Austin in 2010 increased about 17.4% since 2000 ($42,689 in 2000 vs. $50,132 in 2010). The median housing value of Austin, however, has dramatically increased over the past 10 years. While the median housing value of Austin in 2000 was $120,800, in 2010 it was $200,000, a 66.6% increase in just 10 years [83]. This fact has caused a serious housing affordability problem, especially for low-income families. Additionally, according to a new report from Governing magazine, about 30% of neighborhoods in Austin has been gentrified, and Austin was ranked eighth in the U.S. [86]. Austin is also a very young city, and was ranked second in U.S. metropolitan areas with populations over 1 million in terms of the share of the young adult population [64]. A large proportion of young adults in Austin tend to live in the central areas where there are natural and cultural amenities and economic growth [63]. Furthermore, the central urban areas of Austin have high walkability characterized by greater density of retail destinations, intersection density, and population density [61,62].
However, the number of affordable housing units has not kept pace with the rapid population growth, especially the influx of young people in central areas. Thus, providing affordable housing to residents is one of the most important housing policies in Austin. Although LIHTC and PH developments have been allocated to offset the shortage of affordable housing units, it is unclear whether the place-based subsidized households are located in walkable neighborhoods and thus whether the subsidized households living in Austin can take advantage of walkable neighborhood amenities.

3.2. Data Description

This study used the 2009 Picture of Subsidized Households data obtained from the U.S. Department of Housing and Urban Development (HUD) to identify the location of PH households. Additionally, as a supplement to the Picture of Subsidized Households data, additional information from the Texas Department of Housing and Community Affairs (TDHCA) LIHTC Property Inventory was used to specify the location of LIHTC households. Hence, both PH and LIHTC data included all locations of place-based of subsidized households from 1990 to 2009.
Our primary measurement to identify neighborhood walkability is Street Smart Walk Score, collected from walkscore.com for each address in Austin. We decided to use Street Smart Walk Score rather than classic Walk Score because it considers travel routes and street connectivity to measure neighborhood walkability. The score is then aggregated to Census block groups; hence, the score in our study is the average of the block group-level Walk Score. Street Smart Walk Score for a Census block group ranges from 0 to 100, with a higher score signifying better walkable access to amenities in neighborhoods. As a supplement to Walk Score to identify neighborhood walkability, GIS data obtained from the City of Austin were used to further specify the physical conditions of built environments, such as sidewalk coverage, bike lane coverage, highway ratio, and major road ratio within each Census block group. Highway and major road ratios signify the total length of highway and major roads, divided by the total length of streets in a Census block group. Sidewalk and bike lane coverages in this study were calculated separately by dividing the total length of sidewalks and bike lanes by the total street length multiplied by two (indicating two sides of a street to match the sidewalk and bike lane measurements) [87].
We excluded the characteristics of street connectivity in neighborhoods, such as intersection density and block length, from the study because Street Smart Walk Score accounts for street connectivity in its algorithm. Also, this was justified by the presence of strong and significant correlations between Street Smart Walk Score and street connectivity in Austin, based on the Pearson’s correlation test in our study.
Data for various socio-demographic characteristics of neighborhoods in Austin were obtained from the 2000 Census block group data. In particular, we measured seven socio-demographic variables related to the spatial location of place-based subsidized households: median household income, non-White minority composition, median housing value, unemployment, female-headed family, teenage school dropout, and welfare receipt [12,14,18]. Additionally, the locational characteristics of neighborhoods measured by the distance to the Central Business District (CBD) were derived from the 2000 Census data and the Census Transportation Planning Products (CTPP) 2000 Home-to-Work Flows data. The location of the CBD was defined as the centroid of the Census tract with the highest job density in Austin.

3.3. Statistical Analyses

This study used two empirical approaches—bivariate and multivariate analyses—in order to specify the relationships between the spatial locations of place-based subsidized households and walkable neighborhood amenities in Austin, Texas. First, we employed t-tests to specify the differences in walking-related built environmental conditions of neighborhoods with and without LIHTC developments and neighborhoods with and without PH developments. Second, we used the Binary logistic regressions to examine the built environmental correlates of each LIHTC and PH neighborhood after accounting for the geographic and socio-demographic characteristics of neighborhoods. The Binary logistic regressions allow us to specify the relative significance of variables for walking-related built environments after controlling for other geographic and socio-demographic variables [18]. Hence, dependent variables in our study were coded by a binary scheme (0: non-LIHTC neighborhoods, 1: LIHTC neighborhoods (outcome 1); 0: non-PH neighborhoods, 1: PH neighborhoods (outcome 2)). First, a Base Model was developed, identifying the significant socio-demographic and locational characteristics and Street Smart Walk Score correlates of each subsidized neighborhood, which were used as the confounding variables in this study. Then, a series of One-by-One Models was generated to examine the independent effect of the walking-related built environmental variables on the outcome variables by adding one built environmental variable at a time to the base models. Finally, all the confounding variables (socio-demographic, locational characteristic, and Street Smart Walk Score) and the walking-related built environmental variables were used to develop Final Models. Statistical significance is determined at the 0.10 level and all analyses were conducted in STATA ver. 14.

4. Results

4.1. Sample Characteristics

Table 1 shows the socio-demographic characteristics of block group neighborhoods in Austin. While the average percentage of minorities in Austin neighborhoods was about 41%, neighborhoods where LIHTC households and PH households were located had higher percentages of minorities—about 70% and 69%, respectively. The mean household income for all neighborhoods in Austin was $50,230, which was around two times higher than the mean income for the LIHTC ($33,797) and the PH neighborhoods ($28,707). Additionally, the median housing values for neighborhoods with place-based subsidized households were less than $100,000. The unemployment rate in neighborhoods where LIHTC and PH households were sited (6.5% and 8.9%) was about 1.5 times and two times higher, respectively, compared to the unemployment rate in Austin (4.3%). Furthermore, households within the block groups with LIHTC and PH complexes had higher levels in female-headed family, teenage school dropout, and welfare receipt than the total population.

4.2. Comparison t-Test

4.2.1. Walk Score

Figure 1 shows the spatial locations of LIHTC and PH neighborhoods and the Street Smart Walk Scores measured within the block groups. Following the category scheme in walkscore.com, we translated the Walk Score to five categories; (1) walk score 0–24: most car-dependent (almost all errands require a car); (2) walk score 25–49: car dependent (most errands require a car); (3) walk score 50–69: somewhat walkable (some errands can be accomplished on foot); (4) walk score 70–89: very walkable (most errands can be accomplished on foot); and (5) walk score 90–100: walker’s paradise [88]. The majority (65.9%, n = 27) of the LIHTC neighborhoods were considered “most car-dependent (walk score 0–24)” and “car-dependent (walk score 25–49).” About 29.3% (n = 12) of the LIHTC neighborhoods were “somewhat walkable.” Of the total 41 LIHTC neighborhoods, only one neighborhood belonged to each “very walkable” and “walker’s paradise” category. In contrast, almost half (42.9%) of the PH neighborhoods were “very walkable” and one neighborhood was “walker’s paradise.”
Table 2 further represents the results of the differences in means of the Walk Score variable between non-LIHTC neighborhoods and LIHTC neighborhoods as well as between non-PH and PH neighborhoods. The mean Walk Score of the LIHTC neighborhoods was 37.46, while that of the non-LIHTC neighborhoods was 47.17. In contrast to the LIHTC neighborhoods, the mean Walk Score for the PH neighborhoods (60.04) was much greater than the one for the non-PH neighborhoods (45.85). Furthermore, the mean Walk Score in neighborhoods with PH complexes indicates that they are “somewhat walkable” (mean = 60.04).
Figure 2a shows the Census tracts gentrified in Austin since 2000. The neighborhood gentrification has been concentrated in the east area of Austin, where a moderate to high Walk Score indicates somewhat and very walkable neighborhoods. Furthermore, LIHTC households with low walk score (37.4, car-dependent) tend to be located in suburban areas while PH households with moderate walk score (60.4, somewhat walkable) are more likely to be located in inner city neighborhoods. In terms of the relationship between neighborhood walkability and youthification, the spatial distribution of age groups in the study area is depicted in Figure 2b. A higher proportion of young age groups lived in the eastern part of Austin, where the neighborhood gentrification was concentrated and moderate to high walkable scores were reported (Figure 1 and Figure 2a,b).

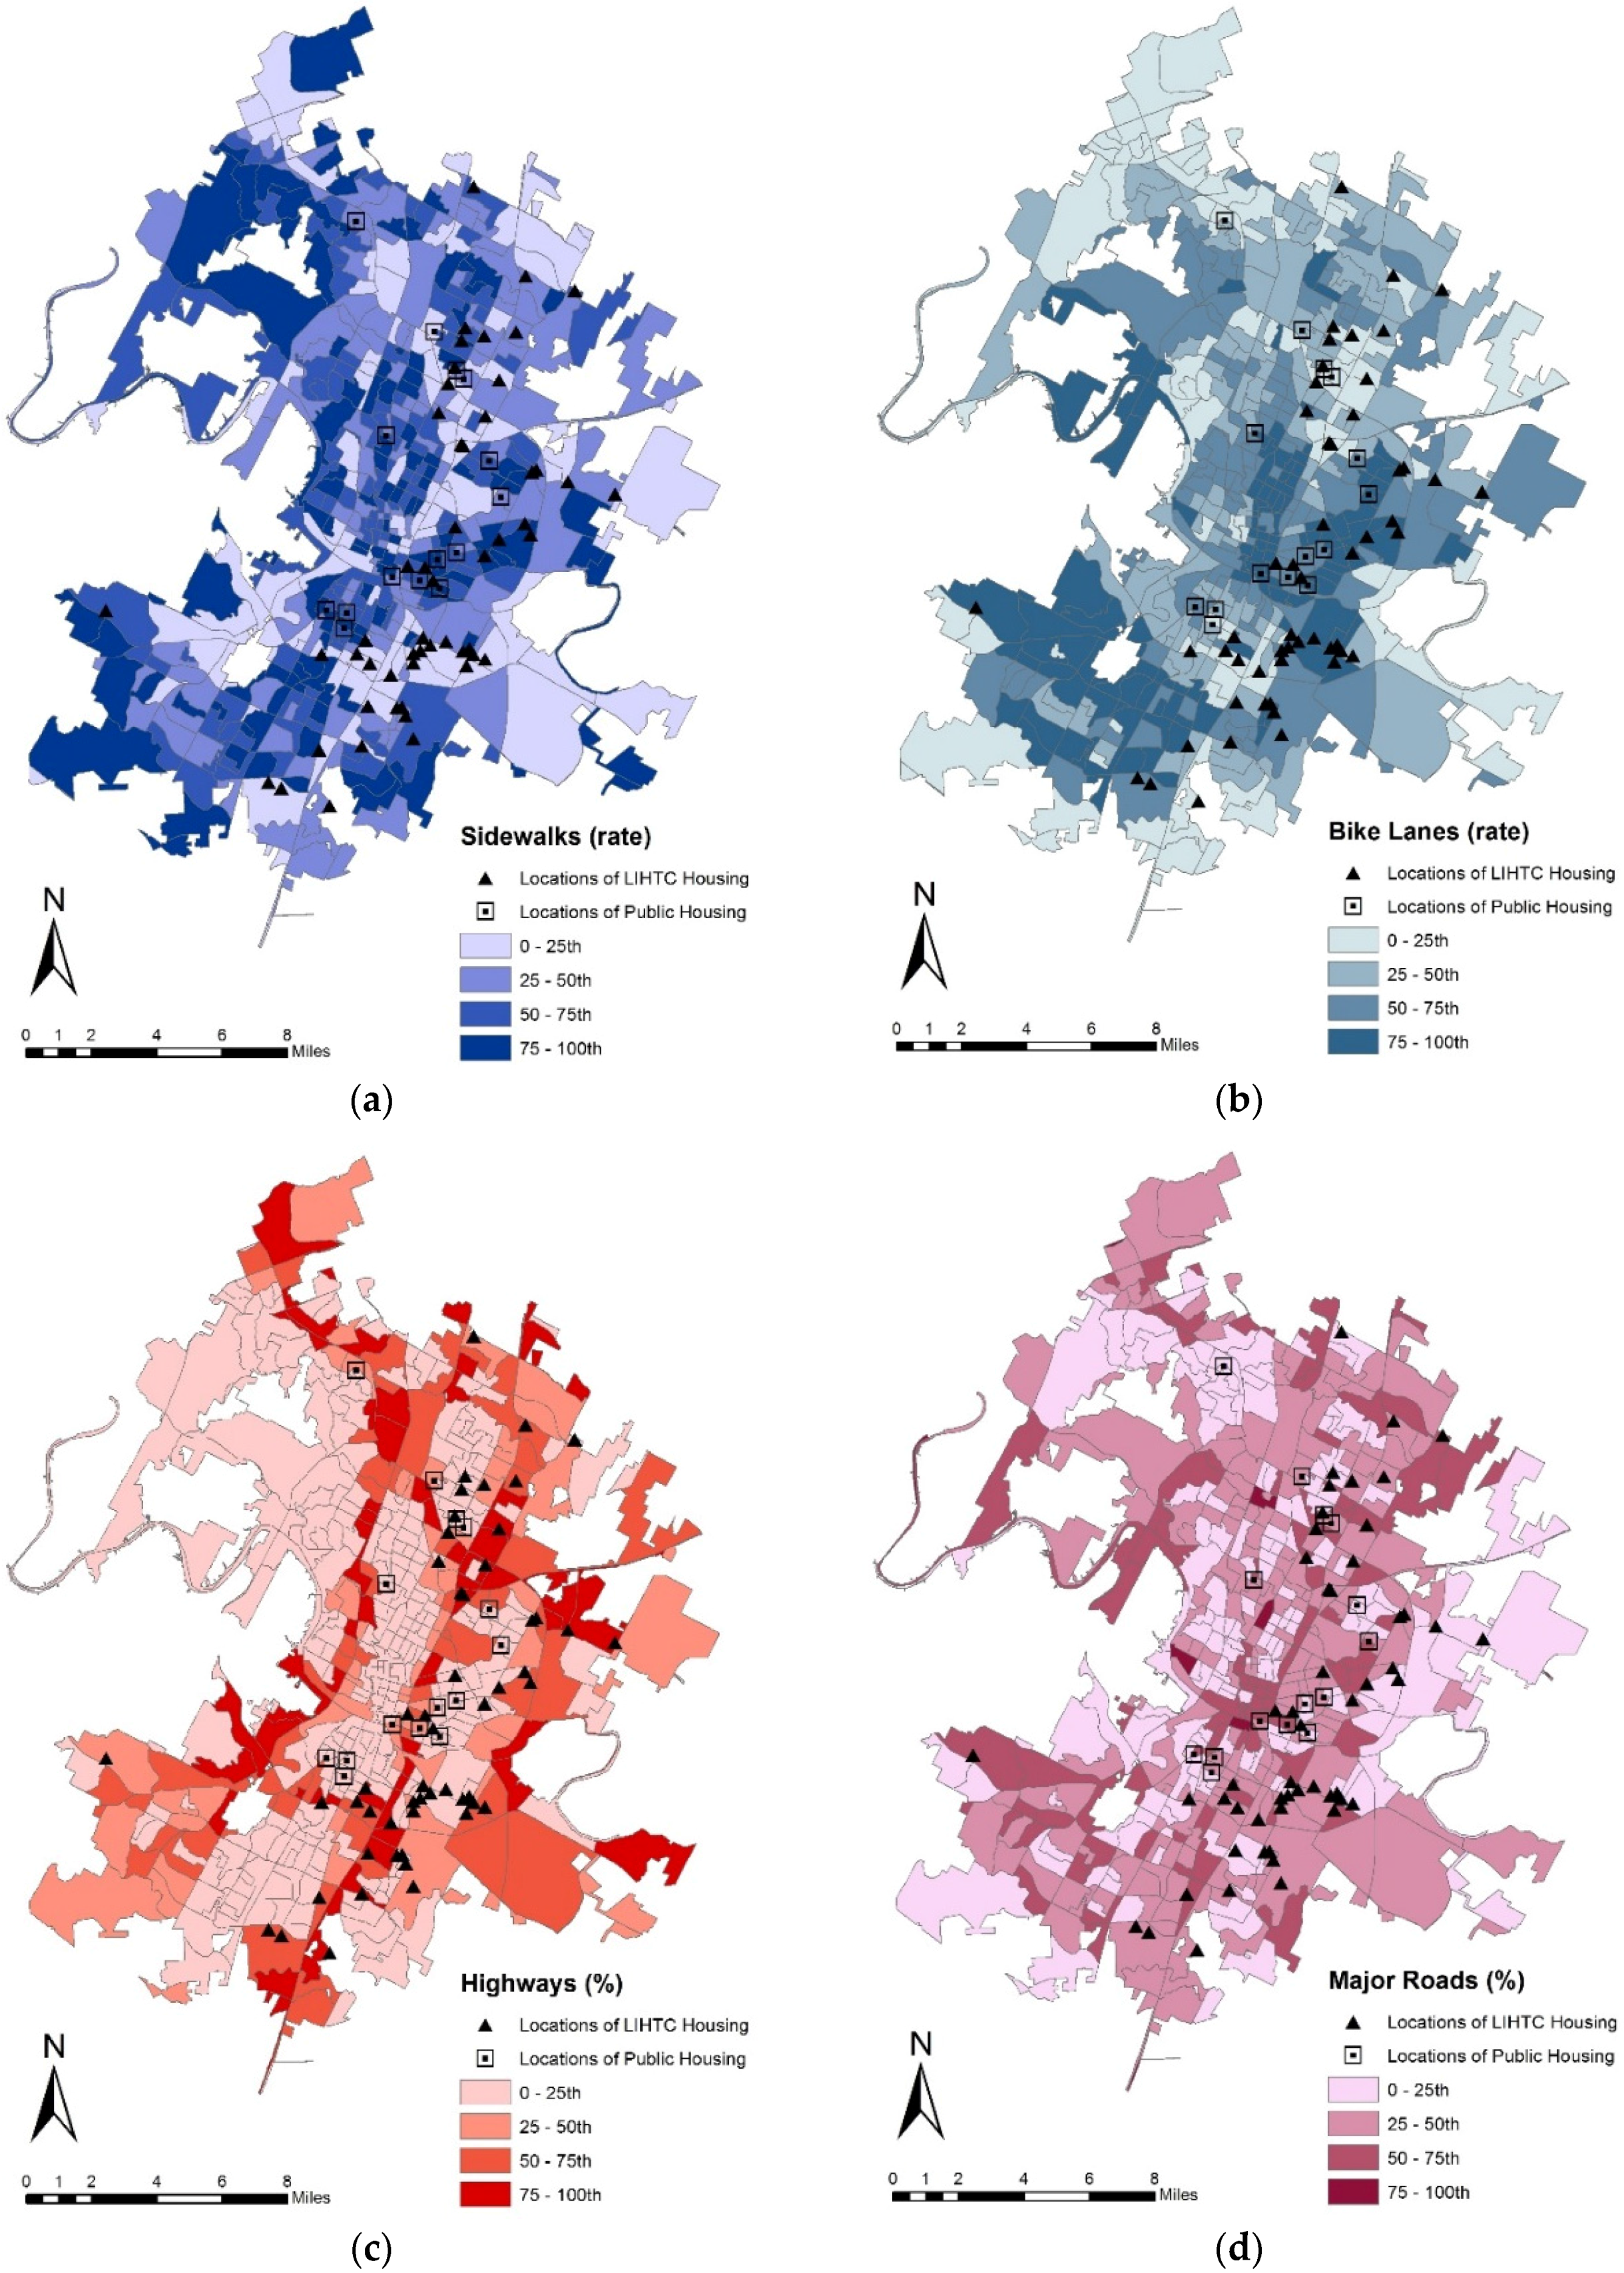
4.2.2. Built Environmental Characteristics

Table 3 represents the results of comparison t-tests on the walking-related built environmental variables between non-LIHTC and LIHTC neighborhoods as well as between non-PH and PH neighborhoods. The sidewalk rate measured within block groups was higher for non-LIHTC neighborhoods than for LIHTC neighborhoods (0.579 vs. 0.516), and it was marginally significant at the 0.10 level. A higher percentage of highways in neighborhoods with LIHTC complexes compared to non-LIHTC neighborhoods was significant at the 0.01 level. However, there were no statistically significant differences in built environmental characteristics between non-PH and PH neighborhoods.
Figure 3 is a series of GIS maps showing the spatial pattern of the built environmental conditions measured within block groups and the locations of LIHTC and PH households. Sidewalks and bike lanes that encourage people to engage in active transportation, such as walking or bicycling, in their neighborhoods were evenly distributed in Austin, TX. However, highways—which are considered one of the significant barriers that prevent participating in walking and bicycling—were distributed heavily in the neighborhoods where most of the LIHTC housing units were developed.

4.3. Binary Logistic Regression

4.3.1. Socio-Demographic and Walk Score Correlates of LIHTC and PH Neighborhoods (Base Models)

Table 4 represents the results from the base models estimating the socio-demographic characteristics and locational characteristics, associated with LIHTC and PH neighborhoods, which were used as the confounding variables in the one-by-one and the final models. The estimated odds ratio for the percentage of minority population was 1.057, indicating that the odds of a neighborhood including LIHTC households increase up to 5.7% if the percentage of minority increases by 1%. The odds ratio for the median housing value variable was 1.009, which means that every $1000 increase in median housing value increases the likelihood of a neighborhood containing LIHTC households by 0.9%. The female-head family variable appeared to be positively associated with the outcome variables, indicating that both LIHTC and PH neighborhoods are more likely to have a higher proportion of female-headed families in their households. The odds ratios of the median income and the welfare receipt variables were 0.957 and 0.896, indicating that every additional $1,000 in income and percentage of welfare receipt leads to a 4.3% and a 10.4% decrease in the odds of a neighborhood including LIHTC households. The odds ratio of 1.056 for the distance to CBD variable was marginally significant at the 0.10 level, indicating that one mile increase in distance to CBD leads to increase in the odds of a neighborhood including LIHTC households up to 5.6%.

4.3.2. Built Environmental Correlates of LIHTC and PH Neighborhoods (One-by-One and Final Models)

Table 5 represents the results of the multivariate analyses, which include a series of one-by-one models and the final model for each subsidized neighborhood. For the one-by-one models, one built environmental variable was separately added into the base model to examine the independent effect of the built environmental variable on the outcome variable, controlling for all the other variables used for the baseline models.
The final models for both LIHTC and PH neighborhoods kept the statistical significance of the socio-demographic variables. After taking into account the various socio-demographic characteristics and the distance to CBD, the relationship between the location of LIHTC neighborhoods and Walk Score was statistically significant at the 0.01 level in the LIHTC base model. The estimated odds ratio for Walk Score was 0.96, signifying that each point increase in Walk Score in neighborhoods resulted in a 4.0% decrease in the odds of the neighborhood containing LIHTC subsidized households. In terms of walking-related built environmental correlates of the subsidized households, highways and major roads were positively associated with neighborhoods with LIHTC developments only. The estimated odds ratios of highways and major roads, 1.04 and 1.05, indicate that every additional percentage of highways and major roads led to a 4% and a 5% increase in the odds of the neighborhood including LIHTC households. Especially, the one-by-one model for the sidewalk variable showed the significant role of sidewalks in in determining the odds of LIHTC neighborhoods. After controlling for the socio-demographic variables, distance to CBD, and Walk Score, LIHTC neighborhoods were less likely to have sidewalks, compared to non-LIHTC neighborhoods (OR = 0.14). The PH final model, however, did not show any statistical significance of the Walk Score and the built environmental factors associated with PH neighborhoods.

5. Conclusions

While most previous studies about subsidized housing issues mainly focused on the associations between subsidized households and socioeconomic environments such as income level, racial composition, poverty level, unemployment level, etc., this study further investigated the living environments of subsidized households by estimating walkable neighborhood amenities around subsidized housing complexes. We examined the characteristics of the walking-related built environment for both PH and LIHTC neighborhoods in Austin and estimated the neighborhood walkability by utilizing the Street Smart Walk Score data, which is known as a valid tool [61,62,77]. Given the empirical evidence on the benefits of walkable neighborhood amenities on public health, social interactions, and environmental benefits, it is important to investigate whether subsidized households are located in neighborhoods where they can partake of these benefits. In order to develop datasets and robust statistical modeling, we aggregated the Street Smart Walk Scores by each block group after geocoding them at the street level and then merged the data with the objectively measured built environment data (sidewalks, bike lanes, highways, and major roads) at the block group level. To control the effects of covariates on the PH and LIHTC outcome variables coded by a binary scheme, we also collected various socio-demographic data at the block group level, including minority, income, housing value, unemployment, female-headed family, teenage school dropouts, and welfare receipt. To the best our knowledge, this study is one of few studies examining walkable environments for subsidized households.
The results of t-tests based on Street Smart Walk Score demonstrated that while PH households are more likely to be located in somewhat walkable neighborhoods, LIHTC households tend to be located in most car-dependent neighborhoods. This finding implies that LIHTC developments may have limitations in terms of providing walkable environments for disadvantaged populations. Additionally, our bivariate analysis shows that LIHTC households must contend with less sidewalk coverage and more highways in their neighborhoods, which hinders walking behavior. This further supports the raised concern about walkability in LIHTC neighborhoods. In contrast, there was no statistical difference in the walking-related built environmental conditions between non-PH and PH neighborhoods.
Furthermore, our regression results based on the Street Smart Walk Score showed that LIHTC households are significantly located in car-dependent neighborhoods, compared with non-LIHTC households, after controlling for the various socio-demographic and locational characteristics of neighborhoods. In contrast, the spatial location of PH households was not significantly associated with neighborhood walkability. In terms of the walking-related built environmental correlates of the two subsidized neighborhoods, sidewalk coverages, highways, and major roads remained significantly associated with LIHTC neighborhoods, indicating that LIHTC households were more likely to be exposed to neighborhoods with less sidewalk coverage but more highways and major roads. Given the findings of previous studies examining the positive role of sidewalks in promoting pedestrian walking behavior [89,90,91], it is necessary to install more sidewalks in LIHTC neighborhoods to facilitate residents’ safe and comfortable walking. Furthermore, highways and major roads can be barriers to walking activity as those facilities disrupt pedestrian routes due to the high velocity of vehicles and street network partitioning [82]. Thus, it is important to make sure that LIHTC households face fewer environmental barriers, such as highways and major roads, in their neighborhoods to avoid discouraging health-related travel behavior.
Regarding the relationship between the walkability near subsidized housing, gentrification, and youthification, our study demonstrates that while LIHTC neighborhoods with low walkability (car-dependent neighborhoods) tend to be located in suburban areas that are not gentrified, PH neighborhoods are more likely to be located in gentrified urban areas with high walkability. This finding may support the results of the regression models showing that the location of LIHTC households was significantly associated with low neighborhood walkability, while the location of PH households was not significantly associated with the neighborhood walkability. It may be because PH households were more likely to be located in urban areas contributing to gentrification. Thus, future studies on subsidized housing (especially for PH households) should address issues relating to neighborhood gentrification. Specifically, by measuring the change of various socio-demographic characteristics (e.g., housing turnover, property values, age, population immigrants, etc.) to identify gentrifying neighborhoods, future studies may better describe and understand the relationships between subsidized housing and neighborhood walkability based on a longitudinal analysis.
This study may be limited in terms of generalizability and data aggregation. First, this study was based on the data collected from one city, Austin, Texas, and therefore the findings from this study are not applicable to other cities. However, our findings should still offer relevant insights to the cities with similar socio-demographic and environmental characteristics, and to those interested in addressing suitable living environments for subsidized households. Second, this study used data aggregated at the block group level and therefore findings may not be directly applied to identify more specific built environment conditions and qualities at the micro level (e.g., width or aesthetics of sidewalks and bike lanes, height or size of highways and major roads) that may contribute to deteriorating quality of life for subsidized households. However, we should acknowledge that this study used socio-demographic data collected at the block group level, which is the smallest unit in the publicly available U.S. Census Bureau data. Future research may conduct survey-based analyses on both subsidized and non-subsidized households’ perceived assessments of walkability to identify more exactly the socio-demographics and neighborhood environmental conditions around respondents’ homes utilizing both micro and macro measurements.
Despite these limitations, this study addressed significant knowledge gaps that had previously been overlooked in the literature. It dealt with suitable living environments of subsidized households beyond addressing the importance of both socioeconomic environments and the quantity of affordable housing. The findings from this study imply that more attention and effort toward reducing the inequitable distributions of walkable neighborhood features supporting rather than hindering healthy lifestyles must be provided to subsidized households. Siting subsidized households in neighborhoods where it is safe and comfortable to walk should be carefully considered for residents’ health-related outcomes and their quality of life.

Acknowledgments

The authors acknowledge the City of Austin which provided us with valuable raw data for this study.

Author Contributions

Young-Jae Kim conceived the idea for the analysis, contributed to walking-related built environmental data collection and geocoding street addresses assigned for Walk Scores using GIS, and drafted the manuscript. Ayoung Woo also conceived the idea for the analysis, contributed to Walk Scores and socio-demographic data collection, and wrote the manuscript. All authors have read, provided feedback, and approved the final manuscript.

Conflicts of Interest

The authors declare no conflict of interest.

References

  1. Li, W.; Joh, K.; Lee, C.; Kim, J.-H.; Park, H.; Woo, A. From car-dependent neighborhoods to walkers’ paradise: Estimating walkability premiums in the condominium housing market. Transp. Res. Rec.: J. Transp. Res. Board 2014, 162–170. [Google Scholar] [CrossRef]
  2. Joh, K.; Chakrabarti, S.; Boarnet, M.G.; Woo, A. The walking renaissance: A longitudinal analysis of walking travel in the greater los angeles area, USA. Sustainability 2015, 7, 8985–9011. [Google Scholar] [CrossRef]
  3. Pivo, G.; Fisher, J.D. The walkability premium in commercial real estate investments. Real Estate Econ. 2011, 39, 185–219. [Google Scholar] [CrossRef]
  4. Setton, E.; Marshall, J.D.; Brauer, M.; Lundquist, K.R.; Hystad, P.; Keller, P.; Cloutier-Fisher, D. The impact of daily mobility on exposure to traffic-related air pollution and health effect estimates. J. Expo. Sci. Environ. Epidemiol. 2011, 21, 42–48. [Google Scholar] [CrossRef] [PubMed]
  5. Rogers, S.H.; Halstead, J.M.; Gardner, K.H.; Carlson, C.H. Examining walkability and social capital as indicators of quality of life at the municipal and neighborhood scales. Appl. Res. Qual. Life 2011, 6, 201–213. [Google Scholar] [CrossRef]
  6. Du Toit, L.; Cerin, E.; Leslie, E.; Owen, N. Does walking in the neighbourhood enhance local sociability? Urban Stud. 2007, 44, 1677–1695. [Google Scholar] [CrossRef]
  7. Lee, C.; Ory, M.G.; Yoon, J.; Forjuoh, S.N. Neighborhood walking among overweight and obese adults: Age variations in barriers and motivators. J. Community Health 2013, 38, 12–22. [Google Scholar] [CrossRef] [PubMed]
  8. Wang, Z.; Lee, C. Site and neighborhood environments for walking among older adults. Health Place 2010, 16, 1268–1279. [Google Scholar] [CrossRef] [PubMed]
  9. Ainsworth, B.E.; Keenan, N.L.; Strogatz, D.S.; Garrett, J.M.; James, S.A. Physical activity and hypertension in black adults: The pitt county study. Am. J. Public Health 1991, 81, 1477–1479. [Google Scholar] [CrossRef] [PubMed]
  10. Mason, J.O.; McGinnis, J.M. “Healthy people 2000”: An overview of the national health promotion and disease prevention objectives. Public Health Rep. 1990, 105, 441–446. [Google Scholar] [CrossRef] [PubMed]
  11. Taylor, W.C.; Baranowski, T.; Young, D.R. Physical activity interventions in low-income, ethnic minority, and populations with disability. Am. J. Prev. Med. 1998, 15, 334–343. [Google Scholar] [CrossRef]
  12. Newman, S.J.; Schnare, A.B. “… and a suitable living environment”: The failure of housing programs to deliver on neighborhood quality. Hous. Policy Debate 1997, 8, 703–741. [Google Scholar] [CrossRef]
  13. Oakley, D. Locational patterns of low-income housing tax credit developments a sociospatial analysis of four metropolitan areas. Urban Affairs Rev. 2008, 43, 599–628. [Google Scholar] [CrossRef]
  14. Freeman, L. Siting Affordable Housing: Location and Neighborhood Trends of Low Income Housing Tax Credit Developments in the 1990s; Brookings Institution, Center on Urban and Metropolitan Policy: Washington, DC, USA, 2004. [Google Scholar]
  15. Van Zandt, S.; Mhatre, P.C. Growing pains: Perpetuating inequality through the production of low-income housing in the dallas/fort worth metroplex. Urban Geography 2009, 30, 490–513. [Google Scholar] [CrossRef]
  16. Crowley, S. The affordable housing crisis: Residential mobility of poor families and school mobility of poor children. J. Negro Educ. 2003, 72, 22–38. [Google Scholar] [CrossRef]
  17. Massey, D.S.; Denton, N.A. American Apartheid: Segregation and the Making of the Underclass; Harvard University Press: Cambridge, MA, USA, 1993. [Google Scholar]
  18. Woo, A.; Kim, Y.-J. Spatial location of place-based subsidized households and uneven geography of opportunities: Case of Austin, Texas in the US. Community Dev. 2016, 47, 1–18. [Google Scholar] [CrossRef]
  19. Squires, G.D.; Kubrin, C.E. Privileged places: Race, uneven development and the geography of opportunity in urban america. Urban Stud. 2005, 42, 47–68. [Google Scholar] [CrossRef]
  20. Kasarda, J.D. Inner-city concentrated poverty and neighborhood distress: 1970 to 1990. Hous. Policy Debate 1993, 4, 253–302. [Google Scholar] [CrossRef]
  21. Pendall, R. Why voucher and certificate users live in distressed neighborhoods. Hous. Policy Debate 2000, 11, 881–910. [Google Scholar] [CrossRef]
  22. Kim, Y.-J.; Woo, A. Estimating natural environmental characteristics of subsidized households: A case study of austin, texas. Sustainability 2015, 7, 13433–13453. [Google Scholar] [CrossRef]
  23. Eriksen, M.D.; Rosenthal, S.S. Crowd out effects of place-based subsidized rental housing: New evidence from the lihtc program. J. Public Econ. 2010, 94, 953–966. [Google Scholar] [CrossRef]
  24. Schwartz, A.F. Housing Policy in the United States; Routledge: Abingdon, VA, USA, 2014. [Google Scholar]
  25. Rohe, W.M.; Freeman, L. Assisted housing and residential segregation: The role of race and ethnicity in the siting of assisted housing developments. J. Am. Plan. Assoc. 2001, 67, 279–292. [Google Scholar] [CrossRef]
  26. Woo, A.; Joh, K.; Van Zandt, S. Unpacking the impacts of the low-income housing tax credit program on nearby property values. Urban Stud. 2015. [Google Scholar] [CrossRef]
  27. Woo, A.; Joh, K.; Van Zandt, S. Impacts of the low-income housing tax credit program on neighborhood housing turnover. Urban Affairs Rev. 2016, 52, 247–279. [Google Scholar] [CrossRef]
  28. Woo, A.; Joh, K. Beyond anecdotal evidence: Do subsidized housing developments increase neighborhood crime? Appl. Geography 2015, 64, 87–96. [Google Scholar] [CrossRef]
  29. Goldstein, I.; Yancey, W.L. Public Housing Projects, Blacks, and Public Policy: The Historical Ecology of Public Housing in Philadelphia; The Africa-America Institute: New York, NY, USA, 1983. [Google Scholar]
  30. Taeuber, K.E.; Taeuber, A.F. Negroes in Cities: Residential Segregation and Neighborhood Change; Aldine Pub. Co.: New Jersey, NJ, USA, 1969. [Google Scholar]
  31. Bickford, A.; Massey, D.S. Segregation in the second ghetto: Racial and ethnic segregation in american public housing, 1977. Soc. Forces 1991, 69, 1011–1036. [Google Scholar] [CrossRef]
  32. Carter, W.H.; Schill, M.H.; Wachter, S.M. Polarisation, public housing and racial minorities in us cities. Urban Stud. 1998, 35, 1889–1911. [Google Scholar] [CrossRef]
  33. Goering, J.; Kamely, A.; Richardson, T. Recent research on racial segregation and poverty concentration in public housing in the united states. Urban Affairs Rev. 1997, 32, 723–745. [Google Scholar] [CrossRef]
  34. Galster, G.C. The evolving challenges of fair housing since 1968: Open housing, integration, and the reduction of ghettoization. Cityscape 1999, 4, 123–138. [Google Scholar]
  35. Lee, C.; Moudon, A.V. Physical activity and environment research in the health field: Implications for urban and transportation planning practice and research. J. Plan. Lit. 2004, 19, 147–181. [Google Scholar] [CrossRef]
  36. Saelens, B.E.; Sallis, J.F.; Frank, L.D. Environmental correlates of walking and cycling: Findings from the transportation, urban design, and planning literatures. Ann. Behav. Med. 2003, 25, 80–91. [Google Scholar] [CrossRef] [PubMed]
  37. Van Dyck, D.; Cardon, G.; Deforche, B.; Sallis, J.F.; Owen, N.; De Bourdeaudhuij, I. Neighborhood ses and walkability are related to physical activity behavior in belgian adults. Prev. Med. 2010, 50, S74–S79. [Google Scholar] [CrossRef] [PubMed]
  38. Frank, L.D.; Schmid, T.L.; Sallis, J.F.; Chapman, J.; Saelens, B.E. Linking objectively measured physical activity with objectively measured urban form: Findings from smartraq. Am. J. Prev. Med. 2005, 28, 117–125. [Google Scholar] [CrossRef] [PubMed]
  39. Saelens, B.E.; Sallis, J.F.; Black, J.B.; Chen, D. Neighborhood-based differences in physical activity: An environment scale evaluation. Am. J. Public Health 2003, 93, 1552–1558. [Google Scholar] [CrossRef] [PubMed]
  40. Zhu, X.; Yu, C.-Y.; Lee, C.; Lu, Z.; Mann, G. A retrospective study on changes in residents’ physical activities, social interactions, and neighborhood cohesion after moving to a walkable community. Prev. Med. 2014, 69, S93–S97. [Google Scholar] [CrossRef] [PubMed]
  41. Ewing, R.; Schmid, T.; Killingsworth, R.; Zlot, A.; Raudenbush, S. Relationship between urban sprawl and physical activity, obesity, and morbidity. In Urban Ecology; Springer: Berlin, Germany, 2008; pp. 567–582. [Google Scholar]
  42. Frank, L.D.; Andresen, M.A.; Schmid, T.L. Obesity relationships with community design, physical activity, and time spent in cars. Am. J. Prev. Med. 2004, 27, 87–96. [Google Scholar] [CrossRef] [PubMed]
  43. Giles-Corti, B.; Macintyre, S.; Clarkson, J.P.; Pikora, T.; Donovan, R.J. Environmental and lifestyle factors associated with overweight and obesity in perth, australia. Am. J. Health Promot. 2003, 18, 93–102. [Google Scholar] [CrossRef] [PubMed]
  44. Lopez, R. Urban sprawl and risk for being overweight or obese. Am. J. Public Health 2004, 94, 1574–1579. [Google Scholar] [CrossRef] [PubMed]
  45. Frank, L.D.; Sallis, J.F.; Conway, T.L.; Chapman, J.E.; Saelens, B.E.; Bachman, W. Many pathways from land use to health: Associations between neighborhood walkability and active transportation, body mass index, and air quality. J. Am. Plan. Assoc. 2006, 72, 75–87. [Google Scholar] [CrossRef]
  46. Sturm, R.; Cohen, D.A. Suburban sprawl and physical and mental health. Public Health 2004, 118, 488–496. [Google Scholar] [CrossRef] [PubMed]
  47. Lund, H. Pedestrian environments and sense of community. J. Plan. Educ. Res. 2002, 21, 301–312. [Google Scholar] [CrossRef]
  48. Kim, J.; Kaplan, R. Physical and psychological factors in sense of community new urbanist kentlands and nearby orchard village. Environ. Behav. 2004, 36, 313–340. [Google Scholar] [CrossRef]
  49. Leyden, K.M. Social capital and the built environment: The importance of walkable neighborhoods. Am. J. Public Health 2003, 93, 1546–1551. [Google Scholar] [CrossRef] [PubMed]
  50. Handy, S.L.; Cao, X.; Mokhtarian, P.L. The causal influence of neighborhood design on physical activity within the neighborhood: Evidence from northern california. Am. J. Health Promot. 2008, 22, 350–358. [Google Scholar] [CrossRef] [PubMed]
  51. Tudor-Locke, C.; Giles-Corti, B.; Knuiman, M.; McCormack, G. Tracking of pedometer-determined physical activity in adults who relocate: Results from reside. Int. J. Behav. Nutr. Phys. Act. 2008. [Google Scholar] [CrossRef] [PubMed]
  52. Wells, N.M.; Yang, Y. Neighborhood design and walking: A quasi-experimental longitudinal study. Am. J. Prev. Med. 2008, 34, 313–319. [Google Scholar] [CrossRef] [PubMed]
  53. Giles-Corti, B.; Bull, F.; Knuiman, M.; McCormack, G.; Van Niel, K.; Timperio, A.; Christian, H.; Foster, S.; Divitini, M.; Middleton, N. The influence of urban design on neighbourhood walking following residential relocation: Longitudinal results from the reside study. Soc. Sci. Med. 2013, 77, 20–30. [Google Scholar] [CrossRef] [PubMed]
  54. Zhu, X.; Lu, Z.; Yu, C.; Lee, C.; Mann, G. Walkable communities: Impacts on residents’ physical and social health. World Health Des 2013, 7, 68–75. [Google Scholar]
  55. Boarnet, M.; Crane, R. The influence of land use on travel behavior: Specification and estimation strategies. Transp. Res. Part A: Policy Pract. 2001, 35, 823–845. [Google Scholar] [CrossRef]
  56. Ewing, R.; Cervero, R. Travel and the built environment: A synthesis. Transp. Res. Rec.: J. Transp. Res. Board 2001, 1780, 87–114. [Google Scholar] [CrossRef]
  57. Holtzclaw, J.; Clear, R.; Dittmar, H.; Goldstein, D.; Haas, P. Location efficiency: Neighborhood and socio-economic characteristics determine auto ownership and use-studies in chicago, los angeles and san francisco. Transp. Plan. Technol. 2002, 25, 1–27. [Google Scholar] [CrossRef]
  58. Frank, L.D.; Stone, B.; Bachman, W. Linking land use with household vehicle emissions in the central puget sound: Methodological framework and findings. Transp. Res. Part D: Transp. Environ. 2000, 5, 173–196. [Google Scholar] [CrossRef]
  59. Frank, L.D.; Engelke, P. Multiple impacts of the built environment on public health: Walkable places and the exposure to air pollution. Int. Reg. Sci. Rev. 2005, 28, 193–216. [Google Scholar] [CrossRef]
  60. Frumkin, H.; Frank, L.; Jackson, R. The Public Health Impacts of Sprawl; Island Press: Washington, DC, USA, 2004. [Google Scholar]
  61. Duncan, D.T.; Aldstadt, J.; Whalen, J.; Melly, S.J.; Gortmaker, S.L. Validation of walk score® for estimating neighborhood walkability: An analysis of four us metropolitan areas. Int. J. Environ. Res. Public Health 2011, 8, 4160–4179. [Google Scholar] [CrossRef] [PubMed]
  62. Carr, L.J.; Dunsiger, S.I.; Marcus, B.H. Walk score™ as a global estimate of neighborhood walkability. Am. J. Prev. Med. 2010, 39, 460–463. [Google Scholar] [CrossRef] [PubMed]
  63. Glaeser, E.L.; Kolko, J.; Saiz, A. Consumer city. J. Econ. Geogr. 2001, 1, 27–50. [Google Scholar] [CrossRef]
  64. Moos, M. From gentrification to youthification? The increasing importance of young age in delineating high-density living. Urban Stud. 2015. [Google Scholar] [CrossRef]
  65. Moos, M. “Generationed” space: Societal restructuring and young adults’ changing residential location patterns. Can. Geogr. 2014, 58, 11–33. [Google Scholar] [CrossRef]
  66. Meligrana, J.; Skaburskis, A. Extent, location and profiles of continuing gentrification in canadian metropolitan areas, 1981–2001. Urban Stud. 2005, 42, 1569–1592. [Google Scholar] [CrossRef]
  67. Yen, I.H.; Kaplan, G.A. Poverty area residence and changes in physical activity level: Evidence from the alameda county study. Am. J. Public Health 1998, 88, 1709–1712. [Google Scholar] [CrossRef] [PubMed]
  68. Jackson, R.J.; Kochtitzky, C. Creating a healthy environment: The Impact of the Built Environment on Public Health; Sprawl Watch Clearinghouse: Washington, DC, USA, 2001. [Google Scholar]
  69. Zhang, Q.; Wang, Y. Trends in the association between obesity and socioeconomic status in us adults: 1971 to 2000. Obes. Res. 2004, 12, 1622–1632. [Google Scholar] [CrossRef] [PubMed]
  70. Townsend, M.S. Obesity in low-income communities: Prevalence, effects, a place to begin. J. Am. Diet. Assoc. 2006, 106, 34–37. [Google Scholar] [CrossRef] [PubMed]
  71. Winkleby, M.A.; Jatulis, D.E.; Frank, E.; Fortmann, S.P. Socioeconomic status and health: How education, income, and occupation contribute to risk factors for cardiovascular disease. Am. J. Public Health 1992, 82, 816–820. [Google Scholar] [CrossRef] [PubMed]
  72. Handy, S.; Cao, X.; Mokhtarian, P.L. Self-selection in the relationship between the built environment and walking: Empirical evidence from northern california. J. Am. Plan. Assoc. 2006, 72, 55–74. [Google Scholar] [CrossRef]
  73. Li, W.; Joh, K.; Lee, C.; Kim, J.-H.; Park, H.; Woo, A. Assessing benefits of neighborhood walkability to single-family property values a spatial hedonic study in austin, texas. J. Plan. Educ. Res. 2015, 35, 471–488. [Google Scholar] [CrossRef]
  74. Rauterkus, S.Y.; Miller, N. Residential land values and walkability. J. Sustain. Real Estate 2011, 3, 23–43. [Google Scholar]
  75. Litman, T. Economic value of walkability. Transp. Res. Rec.: J. Transp. Res. Board 2003, 1828, 3–11. [Google Scholar] [CrossRef]
  76. Koschinsky, J.; Talen, E.; Alfonzo, M.; Lee, S. How walkable is walker’s paradise? Environ. Plan. B: Plan. Des. 2016. [Google Scholar] [CrossRef]
  77. Carr, L.J.; Dunsiger, S.I.; Marcus, B.H. Validation of walk score for estimating access to walkable amenities. Br. J. Sports Med. 2010, 45, 1144–1148. [Google Scholar] [CrossRef] [PubMed]
  78. Duncan, D.T.; Aldstadt, J.; Whalen, J.; Melly, S.J. Validation of walk scores and transit scores for estimating neighborhood walkability and transit availability: A small-area analysis. GeoJournal 2013, 78, 407–416. [Google Scholar] [CrossRef]
  79. Hirsch, J.A.; Moore, K.A.; Evenson, K.R.; Rodriguez, D.A.; Roux, A.V.D. Walk score® and transit score® and walking in the multi-ethnic study of atherosclerosis. Am. J. Prev. Med. 2013, 45, 158–166. [Google Scholar] [CrossRef] [PubMed]
  80. Dong, H. Were home prices in new urbanist neighborhoods more resilient in the recent housing downturn? J. Plan. Educ. Res. 2014, 35, 5–18. [Google Scholar] [CrossRef]
  81. Ewing, R.; Cervero, R. Travel and the built environment: A meta-analysis. J. Am. Plan. Assoc. 2010, 76, 265–294. [Google Scholar] [CrossRef]
  82. Zhu, X.; Lee, C. Correlates of walking to school and implications for public policies: Survey results from parents of elementary school children in Austin, Texas. J. Public Health Policy 2009, 30, S177–S202. [Google Scholar] [CrossRef] [PubMed]
  83. U.S. Census Bureau. Available online: http://www.census.gov/2010census (accessed on 3 November 2015).
  84. Forbes. Available online: http://www.forbes.com/pictures/emeg45iikm/1-austin-texas (accessed on 10 November 2015).
  85. City of Austin. City of Austin Demographic Profile. Available online: http://www.austintexas.gov/page/demographic-data (accessed on 28 March 2016).
  86. Governing. Gentrification in America Report. Available online: http://www.governing.com/gov-data/census/gentrification-in-cities-governing-report.html (accessed on 1 April 2016).
  87. Zhu, X.; Lee, C. Walkability and safety around elementary schools: Economic and ethnic disparities. Am. J. Prev. Med. 2008, 34, 282–290. [Google Scholar] [CrossRef] [PubMed]
  88. Walk Score. Available online: https://www.walkscore.com (accessed on 2 December 2015).
  89. Ewing, R.; Schroeer, W.; Greene, W. School location and student travel analysis of factors affecting mode choice. Transp. Res. Rec.: J. Transp. Res. Board 2004, 1895, 55–63. [Google Scholar] [CrossRef]
  90. Ewing, R.; Forinash, C.V.; Schroeer, W. Neighborhood Schools and Sidewalk Connections: What Are the Impacts on Travel Mode Choice and Vehicle Emissions? TR News, 2005; Volume 237, 4–10. [Google Scholar]
  91. Boarnet, M.G.; Anderson, C.L.; Day, K.; McMillan, T.; Alfonzo, M. Evaluation of the california safe routes to school legislation: Urban form changes and children’s active transportation to school. Am. J. Prev. Med. 2005, 28, 134–140. [Google Scholar] [CrossRef] [PubMed]
Figure 1. Block group Walk Scores and locations of LIHTC and PH households, Austin, Texas.
Sustainability 08 00396 g001
Figure 2. (a) Gentrification in Austin: 2000 Census–Present [86]; (b) Age groups in Austin.
Sustainability 08 00396 g002
Figure 3. (a) Sidewalks (rate); (b) bike lanes (rate); (c) highways (%); (d) major roads (%).
Sustainability 08 00396 g003
Table 1. Block group sample characteristics.
VariablesTotalLIHTC NeighborhoodsPH Neighborhoods
NMeanS.D.NMeanS.D.NMeanS.D.
Minority (%)50041.2427.444270.4622.791467.4029.79
Income ($1000)50650.2027.944233.8014.681428.7110.36
Median Housing Value ($1000)506136.3397.224293.84103.381496.1035.07
Unemployment (%)4984.334.12426.514.15148.876.57
Female-Headed Family (%)48121.9417.924233.7516.631446.2824.57
Teenage School Dropout (%)47215.3120.714223.5316.851426.8324.78
Welfare Receipt (%)4951.792.83423.213.54146.455.69
Table 2. Results of t-tests on the walk score between non-LIHTC versus LIHTC neighborhoods, and between non-PH versus PH neighborhoods.
VariableLIHTC NeighborhoodsPH Neighborhoods
Non-LIHTC (N = 410)LIHTC (N = 41)Diff. in MeanNon-PH (N = 437)PH (N = 14)Diff. in Mean
MeanS.D.MeanS.D.MeanS.D.MeanS.D.
Walk Score47.1724.7637.4621.139.71 **45.8524.4960.0424.61−14.19 **
** p < 0.05 (two-tailed test).
Table 3. Results of t-tests on the built environmental characteristics between non-LIHTC versus LIHTC neighborhoods, and between non-PH versus PH neighborhoods.
Non-LIHTC Neighborhoods (N = 452)LIHTC Neighborhoods (N = 42)Diff. in MeanNon-PH Neighborhoods (N = 480)PH Neighborhoods (N = 14)Diff. inMean
MeanS.D.MeanS.D.MeanS.D.MeanS.D.
Sidewalks (rate)0.5790.2080.5160.1830.063 *0.5720.2090.6330.106−0.062
Bike Lanes (rate)0.2400.2770.2620.201−0.0210.2400.2720.2960.238−0.055
Highways (%)0.0590.1160.1080.126−0.049 ***0.0650.1190.0140.0300.050
Major Roads (%)0.1830.1540.1960.110−0.0130.1840.1520.1670.1100.017
*** p < 0.01; * p < 0.10 (two-tailed test).
Table 4. Base model results for LIHTC and PH neighborhoods.
VariablesLIHTC NeighborhoodsPH Neighborhoods
Odds Ratiop > |z|Odds Ratiop > |z|
Socio-Demographic Variables
Minority (%)1.057 ***0.0011.0100.533
Income ($1000)0.957 ***0.0220.9800.513
Median Housing Value ($1000)1.009 **0.0091.0040.572
Unemployment (%)0.9730.5601.0110.871
Female-Headed Family (%)1.030 **0.0201.033 **0.042
Teenage School Dropout (%)0.9850.1071.0030.799
Welfare Receipt (%)0.896 *0.0721.1180.157
Locatoinal Variables
Distance to CBD (mile)1.056 *0.0720.8960.480
Number of Observations460460
LR Chi63.0530.87
Pro > Chi-Sq<0.00010.0001
Pseudo R20.22430.2608
*** p < 0.01; ** p < 0.05; * p < 0.10.
Table 5. Results of one-by-one models and final model for LIHTC and PH neighborhoods.
VariablesLIHTC NeighborhoodsPH Neighborhoods
One-by-One Models Final ModelOne-by-One Models Final Model
ORP > |z|ORP > |z|ORP > |z|ORP > |z|
Socio-Demographic Variables
Minority (%) 1.05 ***<0.000 1.020.409
Income ($1000) 0.94 **0.013 0.990.773
Median Housing Value ($1000) 1.01 **0.030 1.000.827
Unemployment (%) 0.980.700 0.990.926
Female-Headed Family (%) 1.03 **0.016 1.03**0.045
Teenage School Dropout (%) 0.98 **0.047 1.000.866
Welfare Receipt (%) 0.900.119 1.150.120
Locational Variables
Distance to CBD (mile) 1.010.919 0.990.974
Walk Score
Walk Score (1 to 100)0.96 ****< 0.0000.96 ***<0.0001.01***0.4261.020.376
Built Environmental Variables
Sidewalks (rate) 0.14 ***0.0411.070.9677.390.2960.220.613
Bike Lanes (rate)0.760.6190.720.6821.380.7871.140.924
Highways (%)1.03 **0.0121.04 **0.0480.930.2420.930.279
Major Roads (%)1.020.2731.05 **0.0160.970.2610.960.266
Number of Observations - 420 - 420
LR Chi - 85.85 - 34.01
Pro > Chi-Sq - <0.000 - 0.0012
Pseudo R2 - 0.3196 - 0.2700
: All the associations were adjusted by the covariates including minority, median household income, unemployment, female-headed family, welfare receipt, teenage school dropout, distance to CBD, and Walk Score. *** p < 0.01; ** p < 0.05 (two-tailed test).

