Article

An Approach to Assess the Effectiveness of Smart Growth in Achieving Sustainable Development

by
Ishak Mohammed
*,
Habib M. Alshuwaikhat
* and
Yusuf A. Adenle
Department of City and Regional Planning, King Fahd University of Petroleum & Minerals, KFUPM Box 1632, Dhahran 31261, Saudi Arabia
*
Authors to whom correspondence should be addressed.
Sustainability 2016, 8(4), 397; https://doi.org/10.3390/su8040397
Submission received: 11 February 2016 / Revised: 17 April 2016 / Accepted: 19 April 2016 / Published: 22 April 2016

Abstract

:
Smart Growth has become an evident concept in public policy debates and provides answers to the enduring problems of sprawling development and its many adverse consequences. While the concept has widely been touted to promote an urban development pattern characterized by compact and mixed-use development, walkable and bikeable neighborhoods, preserved green spaces, and the availability of mass transit, not much has been written about its contribution to sustainable development. This paper is an attempt to explore the concepts of smart growth and sustainable development and the extent to which the former contributes to the achievement of the latter. The various debates surrounding the smart growth movement have also been explored. The 2003 general plan guideline by the US State of California is used as the basis for determining the sustainable development role of smart growth policies in Portland (Oregon), Arlington (Virginia), Boulder (Colorado) and Lancaster County (Pennsylvania). The paper concludes that it would be inappropriate to equate smart growth to sustainable development as the latter is a much broader concept and cuts across myriad disciplines. Notwithstanding, the implementation of smart growth policies in the cases studied have been observed to promote compact, infill and transit-oriented development and to conserve and protect open spaces and natural areas. All these are pro-sustainable development. While this paper has observed that smart growth serves as one of the approaches for achieving sustainable development goals, it calls for a more quantitative study to be able to measure the magnitude of the contribution associated with the smart growth policies.

1. Introduction

Urban sprawl is a visually perceivable landscape phenomenon and represents an important topic for analysis and assessment towards the sustainable development of urban areas [1,2,3,4]. In Burchell and Galley [5] (p. 151), sprawl is defined as “ low-density, leapfrog development characterized by unlimited outward extension. In other words, sprawl is a significant residential or nonresidential development in a relatively pristine setting. In nearly every instance, this development is low density, it has leaped over other development to become established in an outlying area, and its very location indicates that it is unbounded”. The more heavily permeated a landscape by buildings, the more sprawled the landscape. Urban sprawl therefore denotes the extent of the area that is built up and its dispersion in the landscape. The more area built over and the more dispersed the buildings, the higher the degree of urban sprawl. The term “urban sprawl” can be used to describe both a state (the degree of sprawl in a landscape) as well as a process (increasing sprawl in a landscape).
Environmental impacts and challenges of urban growth have grown in complexity, engendering significant disparities between cities and their hinterlands. Towards addressing excessive suburban expansion, the concept of Smart Growth has emerged as one of the popular movements to fight against suburbanization in many countries, cities and towns around the world. Emerging in the 1990s, the concept represents an approach to urban design that promotes compact development and aims to reduce development in environmentally and culturally sensitive areas by limiting the expansion of communities into outlying areas and redirecting private investment to urban areas [6].
The persistent dissatisfaction with sprawl development patterns and its associated social and fiscal costs has therefore led to an explosion in innovative thinking and action across the world. It is this new development model that has commonly been referred to as “Smart Growth” [7]. Its importance lies in the fact that it allows for community growth in ways that ensures economic development and improved job opportunities; the creation of a more vibrant neighborhoods with a wide range of residential, commercial and transportation options; and the achievement of communities that are healthy and environmentally clean. The ideas advanced under the concept of smart growth cover a wide spectrum and range from the revitalization of cities and towns to growth where the value of more development is perceived to offset the potential undesirable consequences.
While a significant amount of literature abounds on the concept, not much effort has been committed into explicitly assessing the extent to which smart growth contributes to sustainable development. This paper assesses the smart growth concept and explores its effectiveness in promoting sustainable development. The debate surrounding the concept is also examined. The paper seeks to provide responses to the following research questions: (a) What is the connection between the concepts of smart growth and sustainable development? (b) What are the debates associated with the implementation of smart growth policies? (c) How can the effectiveness of smart growth in achieving sustainable development be assessed?

2. Methodology

This paper reviews literature on the concepts of sustainable development and smart growth and attempts to establish whether or not smart growth contributes to the achievement of sustainable development goals. While both concepts have widely been written about, not much has been done to assess the extent to which sustainable development is achieved through the implementation of smart growth policies. The sustainable urban development goals outlined in the 2003 General Plan Guideline of the state of California [8] have been compared with the principles of smart growth so as to establish their convergence. While the authors acknowledge the release of the 2015 draft general plan guidelines, the 2003 version provides a more comprehensive and clear connection between sustainable urban planning goals and the respective planning policies to promote livable communities. Case studies of the implementation of smart growth policies in Portland (Oregon), Arlington (Virginia), Boulder (Colorado) and Lancaster County (Pennsylvania) have been used to assess the extent to which urban sustainable development policies are achieved through smart growth policies. The researchers understand that smart growth principles are not broad enough to offer a more comprehensive comparison of how smart growth policy implementation leads to the achievement of sustainable development. Nonetheless, juxtaposing the principles with the goals of sustainable urban development potentially represents an important starting point. Figure 1 below is a diagrammatic representation of the approach adopted in this paper.

3. Sustainable Development vs. Smart Growth

The definition of the term “sustainable development” has been widely contested. Nonetheless, the 1987 definition by the United Nations World Commission on Environment and Development (WCED) [9] (p. 43) is the most widely used. It is “development that meets the needs of the present generation without compromising the ability of future generations to meet their own needs”. According to the Sustainable Urban Development Group, sustainable communities are those that flourish because they are governed in a responsible and responsive manner and build a mutually supportive, dynamic balance between social wellbeing, economic opportunity, and environmental quality within a larger global framework of sustainable development. American Society of Civil Engineers (ASCE) [10] also defines sustainable development as the challenge of meeting human needs for natural resources, industrial products, energy, food, transportation, shelter, and effective waste management while conserving and protecting environmental quality and the natural resource base essential for future development. It is discerned from these definitions that the fundamental goal of sustainable development is inter-generational equity and calls for justice to generations yet unborn. Towards achieving the goal, the WCED attempted to put together various societal values to tackle the challenges of reducing poverty, deprivation and overconsumption. It is these values that have come to be known as the “3Es” of sustainable development, consisting of the economy, equity and environment [11]. It posits that a decision to promote economic development should not lead to a decrease in the quality of the environment or social equity. Rather, the decision or action should be capable of promoting all the 3Es. In other words, conventional economic imperative to maximize economic development should make adequate provision for the protection of the environment and promote social equity by minimizing human suffering and deprivation [11,12].
Notwithstanding the rather simple definition of the concept of sustainable development, there seem to be no universal concurrence on how the concept should be translated into practice. While there is no doubt about its ever-increasing popularity, the implementation is not immediately obvious [11,12]. There is a general sense in the planning profession that sustainability is a laudable holistic vision and efforts focused on translating the concept of sustainable development are emerging. By definition, urban planning is deemed sustainable if the built environment becomes more livable; ecosystems get enhanced and protected; economic development becomes more sensitive to the needs of place as opposed to advancing the gains of the elite; and the benefits of improved economic and environmental conditions become more fairly distributed [11]. In the 2003 general plan guideline of the US State of California, a community is said to be sustainable when the neighborhood becomes the foundation of urban design and is characterized by mixed-use development, walkability and mixed-income housing. While the operationalization of sustainable development in planning could be looked at in many diverse ways, attempts to integrate sustainable development into urban planning have largely been linked to the concept of smart growth. While the relationship between the two concepts remains debatable, some writers maintain that smart growth is similar to sustainable development [13].
Smart Growth has become an important concept in public policy discourses and provides answers to the enduring problems of sprawling development and its many adverse consequences. It represents a paradigm shift and a broad rethinking of the consequences of unchecked urban growth [6,14,15]. Emerging in the 1990s, it offers a convincing vision of how to revitalize urban areas and ensure economic competiveness and improved environmental quality. In most urban areas around the world, conventional low-density development pattern has been successful in causing transportation problems, environmental degradation, and have led to the loss of farmlands, natural areas and open spaces. It is this nuisance that has called for innovative thinking and action across the world and generally been referred to as “Smart Growth” [7].
It is built on a set of principles that provide guidance to communities and neighborhoods in their efforts to promote development activities that yield improved quality of life, environmental preservation, economic revitalization, and sense of community. It discourages potential urban development patterns that work independent of communities’ vision and result in neighborhoods, transportation options, industrial corridors, quality of life resources and businesses that are incompatible and inconsistent. Smart Growth America defines the concept as building urban, suburban and rural communities with housing and transportation choices near jobs, shops and schools. This definition not only emphasizes the promotion of local economies but also the creation of neighborhoods that are safe, beautiful and within easy reach to shops and other institutions. As the only national organization devoted to supporting, researching, promoting and providing leadership for smart growth coalitions in the United States, Smart Growth America has the following federal policy priorities: (1) support stronger, more economically competitive communities; (2) ensure a more accountable and safer transportation system; (3) improve programs that waste taxpayer dollars and encourage costly development; (4) create opportunity in underserved communities; (5) protect water; and (6) revitalize communities. Among others, the State of Maryland has one of the popular efforts at promoting smart growth development in North America. According to Knaap et al. [16], the state’s smart growth legislation is dedicated to restricting sprawl through neighborhood restoration and revitalization and the direction of growth towards existing developed areas. In order to discourage outlying developments and to protect farmlands, open spaces and natural resources, state funds were channeled towards projects in locations granted for redevelopment as well as growth in line with the Priority Funding Areas. At the national level, the Obama Administration aims to support community development programs with remarkable increase in capital for neighborhood revitalization and the funding of Brownfield programs.
Unlike the case in Porter and Downs [13,17], the smart growth principles consist of broader themes. In its extensively cited publication, “Getting to Smart Growth”, the Smart Growth Network [18] outlines ten principles of smart growth, which include: (a) mixed-use development; (b) compact development/building design; (c) range of housing choices and opportunities; (d) creation of neighborhoods that are walkable; (e) fostering of unique and attractive communities with a strong sense of place; (f) the preservation of farmlands, open spaces, natural beauty and important environmental areas; (g) intensifying and directing development towards existing communities; (h) provision of a variety of transportation options; (i) making development decisions predictable, cost-effective and fair; and (j) encouraging community and stakeholder participation in development decisions.

4. Debates on the Effectiveness of Smart Growth Policies

The smart growth movement has been a source of increasing controversy in urban planning discussions. Arguments in favor of smart growth have often been centered on infrastructure and public service cost savings, transportation costs savings, congestion impacts, economic development, and environmental protection and preservation [19,20,21,22,23]. With the building of compact neighborhoods and communities, the need for additional government expenditure in providing services and infrastructure beyond urban or community boundaries is reduced [19,20,21]. Conventional communities with single-use and low-density development patterns have been reported to be financially burdened by the maintenance and replacement costs of existing infrastructure. In contrast, higher density development makes efficient use of land and requires lesser roadway area and shorter utility run. Similarly, it makes it possible for communities and neighborhoods to be more easily accessed by guaranteeing alternative travel options such as public transit, cycling and walking. Litman [22] argues that smart growth community residents typically own between 10 and 30 percent fewer vehicles and drive between 20 and 40 percent fewer annual miles than in sprawling, auto-dependent communities. The implementation of smart growth policies reduces automobile dependency and helps urbanites avoid the high cost of fuel, insurance premiums and parking. It is particularly helpful to the economically, physically and socially underprivileged people who tend to be limited in their ability to drive and reduces the portion of household budgets devoted to transportation [23].
Further, smart growth allows for the development of the local economy through increased productivity, property values, business activity, and tax revenue. These are largely evident in the benefits and savings that result from efficient public services and infrastructure provision, agglomeration efficiencies, and improved accessibility which reduce costs of transportation and decrease per capita land consumption. Commercial uses in close proximity to residential neighborhoods also have higher property values and thus make it possible for the generation of more local taxes. Businesses recognize the advantages associated with areas able to draw people together because of different uses as more economic activity exists when there are more people in an area to shop.
The fact that sprawl leads to several environmental problems ranging from the loss of open space and encroachment on suburban lands to the emission of pollutants through high rates of automobile use is also important [24]. By restricting growth beyond community boundaries and encouraging infill development with walkable, compact streets and lot design integrated with or closer to community amenities, jobs, and shopping center, smart growth helps to protect and conserve open spaces and suburban agricultural lands. Its discouragement of high auto-dependence also helps to reduce air pollution associated with increased auto-mobile use. As more people shift from using their individual vehicles to other transportation options provided by the government, their per capita emission is eventually reduced and this consequently improves the quality of the environment and community health.
Notwithstanding the benefits above, critics have argued that sprawl reflects the preferences of community dwellers and that smart growth contradicts market demand [25]. According to Williamson [26], there are several reasons that inform people’s decisions on where they want to live. He argues that suburbs provide myriad benefits such as reduced land costs, less congested roads, improved access to private yards with gardens and play areas, and access to a wide range of low-cost consumer goods and services. Other often cited benefits associated with suburban living include access to better schools and reduced crime. Further, as people move to outlying areas, employers followed them; and commute times have remained fairly unchanged notwithstanding suburban expansions [25]). It is argued also that the decentralization of firms and households raises average travel speeds enough to compensate for longer trips. Ewing [27] however debunks the above claims providing evidence to suggest otherwise. During the 1980s, average commute times got worse in 35 out of the 39 metropolitan areas with population of more than one million. By the end of the decade, the commute time in the suburbs were observed to be significantly greater than in central cities [28]. By increasing density and advocating compact development, smart growth worsens traffic congestion and high pollution problems already prevalent in sprawling urban areas [25,29,30]. In the United States, Cox and Consultancy [29] argue that urban areas now extend for miles and miles, and trip origins and destinations are so far and wide that public transportation systems are hardly capable of serving all trips. What is more, distances of travel are simply too long to justify walking and bicycling. It is important to note however that, while smart growth has somewhat been criticized on the grounds of urban traffic congestion, the situation in the suburbs is often as bad as in downtown locations due to the somewhat poor street connectivity.
Elsewhere, it is also held that smart growth policies are oppressive, restrict property owners’ rights and freedoms, and constitute “social engineering” through the imposition of needless regulations [26]. Often, details such as external colors and tree plantings are required to meet the endorsement of a neighborhood committee. By this, smart growth ignores the diversity of human preferences. What the critics fail to acknowledge however is the fact that strict guidelines and review requirements are rather features of Homeowner Associations (HOAs) governing master-planned communities and neighborhoods. Similarly, while some residents do indeed like high-density “walkable” communities and neighborhoods, others prefer to have more space and more peace and quiet. Neither preference is inherently superior to the other. It is thus held that Smart growth fails to celebrate diversity. This criticism is, however, not necessarily true. When well done, smart growth policies rather emphasize a variety of land uses and dwelling units capable of assuring greater diversity of residents than conventional suburbia. Contrary to what most smart growth policies try to accomplish, developers tend to prefer development in outlying areas due to their comparatively lower land costs, the ease of access and construction, and potential for larger parcel assembly. Typical zoning requirements in such areas are often easier to fulfill due to the few existing building types that new construction must complement. The likelihood of people objecting to disruption and inconveniences that new constructions bring is thus low as only few people inhabit such areas.
While some of the arguments against smart growth are undoubtedly legitimate, they are scarcely able to provide enough justifications that warrant the nullification of the Smart Growth philosophy. Rather, they offer useful insights into strategies that should be adopted to improve the social, economic and environmental effectiveness of smart growth policies.

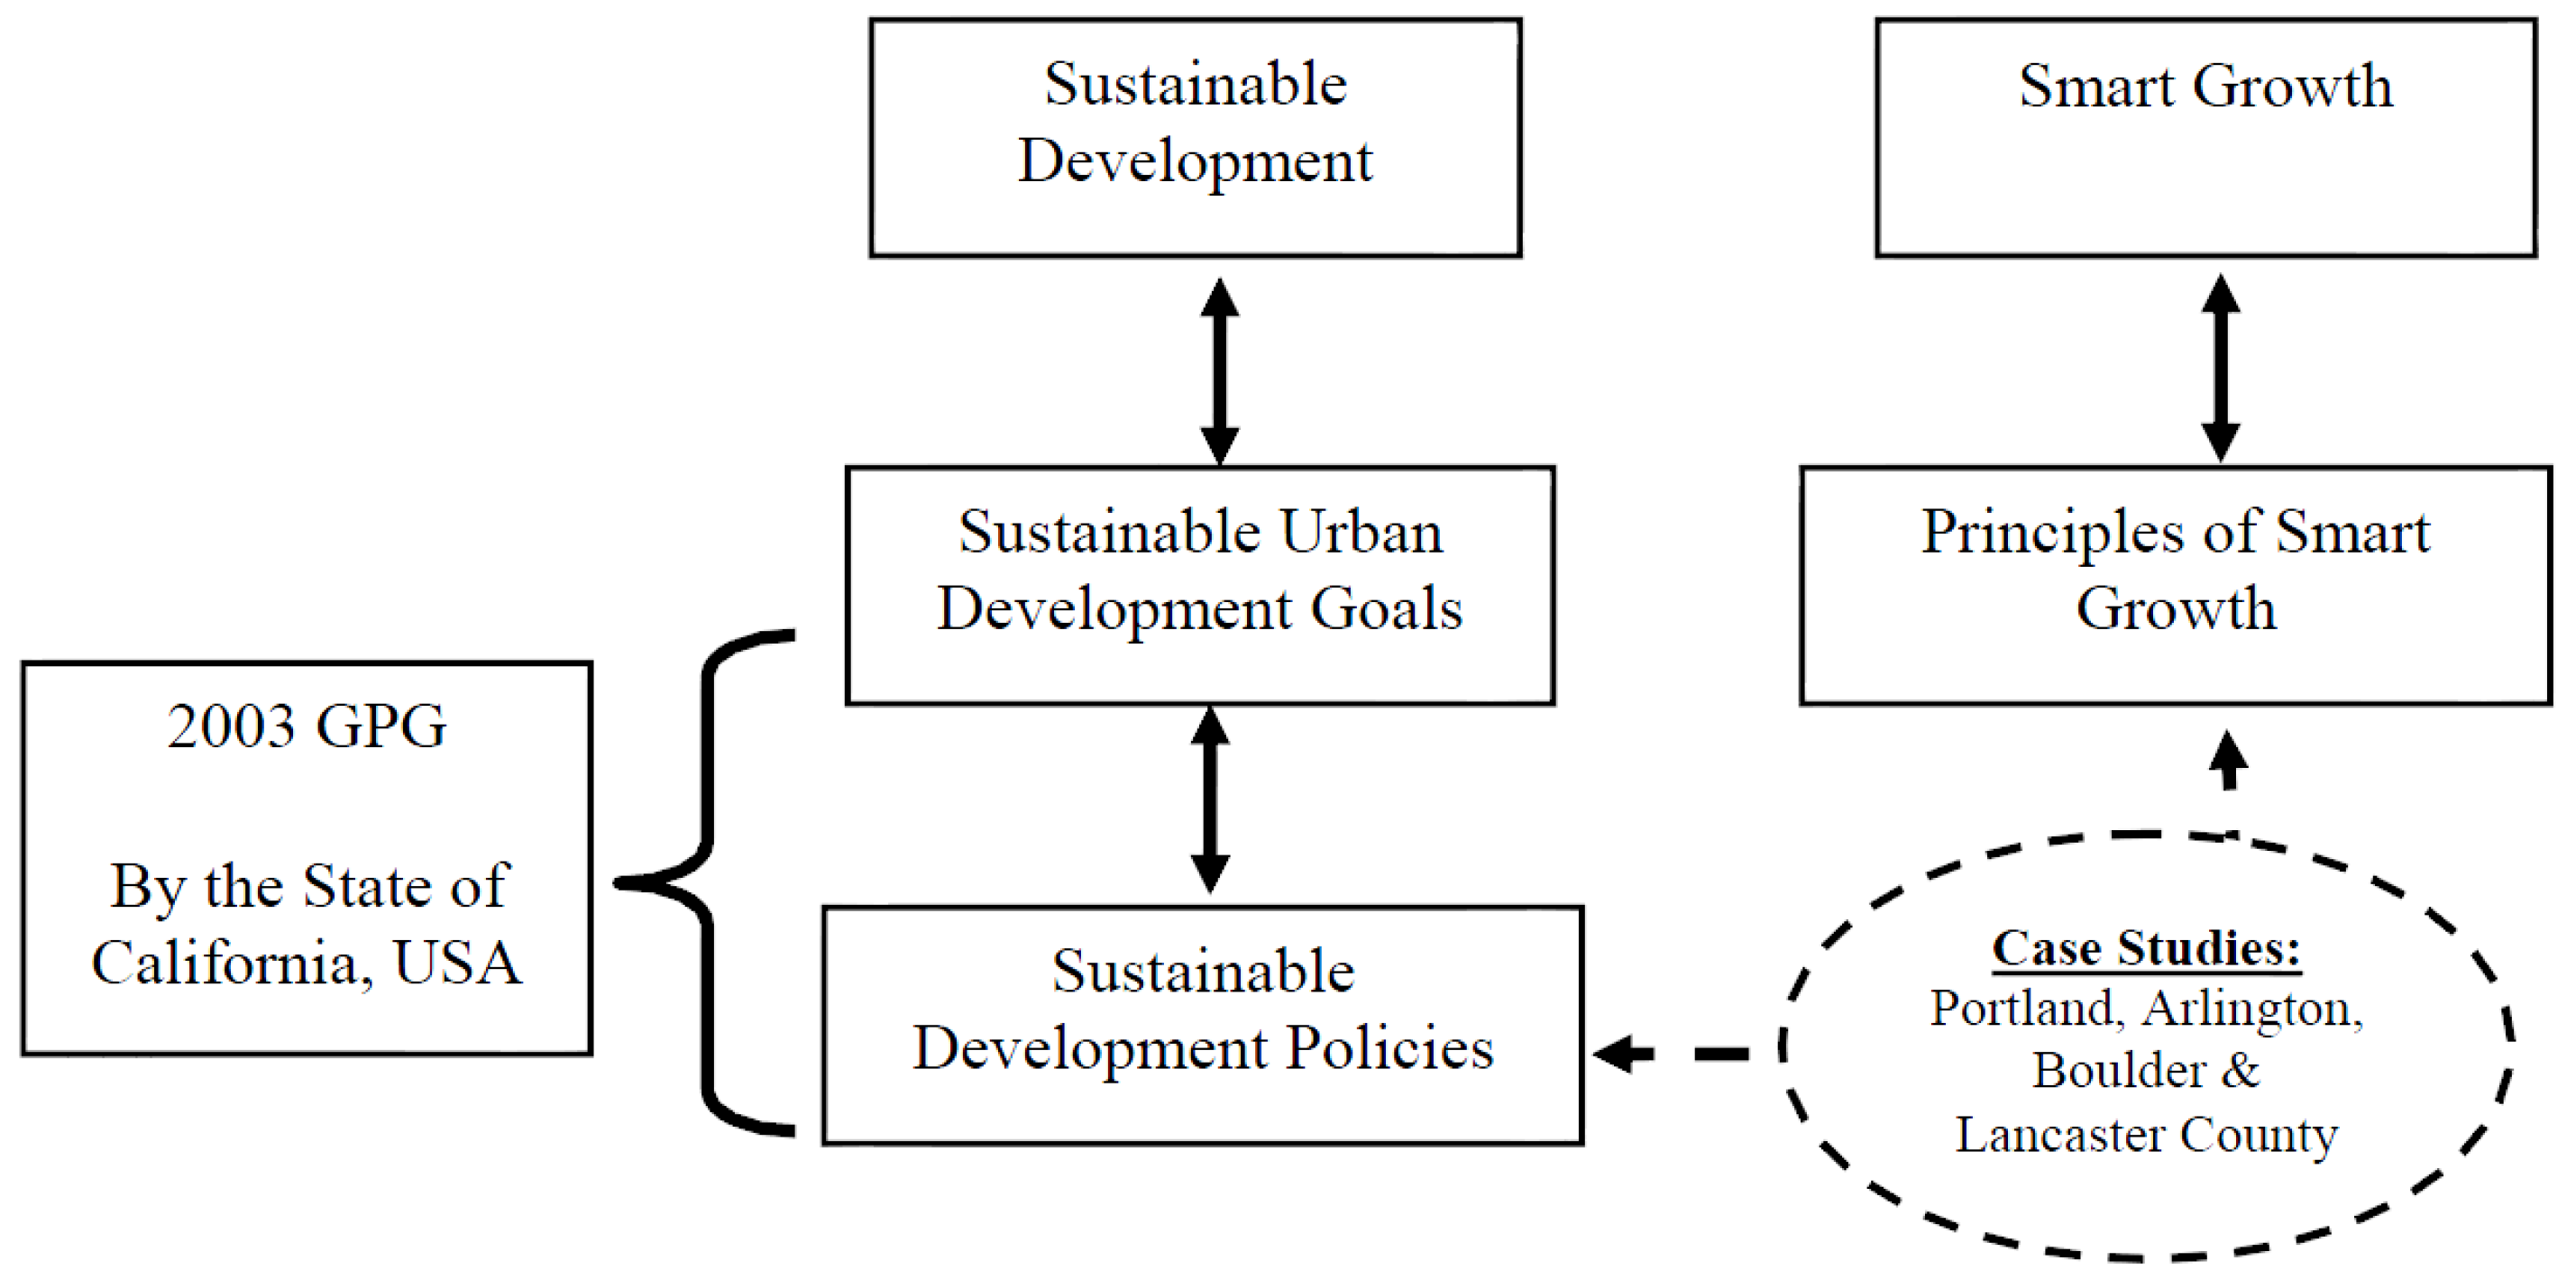
5. Linking Smart Growth and Sustainable Development

In simple terms, the relationship between smart growth and sustainable development is perhaps reflected in the fact that, both are concerned about the degradation of the environment and resource exhaustion and that one concept is essentially the approach to reaching the other. Porter [13] argues that the aims of sustainable development are evident in the principles of smart growth. The Municipal Research and Services Center (MRSC) also see the two concepts to be used interchangeably. Specifically, they define smart growth to be development that is community-oriented and sustainable, economically viable and environmentally sensitive. There are further arguments that suggest that both concepts have parallel definitions. The American Environmental Protection Agency (EPA) for instance, defines smart growth as “development that serves the economy, the community, and the environment” ([31], p. 11). This rather broad definition categorizes smart growth into three main objectives that are directly linked to the 3Es of sustainable development earlier highlighted.
In the discussion that follows, relevant case studies are reviewed to assess the extent to which the implementation of smart growth policies helps to achieve sustainable urban development policies. Table 1 and Table 2 below provide a summary of the relationships between sustainability dimensions, indicators, sustainable urban development goals and smart growth principles adopted from the 2003 General Plan Guidelines [8] for the State of California in the US and Yang [32]. While the goals and the principles vary slightly, the polices for achieving sustainable development and smart growth are somewhat similar. Even though sustainable development is much broader, it is apparent that smart growth represents one of the approaches through which urban sustainability can be achieved.

6. The Application of Smart Growth Policies: A Review of Relevant Case Studies

The concept of smart growth has been variously applied in many cities around the world and in the US cities and counties in particular. However, not much has been done to measure the extent to which the implementation of smart growth principles compliments sustainable development goals. This section relies on the goals of smart growth to explore the connection between sustainable development goals and smart growth implementation efforts in Portland (Oregon), Arlington (Virginia), Boulder (Colorado) and Lancaster County (Pennsylvania).

6.1. Portland, Oregon

For years, Portland, Oregon has gained recognition as one of the world’s leaders in the urban philosophy of smart growth, a model that advocates for compact development, high density urban areas and the use of mass transit instead of private automobile. The initial goals and guidelines called for the drawing of an urban growth limit sizeable enough to contain 20 years worth of growth [33], making Oregon the reigning model for regional planning and growth management. The delineation of urban growth boundaries in the city represents a key component of a regional strategy directed at increasing and promoting compact and high-density development and redirecting investment into the urban core. The establishment of growth limits was seen as an important part of the efforts to manage growth and represents a way to ensure orderliness in rural-urban land use transition and to provide protection for farmlands [34].
In order to meet population targets, many neighborhoods that were originally characterized by single-family homes were rezoned and many backyards rapidly became buildable sites for housing [33]. In the past, residential zoning were flexible and designed such that the maximum allowable densities per acre could be two, four or eight housing units with any minimum densities. Under the smart growth agenda, however, the metro directed that all zoning in Portland area should have minimum densities of at least 80 percent of the maximum densities allowable. This consequently called for the redevelopment of undeveloped lots initially developed as single family homes into row-houses or small apartments. From 1994 to 1997, Anderson [34] reports that densities in Portland increased on average from five homes/acre to eight homes/acre. Similarly, land absorption was observed to be declining steadily due to an increase in multifamily housing units from 25 percent in 1992 to 49 percent in 1997. Another important effort to promote smart development in Portland and set a framework for the region’s development pattern is reflected in the Metro 2040 Growth concept approved in 1995. It builds on the land use designations adopted in the 1980 comprehensive plan of the city and emphasizes the concentration of growth through the promotion of multi-modal transportation system, efficient land use, and the protection of farmland and natural areas. Specifically, it advocated for the concentration of commercial and residential development in and around mixed-use areas, corridors, main streets and in light rail station communities. Rather than growing out of the growth boundaries, the plan gave new emphasis to “growing up”, focusing growth in the downtown areas, in seven designated regional centers, 27 town centers, as well as in a number of rail station communities and along arterials and roads [35]. Despite some implementation challenges, the metro reports that Portland has through the 2040 growth concept been able to capture over a third of the region’s new housing starts, averaging 36 percent of the new residential growth. Over a 10-year period, about 100 mixed use, transit oriented developments have also been built and new housing developments in the River and Pearl districts are using less land to provide more housing than anticipated.
Even though Portland is well-known for its successful examples of growth management efforts, the effectiveness of such efforts has been widely debated. In an attempt to assess the extent to which sprawl development has been controlled, automobile usage curtailed and mobility maintained, Jun [36] concludes that urban growth boundaries have scarcely been successful. From a total of 32 metropolitan areas compared, Portland ranked eighth and ninth as the fastest growing metropolis in terms of land area and urbanized population. These findings undermine the anti-sprawl development and compact development objectives associated with smart growth policies. Similarly, a positive correlation was observed between new housing developments and the distance from the CBD, suggesting that Portland experienced considerable suburbanization of population between 1980 and 2000.
A glimpse of the potential impacts of the growth boundaries on the prices of land and housing was evident after the establishment of Portland’s boundary. Land valued inside the boundary was observed to increase as developers recognized its potential for development [37]. In other words, the stringent adherence to regulations in the enforcement of growth boundaries led to large price increases. Notwithstanding the land price increases, preliminary assessments of the growth management efforts in Portland found little support to suggest there was any impact on the cost of housing. It was noted that the observed increases in the prices of housing reflected national trends, even though prices inside boundaries were somewhat higher than those in the periphery. By the late 1980s and early 1990s, the population growth rates in Portland had tripled relative to the early 1980s, increasing both the demand and price for housing. Anderson [34] reports that between 1990 and 1995, the average home price in the inner city neighborhoods increased from $97,684 to $152,700. Over the same period, the Southeast, Northeast and Northern areas of the city also witnessed the greatest rise in housing prices in the region. The price in North Portland for instance was twice as high, increasing between 1990 and 1995 from $41,300 to $83,800. The trends in the prices of land and housing have both positive and negative implications. Higher prices reflect an incentive for high density development in cities’ inner neighborhoods and suburbs.
There are obviously mixed opinions on the relationship between the effects of compact development on housing prices. There seem not to be a consensus on whether the restriction of outlying growth alone threatens the availability of affordable housing. While there could be myriad other variables contributing to the rising housing prices, the implementation of smart growth policies is no doubt one of the important supply-side constraint in the local housing market. By limiting the availability of developable lands and advocating densification, the boundary is a factor affecting the appreciation of housing prices. This potentially reduces housing affordability. It is suggestive to conclude that while farmland losses have decreased and densities have clearly increased, the implementation of growth limits has somewhat had negative impacts on housing affordability. A summary of the progress of smart growth policy implementation in Portland is presented in Table 3 below.

6.2. Arlington, Virginia

The County of Arlington in Virginia is a national leader in smart growth and transit-oriented development. The implementation of smart growth policies dates back to the periods before 1990s and involved the concentration of mixed-use, high-density development along three major transit corridors, while preserving existing residential neighborhoods and open space [38]. This was accomplished through well-defined land-use policies, zoning and plans that guide development for specific neighborhoods, projects, and the state at large. In Arlington, growth was deemed “smart” when it is capable of creating communities that are attractive and characterized by a range of housing and transportation options in close proximity to places of employment, jobs, schools and services.
Smart growth in the county has been recognized to be good for the local economy, the environment and the people. The most obvious benefits include improved access to public transportation and walkable communities with better restaurants, shopping experience and lively nightlife. Similarly, Arlington has a lower commute time than the region’s average and residents have helped reduce the area’s pollution through high patronage for public transportation. In the Rosslyn-Ballston corridor, one of the primary corridors where high-density and mixed-use development has been implemented, about 40 percent of the residents take public transportation to work. In addition, 16 percent of the residents in Arlington do not own private cars and about six percent prefer to walk to work. Through the biking system, Arlington County [39] reports that there has been improvements in health benefits in the form of reduced obesity, improved environmental conditions and decreased public health problems. In a resident survey conducted in the county in 2012, it was reported that over 90 percent of the residents rate their quality of life as good and about 75 percent are satisfied with improved access and the ease of traveling around due to the availability of bike lanes and routes [40]. In 2003, the Transportation Demand Management (TDM) services program alone resulted in a drop from 63 percent in 2001 to 53 percent of Arlington residents driving alone to work, and a drop from 59 percent in 2001 to 54 percent in 2013 of Arlington workers driving alone in addition to those that come from other jurisdictions. There was also a shift of approximately 45,000 trips from private transportation mode to other modes at peak periods on weekdays and a huge reduction in daily miles traveled by approximately 750,000 miles, and gasoline consumption by 31,000 gallons and pollution by 350 tons per work day [41].
In terms of local economic contribution, the urban villages in Arlington yield approximately $250,000 in taxes per net acre and ranges from $132,000 in Clarendon to $357,000 per acre in Rosslyn [42]. It is important to note that, notwithstanding the high-density development, Arlington has the lowest property tax rate of any jurisdiction in northern Virginia.
In terms of traffic congestion, while the county has experienced major growth, there has been a reduction in traffic due to the improvement in access to various transportation options [43]. The walkable and transit-oriented urban villages give residents and visitors a range of options to easily move around without a car. The various transportation systems available in the county include Metrorails, paratransit service for the aged and people with disability, metrobus, carsharing services, as well as biking and walking. About 23 percent of the people travel by public transit while 39 percent of those residing close to metrorail corridors travel by transit. The national average for the number of people commuting by transit is about five percent, making the progress in Arlington highly impressive [44]. Even though the population of Arlington continues to grow by nearly one percent annually, neighborhood streets and arterial traffic has been rather stable or even declined.
On the issue of housing, the planners in Arlington sought to get as many people within walking distance of the metro through the provision of a variety of housing and businesses in the urban villages. In recent years however, the prices of housing in the county have dramatically increased due to changes that have made Arlington a more desirable place to live and the rise in housing demand due to the county’s proximity to Washington DC [45]. In order to address this challenge, several strategies to offer affordable housing to low-income residents have been adopted. The affordable housing investment fund for instance, provides real estate developers loans for the building of affordable housing. Through zoning ordinances, developers have also been able to build additional density in exchange for the provision of affordable units as a contribution to their Affordable Housing Investment Fund. Another problem the county is also facing is the squeezing out of smaller shops that find it hard to compete with the chain of stores moving into the denser corridor. In order not to lose the county’s unique character, the government is however working to devise means to keep these small-scale businesses along with the larger businesses moving in.
Table 4 below is a summary of the achievement of some of the sustainable development policies in Arlington.

6.3. Boulder, Colorado

Boulder, Colorado has developed a reputation in the States as one of the cities to have creatively addressed the issues of urban growth containment and management [46]. The implementation of growth boundaries has led to the preservation of the physical environment and has been effective in focusing the attention of the community on the relationship between economic development and the services and infrastructure needed to complement such development. Compact and high-density development was promoted through well-defined service areas and the restraint of sprawl development from within the city and from other areas sprawling in the direction of Boulder. As a result of the rapidly rising population in the 1960s and 1980s, local officials felt the need to examine growth management mechanisms that are capable of maintaining the county’s unique character and preserving open spaces. Community service boundaries together with restrictive regulations and ordinances were used to ostensibly increase urban densities, protect open space, ensure the efficient provision of infrastructure, preserve life quality and promote a sense of community and place [47,48].
The 1978 plan was also implemented to protect the city against outlying development that would increase demand on city public services without the ability to raise taxes to fund such services [49]. The plan was intended to control suburbanization, protect rural land uses and the natural environment, and to plan and finance community services in a more efficient manner. Through the plan, both the county and city was better able to control urban development and ensure adequate services provision, while realizing other equally pressing community and environmental goals [34].
Beside the mechanisms above, the Open Space Program implemented in the county had substantial achievements in terms of environmental protection. Under the program, a total of 3400 acres of proposed and state-designated natural areas were protected, including a rare plant species, Spiranthes diluvialis (also known as Ute-ladies Tresses Orchid). Similarly, a total of 2200 acres of endangered Preble’s meadow jumping mouse habitat was also protected from encroachment [12]. Through the program, significant wetlands totaling about 1400 acres was also under protection through the purchase of all water rights available on the land under protection.
Similar to the case in Portland, housing price increases were also observed in the Boulder Metropolitan area [48]. While a single-family home in the area had a median value of about $122,700 in 1990, the median value skyrocketed to about $304,700, nearly double that of Colorado’s median of $166,600 and more than double the national median of $119,600 [48]. This soaring cost of housing somewhat precludes the lower-income groups from actively participating in the housing market and forces them to commute from outlying communities for work in Boulder. Further, it is argued that the strict growth management policies have discouraged businesses to develop in Boulder due to the associated high lease rates, limited availability of space and the high cost of employee housing provision. Notwithstanding, it is held that the rise in prices was majorly influenced by higher incomes, builder expectations about future land availability, the presence of the University of Colorado-Boulder which attracts more people into the area and the observed growth in the local economy [34]. Rising incomes potentially lead to higher housing prices, a claim that is also often made about the city of Portland. On the issue of transit-oriented development, Boulder has since the early 1990s, launched the Boulder’s Community Transit Network, giving birth to the Eco Pass Program and the HOP service in 1994 [50]. The success of the HOP was followed by the SKIP on Broadway, which helped transform service along the busiest transit corridor of the city, almost tripling ridership. The JUMP, BOUND, STAMPEDE, DASH and BOLT emerged later to offer both local and regional services. The Transportation Division of the city of Boulder reports an impressive progress on travel choices. People in Boulder bicycle at twenty-one times the national average, walk three times as much and ride the bus at twice the national average. The credit goes to the Great Options in Transportation (GO Boulder) group, that has over the years led actions to make bus riding, biking and walking more attractive through various outreach and marketing efforts.
As could be observed from Table 5 below, the implementation of smart growth policies in Boulder is associated with the achievement of some sustainable development policies.

6.4. Lancaster County, Pennsylvania

Over the past 50 years, Pennsylvania’s County of Lancaster has experienced challenges with the loss of its agricultural land due to the area’s low-density and sprawling development [51]. It therefore has a long-standing commitment to encourage cohesive development aligned with infrastructure expansion and to protect outlying farm lands. An important policy to addressing sprawl development has been the incorporation of urban growth areas in the county’s comprehensive plan. Lancaster had one of the finest programs directed at protecting agricultural land in the US. Through its comprehensive plan, otherwise known as “Envision Lancaster County”, the county was determined to develop a wide-ranging countywide plan to direct new developments to existing urban centers and to protect farmland and rural areas that define the unique rural character and natural landscape of the county [52].
A two-sided approach to the preservation of open space and farmland has been pursued in the county. The first approach began in the 1980s, where future land development rights were purchased in order to permanently prevent farmland conversion into other uses [34]. Through this approach, the county has been successful in preserving about 30,000 acres of lands. The second approach was implemented after the approval of the county’s comprehensive plan in 1990 and involved the establishment of growth limits to discourage new construction outside existing areas and neighborhoods. The boundaries were seen as the main growth management tool capable of ensuring that growth occurs in the right places. The growth boundaries were believed to be capable of: (a) creating a definable city/town edges to protect areas of unique character; (b) inducing more dense development in the direction of existing communities; (c) preserving agricultural area to protect open space; (d) promoting infill development in already developed areas; (e) fostering the revitalization of the county’s major cities and protecting the encroachment of the local agricultural industry by other uses; and (f) providing for public services near already urbanized areas.
Of the 26 cities and villages in the county, about 19 have presently established urban growth limits. While Lancaster County is correctly identified as an important model of growth management, the achievement of some of the smart growth principles have been mixed. Most land is still developed outside the growth boundaries, low-density and rural development continues across the county. Anderson [34] also reports that urban growth limits have been successful in pushing the price of farmland to $12,000/acre in some parts of the county, providing strong drive for farmers to sell their land to others for development. Over a period of three years, the total land developed was about 6201 acres, with about 60 percent being outside designated urban boundaries. The remaining 40 percent that was developed within the growth boundaries had only three housing units per acre, lower than the recommended five units per acre. While the population growth of the county did not change much, land consumption was about three times faster than population growth projected. In spite of the clearly spelt-out objectives of the comprehensive plan, the housing industry continued to develop land for low-density uses. The difference between land development inside and outside the growth limit could be attributed to the ineffective coordination and planning between the county’s infrastructure and land use investment plans.
Latest proposals by the county attempt to increase the density of development to an average of 4.7 building units per acre. In order to encourage a mix of housing types and to achieve the dwelling units target, it also plans to provide subsidies to developers. Similarly, there will be a mandatory limit on the number and sizes of lots to be developed into single-family detached homes in order to ensure a more compact pattern of development. Towards this end, the county seeks to make it a requirement for players in the real estate industry to adopt standards that encourage high-density development, enforce maximum sizes of lots and setbacks, and spell out the dimensions of parking and streets that comply with the patterns of development desired.
According to Harris [53], there have also been efforts to extend smart growth policies to cover transit-oriented development through the smart growth transportation program. The program includes the addition of pedestrian sidewalks to areas that do not have them, traffic calming improvements to slow traffic, the installation of bus shelters to encourage transit use and the addition of medians for pedestrian safety. Table 6 below provides a summary of the contribution of smart growth in the achievement of sustainable development goals in Lancaster County.

7. Major Findings

From the smart growth implementation efforts presented for each case study, it is evident that there is no universal approach to Smart Growth. Notwithstanding the variations in the way their respective smart growth policies have been designed and implemented, they each have made conscious efforts to pursue a number of policies that encourage mixed-use and high-density development, the protection of open spaces and natural areas and transit-oriented development (see Table 7 below). As a world leader in the smart growth movement, Portland has through the implementation of growth boundaries been able to pursue policies to increase densities and redirect investment into the urban core. Neighborhoods that were originally designed for single-family homes were reconfigured to accommodate high-density apartments. While Portland has in the past, pursued various smart growth policies, the effectiveness of such policies in controlling sprawl, curtailing the use of automobile, and maintaining mobility has been contested. Between 1980 and 2000, substantial population suburbanization was observed and this somewhat contradicts the conventional belief that smart growth is anti-suburbanization. Though not conclusive, the implementation of growth limits was also observed to be associated with high land and housing prices. This however is not entirely undesirable, as high land prices also reflect an incentive for a more compact development. Through the strict enforcement of the urban growth limits, farmland conversion rates in Portland have been found to have declined.
Through well-defined zoning policies, Arlington has also been successful in providing a comprehensive guidance for the development of projects, neighborhoods and the county at large. In addition to improvements in access to public transportation, the reduction in travel time for the residents has helped reduce the area’s potential pollution level. Through policies to increase density per acre, Arlington has been able to maximize tax revenue per acre of land. Even though the population has been observed to grow by 1 percent annually, traffic on the roads has remained stable due to the several transportation options and programs present in the county. Similar achievements on transit-oriented development were also observed in Portland, Boulder and Lancaster county. While the paper did not specifically report about the impacts of the smart growth policies on open space and natural areas, it is implied from the increase in density that the policies discouraged outlying developments into the suburbs and environmentally or culturally sensitive areas.
Lancaster County and Portland were the only regions with pure growth limits integrated into a countywide or regional plan. In both cases, UGB were used to clearly demarcate urban and rural areas in order to ensure that rural agricultural land are preserved and protected. While regulations were used to achieve open-space preservation in Portland, the case of Lancaster County was such that regulations were complemented by programs to acquire rights to prevent future developments on outlying agricultural land. Service areas and growth boundaries in Boulder were supplemented with restrictive land-use laws and regulations that acted as complements to the urban containment policies of the individual cities and towns. The lack of reliable data before and after smart growth policies implementation in the four cases above, however, makes the estimation of the magnitude of sustainable development impact difficult to measure.

8. Conclusions

Rather than being a single tool, it is evident from the previous sections that smart growth consists of a set well-crafted regional and urban planning principles that can be melded with unique local and regional conditions to achieve a more sustainable and livable development pattern. High-density development, infill development and the adaptive re-use of existing buildings help to efficiently utilize land resources and ensure more efficient public services delivery. Using the 2003 general plan guidelines of the state of California, this paper has attempted to assess smart growth implementation in Portland (Oregon), Arlington (Virginia), Boulder (Colorado) and Lancaster County (Pennsylvania) and how the individual efforts help in the achievement of sustainable development. Specifically, the sustainable urban development goals identified include: (a) decrease urban sprawl; (b) protection of working landscapes and open space; (c) protection of environmentally sensitive lands; (d) creation of viable regional and local economies (e) promotion of energy and resource efficiency; and (f) the promotion of equitable development. There seem to be a strong achievement of the goals of protecting environmentally sensitive lands and the protection of open space and working landscapes in almost all the four cases. The claims that the implementation of smart growth policies have led to housing price increases, however, remains contested as little empirical evidence has been put forward by the critics to support their assertions. Without clear facts, it would be erroneous to suggest that the delineation of boundaries decreases the availability of developable land and the supply of adequate and affordable housing.
Even though quantitative data on the progress of most of the sustainable development policies were not readily available, there was evidence to support the belief that smart growth policies promote compact development and help achieve the goal of improving public transportation. High-density development has also been reported in Arlington, Boulder and Portland, thus providing some support for the anti-sprawl goal of smart growth policy implementation. On the basis of the findings above, it would be premature to suggest that the implementation of smart growth does not complement the achievement of sustainable development goals. Similarly, while many set of sustainable urban development indicators have been developed through metro and regional efforts such as Portland’s Metro 2040 Growth concept, Sustainable Seattle, Santa Monica sustainable development program, Cleveland’s long term outcome indicators and Truckee Meadows Tomorrow, such efforts do not entirely represent universal benchmarks based on which the effectiveness of the two concepts could be examined. In future endeavors to further explore the interconnection between the two concepts, the need for a well-crafted set of indicators of assessment cannot be over-emphasized. The quantitative assessment of the savings and costs associated with the implementation of smart growth policies is beyond the scope of this paper. Further studies on the connection between smart growth and sustainable development could focus on providing numeric backing for the findings of this paper.

Acknowledgments

The authors acknowledge the support of King Fahd University of Petroleum & Minerals, Saudi Arabia.

Author Contributions

Ishak Mohammed conceptualized the idea for an assessment of the point of convergence between the concepts of sustainable development and the smart growth philosophy. He developed and contributed significantly to Section 1, Section 2, Section 3, Section 4, Section 5, Section 6, Section 7 and Section 8. Habib Alshuwaikhat proposed and approved the topic of this paper, contributed significantly to Section 4, Section 5 and Section 6 and guided the overall structure and development of the paper. Yusuf A. Adenle contributed to the discussion on linking sustainability dimensions, sustainability indicators and smart growth principles.

Conflicts of Interest

The authors declare no conflict of interest.

References

  1. Bhatta, B. Analysis of Urban Growth and Sprawl from Remote Sensing Data; Springer Science and Business Media: New York, NY, USA, 2010. [Google Scholar]
  2. Sinclair-Smith, K. Methods and Considerations for Determining Urban Growth Boundaries—An Evaluation of the Cape Town Experience. Urban Forum 2014, 25, 313–333. [Google Scholar] [CrossRef]
  3. Jiang, D.; Li, X.; Qu, F.; Li, M.; Zhang, S.; Gong, Y.; Chen, X. Driving mechanism and boundary control of urban sprawl. Front. Environ. Sci. Eng. 2015, 9, 298–309. [Google Scholar] [CrossRef]
  4. Jaeger, J.A.G.; Bertiller, R.; Schwick, C.; Kienast, F. Suitability criteria for measures of urban sprawl. Ecol. Indic. 2010, 10, 397–406. [Google Scholar] [CrossRef]
  5. Burchell, R.W.; Galley, C. Projecting incidence and costs of sprawl in the United States. Transp. Res. Rec. 2003, 1831, 150–157. [Google Scholar] [CrossRef]
  6. Burchell, R.W.; Listokin, D.; Galley, C.C. Smart growth: More than a ghost of urban policy past, less than a bold new horizon. Hous. Policy Debate 2000, 11, 821–879. [Google Scholar] [CrossRef]
  7. Katz, B. Smart Growth: The Future of the American Metropolis? CASE Parer 58; Centre for Analysis of social Exclusion, London School of Economics: London, UK, 2002. [Google Scholar]
  8. State of California. 2003 General Plan Guidelines. Available online: http://opr.ca.gov/docs/General_Plan_Guidelines_2003.pdf (accessed on 16 November 2015).
  9. World Commission on Environment and Development (WCED). Our Common Future; Oxford University Press: Oxford, UK, 1987. [Google Scholar]
  10. American Society of Civil Engineers (ASCE). The Role of the Civil Engineer in Sustainable Development; ASCE Policy Statement 418; ASCE: Reston, VA, USA, 2001. [Google Scholar]
  11. Berke, P.R.; Conroy, M.M. Are We Planning for Sustainable Development? J. Am. Plan. Assoc. 2000, 66, 21–33. [Google Scholar] [CrossRef]
  12. De Raismes, J.N.; Hoyt, H.L.; Pollock, P.L.; Gordon, J.P.; Gehr, D.J. Growth Management in Boulder, Colorado: A Case Study. Available online: http://livableboulder.org/wp-content/uploads/2015/04/Growth-Management-In-Boulder-Colorado-a-Case-Study-.pdf (accessed on 30 November 2015).
  13. Porter, D. Making Smart Growth Work; Urban Land Institute: Washington, DC, USA, 2002. [Google Scholar]
  14. Janssen-Jansen, L.B. Beyond sprawl: Principles for achieving more qualitative spatial development. disP Plan. Rev. 2005, 41, 36–41. [Google Scholar] [CrossRef]
  15. Edwards, M.M.; Haines, A. Evaluating smart growth implications for small communities. J. Plan. Educ. Res. 2007, 27, 49–64. [Google Scholar] [CrossRef]
  16. Knaap, G.J.; Lewis, R. Maryland case study. In Smart Growth Policies: An Evaluation of Programs and Outcomes; Ingram, G.K., Carbonell, A., Hong, Y.-H., Flint, A., Eds.; Lincoln Institute of Land Policy: Cambridge, MA, USA, 2009; pp. 166–175. [Google Scholar]
  17. Downs, A. Smart growth: Why we discuss it more than we do it. J. Am. Plan. Assoc. 2005, 74, 367–380. [Google Scholar] [CrossRef]
  18. Smart Growth Network. Getting to Smart Growth: 100 Policies for Implementation. Available online: http://www.aarp.org/content/dam/aarp/livable-communities/act/planning/getting-to-smart-growth-100-policies-for-implementation-aarp.pdf (accessed on 20 April 2016).
  19. Blais, P. Perverse Cities: Hidden Subsidies, Wonky Policy, and Urban Sprawl; UBC Press: Vancouver, BC, Canada, 2011. [Google Scholar]
  20. Katz, P. “Sarasota’s Smart Growth Dividend.” Planning. Available online: http://www.lgc.org/wordpress/docs/freepub/community_design/peterkatz/Planning%20Spreads.pdf (accessed on 10 December 2015).
  21. Burchell, R.W.; Mukherji, S. Conventional development versus managed growth: The costs of sprawl. Am. J. Public Health 2003, 93, 1534–1540. [Google Scholar] [CrossRef] [PubMed]
  22. Litman, T. Evaluating Criticism of Smart Growth; Victoria Transport Policy Institute: Vicoria, BC, Canada, 2003. [Google Scholar]
  23. Rodier, C.J.; Abraham, J.E.; Dix, B.N.; Hunt, J.D.D. Equity Analysis of Land Use and Transport Plans Using an Integrated Spatial Model. Available online: https://escholarship.org/uc/item/7vd6g464 (accessed on 11 December 2015).
  24. Allen, E.; Benfield, F.K. Environmental Characteristics of Smart Growth Neighborhoods, Phase II: Two Nashville Neighborhoods; Natural Resources Defense Council: New York, NY, USA, 2003. [Google Scholar]
  25. Gordon, P.; Richardson, H.W. Are compact cities a desirable planning goal? J. Am Plan. Assoc. 1997, 63, 95–106. [Google Scholar] [CrossRef]
  26. Williamson, T. Sprawl, Justice, and Citizenship: The Civic Costs of the American Way of Life; Oxford University Press: Oxford, UK, 2010. [Google Scholar]
  27. Ewing, R. Is Los Angeles-style sprawl desirable? J. Am. Plan. Assoc. 1997, 63, 107–126. [Google Scholar] [CrossRef]
  28. Rossetti, M.A.; Eversole, B.S. Eversole, Journey to Work Trends in the United States and Its Metropolitan Areas; National Transportation Systems Center: Cambridge, MA, USA, 1993.
  29. Cox, W.; Consultancy, W.C. How Urban Density Intensifies Traffic Congestion and Air Pollution; Goldwater Institute: Phoenix, AZ, USA, 2000. [Google Scholar]
  30. Cox, W. How Higher Density Makes Traffic Worse. Available online: http://www.publicpurpose.com/pp57-density.htm (accessed on 20 April 2016).
  31. Environmental Protection Agency. Parking Spaces/Community Places: Finding the Balance through Smart Growth Solutions. Available online: http://pipta.org/wp-content/uploads/2014/04/Smart-Growth-Parking-Solutions.pdf (accessed on 2 December 2015).
  32. Yang, F. If “Smart” is “Sustainable”? An Analysis of Smart Growth Policies and Its Successful Practices. Master’s Thesis, Iowa State University, Ames, IA, USA, 2009. [Google Scholar]
  33. O’Toole, R. A Portlander’s view of smart growth. Rev. Austrian Econ. 2004, 17, 203–212. [Google Scholar] [CrossRef]
  34. Anderson, H.A. Use and Implementation of Urban Growth Boundaries. An Analysis Prepared by the Center for Regional and Neighborhood Action. Available online: http://www.colorado.edu/conflict/5010/CRNA-UGBReport.pdf (accessed on 20 November 2015).
  35. Metro 2040 Growth Concept. Available online: http://www.portlandonline.com/portlandplan/index.cfm?c=52250 (accessed on 25 March 2016).
  36. Jun, M.J. The effects of Portland’s urban growth boundary on urban development patterns and commuting. Urban Stud. 2004, 41, 1333–1348. [Google Scholar] [CrossRef]
  37. O’Toole, R. The Folly of Smart-Growth. Growth Regulation. Available online: http://papers.ssrn.com/sol3/papers.cfm?abstract_id=291805 (accessed on 1 January 2016).
  38. Arlington County. Smart Growth. Available online: https://projects.arlingtonva.us/planning/smart-growth/ (accessed on 12 December 2015).
  39. Hanson, R.; Young, G. Active Living and Biking: Tracing the Evolution of a Biking System in Arlington, Virginia. J. Health Politics, Policy Law 2008, 33, 387–406. [Google Scholar] [CrossRef] [PubMed]
  40. Arlington County. 2012 Detailed Survey. Available online: http://departments.arlingtonva.us/cmo/resident-survey/2012-satisfaction-survey/ (accessed on 12 December 2015).
  41. Jennings, H.M., Jr. Providing Travel Choices for Vibrant Street: Transportation Demand Management in Arlington, USA. Inst. Transp. Eng. J. 2014, 84, 24–28. [Google Scholar]
  42. Arlington Economic Development. From the Director: The Value of Smart Growth. Available online: http://www.arlingtoneconomicdevelopment.com/resources/economic-update/2013/july/from-the-director-the-value-of-smart-growth/ (accessed on 12 December 2015).
  43. Smart Growth America. Arlington, Virginia’s Story of Smart Growth: The Movie. Available online: http://www.smartgrowthamerica.org/2009/05/08/arlington-virginias-story-of-smart-growth-the-movie/ (accessed on 10 December 2015).
  44. Arlington County. Master Transportation Plan: Baseline Conditions Report. Available online: http://arlingtonva.s3.amazonaws.com/wp-content/uploads/sites/31/2014/02/DES-MTP-Baseline-Conditions-Report.pdf (accessed on 12 December 2015).
  45. Cleveland, C.; DeMichele, D.; Downie, S.; Garfinkle, S.; Huang, M.; Klein, S. Sustaining Smart Growth in Montgomery County. Available online: http://www.montgomeryplanning.org/research/growth_policy/growth_policy_2007_2009/documents/SustainingSmartGrowthinMontgomeryCounty.pdf (accessed on 24 March 2016).
  46. Nelson, A.C.; Sanchez, T.W.; Dawkins, C.J. The Social Impacts of Urban Containment; Ashgate Publishing: London, UK, 2007. [Google Scholar]
  47. Benfield, F.K.; Terris, J.; Vorsanger, N. Solving Sprawl: Models of Smart Growth in Communities across America; Island Press: Washington, DC, USA, 2003. [Google Scholar]
  48. Jackson, K.J. The need for regional management of growth: Boulder, Colorado, as a case study. Urban Lawyer 2005, 37, 299–322. [Google Scholar]
  49. Pollock, P. Controlling Sprawl in Boulder: Benefits and Pitfalls (Land Lines Article). Available online: http://www.lincolninst.edu/pubs/435_Controlling-Sprawl-in-Boulder---Benefits-and-Pitfalls (accessed on 1 January 2016).
  50. City of Boulder Transportation Division. Transportation to Sustain a Community. Available online: http://www.smartgrowthamerica.org/documents/cs/impl/co-boulder-2012report.pdf (accessed on 28 March 2016).
  51. Weber, F. How to Implement an Urban Growth Area without Really Requiring (It): Evaluating the Effectiveness of Voluntary Urban Growth Areas. Available online: http://repository.upenn.edu/cgi/viewcontent.cgi?article=1014&context=senior_seminar (accessed on 29 November 2015).
  52. U.S. Environmental Protection Agency. Smart Growth: A Guide to Developing and Implementing Greenhouse Gas Reductions Programs. Available online: http://www.sustainablecitiesinstitute.org/Documents/SCI/Report_Guide/Guide_EPA_SmartGrowthGHGReduction_2011.pdf (accessed on 20 April 2016).
  53. Harris, B. Smart Growth Extended to Transportation. Available online: http://lancasteronline.com/news/smart-growth-extended-to-transportation/article_de329c56-015f-5b2f-9c83-828713212366.html (accessed on 1 January 2016).
Figure 1. A framework for linking Smart Growth to Sustainable Development.
Sustainability 08 00397 g001
Table 1. Linking sustainability dimensions, sustainable Indicators, sustainable urban development goals and smart growth principles.
Sustainability DimensionsSustainability IndicatorsSustainable Urban Development GoalsSmart Growth PrinciplesPolicies
Environmental
(1)
Water Quality
(2)
Green/Open Space
(3)
Energy Consumption
(4)
Awareness
(5)
Ecosystem Integrity & Diversity
(6)
Air Quality
(7)
Soil Quality
(8)
Land Use
(9)
Solid Waste
(10)
Transportation
(1) Decrease urban sprawl(a) Mixed-use development
(b) Compact development/building design
(d) Creation of neighborhoods that are walkable
(g) Intensifying and directing development toward existing communities
(h) Provision of a variety of transportation options
  • Promote infill development
  • Promote mixed-used, walkable and compact development
  • Urban and Town centers restoration
  • Promote transit-oriented development
  • Limiting leapfrog/non-contiguous development
(2) Protect open space and working landscapes(f) The preservation of farmlands, open spaces, natural beauty and important environmental areas
(e) Fostering of unique and attractive communities with a strong sense of place
  • Conservation of outlying agricultural lands
  • Using open space to define urban communities
  • Conservation of lands on high recreational and scenic value
(3) Protect environment sensitive areas
  • Minimize disruption to watershed function, including natural floodways and water quality
  • Conservation of natural habitat land
  • Avoid natural hazards
  • Preserving the connectivity of habitats
(4) Promote energy and resource efficiency
  • Providing support for resource and energy efficient industries
  • Promotion of alternative transportation options
  • Intensifying waste reduction programs such as recycling
  • Promoting the construction of building that are resource and energy efficient
Equity
(1)
Education
(2)
Community Participation
(3)
Housing Needs
(4)
Sense of Place
(5)
Human Health
(6)
Wealth Distribution
(7)
Crime/Public safety
(8)
Culture/Heritage
(9)
Public Services
(10)
Poverty
(5) Create strong local and regional economies(c) Range of housing choices and opportunities
(i) Make development decisions predictable, fair and cost effective
(j) Encouraging community and stakeholder participation in development decisions
  • Encouraging a strong balance between jobs and housing
  • Adequate housing provision for all income groups
  • Ensuring that land use planning process is price able and fair
  • Encouraging the expansion of tele-communications services and infrastructure
(6) Promote equitable development
  • Improving accessibility and mobility through the promotion of alternative transportation choices
Economy
(1)
Infrastructure
(2)
Access to Capital
(3)
Access to Job
(4)
Retail Sales
(5)
Income
(6)
Labor Force
(7)
Human Capital Support
(8)
Business Activity
(9)
Food Production
(10)
Economic Diversification
(7) Decrease urban sprawl(g) Intensifying and directing development
Source: Adopted and modified from Yang [32] and the 2003 General Plan Guidelines [8] for State of California.
Table 2. Descriptions of Sustainability Indicators.
DimensionSustainability IndicatorsInterpretation of Indicators
(1) Environmental1. Water QualityImprove quality of water and prevent water contamination
2. Green/Open SpaceCreate an acceptable green/open space linked with open access
3. Energy ConsumptionDecrease the consumption of non-renewable energy
4. AwarenessImprove campaign on green environment
5. Ecosystem Integrity and DiversitySustain continuous and improved bio-diversity
6. Air QualityImprove quality of air and prevent air pollution
7. Soil QualityImprove organic content in soil and prevent erosion as well as contamination
8. Land UseProtect, safeguard, maintain and conserve land for agricultural and other land uses efficiently
9. Solid WasteDecrease solid waste through environment-friendly ways
10. TransportationEstablish beneficial public-transit, bicycle and pedestrian friendly community
(2) Equity11. EducationEstablish quality and sound education
12. Citizen ParticipationIncrease citizen participation in service delivery and decision making
13. Housing NeedsEnsure accessible and affordable quality housing
14. Sense of PlaceImprove sense of place
15. Human HealthIncrease human quality of life
16. Wealth DistributionAllocate equal working opportunities and wealth for all
17. Crime/Public SafetyDecrease accident and crime and increase public safety
18. Culture/HeritageSustain socio-cultural legacy
19. Public ServicesEstablish easily accessible public facilities
20. PovertyEliminate or reduce poverty
(3) Economy21. InfrastructureAllocation of adequate infrastructure for all
22. Access to CapitalAllocation of available capital for business
23. Access to JobCreation of adequate jobs
24. Retail SalesCreation of retail business that provide reasonable profit
25. IncomeIncrease income of households with effective economic policies
26. Labor forceSupply of adequate labor force with considerable hours of work
27. Human Capital SupportProvision of adequate skills and knowledge for all
28. Business ActivityEnsure sustainable business activity
29. Food ProductionProduction of food for local and international consumption
30. Economic DiversificationCreate innovative businesses by discouraging dependent on local natural resources
Source: Adopted from Yang [32].
Table 3. The achievement of sustainable development policies in Portland.
Sustainable Development GoalsSustainable Development PoliciesPortland, Oregon
Decrease urban sprawlPromote infill development
Promote mixed-use, walkable and compact development
Urban and town centers restoration
Promotion of transit-oriented development
Limiting leapfrog/non-contiguous development
Protect working landscapes and open spacesConservation of outlying agricultural lands
Using open space to define urban communities
Conservation of lands of high recreational and scenic
Minimize disruption to watershed function, including natural floodways and water quality
Conservation natural habitat lands
Protect environmentally sensitive areasAvoid natural hazards
Preserving the connectivity of habitats
Providing support for resource and energy efficient industries
Promotion of alternative transportation options
Promote energy and resource efficiencyIntensifying waste reduction programs such as recycling
Promoting the construction of buildings that are resource and energy efficient
Create strong local regional economiesEncouraging a strong balance between jobs and housing
Adequate housing provision for all income groups
Ensuring that land use planning process is predictable and fair
Encouraging the expansion of telecommunications services and infrastructure
Promote equitable developmentImproving accessibility and mobility through the promotion of alternative transportation choices
Ensuring that there is fair treatment in the preparation/design, adoption, implementation and enforcement of environmental regulations, policies and laws
Providing protection for culturally significant sites
Promotion of the development of mixed-income housing
Ensuring that there is equitable economic opportunity for all segments of the community
Source: Authors’ construct, December, 2015.
Table 4. The achievement of sustainable development policies in Arlington, Virginia.
Sustainable Development GoalsSustainable Development PoliciesArlington, Virginia
Decrease urban sprawlPromote infill development
Promote mixed-use, walkable and compact development
Urban and town centers restoration
Promotion of transit-oriented development
Limiting leapfrog/non-contiguous development
Protect open space and working landscapesConservation of outlying agricultural lands
Using open space to define urban communities
Conservation of lands of high recreational and scenic value
Minimize disruption to watershed function, including natural floodways and water quality
Conservation natural habitat lands
Protect environmentally sensitive landsAvoid natural hazards
Preserving the connectivity of habitats
Providing support for resource and energy efficient industries
Promotion of alternative transportation options
Promote energy and resource efficiencyIntensifying waste reduction programs such as recycling
Promoting the construction of buildings that are resource and energy efficient
Create strong local and regional economiesEncouraging a strong balance between jobs and housing
Adequate housing provision for all income groups
Ensuring that land use planning process is predictable and fair
Encouraging the expansion of telecommunications services and infrastructure
Promote equitable developmentImproving accessibility and mobility through the promotion of alternative transportation choices
Ensuring that there is fair treatment in the preparation/design, adoption, implementation and enforcement of environmental regulations, policies and laws
Providing protection for culturally significant sites
Promotion of the development of mixed-income housing
Ensuring that there is equitable economic opportunity for all segments of the community
Source: Authors’ construct, December 2015.
Table 5. The achievement of sustainable development policies in Boulder, Colorado.
Sustainable Development GoalsSustainable Development PoliciesBoulder, Colorado
Decrease urban sprawlPromote infill development
Promote mixed-use, walkable and compact development
Urban and town centers restoration
Promotion of transit-oriented development
Limiting leapfrog/non-contiguous development
Protect open space and working landscapesConservation of outlying agricultural lands
Using open space to define urban communities
Conservation of lands of high recreational and scenic value
Minimize disruption to watershed function, including natural floodways and water quality
Conservation natural habitat lands
Protect environmentally sensitive landsAvoid natural hazards
Preserving the connectivity of habitats
Providing support for resource and energy efficient industries
Promotion of alternative transportation options
Promote energy and resource efficiencyIntensifying waste reduction programs such as recycling
Promoting the construction of buildings that are resource and energy efficient
Create strong local and regional economiesEncouraging a strong balance between jobs and housing
Adequate housing provision for all income groups
Ensuring that land use planning process is predictable and fair
Encouraging the expansion of telecommunications services and infrastructure
Promote equitable developmentImproving accessibility and mobility through the promotion of alternative transportation choices
Ensuring that there is fair treatment in the preparation/design, adoption, implementation and enforcement of environmental regulations, policies and laws
Providing protection for culturally significant sites
Promotion of the development of mixed-income housing
Ensuring that there is equitable economic opportunity for all segments of the community
Source: Authors’ construct, December 2015.
Table 6. The achievement of sustainable development policies in Lancaster County, Pennsylvania.
Sustainable Development GoalsSustainable Development PoliciesLancaster County, Pennsylvania
Decrease urban sprawlPromote infill development
Promote mixed-use, walkable and compact development
Urban and town centers restoration
Promotion of transit-oriented development
Limiting leapfrog/non-contiguous development
Protect open space and working landscapesConservation of outlying agricultural lands
Using open space to define urban communities
Conservation of lands of high recreational and scenic value
Minimize disruption to watershed function, including natural floodways and water quality
Conservation natural habitat lands
Protect environmentally sensitive landsAvoid natural hazards
Preserving the connectivity of habitats
Providing support for resource and energy efficient industries
Promotion of alternative transportation options
Promote energy and resource efficiencyIntensifying waste reduction programs such as recycling
Promoting the construction of buildings that are resource and energy efficient
Create strong local and regional economiesEncouraging a strong balance between jobs and housing
Adequate housing provision for all income groups
Ensuring that land use planning process is predictable and fair
Encouraging the expansion of telecommunications services and infrastructure
Promote equitable developmentImproving accessibility and mobility through the promotion of alternative transportation choices
Ensuring that there is fair treatment in the preparation/design, adoption, implementation and enforcement of environmental regulations, policies and laws
Providing protection for culturally significant sites
Promotion of the development of mixed-income housing
Ensuring that there is equitable economic opportunity for all segments of the community
Source: Authors’ construct, December, 2015.
Table 7. The achievement of Sustainable Development Goals and Policies.
Sustainable Development GoalsSustainable Development PoliciesPortland, OregonArlington, VirginiaBoulder, ColoradoLancaster County, Pennsylvania
Decrease urban sprawlPromote infill development
Promote mixed-use, walkable and compact development
Urban and town centers restoration
Promotion of transit-oriented development
Limiting leapfrog/non-contiguous development
Protect open space and working landscapes
Protect environmentally sensitive lands
Promote energy and resource efficiency
Conservation of outlying agricultural lands
Using open space to define urban communities
Conservation of lands of high recreational and scenic value
Minimize disruption to watershed function, including natural floodways and water quality
Conservation natural habitat lands
Avoid natural hazards
Preserving the connectivity of habitats
Providing support for resource and energy efficient industries
Promotion of alternative transportation options
Intensifying waste reduction programs such as recycling
Promoting the construction of buildings that are resource and energy efficient
Create strong local and regional economies
Promote equitable development
Encouraging a strong balance between jobs and housing
Adequate housing provision for all income groups
Ensuring that land use planning process is predictable and fair
Encouraging the expansion of telecommunications services and infrastructure
Improving accessibility and mobility through the promotion of alternative transportation choices
Ensuring that there is fair treatment in the preparation/design, adoption, implementation and enforcement of environmental regulations, policies and laws
Providing protection for culturally significant sites
Promotion of the development of mixed-income housing
Ensuring that there is equitable economic opportunity for all segments of the community
Source: Adopted and Modified from the 2003 General Plan Guideline [8] for the State of California.

