Article

Multi-Objective Optimization for Sustainable Pavement Maintenance Decision Making by Integrating Pavement Image Segmentation and TOPSIS Methods

1
School of Management, Shanghai University, Shanghai 200444, China
2
Shanghai Road & Bridge (Group) Co., Ltd., Shanghai 200433, China
*
Author to whom correspondence should be addressed.
Sustainability 2024, 16(3), 1257; https://doi.org/10.3390/su16031257
Submission received: 8 January 2024 / Revised: 30 January 2024 / Accepted: 30 January 2024 / Published: 1 February 2024
(This article belongs to the Section Sustainable Transportation)

Abstract

:
To provide a low-carbon economy maintenance strategy is the most challenging problem faced by pavement management authorities under the restricted budget and significant environmental repercussions. The development of a multi-objective optimization model for pavement maintenance decision making is essential to formulate pavements. Nevertheless, the existing automatic detection can only recognize and classify pavement distress. However, few studies are able to accurately determine the precise dimensions of specific distresses such as cracks and potholes, especially combined with the actual size of the image. This limitation hinders the ability to provide specific maintenance recommendations and make optimal maintenance decisions. Therefore, this paper develops a comprehensive and effective multi-objective decision-making framework for pavement maintenance. This framework consists of four distinct components: (1) recognizing the dimensions of pavement distresses based on the pavement image segmentation technique; (2) compiling a list of viable pavement maintenance strategies; (3) assessing the costs and carbon emissions of these strategies; and (4) optimizing decisions on pavement maintenance. We used the U-Net algorithm to accurately recognize the dimensions of pavement distresses, while an improved entropy-weighted TOPSIS model was proposed to determine the optimal pavement maintenance strategy with the lowest cost and carbon emissions. The results indicated that the pavement distress dimension recognition model achieved a high accuracy of 96.88%, and the TOPSIS model identified the optimal maintenance strategy with a score of 99.16. This maintenance strategy achieved a substantial reduction of 30.80% in carbon emissions and a cost reduction of 20.81% compared to the highest values among all maintenance strategies. This study not only provides a scientifically objective method for making pavement maintenance decisions but also offers specific, quantifiable maintenance programs, marking a stride towards more environmentally friendly and cost-effective road maintenance. It also contributes to the sustainability of pavement maintenance.

1. Introduction

Prolonged and extensive highway construction has brought increasing attention to pavement maintenance. To ensure the desired performance of highways, they need regular maintenance. The goal of pavement maintenance is to maintain the usability of the pavement; to restore the damaged parts in time; to ensure the safety, comfort, and smoothness of traffic; and to save transportation costs and time. In addition to maintaining the sustainability of pavement work, the environmental impacts and costs incurred in maintenance works can equally affect the sustainability of society. Efficient and accurate maintenance strategies can reduce the carbon emissions of the transportation industry, while also saving maintenance costs. The traditional approach to pavement assessment is a visual inspection that can be conducted by human experts, which is considered the easiest method [1]. Despite providing roughly exact examination outcomes, there are some downsides to the established approach such as the impact on traffic, nonobjective evaluation, hazards for site inspectors, considerable expense, and poor performance [2,3]. In addition to how pavement damage is detected, most of the materials currently used to maintain asphalt pavements are associated with high emissions, largely due to the nature of asphalt mixes. For example, processes such as asphalt patching can lead to increased emissions due to the energy-intensive nature of the rehabilitation process [4]. While the use of recycled asphalt pavement or bio-based binders has the potential to reduce emissions, they have not yet gained widespread adoption, mainly due to concerns about their pavement performance [5]. Given these challenges, an important issue facing the maintenance of asphalt pavements is how to efficiently and objectively conduct road surface damage detection and propose maintenance solutions that are both low-carbon and economical.
Rapid and efficient pavement inspection facilitates the implementation of pavement maintenance tasks. Bang et al. proposed a pixel-level detection method for identifying road cracks in black-box images using a deep convolutional encoder–decoder network [6]. Li et al. employed a model-based transfer learning strategy for initializing the parameters of a Fully Convolutional Network (FCN), and their research results demonstrated a pixel accuracy of 98.61% [7]. Majidifard et al. established a U-Net-based model to quantify the severity of distress. Ultimately, by integrating the YOLO and U-net models, they developed a hybrid model for classifying distress and simultaneously quantifying its severity [8]. Their research results can be conveniently utilized for assessing the condition of pavements during their service life and aid in making effective decisions for the repair or reconstruction of roads at the appropriate time. Ouma and Hahn based their approach on multi-scale texture-based image filtering, utilized wavelet transform for text on representation, and employed the Fuzzy C-Means (FCM) algorithm for super-pixel clustering of pavement defects and non-defects. They proposed a low-cost detection method based on 2D visual images for identifying potholes in urban asphalt pavements [9]. Hoang et al. developed a machine learning model composed of multi-class Support Vector Machines and an Artificial Bee Colony optimization algorithm for classifying pavement cracks [10]. These studies indicate that traditional manual detection methods have been phased out. The current approach to road surface damage detection primarily relies on image recognition technology for automation, achieving a high level of accuracy. However, this method can only determine the presence and type of damage. Since it cannot quantify the extent of road surface damage, it fails to provide conclusions on whether maintenance is necessary, let alone offer specific and effective maintenance strategies. Pixel-level pavement detection can provide accurate pavement parameters for pavement condition evaluation, and U-Net is a method of pixel-level segmentation [11], which is capable of segmenting the pixel information of the pavement distresses in the image. The U-Net algorithm has been used for the pavement distress dimensions recognition in this study.
In the field of asphalt pavement management, formulating effective pavement maintenance strategies is a significant issue. It involves creating reasonable maintenance strategies based on pavement conditions, traffic volume, and lifespan, aiming to extend the pavement’s service life while reducing maintenance costs and environmental impact [12,13]. Current representative research focuses on optimization algorithms, including Genetic Algorithms (GA) and Dynamic Programming (DP) methods. Genetic Algorithms, based on the concept of genetic evolution, are widely used in asphalt pavement management for their ability to handle numerous parameters and variables and search for global optima [14]. Dynamic Programming is also extensively used in asphalt pavement management. Its advantage lies in finding global optima without falling into dead loops or local optima. Integrating DP algorithms with deep learning has been explored to enhance solution accuracy [15,16]. However, DP has its drawbacks, such as exponential growth in computational complexity when handling high-dimensional problems, leading to prolonged solution times. DP also requires precise pavement condition data and corresponding decision variables, demanding high data accuracy and quality [17,18]. Despite the contributions of these studies in developing maintenance strategies, there are still limitations to address. Decision models typically only consider the technical and economic impacts of asphalt pavement maintenance, neglecting environmental and social impacts, such as carbon emissions and societal costs [19]. Integrating these factors into decision models remains a challenge. TOPSIS has the capability to generate a ranking of alternatives by effectively utilizing the attribute information of variables [20]. We have selected the TOPSIS model as our approach for multi-objective decision making. To avoid the subjectivity of indicators, we selected the entropy weighting method to determine the weights of the indicators.
Few studies have been able to convert the image dimensions of pavement distress to actual dimensions and on this basis suggest a specific maintenance strategy for specific pavement situations. In light of the aforementioned challenges and knowledge gaps, the objective of this study is to propose a comprehensive and effective multi-objective decision-making framework for pavement maintenance. We innovatively proposed a multi-objective decision-making method by combining the dimensions of pavement damage images, converting them to the actual dimensions of the damage, and considering both carbon emission and cost metrics. It is able to propose specific maintenance strategies for specific pavement conditions. Four distinct components comprised this framework: (1) recognizing the dimension of pavement distresses based on the pavement image segmentation technique; (2) compiling a list of viable pavement maintenance strategies; (3) assessing the costs and carbon emissions of these strategies; and (4) optimizing decisions on pavement maintenance based an improved entropy-weighted TOPSIS model. This paper is organized as follows: Section 2 details the research methodology. Section 3 describes the process and methods of data collection. Section 4 presents the experimental results and analyzes these results in depth. Section 5 summarizes this study, discusses its limitations, and provides an outlook on future research directions.

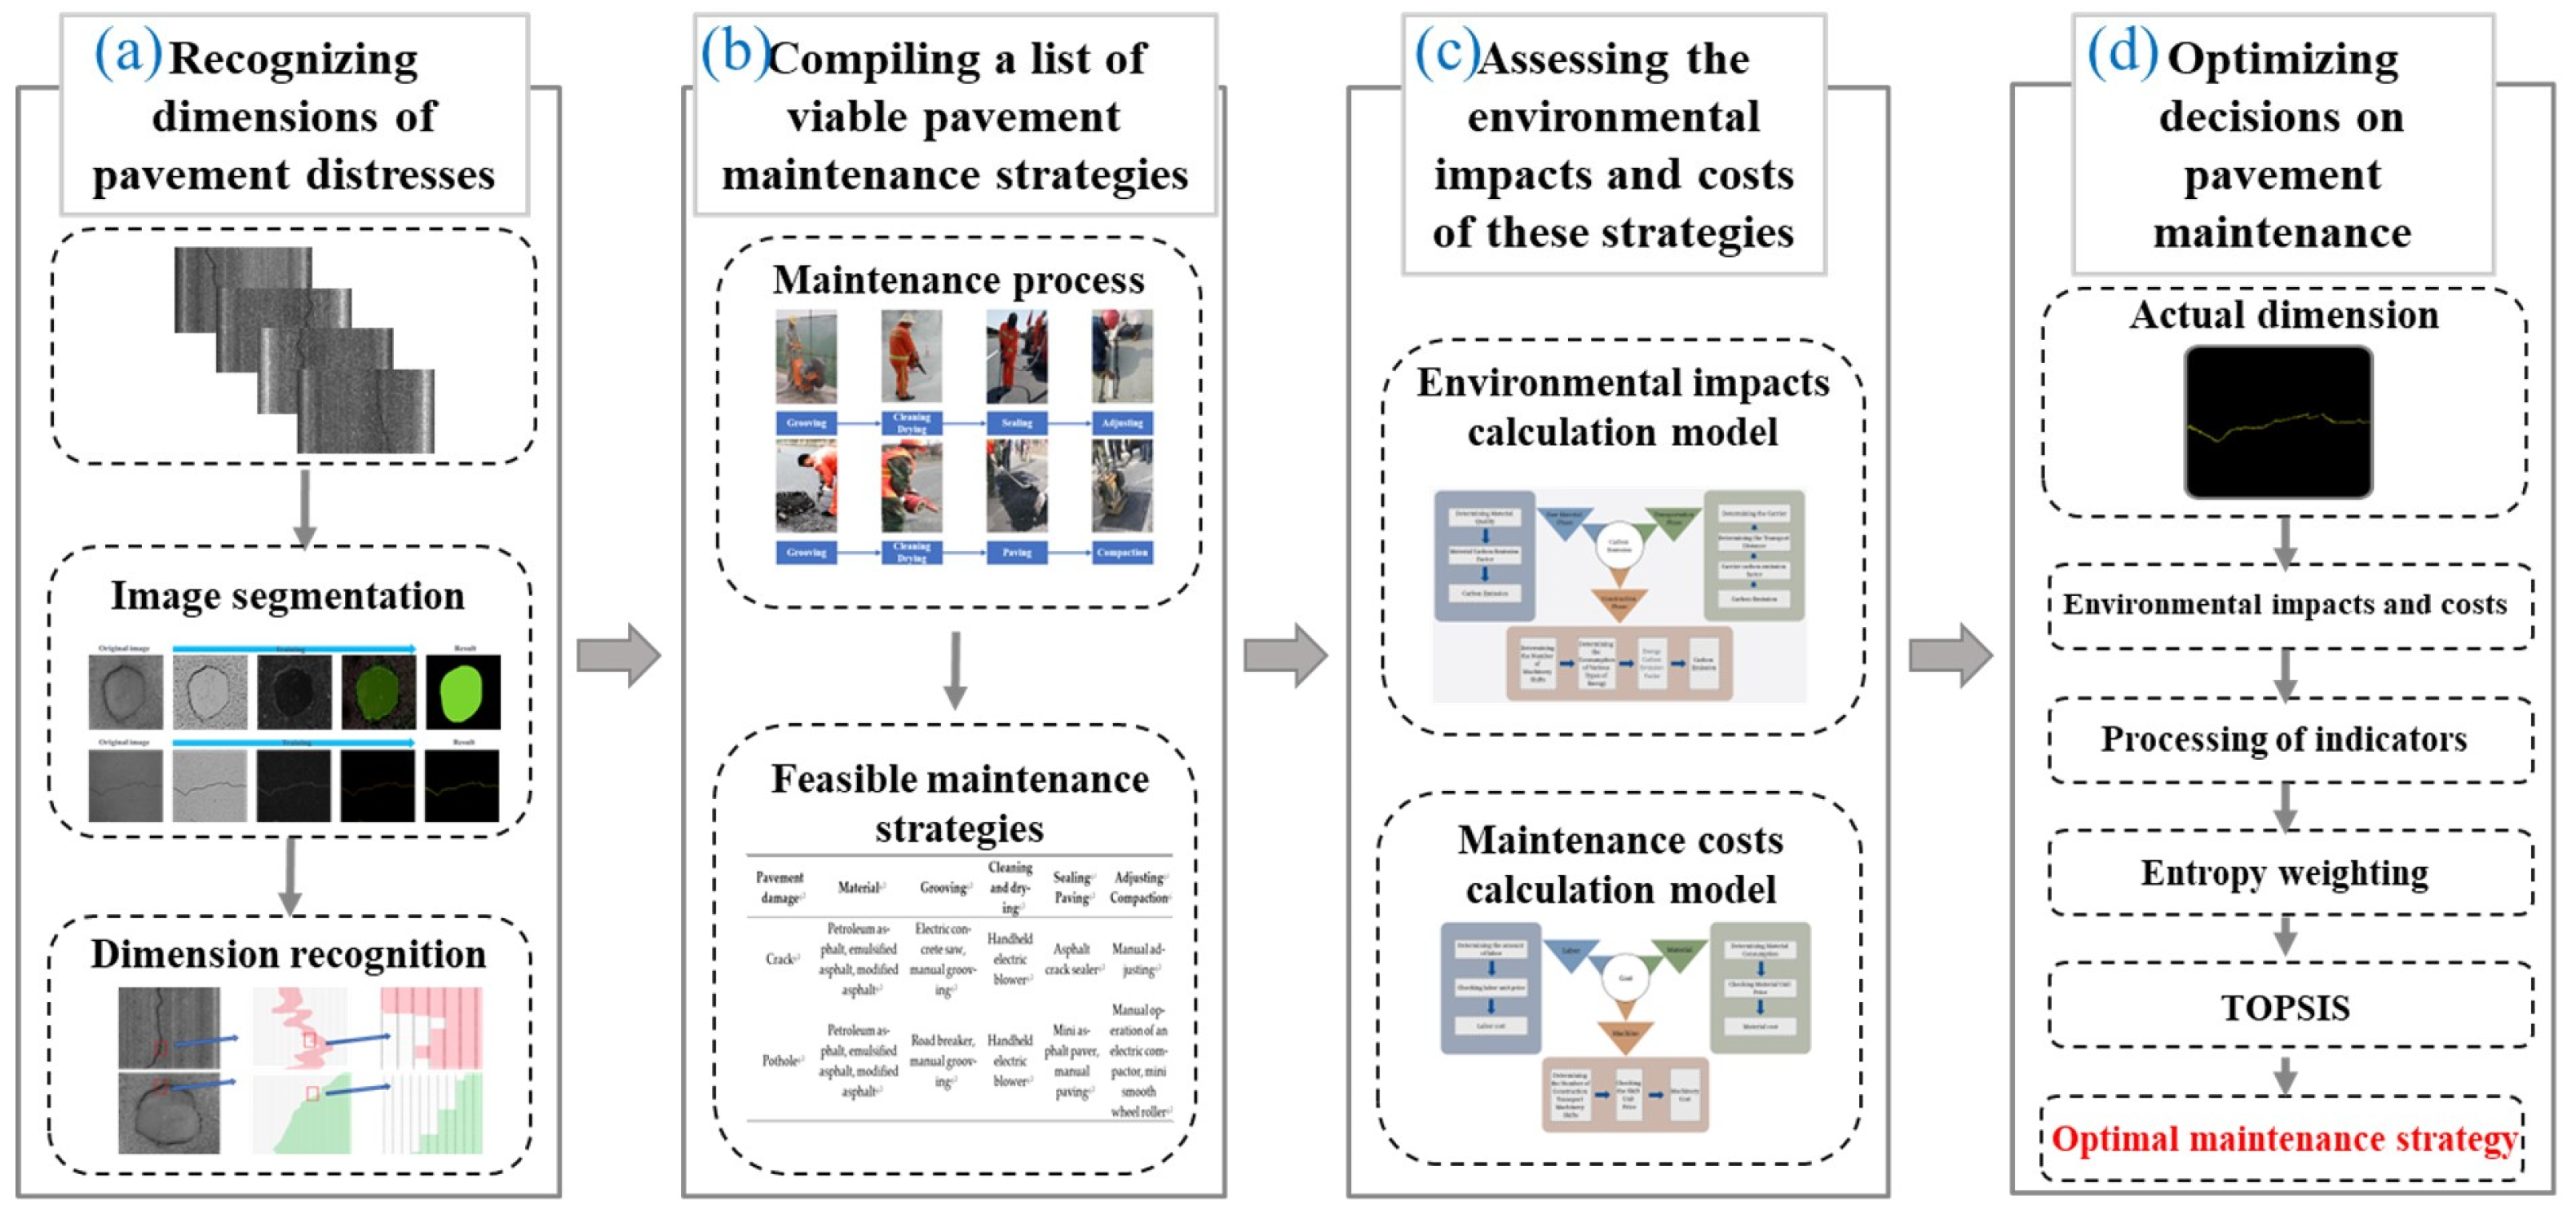
2. Research Framework

Our study was conducted in four steps: (1) we detected the types and recognized the dimensions of pavement distresses based on the pavement image segmentation method (Figure 1a); (2) a list of viable pavement maintenance strategies was compiled based on the automatic pavement detection in the previous step (Figure 1b); (3) we assessed the carbon emissions and costs of these viable strategies (Figure 1c); and (4) a multi-objective decision-making model for pavement maintenance strategies based on the improved entropy-weighted TOPSIS method was established (Figure 1d).

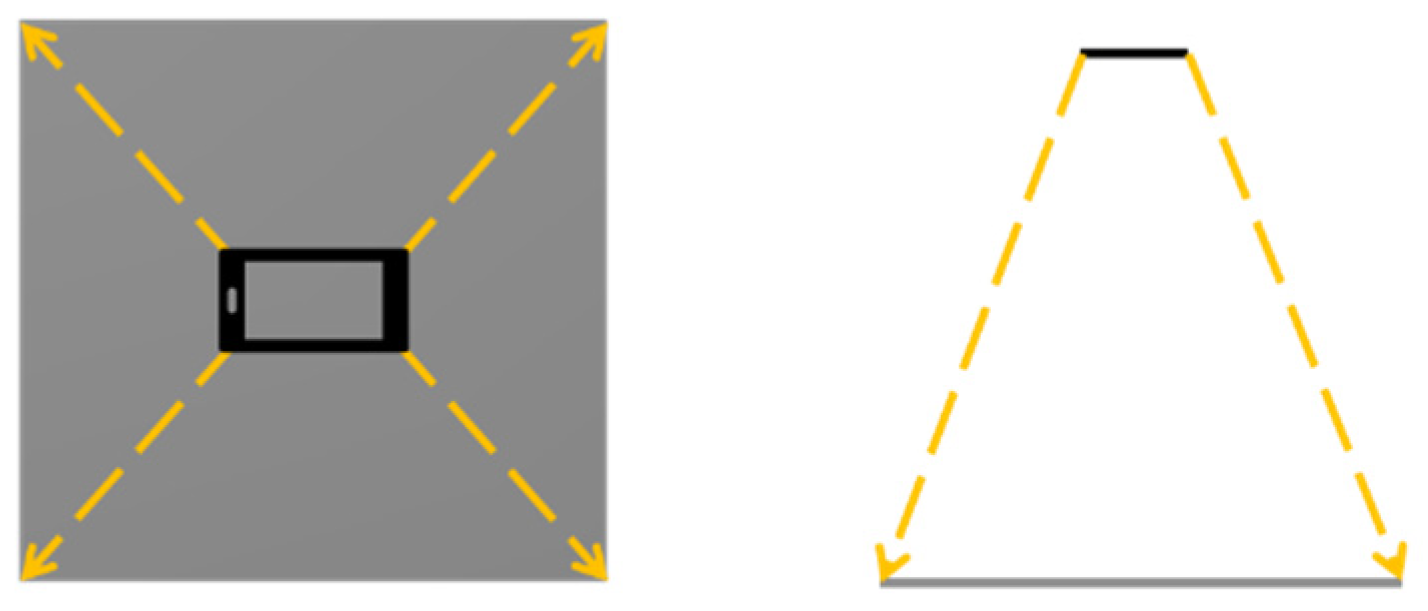
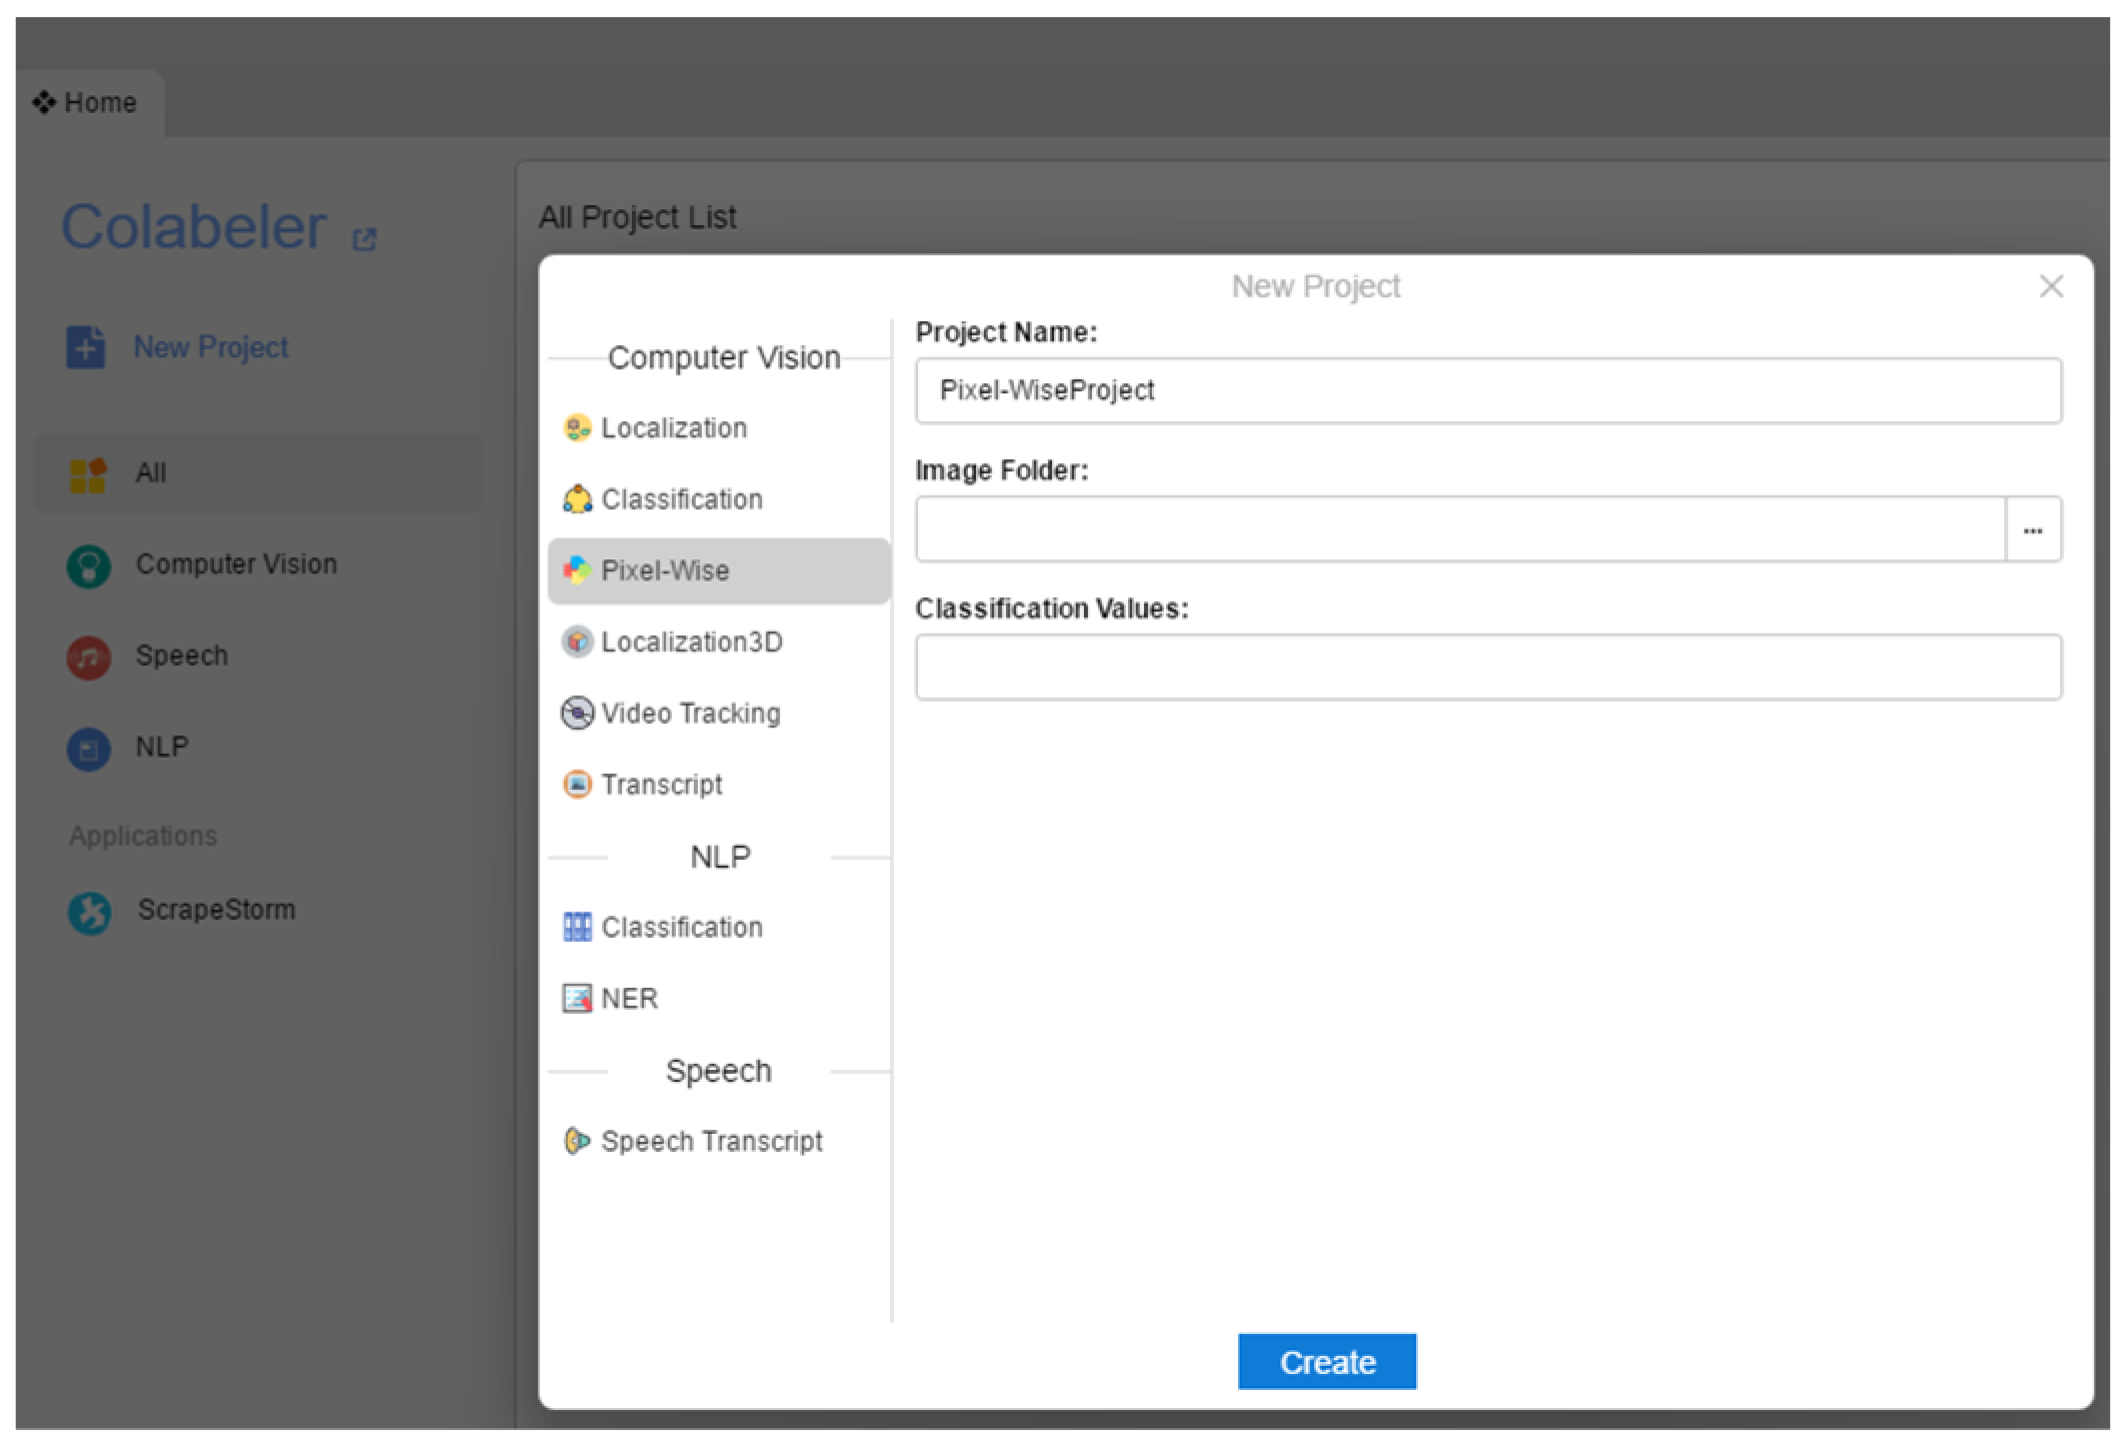
2.1. Recognizing Dimensions of Pavement Distresses

The pavement condition index (PCI) depends on the actual area of pavement damage, making it crucial to accurately identify the actual dimension of pavement distress. Only segmentation can achieve pixel-level recognition accuracy and output geometry information of distress that can be utilized to evaluate the state of pavement performance more practically. Therefore, segmentation has become the mainstream in the field of pavement distress recognition [21]. The U-Net algorithm, which derives its name from its U-shaped structure, is a deep learning network for the task of image segmentation. U-Net is mainly used for solving tasks such as medical image segmentation, where fine boundary information is usually required. The structure of U-Net is divided into two parts: the encoder and the decoder. The encoder is responsible for gradually down-sampling the input image into a small feature map while preserving the contextual information of the image. The decoder gradually up-samples this small feature map into a segmentation prediction map of the same dimension as the original input image. This symmetrical U-shaped structure of U-Net (Figure 2) consists of a contracting (down-sampling) path and an expanding (up-sampling) path. This structure allows the network to capture the contextual information of an image at different scales while preserving the detailed information. It uses the jump connections to connect the feature maps of the down-sampling path to the corresponding layers of the up-sampling path. This connection helps the network to recover detailed information during the up-sampling process and reduces information loss. Jump connections allow the network to learn detailed features better even with limited training data, improving segmentation accuracy. The design of U-Net also focuses on feature learning in localized regions. This means that it can effectively learn rich local features from small samples. Due to its unique up-sampling and jump-joining structure, U-Net can effectively fuse features from different layers. This feature fusion enables the model to learn enough information to achieve accurate image segmentation. The final outcome is pixel images that exclusively depict pavement damage, as shown in Figure 3.
To make the identification of pavement distress more precise, in the pavement damage image collection phase of this study, two key measures were taken to ensure the accuracy of the data: first, the actual dimensions of the images were recorded by using box markers at the time of shooting to facilitate subsequent analysis; and second, a shooting angle perpendicular to the ground was used to minimize the bias of the image information induced by the shooting angle. In the image-processing stage, we applied the U-Net algorithm to segment the collected images and exported the segmented image pixel information to Excel format. This step enabled us to accurately count the number of pixel points representing the damaged areas of the pavement. Based on these data, we used Equations (1) and (2) to calculate the actual dimension of the pavement damage:
S p i e x l = S a c t u a l C p i e x l ,
S p a v e m e n t   d a m a g e = S p i e x l × C p a v e m e n t   d a m a g e ,
where S p i e x l means the area of each pixel point, S a c t u a l means the actual area of the image, C p i e x l means the product of the pixel dimensions of the image, S p a v e m e n t   d a m a g e means the actual dimension of the pavement damage, and C p a v e m e n t   d a m a g e means the number of pixel points occupied by the pavement damage.

2.2. Compiling a List of Viable Pavement Maintenance Strategies

The PCI is often used as an important decision-making index when analyzing maintenance decisions and selecting maintenance countermeasures, which provides an objective and reasonable decision-making basis for pavement maintenance, and thus is also an important index widely used worldwide to determine maintenance strategies. The dimension of the PCI is determined by the Distress Ratio (DR), which is calculated according to different parameters of disease types. According to the Standard for Evaluation of Highway Technical Condition in China (JTG 5210-2018) [22], the equation for calculating the PCI is as follows:
P C I = 100 a 0 D R a 1 ,
D R = 100 × i = 1 i 0 ω i A i A ,
where D R is the pavement distress rate, which is the percentage of the distress area of various distresses to the total area of the pavement; A is the area of the pavement; A i is the area of the pavement with type i distress; and ω i is the weight of the distress in the ith category. The value of ω i is 0.6 or 2.0 when the unit of measure of pavement distress is length, and 1.0 if the unit of measure is area. a 0 = 15 , a 1 = 0.412 , and i 0 is the total number of distress types.
In this study, the PCI is used as the primary decision-making objective for whether maintenance is needed, and the specific maintenance countermeasures are shown in Table 1.
In asphalt pavement maintenance, the selection of appropriate maintenance materials is crucial. Major maintenance materials include petroleum asphalt, emulsified asphalt, and modified asphalt, each of which has its own unique characteristics and application scenarios. Petroleum asphalt is solid or semi-solid at room temperature and is suitable for filling large cracks and potholes, especially in areas with low temperatures. Emulsified asphalt is an emulsion made by mixing asphalt with water and is suitable for small cracks and pavement sealing. Modified asphalt, on the other hand, improves its performance by adding specific modifiers or additives, especially in areas with heavy traffic or extreme climates. When selecting maintenance materials, it is necessary to consider the local climatic conditions, the state of pavement damage, and the feasibility of construction.
In the use of asphalt materials, their environmental impact is particularly reflected in carbon emissions. Petroleum asphalt consumes large amounts of energy during production and heating, resulting in high carbon emissions. Emulsified asphalt has significant advantages in reducing carbon emissions, and due to its water-based nature, no additional heating is required during construction. Modified asphalt, on the other hand, has improved temperature resistance and durability, which helps to reduce the frequency and intensity of road maintenance, thereby reducing carbon emissions. The selection of lower carbon-emitting asphalt materials and the use of efficient construction techniques are critical to reducing the carbon footprint of pavement maintenance. Each of these maintenance materials has its own advantages and disadvantages, but all of them can be used as materials for crack and pothole maintenance, and the carbon emissions and costs of using them for maintenance are not the same. Therefore, in this study, three types of asphalt, namely petroleum asphalt, emulsified asphalt, and modified asphalt, were selected as fillers for cracks and potholes.
By reviewing the Technical Specification for Highway Asphalt Pavement Maintenance in China (JTG5142-2019) [23] and related information on pavement damage maintenance measures, the maintenance process for cracks and potholes is obtained, as shown in Figure 4.
Based on the above available maintenance materials, machines, and labor, combined with the maintenance process shown in Figure 4, a maintenance option selection table can be obtained, as shown in Table 2, and then, according to the maintenance strategy selection table, a total of 108 feasible maintenance strategies can be combined by choosing different labor, materials, and machines. Some of the 108 maintenance strategies are shown in Table 3.

2.3. Assessing the Carbon Emissions and Costs of These Strategies

2.3.1. Carbon Emissions Calculation Model

In the process of measuring the carbon emission of pavement maintenance engineering construction activities, it is easier and more convenient to use the “emission factor method” in the material production, construction, and transportation stages, which only needs to obtain the amount of material or energy consumption and combine it with the corresponding emission factors to calculate the final emissions. The block diagram of carbon emission calculation for each maintenance strategy is shown in Figure 5.
The carbon emissions of the asphalt pavement maintenance phase include three subphases: the raw material phase, the transportation phase, and the construction phase. The carbon emissions generated by them can be expressed by Equation (5).
E i = E i y c l + E i y s + E i s g ,
where E i means the total carbon emissions of the ith maintenance program in the asphalt pavement maintenance stage, E i y c l means the carbon emissions generated in the raw material stage of each maintenance strategy, E i y s means the carbon emissions generated in the transportation stage of each maintenance strategy, and E i s g means the carbon emissions generated in the construction stage of each maintenance strategy. They are all in k g .
According to the Standard for Calculating Carbon Emissions from Buildings (GB/T 51366-2019) [24], carbon emissions at the raw material stage should be calculated according to Equation (6).
E i y c l = j = 1 n M j F j ,
where E i y c l means the carbon emission (kg CO2) in the production phase of raw materials of the ith maintenance strategy, M j means the consumption of the jth raw material, and F j means the carbon emission factor of the j-th raw material (kg CO2/unit quantity of raw material).
The actual area of cracks and potholes can be obtained according to the identification of pavement damage dimensions in Section 2.1, and since the depth of cracks and potholes cannot be obtained directly by identification, the common depth of crack and pothole maintenance is chosen as the actual depth in this study, which is 2 cm and 4 cm, respectively, and then the volume of maintenance materials can be calculated. The consumption of the jth raw material M j can be calculated by Equation (7).
M j = ρ j V j
where ρ j means the density of the j-th raw material (kg/m3) and V j means the volume of the jth raw material (m3).
Carbon emissions from the transportation phase should be calculated according to Equation (8):
E i y s = j = 1 n M j D j T ,
where E i y s means the carbon emission (kgCO2) in the transportation phase of the ith maintenance strategy, M j means the consumption of the j-th material (t), D j means the average transportation distance of the jth material (km), and T means the carbon emission factor of transportation distance per unit weight (kg CO2/(t·km). It is appropriate to give priority to the actual transportation distance of materials. When the transportation distance of construction materials is unknown, the default transportation distance of 40 km given in the Standard for Calculating Carbon Emissions from Buildings (GB/T 51366-2019) [24] can be used.
Construction phase carbon emissions shall be calculated according to Equation (9):
E i s g = j = 1 n R j G j E j ,
where: E i s g means the carbon emission (kgCO2) during the construction phase of the ith type of maintenance strategy, R j means the energy consumption per unit shift of the jth type of construction machine (kg/shift or kW·h/shift), G j means the consumption of the jth type of construction machine unit shift (unit shift), and E j means the carbon emission factor of the energy used by the jth type of construction machine (kgCO2/kg or kg CO2/kW·h).

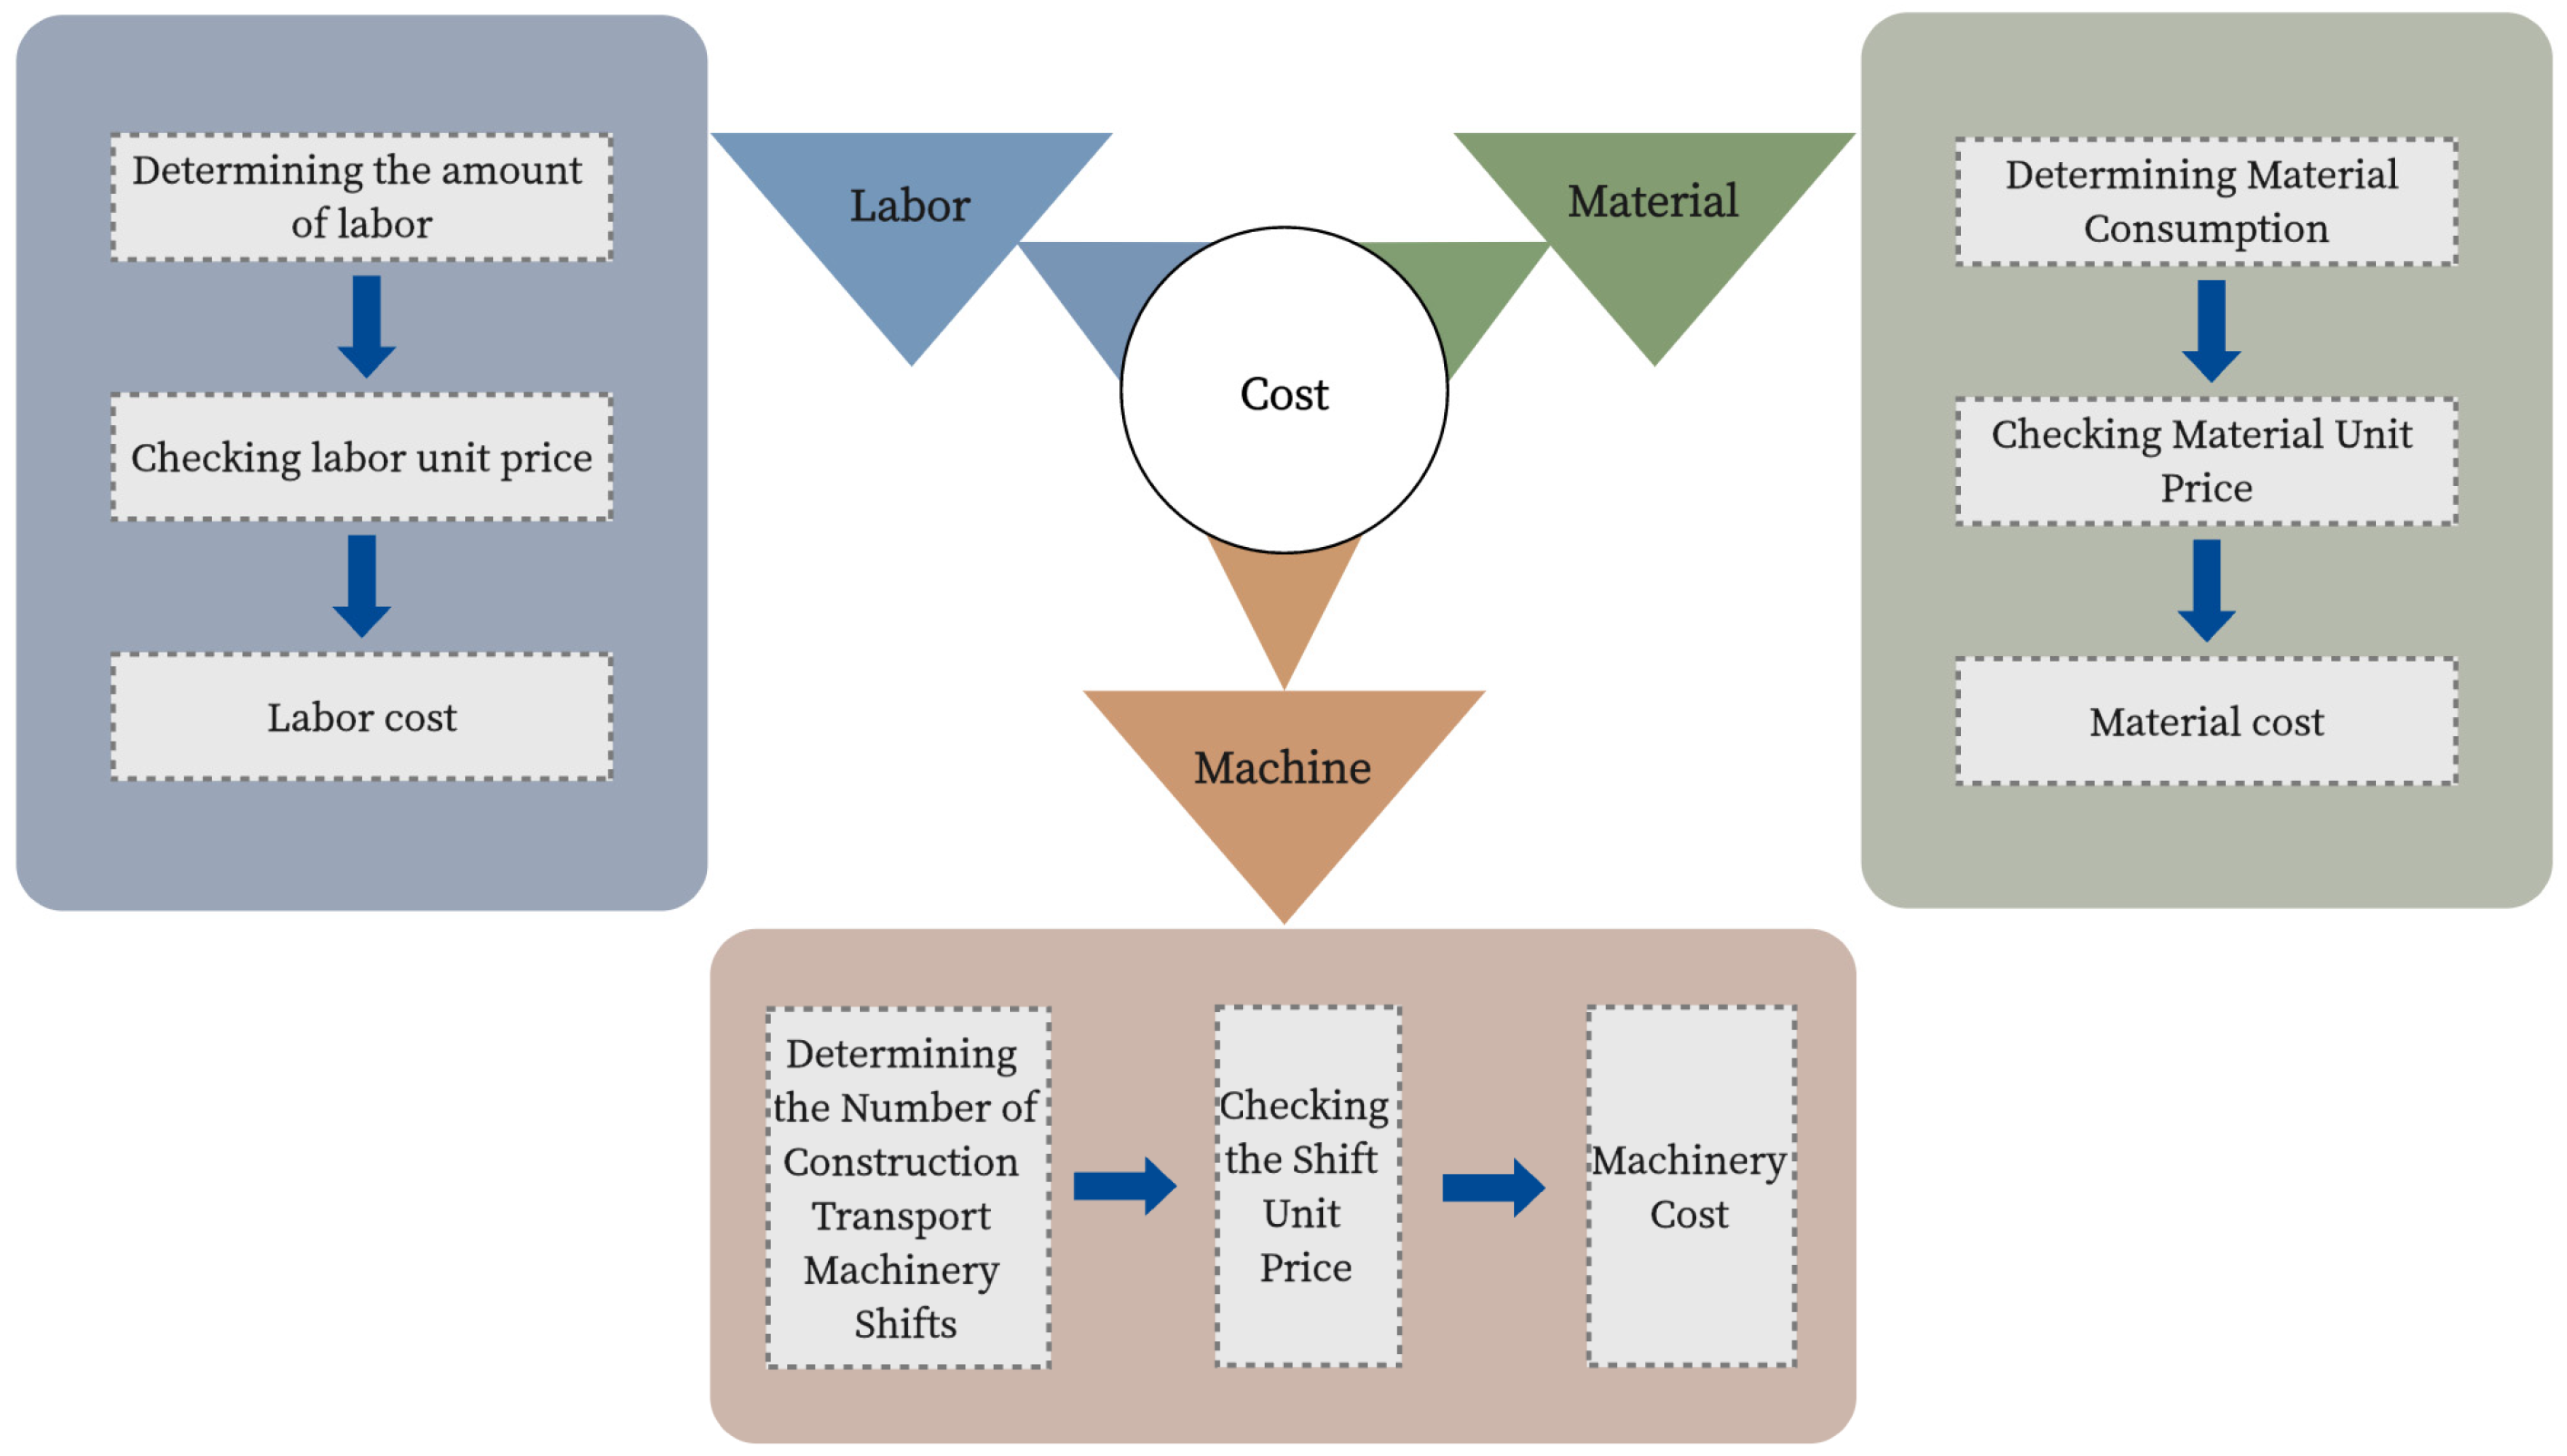
2.3.2. Maintenance Costs Calculation Model

Accurate costing is critical to the success of pavement maintenance projects. By comprehensively considering the cost of raw materials, labor, and machines, the maintenance cost of each maintenance program can be calculated, which in turn reflects the economic benefits of each maintenance strategy. The costing block diagram of the maintenance program in this study is shown in Figure 6.
The three sub-phases of the asphalt pavement maintenance phase are the raw material phase, the transportation phase, and the construction phase, so the cost of the maintenance program also comes from the labor, materials, and machines used in these three sub-phases, and the cost of the whole maintenance phase can be calculated by Equation (10):
C i = C i r g + C i c l + C i j x ,
where C i means the total cost of the ith maintenance strategy in the maintenance phase of asphalt pavement, C i r g means the labor cost of the ith maintenance strategy, C i c l means the material cost of the ith strategy, and C i j x means the machine cost of the ith maintenance strategy. All of them are in CNY.
The labor cost of the ith maintenance strategy is calculated through Equation (11):
C i r g = R i D i P 1 ,
where C i r g means the cost of labor for the ith maintenance strategy (CNY), R i means the number of laborers for the i-th maintenance strategy, D i means the number of hours of labor work for the ith maintenance strategy (man-days), and P 1 means the unit price of labor for composite labor (maintenance, municipal civil works).
The cost of materials for the ith maintenance strategy is calculated through Equation (12):
C i c l = M j P 2 j ,
where C i c l means the material cost of the ith maintenance strategy (CNY), M j means the consumption of the jth material in the ith maintenance strategy (t) and P 2 j means the price of the jth material in the ith maintenance strategy (CNY/t).
The cost of machine for the ith maintenance strategy is calculated by Equation (13):
C i j x = T j P 3 j ,
where C i j x means the machine cost of the ith maintenance strategy (CNY), T j means the working hours of the jth type of machine in the ith maintenance strategy (shift), and P 3 j means the price of the jth type of machine in the ith maintenance strategy (CNY/shift).

2.4. Optimizing Decisions on Pavement Maintenance

In this study, there are three objectives: the pavement condition index, the carbon emissions from maintenance strategies, and the maintenance costs. The main framework of the decision-making model is shown in Figure 7, where the pavement condition index serves as the direct basis for deciding whether pavement damage maintenance is needed, the carbon emissions generated by the maintenance strategy and the cost of the maintenance strategy together serve as the decision-making objectives, and the optimal maintenance strategy is selected through the TOPSIS model.
In the TOPSIS methodology, a uniform conversion of all metrics to positive metrics is a prerequisite for effective comparisons. Such a conversion ensures that when calculating the distance of each alternative from the ideal solution and the negative ideal solution, all metrics contribute to the direction of improving the comprehensive performance of the program. This uniformity of metrics is the key to evaluating different scenarios and determining the optimal choice in the TOPSIS methodology. Therefore, converting metrics to positive metrics is an important step in the TOPSIS-integrated evaluation method, which allows metrics of different natures to be evaluated and compared under a unified standard. This conversion simplifies the decision-making process and enables the TOPSIS method to be effectively applied in multi-objective decision making. There are two ways to convert a negative indicator to a positive indicator. If all the elements are positive, 1 / x can be used to convert it to a positive indicator. In addition to this, the conversion can be performed exclusively by subtracting the value of the indicator from the maximum value of that indicator. This conversion of the maximum value minus the value of the indicator is intuitive but may result in the difference between the maximum value and the value of the indicator having a large impact on the result, and requires careful adjustment of the weights, or it may introduce an unjustified bias. Moreover, when the indicator value is very close to the maximum value, small changes may lead to large differences in the converted values, resulting in instability. The 1 / x approach is more stable in dealing with situations close to the maximum value and is less susceptible to the influence of extreme values. So, in this study, the 1 / x approach is used to convert negative type indicators to positive type indicators.
Since the units of carbon emissions and costs generated by conservation are “kg/m3” and “CNY”, respectively, it is necessary to remove the excessive differences between the indicator values due to the different scales to ensure the validity of the evaluation indicators. In this paper, matrix standardization is used to eliminate the influence of different index outlines. From the 108 feasible maintenance strategies identified in Section 2.2, there are a total of 108 objects to be evaluated in this paper, and there are 2 evaluation indicators, carbon emissions and costs, which constitute the forwarding matrix as follows:
X = x 11 x 12 x 1 m x 21 x 22 x 2 m x n 1 x n 2 x n m ( n = 108 , m = 2 ) .
Then, the matrix to which it is normalized is denoted as Z, and each element in Z:
z i j = x i j / i = 1 n x i j 2 i = 1,2 , 108 , j = 1,2 ,
where z i j is normalized for each element and i = 1 n x i j 2 is the sum of the squares of the elements of the column in which it is located, resulting in the final matrix:
Z = z 11 z 12 z 1 m z 21 z 22 z 2 m z n 1 z n 2 z n m ( n = 108 , m = 2 ) .
Each row of the matrix represents two indicator values for the same scenario, and each column represents the same indicator value for 108 scenarios, and the next step will be to utilize the entropy-weighting method to calculate the weight of each indicator based on this matrix.
The basic idea of the entropy-weighting method is to determine the weight of each indicator as the entropy value of its correlation to avoid the bias brought by subjective assignment, and at the same time, it can reflect the interrelationships among the indicators. Specifically, in the construction of a multi-objective decision-making model, for the carbon emissions and conservation costs generated by each maintenance strategy, you can calculate the maximum and minimum values in the sample data matrix, as well as the score of each sample, and then find out the normalized value and entropy value of each indicator. The advantage of this method is that it is more flexible, unconstrained, and highly operable according to the importance of the indicators to give the corresponding weight, the important indicators to give a larger weight, and the unimportant indicators to give a smaller weight, which is more in line with the nature of the weight. In this paper, a total of 108 maintenance strategies are needed to make decisions, and it is known that there are a total of two maintenance strategies produced by the carbon emissions and the cost of the maintenance strategy of the two evaluation indicators, which can be obtained from the non-negative matrix:
Z = z 11 z 12 z 21 z 22 z n 1 z n 2 ( n = 108 )
The probability matrix P is then computed from the matrix Z , where each element p i j in P is computed as follows:
p i j = Z i j i = 1 n Z i j
For the jth indicator, its information entropy is calculated as
e j = 1 ln n i = 1 n p i j ln ( p i j ) ( j = 1,2 ) .
The larger e j means the larger the information entropy of the jth indicator, and the larger the information entropy means the larger the amount of information that can be supplemented by its value, so the amount of information known before supplementation is smaller, so the real amount of information that can be obtained through this indicator should be
d j = 1 e j .
Finally, the weight of each indicator can be expressed as
W j = d j / j = 1 m d j ( j = 1,2 ) .
With the indicator matrix Z determined in the previous two subsections and W j for each indicator, combined with the TOPSIS evaluation method, it is possible to obtain the most optimal solution for each indicator in these 108 scenarios:
Z + = Z 1 + , Z 2 + , , Z m + = max z 11 , z 21 , , z n 1 , max z 12 , z 22 , , z n 2 , , max z 1 m , z 2 m , , z n m .
And the least optimal solution for each metric in these 108 scenarios:
Z = Z 1 , Z 2 , , Z m = min z 11 , z 21 , , z n 1 , min z 12 , z 22 , , z n 2 , , min z 1 m , z 2 m , , z n m .
After determining the weights, define the distance between the ith (i = 1, 2,⋯, n) maintenance strategy and the optimal solution:
D i + = j = 1 m W j Z j + z i j 2 .
The distance of the ith (i = 1, 2,⋯, n) maintenance strategy score from the least desirable solution:
D i = j = 1 m W j ( z i j ) 2 .
Then, the score of the ith (i = 1, 2,⋯, n) maintenance strategy can be calculated: S i = D i D i + + D i . It can be seen that 0 S i 1 , and the larger the S i the smaller the D i + , which indicates that the score of the maintenance strategy is closer to the optimal solution, and finally, the computed S i is sorted, and the maintenance strategy with the highest score is the optimal maintenance strategy.

3. Data Collection and Processing

3.1. Data Collection

The amount of data required for image segmentation is not large, but the accuracy of the image is required to be high. This study also innovatively proposes the dimension recognition of pavement damage, which requires the collection of pavement damage images while recording the actual dimensions of the image, so it is necessary to manually collect the dataset by using the camera of a cell phone. We set the camera’s magnification to 1 and the shooting pixels to 1920 × 1080. Then, focus the lens on the pavement distress and use the camera’s autofocus function to focus. To ensure consistency across all images, we also utilized a tripod to hold the camera in place and keep the lens at the same distance from the pavement distress. We also turned on the auto-calibration feature in the phone’s camera setting. As shown in Figure 8, it is necessary to keep the cell phone parallel to the ground during the shooting process, to ensure that the pavement damage images obtained from the shooting and the actual pavement damage are in an equiproportional magnification relationship, which ensures the authenticity and accuracy of the actual dimension calculation of the pavement damage. To make sure the camera stayed parallel to the pavement distress, we tied a level to the camera and placed another level on the pavement. Observe the position of the bubble on the pavement level and then adjust the bubble position of the level on the camera to match that on the pavement. In addition, in the process of converting the pixel dimension to the actual dimension, to accurately obtain the actual dimension of the pavement damage, it is necessary to know the actual dimension of the photographed picture, so it is also necessary to place a constant dimension (60 × 60cm) box on the photographed pavement damage during the shooting process. If there is a situation where a rectangular frame may not be able to encompass pavement distress, we will use the approach shown in Figure 9 to ensure the integrity of each pavement distress image. In the subsequent data processing, the pavement damage pictures within the box are intercepted as the final image segmentation dataset (Figure 10). A total of 700 images of different types of cracks and 80 images of potholes were collected in this study in this way, and these data will be used for the subsequent training of the pavement damage dimension recognition algorithm. The method we present in this paper is applicable to all pavement distress detection. The reason we only have pothole and crack images is that these two types of pavement distress are more common. However, this does not conflict with our proposed method. If we can collect other types of distress, we can also train the segmentation model and propose the corresponding pavement distress maintenance strategy.
Through the construction market information service website, the labor information price can be queried for comprehensive labor (maintenance, municipal civil construction) per working day (8 h), which is CNY 230–256. This paper takes the average price of CNY 243 as the price of labor. The unit prices of materials and machines are shown in Table 4 and Table 5. Manual operation means that no additional labor cost is required if the machine is selected. Without manual operation, additional labor costs are required.
The inventory of raw material production stages will be based on the input–output LCA methodology, with no further breakdown of the process and no pursuit of boundary conditions. Calculations will simply be carried out using the generic “two-step method”, which only requires the determination of the quantity of material and the carbon emission factor to the corresponding baseline. The carbon emission factors for petroleum asphalt, emulsified asphalt, and modified bitumen according to the latest Eurobitume 2020 database are shown in Table 6.
The energy consumption and emission of the transportation stage are mainly considered to be generated by transporting the asphalt mixture from the mixing plant to the paving site, with the main reason for the energy consumption and emission being the diesel fuel consumed by the transportation vehicles. China’s asphalt pavement construction in order to match the pavement paving uses dump trucks and other transportation vehicles. In this paper, the energy consumption and emission of these vehicles are categorized into the transportation phase. According to the Construction Carbon Emission Calculation Standard (GB/T 51366-2019) [24], the carbon emission factors of various transportation modes are shown in Table 7.
The energy consumption and emissions during the construction phase of asphalt pavement maintenance are mainly generated by the energy consumed by the construction machines, including diesel and electricity. The energy consumption of machines per shift is shown in Table 8, according to the Cost Quota of Highway Engineering Machine Shifts (JTG/T 3833-2018) [25].

3.2. Data Processing

The goal of image segmentation is to divide an image into regions, each representing a category. Such a task requires labeling each pixel in the image and, therefore, requires a lot of manual labor. Nonetheless, image segmentation is important for understanding the semantic content of an image as it provides detailed information about the shape and location of an object. Image segmentation is annotated at the pixel level, which provides more detailed information but requires more manual labor. The data annotation is performed using the sprite annotation assistant (Figure 11), and a total of 50 images of various types of pavement damages are collected in this study because the amount of image data required for image segmentation is small. Then, the pixel-level labeling is performed. Mask information, as shown in Figure 12, is generated after the labeling is completed.

4. Experiments and Results

4.1. Model Training

The structure of the U-Net network can make it possible to still obtain good results on a small number of datasets [26,27,28]. This helps to reduce the volume of algorithms as well as increase the speed of algorithm training. So, we have selected 40 crack images and 10 pothole images from the collected images for training. Before starting the training, the images are split into a training set, validation set, and test set in the ratio of 8:1:1. Then, the corrupted images and corresponding mask files in the training set are put into the images file and labels folder under the train folder, and the corrupted images and corresponding mask files in the validation set are put into the images file and labels folder under the valid folder, respectively. In order to obtain the optimal hyperparameters, we include a loop at the entry point of the program run, and each loop randomly changes the preset hyperparameter values, as shown in Table 9. A batch and epochs were set up with reference to empirical data. The optimizer Adam was chosen because it combines the advantages of the AdaGrad and RMSProp optimizers, it is able to adaptively adjust the learning rate, and it is both efficient and easy to configure. The binary cross-entropy loss was chosen for the loss function because it is particularly well suited for dealing with pixel-level classification problems in networks such as U-Net that are used for image segmentation, and it is often used to differentiate the segmented object from the background. In addition to this, Dropout is usually set at 0.2 to 0.3 for cases with fewer training data. Then, the loop is started and, in the training loop, the training dataset is traversed, and a batch of images and corresponding segmentation masks are taken out each time. They are fed into the model, the loss function is computed, and the weights of the model are updated using the optimizer.
During the program loop, we found that when the batch was set to 8, there was a memory overflow. When the epochs was set to 70, the training error was much lower than the validation error, which is the phenomenon of overfitting. After all cases were trained, we found that the model had the highest segmentation accuracy when the parameters were set to the values shown in Table 10.
After the training is completed, the final segmented image is obtained by processing the resulting image to contain only the background and pavement damage, and the training process is shown in Figure 13. The change in loss value and the change in accuracy of the training process are shown in Figure 14.
As can be seen from the figure, as the training proceeds, the loss value gets smaller and smaller and the accuracy gets higher and higher. Although it is accompanied by certain fluctuations, the program will automatically record the best of the parameters as the result during the training process. The lowest point of the loss value in the figure is 0.3312, which indicates that the segmentation accuracy of the model has reached 96.88% at this point.

4.2. Dimension Recognition Result

After the training was completed, 20 pavement distress images were chosen to be collected from one of the sections of pavement with a length of 100 m and a width of 7 m for model validation. Some of the results are shown in Figure 15. The pixel values of the obtained binary images are input into Excel 2019 to get the Excel format, as shown in Figure 16, in which the cell with a pixel value of 0 represents the black background of the image, the points with pixel values that are not 0 are the pixel points of the pavement damage, and the pixel points accounted for by the damage of the pavement are counted out by counting out the number of the cells with cell values that are not 0 in the Excel file. The number of pixels occupied by the damaged pavement can be obtained by counting the number of cells in the Excel file that are not 0.
In this study, when collecting pavement damage images for image segmentation training, the dimension of the box used is 60 × 60 cm, the pixels of the image collected by cell phone shooting is 1920 × 1080, and the pixel dimension of the image obtained by intercepting the part of the box in it is 900 × 900, so the actual area represented by each pixel point is
3600 / 810,000 = 0.0044   c m 2
According to the results of image segmentation, the pixel information of the picture containing pixel values is converted into Excel format, the points in which the pixel is not 0 are counted, and the number of pixels occupied by the damage to the pavement of each picture as well as the actual area is obtained, as shown in Table 11.

4.3. Optimal Maintenance Strategy

The total area of cracks contained in this 100 m asphalt pavement was counted to be 1003.424 cm2 and the total area of potholes was 3695.27 cm2, which was brought into Equations (3) and (4) to obtain a pavement condition index of 78.087, which is between 71 and 80. From Table 1, it can be seen that the pavement needs minor maintenance. Then, through the carbon emission calculation method and cost calculation method of the maintenance program given in Section 2.3, the values of the two indexes for the 108 feasible maintenance strategies for this pavement are shown in Table 12. The scatter plot and linear relationship graph between them are shown in Figure 17 and Figure 18.
Based on the results of the calculations and the linear relationship between the two indicators, it can be seen that the correlation between them is not strong and that they are relatively independent. This indicates that a high-cost maintenance strategy does not imply low carbon, and a maintenance strategy with high carbon emissions does not imply economy. Due to the low correlation and independence of the evaluation indicators, a multi-objective decision-making process is needed to select a low-carbon and economic maintenance strategy based on these two indicators. Next, by using the decision objective data processing and entropy weighting method, we calculated that the weights of costs and carbon emissions were 12.40% and 87.60%, respectively. Then, according to the multi-objective decision-making model, the final composite score of the program was calculated, as shown in Table 13.
From the table, it can be seen that among all the maintenance strategies, No. 11 has the highest score, which is 99.16 points, the carbon emissions generated by this maintenance strategy is 33.75 kg, which is 30.80% lower than the highest carbon emissions (48.78 kg) among all the maintenance strategies, and the cost is CNY 464.99, which is 20.81% lower than the highest cost (CNY 587.18) among all the maintenance strategies. From the 108 maintenance strategies determined in Section 2.2, the optimal maintenance strategy can be derived, as shown in Table 14.

5. Conclusions

Effective pavement maintenance can significantly extend the service life of a road, and can also significantly reduce long-term maintenance costs, as well as reduce resource consumption and pollutant emissions during road construction and reconstruction. In this study, the actual dimension of pavement damage is recognized by using image segmentation technology. The PCI is calculated after pavement automatic detection, which provides a direct basis for decision making on whether or not maintenance is required. Then, combining the actual dimension of the pavement damage and the maintenance process, we summarize and generalize all the feasible maintenance schemes, calculate the carbon emissions and maintenance costs generated by all the maintenance schemes, and, finally, use the multi-objective decision-making model based on the TOPSIS model to give the optimal maintenance scheme in terms of badness benefit and economic benefit. The main conclusions of this paper are as follows:
(1)
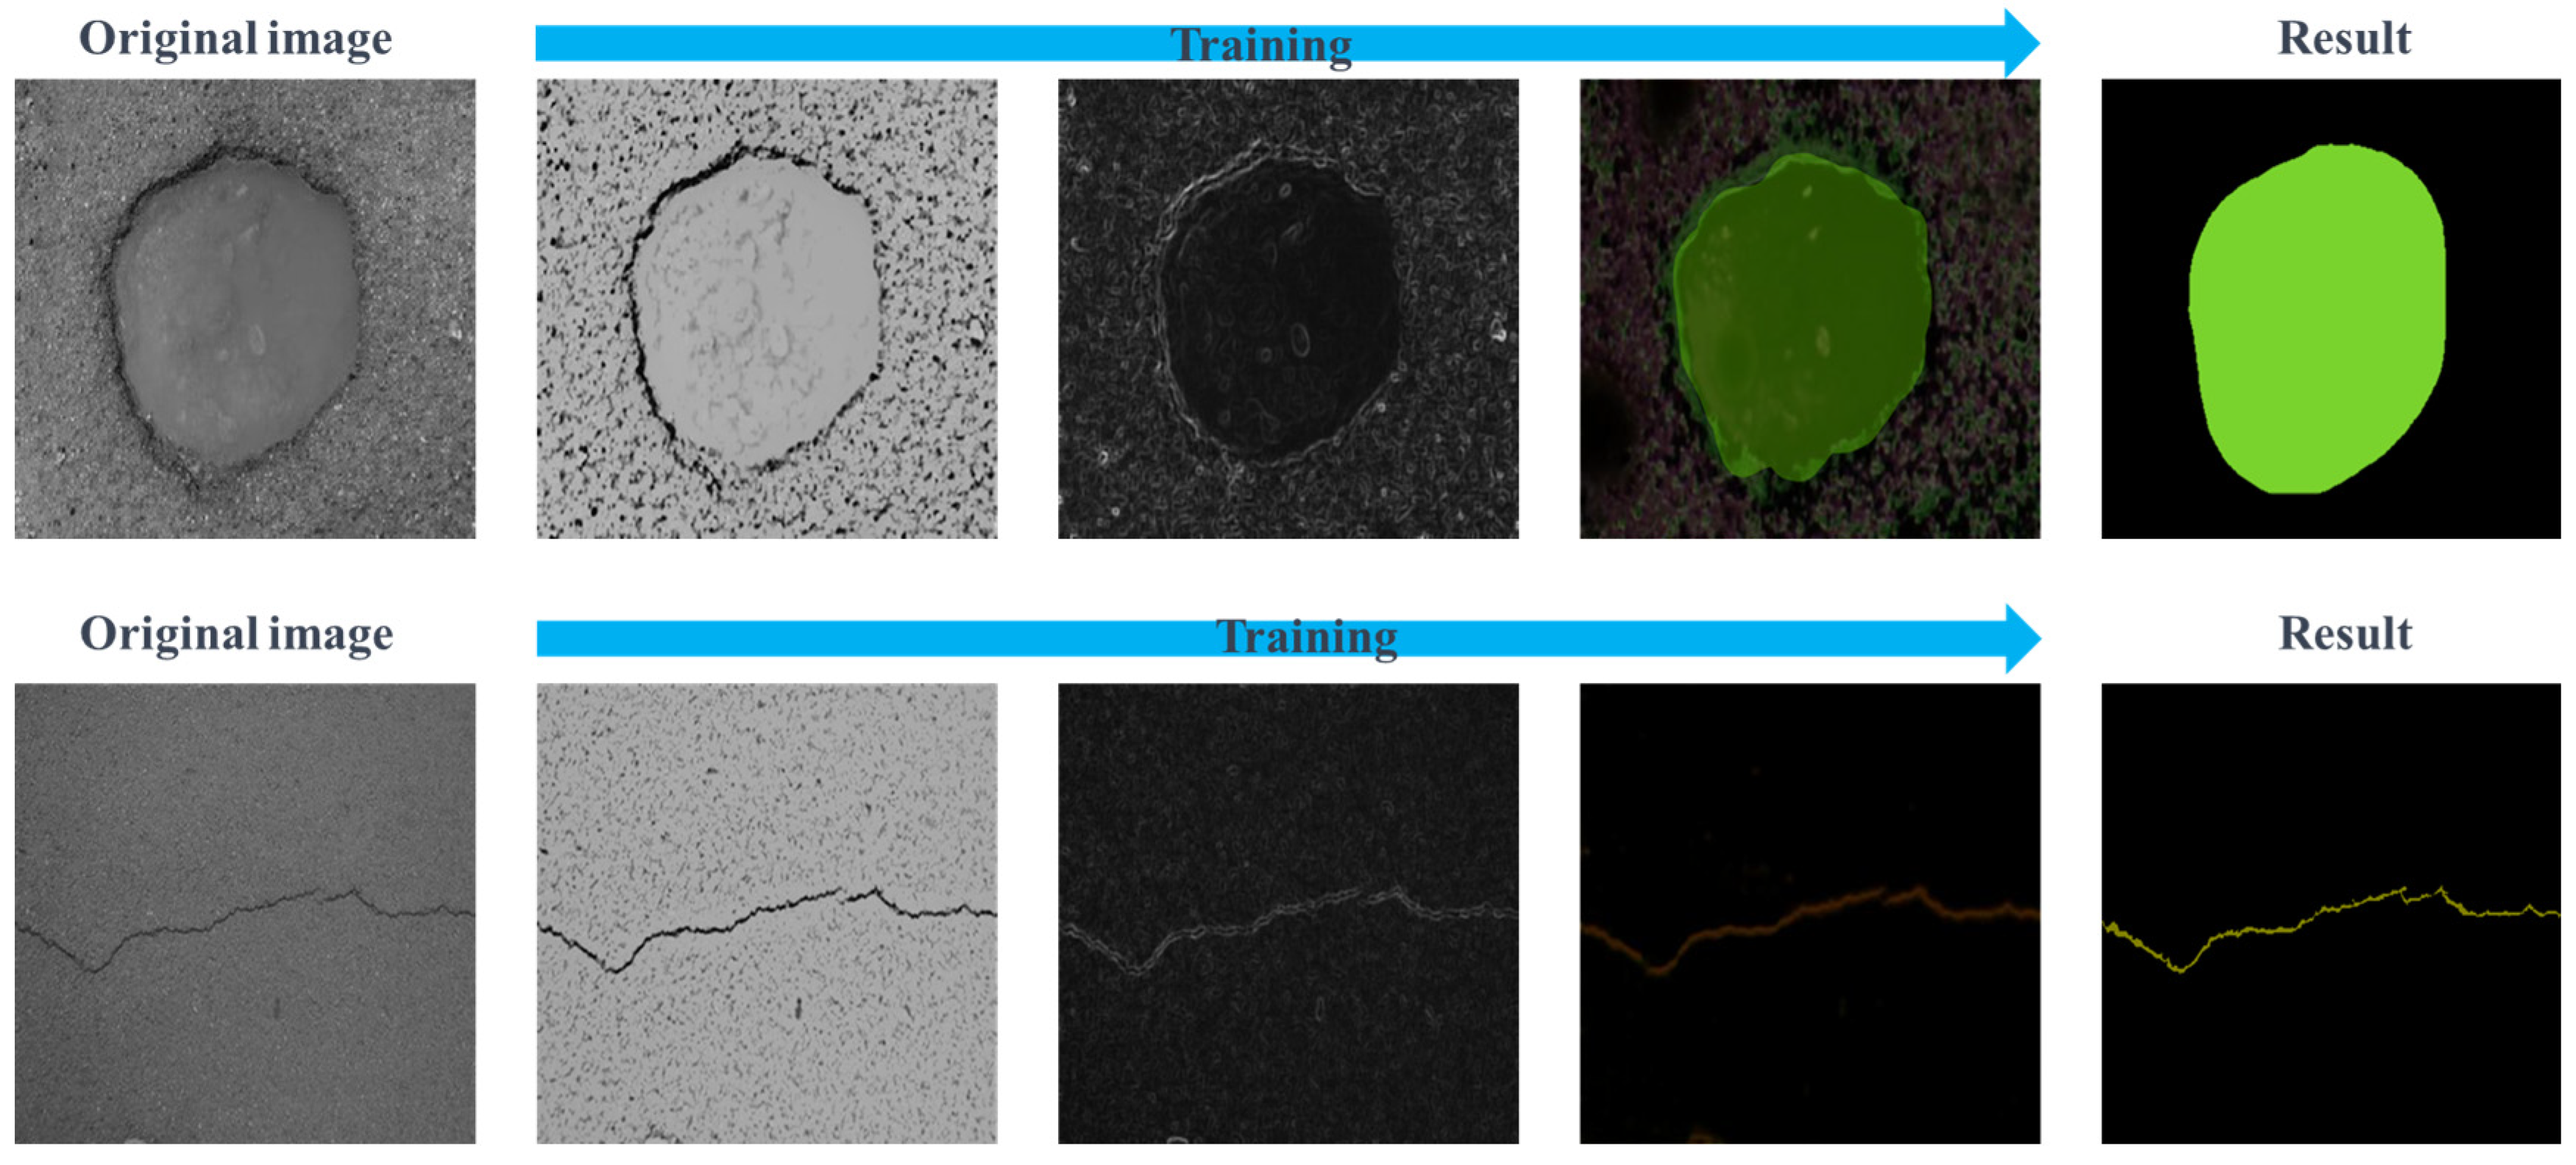
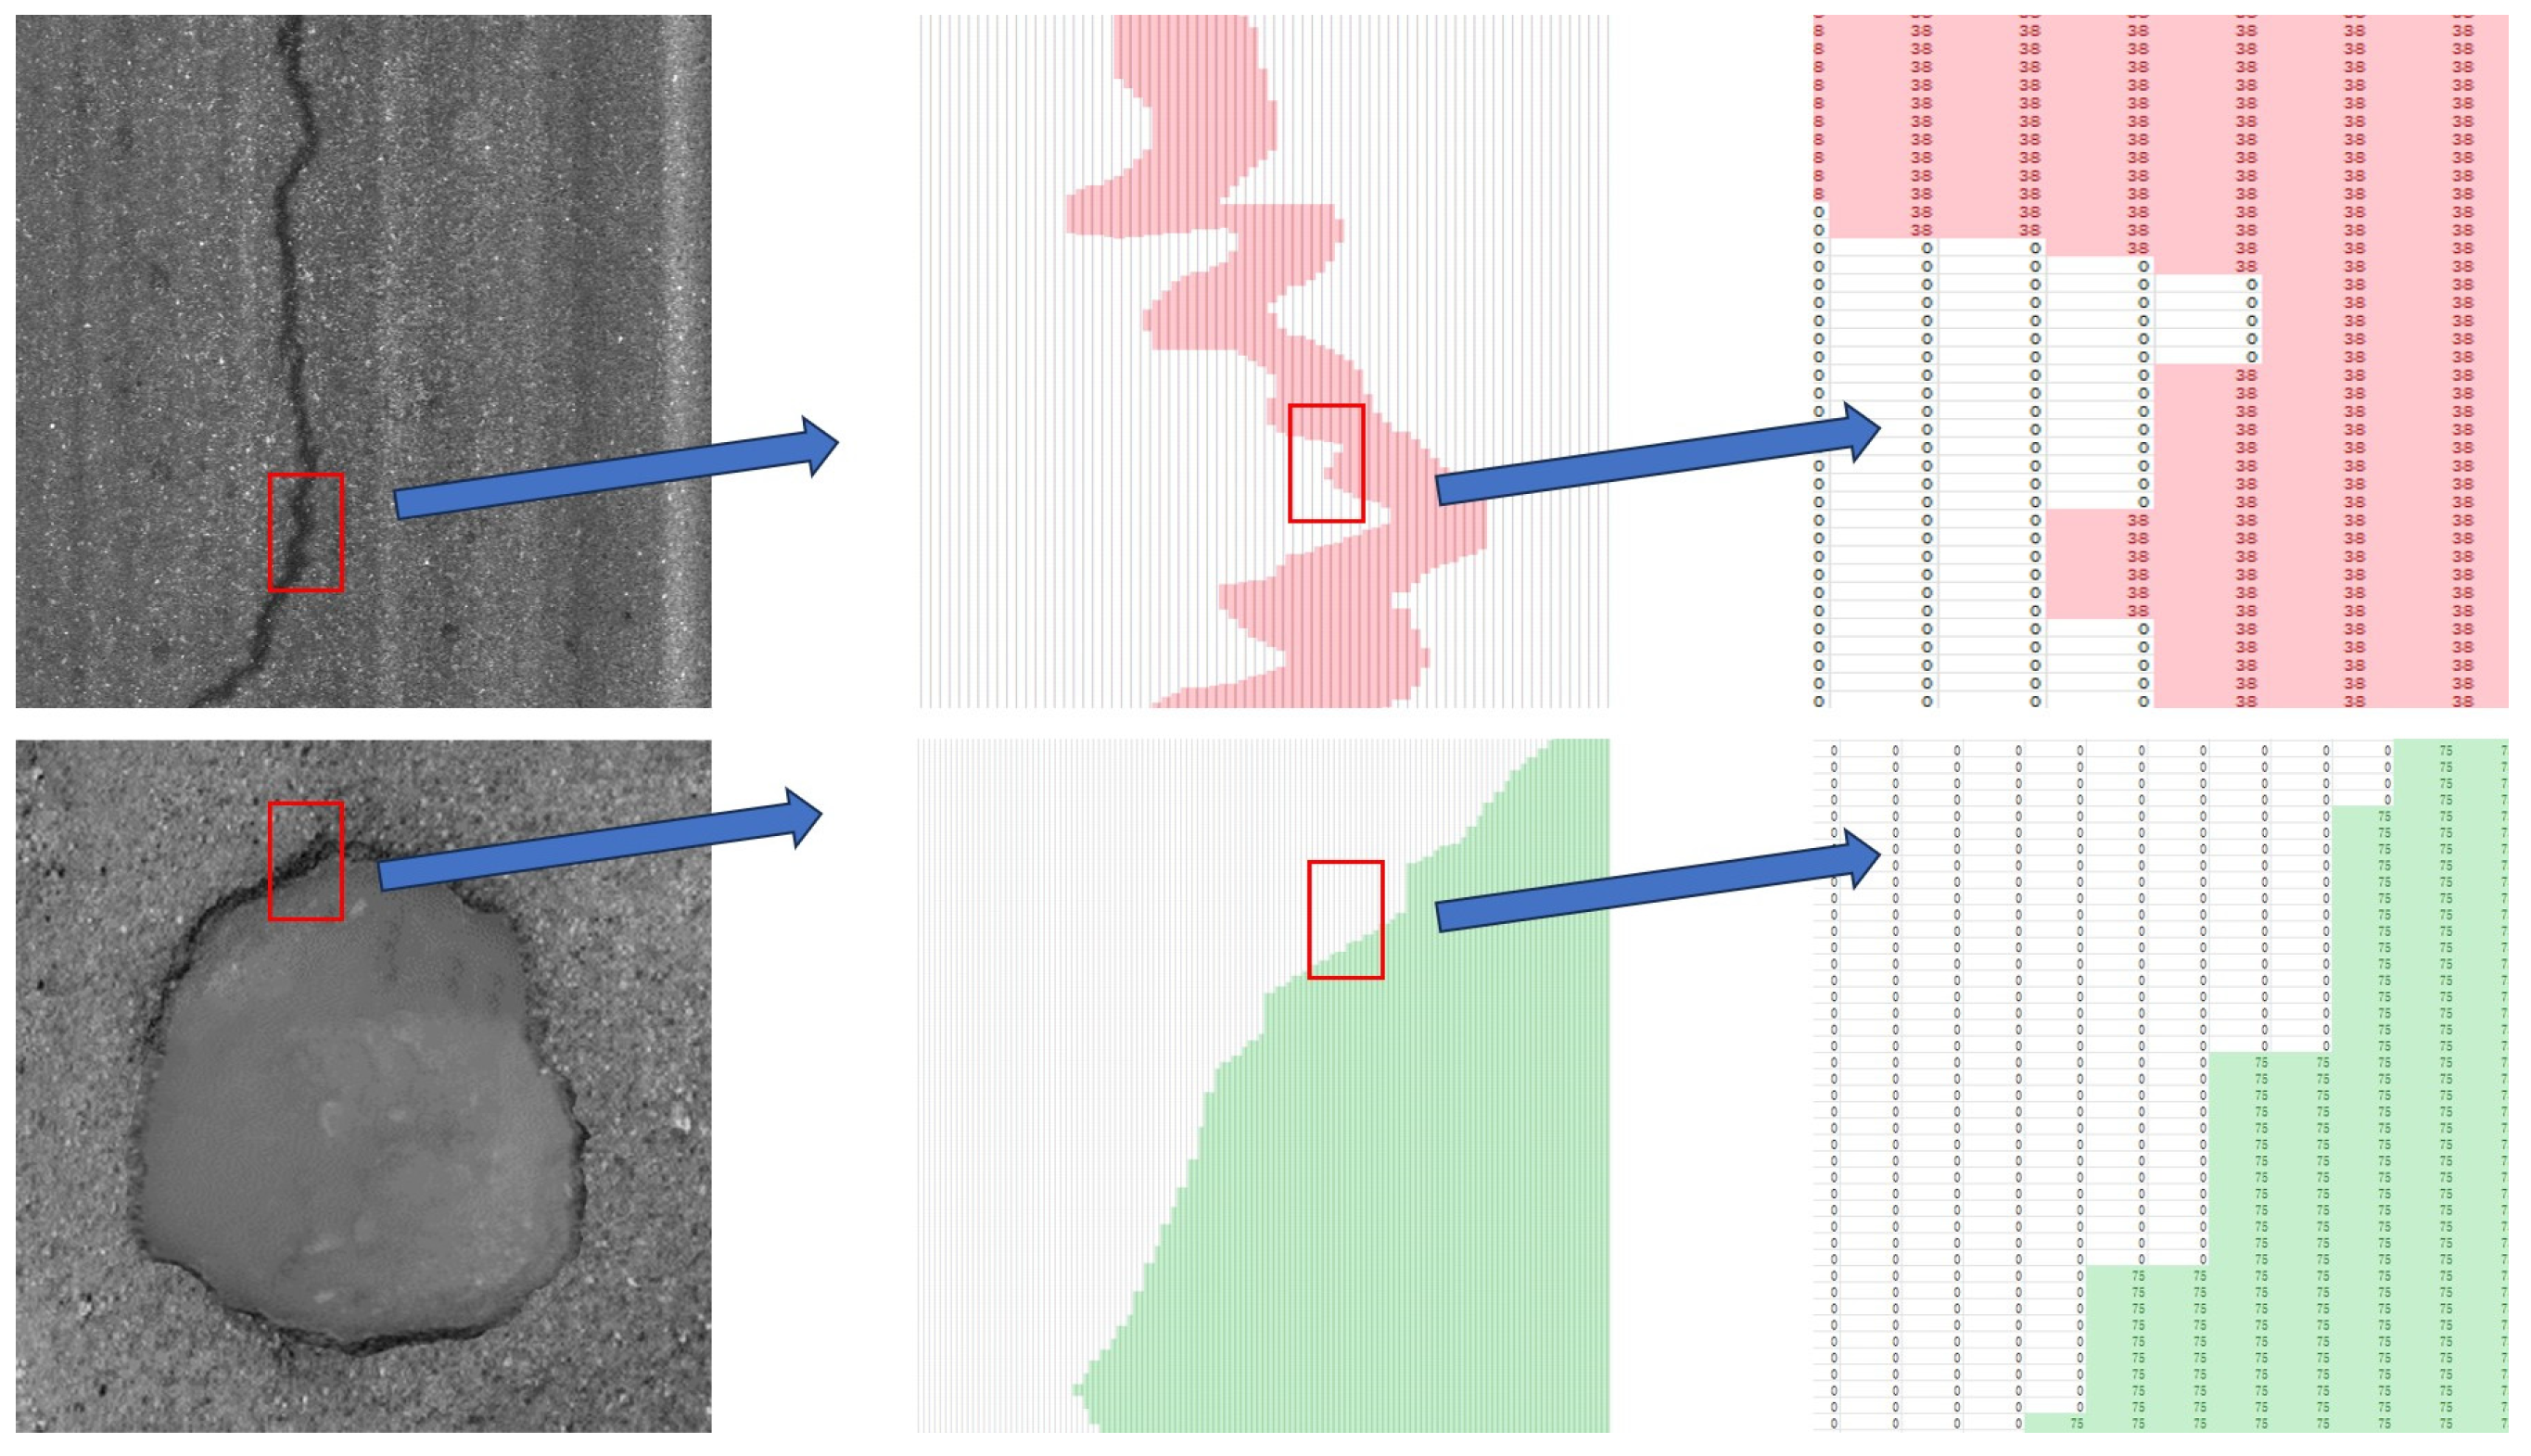
The U-Net algorithm is known for its symmetric U-shaped structure and effective jump connections, which enables it to achieve accurate image segmentation even on limited datasets, and likewise U-Net has a smaller dimension compared to other image segmentation algorithms. In the training process of this paper, the algorithm has achieved a loss value of 0.3312, which indicates that the segmentation is 96.88% efficient. Through accurate image segmentation, combining picture pixels with actual dimensions, this study accurately identifies the detected pavement damage dimensions, which provides a basis for calculating the pavement condition index, the carbon emissions of the maintenance program, and the maintenance cost.
(2)
This study accurately categorizes and identifies the dimension of the pavement damage in combination with actual cases and gives the decision of whether maintenance is needed or not by combining the PCI calculation formula. On this basis, decomposing the pavement damage maintenance process lists the labor, materials, and machines needed for maintenance, and then proposes all feasible maintenance strategies. Then, the carbon emissions and maintenance costs of these maintenance options were calculated by combining the actual dimensions of the pavement damage. Finally, through the multi-objective decision-making method based on the improved entropy-weighted TOPSIS model, the optimal maintenance strategy for cracks, in this case, was obtained by using petroleum asphalt as the material, grooving with a motorized cutter, cleaning and drying the cracks with a handheld motorized blower, grouting with an asphalt grouting machine, and, finally, repairing manually. For potholes, the optimal maintenance strategy is to use emulsified asphalt as material, use a road breaker for grooving, portable electric blower for cleaning and drying cracks, take manual paving, and, finally, use a small light wheel roller for compaction. The comprehensive score of this program is 99.16, the carbon emission generated in this case is 33.75 kg, and the cost of maintenance is CNY 464.99.
(3)
From Conclusion 2, it can be seen that the multi-objective decision-making model proposed in this study is able to give a specific low-carbon and economical maintenance strategy based on specific pavement conditions instead of giving a maintenance strategy that applies to all pavements. The problem that one model cannot be applied to most pavements is solved, and the generalizability of the decision-making model is greatly improved.
Nevertheless, due to the limitation of resources and technology, further in-depth research can be carried out in the following three aspects in future research:
(1)
In this study, only the actual area of the pavement damage was recognized when the pavement damage dimension recognition was performed, and the depth of the damage could not be accurately recognized, so the common depth of these damages was taken as the actual depth of the pavement damage. Future research can combine 3D image recognition technology to obtain a more accurate depth of pavement damage.
(2)
Due to the limitation of obtaining the carbon emission factor of materials, this study is not comprehensive enough in the selection of materials, and in the future, if the carbon emission factor of more new materials can be obtained, a lower carbon economic maintenance strategy can be proposed.

Author Contributions

Resources, D.C. and W.F.; writing—review and editing, D.C.; validation, D.C.; conceptualization, P.L.; methodology, P.L.; writing—original draft, P.L.; data analysis, P.L. and W.F.; visualization, P.L. All authors have read and agreed to the published version of the manuscript.

Funding

Research on carbon emission accounting method, indicator system and carbon emission monitoring platform framework for near-zero carbon surface roads. The funding number is: 23DZ1202102. This project is from: Shanghai 2023 “Science and Technology Innovation Action Plan” Science and Technology Support Carbon Peak Carbon Neutral Project Declaration Guidelines/Low Construction.

Institutional Review Board Statement

Not applicable.

Informed Consent Statement

Not applicable.

Data Availability Statement

The datasets generated and/or analyzed in the current study are available from the corresponding author upon reasonable request.

Conflicts of Interest

Author Wurong Fu was employed by the company Shanghai Road & Bridge (Group) Co., Ltd. The remaining authors declare that the research was conducted in the absence of any commercial or financial relationships that could be construed as a potential conflict of interest.

References

  1. Zakeri, H.; Nejad, F.M.; Fahimifar, A.; Torshizi, A.D.; Zarandi, M.H.F. A Multi-Stage Expert System for Classification of Pavement Cracking. In Proceedings of the 2013 Joint IFSA World Congress and NAFIPS Annual Meeting (IFSA/NAFIPS), Edmonton, AB, Canada, 24–28 June 2013; pp. 1125–1130. [Google Scholar]
  2. Gavilán, M.; Balcones, D.; Marcos, O.; Llorca, D.F.; Sotelo, M.A.; Parra, I.; Ocaña, M.; Aliseda, P.; Yarza, P.; Amírola, A. Adaptive Road Crack Detection System by Pavement Classification. Sensors 2011, 11, 9628–9657. [Google Scholar] [CrossRef] [PubMed]
  3. Nhat-Duc, H.; Nguyen, Q.-L.; Tran, V.-D. Automatic Recognition of Asphalt Pavement Cracks Using Metaheuristic Optimized Edge Detection Algorithms and Convolution Neural Network. Autom. Constr. 2018, 94, 203–213. [Google Scholar] [CrossRef]
  4. Oreto, C.; Veropalumbo, R.; Viscione, N.; Biancardo, S.A.; Russo, F. Investigating the Environmental Impacts and Engineering Performance of Road Asphalt Pavement Mixtures Made up of Jet Grouting Waste and Reclaimed Asphalt Pavement. Environ. Res. 2021, 198, 111277. [Google Scholar] [CrossRef]
  5. Zhang, J.; Sesay, T.; You, Q.; Jing, H. Maximizing the Application of RAP in Asphalt Concrete Pavements and Its Long-Term Performance: A Review. Polymers 2022, 14, 4736. [Google Scholar] [CrossRef] [PubMed]
  6. Bang, S.; Park, S.; Kim, H.; Kim, H. Encoder–Decoder Network for Pixel-Level Road Crack Detection in Black-Box Images. Comput. -Aided Civ. Infrastruct. Eng. 2019, 34, 713–727. [Google Scholar] [CrossRef]
  7. Li, S.; Zhao, X.; Zhou, G. Automatic Pixel-Level Multiple Damage Detection of Concrete Structure Using Fully Convolutional Network. Comput. -Aided Civ. Infrastruct. Eng. 2019, 34, 616–634. [Google Scholar] [CrossRef]
  8. Majidifard, H.; Adu-Gyamfi, Y.; Buttlar, W.G. Deep Machine Learning Approach to Develop a New Asphalt Pavement Condition Index. Constr. Build. Mater. 2020, 247, 118513. [Google Scholar] [CrossRef]
  9. Ouma, Y.O.; Hahn, M. Pothole Detection on Asphalt Pavements from 2D-Colour Pothole Images Using Fuzzy c-Means Clustering and Morphological Reconstruction. Autom. Constr. 2017, 83, 196–211. [Google Scholar] [CrossRef]
  10. Hoang, N.-D.; Nguyen, Q.-L.; Tien Bui, D. Image Processing–Based Classification of Asphalt Pavement Cracks Using Support Vector Machine Optimized by Artificial Bee Colony. J. Comput. Civ. Eng. 2018, 32, 04018037. [Google Scholar] [CrossRef]
  11. Yu, G.; Dong, J.; Wang, Y.; Zhou, X. RUC-Net: A Residual-Unet-Based Convolutional Neural Network for Pixel-Level Pavement Crack Segmentation. Sensors 2023, 23, 53. [Google Scholar] [CrossRef]
  12. Yu, B.; Gu, X.; Ni, F.; Guo, R. Multi-Objective Optimization for Asphalt Pavement Maintenance Plans at Project Level: Integrating Performance, Cost and Environment. Transp. Res. Part D Transp. Environ. 2015, 41, 64–74. [Google Scholar] [CrossRef]
  13. Hamdi, H.; Hadiwardoyo, S.P.; Correia, A.G.; Pereira, P. Pavement Maintenance Optimization Strategies for National Road Network in Indonesia Applying Genetic Algorithm. Procedia Eng. 2017, 210, 253–260. [Google Scholar] [CrossRef]
  14. Santos, J.; Ferreira, A.; Flintsch, G. An Adaptive Hybrid Genetic Algorithm for Pavement Management. Int. J. Pavement Eng. 2019, 20, 266–286. [Google Scholar] [CrossRef]
  15. Lee, J.; Madanat, S. Jointly Optimal Policies for Pavement Maintenance, Resurfacing and Reconstruction. EURO J. Transp. Logist. 2015, 4, 75–95. [Google Scholar] [CrossRef]
  16. Heidari, M.R.; Heravi, G.; Esmaeeli, A.N. Integrating Life-Cycle Assessment and Life-Cycle Cost Analysis to Select Sustainable Pavement: A Probabilistic Model Using Managerial Flexibilities. J. Clean. Prod. 2020, 254, 120046. [Google Scholar] [CrossRef]
  17. Vargas, D.E.C.; Lemonge, A.C.C.; Barbosa, H.J.C.; Bernardino, H.S. Solving Multi-Objective Structural Optimization Problems Using GDE3 and NSGA-II with Reference Points. Eng. Struct. 2021, 239, 112187. [Google Scholar] [CrossRef]
  18. Leite, B.; da Costa, A.O.S.; Costa Junior, E.F. da Multi-Objective Optimization of Adiabatic Styrene Reactors Using Generalized Differential Evolution 3 (GDE3). Chem. Eng. Sci. 2023, 265, 118196. [Google Scholar] [CrossRef]
  19. Chen, Z.; Wang, D. Numerical Analysis of a Multi-Objective Maintenance Decision-Making Model for Sustainable Highway Networks: Integrating the GDE3 Method, LCA and LCCA. Energy Build. 2023, 290, 113096. [Google Scholar] [CrossRef]
  20. Behzadian, M.; Khanmohammadi Otaghsara, S.; Yazdani, M.; Ignatius, J. A State-of the-Art Survey of TOPSIS Applications. Expert Syst. Appl. 2012, 39, 13051–13069. [Google Scholar] [CrossRef]
  21. Gong, H.; Liu, L.; Liang, H.; Zhou, Y.; Cong, L. A State-of-the-Art Survey of Deep Learning Models for Automated Pavement Crack Segmentation. Int. J. Transp. Sci. Technol. 2024, 13, 44–57. [Google Scholar] [CrossRef]
  22. JTG 5210—2018; Highway Performance Assessment Standard. Ministry of Transport of the People’s Republic of China: Beijing, China, 2019.
  23. JTG 5142—2019; Technical Specifications for Maintenance of Highway Asphalt Pavement. Ministry of Transport of the People’s Republic of China: Beijing, China, 2019.
  24. GB/T 51366—2019; Standard for building carbon emission calculation. Ministry of Housing and Urban-Rural Development of the People's Republic of China: Beijing, China, 2019.
  25. JTG/T 3833—2018; Cost Quota of Highway Engineering Machine Shifts. Ministry of Transport of the People’s Republic of China: Beijing, China, 2019.
  26. Jin, Q.; Meng, Z.; Pham, T.D.; Chen, Q.; Wei, L.; Su, R. DUNet: A Deformable Network for Retinal Vessel Segmentation. Knowl.-Based Syst. 2019, 178, 149–162. [Google Scholar] [CrossRef]
  27. Schlemper, J.; Oktay, O.; Schaap, M.; Heinrich, M.; Kainz, B.; Glocker, B.; Rueckert, D. Attention Gated Networks: Learning to Leverage Salient Regions in Medical Images. Med. Image Anal. 2019, 53, 197–207. [Google Scholar] [CrossRef] [PubMed]
  28. Ronneberger, O.; Fischer, P.; Brox, T. U-Net: Convolutional Networks for Biomedical Image Segmentation. In Medical Image Computing and Computer-Assisted Intervention—MICCAI 2015; Navab, N., Hornegger, J., Wells, W.M., Frangi, A.F., Eds.; Lecture Notes in Computer Science; Springer International Publishing: Cham, Switzerland, 2015; Volume 9351, pp. 234–241. ISBN 978-3-319-24573-7. [Google Scholar]
Figure 1. Research framework.
Sustainability 16 01257 g001
Figure 2. U-Net network architecture diagram.
Sustainability 16 01257 g002
Figure 3. The result of pavement distress image segmentation.
Sustainability 16 01257 g003
Figure 4. Pavement damage maintenance process.
Sustainability 16 01257 g004
Figure 5. Framework for calculating carbon emissions from maintenance strategies.
Sustainability 16 01257 g005
Figure 6. Framework maintenance costing.
Sustainability 16 01257 g006
Figure 7. Framework of decision modeling.
Sustainability 16 01257 g007
Figure 8. Schematic of image segmentation dataset shot.
Sustainability 16 01257 g008
Figure 9. Schematic diagram of how to photograph pavement distresses.
Sustainability 16 01257 g009
Figure 10. Schematic diagram of image segmentation dataset interception.
Sustainability 16 01257 g010
Figure 11. Data-labeling tool.
Sustainability 16 01257 g011
Figure 12. Results of image segmentation labeling.
Sustainability 16 01257 g012
Figure 13. Image segmentation training process.
Sustainability 16 01257 g013
Figure 14. Accuracy and loss value.
Sustainability 16 01257 g014
Figure 15. Image segmentation results.
Sustainability 16 01257 g015
Figure 16. Pixel value diagram.
Sustainability 16 01257 g016
Figure 17. Scatter plot of carbon emissions and costs.
Sustainability 16 01257 g017
Figure 18. Linear relationship diagram of carbon emissions and costs.
Sustainability 16 01257 g018
Table 1. Pavement damage ratings and maintenance countermeasures.
GradingExceptionalExcellentGoodModeratePoorVery Poor
PCI100~9190~8l80~7170~5150~31≤30
Maintenance Countermeasures-Routine
maintenance
Minor repairMedium repairMajor repairReconstruction
Table 2. Maintenance strategy selection table.
Pavement DamageMaterialGroovingCleaning and DryingSealing
Paving
Adjusting
Compaction
CrackPetroleum asphalt, emulsified asphalt, modified asphaltElectric concrete saw, manual groovingHandheld electric blowerAsphalt crack sealerManual adjusting
PotholePetroleum asphalt, emulsified asphalt, modified asphaltRoad breaker, manual groovingHandheld electric blowerMini asphalt paver, manual pavingManual operation of an electric compactor, mini smooth wheel roller
Table 3. Some of 108 maintenance strategies.
No.DistressMaterialGroovingCleaning and DryingSealing
Paving
Adjusting
Compaction
1CrackPetroleum asphaltManual groovingHandheld electric blowerAsphalt crack sealerManual adjusting
PotholeEmulsified asphaltManual groovingManual pavingManual operation of an electric compactor
2CrackPetroleum asphaltManual groovingAsphalt crack sealerManual adjusting
PotholeEmulsified asphaltManual groovingMini asphalt paverManual operation of an electric compactor
3CrackPetroleum asphaltManual groovingAsphalt crack sealerManual adjusting
PotholeEmulsified asphaltManual groovingManual pavingMini Smooth wheel roller
4CrackPetroleum asphaltManual groovingAsphalt crack sealerManual adjusting
PotholeEmulsified asphaltManual groovingMini asphalt paverMini Smooth wheel roller
5CrackPetroleum asphaltElectric concrete sawAsphalt crack sealerManual adjusting
PotholeEmulsified asphaltManual groovingManual pavingManual operation of an electric compactor
6CrackPetroleum asphaltElectric concrete sawAsphalt crack sealerManual adjusting
PotholeEmulsified asphaltManual groovingMini asphalt paverManual operation of an electric compactor
103CrackModified asphaltElectric concrete sawHandheld electric blowerAsphalt crack sealerManual adjusting
PotholeEmulsified asphaltManual groovingManual pavingMini Smooth wheel roller
104CrackModified asphaltElectric concrete sawAsphalt crack sealerManual adjusting
PotholeEmulsified asphaltManual groovingMini asphalt paverMini Smooth wheel roller
105CrackModified asphaltElectric concrete sawAsphalt crack sealerManual adjusting
PotholeEmulsified asphaltRoad breakerManual pavingManual operation of an electric compactor
106CrackModified asphaltElectric concrete sawAsphalt crack sealerManual adjusting
PotholeEmulsified asphaltRoad breakerMini asphalt paverManual operation of an electric compactor
107CrackModified asphaltElectric concrete sawAsphalt crack sealerManual adjusting
PotholeEmulsified asphaltRoad breakerManual pavingMini Smooth wheel roller
108CrackModified asphaltElectric concrete sawAsphalt crack sealerManual adjusting
PotholeEmulsified asphaltRoad breakerMini asphalt paverMini Smooth wheel roller
Table 4. Materials price list.
No.MaterialsPrice (CNY/t)
1Petroleum asphalt4950
2Emulsified asphalt4200
3Modified asphalt6050
Table 5. Machines Price List.
No.MachinesPrice (CNY/Shift)
1Electric concrete saw (with manual operation)303.05
2Handheld blower (without manual operation)2.07
3Asphalt crack sealer (with manual operation)209.78
4Road breaker (with manual operation)212.08
5Mini asphalt paver (with manual operation)652.84
6Electric compactor (without manual operation)32.08
7Mini smooth wheel roller (with manual operation)361.02
8Eight-ton truck (with manual operation)605.04
Table 6. Carbon emission factors of materials.
No.MaterialsCarbon Emission Factors (kgCO2/kg)
1Petroleum asphalt136.8
2Emulsified asphalt166.3
3Modified asphalt259.7
Table 7. Transportation mode carbon emission factors.
Transportation ModeCarbon Emission Factors [kgCO2/(t·km)]
Light-duty diesel truck transportation (2-ton capacity)0.286
Medium-duty diesel truck transportation (8-ton capacity)0.179
Heavy-duty diesel truck transportation (10-ton capacity)0.162
Heavy-duty diesel truck transportation (18-ton capacity)0.129
Heavy-duty diesel truck transportation (30-ton capacity)0.078
Heavy-duty diesel truck transportation (46-ton capacity)0.057
Table 8. Energy consumption of machines during the construction phase.
No.MachinesDiesel Fuel (kg/Shift)Electricity (k·Wh/Shift)
1Electric concrete saw-18.95
2Handheld blower-0.2
3Asphalt crack sealer9.81-
4Road breaker9.6-
5Mini asphalt paver27.43-
6Electric compactor-17.34
7Mini smooth wheel roller19.2-
Table 9. Model hyperparameters.
ParameterValue
Batch2, 4, 8
Epochs40, 50, 60, 70
OptimizerAdam
Loss functionBinary Cross-Entropy Loss
Dropout0.2, 0.3
Table 10. Image segmentation training parameter settings.
Parameter Settings
Batch4
Epochs60
optimizerAdam
loss functionBinary Cross-Entropy Loss
Dropout0.3
Table 11. Number of pixels and actual area.
No.Pavement DamageNumber of PixelsActual Area (cm2)No.Pavement DamageNumber of PixelsActual Area (cm2)
1Pothole310,2421365.06511Crack15,09266.4048
2Pothole240,3911057.7212Crack15,04366.1892
3Pothole289,2011272.48413Crack12,01652.8704
4Crack10,92348.061214Crack14,23062.612
5Crack13,49259.364815Crack15,02366.1012
6Crack23,410103.00416Crack14,83065.252
7Crack10,23145.016417Crack11,04248.5848
8Crack16,92374.461218Crack10,32145.4124
9Crack13,92161.252419Crack943141.4964
10Crack910240.048820Crack13,02157.2924
Table 12. Carbon emissions and costs of each maintenance strategy.
No.Cost
(CNY)
Carbon Emissions
(kgCO2)
No.Cost
(CNY)
Carbon Emissions
(kgCO2)
No.Cost
(CNY)
Carbon Emissions
(kgCO2)
1535.3222.4437543.0231.5673565.9035.96
2556.4233.0338564.0931.6974587.1836.10
3520.1828.6139527.8230.5675551.1334.98
4541.2729.8740548.8931.9576572.4136.37
5513.4123.8441521.0033.4577544.7337.89
6534.5134.4442542.0733.5878566.0138.02
7498.2730.0143505.8132.4579529.9636.90
8519.3631.2844526.8833.8380551.2338.30
9480.1327.5845487.6233.9681512.1938.43
10501.2238.1846508.6941.5382533.4644.32
11464.9933.7547472.4235.4483497.4137.92
12486.0844.3548493.4945.8284518.6948.09
13539.4829.1649546.6832.7685564.0236.84
14560.6729.2950567.7732.8986585.2136.97
15524.5428.1651531.5331.7687549.0835.85
16545.7329.5552552.6233.1488570.2737.24
17517.9831.0653524.7634.6589542.5138.74
18539.1731.1954545.8534.7790563.7138.88
19503.0430.0655509.6133.6491527.5737.75
20524.2331.4556530.7035.0392548.7739.14
21485.1031.5857491.4635.1593509.6439.27
22506.3040.2958512.5542.1694530.8444.59
23470.1634.4159476.3135.9695494.7038.08
24491.3644.9460497.4046.2796515.9048.17
25541.5530.3061554.5134.3297565.9338.19
26562.6630.4362575.6834.4598587.1138.32
27526.4529.2963539.5233.3399550.9537.19
28547.5630.6864560.7034.72100572.1238.58
29519.7232.1865532.9236.23101544.3440.09
30540.8332.3166554.0936.36102565.5140.22
31504.6131.1767517.9335.23103529.3639.10
32525.7332.5668539.1036.62104550.5340.49
33486.5132.6969499.9536.76105511.3840.62
34507.6340.8270521.1243.20106532.5545.37
35471.4134.8371484.9736.90107496.3938.76
36492.5245.2972506.1447.14108517.5648.78
Table 13. Maintenance strategy composite score.
No.ScoreNo.ScoreNo.ScoreNo.Score
128.382813.305564.638226.93
27.052948.565631.408381.03
348.513019.335787.778448.41
419.263172.595858.79853.48
560.613239.015997.07860.18
626.403392.226079.978711.51
781.253466.65618.00881.75
849.293598.44620.988916.99
996.613685.406320.60903.50
1076.183717.23644.879135.56
1199.16383.876528.259211.53
1291.003936.21668.099363.75
1321.334012.066750.979430.39
145.514146.286820.709584.08
1541.704217.896978.059652.87
1615.044370.627044.94972.81
1751.594437.087192.70980.12
1821.304591.217268.169910.06
1975.024664.94732.931001.34
2041.504798.18740.1910115.18
2193.354884.367510.101022.87
2268.724913.74761.3810332.85
2398.69502.637714.9610410.17
2486.575130.72782.8010560.85
2518.90529.287932.2210628.06
264.545340.19809.7910782.10
2738.525414.238159.8310850.16
Table 14. Optimal maintenance strategy.
Pavement DamageMaterialGroovingCleaning and DryingSealing
Paving
Adjusting
Compaction
CrackPetroleum asphaltElectric concrete sawHandheld electric blowerAsphalt crack sealerManual adjusting
PotholeEmulsified asphaltRoad breakerHandheld electric blowerManual pavingMini smooth wheel roller
Disclaimer/Publisher’s Note: The statements, opinions and data contained in all publications are solely those of the individual author(s) and contributor(s) and not of MDPI and/or the editor(s). MDPI and/or the editor(s) disclaim responsibility for any injury to people or property resulting from any ideas, methods, instructions or products referred to in the content.

