1. Introduction
A sense of security, as defined by the psychologist Abraham Maslow, is the feeling of being free from fear and anxiety, experiencing confidence, safety, and liberation [
1]. Studies in environmental psychology have substantiated a significant correlation between the characteristics of public spaces and a sense of security, highlighting that those spaces inducing a sense of security facilitate the establishment of a conducive social order [
2,
3,
4,
5]. Environmental behavioral studies indicate a mutual influence between individuals and their surroundings [
6,
7,
8,
9], emphasizing that physical environments are one of the principal factors influencing people’s psychological sense of security [
10,
11]. Universities, as relatively independent communities with distinctive characteristics, bear the crucial responsibility of talent cultivation, forming a vital part of the national social system and urban development. Campus public spaces, outside of the physical buildings, encompass open outdoor areas such as green spaces, squares, courtyards, and roadways [
12,
13]. These public spaces serve functions like recreation, outdoor exercise, gatherings, rest, sightseeing, and transportation, acting as essential conduits linking the faculty and students’ learning, work, and lives [
14,
15,
16,
17]. Safe campus public spaces foster a welcoming and nurturing environment, nurturing a sense of belonging and identity among faculty and students, aiding in their integration into the campus environment, and facilitating effective teaching activities [
18]. In today’s era where higher education reaches a broader audience, enhancing the sense of campus security for faculty and students presents an increasingly pressing challenge in both Western and Eastern nations. A comprehensive understanding of the correlation between campus physical environments and user perceptions is crucial to elevating the quality of safety in campus public spaces.
With the frequent occurrence of security incidents on university campuses, research into the sense of security in public spaces within these campuses is continually evolving. In terms of security assessments, Negi [
19] conducted in-depth interviews with students and found that areas with insufficient night lighting, distant from central zones, where people were scarce, and dense vegetation tended to evoke feelings of insecurity among students. Enkai and others [
20] indicated a correlation between environmental cues (such as the absence of natural surveillance) and crime risks, resulting in a lower sense of security among faculty and students. Claire [
2] and Azevedo et al. [
21], on the other hand, found through a questionnaire study that fear of crime and satisfaction with campus security measures significantly affect students’ sense of campus safety. These studies have collectively focused on the subjective perceptions of campus security among faculty and students. However, their evaluation methods have primarily involved field surveys and questionnaires, mostly targeting individual factors, with limited comprehensive analyses of psychological perceptual factors influencing security perceptions. Moreover, there is a lack of investigation and statistical analysis of temporal factors contributing to differences in the sense of security.
In terms of security optimization, since Jane Jacobs introduced the concept of ‘eyes on the street’ in 1961, emphasizing the necessity of visual surveillance in creating safe streets [
22], C. Ray Jeffery, influenced by Jane Jacobs, proposed the theory of crime prevention through environmental design (CPTED) in 1971 as a strategy to prevent urban crime through environmental design [
23]. Building upon the CPTED theory and methods, Xiao Ailing et al. [
24] analyzed the current security status within campuses, emphasizing the need for dual surveillance—natural and device-based—for enhancing security in open campus environments. Lawrence J. Fennelly [
25] suggested that university campus insecurity could be reduced by means such as campus beautification and increased illumination. Shiue [
26] proposed design strategies for optimizing green spaces in response to issues like poor accessibility and inadequate vegetation trimming within campuses. However, most of these strategies for enhancing campus security perceptions are theory-based, primarily focusing on the policy and management aspects that lack objective and quantifiable analyses for optimizing public space layouts [
27,
28].
In order to delve deeper into studying the sense of security in campus public spaces and to provide more targeted and effective optimization measures to enhance that sense of security among faculty and students, it is essential to evaluate security perceptions across various influencing factors and different timeframes. This comprehensive assessment aims to propose more extensive and targeted optimization strategies for enhancing the sense of security on campus.
Overall, our study employs a combined qualitative and quantitative research approach, starting with the psychological perceptions of public facility users. We comprehensively consider the physical environmental features of university campus public spaces, establishing an evaluation index system encompassing both daytime and nighttime safety perceptions. The analytic hierarchy process (AHP) is utilized to determine index weights, constructing an exhaustive evaluation model for campus safety during both time periods. Furthermore, based on these assessments and incorporating the maximal covering location problem (MCLP), we propose a systematic approach for optimizing the layout of public facilities on campus. This endeavor aims to offer a substantial reference resource and support for enhancing the sense of security within campus environments.
2. Literature Review
As the scale of university campuses expands and the number of students increases, the sense of security in campus public spaces directly influences the quality of life and the learning and working environments for students and faculty. This paper explores how to establish a scientific evaluation model and optimize the enhancement of the sense of security in campus public spaces. Initially, a systematic review of relevant literature on campus public spaces, evaluation, and optimization of sense of security is conducted. The aim is to provide a solid theoretical foundation for the subsequent construction of related models.
2.1. Research on Campus Public Spaces
University campus public spaces, as a unique type of urban public space, intricately intertwine with urban public spaces while remaining relatively independent. They connect various functional clusters within the campus, playing a crucial role in showcasing campus culture and spirit and fostering student development. Research related to these spaces has garnered widespread attention from the international academic community [
29,
30,
31], covering multiple aspects such as perception, design, and management of campus public spaces.
In the aspect of perception, Alnusairat et al. [
14], through surveys and simulation studies, investigated the impact of university outdoor open spaces on student well-being, creative development, and education. They highlighted the significance of public spaces in influencing student behavior and perception. Dong et al. [
15] provided a comprehensive overview of the development of perception research on university campus public spaces over the past 20 years. They identified three stages in the evolution of perception research: initial development, rapid growth, and stable development. The review encompassed studies on thermal perception, health impact perception, spatial configuration perception, and user activity perception. The authors emphasized the development direction of student-oriented campus space design. Trawalter et al. [
32] examined the usage patterns of low socioeconomic status students in higher education regarding public spaces, exploring the relationship between campus public spaces and student sense of belonging.
In the realm of design and management, Soares et al. [
33] conducted a case study involving inner-city campuses and technology park areas of two universities. They aimed to address the issues of public spaces being perceived as residual and poorly managed. The study suggested that proximity between space functionality and physical features could be utilized as a tool in planning and design. This approach could result in campus public spaces that convey implicit knowledge, possess attractiveness, foster a sense of community, and provide a sense of place. Tochaiwat et al. [
34], through simulation studies, investigated the impact of trees on enhancing the comfort period of university campus public spaces. They discussed the potential of greenery to improve the environmental conditions of campus public spaces. Tudorie et al. [
35] conducted an online survey to gather the opinions, satisfaction levels, and outdoor area-related needs of faculty and students regarding campus public spaces. The study explored the capabilities of different campus public spaces in providing cultural, supply, and regulatory landscape services.
2.2. Research on the Evaluation and Optimization of the Sense of Security
The sense of security is a widely discussed topic in various fields, involving complex relationships among individuals, society, and the environment. It is typically influenced by multiple factors [
36,
37,
38]. Scholars both domestically and internationally have primarily focused their research on the evaluation and optimization of the sense of security in three main aspects.
First, theoretical research is conducted. The sense of security falls within the interdisciplinary research domain, requiring the application of theories and methods from various disciplines to explain the reasons and mechanisms behind the formation of individual security feelings. Environmental psychology reveals the patterns of psychological activities that occur and develop under various environmental conditions, encompassing the behaviors, perceptions, and emotional responses of individuals in diverse environments [
39]. Its goal is to improve the relationship between humans and their environment, making human-made environments more humane. CPTED theory builds upon environmental psychology and further emphasizes the relationship between people and the environment. It asserts that individuals interpret the characteristics of their surroundings and respond accordingly based on their perceptions. This theory believes that properly planned spaces serve as effective warnings to potential intruders, allowing for early control and reduction of potential criminal possibilities, thereby enhancing residents’ sense of security. Silva et al. [
40] selected four highly relevant urban architectural environmental indicators to create a single indicator. They then used correlation and regression analyses to explore the relationships between these indicators and five categories of crime. The study emphasized that urban planners should consider the principles of CPTED and Broken Windows Theory (BWT) when designing spaces. Kyun et al. [
41] pointed out that security measures, such as lighting facilities, can be increased before criminals commit crimes to suppress their psychological tendencies.
Second, scholars have focused on researching the scale, delving into individuals’ sense of security from different spatial perspectives such as streets, parks, and communities. They explore how optimizing space design and social interactions can elevate levels of security feelings.
In the context of street spaces, research centers on the comprehensive impact of lighting and visibility, social environments, and public safety conditions on individual sense of security. Wu et al. [
42], utilizing multi-source big data, constructed an assessment system comprising four dimensions: walkability, spatial enclosure, visual permeability, and vitality. They conducted a large-scale evaluation of the safety of street design from the perspective of individual perception. Studies on parks and green spaces focus on natural elements, activities, social interactions, and how design and layout influence people’s perceptions and sense of security in these environments. Evensen et al. [
43] conducted on-site experiments to assess whether the height of fences in green spaces affects users’ sense of security. The evaluation of community environments includes aspects such as neighborly relations, public facilities, and overall planning, aiming to understand the impact of community structure on the sense of security for individuals and the entire community. Pang et al. [
44], starting from the evaluation of spatial accessibility, spatial recognizability, spatial privacy, and community services, identified the main influencing factors on the sense of security in outdoor public spaces within communities. Additionally, transportation spaces are also included in the research scope, examining the impact of traffic safety and accessibility on pedestrians’ sense of security [
45,
46].
Finally, research methods for the evaluation and optimization of the sense of security are multidimensional and comprehensive. By combining survey questionnaires, researchers can obtain subjective evaluations from individuals regarding environmental features, social factors, and personal experiences, providing rich information for understanding a sense of security. For example, Shao et al. [
47] recruited 1206 Chinese adults to complete survey questionnaires, exploring the relationship between a sense of security and social trust. Field observations, involving the recording of features and social interactions in actual environments, deepen the understanding of the specific contexts in which the sense of security is formed. This includes observations related to street layouts, lighting levels, and community facilities. Geographic information system (GIS) analysis involves processing geographical spatial data to assess objective factors related to the sense of security, such as environmental features and crime rates. Researchers are provided with quantitative information on spatial distribution. For instance, Tagliabue et al. [
48] conducted GIS analysis using lighting data generated from Internet of Things (IoT) sensors to assess the safety of urban areas. The study revealed that reasonable increases in lighting can enhance citizens’ sense of security. The integrated application of these methods provides powerful tools for uncovering the multidimensional influencing factors of the sense of security. This, in turn, aids in the formulation of more targeted security optimization strategies, ultimately enhancing the overall safety levels of society and the environment.
2.3. Evaluation of the Literature Review
In conclusion, the related research on campus public spaces and the sense of security has accumulated a substantial body of work, primarily focusing on perspectives such as environmental design and planning [
49], psychological factors [
50], and technological applications [
51]. This has provided a solid research foundation for exploring the evaluation and optimization of a sense of security. However, there is still a need for further enrichment in the assessment of the sense of security on university campuses, considering their unique status as a specific type of urban space.
Therefore, this paper intends to focus on the scale of campus public spaces, taking a combined perspective of the physical environment and psychological perception. It aims to select core factors influencing the perception of security, construct a day-and-night campus security perception evaluation model, and employ this model for empirical testing. The goal is to deeply analyze the mechanisms of the sense of security, enrich the research perspective on campus security, and provide theoretical and practical references for promoting the development of safe and sustainable university campuses.
3. The Sense of Security Evaluation Method
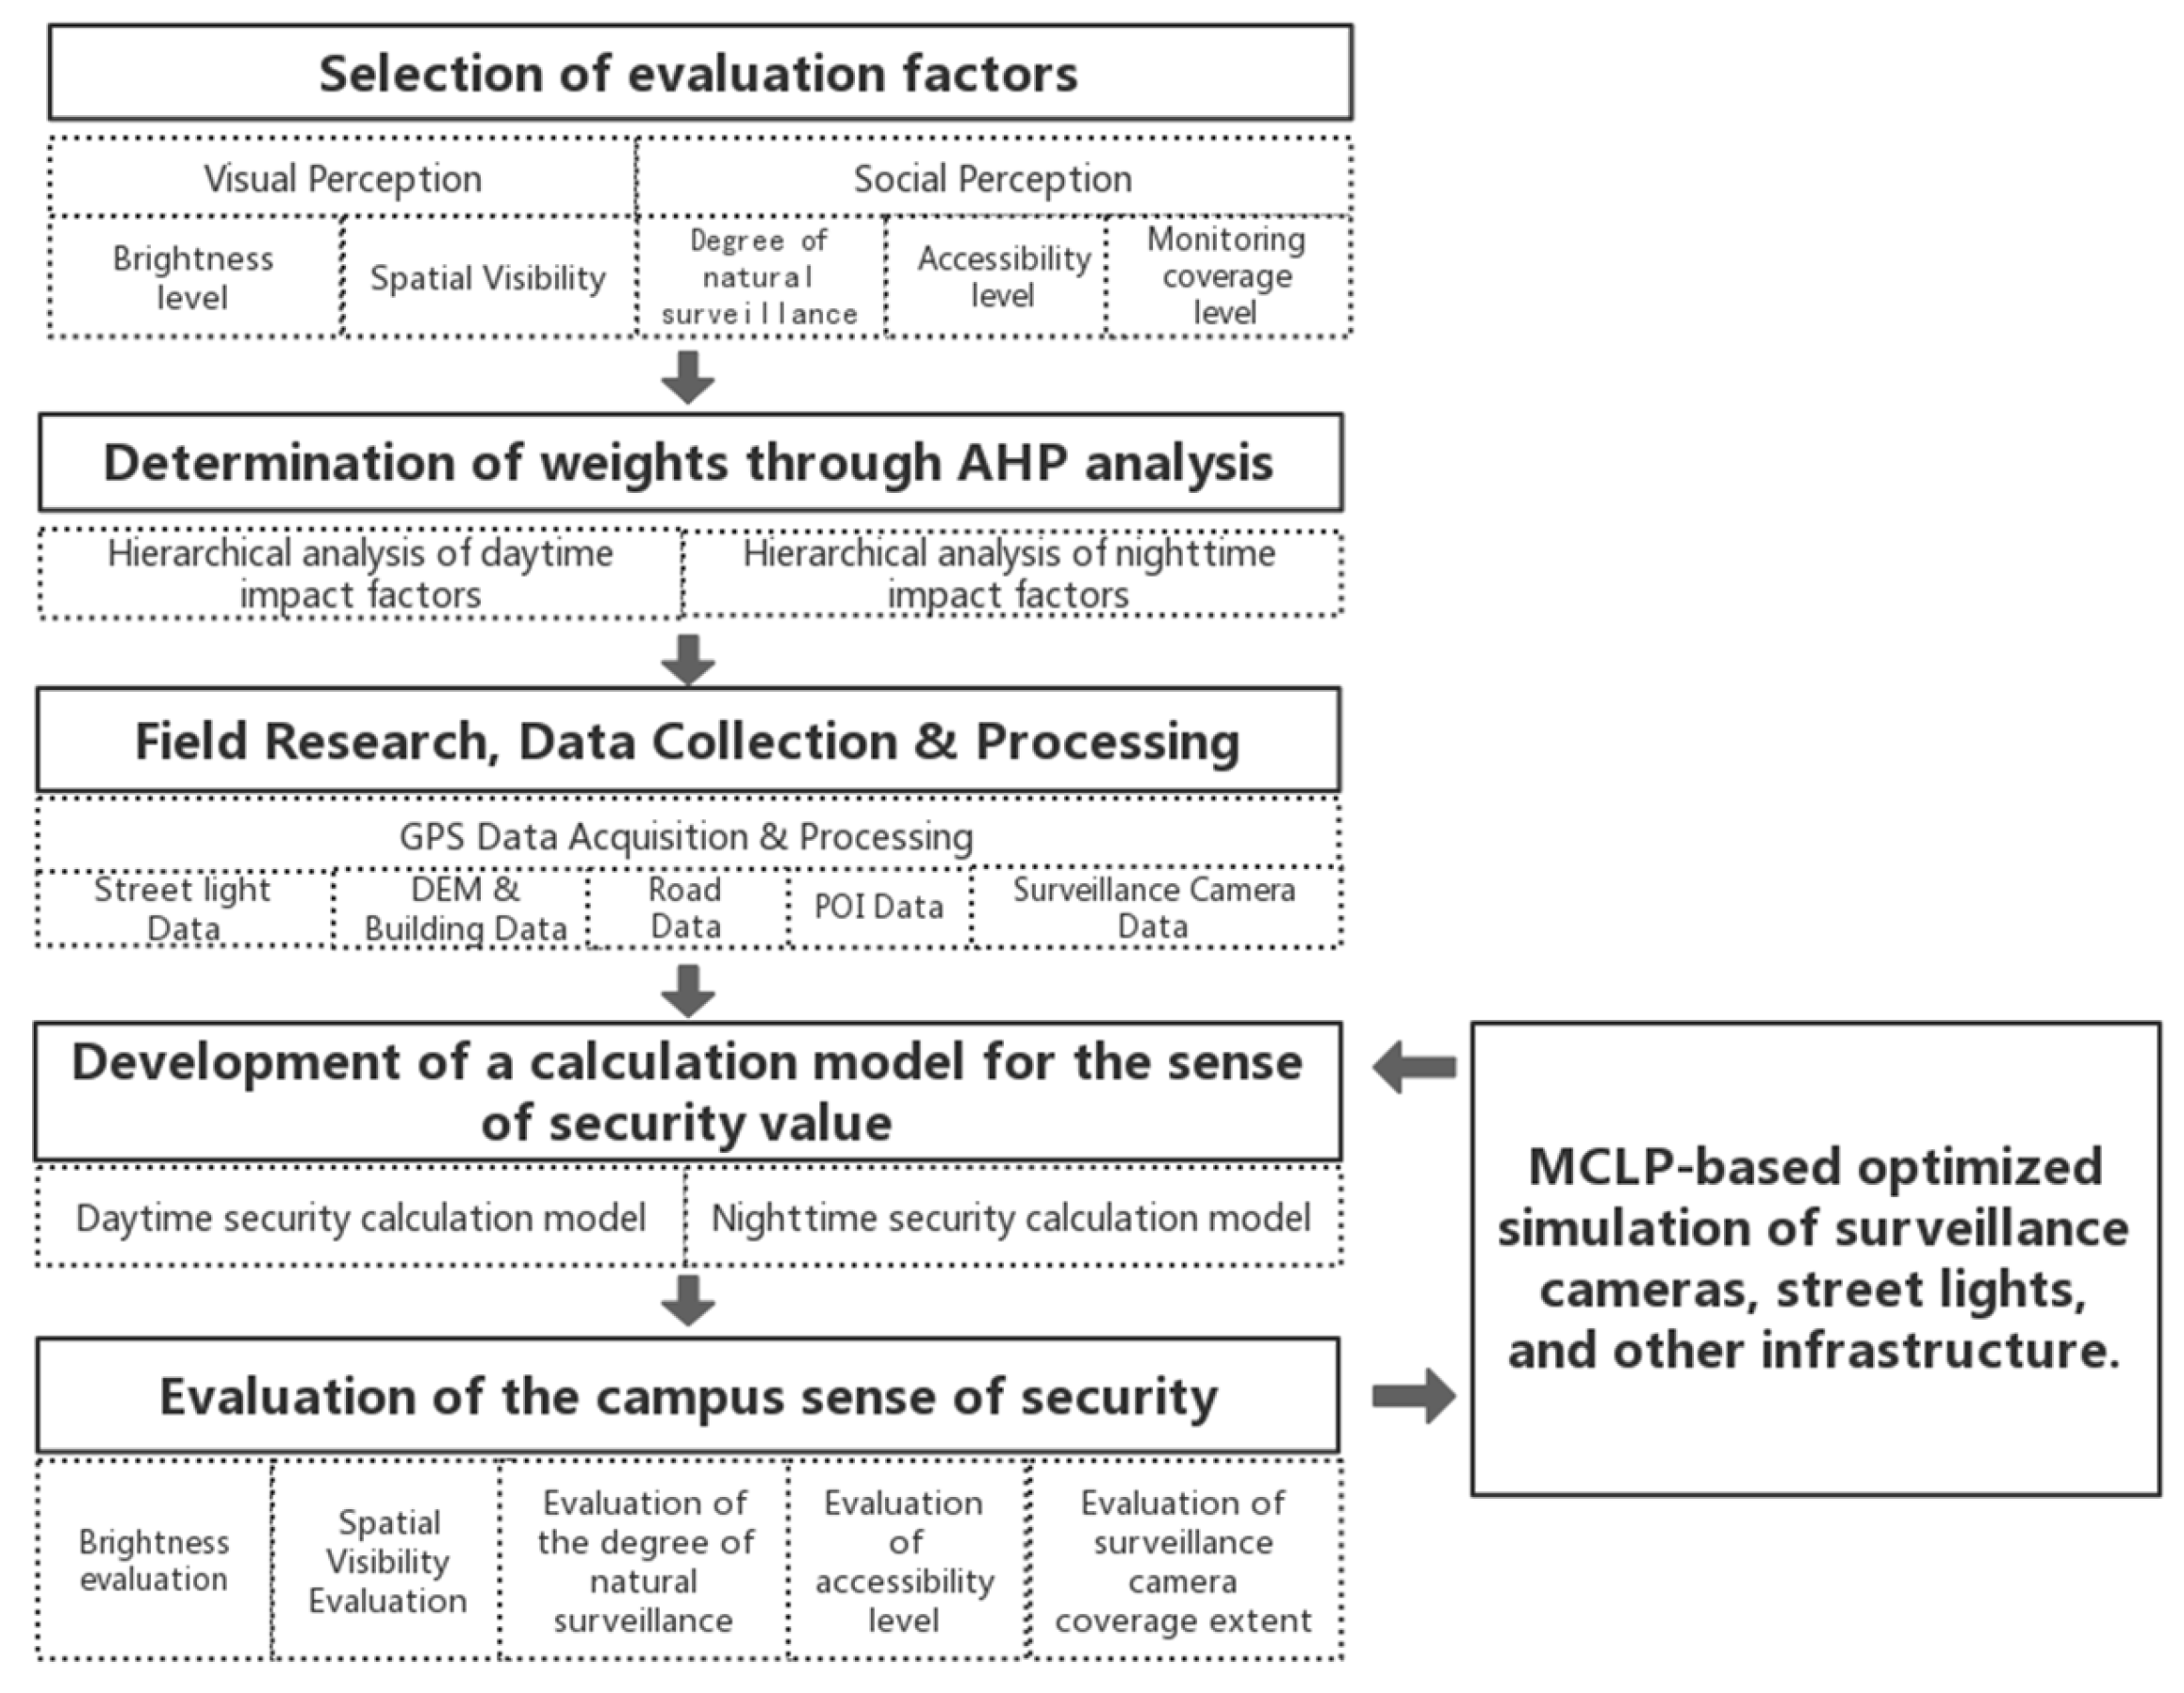
As shown in
Figure 1, the following steps were used in this study to evaluate and enhance the sense of security in public areas on college campuses: selection of evaluation factors, determination of weights through AHP analysis, field research, data collection and processing, development of a calculation model for the sense of security value, evaluation of the sense of security in campus public spaces, layout optimization using the MCLP model, and comparative analysis of the evaluation results.
3.1. Selection of Evaluation Factors
Based on the relevant literature regarding the sense of security in campus public spaces [
52], combined with the analytical insights from environmental behavioral psychology on campus safety, this study adopts a methodology involving a literature review, framework establishment, questionnaire survey, and factor determination. This approach aims to select factors for assessing the psychological perceptions of safety within campus public areas.
3.1.1. Establishment of the Evaluation System
Users’ perceptions of the safety of campus public spaces are multifaceted, influenced by both physical environmental characteristics and individual psychological factors. Synthesizing the relevant literature [
53,
54,
55], this study’s selection criteria for evaluation factors are as follows: (1) Relevance: The chosen evaluation factors should tangibly impact the sense of security among faculty and students in public spaces. (2) Perceptibility: The selected evaluations should, to some extent, be perceivable by users, ensuring that the assessment considers actual subjective experiences. (3) Measurability: Evaluation factors need to be measurable, enabling assessments through scientific methods to enhance objectivity and operability.
This article selects evaluation factors for the sense of security in public spaces based on visual perception and social perception [
56,
57]. Visual perception primarily denotes the ability to perceive and understand the surrounding environment through the visual system, quantifying subjective visual experiences. In public spaces, visual perception encompasses factors such as brightness, spatial visibility, greenery level, and safety alert signs. Social perception refers to individuals’ perception and understanding of the surrounding social environment, characterizing psychological perceptions within an environment, emphasizing self-awareness, including natural surveillance, accessibility, surveillance camera coverage, and emergency facility arrangements. This establishes an initial framework for the evaluation factors of campus security perception, as shown in
Table 1.
3.1.2. Questionnaire Survey for Determining Evaluation Factors
Building on the literature review and on-site investigations, we further selected evaluation factors by distributing questionnaires (see
Supplementary Material S1). Considering the differences in scale and structure among various universities, the needs and experiences of students and faculty regarding a sense of security may vary across different backgrounds. Conducting research based on the list of national universities published by the Chinese Ministry of Education in 2023, we conducted a statistical analysis to compile the top 10 cities currently hosting the highest number of universities. Samples were then selected from universities in these cities to capture the common characteristics of faculty and students. Purposive sampling methods were used to collect the extent to which each of the above evaluative factors was perceived by a total of 152 students and faculty members at major colleges and universities across the country to have an impact on the perception of campus safety. The basic information about the participants is presented in
Table 2. Overall, the respondents are predominantly undergraduate students, with a balanced gender distribution, a relatively young age group, and a geographical distribution centered around Wuhan, with other cities showing a relatively even distribution. This aligns well with the current demographic profile of Chinese university students.
Using a Likert-style five-point scoring system, ratings from “1” to “5” signified degrees of impact: “very little impact”, “somewhat limited impact”, “moderate impact”, “considerable impact”, and “significant impact”, respectively, corresponding to scores of 1, 2, 3, 4, and 5. Typically, mean scores between 1 and 2.5 on the five-point Likert scale indicate disagreement, 2.5 to 3.5 denote neutrality, and 3.5 to 5 suggest agreement [
59,
60]. This questionnaire gauged the significance of each evaluation factor, categorizing scores between 1 and 2.5 as insignificant, 2.5 to 3.5 as moderately significant, and 3.5 to 5 as significant. The mean score reflecting the impact level was used to determine the factor’s importance, leading to the exclusion of elements with a relatively lower significance.
According to the skewness and kurtosis of the collected survey data, a test is conducted to determine whether the data follows a normal distribution. In theory, the skewness and kurtosis of a standard normal distribution are both 0. However, in reality, data rarely conforms to a perfect standard normal distribution. Therefore, if the absolute value of kurtosis is less than 10 and the absolute value of skewness is less than 3, it is considered that the data, while not strictly normal, is generally acceptable as following a normal distribution [
61]. Skewness and kurtosis calculations for the research sample (see
Table 3) indicate that the absolute values of skewness for the collected data are all less than 3, and the absolute values of kurtosis are all less than 10. This suggests that the sample data conforms to a normal distribution.
The reliability analysis conducted using SPSS v26.0 revealed a Cronbach’s alpha value of 0.911, indicating strong internal consistency among the questionnaire items. This high alpha value suggests good reliability among the various items in the questionnaire. Furthermore, the examination of each indicator through Kaiser-Meyer-Olkin (KMO) sample measurement and Bartlett’s test of sphericity yielded a KMO value of 0.900 (KMO > 0.8) and a significant chi-square value of 988.974 at a significance level of 0.000 in Bartlett’s test. These results indicate excellent structural validity for the questionnaire, affirming the suitability of the research data for information extraction.
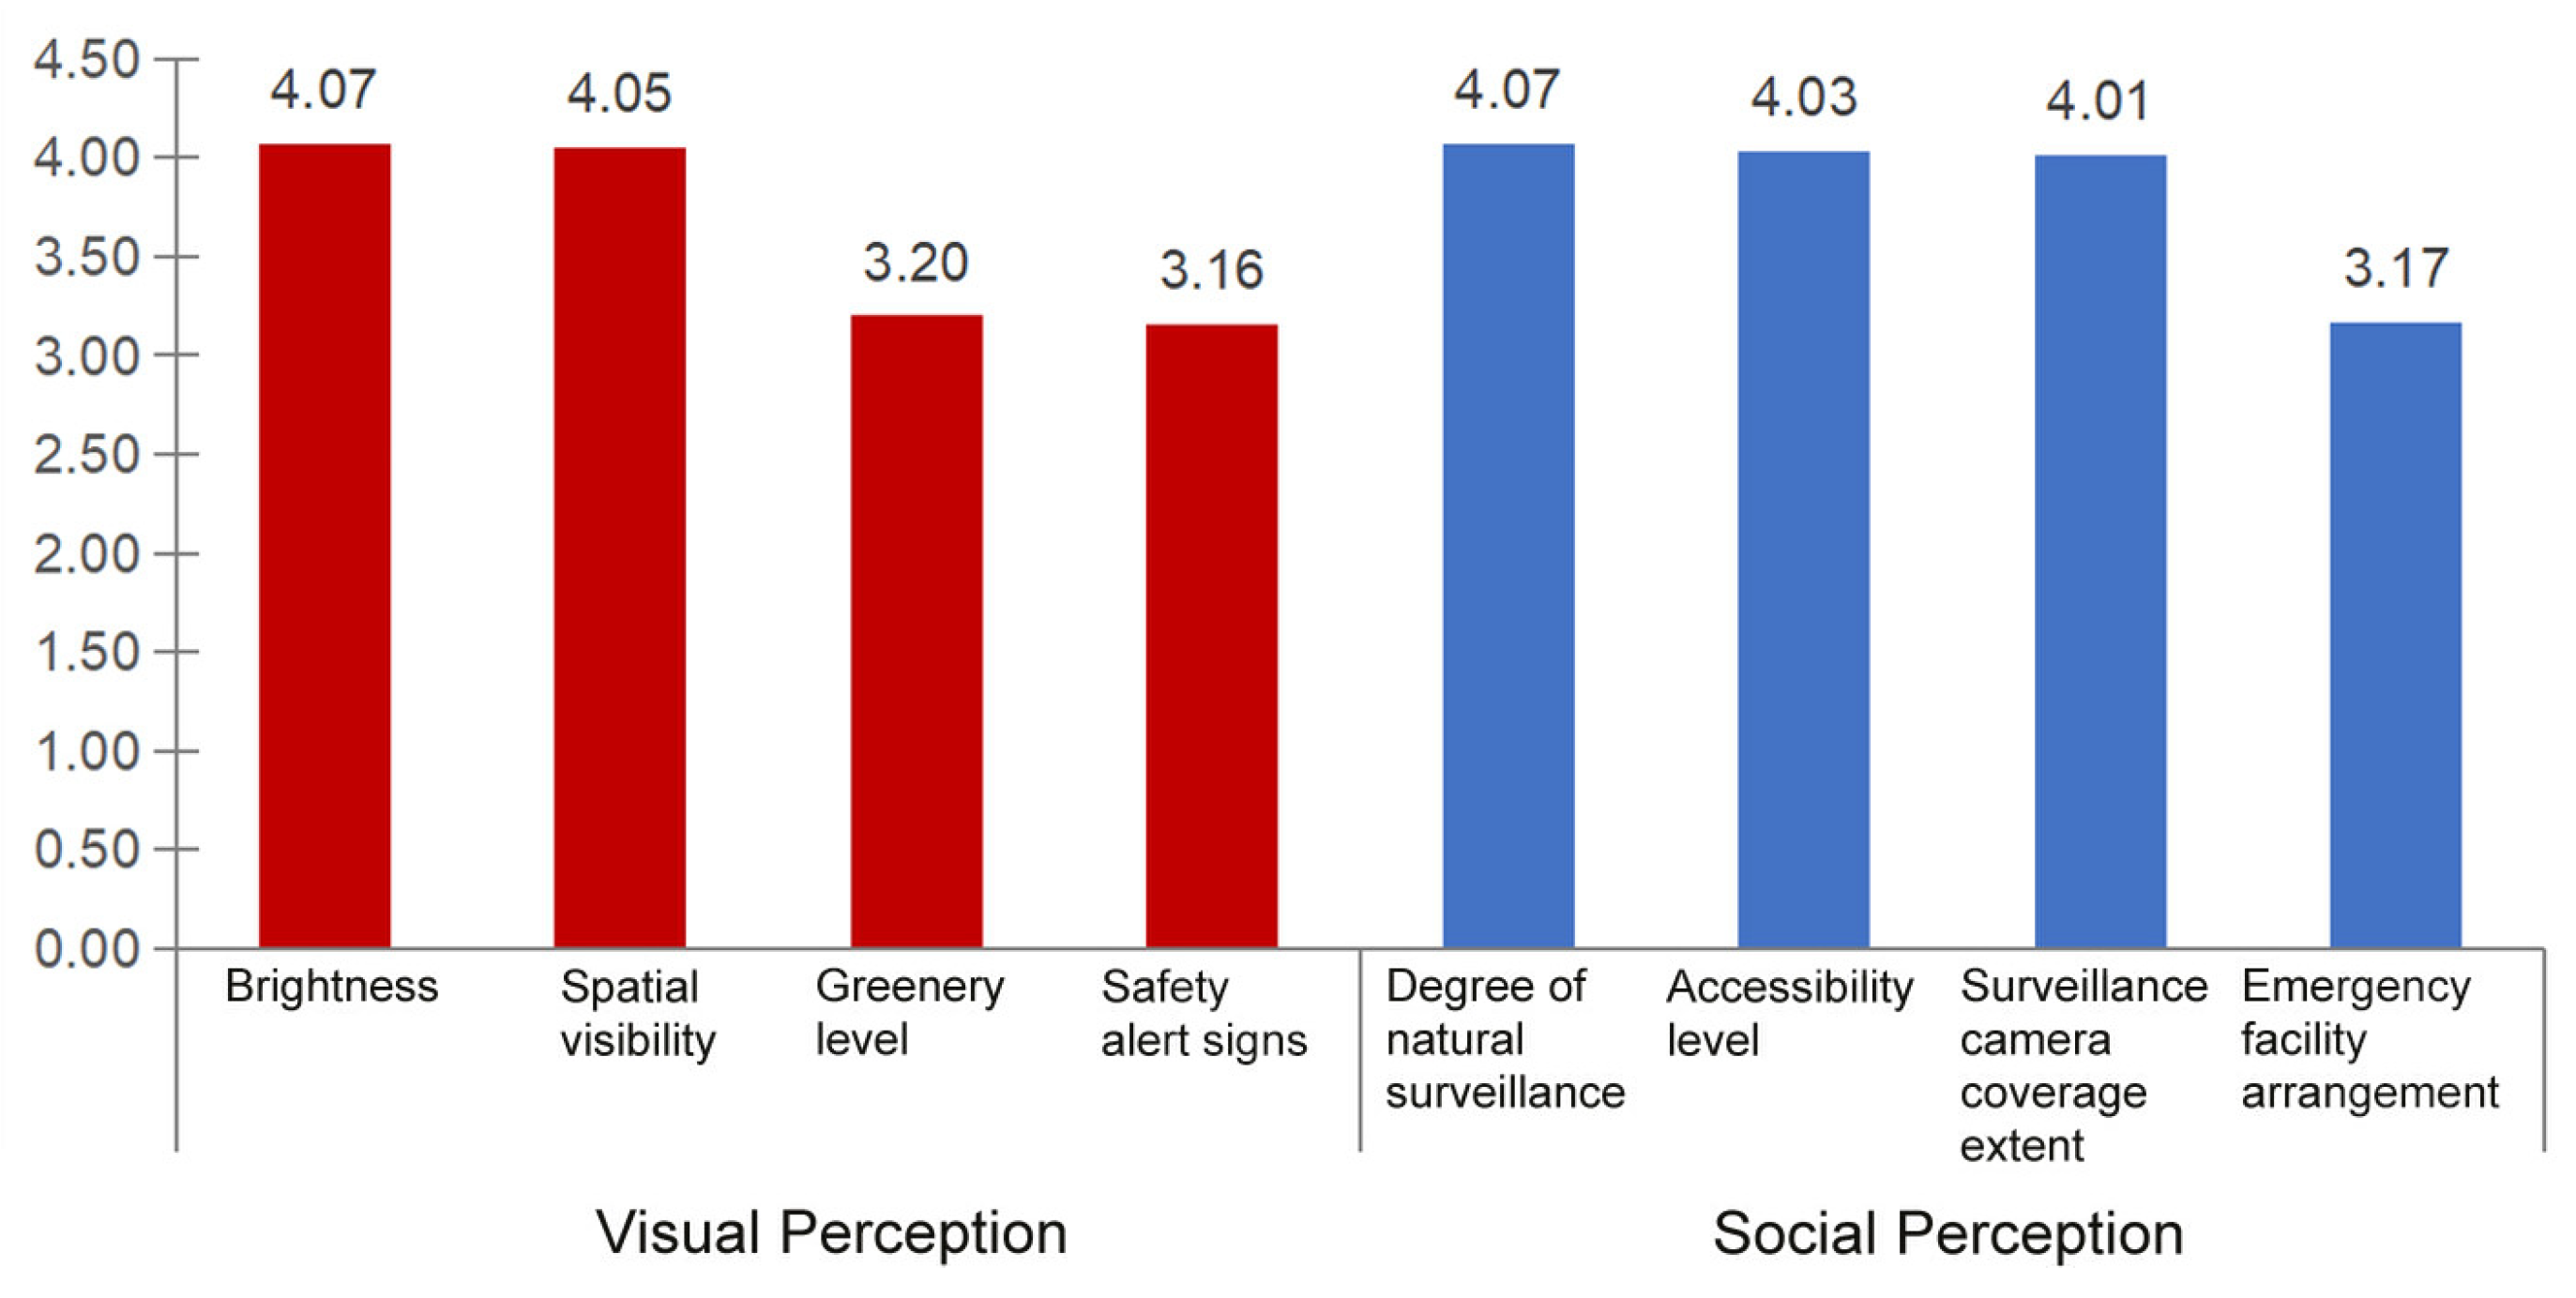
From the questionnaire findings (
Figure 2), the importance scores of the three evaluation factors, namely “Greenery Level” (3.20 points), “Safety Alert Signs” (3.16 points), and “Emergency Facility Arrangement” (3.17 points), fell below 3.5 points, ranking among the bottom three. These factors show a considerable deviation in importance compared to the others. Upon further analysis of interviews and questionnaires, plausible reasons emerged. While a pleasant green environment is crucial for fostering a sense of safety in public spaces, it might be more subject to individual aesthetic preferences and perceptions, making a consensus in this area challenging to achieve. Moreover, for the resident faculty and students familiar with the campus layout and signs, the impact of safety signage might be relatively limited as the information is already subliminally integrated into their daily routines. Additionally, the emergency facilities are infrequently used by most resident faculty and students on campus, potentially contributing less to their sense of security compared to factors more directly related to their daily safety. Based on the questionnaire’s indicator screening results, these three factors, with comparatively lower importance and relatively minor contributions to evaluating the sense of safety in campus public spaces, were excluded.
In summary, this study finalized five evaluation factors that affected the sense of security in the campus public space in terms of visual perception and social perception. The evaluation factors of visual perception are brightness and spatial visibility, and the evaluation factors of social perception are the degree of natural surveillance, accessibility, and surveillance camera coverage.
3.2. Analysis of Evaluation Factor Weights
3.2.1. Establishing a Hierarchical Structure Model
The hierarchical structure model involves categorizing the goal of decision-making, the factors under consideration, and the decision object into distinct levels based on their interrelationships. These elements are divided into the highest, middle, and lowest levels, and a hierarchical structure diagram was created to visually represent their relationships [
62]. To facilitate the subsequent raster calculation in GIS, the expert scoring approach was used to compare each factor in pairs, grade the rank according to its importance, and establish the varied weights of each evaluation element for daytime and nighttime.
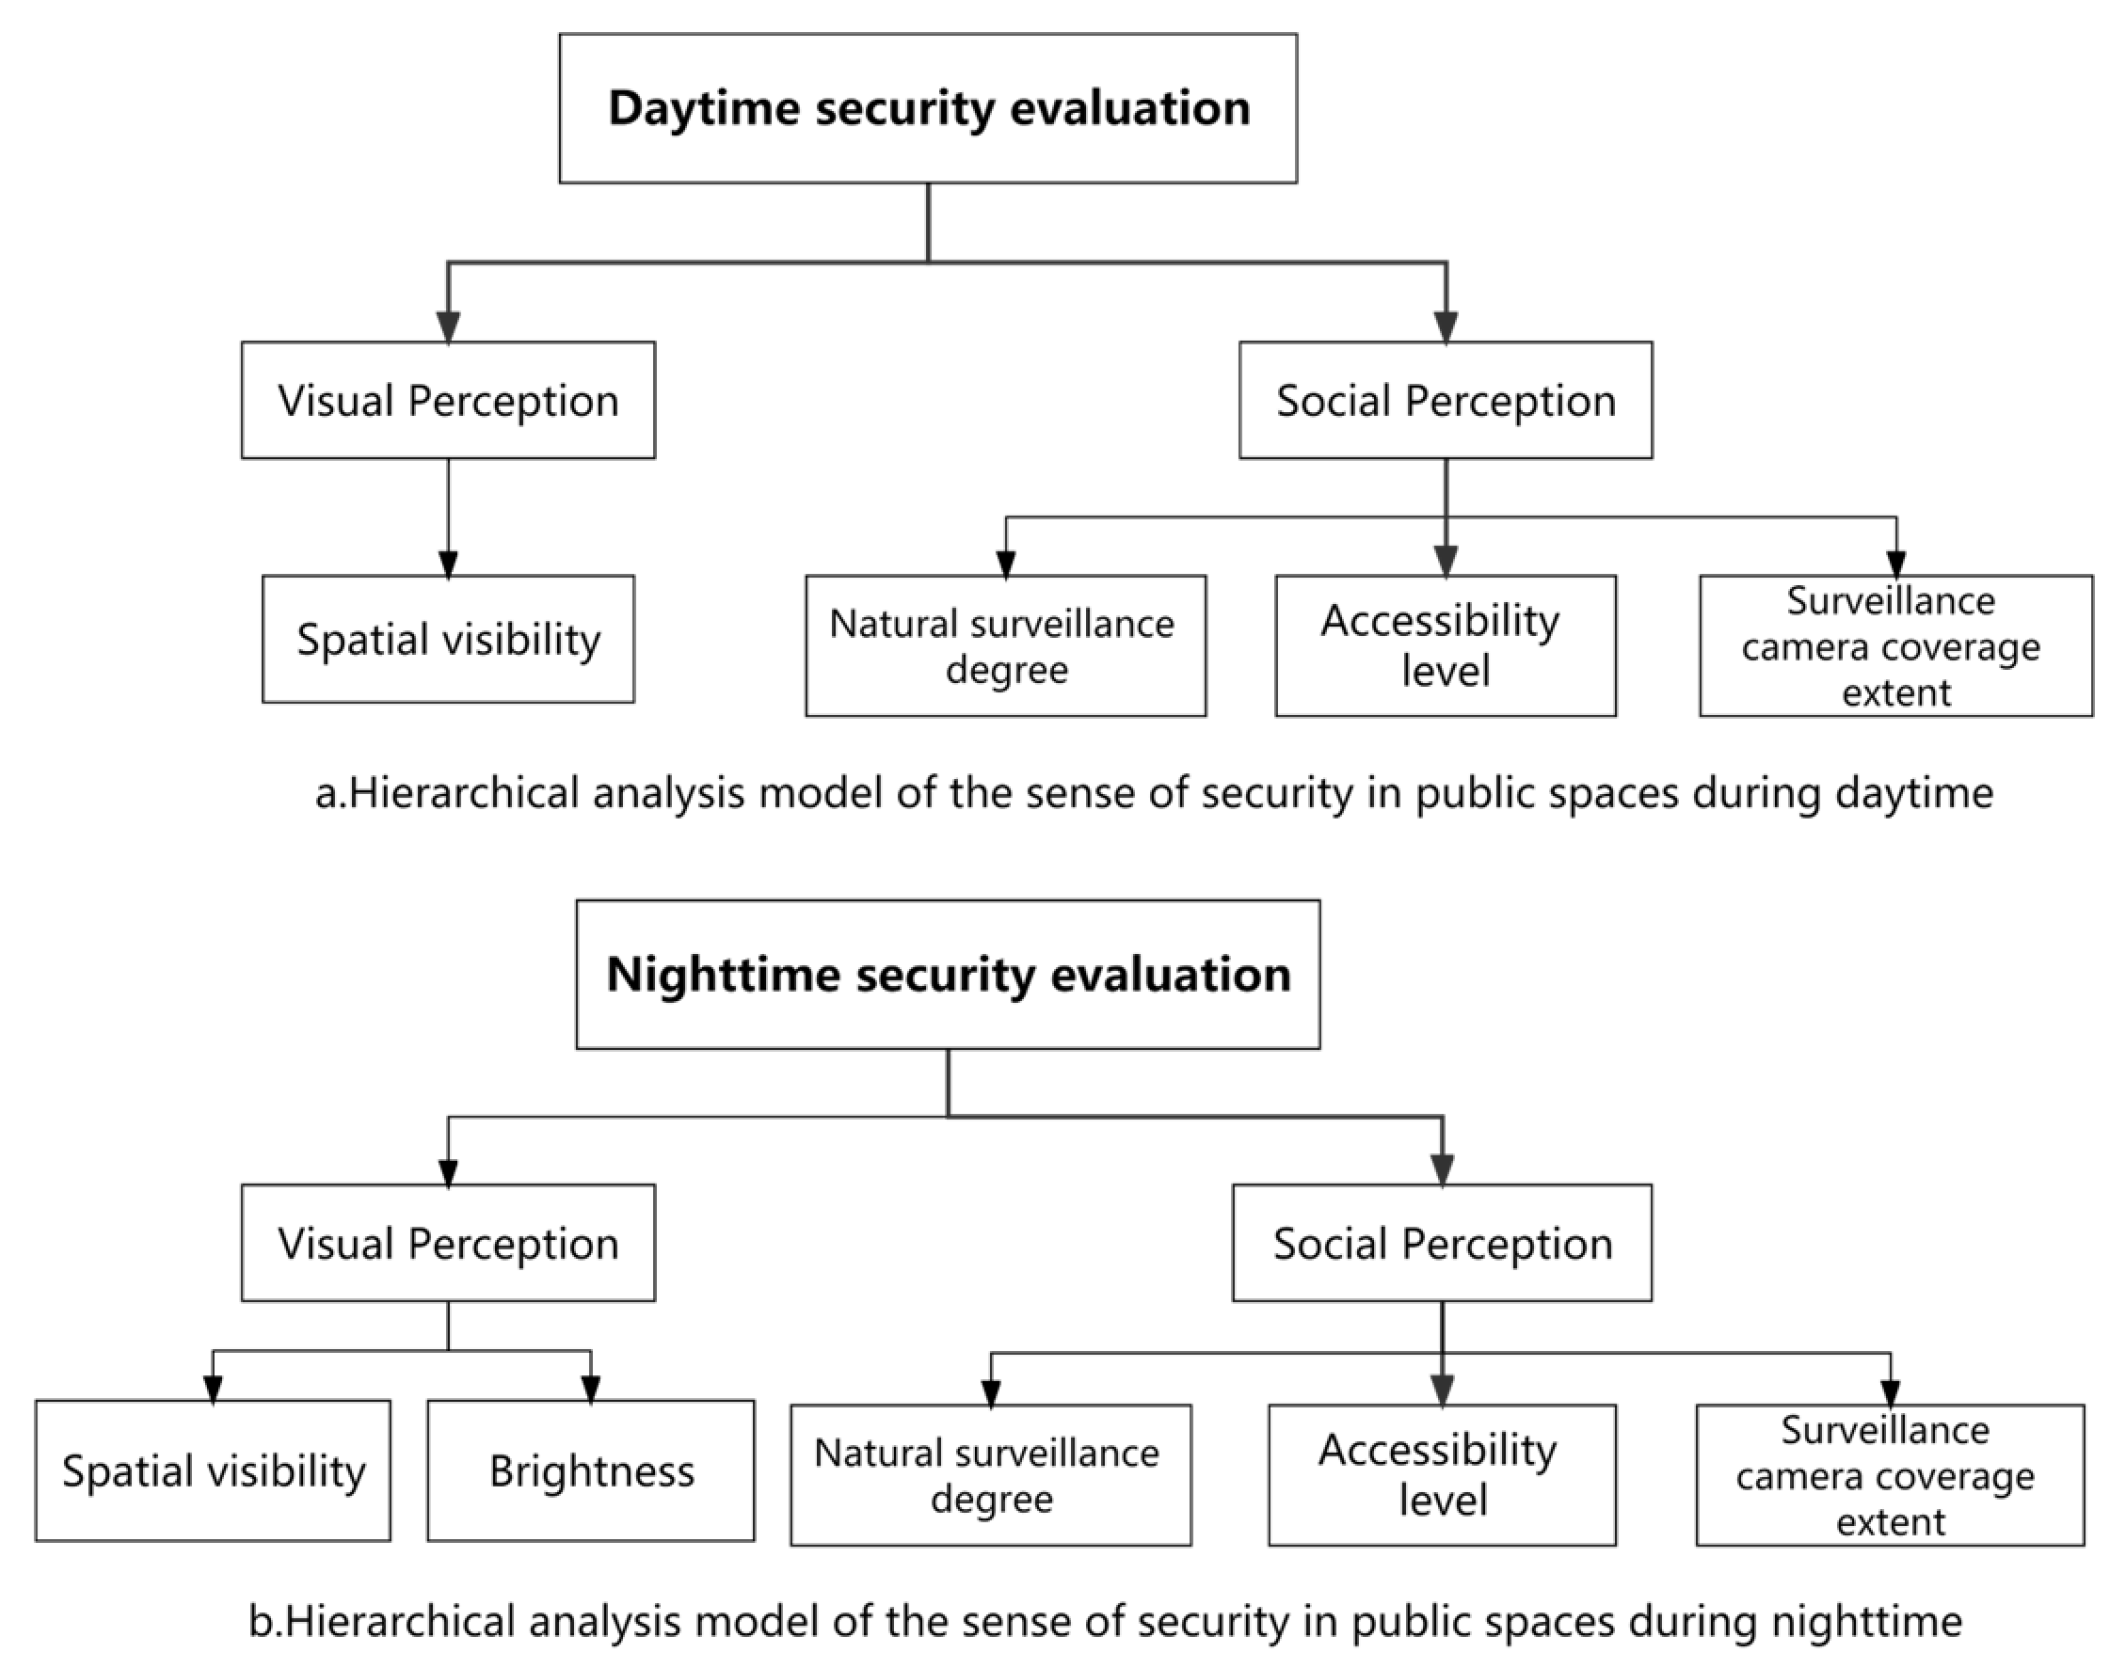
This study provided an evaluation system to evaluate the campus’s spatial security both during the day (7:00–18:00) and at night (18:00–7:00 the next day) to evaluate it as thoroughly as feasible (
Figure 3). Four factors made up the evaluation of campus spatial security throughout the day: spatial visibility, natural surveillance degree, accessibility level, and surveillance camera coverage extent. At night, the perception of campus space security consisted of five evaluation factors: brightness, spatial visibility, natural surveillance degree, accessibility level, and surveillance camera coverage extent.
3.2.2. AHP Hierarchical Analysis Results
This study invited 15 experts in the field of urban planning and human habitat to individually rate various levels of indicators during both daytime and nighttime.
When conducting an analytic hierarchy process, the first step is to obtain expert ratings. This study has set criteria for inviting experts:
Professional background: Experts should be professionals in relevant fields such as urban planning and human habitat environment. They should hold a minimum of a master’s degree, possess significant experience, and have extensive knowledge in the related domains.
Academic contributions: The selection of experts considers whether they have published papers in relevant journals in the respective field, using their academic contributions as a reference.
Diversity: It is essential to ensure diversity within the expert team, including representation from both genders and different age groups. This ensures a comprehensive range of perspectives and experiences.
Furthermore, to enhance the accuracy of the ratings, the number of experts in the AHP method is generally recommended to be 10 or more, with a minimum of no less than 5 experts [
63]. Given the resource constraints of this research project, obtaining 15 experts is considered a feasible and appropriate number. Therefore, this study invites 15 experts to individually rate each level of indicators for both daytime and nighttime. The background information about the expert representatives is detailed in
Table 4, ensuring a diverse composition that effectively contributes to the evaluation.
See
Supplementary Materials S3,S4 for expert scoring sheets. A relative scale was employed to enhance accuracy, with measurement levels ranging from 1 to 9 (1, 3, 5, 7, and 9 signify equally important, slightly important, moderately important, strongly important, and extremely important, respectively, and 2, 4, 6, and 8 represent intermediate values for adjacent judgments). Based on the expert ratings, a comparative matrix was created, and weights were calculated. Matrix laboratory (MATLAB 2022b) software was utilized to compute the consistency ratio (CR) to examine if the scoring criteria exhibited logical consistency (see
Table 5 and
Table 6 for details).
The computed results indicated that the maximum eigenvalue for the daytime comparative matrix was 4.0. Referring to the random index (RI) table, the corresponding RI value was found to be 0.882; CR = CI/RI = 0.036 < 0.1, therefore passing the one-time consistency test.
The calculated results reveal that the maximum eigenvalue for the nighttime comparative matrix was 5.0. Consulting the RI table, the corresponding RI value is determined to be 1.11. Consequently, the CR = CI/RI = 0.044 < 0.1 successfully passed the one-time consistency test.
3.3. Quantitative Methods of Evaluation Factors
3.3.1. Data Preparation
Field research was conducted in the study area to collect the basic data and the relevant topic data, including the five evaluation factors, based on the selection and analysis of the evaluation factors of the sense of security in public spaces of colleges and universities in the previous work.
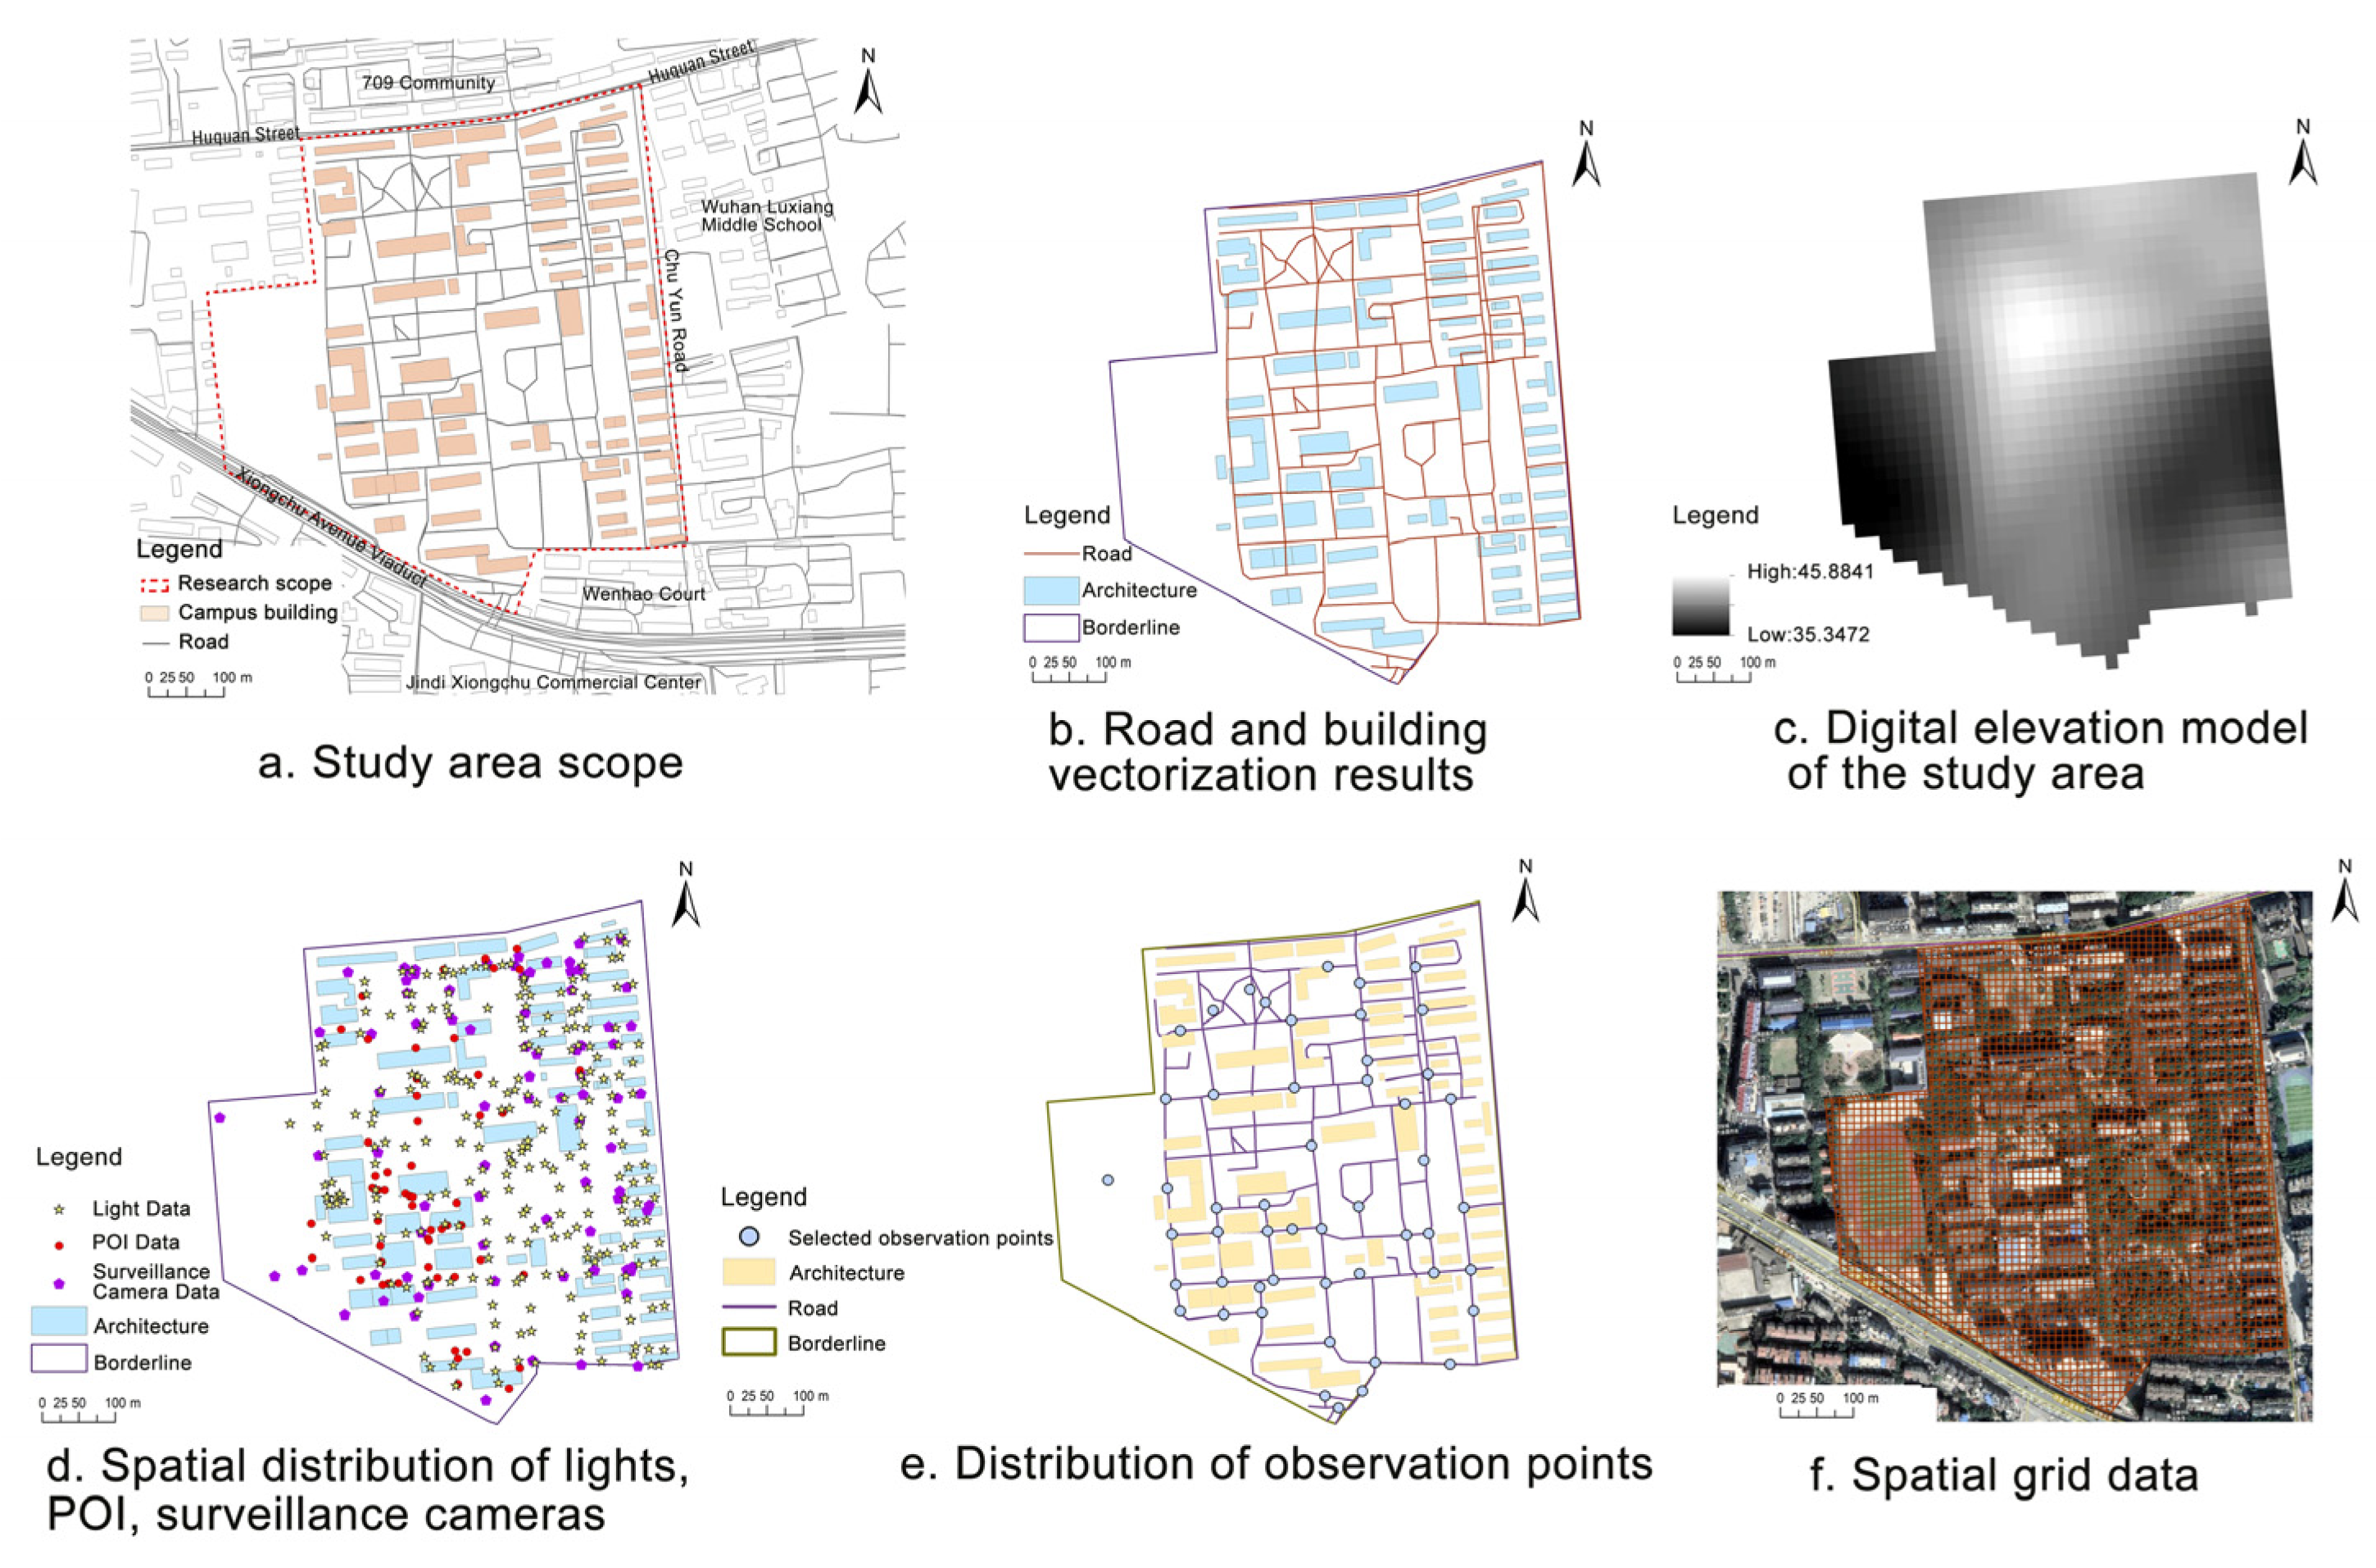
The handheld global positioning system (GPS) instrument was used to gather feature points in the study area; export the feature point data and georeference it with remote sensing images in GIS; extract water bodies, buildings, roads, and vegetation from the aligned remote sensing images; carry out map vectorization processing on the two kinds of feature data of buildings and water bodies; and then interpolate the spline function to construct a digital elevation model of the study area.
- 2.
Relevant topic data
The relevant data for this study encompassed various aspects, including lighting data, surveillance camera data, points of interest (POI) data, and spatial grid data. The lighting data involved collecting information on street lights within the campus and assigning grades based on their brightness levels. Higher grades indicate brighter lights. The surveillance camera data consisted of data collected from various types of surveillance cameras in the public spaces of the campus using a handheld GPS instrument. The POI data included entrance and exit information for different facilities, such as cafeterias, stores, teaching buildings, dormitory buildings, and libraries, among others, within the university campus. Finally, the spatial grid data involved constructing a 10 m × 10 m spatial grid cell within the study area, represented as vector data. Each spatial grid cell served as an area primitive for analysis purposes.
3.3.2. Visualization Processing
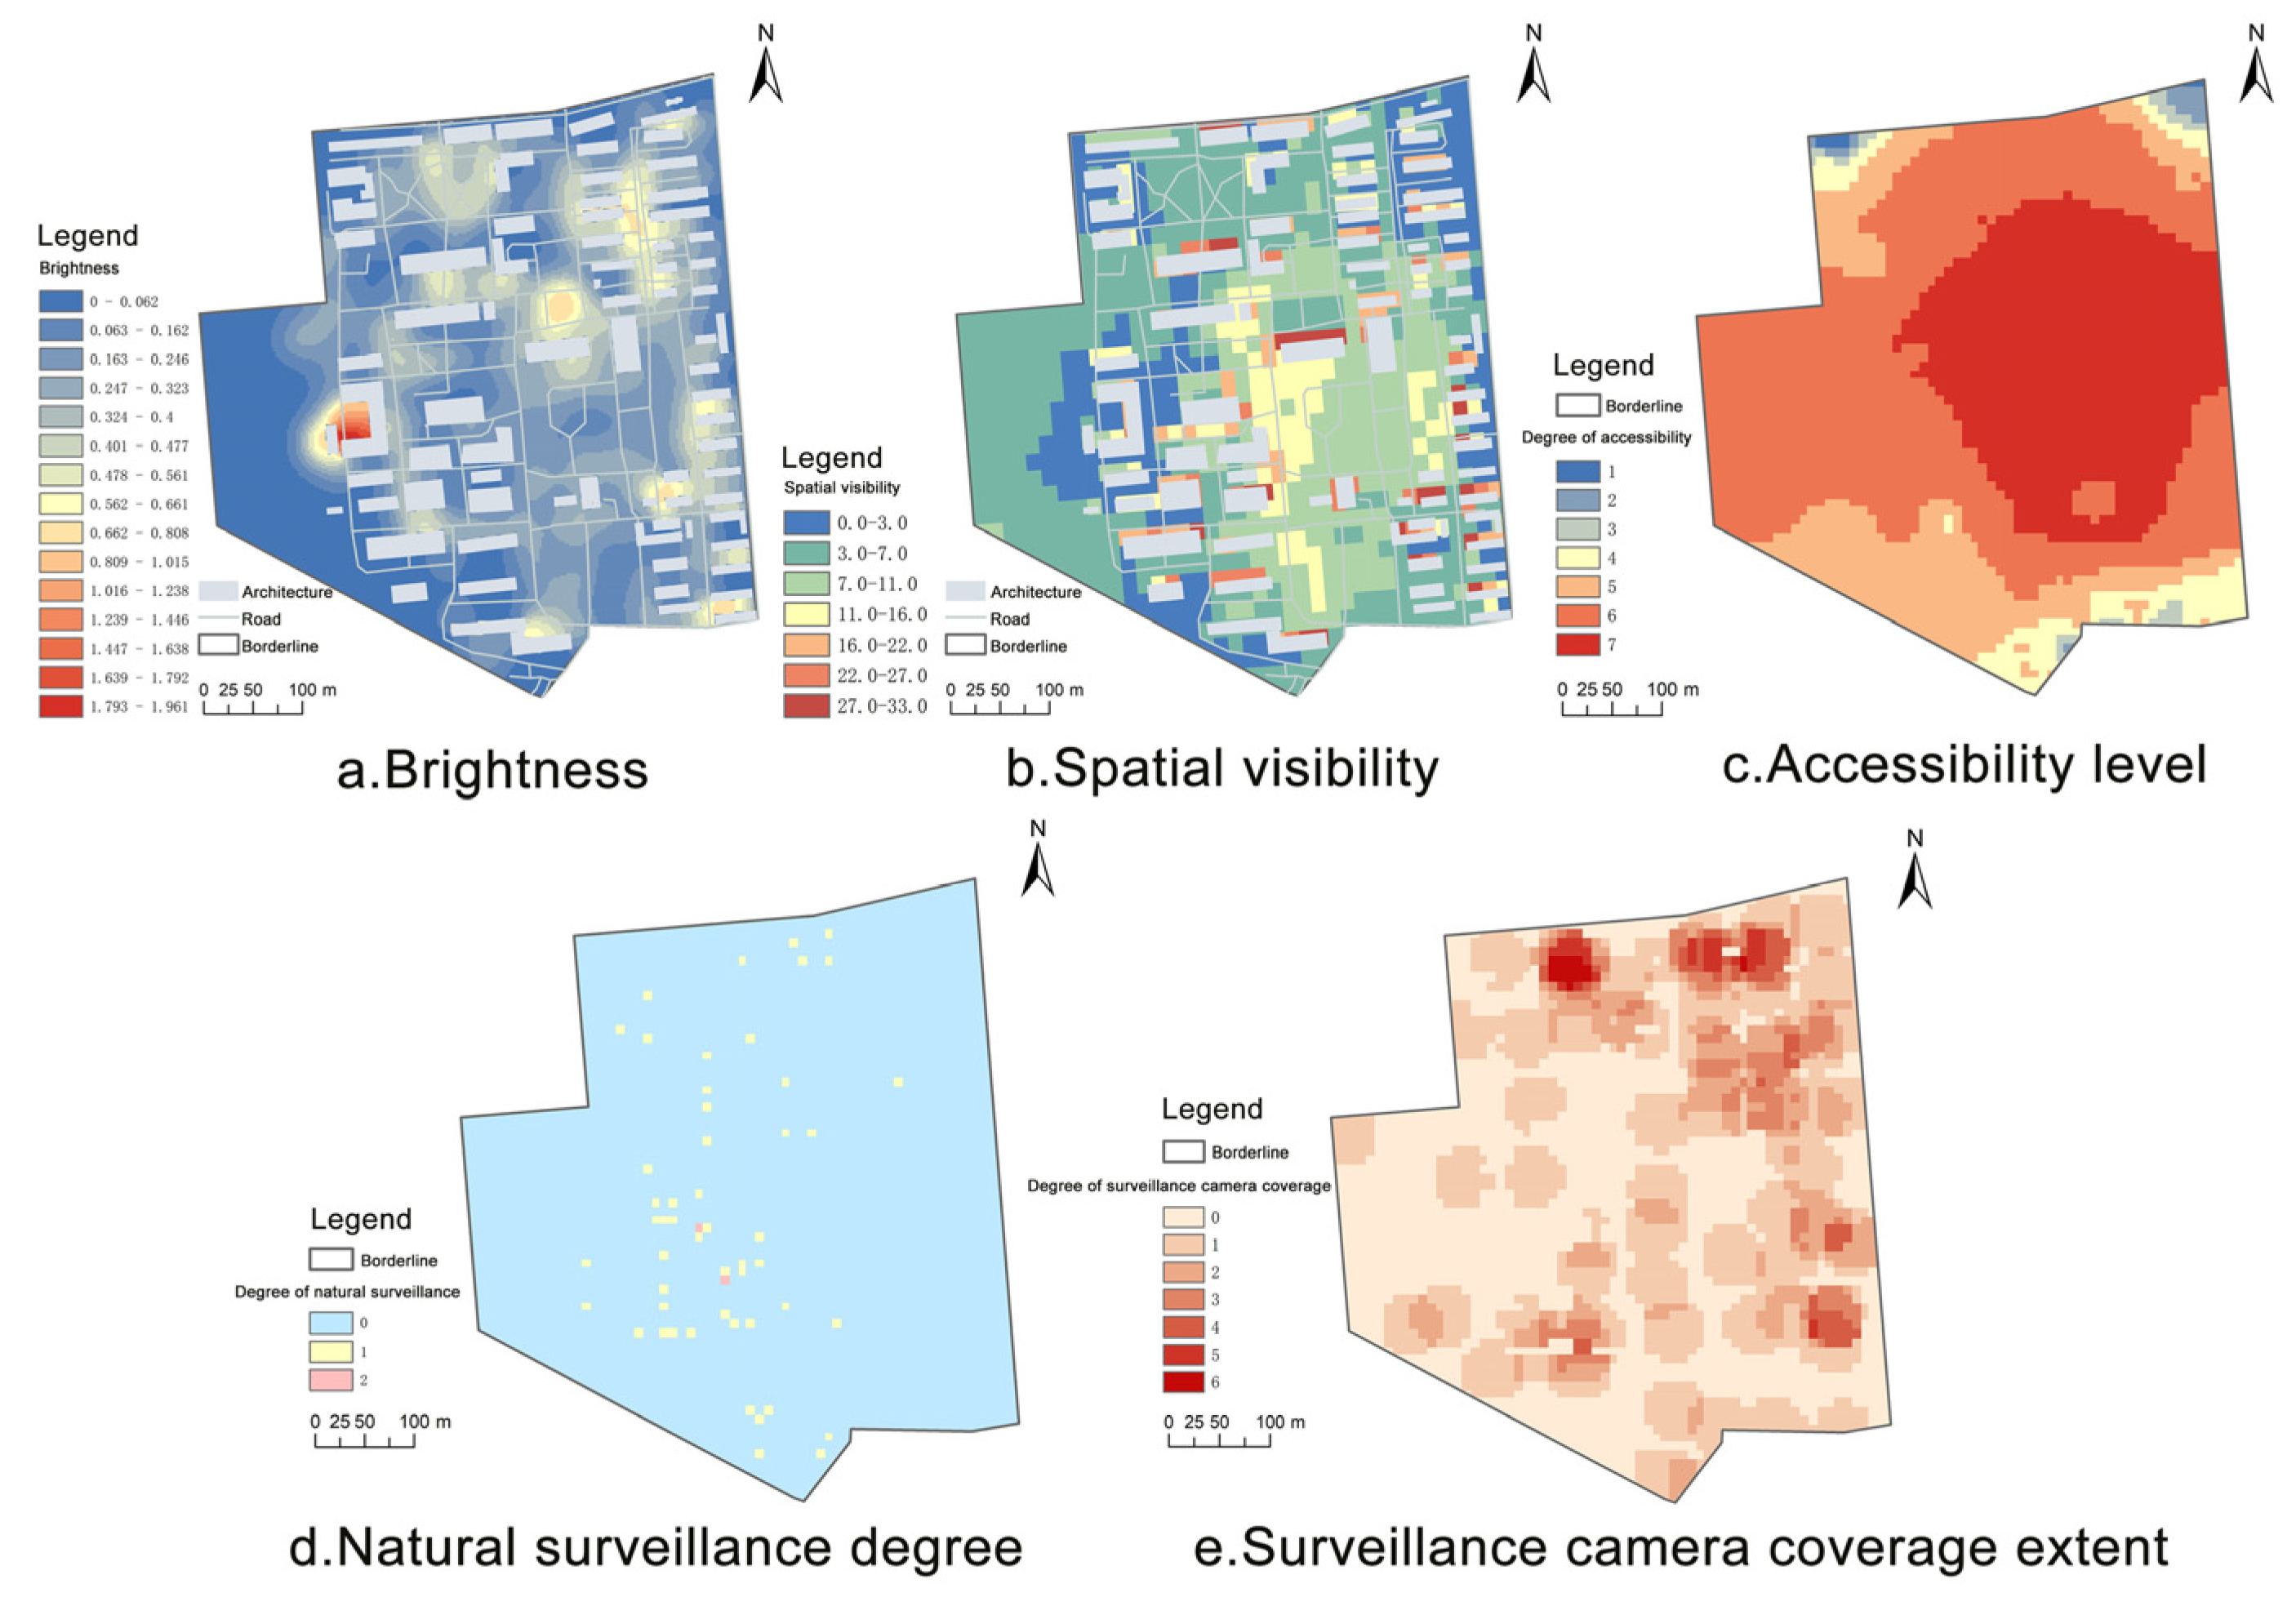
Through the acquired data, each data processing method was determined, and quantitative analysis was conducted for each of the five evaluation indicators:
The brightness of the street light data was spatially connected with the spatial grid data, and the maximum brightness value of the street light falling into the spatial grid cell was regarded as the brightness value of the grid cell. Campus buildings were considered obstacles, and diffusion interpolation analysis with obstacles was carried out. Finally, the interpolated raster data were mapped to the vector spatial grid data to complete the visualization analysis.
- 2.
Spatial Visibility.
A set of observation points was selected within the study area. The observation points were viewshed and analyzed point-by-point using campus digital elevation model (DEM) data and building data. Finally, the raster data of the viewshed analysis results of all observation points were overlaid. The results were then utilized to calculate the spatial visibility. When visibility is good, there is a better chance of seeing the location and a larger field of vision; when visibility is poor, there is a more severe degree of view obstruction.
- 3.
Accessibility level.
The total time from the starting point to different termination points is a measure of how accessible a point is to other points; the shorter the time, the more accessible the point is and the easier it is to go to the next place. The traffic network was built using network analysis in GIS to produce road intersection data based on the data from the campus road network. The intersections were used as the beginning and terminating locations for the OD cost matrix, which calculated traffic accessibility. After performing the inverse distance weight interpolation analysis, the results were displayed.
- 4.
Natural surveillance degree.
The crowded entrances and exits of libraries, dorms, academic buildings, and campus stores were chosen as the natural surveillance spots. The natural surveillance points were spatially connected to the spatial grid using the created spatial grid data and the entrance and exit POI data collected, and the number of natural surveillance points falling into each grid cell was counted to determine the natural surveillance intensity of each grid area.
- 5.
Surveillance camera coverage extent.
With the help of the security camera data, a buffer zone analysis was carried out using a buffer zone distance of 30 m for monitoring. Building intersection points were removed from the buffer polygons, which were then spatially connected to the spatial grid data. The degree of surveillance coverage was then calculated using the number of grid cells that intersected the buffer as a measure of the grid cells’ extent of surveillance coverage.
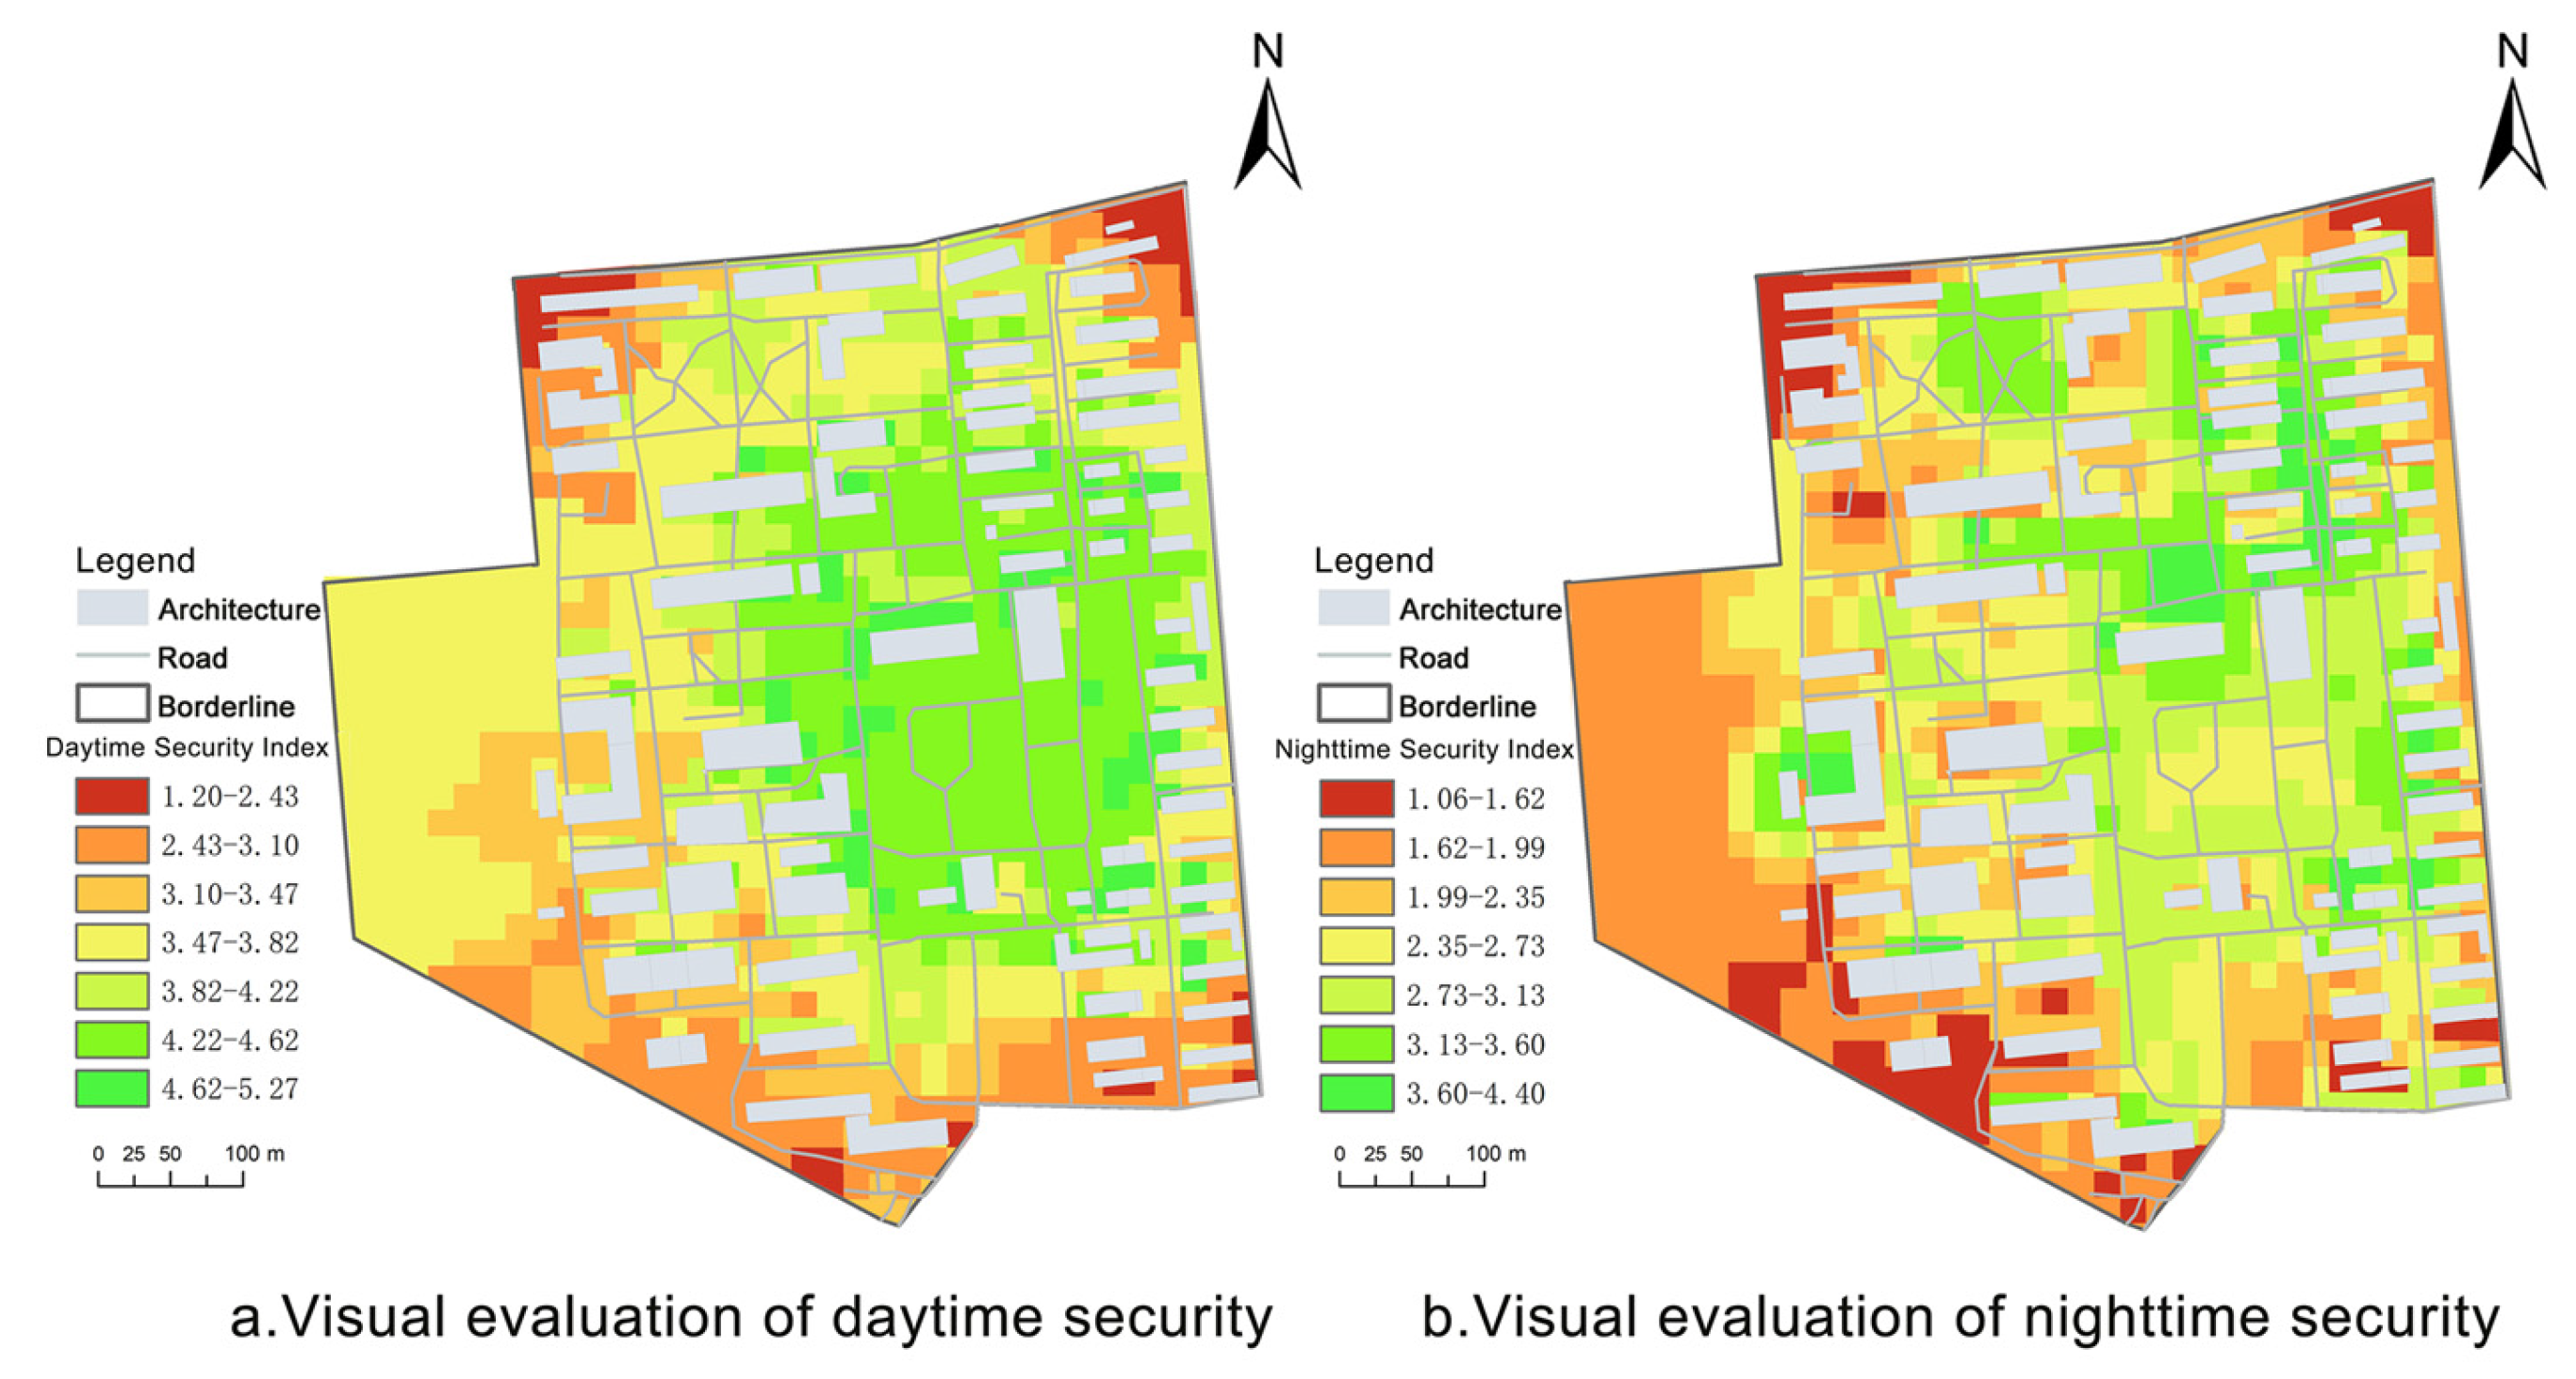
3.4. Calculation Model of Spatial Security Value
After the evaluation factors were quantified and rasterized, the results of the hierarchical analysis method were weighted in the GIS raster calculator to produce the spatial sense of security values in each spacious space of the campus during the day and at night, and the overall evaluation was then carried out. The calculation method for the sense of security is shown in Equations (1) and (2):
- (1)
Daytime sense of security calculation model:
- (2)
Nighttime sense of security calculation model:
In the formula, is the spatial sense of security value, is the brightness of space; is the spatial visibility, is the natural surveillance degree, is the surveillance coverage extent, is the accessibility level, and is the corresponding weight of each evaluation factor.
4. Optimized Configuration Based on MCLP
The distribution of regions on campus with a low sense of security index can be inferred intuitively from the results of the aforementioned daytime and nighttime sense of security evaluations. Since spatial visibility, degree of natural surveillance, and degree of accessibility are all established factors, optimization of the above three factors is not selected. Surveillance cameras and street lights belong to the scope of manual supervision, and the weak areas of the sense of security in public spaces can be reduced by optimizing the layout of the above two factors.
4.1. Discrete Location Model
The majority of the college’s green spaces, playgrounds, courtyards, roadways, and other outdoor areas used for gathering, relaxing, and walking were included in the study’s service areas for surveillance cameras and street lights. To achieve suitable surveillance camera and streetlight deployment and optimize their service scope, this study utilized the MCLP model, which discretizes the demand into points to assess the optimal site choices for these devices.
The basic idea of the siting MCLP model is to layout the facilities within the study area so that the facility points cover as many demand points as possible within the maximum service area [
64,
65,
66]. The mathematical expression for the model is depicted in Equations (3)–(8):
and
are decision variables, defined as:
In the formula, is the set of demand points , is the set of facility candidates , is the number of facilities allowed to be built, is the distance from demand point to candidate , is the service radius of new facilities, is the set of facility points that can cover the demand points, and is the weight of demand points .
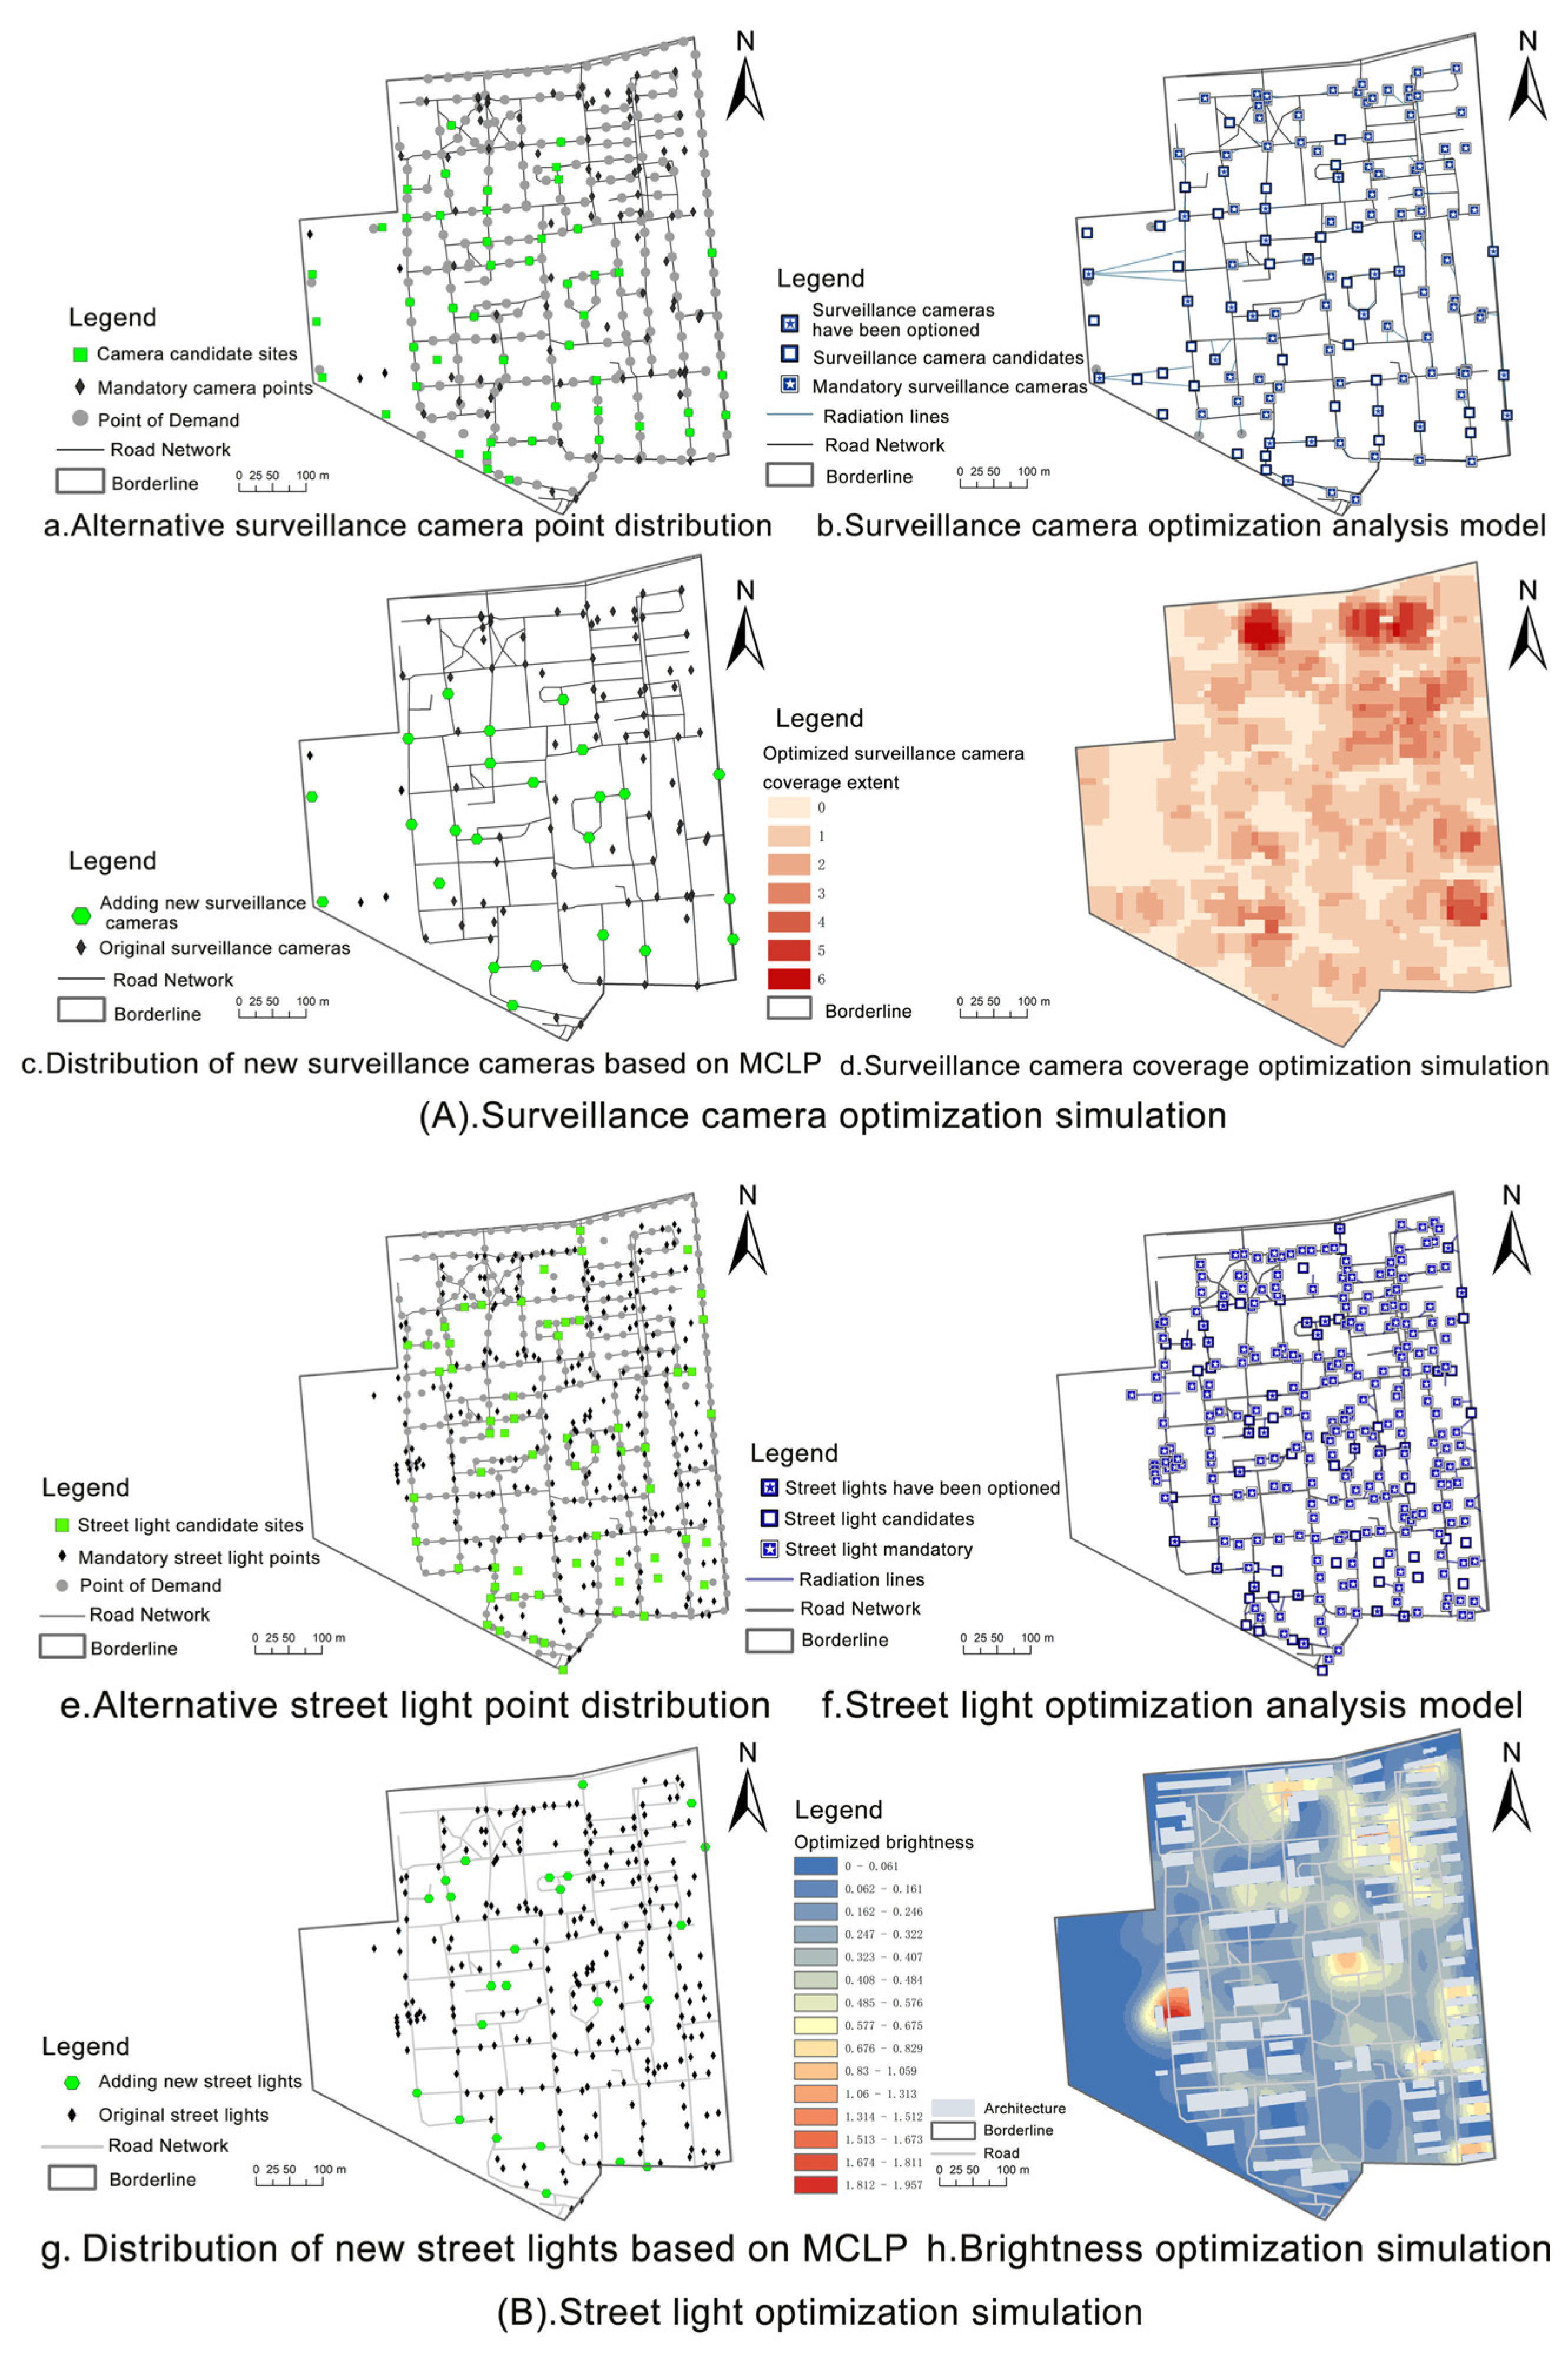
4.2. MCLP Model Operation
Demand points were established in the research area based on the surveillance cameras’ service area and the weak spots identified by the findings of the surveillance coverage evaluation. The surveillance camera alternative points were divided into two categories. (1) Candidate points—selected from areas with low-security regions with insufficient surveillance as a general site selection. These candidates may or may not be chosen during the analysis. (2) Mandatory points—obtained from the existing surveillance camera points. For the surveillance camera’s service range to effectively cover the majority of demand points on campus, the impedance interruption value was set as the service range of the camera, the location allocation analysis was attributed, the required facility points were set, and the allocation target was set as the maximal covering for calculation.
When optimizing the location of street lights, the setting of demand points was adjusted to take underlit areas into account when evaluating the lighting range and brightness of the street lights. The alternate points for street lights were also separated into two groups: (1) Candidate points—selecting the area with poor lighting and a low sense of security at night to determine the point position. (2) Mandatory points—obtained from the existing street light locations. The blocking interrupt value was set to the service range of the street light, and the rest of the operation remained unchanged.
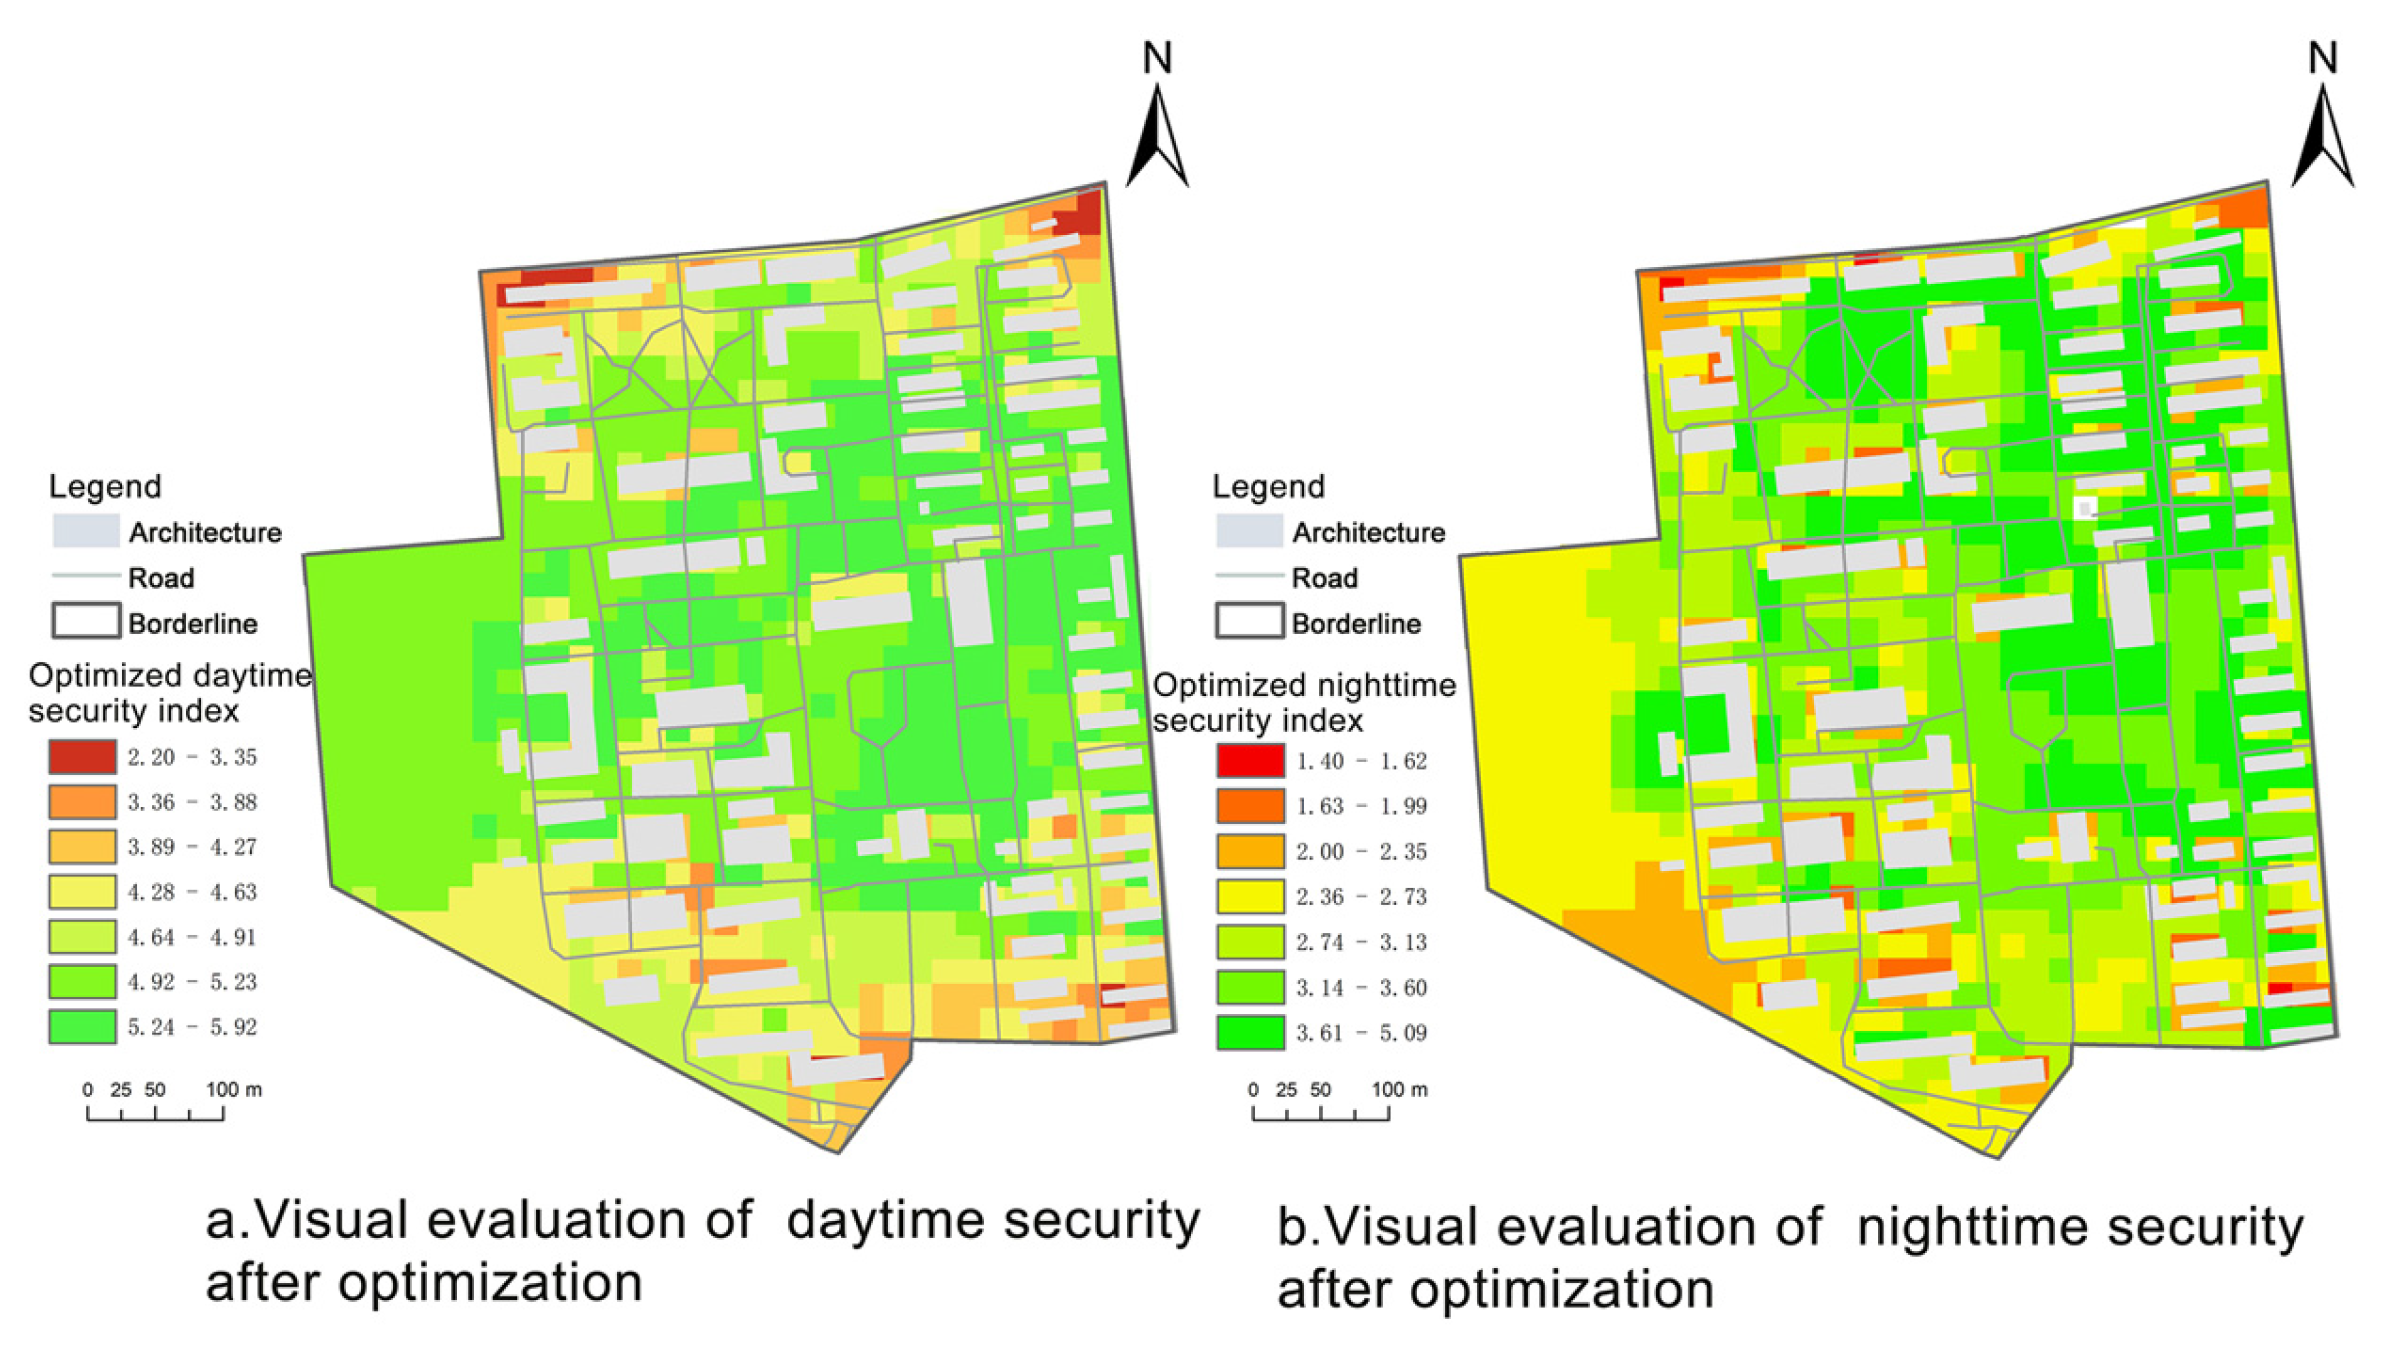
4.3. Comparative Analysis of Optimization Results
According to the operation results of the location assignment to configure surveillance cameras and street lights, the process of street light and surveillance camera security evaluation was repeated, which allowed for a simulation of the sense of security in the optimized campus space. By comparing the results with the preoptimization evaluation, the effectiveness of the optimization strategy can be verified.
6. Discussion
6.1. Effectiveness and Scalability
The evaluation model for the sense of security on college campuses developed in this study aims to comprehensively evaluate the abstract concept of “the sense of security in public spaces” using data from various influencing factors with an AHP hierarchical analysis model and then superimpose quantitative analysis according to the weights, which is a quantitative and visualized method to identify the “campus security blind spots”. As a key issue of social concern, campus safety can greatly benefit from the proposed optimized configuration method presented in this study. By applying the MCLP model to the design of public spaces, the configuration of essential facilities such as surveillance cameras and street lights can be executed in a more targeted manner, leading to significant upgrades in the safety of college campuses.
In addition, the evaluation model and optimization method proposed in this paper are generic and can be extended to other domains, such as the analysis and design of security evaluation in streets, factories, and parks. As the complexity of the study area’s environment increases, its evaluation indices need to take into account many factors that affect the perception of security, such as the maintenance level of street hygiene, the number of stores at night, and the visibility of security personnel. With complete data collection, it is also possible to analyze the sense of security of the entire urban space and integrate it into various aspects of urban community construction and urban renewal to improve the environmental quality of public space. Moreover, using the model and database suggested in this study, secondary development can be performed to create an urban space security perception management system that can use the data visualization and updateable features in this method to make it more user-friendly and convenient for relevant managers to track and analyze the characteristics of urban space’s sense of security and achieve intelligent management of urban space.
6.2. Validation of the Evaluation Method
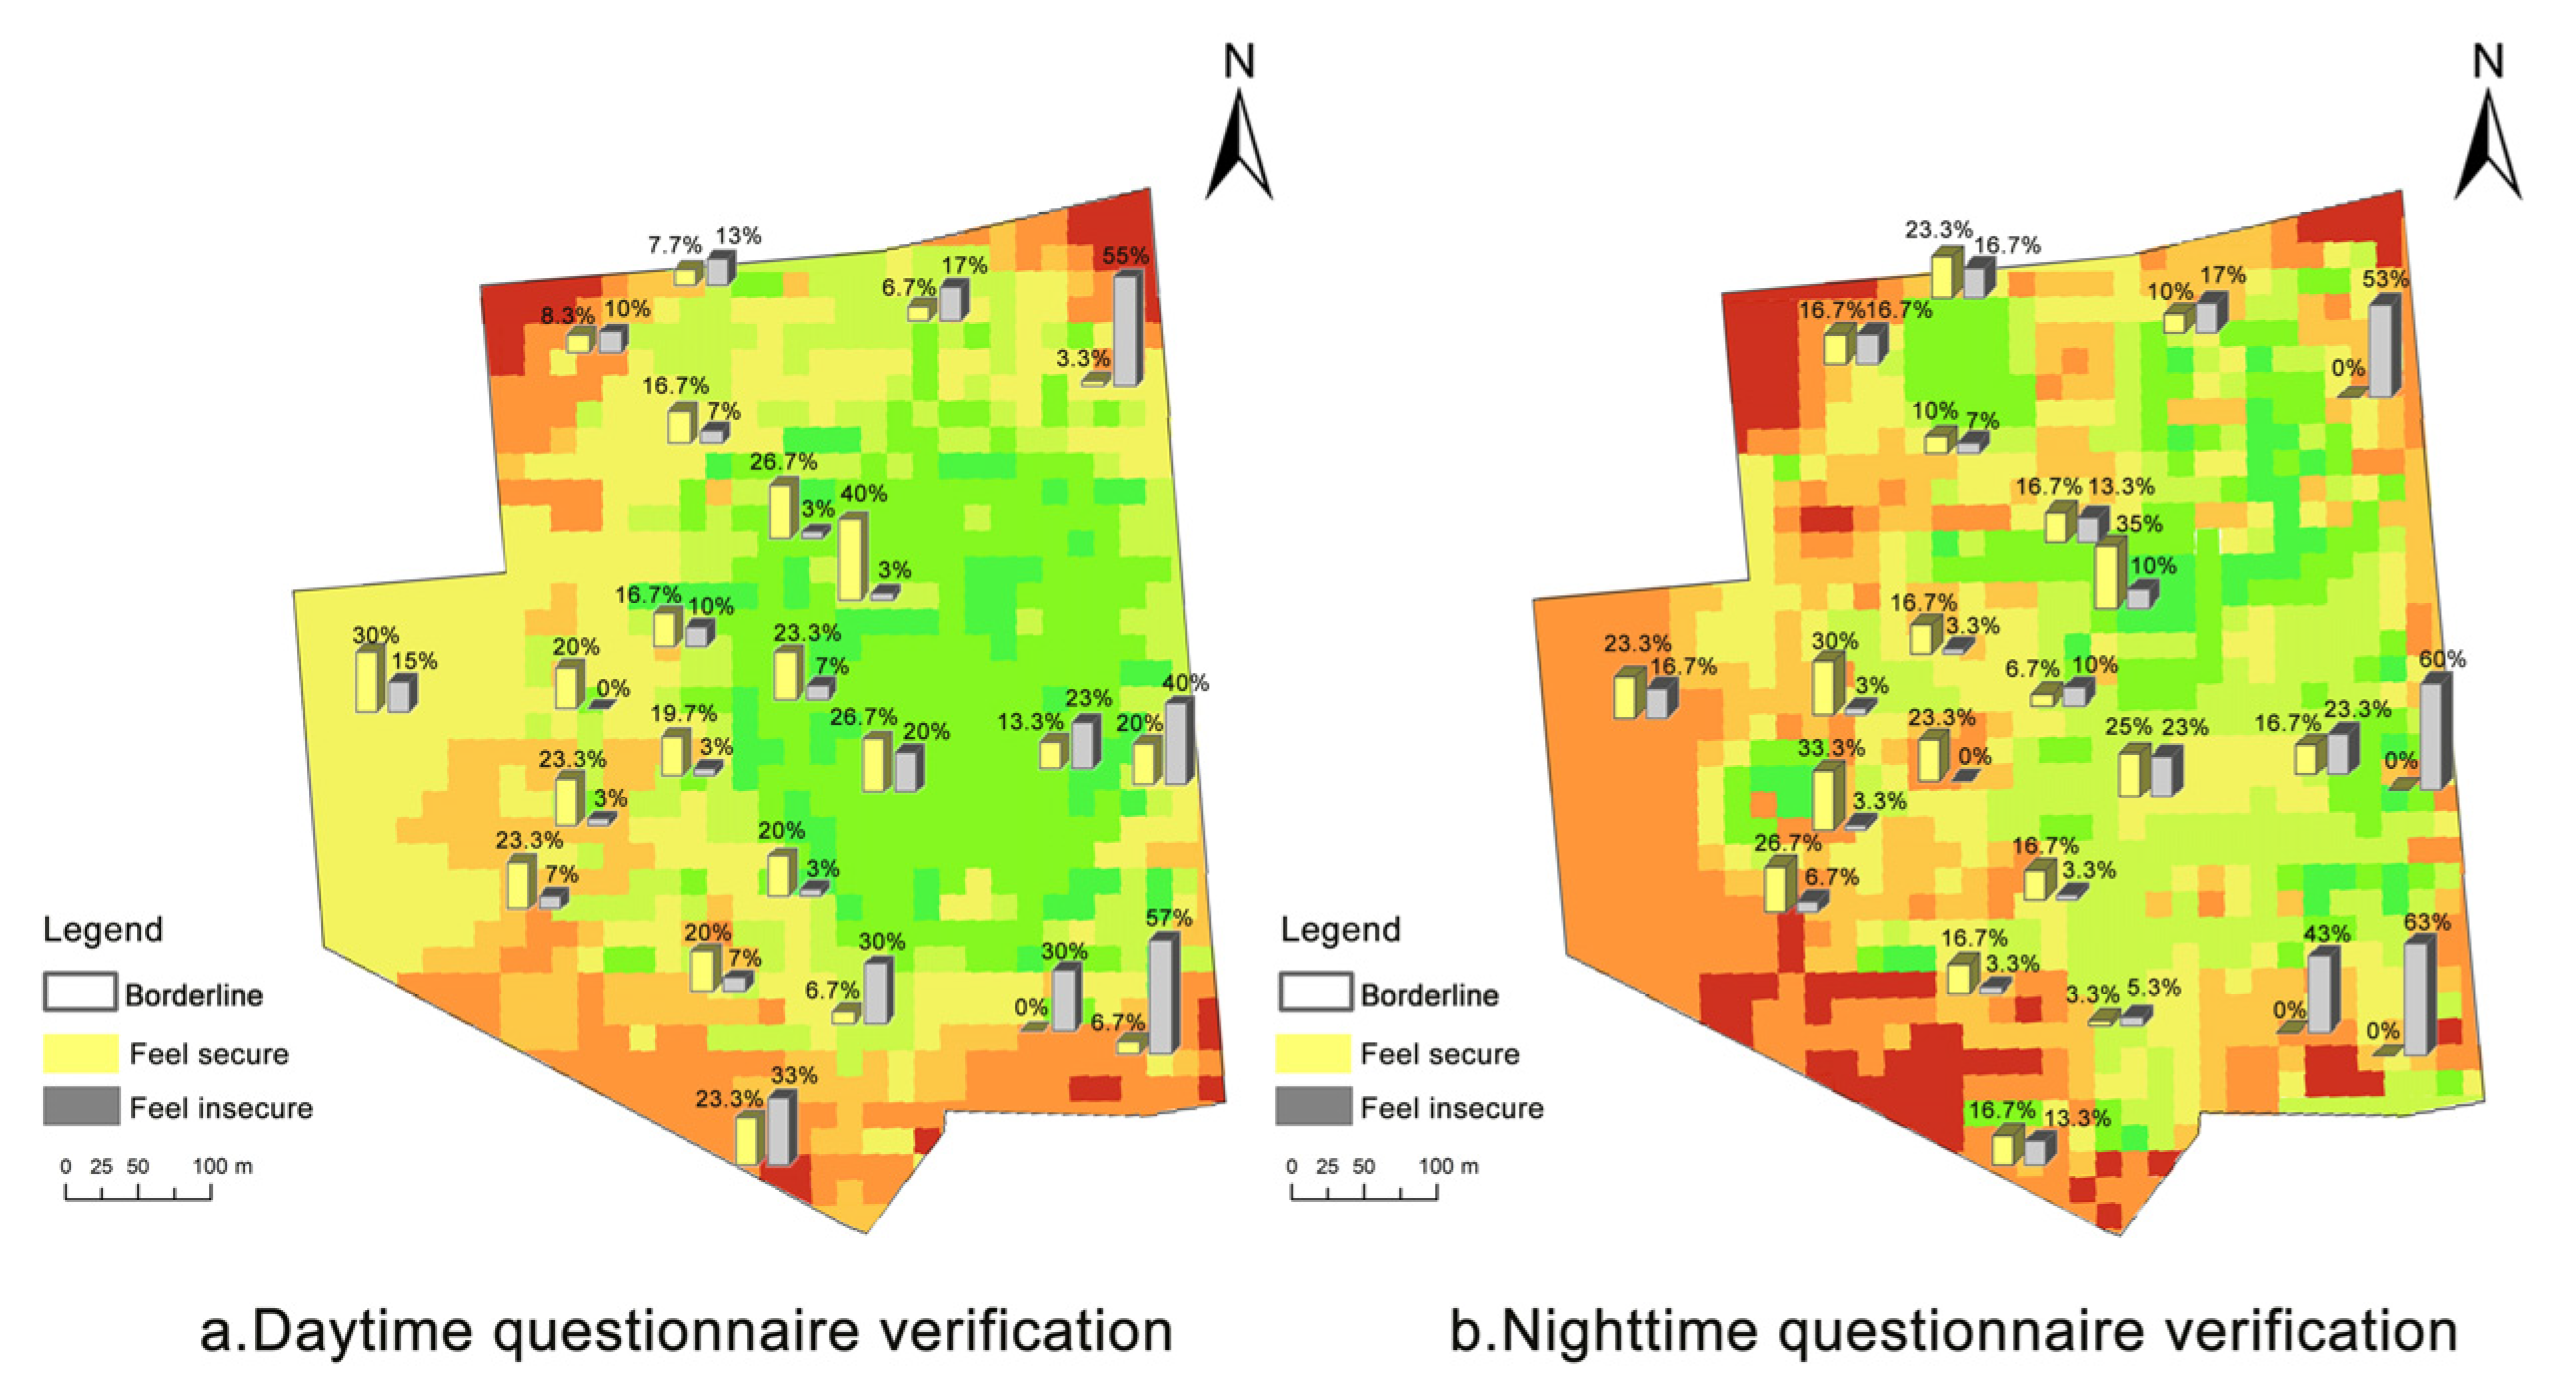
The survey questionnaires were created by evenly positioning and marking points on satellite images of the Wuhan Institute of Technology’s Wuchang Campus, please refer to the
Supplementary Material S2 for the questionnaire. Selecting representatives of faculty and students from Wuhan Institute of Technology, Wuchang Campus, as participants aims to directly collect feedback from the campus community regarding their security perceptions in public spaces. This targeted approach allows for a focused understanding of the experiences and needs of faculty and students in the actual environment. It serves as a more effective means to validate the practicality of the evaluation model in real-world scenarios. The respondents were asked to select five points from a list of options, asking if they felt a sense of security on campus throughout the day and night. After the surveys were distributed, 204 verified questionnaires were collected. The basic information about the participants is presented in
Table 7. Among the valid samples obtained for this study, individuals aged 18–38 constitute the majority. The gender distribution is balanced, encompassing students and staff across various educational backgrounds and age groups within the campus. This demographic composition aligns with the current population makeup of Wuhan Institute of Technology, Wuchang Campus. To verify the accuracy of the evaluation technique, the percentages of those who felt secure and those who did not feel safe at each indicated point throughout the day and night were individually tallied. The results were marked in the form of bar graphs in the day and night security evaluation results chart.
Figure 9 illustrates this concept by showing that areas with high yellow bars have a strong sense of security, whereas areas with high gray bars have a poor sense of security. It can be seen that the areas where the survey respondents think they feel safe during the day and night are mostly the roads near the center of the campus, the student dormitory area, and the teaching building area, while the areas where they do not feel safe are mostly the edge of the campus. The bar trend from high to low roughly matches the evaluation results of the sense of security, which proves that the experimental results have credibility and verifies the accuracy of the evaluation model.
In previous studies, the evaluation of the perception of security in public spaces relied primarily on crime data, questionnaires, and field research interviews. These methods are vulnerable to subjectivity and lack quantitative analysis and open-source data. The proposed spatial sense of security evaluation model in this study has a broad scope of application and is particularly suitable for public areas with low levels of violence and limited crime data. It offers easy data access and has low confidentiality requirements. The model efficiently transforms a large amount of data into visual representations, generating thematic information resources. This enables the analysis and evaluation of the sense of security and structural indices within the study area. Ultimately, the model facilitates the construction of a comprehensive database, providing objective, accurate, and efficient data support for subsequent optimization and design efforts.
6.3. Comparison of the Optimization Models
This study utilized the maximal covering model to evaluate the layout of existing public facilities. It aims to optimize and improve areas with a weak sense of security and provide decision-makers with solutions based on the sense of security evaluation results. The goal is to ensure that the facilities’ service scope covers as many demand points as possible within the study area. The fine-grained optimization method proposed in this paper is more intuitive and targeted than the previous broad “top-down” approach to enhancing the sense of security.
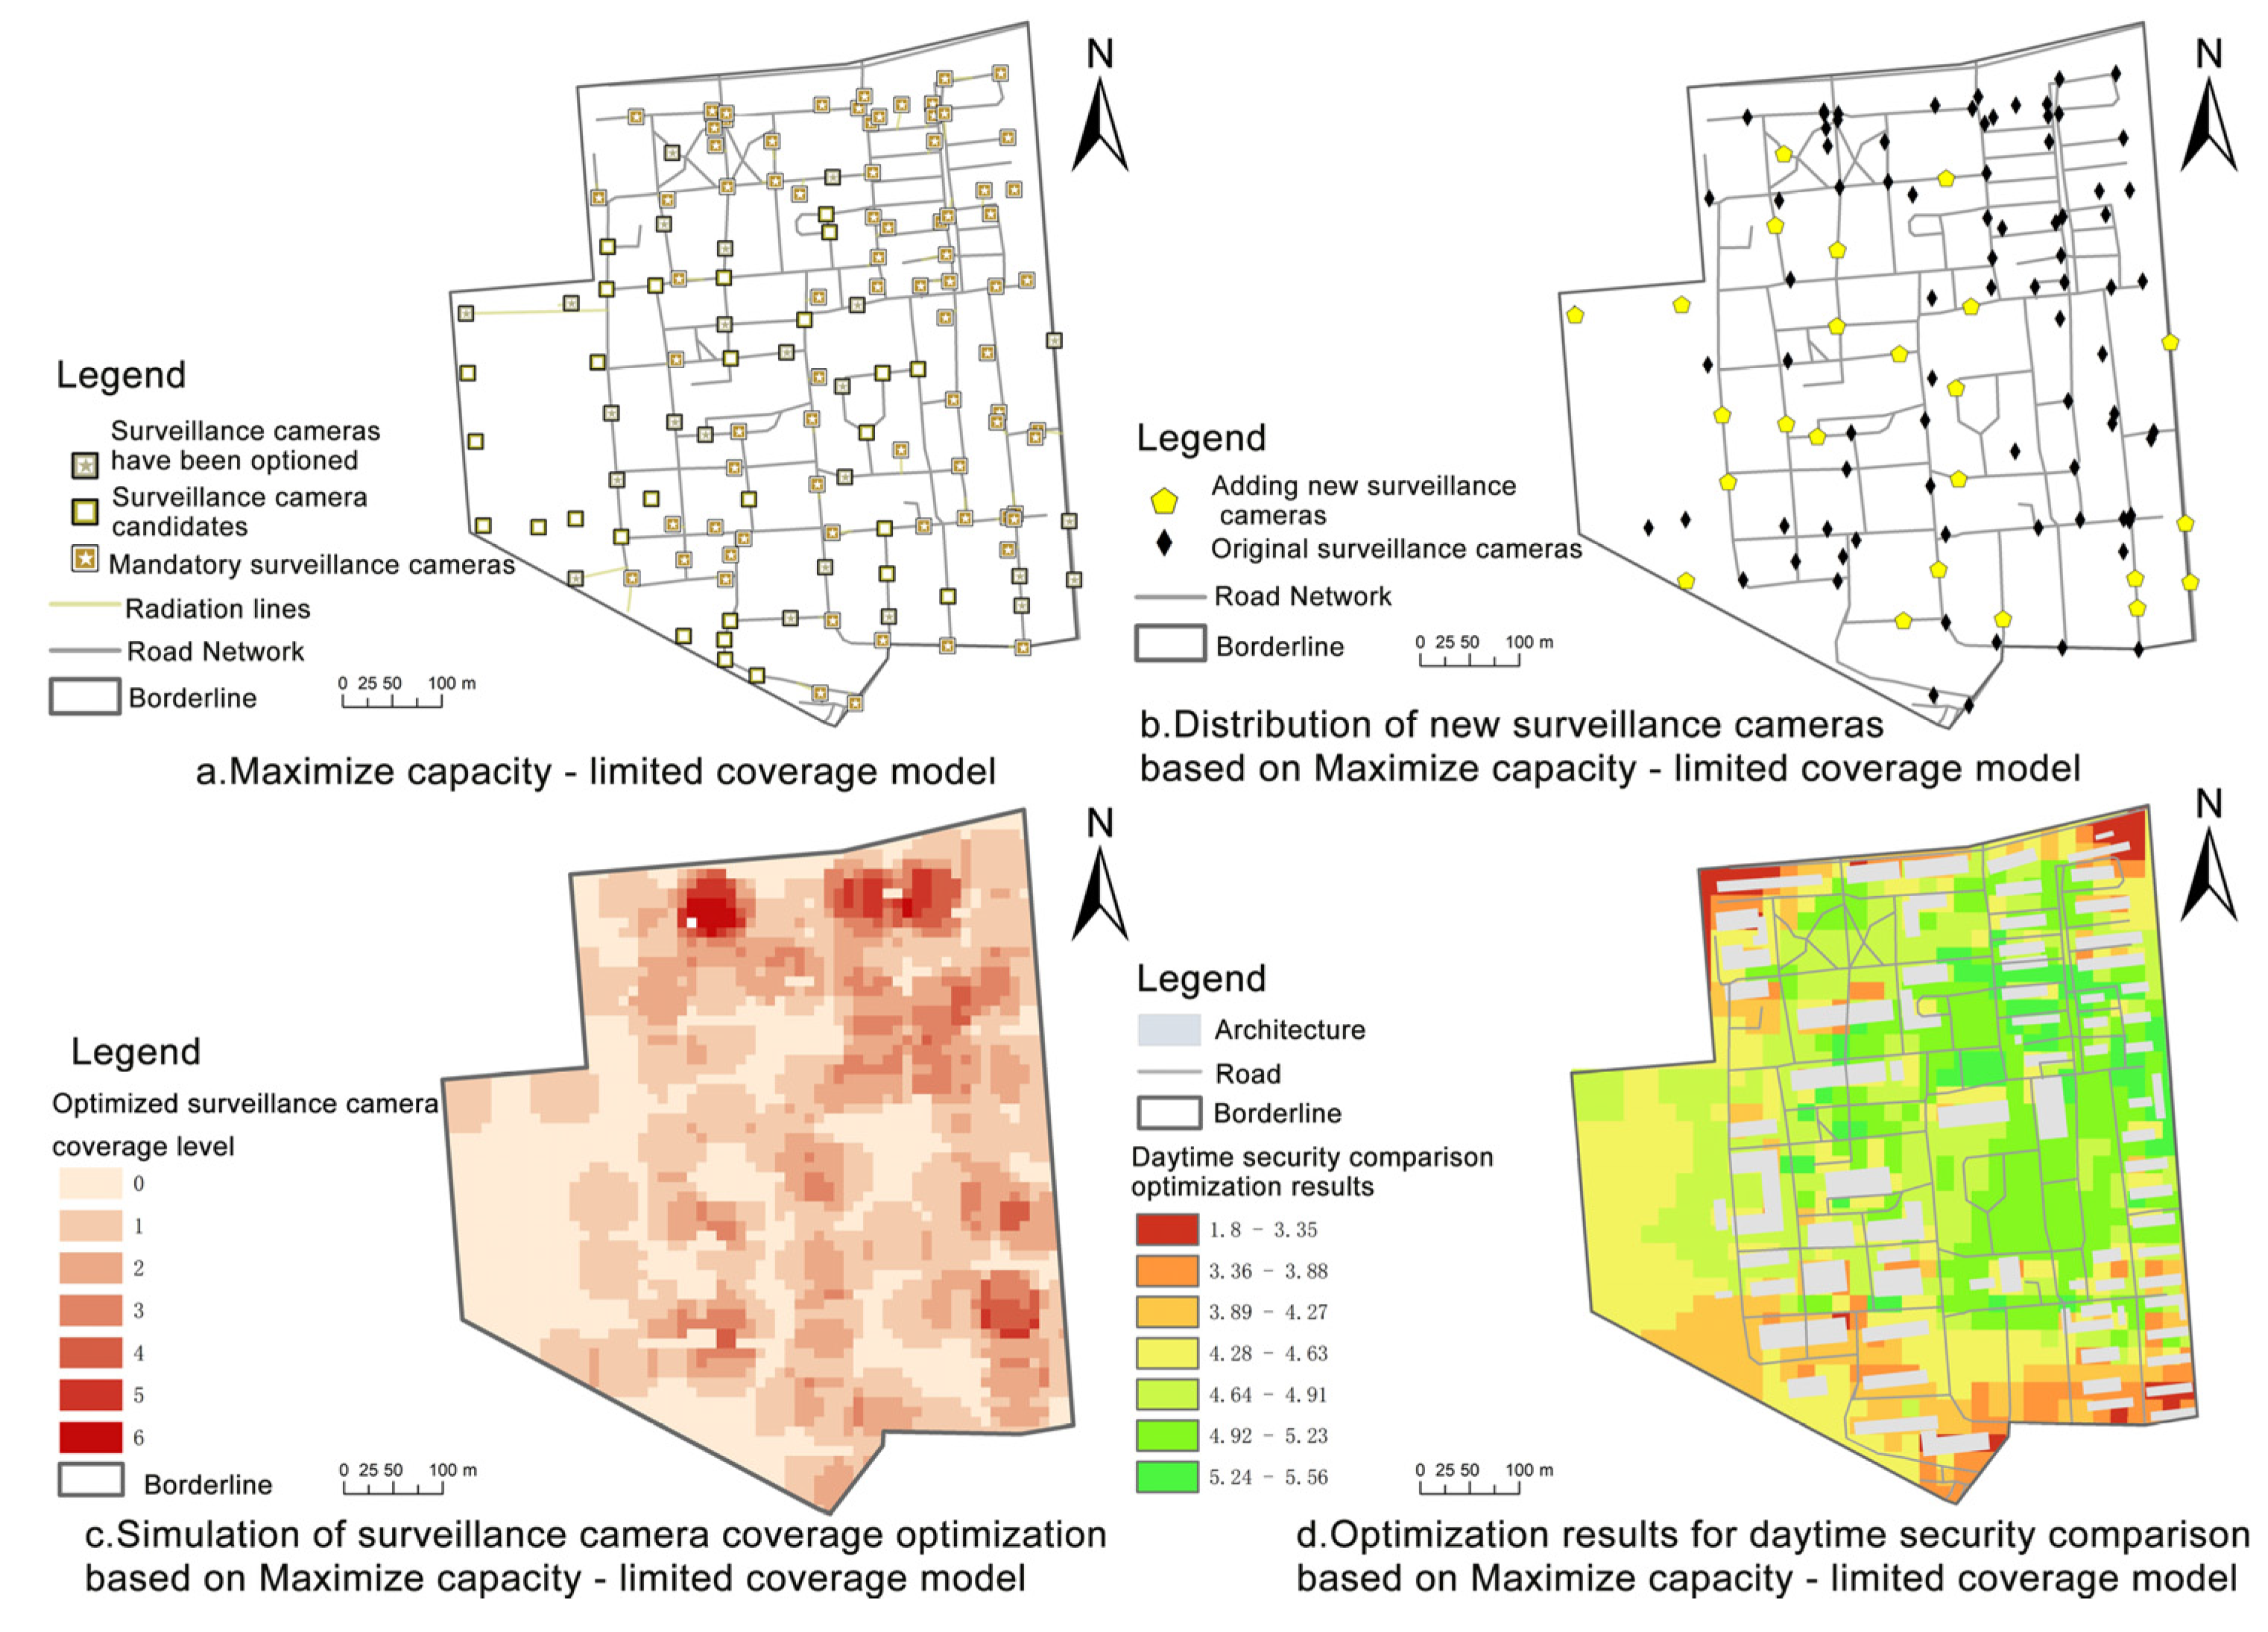
To conduct a comparison experiment on the optimal simulation of the sense of campus security during the daytime, we changed a new constraint to maximize the coverage model with capacity limitation (MCCLP). The remaining parameters were kept unchanged. The results of the model run are depicted in
Figure 10. Notably, the lowest value of the campus space sense of security increased to 1.80, and the highest value increased to 5.56. The results of the comparative analysis showed that both the MCLP model and the MCCLP model can improve the sense of security in campus public spaces to some extent, but the MCLP model is more effective in comparison.
6.4. Limitations and Future Perspectives
The proposed sense of security evaluation and optimization model in this study is relatively well-developed, yet there are several aspects that merit further exploration and refinement: (1) differences in the observation angles of surveillance devices and the service area of streetlights, (2) the impact of campus environmental factors on the evaluation of security provided by lighting, and (3) the complex relationship between security needs and individual privacy.
First, variations in the effective monitoring range and observation angles among different camera models may result in differences in the coverage of surveillance. The evaluation and optimization processes are based on ideal conditions for facility placement, but in reality, the service capacity of streetlights in different areas may vary. Second, when conducting nighttime security evaluations, it is essential to consider the obstruction caused by campus buildings, vegetation, and other elements to both human vision and streetlights. Lastly, the relationship between brightness levels, surveillance coverage, and the individual’s psychological sense of security is intricate and multifaceted. Proper and moderate lighting and surveillance systems may contribute to an overall enhancement in psychological security. However, it is crucial to be mindful of avoiding the negative psychological impacts associated with excessive illumination. Striking a balance between privacy protection and security needs for individuals of different genders, ages, and cultural backgrounds is necessary.
Therefore, future research could consider the following directions: (1) Deepening the evaluation model for the relevant equipment. Designing an evaluation model that takes into account different camera models and the service capacity of streetlights would provide a more accurate assessment of surveillance coverage and the lighting conditions in public spaces. (2) Integrating environmental impact factors. Further investigating the obstructive effects of buildings, vegetation, and other factors on illumination and surveillance, along with considering the influence of interior lighting on the brightness of public spaces, would enhance the nighttime security assessment model. (3) Balancing the need for a psychological sense of security with privacy protection. Delving into the relationship between brightness levels, surveillance coverage, and the individual psychological sense of security, with a particular focus on the moderate use of lighting and surveillance systems, would balance the privacy protection and security needs of different individuals. (4) Research into the impact of differences in culture, gender, and age. Further studying the impact of different cultural backgrounds, genders, and ages on security perceptions and proposing more differentiated security management strategies would better meet the diverse needs of different population groups.
7. Conclusions
In summary, this study established a comprehensive sense of security evaluation model covering both day and night, assessing the abstract perception of a “sense of security” through a qualitative and quantitative approach. Based on the MCLP model, optimization measures were proposed for the configuration of cameras and streetlights. Taking the Wuchang campus of Wuhan Institute of Technology as a case study, a comprehensive evaluation and optimization simulation of campus public space security was conducted. The experimental results indicated a significant improvement in campus safety levels, validating the effectiveness of the proposed sense of security evaluation and optimization model. The proposed model not only facilitates a deeper understanding of the constituent elements of security perception in campus public spaces but also provides specific solutions for optimizing campus security facilities. This, in turn, aids in the effective allocation of resources and offers practical strategies for campus security management.
This study introduces a novel approach by innovatively considering day–night variations in the perception of safety, integrating both physical environmental and psychological perceptual factors. The model combines an AHP-based assessment with MCLP-based optimization, resulting in a comprehensive sense of security evaluation and optimization framework. As societal evolution continues, there is a growing demand for enhanced safety in urban public spaces. This integrated model holds the potential for broader application in relevant urban renewal studies, offering a fresh perspective on safety concerns in analogous scenarios. It propels the development of safety design in public spaces in a more quantitative and precise direction.
Future research could further focus on the differences in various safety facilities, assessing how to balance ensuring a sense of security with privacy protection, and the impact of diverse cultural backgrounds on security perception. This would refine and deepen the sense of security evaluation and optimization model for public spaces, ensuring that urban environments are safer, more inclusive, and more comfortable. Such advancements will contribute to promoting the development of harmonious communities and the construction of safer cities.


