Article

Assessing Coastal Vulnerability and Evaluating the Effectiveness of Natural Habitats in Enhancing Coastal Resilience: A Case Study in Shanghai, China

1
Centre for Environmental Policy, Imperial College London, London SW7 1NE, UK
2
Nature Based Solutions Initiative (NBSI), School of Geography and Environment, Oxford University, Oxford SW7 2UA, UK
*
Author to whom correspondence should be addressed.
Sustainability 2024, 16(2), 609; https://doi.org/10.3390/su16020609
Submission received: 28 November 2023 / Revised: 5 January 2024 / Accepted: 8 January 2024 / Published: 10 January 2024

Abstract

:
This research evaluates the coastal vulnerability of Shanghai, evaluates the effectiveness of existing natural habitats in reducing that vulnerability, and, finally, provides recommendations to improve the resilience of the coastal areas. Shanghai is an important economic center that is home to a large population. However, the combination of ground subsidence, rising sea levels, and more frequent coastal flooding due to tropical cyclones poses escalating climate risks for Shanghai, demanding urgent mitigation measures. The InVEST Coastal Vulnerability Model was used in this study to assess Shanghai’s coastal vulnerability under the current situation and various scenarios that simulated the absence of natural habitats. The assessment results were analyzed through a comparison between different scenarios and spatial aggregation analysis. This study pinpointed highly vulnerable areas, primarily located on the east coast of Chongming Island, the east and northeast coasts of Hengsha Island, and the east coast of the mainland of Shanghai. These areas need to be prioritized for intervention. Also, it demonstrated the effectiveness of existing natural habitats in reducing coastal vulnerability, with large green spaces and salt marshes playing a greater role compared to small green spaces. This is the first study applying the InVEST Coastal Vulnerability Model to Shanghai, demonstrating the model’s potential in providing valuable information regarding coastal protection against the impacts of climate change in Shanghai. Insights from the findings of this study are useful in crafting sustainable land-use policies and plans for Shanghai.

1. Introduction

1.1. Background

Coastal hazards such as erosion, storm surges, tsunamis, and floods have become a major worldwide issue, presenting a substantial risk to coastal populations, homes, and infrastructure [1]. The Indian Ocean Tsunami (IOT) of 2004 resulted in the deaths of about 200,000 people [2]. The subsequent inundation of seawater resulted in the deterioration of both land productivity and the ecological environment [3]. Also, an extensive flooding following Hurricane Katrina in 2005 led to damages exceeding USD 100 billion and a loss of approximately 2000 lives in the United States [4]. More recently, storms such as Harvey and Maria in 2017 also underscored the immense destructive potential of hurricanes and their resulting storm surges and floodings [5].
Climate change leads to an increase in sea levels and more frequent and severe extreme weather events, which worsens coastal erosion and flooding [1,2,3,4,5,6]. The global average sea level has risen by about 20 cm since 1880 [7]. Moreover, since the 18th century, the rate of sea level rise has accelerated, from 1.4 mm per year to 3.6 mm per year [7]. Sea level rise increases the coastal erosion in many regions, such as the east coast of the United States, the Papua New Guinea delta, and the European region [8,9,10,11,12]. Also, in many coastal communities of the United States, the incidence of compound flooding, which is caused by the convergence of high sea levels and intense precipitation, has increased significantly over the past century [12]. Similarly, there has been an upward trend in compound flooding along the coasts of Northern Europe [13].
Globally, there are approximately 2 billion people located in near-coastal zones and nearly 900 million people in low-lying coastal zones [14]. Furthermore, the coastal population is projected to rise further due to rapid economic growth and coastal migration [14]. Additionally, the economic impact of coastal hazards is substantial. One study showed that global economic losses caused by coastal hazards reached approximately 6 billion dollars in 2005 and are estimated to increase to 52 billion dollars by 2050 [15]. Coastal areas’ vulnerability to these trends is a matter of concern, and immediate action is required to mitigate their detrimental effects.
As a metropolis, Shanghai is an important economic hub and home to a substantial population in China. However, it is heavily influenced by coastal hazards and will be increasingly vulnerable to them due to ongoing development and climate change [16]. Between the 1990s and the 2010s, the combination of rising sea levels and storm surges resulted in nearly $400 million in socioeconomic damages [17]. Also, it is projected that about 50% of Shanghai will have experienced flooding by 2100 and 46% of seawalls and levees will be overtopped [18]. In this light, it is essential to understand the coastal vulnerability of this city and provide effective strategies to mitigate the risks, thereby reducing the loss of life and property and maintaining economic viability.

1.2. Literature Review

1.2.1. Basic Definition of Coastal Vulnerability

Coastal vulnerability is typically understood under the umbrella concept of vulnerability. The definition of vulnerability is not standardized and often changes with specific issues and situations [19,20]. Nevertheless, it can be generally defined as ‘The characteristics of a person or group in terms of their capacity to anticipate, cope with, resist, and recover from the impact of a natural hazard’ [21]. Moreover, many researchers characterize vulnerability by considering exposure, sensitivity, and adaptive capacity, an approach which is developed from the conceptual framework initially introduced by the IPCC in 1995 [22,23,24,25,26,27]. Specifically, exposure refers to the degree to which a system is subjected to hazards. Sensitivity is the measure of how much a system is impacted by these hazards. Adaptive capacity, on the other hand, refers to a system’s ability to reduce the negative effects of hazards [25,26,27,28].

1.2.2. Coastal Vulnerability Index: A Main Assessment Method

The fact that numerous countries and regions are vulnerable to coastal hazards highlights the importance of a comprehensive assessment of their vulnerability status. By pinpointing vulnerable hotspots and high-priority areas, coastal vulnerability assessment can guide the allocation of resources and the implementation of mitigation measures [29]. This entails enhancing infrastructure, devising sustainable land-use regulations, and implementing community-based measures to mitigate the extensive impacts of coastal hazards.
Index-based methodologies are widely used in coastal vulnerability assessment [30,31,32,33]. These are often applied in conjunction with remote sensing, GIS, and dynamic modeling techniques [31]. This approach allows people to summarize and simplify relevant information and obtain visual and quantified outcomes, facilitating scientific planning and policymaking for coastal regions [31,32,33,34,35,36,37].
The concept of the Coastal Vulnerability Index (CVI) was first formulated by Gorintz in 1990 [38]. In the study, six geophysical variables—geomorphology, coastal slope, relative sea level rise, and tidal range—were integrated to investigate the impact of sea level rise. This measure was first used for the coastlines of the United States [39]. Subsequently, many researchers adopted and modified this method to conduct coastal vulnerability assessments on a wide range of regions and scales [32,33,34,35,36,37,38,39,40,41,42].
It is recognized that vulnerability is the result of interactions between biophysical and social factors [43]. Thus, even though much of the literature discusses geomorphic and physical coastal vulnerability, a growing number of studies are considering socio-economic factors and incorporate relevant variables into comprehensive assessments. Cutter et al. [43] initially created the Social Vulnerability Index (SoVI), making use of a total of 42 factors to examine the socio-economic vulnerability of significant coastal regions in the United States. This index has acted as the foundational reference for numerous coastal vulnerability assessments that take socio-economic factors into account [44]. The selection of variables ranges from the simple to the complex, with socio-economic status, population, education level, and land use being very common [45]. For example, Onat et al. [46] considered only population density when assessing the coastlines of Hawaii Island, whereas Yoo et al. [25] used a more diverse set of variables, such as regional gross domestic product (GRDP), transportation networks, and healthcare services, in their study in Jakarta, Indonesia.
Currently, most studies use a composite CVI and multi-scale CVI, considering both physical and socio-economic factors [47,48,49,50]. Such CVIs use varied subindices that are combined to yield the final CVI. For example, Murali et al. [48] utilized a composite CVI to study the Puducherry coast in India. They examined seven variables for their Physical Vulnerability Index (PVI), such as coastal geomorphology, regional elevation, and sea level change. Additionally, four parameters were considered for their Social Vulnerability Index (SVI), such as population, land use, transportation systems, and cultural heritage [48]. The CVI was finally calculated as the arithmetic mean of the PVI and SVI [48]. Also, McLaughlin and Cooper developed another multi-scale CVI that specialized in the impacts of coastal erosion. The index integrated three sub-indices, including a coastal characteristic sub-index, a coastal forcing sub-index, and a socio-economic sub-index, and has been applied to coastal systems in the UK at various scales, from the national to the local [51].
Furthermore, given that vulnerability is often characterized as including a combination of exposure, sensitivity, and adaptive capacity, several researchers have used this conceptual framework to create three subindices, including the Exposure Index (EI), the Sensitivity Index (SI), and the Adaptive Capacity Index (ACI) [25,26,27,28,29,30,31,32,33,34,35,36,37,38,39,40,41,42,43,44,45,46,47,48,49,50,51,52]. The EI and SI generally reflect the potential of coastal systems to be negatively affected by hazards [53], whilst the ACI generally indicates their ability to mitigate the impacts [45]. The CVI considers physical and social factors to measure vulnerability, whereas the EI incorporates climate change scenarios, making it useful for coastal habitat assessments. The Coastal InVEST model assesses coastal vulnerability using both indicators and considers future changes under several climate change scenarios [54,55,56,57,58,59]. In the study by Zhang et al. [27], which assessed the coastal vulnerability of Bohai in China, the researchers considered a total of 15 variables (5 variables for each subindex), including geomorphology, natural habitats, population density, urbanized area, per capita GDP, and medical services, and computed the final CVI for each coastline segment based on the formula CVI = (EI + SI)/ACI [27].

1.2.3. Application of the InVEST Coastal Vulnerability Model

The InVEST Coastal Vulnerability Model is an effective tool for quickly evaluating the risks associated with coastal disasters. Based on the rationale of the CVI, this model determines coastal vulnerability by considering multiple geophysical variables [54]. A detailed explanation of how this model works will be given in the Methodology section.
To date, this model has been applied in many cases around the world, such as the United States, Italy, China, and East Africa, contributing to coastal protection and management from local to cross-national scales [56,57,58,59]. This research used a methodology that has been proven effective in previous cases to evaluate the vulnerability of Shanghai’s coastal areas. The objective was to provide valuable information for the future development and administration of these coastal regions.

1.2.4. Calls for Coastal Protection and Adaptation

It is widely recognized that governments at different levels need to take actions for the mitigation of and to adapt to coastal hazards. The Rio+20 Conference reached a consensus that adaptation is one of most important priorities at the global level and emphasized the concern over the escalating threats posed by sea level rise and coastal erosion [60]. More recently, the Sharm-El-Sheikh Adaptation Agenda was launched at COP 27, which proposed that there is a need to further enhance adaptation actions, with a focus on vulnerable communities [61].
At present, the mitigation and protection measures for coastal hazards mainly rely on hard structures such as seawalls, groins, and breakwaters, particularly in urban areas [62,63]. Even though such structures are effective against hazards, they have a significant limitation of high construction and maintenance costs [64,65]. Hard structures also tend to be resistant to hazards only up to a certain threshold; for example, the seawalls in Jiangsu and Shanghai in China are typically designed to withstand the water levels of 50-year and 200-year return periods [66]. However, as sea levels continue to rise and violent storms become more frequent, the likelihood of hard buildings failing is growing. This, in turn, might worsen coastal risks in the nearby communities [67,68]. Additionally, hard structures can bring other negative consequences, such as reducing the aesthetics of coastal landscapes, and altering hydrodynamic and depositional processes, which may exacerbate coastal erosion [63].
Meanwhile, it is increasingly realized by scholars and policymakers that coastal ecosystems play an essential role in preserving coastlines and enhancing the resilience of coastal systems to natural hazards [60,69]. As a result, there is a growing trend of making the preservation of ecosystems a part of coastal development plans [70]. On the international scale, Aichi Targets emphasize the importance of recognizing the values that ecosystems can provide and integrating them into national and local development strategies [71]. Moreover, the Kunming-Montreal Global Biodiversity Framework advocates for governments to adopt nature-based solutions, which could be understood as approaches to protecting and restoring ecosystems to maintain and enhance ecosystem services, including protection from natural disasters [71].

1.2.5. Importance of Natural Habitats

Coastal vegetated habitats, including mangroves, salt marshes, and seagrass meadows, have been proven to be effective in coastal protection [72]. The root systems of vegetation, especially mangroves, can create a barrier between water and soil, which enhances soil cohesion and slows coastal erosion [72,73]. In addition, vegetation can decelerate water flow and promote sediment deposition [60,74]. In turn, sediments can further support the growth of roots [75]. Moreover, vegetation can significantly dissipate wave energy and, thus, mitigate storm surges and flooding [73,76]. According to McIvor et al. [77], 100 m of mangroves could result in a 13%–66% reduction in wave height. An early study in England found that salt marshes had the ability to mitigate wave energy by about 82% [78]. Additionally, in a study in northwestern Europe, it was shown that salt marshes that were merely 40 m wide were able to reduce the wave height by about 15% [79].
Moreover, these habitats can grow with rising sea levels. A few studies have found deep sediments in mangrove and salt marsh ecosystems, suggesting that vegetation has been growing vertically [74,80]. However, the accretion rates of these habitats can vary by location; for example, it has been proposed that salt marshes would accrete at a lower rate at higher latitudes due to the shorter growing season [60,61,62,63,64,65,66,67,68,69,70,71,72,73,74,75,76,77,78,79,80,81,82,83]. Regardless, this characteristic allows these habitats to adapt to climate change, providing an advantage over traditional coastal defense structures [74,84].
In addition to coastal vegetated habitats, coral reefs are another typical natural habitat that can protect the coast. The complex geometry and rough surface of coral reefs can absorb and disperse the energy of waves, thereby protecting the shore against hazards [85,86,87,88]. A thorough study of coral reefs in the Indian, Pacific, and Atlantic oceans revealed that coral reefs can disperse almost 97% of wave energy [89]. Also, in the study by Reguero et al. [88], it was found that the uppermost 1 m of coral reefs along the coastlines of the United States prevented a ten-fold increase in the frequency of 100-year flooding events, as well as a 23% expansion of the flood zone. However, it is important to note that the effectiveness of these habitats in coastal protection is closely linked to their health [90]. Coral reef ecosystems are in crisis globally; for example, in the Indo-Pacific, where coral reefs are highly abundant, the annual loss of coral cover is about 1–2% [91]. A range of environmental issues, such as seawater warming, ocean acidification, and pollution all contribute to coral reef bleaching and degradation [92,93].
Many nations and regions are now acknowledging the importance of natural habitats in enhancing coastal resilience. As a result, they are actively engaging in efforts to restore and create biological habitats as a means of coastal protection and adaptation [64,94]. For instance, the Belgian government has undertaken a large-scale project to restore about 4000 hectares of reclaimed wetlands in the Scheldt estuary to flood plains, of which about 2500 hectares would be tidal marsh [64]. This project, which is due to be completed by 2030, will effectively reduce annual losses due to coastal flooding by 1 billion euros in the future [95]. Similar projects have been implemented in estuaries in the UK, such as the Humber Estuary, to restore marshes for coastal defense, known as “managed coastal realignment” [96]. Multiple large-scale projects are now being carried out in the United States, such as the rehabilitation of tidal marshes in San Francisco Bay and the Mississippi River Delta [64,97]. In addition, in tropical areas such as Bangladesh, the Philippines, and Vietnam, mangroves are being planted and protected against storm surges [98,99].

1.3. Research Aims & Objectives

Continuous understanding of the level of protection that natural habitats provide toward coastal resilience is needed. This entails building on previous research and enhancing existing models [60]. Moreover, essential information regarding specific locations in which natural habitats provide protection against coastal hazards and reduce coastal vulnerability is often lacking for decision-makers [69]. Hence, this research aims to (1) assess Shanghai’s coastal vulnerability under the current situation and under scenarios that simulate the absence of different natural habitats; (2) evaluate the effectiveness of different natural habitats in reducing that vulnerability; and (3) provide intervention recommendations to improve coastal resilience in Shanghai.
The research objectives include:
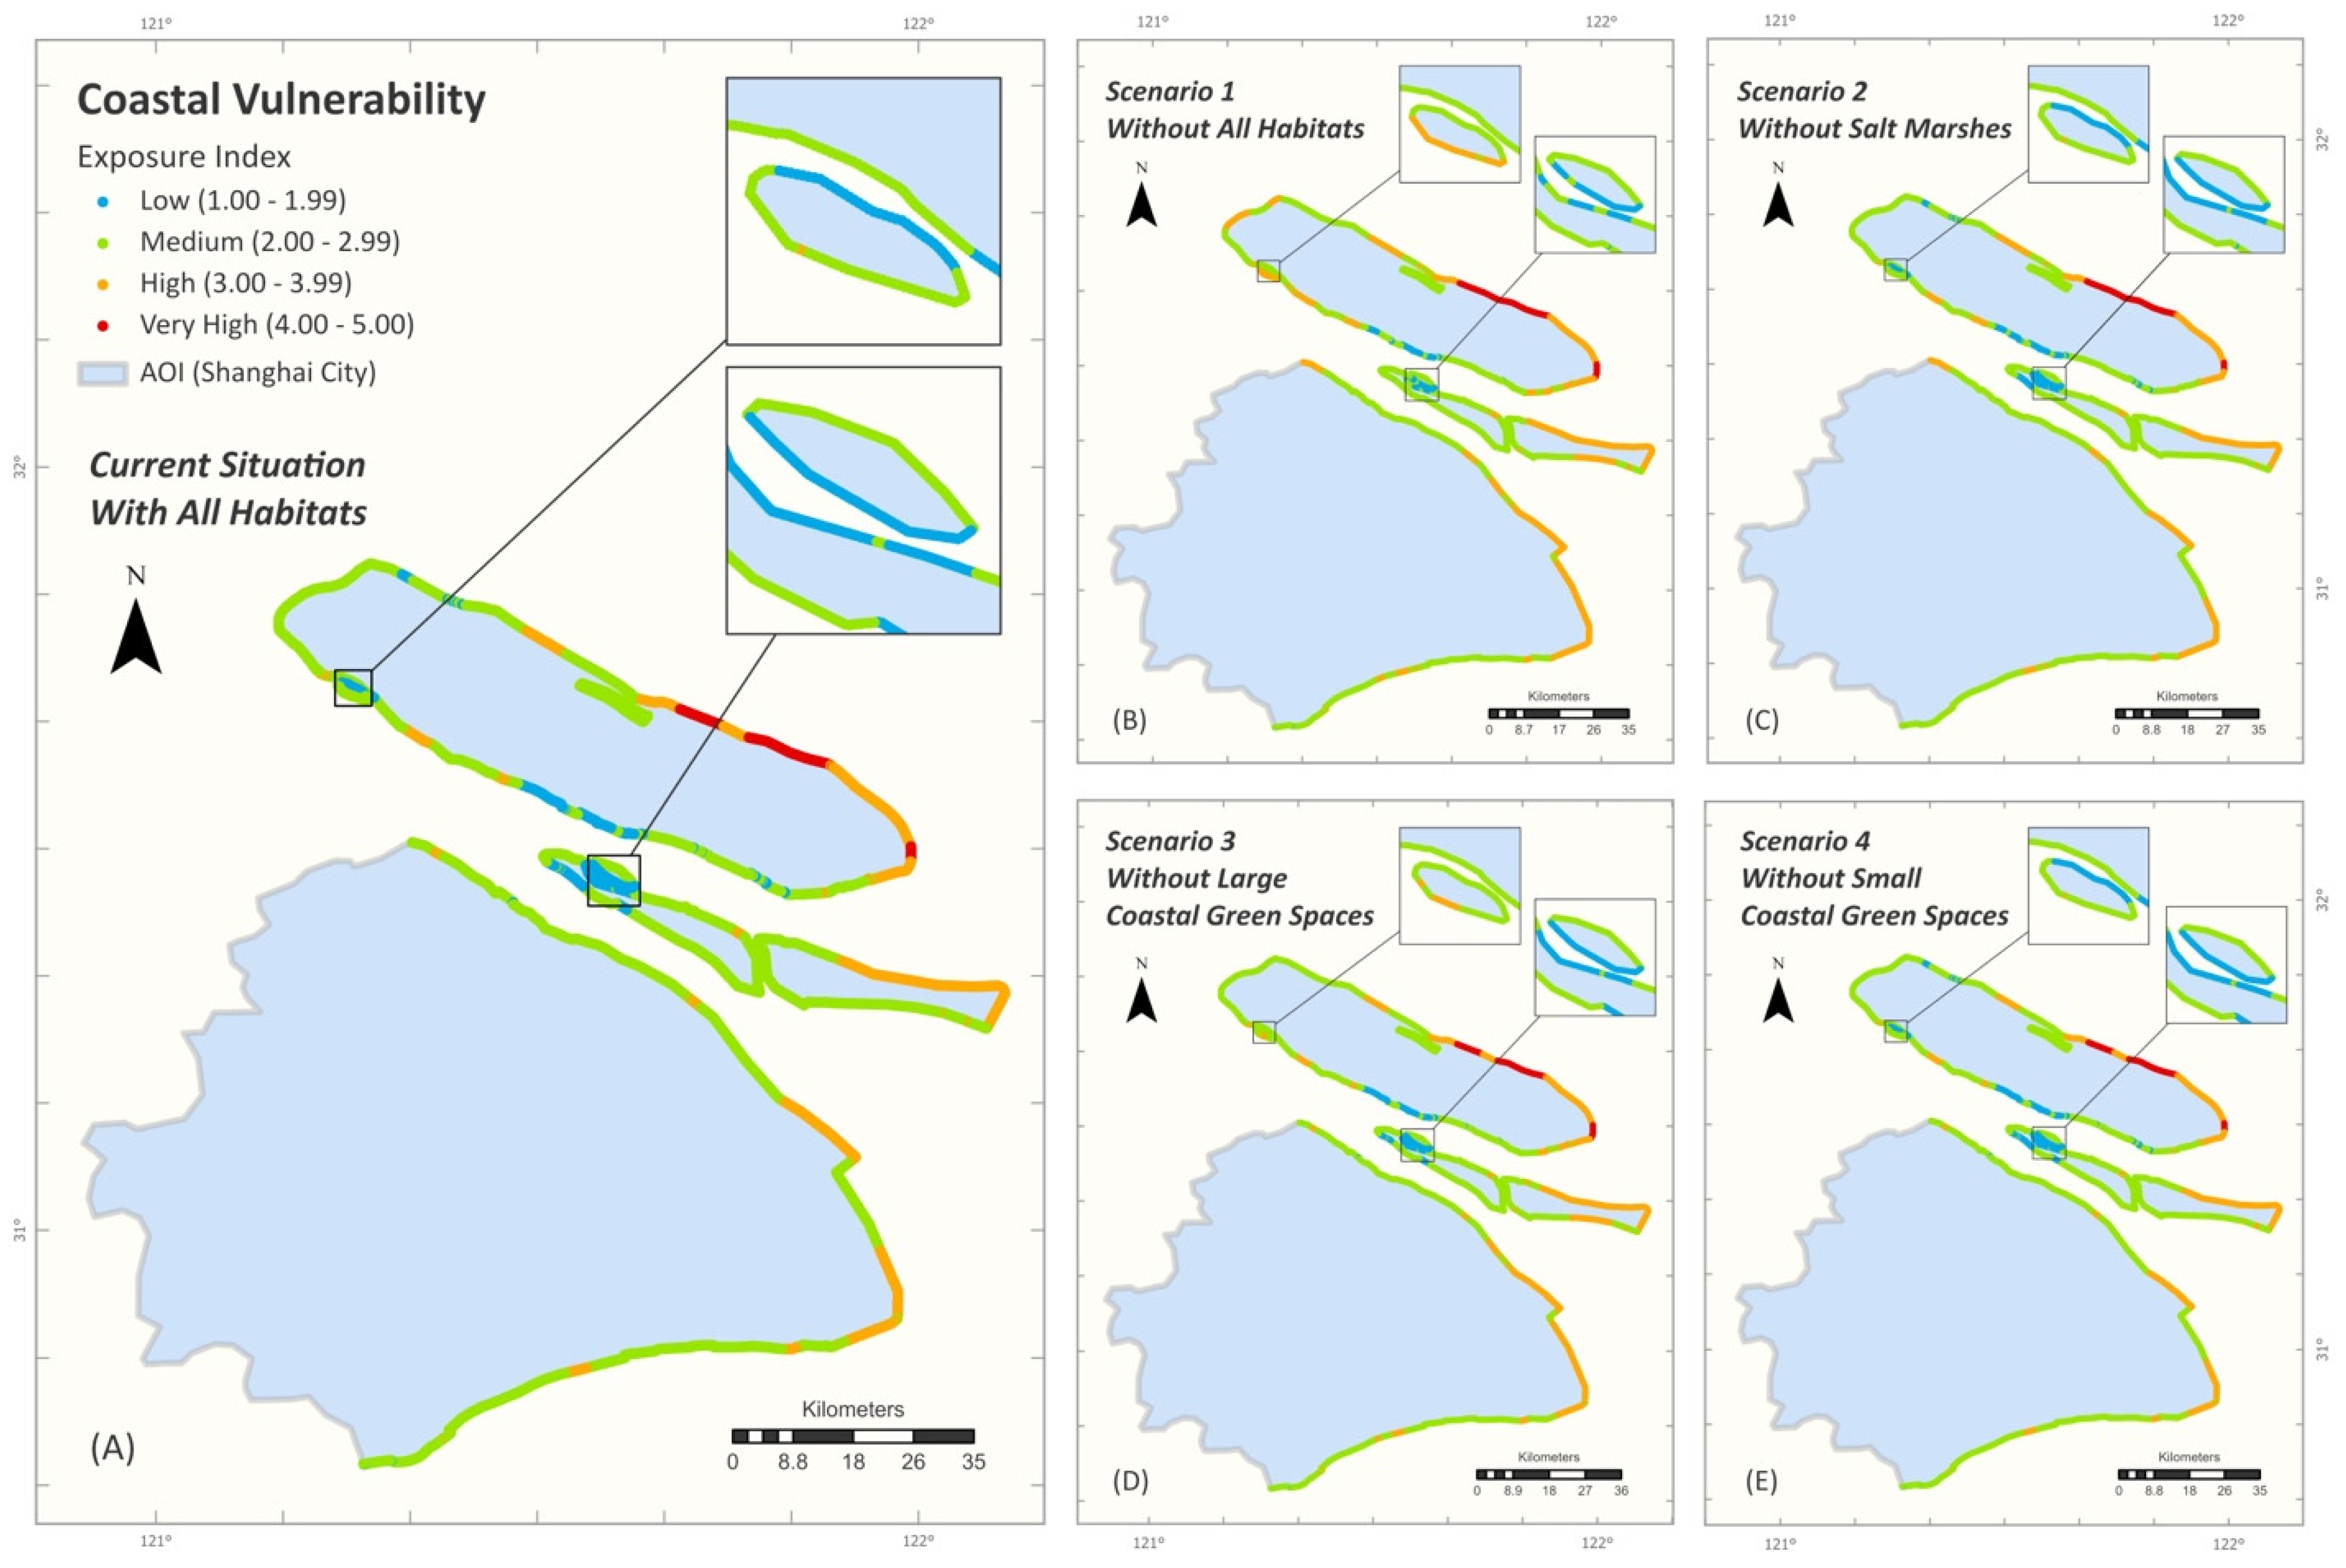
  • Produce maps that depict the spatial distribution of coastal vulnerability under the current situation and under scenarios without certain natural habitats;
  • Compare the differences in the distribution of coastal vulnerability between different scenarios;
  • Discuss the characteristics of the spatial distribution of the current coastal vulnerability;
  • Identify priority areas for implementing interventions;
  • Propose recommendations for interventions that can improve the city’s resilience to coastal hazards.

2. Materials and Methods
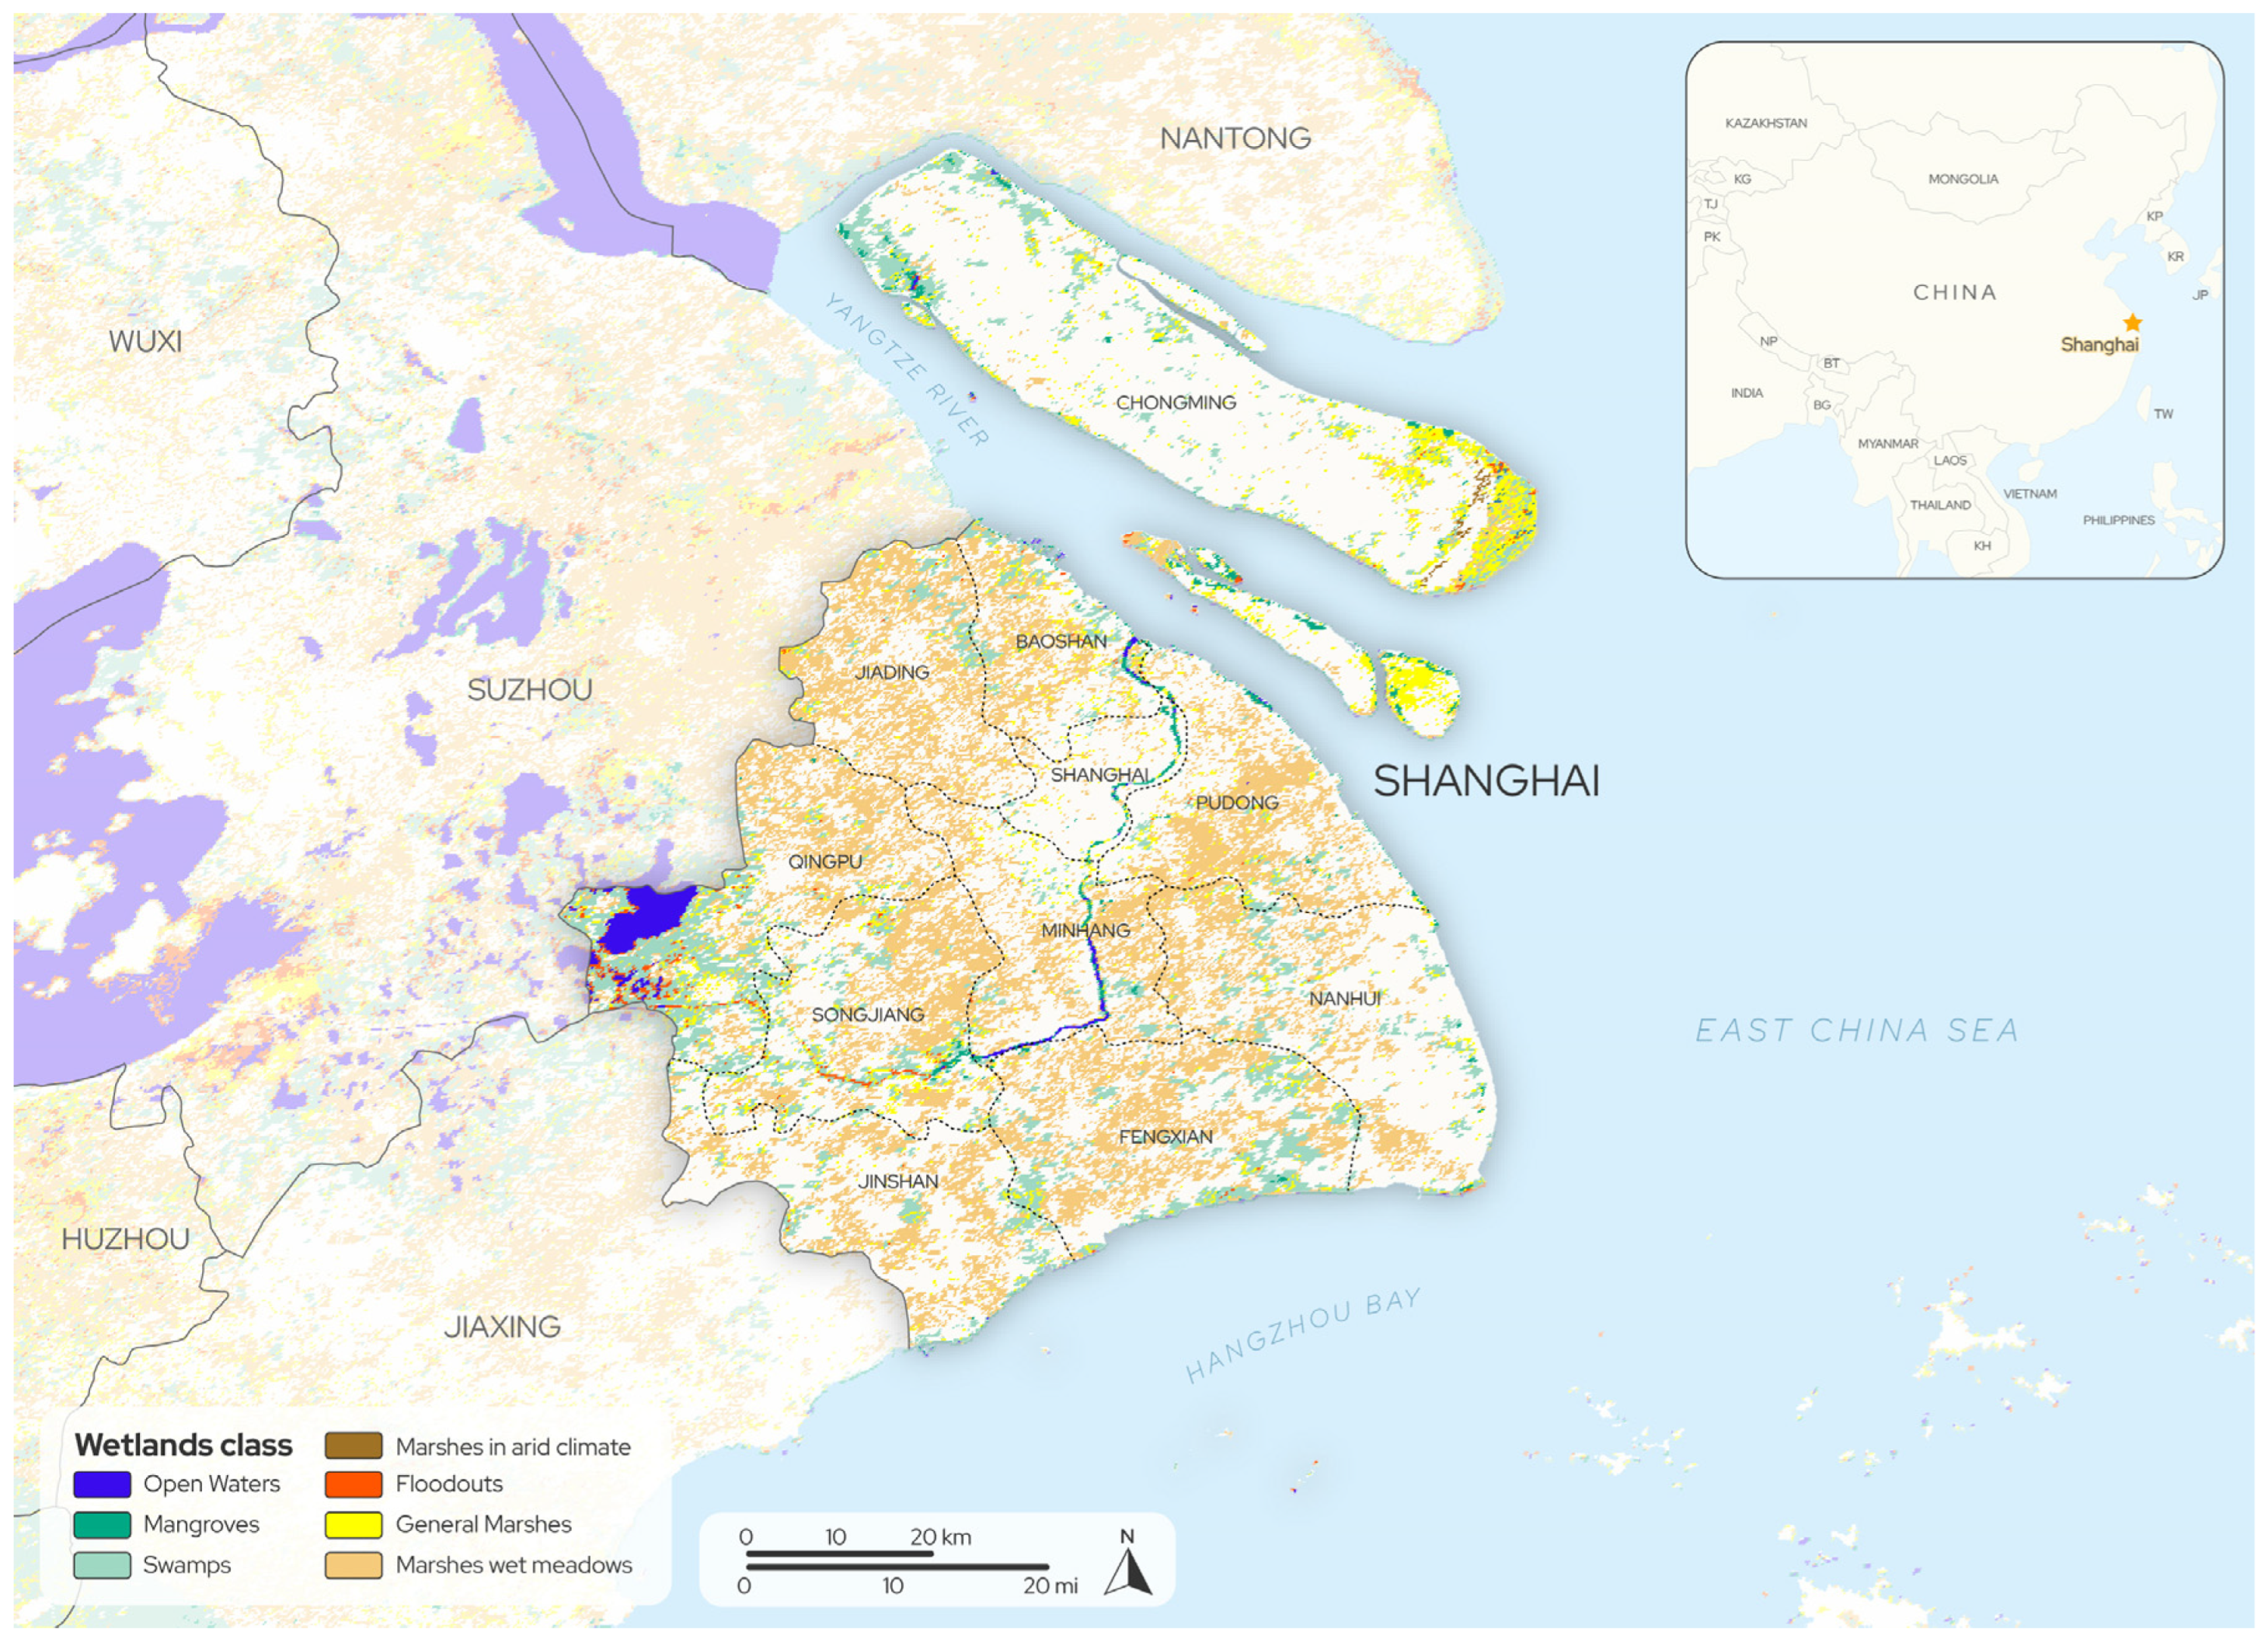
2.1. Study Area

The location and boundaries of the study area, which comprises the Shanghai mainland and three inhabited islands under municipal administration, are illustrated in Figure 1. Shanghai, a notable urban center, is geographically located on the eastern coast of China, at the convergence of the Yangtze River and the East China Sea. It covers an area of 6340 km2, spanning the geographical coordinates between 30°23′–31°37′ N and 120°50′–121°45′ E [17,18]. This city is home to a substantial population of 24.76 million as of 2022 [100]. Moreover, the population is projected to increase to 32.87 million by 2023 [101].
Shanghai has an annual precipitation of approximately 1200 mm and a humid subtropical climate [102]. The majority of the precipitation occurs during the summer months [103]. Tropical cyclones frequently affect the city from August to September [104]. The city encountered a total of 148 tropical cyclones from 1949 to 2015, among which 91 incidents resulted in storm surges exceeding 0.8 m [16]. Coastal flooding resulting from tropical cyclones is a significant natural hazard in Shanghai, with an increase in frequency since 1949 [16,103]. Moreover, as a result of the combined effects of ground subsidence and sea level rise, the danger of coastal inundation in Shanghai will increase in the future [104,105].
Shanghai is situated on an alluvial plain with low-lying terrain. The average elevation is only 4 m [18]. This inherent topographical feature renders the city susceptible to coastal hazards. To strengthen the city’s defense, a flood defense system was initiated in the 1950s and has since undergone extensive reinforcement. Currently, Shanghai has 480 km of levees along the Huangpu River [16]. Additionally, it has a network of 514 km of coastal seawalls, designed to stand at least 6 m in height [18].

2.2. Main Phases of the Study

This study was conducted in four main phases, including data preparation, model operation, visualization, and data and result analysis. Each phase produced corresponding outputs that could be fed into the next phase or serve the final research aims. Different software tools and models were used throughout the process, including ArcGIS Pro 3.2, the InVEST Coastal Vulnerability Model, and MS Excel 2021. The following parts of this section will specifically introduce the InVEST Coastal Vulnerability Model and explain the processes of data preparation, scenario creation, and data and result analysis.

2.3. InVEST Coastal Vulnerability Model

This research used the Coastal Vulnerability Model in InVEST 3.13.0 to perform a comprehensive evaluation of coastal vulnerability as shown in Figure 2. This model is an open-source software created by the Natural Capital Project [54]. The model can create shore points along the coastline, and compute an EI for each point. The EI quantifies the level of vulnerability to erosion and flooding caused by storm events. The purpose of this research is to use the EIs as a metric to assess the degrees of susceptibility of coastal areas.
The EI is calculated by integrating the ranks of a range of bio-geophysical variables, including relief, natural habitats, wind exposure, wave exposure, surge potential, geomorphology, and sea level change. The following equation represents the calculation of the EI [54]:
EI = (R_Geomorphology R_Relief R_Habitats R_WindExposure R_WaveExposure R_Surge R_SLR)1/7
where R is the rank of the variable.
The ranking of variables is grounded in the methods proposed by Gornitz et al. [39] and Hammar-Klose and Thieler [106]. The model assigns distinct ranks (from Rank 1 to 5) to the variables, with a higher rank referring to a higher level of exposure. Appendix A is an illustrative example from the Natural Capital Project [54]. Notably, the ranking criteria for natural habitats and geomorphology can be tailored to the context of the study area. In this study, both were properly modified, and the adjustment details will be elucidated in Section 3.2.2, Data Preparation.

2.4. Data Preparation

The operation of the model necessitated a series of data layers for the Digital Elevation Model (DEM), bathymetry, continental shelf contour, landmass, geomorphology, natural habitat, wind and wave data, and sea level rise (SLR) [54]. Most data were openly accessible and could be directly input into the model. However, certain data, including data on the landmass, geomorphology, and natural habitat, were either unavailable or lacked the required level of accuracy and detail for the project’s needs. To address this issue, visual interpretation and supervised classification were adopted to create and modify data layers that described the required bio-geophysical variables. Table 1 lists the details of the datasets used in this study.
The landmass data were sourced from GSHHG version 2.3.7 [109]. Due to ongoing land reclamation activities and the deposition of sediment in the study area [111], the existing data layer faced a limitation in accurately depicting certain landmass outlines. Given this, the landmass data layer was manually modified with reference to Landsat-8 satellite imageries [111] and World Imagery [112].
The geomorphology data layer was manually created by visual interpretation. The imagery information was sourced from World Imagery [112] and street views provided by Google Maps and Baidu Maps. Referring to the Natural Capital Project [55] and pertinent studies [55,58], the coastal geomorphology of the study area was classified into six types with different ranks, including protection structure, harbour and wharf, cobble beach, lagoon, estuary, and mudflat (see Table 2).
In this study, the natural habitats were mainly salt marsh and coastal green space. The data layer of saltmarsh was downloaded from the UNEP-WCMC Ocean Data Viewer [113]. The Ocean Data Viewer also provided data on other habitats, such as seagrasses and mangroves, but they were not distributed within the study area.
Coastal green spaces and vegetated habitats were considered in the study due to their function of coastal protection [72,114]. Since there was a lack of existing datasets, this study employed the method of supervised classification to identify ground features within a 1 km radius of the shorelines, and then screened the vegetated areas to create the data layer of coastal green space. This process was conducted in ArcGIS Pro, and satellite imagery composited from Landsat-8 spectral bands was used as reference [111].
The classification was relatively rough due to technical limitations and a lack of high-resolution images. There were four main categories for the ground features, including water bodies, developed area, vegetated area, and bare land. Also, an accuracy assessment was conducted for the classification results (see the assessment result in Appendix B). While the overall accuracy is modest, the accuracy of “vegetated area” is relatively high at over 80%. Therefore, this data layer could be considered reliable in general.
Additionally, given that the effectiveness of green space in mitigating coastal hazards increases with its size, further processing was carried out on the data [115]. Green spaces smaller than 0.1 km2 were deemed negligible and subsequently removed from the dataset. Coastal green spaces larger than 0.5 km2 were classified as large green space with a lower rank of exposure, while those smaller than 0.5 km2 were classified as small green spaces with a higher rank of exposure. Table 3 illustrates the final ranks of the natural habitats and their protection distances. The ranking was based on the Natural Capital Project [54].

2.5. Scenario Creation

Since one of the aims of this research was to evaluate the benefits of natural habitats in mitigating vulnerability, this study (in addition to the current situation) assessed the coastal vulnerability for four different simulated scenarios, including (1) “without all natural habitats”, (2) “without salt marshes”, (3) “without large coastal green space”, and (4) “without small coastal green space”. These scenarios were generated by selectively inputting datasets of natural habitats. With the various scenarios, the study could conduct an analysis of how coastal vulnerability changes with variations in natural habitats, thereby acknowledging their significance and enabling the formulation of informed recommendations for coastal planning.

2.6. Data and Result Analysis

According to the rationale of the InVEST model, the EIs are output with values ranging from 1 to 5, with 1 being the least exposed and 5 being the most exposed. Accordingly, this study set four equal intervals, classifying coastal points with EI values between 1.00 and 1.99 into “low vulnerability,” EI values between 2.00 and 2.99 into “medium,” EI values between 3.00 and 3.99 into “high,” and EI values between 4.00 and 5.00 into “very high.”
Indeed, the methods for vulnerability classification are not standardized. For example, in the study of Ai et al. [58], vulnerability was classified into five classes by the natural breakpoint method, while Cabral et al. [116] and Silver et al. [69] used the percentile method to divide it into three or five classes. However, the metric intervals corresponding to each vulnerability level derived from these techniques may be influenced by variations in the overall scope and arrangement of EIs across various circumstances. Conversely, the approach used in this investigation utilizes predetermined intervals. This allows for a more clear and direct assessment of variations in the dispersion of coastal vulnerability across various situations, aiding in comprehending the specific locations and degree to which natural habitats contribute.
As for the analysis of the data and results, it was conducted in two parts. The first part described the results of the coastal vulnerability assessment of all scenarios (i.e., the current situation and the four simulated scenarios). More specifically, this involved describing and comparing the mean EI, and the numbers and proportions of coastal points at different levels. The spatial distribution of coastal vulnerability was also described. This part of the analysis aimed to understand the general distribution of coastal vulnerability in Shanghai, and to evaluate the effectiveness of different natural habitats in improving coastal resilience.
The second part involved the spatial aggregation analysis of costal vulnerability through three methods, including Spatial Autocorrelation Analysis (Global Moran’s I), Hot Spot Analysis (Getis-Ord Gi*), and Cluster and Outliers Analysis (Anselin Local Moran’s I). This part of the analysis was conducted for the current coastal vulnerability (i.e., the current situation) only, with the aim of gaining a better understanding of which areas are currently highly vulnerable and in need of focused attention, in order to provide constructive guidance for the next mitigation measures. This process was carried out in ArcGIS Pro.
Spatial Autocorrelation Analysis reveals the spatial correlation of certain phenomena or attribute values across a whole study area [58]. The analysis result is typically presented by Global Moran’s I, which yields values within a range from −1 to 1 [58]. A positive I value (I > 0) indicates clustering of the objects, with higher I values suggesting a more pronounced positive correlation; conversely, a negative I value (I < 0) indicates dispersion of the objects, and smaller I values imply greater negative correlation; when I = 0, it points to a random spatial distribution of the objects [58,117].
Cluster and Outliers Analysis is a technique used to determine the spatial correlation between a certain region within the studied area and its neighboring areas [118]. An index value is estimated for each feature, representing the similarity between its attribute values and those of neighboring features [117]. The high-value clusters and low-value clusters can be distinguished by this method. Additionally, it has the capability to distinguish between two categories of outliers. H–L outliers refer to features that have a high value but are surrounded by low-value features, whereas L–H outliers refer to features that have a low value but are surrounded by high-value data [117]. The main issue often lies with outliers, necessitating specific recommendations.
Hot Spot Analysis could statistically identify high-vulnerability clusters (i.e., hot spots) and low-vulnerability clusters (i.e., cold spots) in the coastal areas of Shanghai, which would help to prioritize areas for the allocation of conservation and mitigation resources [119,120]. A statistically significant hot spot refers to areas that exhibit high values and are also bordered by other areas with high values. Conversely, cold spots refer to areas that exhibit low values and are surrounded by other areas with low values [117].

3. Results

3.1. Coastal Vulnerability of the Current Situation and Simulated Scenarios

Based on the InVEST model, the Eis of 5608 coastal points along the Shanghai coastline were derived. The coastal vulnerability was categorized into four levels, including “low” (EI: 1.00–1.99), “medium” (EI: 2.00–2.99), “high” (EI: 3.00–3.99), and “very high” (EI: 4.00–5.00). In terms of the current situation, the average EI in Shanghai is 2.69. The “medium vulnerability” has the highest number of shorelines, accounting for 68.62% of the total. This is followed by “high vulnerability” with 19.61%, “low vulnerability” with 8.31%, and “very high vulnerability” with only 3.46%, see Table 4.
Scenario 1 simulated the absence of any natural habitat, which presented the greatest difference in coastal vulnerability from the current situation. Compared to the current situation, the average EI increased to 2.88, and the numbers of “high vulnerability” and “very high vulnerability” shore points increased by 70.27% and 27.32%, respectively. In this scenario, 33.40% of the shore points were at the level of “high vulnerability,” and 4.40% of the shore points were at the level of “very high vulnerability.” Conversely, the percentages of both “medium vulnerability” and “low vulnerability” shore points decreased (compared to the current situation), to 58.42% and 3.87%, respectively.
Comparing the other three scenarios showed that large coastal green spaces and salt marshes had a relatively larger impact on the coastal vulnerability, while small green spaces had a smaller one (see Figure 3). In terms of average EI, those in scenario 3 (without large coastal green spaces) and 2 (without salt marshes) were 2.77 and 2.75, respectively, both of which increased compared to the current situation. However, the average EI of scenario 4 (without small green spaces) remained basically unchanged from the current situation at 2.69. In terms of the distribution of shore points across vulnerability levels, the numbers of “high vulnerability” and “very high vulnerability” shore points in scenario 2 had increases of 12.09% and 19.59%, respectively, when comparing to the current situation, whilst those in scenarios 3 increased by 34.64% and 7.73%, respectively. These numbers directly suggested that the loss of large coastal green spaces and salt marshes would result in more areas being at greater risk. As for scenario 4, there were only very minor or even no changes in the distribution.
Figure 4 presents the spatial distribution of the coastal vulnerability in different scenarios. In the current situation, it was found that the shore points with a “very high vulnerability” were concentrated on the east side of Chongming Island’s north coast. The distribution of “high vulnerability” areas was relatively dispersed, concentrating mainly on the east coast of Chongming Island, the east and northeast coast of Hengsha Island, and the east coast of the mainland. With the absence of all natural habitats, the “very high vulnerability” areas expanded on the east side of Chongming Island’s north coast. Also, certain “medium vulnerability” sites on the east coast of the mainland, the south coast of Hengsha Island, and the northmost shore of Chongming Island were reclassified into “highly vulnerable” zones.
By comparing the differences between Scenarios 2, 3, and 4 and the current situation, it can be seen that salt marshes can effectively reduce the coastal vulnerability along the eastern part of Chongming Island’s north coast, turning a small portion of the shore points with “very high vulnerability” into “high vulnerability” Points. Also, they transformed certain coastline segments on the north coast of the mainland from “high” to “medium.” The presence of large coastal green spaces downgraded certain areas from “high vulnerability” to “medium vulnerability,” and these were mainly on the east coast of the mainland and the south coast of Hengsha Island. Moreover, they protected the coastline of the northern part of Chongming Island and the small island belonging to Chongming Island, making them “low vulnerability”. However, small coastal green spaces did not play a significant role.

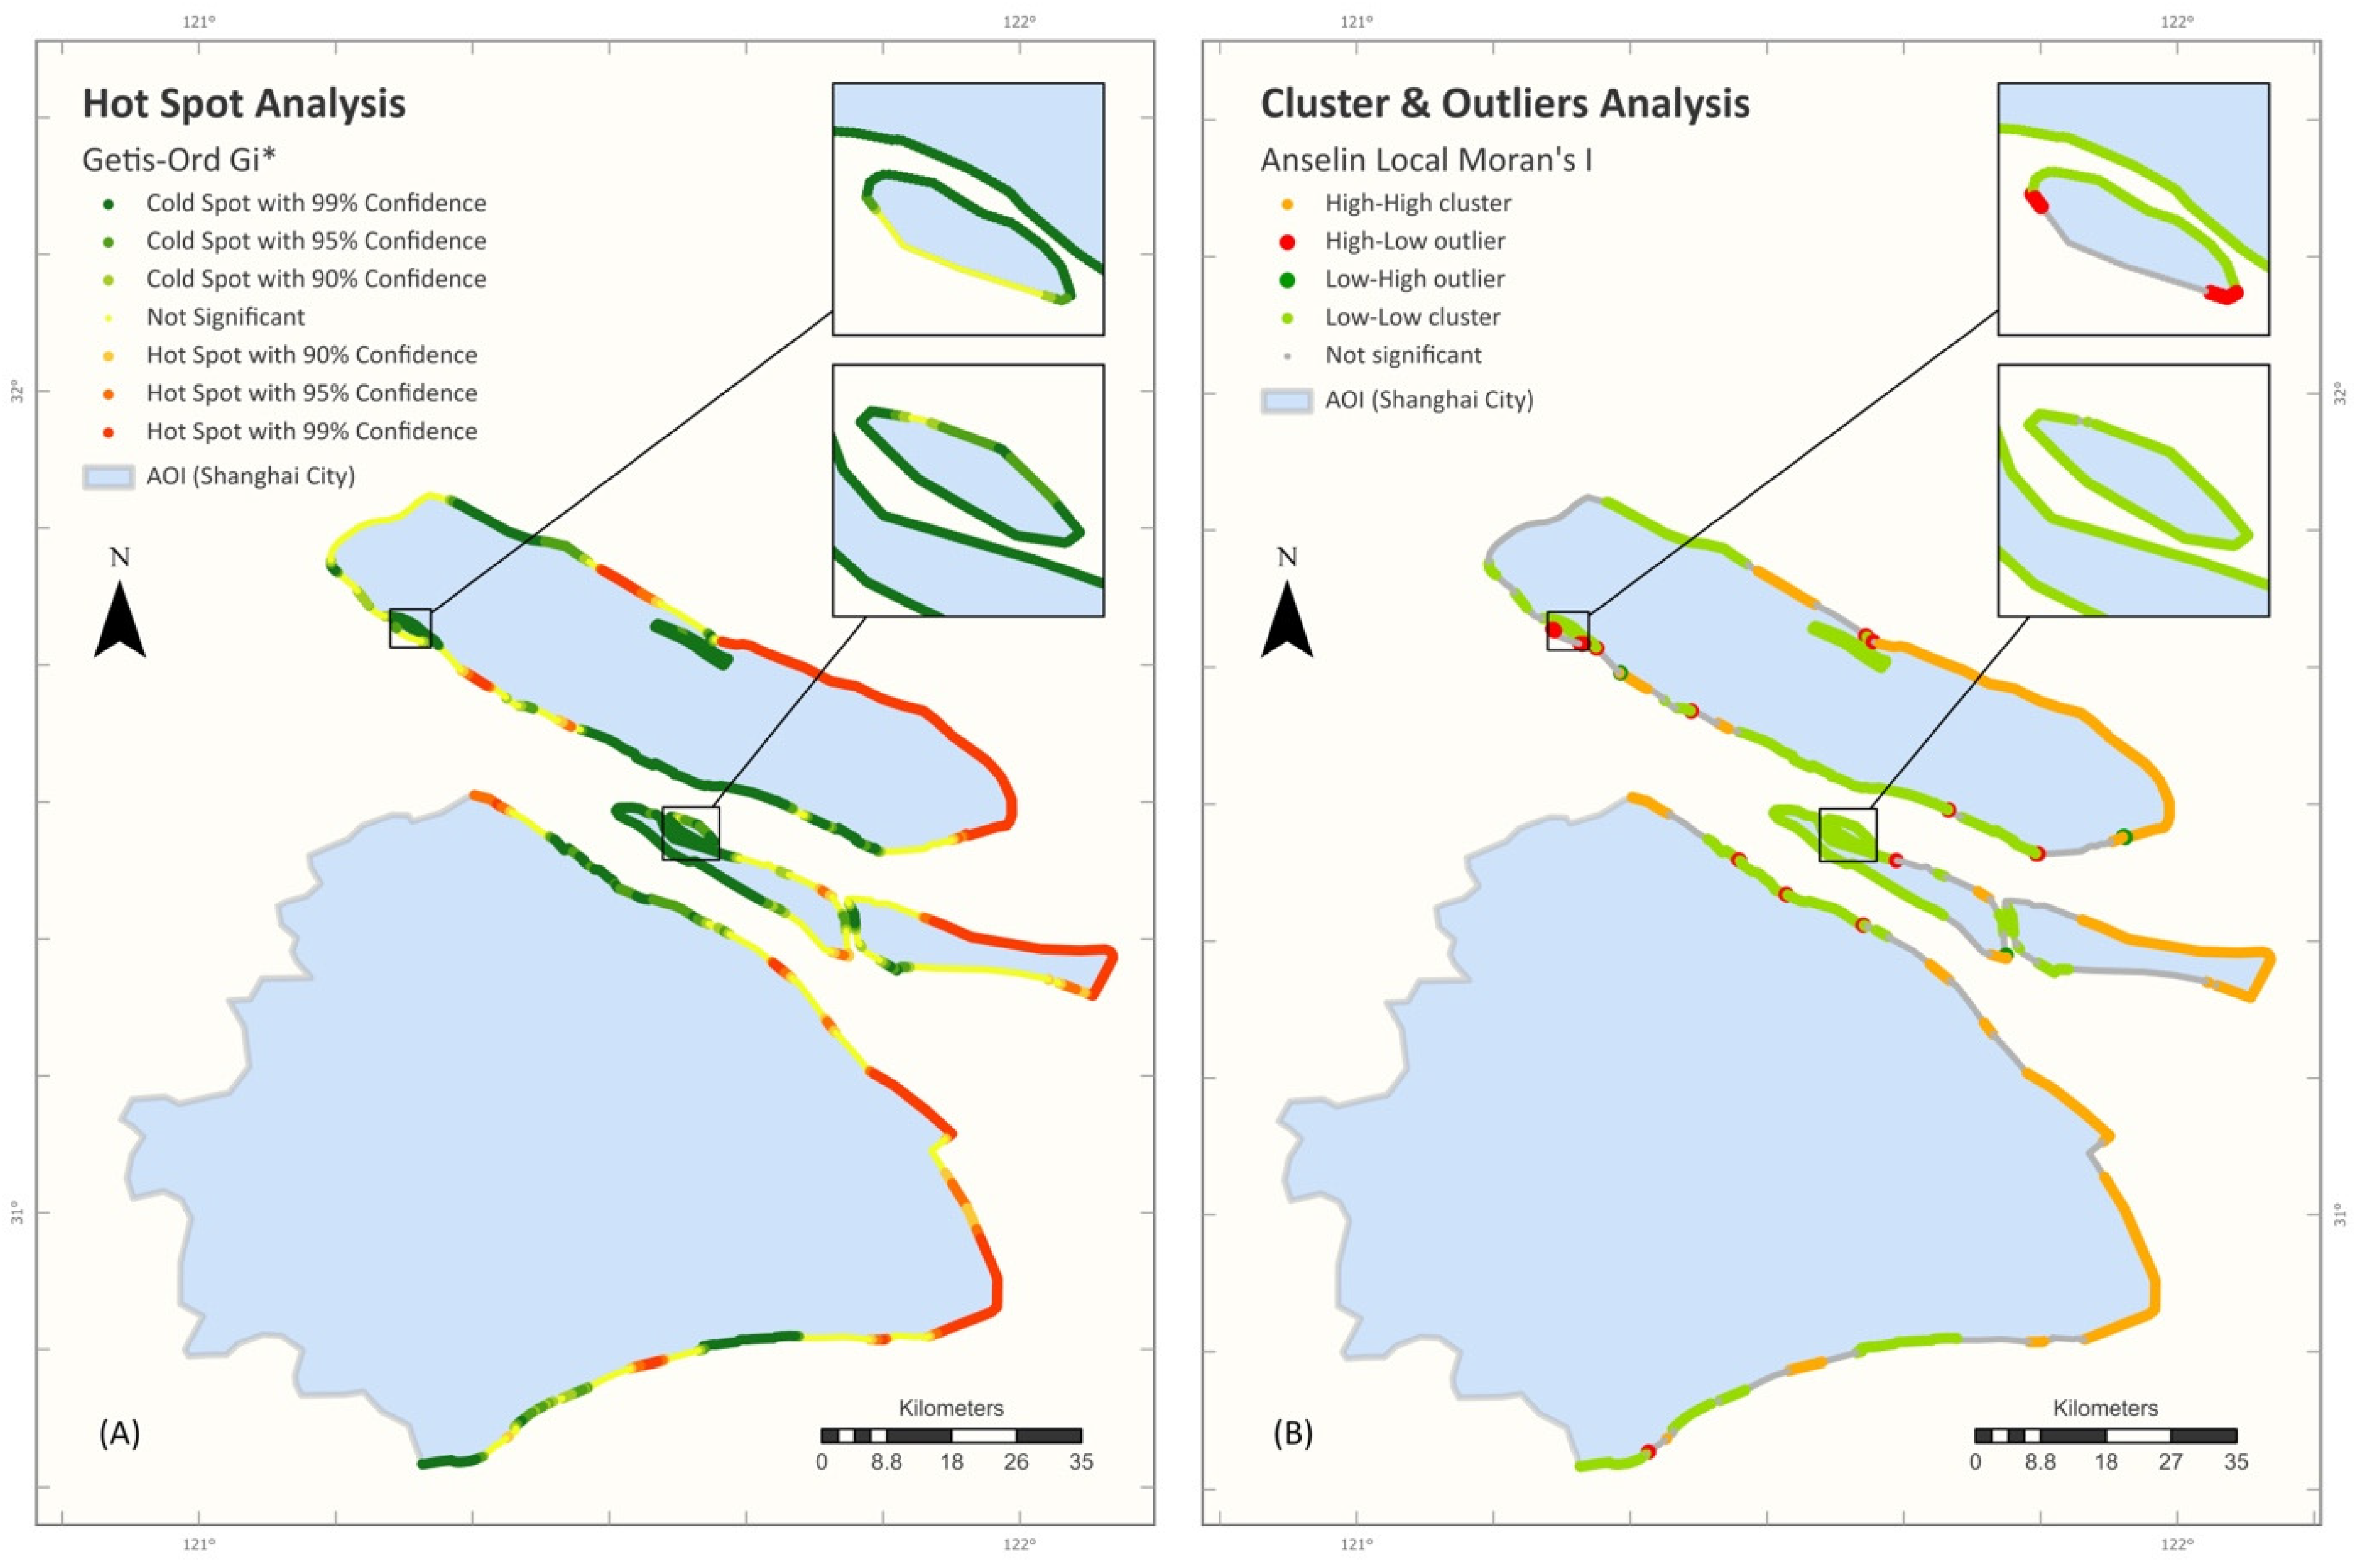
3.2. Spatial Aggregation Analysis of Current Costal Vulnerability

3.2.1. Spatial Autocorrelation Analysis

According to the analysis of spatial autocorrelation, the global Moran’s I of the current situation was 0.959. The value was extremely close to 1, which demonstrated that the coastal vulnerability was significantly spatially autocorrelated. In other words, areas of higher (or lower) vulnerability are always surrounded by areas of higher (or lower) vulnerability.

3.2.2. Cluster and Outliers Analysis

The results of the Cluster and Outliers Analysis indicated the characteristics of local spatial aggregation in the coastal vulnerability (see Table 5). In the current situation, it could be observed that “high-high” and “low-low” clusters were very prominent, while “high-low” and “low-high” outliers were negligibly few. A total of 28.50% of the shore points fell into the “high-high” category and 38.98% of them fell into the “low-low” category. Conversely, only 26 shore points were “high-low” outliers, and 6 shore points were “low-high” outliers.

3.2.3. Hotspot Analysis

The Hotspot analysis identified hot and cold spots of coastal vulnerability at 99%, 95%, and 90% confidence levels. Hotspots with the highest level of confidence typically represent areas where interventions are most needed. The findings indicated that the locations most susceptible to risk (referred to as hotspots with a 99% confidence level) were mostly situated on the eastern shore of Chongming Island, the eastern and northeastern beaches of Hengsha Island, and the eastern coast of the mainland. Meanwhile, a few small coastline segments located along the northernmost coast of the mainland and the north-central part of Chongming Island’s south coast were also significant hot spots. In contrast, the cold spots were more dispersed, and, in theory, these areas could be given a lower priority in implementing coastal protection and adaptation interventions relative to those hot spots.

4. Discussion

4.1. Important Factors for Coastal Vulnerability

Based on the findings of the coastal vulnerability assessment, the northern coast’s eastern side of Chongming Island is identified as the most susceptible location in Shanghai, exhibiting the greatest level of EI values, as shown in Figure 5. Moreover, by analyzing the spatial aggregation characteristics, it can be concluded that the east coast of Chongming Island, the east coast of the mainland, and the east and northeast coasts of Hengsha Island are the primary hotspots with higher coastal vulnerability, where interventions need to be developed on a priority basis. An important reason for the high vulnerability of these areas is that they are located at the eastern edge of the landmass, closest to the East China Sea, and are not surrounded by any shelter, such as islands. As a result, they are exposed to higher wind and wave energies than other areas and face a trend of higher sea level rise. As for the east side of Chongming Island’s north coast, its geomorphic characteristics are an additional factor contributing to its high vulnerability. Unlike the majority of the coastal regions in Shanghai, which use rigid buildings as a protective barrier against coastal threats, this location stands out as distinct. This property is situated on a low-lying mudflat, rendering it very susceptible to coastal hazards. However, natural habitats are not a significant contributor to the high vulnerability of these areas, as parts of the shoreline, even when protected by them, still remain highly vulnerable.
Local features result in differences in vulnerability within Shanghai. Moreover, a few holistic geophysical features also play an important role in contributing to coastal vulnerability across the city. Due to its location in an estuarine delta where the land is formed by the deposition of silt and mud, the natural geomorphic features of Shanghai are mainly those that are highly exposed to coastal erosion and inundation, such as mudflats and estuaries. Shanghai’s biological and environmental dynamics depend on its estuaries, notably the Yangtze. One of the world’s greatest alluvial estuaries, the Yangtze, borders China’s most developed economic zone [121]. Many cities, like Shanghai, depend on estuaries, which are dynamic ecosystems affected by natural and human influences [122]. Therefore, even though much of the coastline of Shanghai is protected by coastal defense structures, many areas are at great risk of disasters when these structures fail to withstand hazards. In the existing defense system of Shanghai, only 23% of the coastal seawalls can withstand 200-year storm surges and strong typhoons of magnitude 12, and only 58% of the levees along the Huangpu River can withstand 1000-year storm surges [18]. According to Wang et al. [104], under the combined effects of multiple coastal hazards, 4.31% of the total length of the seawalls and levees in Shanghai would be at risk of overtopping by 2030, and the overtopping rate would further increase to 27.55% and 45.98% by 2050 and 2100, respectively.
Furthermore, Shanghai is confronted with a significant issue of rising sea levels and land subsidence. Shanghai has had a consistent increase in its absolute sea level over the last three decades, with an average annual rise of 3.8 mm. This rate of increase surpasses both the world and national norms [123]. It is projected that, by 2050, the sea level in the city will rise by 75–155 mm compared to 2018 [124]. Moreover, since the early 20th century, this city has experienced large-scale land subsidence mainly due to anthropogenic activities including extensive groundwater extraction and construction [18,125]. During the period of 1995–2001, the land subsidence rate in the urban area was about 25–60 mm/year [18]. Currently, land subsidence is a primary driver of the relative sea level changes in Shanghai. This will lead to an increased likelihood of the inundation and deformation of defense structures, ultimately causing coastal areas to be at higher risk levels [126]. In response to this issue, the municipal government launched a comprehensive plan to control land subsidence in 2016, with specific measures that include the delineation of control zones, the establishment of a sound monitoring system, the control of groundwater extraction projects, and the recharge of groundwater. These measures have proven to be effective in slowing down the rate of subsidence, and should be further advanced in the future [125].

4.2. Intervention Suggestions

4.2.1. Maintenance and Development of Natural Habitats

Multiple studies have shown that natural habitats have the capacity to enhance coastal resilience in a very cost-effective manner [60,61,62,63,64,65,66,67,68,69,70,71,72]. Therefore, the preservation of existing habitats and the development of future habitats is a sound option for reducing coastal vulnerability, which should be incorporated into coastal management and development plans and strategies.
In this study, existing natural habitats, especially salt marshes and large coastal green spaces, have shown their value in protecting the coasts of Shanghai. Specifically, salt marshes and large coastal green spaces have effectively reduced the vulnerability of the coasts in the northeast of Chongming Island, the east of the mainland, and the south of Hengsha Island. These natural ecosystems not only safeguard the shoreline but also provide other ecological roles and services, including carbon storage and sequestration, biodiversity enhancement, and recreation. For example, Chongming Dongtan Wetland provides habitats and resources for diverse bird species; Paotaiwan Wetland Forest Park and Binjiang Forest Park, which are on the north coast of the mainland, provide recreational and educational opportunities for local residents [127]. However, a large number of habitats are currently under great stress of loss and degradation due to both natural and anthropogenic factors, including extensive reclamation, pollution, species invasion, coastal erosion, and sea level rise [128,129]. For these reasons, relevant regulations should be formulated to strictly control reclamation projects and waste discharge. Also, the government should invest financial funds and human resources to strengthen ecological restoration and monitoring, allowing natural habitats to perform their roles to the fullest [130].
In addition, developing new natural habitats is also critical, especially in areas that are highly vulnerable or lacking in habitats. For example, on the east coast of the mainland, where property and infrastructure are concentrated, coastal shelterbelt forests can be planted which can serve as an important barrier to reduce the risk of economic loss. It is crucial to emphasize that, when establishing forest belts, a comprehensive investigation of the local terrain, soil, and vegetation should be conducted. This will help in selecting the most suitable species, as this often results in the greatest benefits. Unsuitable tree species are likely to fail to establish strong root systems and, consequently, cannot withstand strong storms [131]. However, it is a different case for the northeastern and eastern parts of Chongming Island as well as the eastern part of Hengsha Island, where agriculture is the predominant type of land use, and where some of the agricultural land that has less economical value can be restored to wetlands covered by native vegetation, thereby establishing highly adaptive and resilient coastal ecosystems [18,132,133]. Also, certain types of natural habitats, like marshes, dunes, and oyster reefs, can be created as extensions of existing habitats or outside of seawalls. Therefore, the development of natural habitats needs to take into account a combination of natural and socio-economic conditions, such as land requirements, technical support, cost-effectiveness, and sustainability.

4.2.2. Improvement of Coastal Defense Structures

Relying exclusively on natural habitats to protect the coast in urban areas is not practical, since the desired results in coastal protection can usually only be achieved when natural habitats are sufficiently large and healthy [134,135]. Hard coastal defense structures that have the advantages of high efficiency and space savings are necessary for coastal urban areas [65,136]. The existing seawall and levee systems in Shanghai must be regularly maintained to prevent them from failing due to aging or damage and reinforced where necessary to enable them to cope with the escalating coastal hazards brought about by climate change. Areas with high population and property densities should be prioritized in the development of hard defense structures. For instance, the most densely populated and developed area of Shanghai is in the northern part of the mainland near the estuary. The same is true for the east coast of the mainland, where important infrastructure like international airports is located. These are both places where it might be necessary to strengthen hard defense structures.
In addition, traditional hard structures can be improved by incorporating ecological elements, structures, and processes to achieve better coastal hazard mitigation. Various methods and techniques have been applied around the world, ranging from the micro-scale incorporation of barnacles into construction materials to the macro-scale integration of ecosystems into foreshores [137,138,139]. The Howard Beach Coastal Defence Project in New York is a comprehensive case study that can serve as a reference, which combines a variety of approaches, including restoring marsh habitats, creating mussel beds along the shoreline, and building raised berms, rock groins, flood gates, and seawalls [140]. In addition, an approach that can be applied to the coasts of Shanghai is to combine traditional seawalls with vegetated foreshores and submerged breakwaters (see Figure 6) [136]. Breakwaters can attenuate nearshore waves and capture sediments; vegetated foreshores can reduce wave energy and stabilize salt marshes; and seawalls can protect against extreme tidal levels and prevent wave overtopping. The functions of these three components are interdependent and synergistic, resulting in a more robust and resilient coastline.

4.3. Limitations and Further Research

The InVEST Coastal Vulnerability Model used in this study has the limitation of being oversimplified, as we simplified the calculation of the EI to a geometric mean of seven variables [54]. It does not take into account or model some complex geophysical features and processes, such as storm surges and wave fields in nearshore areas, hydrodynamic or sediment transport processes, and interactions between different variables [54].
In addition, a major limitation of this project was the lack of richness and detail of natural habitat data. The UNEP-WCMC Ocean Data Viewer provided data on salt marshes, but no other types of natural habitats were available in the study area. Meanwhile, no other reliable data sources on natural habitats in Shanghai were found. Therefore, this study used supervised classification in ArcGIS Pro to create a data layer for the coastal green space. However, this data layer included all the land covered by vegetation, and did not have a further classification of green spaces such as farmland and wetlands. This may lead to certain inaccuracies in the results of coastal vulnerability assessment, as well as an inability to recognize the roles of different types of coastal green spaces on coastal vulnerability. Several relevant studies used field surveys as a complementary method to collect and refine natural habitat data [58,141]. However, due to time and location constraints, it was less feasible to obtain data through this method in this study. Future research on the coastal vulnerability of Shanghai could adopt this method to fill the data gaps and, thus, improve the accuracy and reliability of the assessment results [142,143].
Another limitation of this project is that the assessment only considered geophysical variables. Since Shanghai is a highly populated and economically developed city, socio-economic factors, such as demographics and infrastructure, can have a significant impact on coastal vulnerability. Therefore, further research should consider both geophysical and socio-economic factors, and calculate three subindices, including exposure, sensitivity, and adaptive capacity, based on the conceptual model of vulnerability, and, finally, synthesize the result of coastal vulnerability. Such a comprehensive assessment could provide more scientifically sound information for resource allocation and intervention implementation in the coastal area [144,145,146]. This would further contribute to enhancing resilience and sustainability in the area, shedding light on the social, economic, and ecological aspects that strengthen resilience against coastal hazards.
Additionally, this project compared and evaluated the roles of different habitats in the coastal vulnerability of Shanghai. However, it is worth noting that this evaluation is not a quantification of their effectiveness, but rather an examination of their relative contributions. Therefore, more comprehensive empirical research is required in order to fully comprehend the quantitative advantages of minimizing the effects of coastal risks.

5. Conclusions

Based on the InVEST Coastal Vulnerability Model, this study assessed the vulnerability of the shoreline of Shanghai under current situations as well as simulated scenarios without different natural habitats. In addition, it conducted further spatial aggregation analysis of the current coastal vulnerability.
This study concluded that the existing natural habitats in Shanghai play a role in reducing coastal vulnerability, with salt marshes and large coastal green spaces being more significant. Also, this study identified that the east coast of the mainland of Shanghai, the east coast of Chongming Island, and the east and northeast coasts of Hengsha Island are hotspots of coastal vulnerability, which need to be prioritized for interventions to enhance coastal resilience. These findings will be useful in decision-making toward sustainable policies and plans for Shanghai. Given the results of this study, the government and relevant stakeholders should enhance the protection and development of natural habitats to maximize their benefits for coastal protection. The key measures are to strictly control development projects that damage natural habitats and to actively implement ecological restoration work. Also, it is necessary to improve defense structures in critical areas. Innovative defense structures that combine ecological elements and engineering techniques should be considered for wide application.
This is the first study that applies the InVEST Coastal Vulnerability Model to Shanghai. It demonstrated the potential of the model to be widely applicable, and more importantly, provided valuable information for future coastal protection and sustainable development in Shanghai. However, there were some limitations, such as the oversimplification of the model and the lack of natural habitat data, which slightly affected the results of the study. Further research could be conducted to enhance the aforementioned elements, thereby facilitating a more comprehensive evaluation of the city’s susceptibility to coastal hazards.

Author Contributions

Conceptualization, Z.L. and M.S.; Data curation, Z.L.; Formal analysis, Z.L.; Investigation, Z.L.; Methodology, M.S. and Z.L.; Project administration, M.S.; Resources, M.S.; Supervision, M.S.; Writing—original draft, Z.L.; Writing—review and editing, M.S. and Z.L. All authors have read and agreed to the published version of the manuscript.

Funding

This research received no external funding.

Institutional Review Board Statement

Not applicable.

Informed Consent Statement

Not applicable.

Data Availability Statement

All data utilized in this study is freely accessible in https://drive.google.com/drive/folders/1DK13XKN6ODCldwGcS9js4XI2ZqbrA9_G, accessed on 5 December 2023.

Acknowledgments

The authors are grateful for the support of the Center for Environmental Policy at Imperial College London.

Conflicts of Interest

The author declares no conflicts of interest.

Appendix A

Table A1. Confusion matrix showcasing the results of accuracy assessment of the supervised classification.
Rank 1
(Very Low Exposure)
Rank 2
(Low Exposure)
Rank 3
(Medium Exposure)
Rank 4
(High Exposure)
Rank 5
(Very High Exposure)
Relief81 to 100 Percentile61 to 80 Percentile41 to 60 Percentile21 to 40 Percentile0 to 20 Percentile
Natural HabitatsCoral reef; mangrove; coastal forestHigh dune; marshLow duneSeagrass; kelpNo habitat
GeomorphologyRocky; high cliffs; fjord; fiard; seawallsMedium cliff; indented coast; bulkheads and small seawallsLow cliff; glacial drift; alluvial plain; revetments; rip-rap wallsCobble beach; estuary; lagoon; bluffBarrier beach; sand beach; mud flat; delta
Wind Exposure0 to 20 Percentile21 to 40 Percentile41 to 60 Percentile61 to 80 Percentile81 to 100 Percentile
Wave Exposure
Surge Potential

Appendix B

Table A2. Confusion Matrix showcasing the results of accuracy assessment of the supervised classification.
WaterDeveloped AreaVegetated AreaBare LandTotalUser’s AccuracyKappa
Water46013500.92
Developed Area331214500.62
Vegetated Area02426500.84
Bare Land69233500.66
Total55424756200
Producer’s Accuracy0.8363640.7380950.8936170.589286 0.76
Kappa 0.68

References

  1. Mukhopadhyay, A.; Dasgupta, R.; Hazra, S.; Mitra, D. Coastal hazards and vulnerability: A review. Int. J. Geol. Earth Environ. Sci. 2012, 2, 57–69. [Google Scholar]
  2. Telford, J.; Cosgrave, J. Joint Evaluation of the International Response to the Indian Ocean Tsunami: Synthesis Report; Tsunami Evaluation Coalition: London, UK, 2006. [Google Scholar]
  3. Villholth, K.G.; Neupane, B. Tsunamis as long-term hazards to coastal groundwater resources and associated water supplies. In Tsunami: A Growing Disaster; Mokhtari, M., Ed.; InTechOpen: Rijeka, Croatia, 2011; pp. 87–104. [Google Scholar]
  4. Lau, Y.Y.; Yip, T.L.; Dulebenets, M.A.; Tang, Y.M.; Kawasaki, T. A review of historical changes of tropical and extra-tropical cyclones: A comparative analysis of the United States, Europe, and Asia. Int. J. Environ. Res. Public Health 2022, 19, 4499. [Google Scholar] [CrossRef] [PubMed]
  5. Shuckburgh, E.; Mitchell, D.M.; Stott, P. Hurricanes Harvey, Irma and Maria: How natural were these ‘natural disasters’? Weather 2017, 17, 353–354. [Google Scholar] [CrossRef]
  6. Hansen, J.; Sato, M.; Hearty, P.; Ruedy, R.; Kelley, M.; Masson-Delmotte, V.; Russell, G.; Tselioudis, G.; Cao, J.; Rignot, E.; et al. Ice melt, sea level rise and superstorms: Evidence from paleoclimate data, climate modeling, and modern observations that 2 °C global warming could be dangerous. Atmos. Chem. Phys. 2016, 16, 3761–3812. [Google Scholar] [CrossRef]
  7. Climate Change: Global Sea Level. Available online: https://www.climate.gov/news-features/understanding-climate/climate-change-global-sea-level (accessed on 1 September 2023).
  8. Zhang, K.; Douglas, B.C.; Leatherman, S.P. Global warming and coastal erosion. Clim. Change 2004, 64, 41–58. [Google Scholar] [CrossRef]
  9. Gutierrez, B.T.; Plant, N.G.; Thieler, E.R. A Bayesian network to predict coastal vulnerability to sea level rise. J. Geophys. Res. 2011, 116. [Google Scholar] [CrossRef]
  10. Yates, M.L.; Le Cozannet, G.; Garcin, M.; Salaï, E.; Walker, P. Multidecadal atoll shoreline change on Manihi and Manuae, French Polynesia. J. Coast. Res. 2013, 29, 870–882. [Google Scholar] [CrossRef]
  11. Shearman, P.; Bryan, J.; Walsh, J.P. Trends in deltaic change over three decades in the Asia-Pacific region. J. Coast. Res. 2013, 29, 1169–1183. [Google Scholar] [CrossRef]
  12. Wahl, T.; Jain, S.; Bender, J.; Meyers, S.D.; Luther, M.E. Increasing risk of compound flooding from storm surge and rainfall for major US cities. Nat. Clim. Change 2015, 5, 1093–1097. [Google Scholar] [CrossRef]
  13. Bevacqua, E.; Maraun, D.; Vousdoukas, M.I.; Voukouvalas, E.; Vrac, M.; Mentaschi, L.; Widmann, M. Higher probability of compound flooding from precipitation and storm surge in Europe under anthropogenic climate change. Sci. Adv. 2019, 5, e5531. [Google Scholar] [CrossRef]
  14. Reimann, L.; Vafeidis, A.; Honsel, L. Population development as a driver of coastal risk: Current trends and future pathways. Camb. Prism. Coast. Futures 2023, 1, E14. [Google Scholar] [CrossRef]
  15. Hallegatte, S.; Green, C.; Nicholls, R.J.; Corfee-Morlot, J. Future flood losses in major coastal cities. Nat. Clim. Chang. 2013, 3, 802–806. [Google Scholar] [CrossRef]
  16. Yin, J.; Lin, N.; Yang, Y.; Pringle, W.J.; Tan, J.; Westerink, J.J.; Yu, D. Hazard assessment for typhoon-induced coastal flooding and inundation in Shanghai, China. J. Geophys. Res. Oceans 2021, 126, e2021JC017319. [Google Scholar] [CrossRef]
  17. Yan, B.; Li, S.; Wang, J.; Ge, Z.; Zhang, L. Socio-economic vulnerability of the megacity of Shanghai (China) to sea-level rise and associated storm surges. Reg. Environ. Change 2016, 16, 1443–1456. [Google Scholar] [CrossRef]
  18. Wang, J.; Gao, W.; Xu, S.; Yu, L. Evaluation of the combined risk of sea level rise, land subsidence, and storm surges on the coastal areas of Shanghai, China. Clim. Change 2012, 115, 537–558. [Google Scholar] [CrossRef]
  19. Füssel, H.M. Vulnerability: A generally applicable conceptual framework for climate change research. Glob. Environ. Change 2007, 17, 155–167. [Google Scholar] [CrossRef]
  20. Koroglu, A.; Ranasinghe, R.; Jiménez, J.A.; Dastgheib, A. Comparison of coastal vulnerability index applications for Barcelona Province. J. Ocean. Coast. Manag. 2019, 178, 104799. [Google Scholar] [CrossRef]
  21. Blaikie, P.; Cannon, T.; Davis, I.; Wisner, B. At Risk: Natural Hazards, People’s Vulnerability and Disasters; Routledge: London, UK, 2014. [Google Scholar]
  22. Climate Change Vulnerability Mapping for Southeast Asia. Available online: https://www.semanticscholar.org/paper/Climate-change-vulnerability-mapping-for-Southeast-Yusuf-Francisco/2f440f99e43ef8421cb32e8da4dc7e2cc36e341c (accessed on 2 August 2023).
  23. Eriyagama, N.; Smakhtin, V.; Chandrapala, L.; Fernando, K. Impacts of climate change on water resources and agriculture in Sri Lanka: A review and preliminary vulnerability mapping. IWMI Res. Rep. 2010, 135. [Google Scholar]
  24. Webersik, C.; Esteban, M.; Shibayama, T. The economic impact of future increase in tropical cyclones in Japan. Nat. Hazards 2010, 55, 233–250. [Google Scholar] [CrossRef]
  25. Yoo, G.; Kim, A.R.; Hadi, S. A methodology to assess environmental vulnerability in a coastal city: Application to Jakarta, Indonesia. J. Ocean. Coast. Manag. 2014, 102, 169–177. [Google Scholar] [CrossRef]
  26. Jiang, L.; Huang, X.; Wang, F.; Liu, Y.; An, P. Method for evaluating ecological vulnerability under climate change based on remote sensing: A case study. Ecol. Indic. 2018, 85, 479–486. [Google Scholar] [CrossRef]
  27. Zhang, Y.; Wu, T.; Arkema, K.K.; Han, B.; Lu, F.; Ruckelshaus, M.; Ouyang, Z. Coastal vulnerability to climate change in China’s Bohai Economic Rim. Environ. Int. 2021, 147, 106359. [Google Scholar] [CrossRef]
  28. IPCC. Climate Change 2007: Impacts, Adaptation and Vulnerability: Contribution of Working Group II to the Fourth Assessment Report of the Intergovernmental Panel on Climate Change; Cambridge University Press: Cambridge, UK, 2007. [Google Scholar]
  29. Bukvic, A.; Rohat, G.; Apotsos, A.; de Sherbinin, A. A systematic review of coastal vulnerability mapping. Sustainability 2020, 12, 2822. [Google Scholar] [CrossRef]
  30. Debortoli, N.S.; Clark, D.G.; Ford, J.D.; Sayles, J.S.; Diaconescu, E.P. An integrative climate change vulnerability index for Arctic aviation and marine transportation. Nat. Commun. 2019, 10, 2596. [Google Scholar] [CrossRef] [PubMed]
  31. Nguyen, T.T.; Bonetti, J.; Rogers, K.; Woodroffe, C.D. Indicator-based assessment of climate-change impacts on coasts: A review of concepts, methodological approaches and vulnerability indices. J. Ocean. Coast. Manag. 2016, 123, 18–43. [Google Scholar] [CrossRef]
  32. Balica, S.F.; Wright, N.G.; Van der Meulen, F. A flood vulnerability index for coastal cities and its use in assessing climate change impacts. Nat. Hazrds 2012, 64, 73–105. [Google Scholar] [CrossRef]
  33. Baker, S.M. Vulnerability and resilience in natural disasters: A marketing and public policy perspective. J Public Policy Mark. 2009, 28, 114–123. [Google Scholar] [CrossRef]
  34. Sudha Rani, N.N.V.; Satyanarayana, A.N.V.; Bhaskaran, P.K. Coastal vulnerability assessment studies over India: A review. Nat. Hazards 2015, 77, 405–428. [Google Scholar] [CrossRef]
  35. Malone, E.L.; Engle, N.L. Evaluating regional vulnerability to climate change: Purposes and methods. Wiley Interdiscip. Rev. Clim. Change 2011, 2, 462–474. [Google Scholar] [CrossRef]
  36. McIntosh, R.D.; Becker, A. Expert evaluation of open-data indicators of seaport vulnerability to climate and extreme weather impacts for US North Atlantic ports. J. Ocean. Coast. Manag. 2019, 180, 104911. [Google Scholar] [CrossRef]
  37. Biswas, S. A review of socio-economic vulnerability: The emergence of its theoretical concepts, models and methodologies. Nat. Hazards 2023, in press. [Google Scholar] [CrossRef]
  38. Gornitz, V. Vulnerability of the East Coast, USA to future sea level rise. J. Coast. Res. 1990, 9, 201–237. [Google Scholar]
  39. Gornitz, V.M.; Daniels, R.C.; White, T.W.; Birdwell, K.R. The development of a coastal risk assessment database: Vulnerability to sea-level rise in the US Southeast. J. Coast. Res. 1994, 4, 327–338. [Google Scholar]
  40. Abuodha, P.; Woodroffe, C.D. Assessing vulnerability of coasts to climate change: A review of approaches and their application to the Australian coast. In GIS for the Coastal Zone: A Selection of Papers from CoastGIS 2006; Woodroffe, C.D., Bruce, E., Puotinen, M., Furness, R.A., Eds.; Australian National Centre for Ocean Resources and Security University of Wollongong: Wollongong, Australia, 2007; p. 458. [Google Scholar]
  41. Kumar, A.A.; Kunte, P.D. Coastal vulnerability assessment for Chennai, east coast of India using geospatial techniques. Nat. Hazards 2012, 64, 853–872. [Google Scholar] [CrossRef]
  42. Islam, M.A.; Mitra, D.; Dewan, A.; Akhter, S.H. Coastal multi-hazard vulnerability assessment along the Ganges deltaic coast of Bangladesh: A geospatial approach. J. Ocean. Coast. Manag. 2016, 127, 1–15. [Google Scholar] [CrossRef]
  43. Cutter, S.L. The vulnerability of science and the science of vulnerability. Ann. Am. Assoc. Geogr. 2003, 93, 1–12. [Google Scholar] [CrossRef]
  44. Roukounis, C.N.; Tsihrintzis, V.A. Indices of coastal vulnerability to climate change: A review. Environ. Process. 2022, 9, 29. [Google Scholar] [CrossRef]
  45. Hahn, M.B.; Riederer, A.M.; Foster, S.O. The livelihood vulnerability index: A pragmatic approach to assessing risks from climate variability and change: A case study in Mozambique. Glob. Environ. Change 2009, 19, 74–88. [Google Scholar] [CrossRef]
  46. Onat, Y.; Marchant, M.; Francis, O.P.; Kim, K. Coastal exposure of the Hawaiian Islands using GIS-based index modeling. J. Ocean. Coast. Manag. 2018, 163, 113–129. [Google Scholar] [CrossRef]
  47. Szlafsztein, C.; Sterr, H. A GIS-based vulnerability assessment of coastal natural hazards, State of Pará, Brazil. J. Coast. Conserv. 2007, 11, 53–66. [Google Scholar] [CrossRef]
  48. Murali, R.M.; Ankita, M.; Amrita, S.; Vethamony, P. Coastal vulnerability assessment of Puducherry coast, India, using the analytical hierarchical process. Nat. Hazards Earth Syst. Sci. 2013, 13, 3291–3311. [Google Scholar] [CrossRef]
  49. Krishnan, P.; Ananthan, P.S.; Purvaja, R.; Jeevamani, J.J.J.; Infantina, A.J.; Rao, S.C.; Anand, A.; Mahendra, R.S.; Sekar, I.; Kareemulla, K.; et al. Framework for mapping the drivers of coastal vulnerability and spatial decision making for climate-change adaptation: A case study from Maharashtra, India. Ambio 2019, 48, 192–212. [Google Scholar] [CrossRef] [PubMed]
  50. Furlan, E.; Dalla Pozza, P.; Michetti, M.; Torresan, S.; Critto, A.; Marcomini, A. Development of a multi-dimensional coastal vulnerability index: Assessing vulnerability to inundation scenarios in the Italian coast. Sci. Total Environ. 2021, 772, 144650. [Google Scholar] [CrossRef] [PubMed]
  51. Mclaughlin, S.; Cooper, J.A.G. A multi-scale coastal vulnerability index: A tool for coastal managers? Environ. Hazards 2010, 9, 233–248. [Google Scholar] [CrossRef]
  52. Weis, S.W.M.; Agostini, V.N.; Roth, L.M.; Gilmer, B.; Schill, S.R.; Knowles, J.E.; Blyther, R. Assessing vulnerability: An integrated approach for mapping adaptive capacity, sensitivity, and exposure. Clim. Change 2016, 136, 615–629. [Google Scholar] [CrossRef]
  53. Arkema, K.K.; Guannel, G.; Verutes, G.; Wood, S.A.; Guerry, A.; Ruckelshaus, M.; Kareiva, P.; Lacayo, M.; Silver, J.M. Coastal habitats shield people and property from sea-level rise and storms. Nat. Clim. Chang. 2013, 3, 913–918. [Google Scholar] [CrossRef]
  54. InVEST User’s Guide: Coastal Vulnerability Model. Available online: http://releases.naturalcapitalproject.org/invest-userguide/latest/en/coastal_vulnerability.html# (accessed on 15 June 2023).
  55. Hopper, T.; Meixler, M.S. Modeling coastal vulnerability through space and time. PLoS ONE 2016, 11, e0163495. [Google Scholar] [CrossRef]
  56. Ruckelshaus, M.H.; Guannel, G.; Arkema, K.; Verutes, G.; Griffin, R.; Guerry, A.; Silver, J.; Faries, J.; Brenner, J.; Rosenthal, A. Evaluating the benefits of green infrastructure for coastal areas: Location, location, location. Coast. Manag. 2016, 44, 504–516. [Google Scholar] [CrossRef]
  57. Ballesteros, C.; Esteves, L.S. Integrated assessment of coastal exposure and social vulnerability to coastal hazards in East Africa. Estuar. Coast. 2021, 44, 2056–2072. [Google Scholar] [CrossRef]
  58. Ai, B.; Tian, Y.; Wang, P.; Gan, Y.; Luo, F.; Shi, Q. Vulnerability analysis of coastal zone based on InVEST model in Jiaozhou Bay, China. Sustain. Sci. 2022, 14, 6913. [Google Scholar] [CrossRef]
  59. Re, A.; Minola, L.; Pezzoli, A. Climate scenarios for coastal flood vulnerability assessments: A case study for the Ligurian Coastal Region. Climate 2023, 11, 56. [Google Scholar] [CrossRef]
  60. Spalding, M.D.; Ruffo, S.; Lacambra, C.; Meliane, I.; Hale, L.Z.; Shepard, C.C.; Beck, M.W. The role of ecosystems in coastal protection: Adapting to climate change and coastal hazards. Ocean Coas. Manag. 2014, 90, 50–57. [Google Scholar] [CrossRef]
  61. COP27 Presidency Launches Adaptation Agenda to Build Climate Resilience for 4 Billion by 2030. Available online: https://climatechampions.unfccc.int/cop27-presidency-announces-ambitous-climate-resilience-agenda/ (accessed on 28 August 2023).
  62. Schoonees, T.; Gijón Mancheño, A.; Scheres, B.; Bouma, T.J.; Silva, R.; Schlurmann, T.; Schüttrumpf, H. Hard structures for coastal protection, towards greener designs. Estuar. Coast. 2019, 42, 1709–1729. [Google Scholar] [CrossRef]
  63. Mamo, L.T.; Dwyer, P.G.; Coleman, M.A.; Dengate, C.; Kelaher, B.P. Beyond coastal protection: A robust approach to enhance environmental and social outcomes of coastal adaptation. J. Ocean. Coast. Manag. 2022, 217, 106007. [Google Scholar] [CrossRef]
  64. Temmerman, S.; Meire, P.; Bouma, T.J.; Herman, P.M.; Ysebaert, T.; De Vriend, H.J. Ecosystem-based coastal defence in the face of global change. Nature 2013, 504, 79–83. [Google Scholar] [CrossRef] [PubMed]
  65. Waryszak, P.; Gavoille, A.; Whitt, A.A.; Kelvin, J.; Macreadie, P.I. Combining gray and green infrastructure to improve coastal resilience: Lessons learnt from hybrid flood defenses. Coast. Eng. 2021, 63, 335–350. [Google Scholar] [CrossRef]
  66. Yang, X.; Hu, X.; Li, Z. The conditional risk probability-based seawall height design method. Int. J. Nav. Archit. Ocean Eng. 2015, 7, 1007–1019. [Google Scholar] [CrossRef]
  67. Brown, S.; Barton, M.; Nicholls, R. Coastal retreat and/or advance adjacent to defences in England and Wales. J. Coast. Conserv. 2011, 15, 659–670. [Google Scholar] [CrossRef]
  68. Stancheva, M.; Rangel-Buitrago, N.; Anfuso, G.; Palazov, A.; Stanchev, H.; Correa, I. Expanding level of coastal armouring: Case studies from different countries. J. Coast. Res. 2011, 64, 1815–1819. [Google Scholar]
  69. Silver, J.M.; Arkema, K.K.; Griffin, R.M.; Lashley, B.; Lemay, M.; Maldonado, S.; Moultrie, S.H.; Ruckelshaus, M.; Schill, S.; Thomas, A.; et al. Advancing coastal risk reduction science and implementation by accounting for climate, ecosystems, and people. Front. Mar. Sci. 2019, 6, 556. [Google Scholar] [CrossRef]
  70. Narayan, S.; Beck, M.W.; Reguero, B.G.; Losada, I.J.; Van Wesenbeeck, B.; Pontee, N.; Sanchirico, J.N.; Ingram, J.C.; Lange, G.M.; Burks-Copes, K.A. The effectiveness, costs and coastal protection benefits of natural and nature-based defences. PLoS ONE 2016, 11, e0154735. [Google Scholar] [CrossRef]
  71. Strategic Plan for Biodiversity 2011–2020: Aichi Biodiversity Targets. Available online: https://www.cbd.int/sp/targets/ (accessed on 28 August 2023).
  72. Chang, C.W.; Mori, N. Green infrastructure for the reduction of coastal disasters: A review of the protective role of coastal forests against tsunami, storm surge, and wind waves. Coast. Eng. 2021, 63, 370–385. [Google Scholar] [CrossRef]
  73. Shepard, C.C.; Crain, C.M.; Beck, M.W. The protective role of coastal marshes: A systematic review and meta-analysis. PLoS ONE 2011, 6, e27374. [Google Scholar] [CrossRef] [PubMed]
  74. Gijsman, R.; Horstman, E.M.; van der Wal, D.; Friess, D.A.; Swales, A.; Wijnberg, K.M. Nature-based engineering: A review on reducing coastal flood risk with mangroves. Front. Mar. Sci. 2021, 8, 702412. [Google Scholar] [CrossRef]
  75. Gedan, K.B.; Kirwan, M.L.; Wolanski, E.; Barbier, E.B.; Silliman, B.R. The present and future role of coastal wetland vegetation in protecting shorelines: Answering recent challenges to the paradigm. Clim. Change 2011, 106, 7–29. [Google Scholar] [CrossRef]
  76. Zhang, K.; Liu, H.; Li, Y.; Xu, H.; Shen, J.; Rhome, J.; Smith, T.J., III. The role of mangroves in attenuating storm surges. Estuar. Coast. Shelf Sci. 2013, 102, 11–23. [Google Scholar] [CrossRef]
  77. McIvor, A.L.; Möller, I.; Spencer, T.; Spalding, M. Reduction of Wind and Swell Waves by Mangroves. Natural Coastal Protection Series: Report 1. Cambridge Coastal Research Unit Working Paper 40; The Nature Conservancy and Wetlands International: Arlington, VA, USA, 2012. [Google Scholar]
  78. Möller, I.; Spencer, T.; French, J.R.; Leggett, D.J.; Dixon, M. Wave transformation over salt marshes: A field and numerical modelling study from North Norfolk, England. Estuar. Coast. Shelf Sci. 1999, 49, 411–426. [Google Scholar] [CrossRef]
  79. Möller, I.; Kudella, M.; Rupprecht, F.; Spencer, T.; Paul, M.; Van Wesenbeeck, B.K.; Wolters, G.; Jensen, K.; Bouma, T.J.; Miranda-Lange, M.; et al. Wave attenuation over coastal salt marshes under storm surge conditions. Nat. Geosci. 2014, 7, 727–731. [Google Scholar] [CrossRef]
  80. McIvor, A.L.; Spencer, T.; Möller, I.; Spalding, M. The Response of Mangrove Soil Surface Elevation to Sea Level Rise. Available online: https://conservationgateway.org/ConservationPractices/Marine/crr/library/Documents/mangrove-surface-elevation-and-sea-level-rise.pdf (accessed on 1 September 2023).
  81. Ashton, A.D.; Donnelly, J.P.; Evans, R.L. A discussion of the potential impacts of climate change on the shorelines of the Northeastern USA. Mitig. Adapt. Strateg. Glob. Chang. 2008, 13, 719–743. [Google Scholar] [CrossRef]
  82. Swales, A.; Lovelock, C.E. Comparison of sediment-plate methods to measure accretion rates in an estuarine mangrove forest (New Zealand). Estuar. Coast. Shelf Sci. 2020, 236, 106642. [Google Scholar] [CrossRef]
  83. Kirwan, M.L.; Megonigal, J.P. Tidal wetland stability in the face of human impacts and sea-level rise. Nature 2013, 504, 53–60. [Google Scholar] [CrossRef]
  84. Cheong, S.M.; Silliman, B.; Wong, P.P.; Van Wesenbeeck, B.; Kim, C.K.; Guannel, G. Coastal adaptation with ecological engineering. Nat. Clim. Chang. 2013, 3, 787–791. [Google Scholar] [CrossRef]
  85. Quataert, E.; Storlazzi, C.; Van Rooijen, A.; Cheriton, O.; Van Dongeren, A. The influence of coral reefs and climate change on wave-driven flooding of tropical coastlines. Geophys. Res. Lett. 2015, 42, 6407–6415. [Google Scholar] [CrossRef]
  86. Costa, M.B.; Araújo, M.; Araújo, T.C.; Siegle, E. Influence of reef geometry on wave attenuation on a Brazilian coral reef. Geomorphology 2016, 253, 318–327. [Google Scholar] [CrossRef]
  87. Beck, M.W.; Losada, I.J.; Menéndez, P.; Reguero, B.G.; Díaz-Simal, P.; Fernández, F. The global flood protection savings provided by coral reefs. Nat. Commun. 2018, 9, 2186. [Google Scholar] [CrossRef]
  88. Reguero, B.G.; Storlazzi, C.D.; Gibbs, A.E.; Shope, J.B.; Cole, A.D.; Cumming, K.A.; Beck, M.W. The value of US coral reefs for flood risk reduction. Nat. Sustain. 2021, 4, 688–698. [Google Scholar] [CrossRef]
  89. Ferrario, F.; Beck, M.W.; Storlazzi, C.D.; Micheli, F.; Shepard, C.C.; Airoldi, L. The effectiveness of coral reefs for coastal hazard risk reduction and adaptation. Nat. Commun. 2014, 5, 3794. [Google Scholar] [CrossRef]
  90. Wild, C.; Hoegh-Guldberg, O.; Naumann, M.S.; Colombo-Pallotta, M.F.; Ateweberhan, M.; Fitt, W.K.; Iglesias-Prieto, R.; Palmer, C.; Bythell, J.C.; Ortiz, J.C.; et al. Climate change impedes scleractinian corals as primary reef ecosystem engineers. Mar. Freshw. Res. 2011, 62, 205–215. [Google Scholar] [CrossRef]
  91. Bruno, J.F.; Selig, E.R. Regional decline of coral cover in the Indo-Pacific: Timing, extent, and subregional comparisons. PLoS ONE 2007, 2, e7112007. [Google Scholar] [CrossRef]
  92. Pandolfi, J.M.; Connolly, S.R.; Marshall, D.J.; Cohen, A.L. Projecting coral reef futures under global warming and ocean acidification. Science 2011, 333, 418–422. [Google Scholar] [CrossRef]
  93. Elliff, C.I.; Silva, I.R. Coral reefs as the first line of defense: Shoreline protection in face of climate change. Mar. Environ. Res. 2017, 127, 148–154. [Google Scholar] [CrossRef] [PubMed]
  94. Silvestri, S.; Kershaw, F. Framing the Flow: Innovative Approaches to Understand, Protect and Value Ecosystem Services across Linked Habitats; UNEP: Cambridge, UK, 2010. [Google Scholar]
  95. Broekx, S.; Smets, S.; Liekens, I.; Bulckaen, D.; De Nocker, L. Designing a long-term flood risk management plan for the Scheldt estuary using a risk-based approach. Nat. Hazards 2011, 57, 245–266. [Google Scholar] [CrossRef]
  96. Turner, R.K.; Burgess, D.; Hadley, D.; Coombes, E.; Jackson, N. A cost–benefit appraisal of coastal managed realignment policy. Glob. Environ. Change 2007, 17, 397–407. [Google Scholar] [CrossRef]
  97. Day, J.W., Jr.; Boesch, D.F.; Clairain, E.J.; Kemp, G.P.; Laska, S.B.; Mitsch, W.J.; Orth, K.; Mashriqui, H.; Reed, D.J.; Shabman, L.; et al. Restoration of the Mississippi delta: Lessons from hurricanes Katrina and Rita. J. Sci. 2007, 315, 1679–1684. [Google Scholar] [CrossRef]
  98. Spalding, M.D.; Kainuma, M.; Collins, L. World Atlas of Mangroves; Earthscan: London, UK, 2010. [Google Scholar]
  99. Schmitt, K.; Albers, T.; Pham, T.T.; Dinh, S.C. Site-specific and integrated adaptation to climate change in the coastal mangrove zone of Soc Trang Province, Viet Nam. J. Coast. Conserv. 2013, 17, 545–558. [Google Scholar] [CrossRef]
  100. Shanghai Municipal Statistics Bureau. Shanghai Statistical Yearbook 2000–2023; China Statistics Press: Beijing, China, 2023.
  101. Estimated Population of the Urban Area of Shanghai, China from 1980 to 2035 (in Millions). Available online: https://www.statista.com/statistics/466938/china-population-of-shanghai/ (accessed on 2 August 2023).
  102. Xu, H.; Tian, Z.; Sun, L.; Ye, Q.; Ragno, E.; Bricker, J.; Mao, G.; Tan, J.; Wang, J.; Ke, Q.; et al. Compound flood impact of water level and rainfall during tropical cyclone periods in a coastal city: The case of Shanghai. Nat. Hazards Earth Syst. Sci. 2022, 22, 2347–2358. [Google Scholar] [CrossRef]
  103. Du, S.; Gu, H.; Wen, J.; Chen, K.; Rompaey, A.V. Detecting flood variations in Shanghai over 1949–2009 with Mann-Kendall tests and a newspaper-based database. Water 2015, 7, 1808–1824. [Google Scholar] [CrossRef]
  104. Wang, J.; Yi, S.; Li, M.; Wang, L.; Song, C. Effects of sea level rise, land subsidence, bathymetric change and typhoon tracks on storm flooding in the coastal areas of shanghai. Sci. Total Environ. 2018, 621, 228–234. [Google Scholar] [CrossRef]
  105. Wang, Y.; Guo, Z.; Zheng, S.; Zhang, M.; Shu, X.; Luo, J.; Qiu, L.; Gao, T. Risk assessment for typhoon-induced storm surges in Wenchang, Hainan Island of China. Geomat. Nat. Hazards Risk 2021, 12, 880–899. [Google Scholar] [CrossRef]
  106. Hammar-Klose, E.S.; Thieler, E.R. Coastal Vulnerability to Sea-Level Rise: A Preliminary Database for the U.S. Atlantic, Pacific, and Gulf of Mexico Coasts; U.S. Geological Survey Digital Data Series; U.S. Geological Survey: Reston, VA, USA, 2001; Volume 68. [Google Scholar]
  107. Danielson, J.J.; Gesch, D.B. Global Multi-Resolution Terrain Elevation Data 2010 (GMTED2010): U.S. Geological Survey Open-File Report 2011–1073; U.S. Geological Survey: Reston, VA, USA, 2011; 26p. [Google Scholar]
  108. Klein, E.; Hadré, E.; Krastel, S.; Urlaub, M. An evaluation of the General Bathymetric Chart of the Ocean in shoreline-crossing geomorphometric investigations of volcanic islands. Front. Mar. Sci. 2023, 10, 1259262. [Google Scholar] [CrossRef]
  109. Wessel, P.; Smith, W.H.F. A global self-consistent, hierarchical, high-resolution shoreline database. J. Geophys. Res. 2017, 10, 8741–8743. [Google Scholar] [CrossRef]
  110. Sengupta, D.; Chen, R.; Meadows, M.E.; Choi, Y.R.; Banerjee, A.; Zilong, X. Mapping Trajectories of Coastal Land Reclamation in Nine Deltaic Megacities using Google Earth Engine. Remote Sens. 2019, 11, 2621. [Google Scholar] [CrossRef]
  111. EarthExplorer. Available online: https://earthexplorer.usgs.gov/ (accessed on 15 June 2023).
  112. World Imagery. Available online: https://hub.arcgis.com/datasets/esri::world-imagery/about (accessed on 5 June 2023).
  113. Mcowen, C.; Weatherdon, L.V.; Bochove, J.; Sullivan, E.; Blyth, S.; Zockler, C.; Stanwell-Smith, D.; Kingston, N.; Martin, C.S.; Spalding, M.; et al. A global map of saltmarshes (v6.1). Biodivers. Data J. 2017, 5, e11764. [Google Scholar] [CrossRef]
  114. Fathi-Moghadam, M.; Davoudi, L.; Motamedi-Nezhad, A. Modeling of solitary breaking wave force absorption by coastal trees. Ocean Eng. 2018, 169, 87–98. [Google Scholar] [CrossRef]
  115. Brody, S.D.; Highfield, W.E.; Blessing, R.; Makino, T.; Shepard, C.C. Evaluating the effects of open space configurations in reducing flood damage along the Gulf of Mexico coast. Landsc. Urban Plan. 2017, 167, 225–231. [Google Scholar] [CrossRef]
  116. Cabral, P.; Augusto, G.; Akande, A.; Costa, A.; Amade, N.; Niquisse, S.; Atumane, A.; Cuna, A.; Kazemi, K.; Mlucasse, R.; et al. Assessing Mozambique’s exposure to coastal climate hazards and erosion. Int. J. Disaster Risk Reduct. 2017, 23, 45–52. [Google Scholar] [CrossRef]
  117. Raja, D.R.; Hredoy, M.S.N.; Islam, M.K.; Islam, K.A.; Adnan, M.S.G. Spatial distribution of heatwave vulnerability in a coastal city of Bangladesh. Environ. Chall. 2021, 4, 100122. [Google Scholar] [CrossRef]
  118. Anselin, L. Local indicators of spatial association—LISA. Geogr. Anal. 1995, 27, 93–115. [Google Scholar] [CrossRef]
  119. Panteras, G.; Cervone, G. Enhancing the temporal resolution of satellite-based flood extent generation using crowdsourced data for disaster monitoring. Int. J. Remote Sens. 2018, 39, 1459–1474. [Google Scholar] [CrossRef]
  120. Renard, F. Flood risk management centred on clusters of territorial vulnerability. Geomat. Nat. Hazards Risk 2017, 8, 525–543. [Google Scholar] [CrossRef]
  121. Chen, Y.; Dong, J.; Xiao, X.; Zhang, M.; Tian, B.; Zhou, Y.; Li, B.; Ma, Z. Land claim and loss of tidal flats in the Yangtze Estuary. Sci. Rep. 2016, 6, 24018. [Google Scholar] [CrossRef]
  122. Tian, B.; Zhou, Y.X.; Thom, R.M.; Diefenderfer, H.L.; Yuan, Q. Detecting wetland changes in Shanghai, China using FORMOSAT and Landsat TM imagery. J. Hydrol. 2015, 529, 1–10. [Google Scholar] [CrossRef]
  123. Wang, J.; Xu, S.; Ye, M.; Huang, J. The MIKE model application to overtopping risk assessment of seawalls and levees in Shanghai. Int. J. Disaster Risk Sci. 2011, 2, 32–42. [Google Scholar] [CrossRef]
  124. Yin, J.; Yu, D.; Yin, Z.; Wang, J.; Xu, S. Modelling the combined impacts of sea-level rise and land subsidence on storm tides induced flooding of the Huangpu River in Shanghai, China. Clim. Change 2013, 119, 919–932. [Google Scholar] [CrossRef]
  125. Ke, Q.; Yin, J.; Bricker, J.D.; Savage, N.; Buonomo, E.; Ye, Q.; Visser, P.; Dong, G.; Wang, S.; Tian, Z.; et al. An integrated framework of coastal flood modelling under the failures of sea dikes: A case study in Shanghai. Nat. Hazards 2021, 109, 671–703. [Google Scholar] [CrossRef]
  126. He, X.C.; Yang, T.L.; Shen, S.L.; Xu, Y.S.; Arulrajah, A. Land subsidence control zone and policy for the environmental protection of Shanghai. Int. J. Environ. Res. Public Health 2019, 16, 2729. [Google Scholar] [CrossRef] [PubMed]
  127. Zhao, Q.; Pan, J.; Devlin, A.; Xu, Q.; Tang, M.; Li, Z.; Zamparelli, V.; Falabella, F.; Mastro, P.; Pepe, A. Integrated analysis of the combined risk of ground subsidence, sea level rise, and natural hazards in coastal and Delta River regions. Remote Sens. 2021, 13, 3431. [Google Scholar] [CrossRef]
  128. Bao, J.; Gao, S. Wetland utilization and adaptation practice of a coastal megacity: A case study of Chongming Island, Shanghai, China. Front. Environ. Sci. 2021, 9, 627963. [Google Scholar] [CrossRef]
  129. Cui, L.; Ge, Z.; Yuan, L.; Zhang, L. Vulnerability assessment of the coastal wetlands in the Yangtze Estuary, China to sea-level rise. Estuar. Coast. Shelf Sci. 2015, 156, 42–51. [Google Scholar] [CrossRef]
  130. Lin, S.; Li, X.; Yang, B.; Ma, Y.; Jiang, C.; Xue, L.; Wang, J.; Yan, Z. Systematic assessments of tidal wetlands loss and degradation in Shanghai, China: From the perspectives of area, composition and quality. Glob. Ecol. Conserv. 2021, 25, e01450. [Google Scholar] [CrossRef]
  131. Sun, Z.; Sun, W.; Tong, C.; Zeng, C.; Yu, X.; Mou, X. China’s coastal wetlands: Conservation history, implementation efforts, existing issues and strategies for future improvement. Environ. Int. 2015, 79, 25–41. [Google Scholar] [CrossRef] [PubMed]
  132. Kim, M.; You, S.; Chon, J.; Lee, J. Sustainable land-use planning to improve the coastal resilience of the social-ecological landscape. Sustain. Sci. 2017, 9, 1086. [Google Scholar] [CrossRef]
  133. Bucharova, A.; Michalski, S.; Hermann, J.; Heveling, K.; Durka, W.; Hölzel, N.; Kollmann, J.; Bossdorf, O. Genetic differentiation and regional adaptation among seed origins used for grassland restoration: Lessons from a multi-species transplant experiment. J. Appl. Ecol. 2017, 54, 127–136. [Google Scholar] [CrossRef]
  134. Khazai, B.; Ingram, J.C.; Saah, D.S. The Protective Role of Natural and Engineered Defence Systems in Coastal Hazards. Available online: https://www.researchgate.net/publication/242734043_The_Protective_Role_of_Natural_and_Engineered_Defence_Systems_in_Coastal_Hazards (accessed on 1 September 2023).
  135. Hochard, J.P.; Hamilton, S.; Barbier, E.B. Mangroves shelter coastal economic activity from cyclones. Proc. Natl. Acad. Sci. USA 2019, 116, 12232–12237. [Google Scholar] [CrossRef]
  136. Mi, J.; Zhang, M.; Zhu, Z.; Vuik, V.; Wen, J.; Gao, H.; Bouma, T.J. Morphological wave attenuation of the nature-based flood defense: A case study from Chongming Dongtan Shoal, China. Sci. Total Environ. 2022, 831, 154813. [Google Scholar] [CrossRef]
  137. Pontee, N.; Narayan, S.; Beck, M.W.; Hosking, A.H. Nature-based solutions: Lessons from around the world. Proc. Inst. Civ. Eng. -Marit. Eng. 2016, 169, 29–36. [Google Scholar] [CrossRef]
  138. Coombes, M.A.; Viles, H.A.; Naylor, L.A.; La Marca, E.C. Cool barnacles: Do common biogenic structures enhance or retard rates of deterioration of intertidal rocks and concrete? Sci. Total Environ. 2017, 580, 1034–1045. [Google Scholar] [CrossRef]
  139. Singhvi, A.; Luijendijk, A.P.; van Oudenhoven, A.P. The grey–green spectrum: A review of coastal protection interventions. J. Environ. Manag. 2022, 311, 114824. [Google Scholar] [CrossRef]
  140. Urban Coastal Resilience: Valuing Nature’s Role. Available online: https://www.nature.org/media/newyork/urban-coastal-resilience.pdf (accessed on 28 August 2023).
  141. Bama, V.P.S.; Rajakumari, S.; Ramesh, R. Coastal vulnerability assessment of Vedaranyam swamp coast based on land use and shoreline dynamics. Nat. Hazards 2020, 100, 829–842. [Google Scholar] [CrossRef]
  142. De Sherbinin, A.; Bukvic, A.; Rohat, G.; Gall, M.; McCusker, B.; Preston, B.; Apotsos, A.; Fish, C.; Kienberger, S.; Muhonda, P.; et al. Climate Vulnerability Mapping: A Systematic Review and Future Prospects. Wiley Interdiscip. Rev. Clim. Change 2019, 10, e600. [Google Scholar] [CrossRef]
  143. Kienberger, S.; Borderon, M.; Bollin, C.; Jell, B. Climate Change Vulnerability Assessment in Mauritania: Reflections on Data Quality, Spatial Scales, Aggregation and Visualizations. GI Forum 2016, 4, 167–175. [Google Scholar] [CrossRef]
  144. Pietrucha-Urbanik, K.; Rak, J. Water, Resources, and Resilience: Insights from Diverse Environmental Studies. Water 2023, 15, 3965. [Google Scholar] [CrossRef]
  145. Langkulsen, U.; Rwodzi, D.T.; Cheewinsiriwat, P.; Nakhapakorn, K.; Moses, C. Socio-Economic Resilience to Floods in Coastal Areas of Thailand. Int. J. Environ. Res. Public Health 2022, 19, 7316. [Google Scholar] [CrossRef]
  146. Umamaheswari, T.; Sugumar, G.; Krishnan, P.; Ananthan, P.S.; Anand, A.; Jeevamani, J.J.J.; Mahendra, R.S.; Amali Infantina, J.; Srinivasa Rao, C. Vulnerability assessment of coastal fishing communities for building resilience and adaptation: Evidences from Tamil Nadu, India. Environ. Sci. Policy 2021, 123, 114–130. [Google Scholar] [CrossRef]
Figure 1. Location and boundaries of the study area (Shanghai).
Sustainability 16 00609 g001
Figure 2. The main flow of the study, including main phases, outputs, and software tools used.
Sustainability 16 00609 g002
Figure 3. Proportional distribution of different coastal vulnerability levels for various scenarios.
Sustainability 16 00609 g003
Figure 4. Coastal vulnerability maps of different scenarios: (A) All habitats are present, (B) no habitats, (C) without the salt marshes, (D) without the large coastal green spaces, and (E) without the small coastal green spaces.
Sustainability 16 00609 g004
Figure 5. (A) Hot Spot Map and (B) Cluster and Outlier Map of current coastal vulnerability.
Sustainability 16 00609 g005
Figure 6. Innovative method that combines natural elements and conventional hard structures [136].
Sustainability 16 00609 g006
Table 1. Input data and their sources.
Input DataDescriptionSource
DEMDirectly used the dataset of Global Multi-resolution Terrain Elevation Data 2010 (GMTED 2010); the resolution is 7.5 arc seconds[107]
BathymetryDirectly used the dataset of General Bathymetric Chart of the Oceans 2023 (GEBCO 2023); the resolution is 15 arc seconds[108]
Continental Shelf ContourDirectly used the shapefile provided by the InVEST coastal vulnerability package[54]
LandmassDownloaded the dataset of Global Self-consistent, Hierarchical, High-resolution Geography Database (GSHHG) version 2.3.7, and made modifications[109]
GeomorphologyCreated a data layer in ArcGIS Pro through visual interpretation
Natural HabitatDirectly used the dataset of Global Distribution of Saltmarshes version 6.1 from UNEP-WCMC Ocean Data Viewer; Created two data layers in ArcGIS Pro through supervised classification[110]
Wind and WaveDirectly used the WaveWatchIII dataset included in the InVEST coastal vulnerability package[54]
Table 2. The main coastal geomorphic features of Shanghai with their ranks.
TypeProtection StructureHarbour and WharfCobble BeachLagoonEstuaryMudflat
Rank234445
Table 3. The main natural habitats in Shanghai with their ranks and protection distances.
TypeSalt MarshCoastal Green Space
LargeSmall
Rank234
Protection Distance (m)5001000250
Table 4. Descriptive statistics of the coastal vulnerability of all scenarios.
Input Current SituationScenario 1Scenario 2Scenario 3Scenario 4
CountLow (1.00–1.99)466212423331466
Medium (2.00–2.99)38483276372035873843
High (3.00–3.99)11001873123314811105
Very High (4.00–5.00)194247232209194
PercentageLow (1.00–2.00)8.31%3.78%7.54%5.90%8.31%
Medium (2.01–3.00)68.62%58.42%66.33%63.96%68.53%
High (3.01–4.00)19.61%33.40%21.99%26.41%19.70%
Very High (4.01–5.00)3.46%4.40%4.14%3.73%3.46%
Change in the number of shore points
(compared with the current situation)
Low (1.00–2.00) −54.51%−9.23%−28.97%0.00%
Medium (2.01–3.00) −14.86%−3.33%−6.78%−0.13%
High (3.01–4.00) 70.27%12.09%34.64%0.45%
Very High (4.01–5.00) 27.32%19.59%7.73%0.00%
Mean Exposure Index2.6863799332.8782330212.7502107962.7669146642.689440308
Table 5. Descriptive statistics of the results of the Cluster and Outliners Analysis.
High-HighHigh-LowLow-HighLow-LowNot Significant
Count159826621861792
Percentage28.50%0.46%0.11%38.98%31.85%
Disclaimer/Publisher’s Note: The statements, opinions and data contained in all publications are solely those of the individual author(s) and contributor(s) and not of MDPI and/or the editor(s). MDPI and/or the editor(s) disclaim responsibility for any injury to people or property resulting from any ideas, methods, instructions or products referred to in the content.

