Article

Promoting Sustainable Transportation: A Transtheoretical Examination of Active Transport Modes

1
Transportation Research Institute (IMOB), Hasselt University, Martelarenlaan 42, 3500 Hasselt, Belgium
2
Department of Cardiology, Jessa Hospital, Stadsomvaart 11, 3500 Hasselt, Belgium
3
Faculty of Medicine and Life Sciences, Hasselt University, Agoralaan, 3590 Diepenbeek, Belgium
*
Author to whom correspondence should be addressed.
Sustainability 2024, 16(2), 472; https://doi.org/10.3390/su16020472
Submission received: 23 November 2023 / Revised: 22 December 2023 / Accepted: 26 December 2023 / Published: 5 January 2024
(This article belongs to the Special Issue Behavioural Approaches to Promoting Sustainable Transport Systems)

Abstract

:
The use and promotion of active transportation has been scientifically proven to play a fundamental role in influencing global sustainable development goals. Despite increased recognition, there is a notable gap in understanding how to effectively transition the general population from convenience-oriented transport to embracing active modes. The application of the Transtheoretical Model (TTM) in understanding the utilization of active transport modes is currently constrained. The first aim is to include measuring the readiness to change in the use of active transport modes to increase physical activity (PA) using a continuous measure (i.e., University of Rhode Island Change Assessment, URICA). A second aim is to determine whether the decisional balance (perception of pros and cons) and self-efficacy increase as respondents progress through the stages of change as well as with the increase in self-reported active transport use. In total, 260 university students and staff filled out an online survey containing self-reported use of active transport modes and TTM constructs. The results suggest that URICA successfully identifies five stages of change. The decision balance and self-efficacy of the behaviour increase as individuals progress through the stages. The same is also true for the use of active transport modes.

1. Introduction

The use of active transport modes (walking and cycling) has multiple benefits to health and the environment by contributing to increased physical activity (PA) levels [1], reducing air and noise pollution (e.g., CO2 emissions), and alleviating congestion problems [2,3]. Walking and cycling are considered the most sustainable and accessible modes for any journey from A to B [3]. The use and promotion of active transportation, such as walking and cycling, has been scientifically proven to play a pivotal role in directly influencing global sustainable development goals. These sustainable development goals include the following [4]:
  • Reducing air pollution (Sustainable Development Goals, SDG 3) and providing access to sustainable urban transport for all citizens (SDG 11).
  • Beyond their direct impact on these critical sustainable development goals, active transportation modes deliver a cascade of additional indirect benefits. These benefits encompass improved access to health and education (SDG 4), reduced inequality (SDG 10), enhanced gender inclusion (SDG 5), and support for poverty reduction strategies (SDG 1).
Land use and transport policies wield parallel influences on both human health and environmental sustainability [5]. PA helps with reducing the prevalence of chronic diseases, improving mental health, reducing the rates of cognitive decline, and consequently reducing overall mortality rates [6,7,8,9]. Active transport and walking in particular are feasible for many people [10]. The use of active transportation benefits health and transportation sciences as they are a convenient and accessible way to increase PA levels. For example, achieving the recommended dose of PA by walking and cycling has proven to have significant health effects [11,12]. In general, adults should perform at least 150–300 min of moderate-intensity PA [13]. While the health benefits of PA are well documented, approximately 28% of adults (18–64) do not reach the World Health Organization’s (WHO) recommended PA levels [13]. The WHO advocates for the use of non-motorised transport modes such as walking and cycling, as they can reduce health risks and mortality levels by increasing PA levels [13,14].
Moreover, the transport sector’s heavy reliance on fossil fuels, particularly in Europe, poses a significant challenge to meeting international sustainable policies for climate change. Despite the slow transition to alternative fuels, there is a growing consensus that promoting active travel, such as walking and cycling, holds promise in mitigating carbon emissions, emphasizing its importance over relying solely on technological substitution [3].
Owing to the aforementioned benefits, the promotion of walking and cycling for travel purposes or active transportation has become an integral part of global and regional level policies; e.g., European Green Deal [15], Transport, Health, and Environment Pan-European Programme (THE PEP) [16], and Sustainable Mobility for all (SuM4all) [17]. Therefore, research on the identification and evaluation of interventions to increase PA via active transport is necessary. Theory-based interventions (e.g., Transtheoretical Model, Social Cognitive Theory, Protection Motivation Theory) to promote PA have a strong evidence base in the medical and public health domain [18,19]. The application of theory-based intervention to promote active transport is limited by comparison [20]. Additionally, to develop customised strategies for enhancing health through active transportation, it is essential to initially comprehend the motivating factors behind individuals’ engagement in active transport. A viable approach involves employing well-established social psychological models to measure people’s readiness to embrace this concept. One such model that is extensively used in exploring the willingness to change is the Transtheoretical Model (TTM) [21,22,23]. This research aims to explore the utility of the TTM in an attempt to measure the readiness of individuals to change, or to be more specific, their readiness to increase PA levels through active transport use. The TTM has been most popular within the realm of health-related and addictive behaviours such as exercise, smoking cessation, and alcohol and drug use behaviour research [24,25,26,27]. Limited exploration of the model’s applicability in the area of transport [28], and specifically active transport [20,29], is available.

1.1. Overview of Transtheoretical Model

Prochaska and DiClemente’s (1983) TTM of behaviour change is one of the most popular and widely used stage models in health research [30,31,32]. The TTM denotes the following: (1) single behavioural theory is insufficient to comprehend the complexity of behaviour change processes, (2) the process of behaviour change unwinds through different stages over time, (3) the stages of change are stable and welcoming to change, and (4) the efficacy of behaviour change can be augmented by exploiting specific change processes and techniques to specific stages [33,34].
The stage theory is an essential part of the TTM. It is based on the idea that individuals undergo behaviour change as they advance through a defined sequence of stages [22,35]. The TTM typically consists of five stages: pre-contemplation (where individuals perceive the consequences of their behaviour as insignificant or remain unaware of any problem), contemplation (where people recognize the benefits of behavioural change but view the cost of change as high thus leading to apprehension), preparation (where individuals decide to change in the future and start taking small steps towards that goal), action (where individuals actively engage in changing their current behaviour or adopting the desired behaviour), and maintenance (where behavioural change is established and sustained over time) [22,36,37,38]. The TTM conceptualizes behaviour change within a temporal framework, suggesting that individuals undergo progression over time [39]. It is acknowledged that individuals may go through multiple cycles across the stages before attaining lasting behavioural changes. Consequently, the TTM offers a structured approach for designing personalized interventions tailored to individuals at various stages [34].
Advancement through the stages of change (SOCs) is shaped by key mediators of change, which are conceptual frameworks including decisional balance (DB), self-efficacy, and processes of change (POCs) [40]. DB refers to an individual’s assessment of the advantages and disadvantages associated with choosing to adopt a particular behaviour or not [40]. Studies have consistently shown predictable relationships between the pros and cons across DB stages [22,41,42,43]. To elaborate, individuals in the pre-contemplation stage typically lean towards recognizing the drawbacks or negative aspects of behaviour change. In contrast, those in the action or maintenance stages tend to perceive the advantages as outweighing the disadvantages [22]. This evolution in decisional balance underscores the dynamic nature of one’s perception as they progress through the stages of change, reflecting a shifting emphasis on either the challenges or benefits associated with behaviour modification. Understanding these nuanced shifts in decisional balance is crucial for tailoring effective interventions that align with individuals’ specific needs and stages in the change process [22].
Self-efficacy refers to an individual’s confidence in their capability to execute actions leading to a specific level of performance [22,40]. Examination across different stages, from preparation to maintenance, indicates a general trend of increasing self-efficacy [22,34,44]. Consistent patterns have been observed in the relationship between the stages of the Transtheoretical Model (TTM) and its mediators, such as DB and self-efficacy, across various behaviours [40,41,45].
Finally, the ten Processes of Change (POCs) encompass both covert and overt activities employed by individuals to advance through the stages of change. These activities are further categorised into experiential processes and behavioural processes. Experiential POCs are focused on acquiring knowledge through personal experiences, primarily applied during early-stage transitions. Examples of experiential processes include consciousness-raising, dramatic relief, self-re-evaluation, environmental re-evaluation, and social liberation.
On the other hand, behavioural processes are deployed during later-stage transitions, involving individuals actively engaging in specific actions to modify their behaviour. Key behavioural processes comprise self-liberation, establishing helpful relationships, counterconditioning, reinforcement management, and stimulus control. These processes collectively contribute to the dynamic and multifaceted nature of the change journey, addressing different aspects of personal development and behavioural modification [39,40].

1.2. Criticism Related to the Transtheoretical Model

Like other social-psychological models, TTM is not free from criticism. A few important criticisms include limited clarity and consistency of factors influencing the transitions between stages. However, the important critic of TTM is about the SOCs and their measurement. It was criticized that the SOCs are quite discrete and arbitrary [28,46]. In response to this criticism, Velicer and Prochaska described the stages as periods of temporal stability [22]. They have drawn the similarity between the concept of distinct stages and punctuated equilibrium models of evolution used in natural sciences. These models allude to extended intervals of stability or equilibrium interrupted by shorter episodes of imbalance or change [47]. In a similar pattern, stages such as pre-contemplation, contemplation, and maintenance present longer periods of equilibrium which are punctuated by disequilibria or change [47]. However, in real life, an individual categorised in one stage is capable of having feelings and thoughts from other stages. For example, a subject may achieve high scores in multiple stages at the same time. This is why multidimensional or continuous scale measures (e.g., University of Rhode Island Change Assessment, URICA, URICA for exercise, URICA-E2) were developed to capture the continuity of motivations to perform certain behaviours across all stages [35]. A higher total score indicates that an individual has a higher readiness to change (RTC) [48]. RTC is determined by subtracting the scores of the pre-contemplation subscale from the sum of the contemplation, action, and maintenance subscales. Alternatively, the staging algorithms provide less insight into the underlying psychological determinants of behaviour as the scale is simplified. On the other hand, the tool adheres to the original conceptualization of the TTM and its discrete stages. The majority of the studies in the travel behaviour domain have utilised the staging algorithms, and the utility of the multidimensional scale measure is lacking [45,49,50].

1.3. Study Aims

The innovation of this study lies in its pioneering effort to address a significant gap in the existing literature on the use of active transport modes. While prior studies have predominantly focused on isolated aspects of the Transtheoretical Model (TTM) when examining interventions related to active transport use, this research takes a step forward. It not only fills the void in the limited number of studies exploring the motivational mechanisms defined by TTM in the context of active transport use but goes beyond by comprehensively examining multiple constructs inherent to the model and the relationships between the constructs are also evaluated. For example, the majority of the studies that exist utilise either POCs or SOCs or a combination of both and it is rare to use outcome measures that relate these constructs as defined in TTM [28]. The current study, however, tests the relationship between the three constructs of TTM including SOCs, DB (perception of pros and cons), and self-efficacy and with the use of active transportation. In this study, the overarching goal is to empirically examine the Transtheoretical Model’s (TTM) assumptions and assess its prospective utility in highlighting the motivational mechanisms underpinning the use of active transport modes. The following aims based on primary assumptions of the TTM are investigated:
  • If the continuous measure of stages of change can identify the five stages of change measuring the readiness to change in the use of active transport modes to increase PA.
  • Determining whether the DB (i.e., pros of the behaviour outweigh the cons of the behaviour) and self-efficacy increase as respondents progress through the stages (SOCs).
  • Determining whether stages of change, self-efficacy, and DB also progress with the increase in self-reported use of active transport modes.

2. Research Methodology

To test readiness to change in relation to increased active transport modes in a student population, this study uses three TTM measurement instruments, namely: the URICA scale, the DB scale [51], and the Situational Confidence Questionnaire (SCQ) to measure self-efficacy [52]. Two important criteria for participation included that participants must be above the age of 18 and physically able to carry out trips to and from work/school/shopping. Moreover, as the behaviour explored in the current study relates to the use of active transport, only people capable of unassisted mobility were included. A convenience sample was collected by contacting the students and staff of Hasselt University, Belgium. The population of Hasselt University comprises nearly 7500 students aged 18–35 and a faculty of 1400 individuals spanning the age range of 30–65. After initial analysis and data cleaning, the usable obtained count of responses was 260 from a total of 314. Only complete cases for TTM constructs measures were kept as required for analysis.
The standard questionnaires of TTM constructs (i.e., URICA, DB scale, and SCQ) were back-translated into the Netherlands language. Afterwards, a survey (Appendix A) consisting of the TTM constructs (40 survey items) and sociodemographic questionnaires (10 survey items) was prepared in the online software program Qualtrics 2019. The sociodemographic information consisted of key personal factors such as age, education level, gender, etc. (Appendix A). In addition, questions measuring the duration spent on the use of active transport modes (minutes per week) were incorporated, together with other transport modes choice-related questions. A summary of the sociodemographic and transport modes choice-related questions is provided in Section 4.1. The online link was disseminated through the administration staff of Hasselt University to the students and staff via email. One week later a reminder email was sent. The data collection period continued for 3 weeks after which the survey was disabled. This study was approved by the social ethics committee Sociaal-Maatschappelijke Ethische Commissie (SMEC) of Hasselt University (REC/SMEC/VRAI/189/122).

2.1. Measures

The standard measures were adapted from the previous studies for all three TTM constructs (i.e., SOCs, DB scale, SCQ) used in the current study and are explained in the following sections.

2.1.1. SOCs Measure

URICA is a continuous scale measure to capture the SOCs or readiness to change of individuals. At first, it was proposed by McConnaughy, Prochaska, and Velicer (1983) and consisted of 32 items [53]. This instrument has been characterized as user-friendly and does not necessitate training beforehand for its administration [48]. The URICA has proven effective in assessing outcomes and variables related to various health and addictive behaviours, as evidenced in previous studies [48,54,55]). However, various subscales developed for specific behaviours were developed as well (e.g., REFs. Relevant to our aim, for instance, is the URICA-E2. URICA-E2 was developed by Reed (1995) as a 24-item scale measure to capture continuous SOCs for exercise behaviour [35,56] and is downloadable from the website of the University of Rhode Island Cancer Prevention Research Centre [57]. The URICA-E2 instrument was selected because of its established reliability across various TTM studies [56,58,59,60]. This particular version of the URICA measures all the stages of the TTM, including pre-contemplation non-believers (PCNB), pre-contemplation believers (PCB), and Contemplation, Preparation, Action, and Maintenance. For the current study, the URICA-E2 was adapted for active transport mode use. The adapted version of URICA-E2 for the use of active transport is provided in Appendix A. The questionnaire itself is a 24-item continuous measure with a 5-point scale, with 1 for ‘strongly disagree’ and 5 for ‘strongly agree’. The participants were required to indicate the responses that they believed to match their feelings towards a particular statement.

2.1.2. Decisional Balance Scale

A scale designed by Nigg et al. (1998) to gauge Decisional Balance (DB) for Physical Activity (PA) behaviour was adapted for the present study [51]. This 10-item measure is utilised to evaluate the perceived advantages (pros) and disadvantages (cons) by an individual when considering increasing their PA levels through active transport. The identification of pros and cons related to the heightened use of active transport modes was informed by relevant literature [29]. The scale comprises five items categorised as ‘pros’ and five items categorised as ‘cons’. Participants were instructed to assess the importance of each item in their decision to enhance their PA levels through active transport using a five-point scale ranging from 1 (not important) to 5 (extremely important). The adapted DB measure for active transport use is provided in Appendix A.
To calculate the DB score, participants’ scores for “pros” and “cons” were separately summed and averaged. The difference between these two scores was then computed by subtracting the cons from the pros. A positive final score indicated that the individual endorsed more pros than cons regarding the target behaviour. Conversely, a negative score signified a higher perception of cons by the participant.

2.1.3. Situational-Confidence Questionnaire

A six-item questionnaire for self-efficacy, called the situational confidence questionnaire (SCQ), has been adapted in the current study [52]. The SCQ typically presents individuals with scenarios or situations related to the behaviour of interest which in this case is active transport use. Participants are asked to rate their confidence in successfully adopting active transport in challenging situations, providing nuanced insights into their perceived capability. The chosen scenarios encompass readiness to increase physical activity through active transport, social influence, weather impact, busy schedules, distance considerations, and the willingness to replace motorised transport. These scenarios represent common environmental constraints, aiming to gauge participants’ confidence in relation to their actual transport use. Participants were presented with six scenarios representing situations in which they encounter difficulty using active transport to enhance their physical activity (PA) levels. They were instructed to rate their confidence for each scenario on a five-point scale, ranging from 1 (not confident at all) to 5 (completely confident). The modified version of the SCQ for active transport modes is included in Appendix A.
To calculate the SCQ score, the sum of each participant’s responses was computed, and then the average was determined. The maximum achievable score was five, with a higher score indicating an elevated level of self-efficacy, while lower scores suggested the opposite.

3. Data Analysis

The initial analysis of the TTM constructs questionnaire results was conducted in Microsoft Excel, 2016. The rest of the analyses were performed with IBM Corp., released 2019, IBM SPSS Statistics for Windows, version 26.0, and Studio Version 1.2.1335, 2009–2019 RStudio, Inc. The data were first tested for normality. The Shapiro Wilk and Kolmogorov–Smirnov tests yielded significant values (p < 0.05) for maintenance and DBI scores as well as pre-contemplation and SCQ. Due to the relatively large sample size (n = 260), the violation from the normality assumption was not considered problematic [61]. The results section is divided into two subsections. First, we performed Explanatory Factor Analysis (EFA) to examine the structure of the URICA instrument or in simple words to explore the number of SOCs present in the sample population. Second, we performed a series of one-way analysis of variance (ANOVAs) to determine the differences in both DB and SCQ scores across SOCs, and likewise to determine the differences of both DB and SCQ scores across the level of use of active transportation modes. Afterwards, a contingency table analysis was performed to assess the correlation between the use of active transport modes and the five stages determined by URICA.

3.1. Step-1: URICA-Based SOCs

At first, a straightforward RTC-based classification was worked out in MS Excel as proposed in standard practices [57,62,63]. Each item on the questionnaire was associated with one of the five Transtheoretical Model (TTM) stages. The scores for each stage were totalled and then averaged. For instance, the responses to the four questions assigned to the contemplation stage were summed and divided by 4. Subsequently, the sum of the scores from each stage was computed. The final RTC Score was configured by subtracting the mean score of the pre-contemplation stage from the sum of all the scores across stages. Individuals scoring 8 or lower were categorised as being in the pre-contemplation stage. Scores between 9 and 11 were classified as the contemplation stage, while scores from 12 to 14 were attributed to the preparation or action stages. Scores exceeding 14 were designated as the maintenance stage.
Following this, the reliability of URICA items to measure the common factor (SOCs) was assessed using McDonald’s Omega (ωh), a reliable measure with values above 0.65 expected for good reliability and an acceptable classification error of <10% [64,65]. Subsequently, Exploratory Factor Analysis (EFA) was conducted. The Kaiser-Meyer-Olkin (KMO) test, assessing common variance within the dataset, was performed with a value between 0.80–0.90 considered meritorious or good. Bartlett’s Test of Sphericity was applied to ensure the appropriateness of data for EFA, with significance (p ≤ 0.05) indicating suitability [66,67]. Two criteria, namely the scree plot and parallel analysis, were considered to retain factors [66,67,68]. Additionally, the Oblimin rotation method was utilised to enhance factor interpretation, allowing for correlated factors, and is considered satisfactory in performance [66,67].
In the URICA-E2 survey, the pre-contemplators are further divided into subgroups of believers and non-believers. The results of an initial parallel analysis suggested only a four-factor solution and indicated that the stages of pre-contemplation non-believer (PCNB) and maintenance were loaded on the same factor but in opposite dimensions. The factor loadings of maintenance items were positive and of PCNB were negative which is explainable as the maintenance stage represents the people with already established behaviour activity and the people in the PCNB stage simply do not have any motivation to perform the behaviour. However, when another EFA was conducted excluding the survey items related to PCNB (U1, U3, U6, and U9, U refers to the URICA-based survey item in Appendix A), while parallel analysis and scree test suggested a five-factor solution. The results and explanation of the final EFA are provided in Section 4.

3.2. Step-2: Determining Differences of Both DB and Self-Efficacy across SOCs and the Use of Active Transportation

Aa a second step, the assumptions of ANOVA analysis, including requirements for sample size and independence of observations, were assessed. The normality for both the DB and SCQ scores was first checked through skewness and Kurtosis and found normally distributed with skewness of DBI = −0.267 (SE = 0.151) and SCQ = −0.077 (SE = 0.151) and Kurtosis of DBI = 0.312 (SE = 301) and SCQ = −0.390 (SE = 301), respectively. Likewise, Levene’s test of equality of error variances showed no significant levels (p > 0.05) for each outcome variable. To gain deeper insight into the omnibus differences between stages and behaviour categories, the post hoc analysis of Tukey’s Honestly Significance Difference (HSD) was performed as it is better for unequal samples across groups [69,70].
The scale items 1,3,5,7,9 were classified as ‘pros’ whilst items 2,4,6,8,10 were classified as ‘cons’ (Appendix A). However, the ten-item scale of DB was reduced to an eight-item measure to calculate the DB score. The survey analysis showed that a significant proportion of participants did not respond to question 10. To ensure balance between ‘pro’ and ‘con’ items, question number 3 was omitted considering question 9 as the suitable alternative to it.

4. Results

4.1. Participants

The mean age of the study population was 24 years (standard deviation ± 4.4). The majority of the population (91.2%) were students. Among the rest, 6.5% were university staff and 2.3% were categorised as missing information. Apart from these, other descriptive sociodemographics are provided in Table 1. The duration spent on using active transport was well distributed across all categories; 15.8% reported that they achieved 0–20 min per week, 25% reported 20–60 min, 22.3% reported 60–100 min, and 11.2% reported 100–150 min per week. The relatively highest percentage of 25.8% was reported for 150 min or more per week.

4.2. Stage Allocation-URICA

As per the RTC-based classification method, the majority of respondents were classified in the earlier stages of pre-contemplation and contemplation (Table 2).
A five-factor solution was retained with Oblimin rotation. The factors correspond to five SOCs as precontemplation believer (PCB), contemplation (C), preparation (P), action (A), and maintenance (M). The variance explained by these five factors was 63%. The factors named as their corresponding stages and factor loading related to survey items are provided in Table 3. Higher factor loading values indicate a stronger association between a survey item and the latent factor (i.e., stages). In the literature, different cutoff values for factor loadings are utilised, with ranges typically varying from 0.30 to 0.45. These cutoff values serve as thresholds to determine the strength of the association, and items with factor loadings surpassing these thresholds are considered to have a more robust connection with the underlying factor [67]. Keeping 0.35 as the cutoff value, it is observed from Table 3 that U14 and U23 from preparation and U4 from action stages do not load well on their corresponding latent factors.

4.3. Determining Differences of Both DB and Self-Efficacy across SOCs and the Use of Active Transportation

ANOVA’s findings showed a statistically significant difference (p ≤ 0.05) in the mean DB and SCQ scores of five stages of TTM (Table 4). Likewise, a significant difference (p ≤ 0.05) between the mean DB and SCQ scores was also found across the level of use of active transport modes behaviour (Table 4). At first, Tukey’s HSD results indicated that the mean score of DB for pre-contemplation was significantly different (p ≤ 0.05) from contemplation, preparation, and action but not maintenance in the case of URICA-based stage allocation. This implies that the mean score of DB increases across all stages but the pre-contemplators’ mean scores were significantly different from the mean scores of other stages. Moreover, the mean score of SCQ for pre-contemplation was significantly different (p ≤ 0.05) from the rest of the stages based on URICA. The post hoc analysis confirms that DB and SCQ scores increase (Table 5) with later stages although the significant difference is only found between the earliest stages (pre-contemplation stage) and the later stage (maintenance). However, one exception exists between URICA and DB scores where pre-contemplation is not significantly different from maintenance. Table 5 shows only significant stages and categories of behaviour.
The post hoc Tukey’s HSD results indicated that the mean score of DB for the category of 0–20 min of weekly active transport modes use was significantly different from all categories except for 20–60 min of use (Table 4). Likewise, Tukey’s HSD results indicated that the mean score of SCQ for the category of 0–20 min of weekly active transport modes use was significantly different from all the rest of the categories (Table 4). The ANOVA and post hoc analysis indicated that the mean scores of DBI and SCQ increase as the use of active transport modes increase (Table 6).
In the final step, we performed a contingency analysis (Table 7) to test the correlation between stages of change and the use of active transport modes. SOCs determined by URICA were significantly correlated (Camer’V = 0.25, p ≤ 0.05) with the use of active transport modes. This correlation was moderate. Moreover, to assess the direction of correlation we also measured the Lambda (λ) which is a Proportional Reduction in Error (PRE). That means it indicates the percentage of prediction error that could be avoided if the dependent variable is predicted by the independent variable [71]. The results of Lambda (λ) showed that 19.9% of error can be avoided if the use of active transport modes is predicted by URICA-based stage allocation. URICA-based SOCs are associated with the level of use of active transport mode and can help explain this behaviour (Figure 1 and Figure 2).

5. Discussion

Our main objective was to assess the overall suitability of the Transtheoretical Model (TTM) and its constructs as a viable measure of Readiness to Change (RTC) in individuals utilising active transport to enhance their physical activity (PA) levels. Consequently, this study aimed to investigate the psychometric properties of the adapted URICA-E2 for assessing readiness to change concerning the use of active transport. Moreover, the important assumption of TTM, that the DB and self-efficacy of individuals increase as they progress through earlier to later stages of change, was assessed as well in this study.

5.1. Stage Allocation by URICA for the Use of Active Transport Modes

The initial allocation of the respondents of URICA through the RTC score was successful in identifying each of the five SOCs described in the TTM framework within the sample. Based on the conceptual grouping of each item within its corresponding component, we identified the following TTM dimensions: pre-contemplation believer, contemplation, preparation, action, and maintenance by a twenty survey item URICA for active transport modes use. The RTC scores based on URICA allocated the majority of participants in the earlier stages, i.e., pre-contemplation and contemplation. Only two respondents were present in the maintenance stage. Additionally, the result of the EFA carried out on the URICA questionnaire identified five factors when excluding the PCNB. The previous studies using URICA-E2, however, reported six SOCs in contrast to the current study [35,56,59]. In an initial EFA, PCNB did not turn out as a separate factor for instead the related survey items were loaded on the maintenance factor but in an opposite direction. This refers to the lower means of responses to PCNB survey items by the respondents who were already in the maintenance stage. The main reason behind this can be the type of behaviour and population in the current study. The use of active transport modes is an essential part of the majority of students’ daily travel routine despite their lack of motivation for it. Previous studies show higher percentages of university students have reported active travel [72,73].
The overall component loadings were lower than those recorded by a previous study [35,56]. Table 3 shows the factor loadings of all twenty survey items of URICA. One of the survey items from the action stage (U4) is loaded better on the maintenance stage than on the action stage. Likewise, two survey items related to the preparation stage (U14 and U23) are better loaded on contemplation and action stages, respectively. Lerdal et al. (2009) observed a similar result in terms of factor loadings. For instance, the factor loadings for preparation-related items (U14 and U23) were observed relatively lower than the other two survey items. Correspondingly, the same was true for the survey item relating to the action stage (Q4UA). It was also observed that only one survey item related to action loaded more significantly on the maintenance stage. This contrasts with the findings of Lerdal et al. (2009), where all items associated with the action and maintenance stages were represented by a single factor. The explanation provided in that study was that the concepts underlying responses related to action involved the notion of ‘keeping up with exercise,’ which could then be linked to the idea of the maintenance stage. Moreover, the translation of the questionnaire into Norwegian influenced the phrasing of question items, contributing to the observed result. A similar phenomenon might have occurred in the current study. For instance, the phrasing of certain question items was, in some cases, quite similar, such as “I am finally regularly increasing physical activity levels by using active transport modes” (U4 from URICA) and “I have been increasing my physical activity levels by using active transport modes for a long time and I plan to continue” (Q2 from URICA, maintenance). The former item loaded more heavily on the component corresponding to the maintenance stage. The same situations are true for the items related to the preparation stage. The remaining items presenting the preparation stage (U17 and U20 from URICA) both include planning activity with a friend so probably this factor is more representative of a new factor (e.g., preparing with social circle) than the preparatory stage itself. We performed various Confirmatory Factor Analyses (CFAs) using URICA’s twenty survey items for active transport modes use. The indicators of the model fit were deemed satisfactory, with Goodness-of-Fit Indices exceeding 0.9, Tucker-Lewis Index surpassing 0.9, and the standardized Root-Mean-Square Residual (RMSR) below 0.05, along with a Root-Mean-Square Error of Approximation (RMSEA) below 0.08 [58,74]. The three above-mentioned items related to action and preparation stages were excluded. This suggests the potential need for a reassessment of the language and phrasing, particularly in the double-back translation process, for subsequent questionnaires in both the English and Dutch versions. This consideration aims to ensure the linguistic accuracy and cultural equivalence of the items, warranting further attention to enhance the reliability and validity of the measurement instrument.

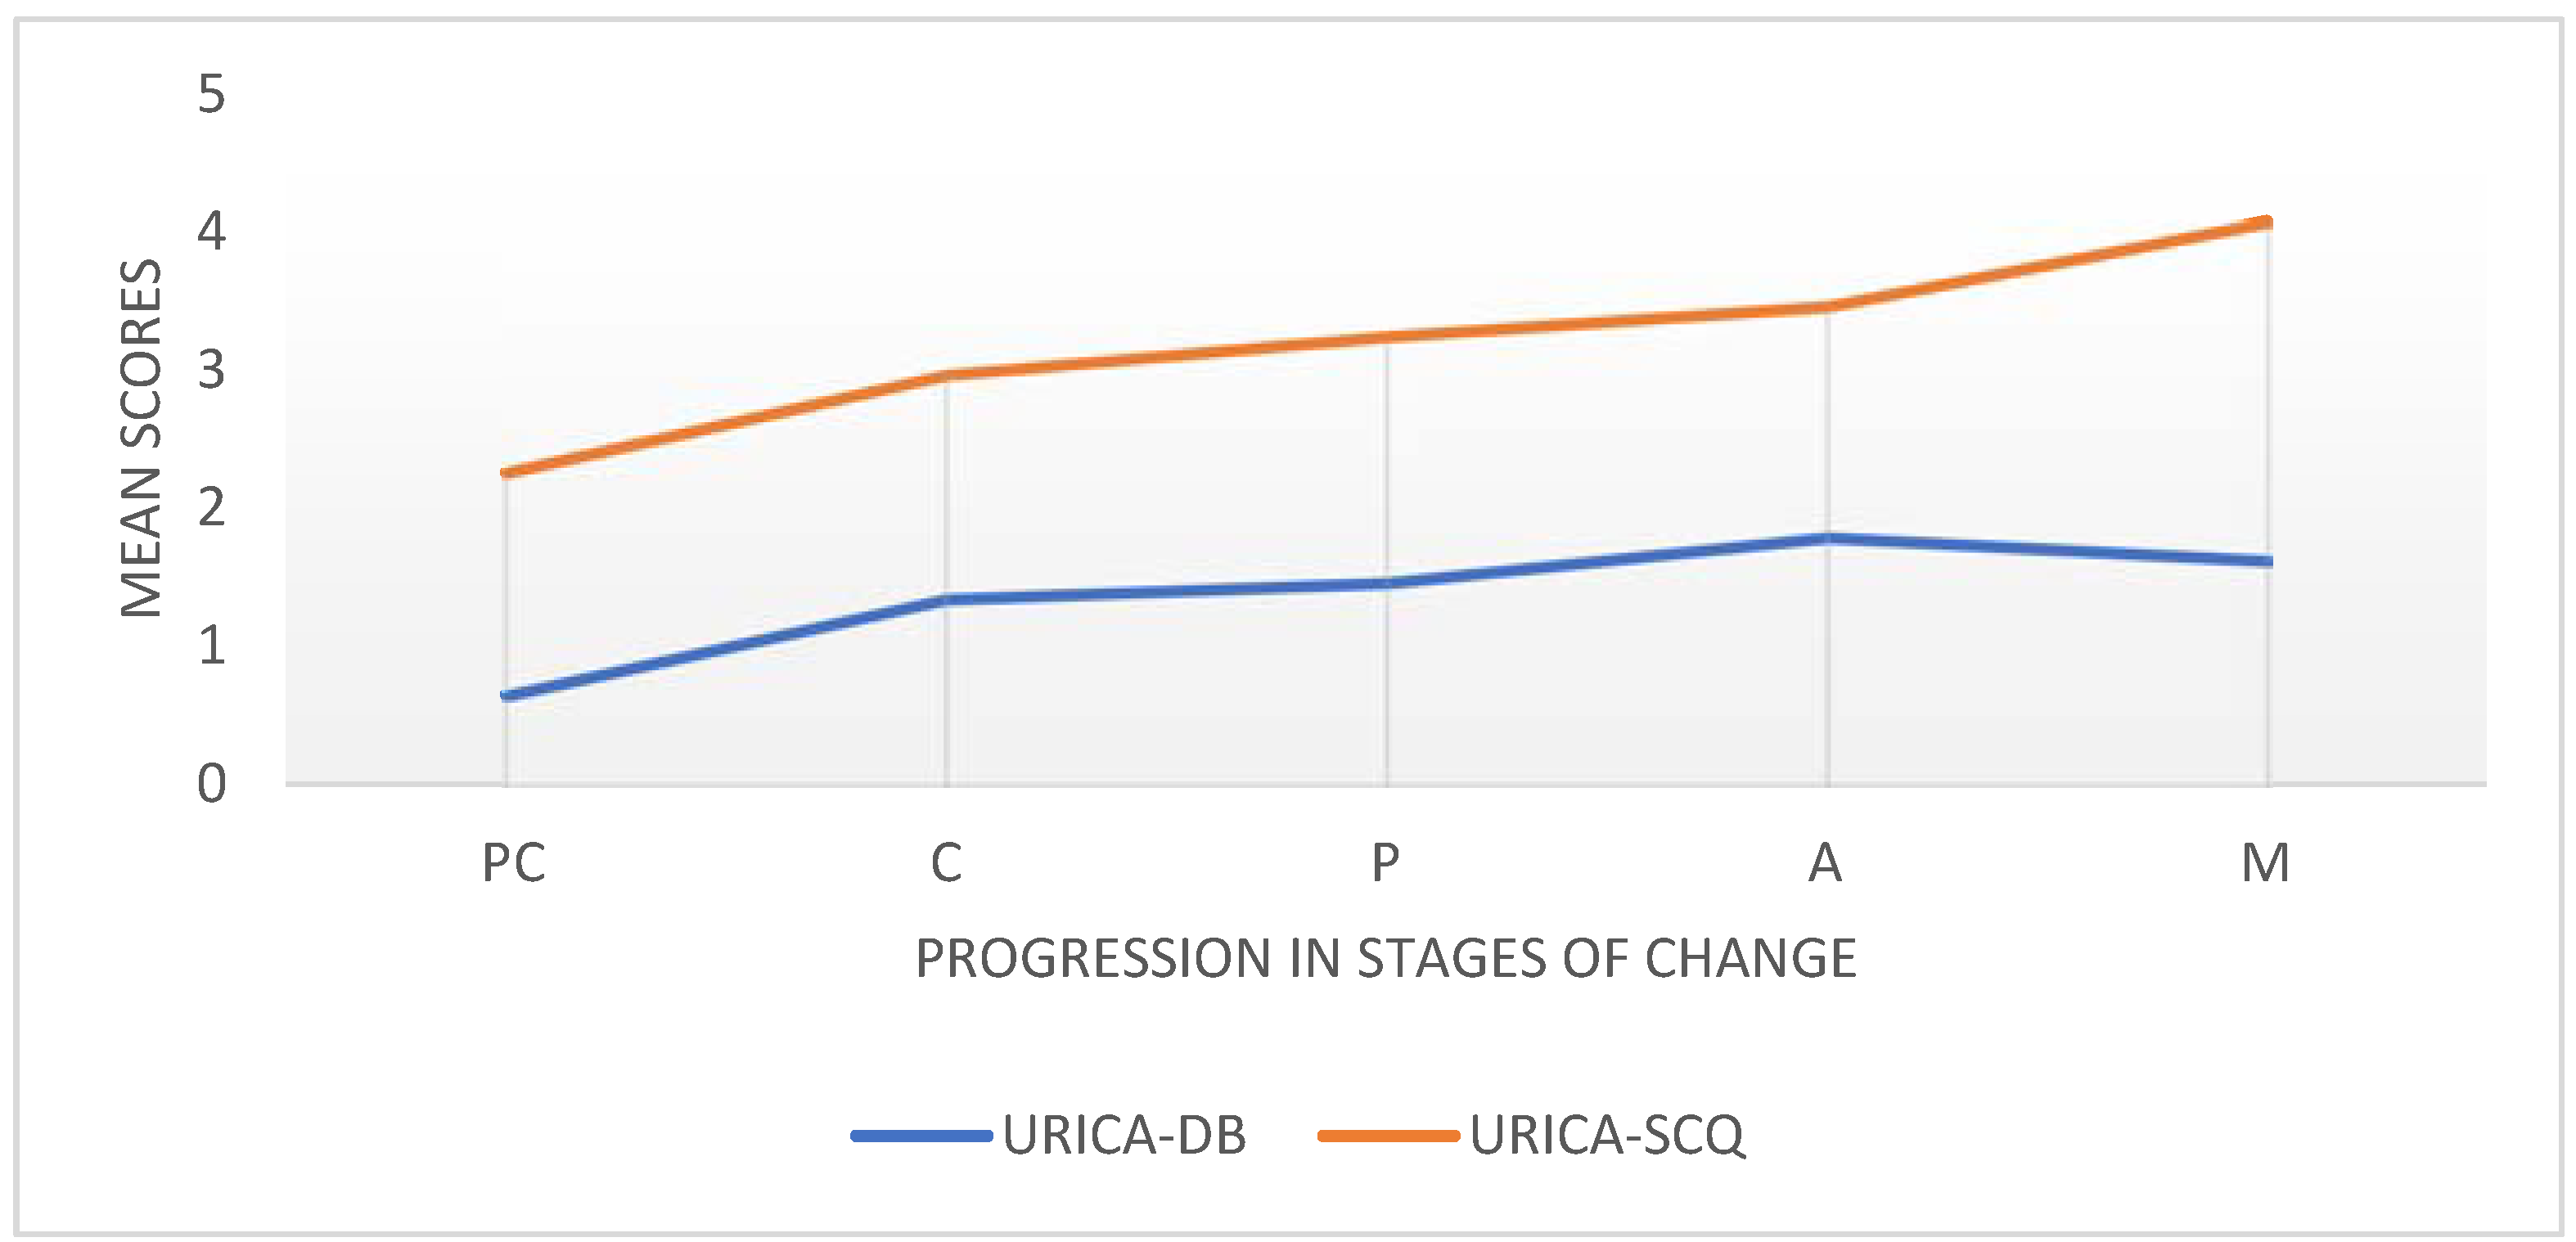
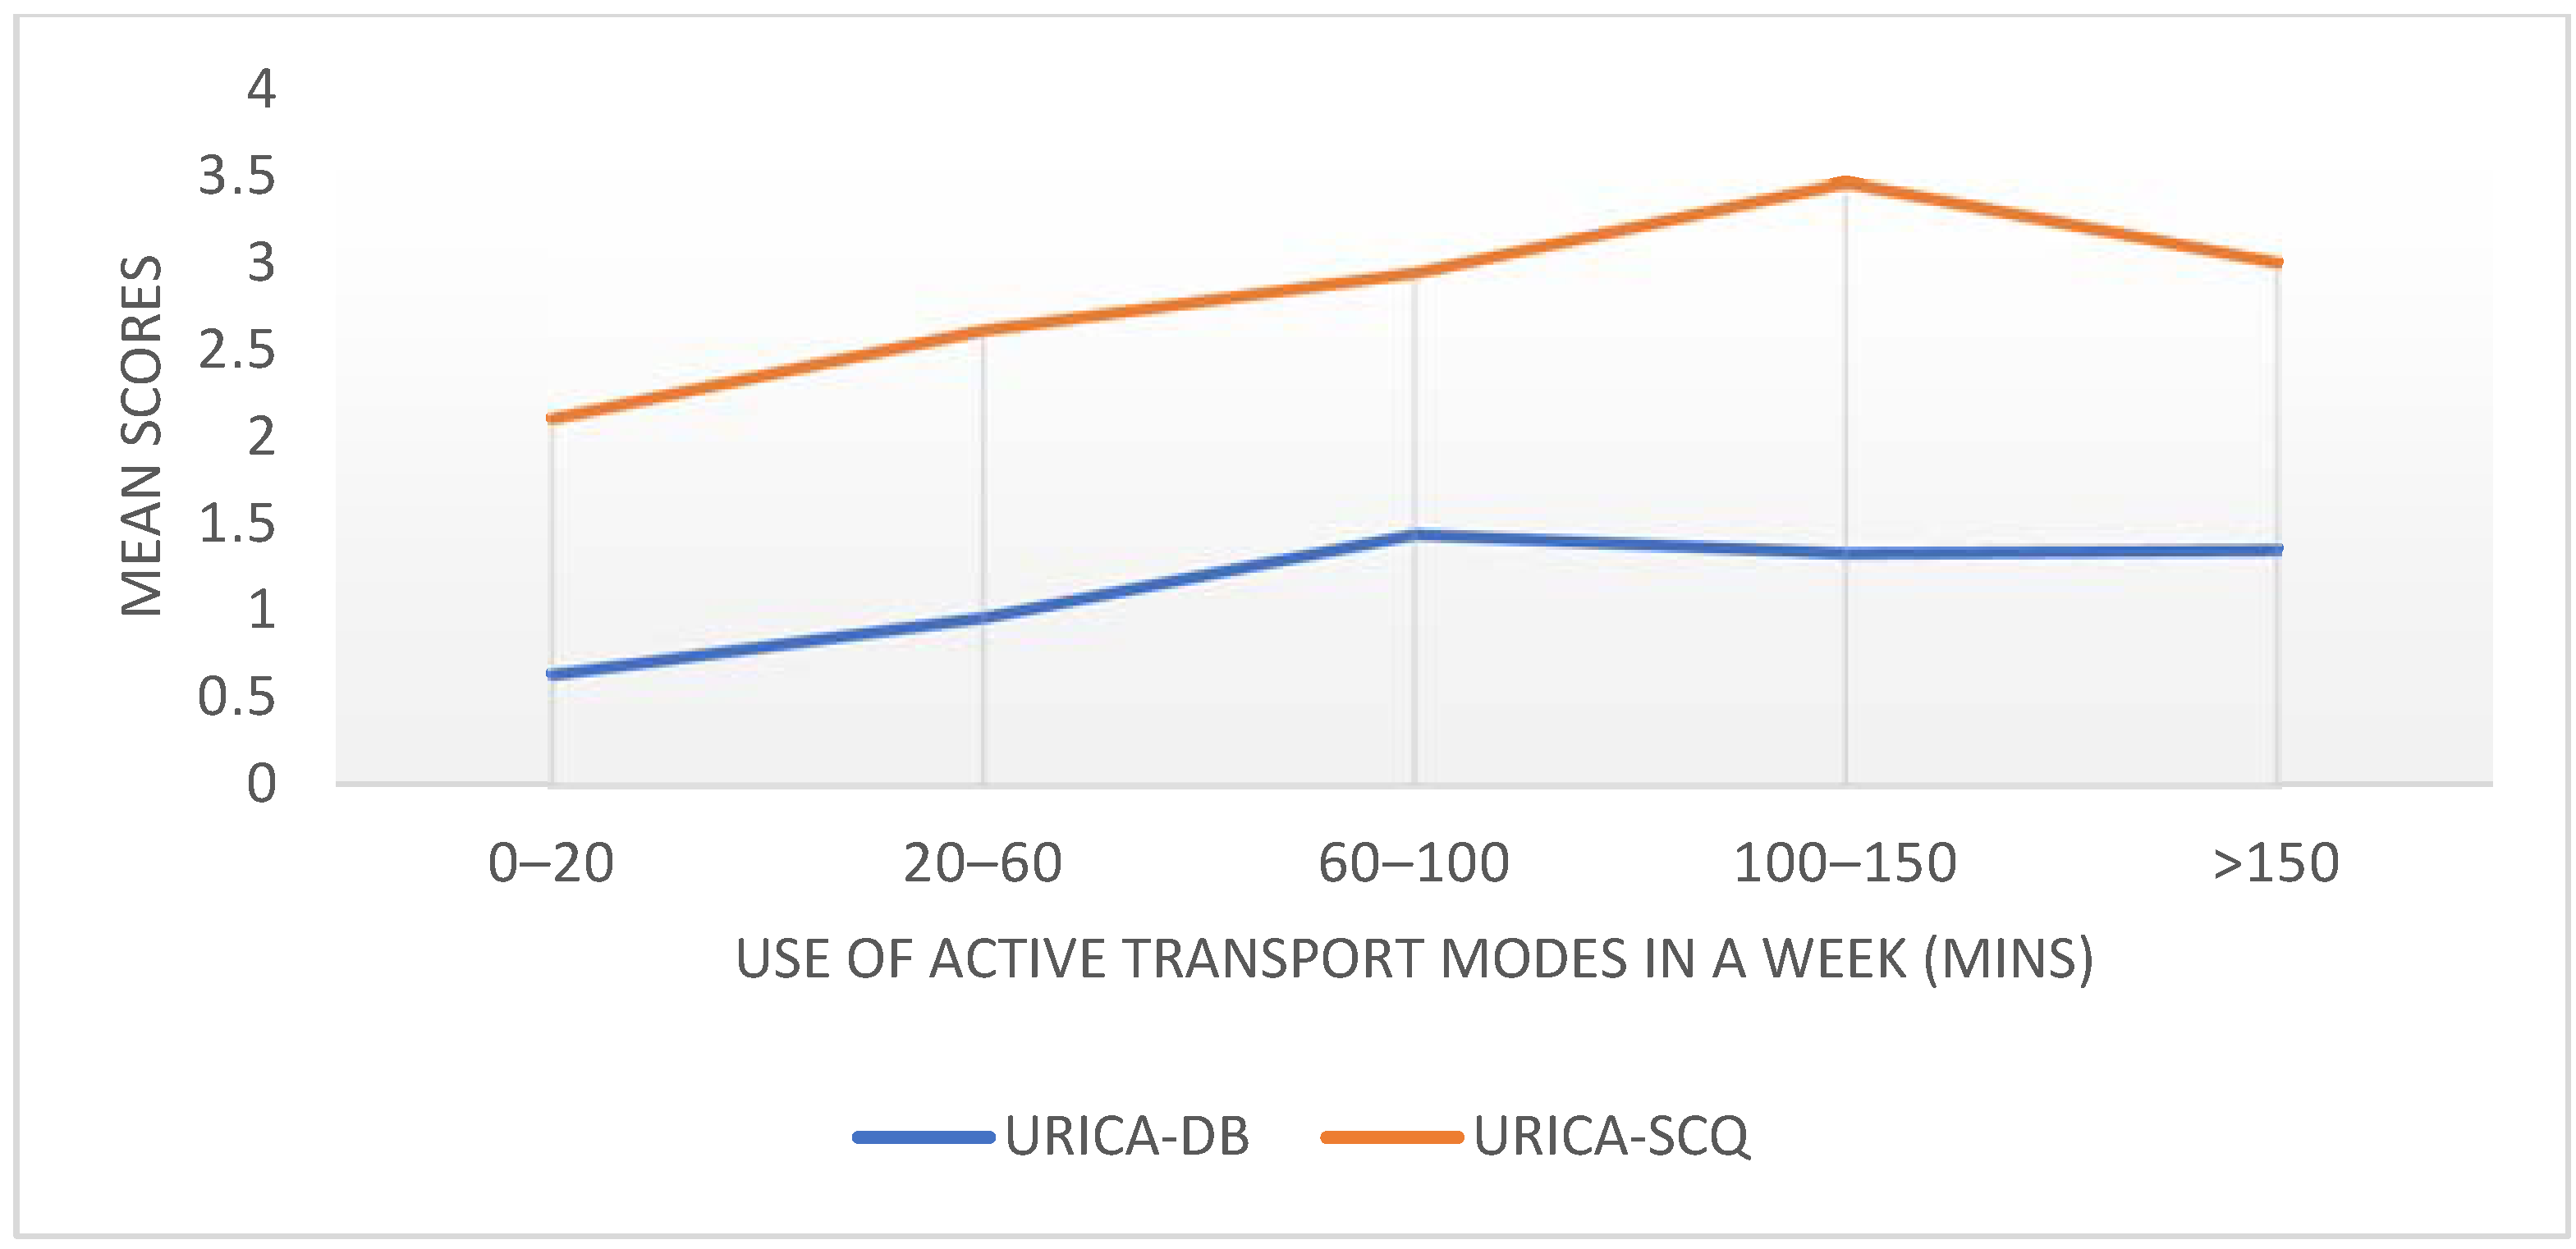
5.2. Decisional Balance and Self-Efficacy across SOCs and Use of Active Transport Mode Behaviour

In agreement with the assumption of TTM, the mean scores of DBI and SCQ increase with the progress in the later stages as well as with increased use of active transport modes. Furthermore, post hoc analyses showed a separating of the earlier stages from the later stages. The scores for DB pros have been observed to increase from the contemplation or preparation stages in previous research [32]. This observation suggests that individuals may adjust their attitudes toward a behaviour before actually making the change [22]. Therefore, the increasing pattern in Decisional Balance (DBI) scores across Transtheoretical Model (TTM) stages aligns with the theory, indicating that individuals undergo an attitude change before initiating behaviour change. A similar pattern is noted in self-efficacy, implying that individuals experience a boost in confidence related to the target behaviour as they advance through the stages. Moreover, it was also confirmed that the positive perception of pros (advantages) and cons (disadvantages) of behaviour and self-efficacy of enacting behaviour are both linked to the higher use of active transport modes. Finally, the significant correlation between the categories of self-reported behaviour and TTM stage allocation by URICA was positive indicating that SOCs can determine the use of active transport modes. As already explained in the introduction, the studies using TTM in the use of active transportation behaviour typically used staging algorithms, which allocate the individual in discrete SOCs [45,49,50]. In this case, to the best knowledge of the authors, the significant association of continuous measure URICA-based SOCs with the use of active transport is a unique finding.
The URICA, as a continuous measure, enables individuals to attain high scores on one stage while concurrently achieving scores on other subscales. This arguably mirrors the fluctuating nature of, in this instance, physical activity (PA) through active transport. Such an approach may align with the notion of engaging in active modes that depend on various external factors like weather, access, and health, among others [75]. To bridge the gap created by constraints, future research could consider incorporating real-time or ecological momentary assessment methods. These approaches capture individuals’ experiences in the context of their daily lives, providing a more nuanced understanding of how external factors influence their readiness to engage in active transportation. An individual might continuously cycle through the stages, contingent on their life circumstances. Notably, previous applications of the Transtheoretical Model (TTM) have primarily focused on individuals committing to discontinuing a behaviour rather than initiating a new one [35]. Therefore, starting or improving the use of active transport modes might consist of different underlying change mechanisms and stages of the model.
The successful application of TTM to the use of active transport modes can help highlight the underlying motivation factors to predict behavioural change. This study validates that the individual perception of the pros, cons, and self-efficacy of being physically active can influence the use of active transport modes. The URICA can be useful in identifying the different profiles based on the motivation stages to ensure sufficient use of active transport and consequent physical activity and alignment with the sustainable development goals. This study underscores the significance of population segmentation and the application of customized behavioural processes to facilitate effective change. A pertinent example supporting the efficacy of population segmentation and the applicability of the three-stage Transtheoretical Model (TTM) in the context of active transport is derived from a study conducted in Stockholm. This study validated the three-stage TTM model specifically for bicycle use. The findings underscored the utility of understanding distinct motivational profiles and tailoring interventions to individuals in the pre-motivation, motivation, and volition stages, providing empirical support for the effectiveness of targeted strategies in promoting bicycle use in urban environments [76]. The utility of the Transtheoretical Model (TTM) in behaviour change extends beyond active transport; it can also be applied, for instance, in promoting sustainable travel behaviour through smartphones [77] and advocating for sustainable driving [78].

5.3. Limitations and Future Directions

This study has two main limitations: the use of a convenience sample, with the majority being students, and reliance on a self-report measure of behaviour. To address these limitations, future studies are recommended to test the URICA for the use of active transport modes in a more diverse population, possibly with an even larger sample size. Introducing an objective measure and incorporating an element of concurrent validity could enhance the robustness of testing.
Despite the back-translation procedure, some of the URICA questions might be somewhat confusing, especially when translated into Dutch. Therefore, it is suggested to employ a more collaborative and iterative approach [79] to identify redundant items in the URICA scale. This approach can help refine the questionnaire and im-prove its clarity and applicability across different language versions. A recommendation for future intervention design would be to identify the behaviour change techniques relevant to POC and further extend the utility of TTM in the use of active transport modes. It can also highlight the requirement for designing need-based tailored interventions to achieve effective enactment of behaviour [40,80].

6. Conclusions

The outcomes of this study bear significance for individuals and societies alike, as the promotion of active transportation emerges as a key driver toward attaining the health and sustainability goals of global cities. More importantly, this study adds to the comprehension of active transport modes, recognized for their potential in mitigating the advancement of numerous chronic diseases, while also addressing pressing environmental issues like congestion and emissions. In particular, the findings imply that the URICA can effectively discern respondents’ change profiles across various stages. The participants of the study were categorised into five SOCs defined in TTM as pre-contemplation, contemplation, preparation, action, and maintenance. Well-known assumptions concerning the TTM framework were confirmed in the current study. The DB and self-efficacy of the use of active transport modes behaviour increase as individuals progress through the stages. The same is also true for the self-reported level of the use of active transport modes to increase physical activity. In summary, these observations hold the potential to not only predict the likelihood of respondents changing their active travel behaviours but also to pinpoint appropriate and customized behaviour change strategies aimed at enhancing travel-related physical activity. Modifications to the URICA instrument items could enhance its applicability for future studies in more diverse populations.

Author Contributions

T.B.: Writing—Original Draft, conceptualization, methodology, software, investigation, resources, formal analysis, data curation, visualization; V.R. and K.B.: Conceptualization, supervision, resources, validation, methodology, Writing—Review and Editing; J.V.B.: Writing—Original Draft, conceptualization, methodology, investigation; A.N., P.D., D.J. and G.W.: Writing—Review and Editing, resources, validation. All authors have read and agreed to the published version of the manuscript.

Funding

This work was supported by the Higher Education Commission, Pakistan (three years) and the Special Research Fund (BOF) of Hasselt University (fourteen months). The funding sources had no role in study design, in the collection, analysis, and interpretation of data, in the writing of the report, and in the decision to submit the article for publication.

Institutional Review Board Statement

The study was conducted in accordance with the ethical advice of the Social-Societal Ethics Committee (SSEC) at Hasselt University with protocol approval REC/S M ECIV RAI/T89/122 on 4 March 2019.

Informed Consent Statement

Informed consent was obtained from all subjects involved in this study.

Data Availability Statement

The data presented in this study are available on request from the corresponding author. The data are not publicly available due to ethical advice provided by SSEC commission.

Acknowledgments

I would like to acknowledge Geert Wets and Paul Dendale for providing the opportunity to work on this research topic. I am thankful for the cooperation of the administration staff and especially Nadine Smeyers who has provided her assistance in the translation of the documents.

Conflicts of Interest

The authors declare no conflicts of interest. The funders had no role in the design of the study, in the collection, analyses, or interpretation of data, in the writing of the manuscript, or in the decision to publish the results.

Abbreviations

TTMTranstheoretical Model
RTCReadiness to Change
SOCsStages of Change
URICAThe University of Rhode Island Change Assessment
POCsProcesses of Change
DBDecisional Balance
PCNBPre-contemplation Non-believer
PCBPre-contemplation Believer
SCQSituational Confidence Questionnaire
ANOVAAnalysis of Variance
EFAExploratory Factor Analysis

Appendix A. Demographic Questionnaire

Please answer all the following questions as they describe you by circling the relevant option. Write brief answers where requested.

Appendix A.1. Definition

Travel Mode: The type of transport you use to go from point A to point B. Example: car, cycle, walking, public transport.
Table A1. Descriptive questions.
QuestionAnswer
1.What is your gender?Male
Female
Other
2.Please indicate your age (years).e.g., 2001
3.What is your current occupation?Student(full-time)
Employed/own business (full-time)
Neither
4.Where do you currently live (during the week)?Hasselt
Diepenbeek
Greater Limburg area
Other________ (please state)
5.What is your highest level of education?Secondary School general academic program
Technical Secondary School
Higher education-Not University
University Degree
6.Do you own or have regular access to a form of motorised transport (car, motorbike, scooter)?Yes
No
7.Do you have an illness or disability that would make it difficult for you to travel (between work/school, etc.) independently?Yes
No
8.What is the primary way in which you travel to work, school, or any other regular activities (e.g. shopping, errands, etc.)?Car
Public transport
Cycling
Walking
Walking and/or cycling combined with public transport.
9.Within 7 days, how many minutes do you spend using active transport?0–20 min
20–60 min
60–100 min
100–150 min
150 min+
10.Briefly explain why you use a particular travel mode.
For example, why do you bike/walk/drive or use public transport regularly?

Appendix A.2. The University of Rhode Island Change Assessment (URICA)

The questionnaire is designed to identify how you personally feel about your current levels of physical activity from using active transport modes. Please think about your current situation and travel habits, even if you primarily make use of active transport modes. Read each question below carefully, and then decide whether you agree or disagree with the statements.
Please enter the number in the right-hand column that indicates how strongly you agree or disagree with the following statements.
  • 1 = Strongly Disagree
  • 2 = Disagree
  • 3 = Undecided
  • 4 = Agree
  • 5 = Strongly Agree

Appendix A.3. Definitions

Appendix A.3.1. What Is Physical Activity?

This is energy expenditure by way of bodily movement. This can include exercise as well as any kind of physical work or domestic chores (cleaning, gardening, childcare, shopping, etc.). Transport-related activity (walking, cycling, accessing public transport) is also included as part of physical activity.

Appendix A.3.2. What Are Active Transport Modes?

Active Transport Modes in this case are defined primarily as ways of going from A to B that require some degree of physical exertion. Examples of Active Transport Modes are cycling, walking, or even using a combination of active and public transport where one would be required to walk or cycle for 10 min or longer.
Table A2. URICA for use of active transport modes.
Item No.URICA for Use of Active Transport ModesLikert Scale
1As far as I am concerned, I do not need to increase my physical activity levels by using active transport modes.1–5
2I have been increasing my physical activity levels by using active transport modes for a long time and I plan to continue.1–5
3I am not increasing my physical activity levels by using active transport right now and I do not care.1–5
4I am finally regularly increasing physical activity levels by using active transport modes.1–5
5I have been successful at increasing my physical activity levels by using active transport modes and I plan to continue.1–5
6I am satisfied with not increasing my physical activity levels by using active transport modes.1–5
7I have been thinking that I might want to start increasing my physical activity levels by using active transport modes on a more regular basis.1–5
8I have started regularly increasing my physical activity levels by using active transport modes within the last 6 months.1–5
9I could increase my physical activity levels by using active transport, but I do not plan to do so.1–5
10Recently, I have started to increase my physical activity levels by using active transport modes.1–5
11I do not have the time or energy to increase my physical activity levels by using active transport modes right now.1–5
12I have started to increase my physical activity levels by using active transport modes right now, and I plan to continue.1–5
13I have been thinking about whether I will be able to increase my physical activity levels by using active transport modes.1–5
14I have set up a plan of how to increase my physical activity levels by using active transport modes over the next few weeks.1–5
15I have managed to increase my physical activity levels by using active transport modes over the last 6 months.1–5
16I have been thinking that I may want to begin increasing my physical activity levels by using active transport modes.1–5
17I have organised with a friend so that we can start increasing our physical activity levels by using active transport modes within the next few weeks.1–5
18I have increased my physical activity levels by using active transport modes for the last 6 months.1–5
19I know that increasing my physical activity levels by using active transport modes is worthwhile, but I do not have time for it in the near future.1–5
20I have been calling friends to find someone to start increasing physical activity levels by using active transport modes with over the next few weeks.1–5
21I think increasing physical activity levels by using active transport modes is good, but I cannot fit it into my schedule right now.1–5
22I really think I should work on getting started with increasing my physical activity levels through using active transport modes over the next 6 months.1–5
23I am preparing to start increasing my physical activity though using active transport modes in the next few weeks.1–5
24I am aware of the importance of increasing my physical activity through using active transport modes but I cannot do it right now.1–5

Appendix A.4. Scoring

  • Precontemplation (non-believers in exercise) items: 1, 3, 6, 9
  • Precontemplation (believers in exercise) items: 11, 19, 21, 24
  • Contemplation items: 7, 13, 16, 22
  • Preparation items: 14, 17, 20, 23
  • Action items: 4, 8, 10, 12
  • Maintenance items: 2, 5, 15, 18

Appendix A.5. Decisional Balance Scale

Each statement represents a thought that might occur to a person who is deciding whether or not to increase their physical activity levels through Active Transport. Please indicate how IMPORTANT each of these statements might be to you if you were considering a decision to use Active Transport for daily travel. There are FIVE possible responses to each of the items that reflect your answer to the question “How important would this be to you?” Please circle the number that best describes how important each statement would be to you if you were deciding whether or not to use active transport.
1 = Not important at all, 2 = Slightly important, 3 = Moderately important, 4 = Very important, 5 = Extremely important.
Please read each statement and fill in the number in the right-hand side column to indicate how you rate its level of importance as it relates to your deciding whether to increase your physical activity levels through active transport.
Table A3. Decision Balance Index survey items.
No.DBI Survey ItemsLikert Scale
1.I would feel healthier and have more energy if I increased my physical activity levels through active transport modes.1–5
2.I would feel embarrassed if people saw me increasing my physical activity levels by using active transport modes.1–5
3.I would feel less stressed if I increased my physical activity levels through active transport modes.1–5
4.Increasing my physical activity levels through active transport modes would be inconvenient.1–5
5.I would save money if I increased my physical activity levels through active transport modes. 1–5
6.I would feel unsafe on the road if I were to increase my physical activity levels through active transport modes.1–5
7.I would avoid time spent in traffic if I increased my physical activity levels through active transport modes.1–5
8.My choice of clothing would be affected if I were to increase my physical activity levels through active transport modes.1–5
9.I would enjoy my environment (city, town, etc.) if I increased my physical activity levels through active transport modes.1–5
10.I would find certain tasks like shopping more difficult if I increased my levels of physical activity through active transport modes.1–5
Scoring: 1,3,5,7,9 pros; 2,4,6,8,10 cons.

Appendix A.6. Situational Confidence Questionnaire: Increasing Physical Activity through Active Transport Modes

Each statement represents a scenario in which you do or do not perceive it to be possible to increase your physical activity levels through active transport. There are FIVE possible responses to each of the items that reflect your answer to the question. The scale ranges from 1 (not confident at all) to 5 (completely confident).
1 = Not confident at all, 2 = slightly confident, 3 = somewhat confident, 4 = fairly confident, 5 = completely confident
Please read each statement and fill in the number in the right-hand column that corresponds with the level of confidence you feel relative to the scenario described in the statement.
Table A4. Situational Confidence Questionnaire (SCQ).
No.SCQ Survey ItemsLikert Scale
1.I can increase my physical activity levels by using active transport on most days.1–5
2.I can ask a friend or family member to join me as I increase my physical activity levels by using active transport.1–5
3.I can increase my physical activity levels by using active transport on most days even if I could choose a motorised transport mode instead.1–5
4.I can increase my physical activity levels by using active transport during varying weather conditions (rain, high temperatures, low temperatures, snow, etc.)1–5
5.I can increase my physical activity levels by using active transport when I am very busy.1–5
6.I can increase my physical activity levels by using active transport when carrying out different types of trips (e.g., to work/school/shopping/social).1–5

References

  1. Mueller, N.; Rojas-Rueda, D.; Cole-Hunter, T.; de Nazelle, A.; Dons, E.; Gerike, R.; Götschi, T.; Int Panis, L.; Kahlmeier, S.; Nieuwenhuijsen, M. Health Impact Assessment of Active Transportation: A Systematic Review. Prev. Med. 2015, 76, 103–114. [Google Scholar] [CrossRef] [PubMed]
  2. Pérez, K.; Olabarria, M.; Rojas-Rueda, D.; Santamariña-Rubio, E.; Borrell, C.; Nieuwenhuijsen, M. The Health and Economic Benefits of Active Transport Policies in Barcelona. J. Transp. Health 2017, 4, 316–324. [Google Scholar] [CrossRef]
  3. Brand, C.; Götschi, T.; Dons, E.; Gerike, R.; Anaya-Boig, E.; Avila-Palencia, I.; de Nazelle, A.; Gascon, M.; Gaupp-Berghausen, M.; Iacorossi, F.; et al. The Climate Change Mitigation Impacts of Active Travel: Evidence from a Longitudinal Panel Study in Seven European Cities. Glob. Environ. Chang. 2021, 67, 102224. [Google Scholar] [CrossRef]
  4. THE 17 GOALS|Sustainable Development. Available online: https://sdgs.un.org/goals (accessed on 8 November 2023).
  5. Lowe, M.; Adlakha, D.; Sallis, J.F.; Salvo, D.; Cerin, E.; Moudon, A.V.; Higgs, C.; Hinckson, E.; Arundel, J.; Boeing, G.; et al. City Planning Policies to Support Health and Sustainability: An International Comparison of Policy Indicators for 25 Cities. Lancet Glob. Health 2022, 10, e882–e894. [Google Scholar] [CrossRef]
  6. Musich, S.; Wang, S.S.; Hawkins, K.; Greame, C. The Frequency and Health Benefits of Physical Activity for Older Adults. Popul. Health Manag. 2017, 20, 199–207. [Google Scholar] [CrossRef]
  7. Wahid, A.; Manek, N.; Nichols, M.; Kelly, P.; Foster, C.; Webster, P.; Kaur, A.; Friedemann Smith, C.; Wilkins, E.; Rayner, M.; et al. Quantifying the Association Between Physical Activity and Cardiovascular Disease and Diabetes: A Systematic Review and Meta-Analysis. J. Am. Heart Assoc. 2016, 5, e002495. [Google Scholar] [CrossRef]
  8. Kokkinos, P.; Sheriff, H.; Kheirbek, R. Physical Inactivity and Mortality Risk. Cardiol. Res. Pract. 2011, 2011, 924945. [Google Scholar] [CrossRef]
  9. Fagard, R.H. Physical Activity, Fitness and Mortality. J. Hypertens. 2012, 30, 1310–1312. [Google Scholar] [CrossRef]
  10. Wanner, M.; Götschi, T.; Martin-Diener, E.; Kahlmeier, S.; Martin, B.W. Active Transport, Physical Activity, and Body Weight in Adults a Systematic Review. Am. J. Prev. Med. 2012, 42, 493–502. [Google Scholar] [CrossRef]
  11. Kelly, P.; Kahlmeier, S.; Götschi, T.; Orsini, N.; Richards, J.; Roberts, N.; Scarborough, P.; Foster, C. Systematic Review and Meta-Analysis of Reduction in All-Cause Mortality from Walking and Cycling and Shape of Dose Response Relationship. Int. J. Behav. Nutr. Phys. Act. 2014, 11, 132. [Google Scholar] [CrossRef]
  12. Götschi, T.; Garrard, J.; Giles-Corti, B. Cycling as a Part of Daily Life: A Review of Health Perspectives. Transp. Rev. 2016, 36, 45–71. [Google Scholar] [CrossRef]
  13. World Health Organization. Physical Activity; World Health Organization: Geneva, Switzerland, 2022. [Google Scholar]
  14. Attard, M.; Shiftan, Y. Sustainable Urban Transport; Emerald: New York, NY, USA, 2015; ISBN 9781784416164. [Google Scholar]
  15. European Commission. A European Green Deal; European Commission: Brussels, Belgium, 2020; Available online: https://commission.europa.eu/strategy-and-policy/priorities-2019-2024/european-green-deal_en (accessed on 22 November 2023).
  16. THE PEP: Building forward Better by Transforming to New Clean Safe Healthy and Inclusive Mobility and Transport, December 2022, WHO/Europe. Available online: https://www.who.int/europe/publications/m/item/building-forward-better-by-transforming-to-new-clean-safe-healthy-and-inclusive-mobility-and-transport (accessed on 22 December 2023).
  17. Sum4all. Global Tracking Framework 2.0; Sum4all: Washington, DC, USA, 2022. [Google Scholar]
  18. Gourlan, M.; Bernard, P.; Bortolon, C.; Romain, A.J.; Lareyre, O.; Carayol, M.; Ninot, G.; Boiché, J. Efficacy of Theory-Based Interventions to Promote Physical Activity. A Meta-Analysis of Randomised Controlled Trials. Health Psychol. Rev. 2016, 10, 50–66. [Google Scholar] [CrossRef] [PubMed]
  19. Short, C.E.; James, E.L.; Plotnikoff, R.C.; Girgis, A. Efficacy of Tailored-Print Interventions to Promote Physical Activity: A Systematic Review of Randomised Trials. Int. J. Behav. Nutr. Phys. Act. 2011, 8, 113. [Google Scholar] [CrossRef] [PubMed]
  20. Arnott, B.; Rehackova, L.; Errington, L.; Sniehotta, F.F.; Roberts, J.; Araujo-Soares, V. Efficacy of Behavioural Interventions for Transport Behaviour Change: Systematic Review, Meta-Analysis and Intervention Coding. Int. J. Behav. Nutr. Phys. Act. 2014, 11, 133. [Google Scholar] [CrossRef] [PubMed]
  21. Johnson, S.S.; Paiva, A.L.; Cummins, C.O.; Johnson, J.L.; Dyment, S.J.; Wright, J.A.; Prochaska, J.O.; Prochaska, J.M.; Sherman, K. Transtheoretical Model-Based Multiple Behavior Intervention for Weight Management: Effectiveness on a Population Basis. Prev. Med. 2008, 46, 238–246. [Google Scholar] [CrossRef] [PubMed]
  22. Prochaska, J.O. Decision Making in the Transtheoretical Model of Behavior Change. Med. Decis. Mak. 2008, 28, 845–849. [Google Scholar] [CrossRef]
  23. Han, H.; Gabriel, K.P.; Kohl, H.W. Application of the Transtheoretical Model to Sedentary Behaviors and Its Association with Physical Activity Status. PLoS ONE 2017, 12, e0176330. [Google Scholar] [CrossRef]
  24. Casey, S.; Day, A.; Howells, K. The Application of the Transtheoretical Model to Offender Populations: Some Critical Issues. Leg. Criminol. Psychol. 2005, 10, 157–171. [Google Scholar] [CrossRef]
  25. Xu, L.; Mao, Z. Psychological Factor and Its Structure Influencing the Change of Exercise Behavior of Chinese Adult Community Residents: A TTM-Based Study. Int. J. Sport Exerc. Psychol. 2012, 10, 251–275. [Google Scholar] [CrossRef]
  26. Baumann, S.; Gaertner, B.; Schnuerer, I.; Bischof, G.; John, U.; Freyer-Adam, J. How Well Do TTM Measures Work among a Sample of Individuals with Unhealthy Alcohol Use That Is Characterized by Low Readiness to Change? Psychol. Addict. Behav. 2013, 27, 573–583. [Google Scholar] [CrossRef]
  27. Cahill, K.; Lancaster, T.; Green, N. Stage-based Interventions for Smoking Cessation. Cochrane Database Syst. Rev. 2010, 83, 524. [Google Scholar] [CrossRef] [PubMed]
  28. Friman, M.; Huck, J.; Olsson, L.E. Transtheoretical Model of Change during Travel Behavior Interventions: An Integrative Review. Int. J. Environ. Res. Public Health 2017, 14, 581. [Google Scholar] [CrossRef] [PubMed]
  29. Biehl, A.; Ermagun, A.; Stathopoulos, A. Modelling Determinants of Walking and Cycling Adoption: A Stage-of-Change Perspective. Transp. Res. Part F Traffic Psychol. Behav. 2018, 58, 452–470. [Google Scholar] [CrossRef]
  30. Prochaska, J.O.; DiClemente, C.C.; Velicer, W.F.; Rossi, J.S. Standardized, Individualized, Interactive, and Personalized Self-Help Programs for Smoking Cessation. Health Psychol. 1993, 12, 399–405. [Google Scholar] [CrossRef] [PubMed]
  31. Romain, A.J.; Bernard, P.; Hokayem, M.; Gernigon, C.; Avignon, A. Measuring the Processes of Change from the Transtheoretical Model for Physical Activity and Exercise in Overweight and Obese Adults. Am. J. Health Promot. 2016, 30, 272–278. [Google Scholar] [CrossRef] [PubMed]
  32. Sutton, S. Back to the Drawing Board? A Review of Applications of the Transtheoretical Model to Substance Use. Addiction 2001, 96, 175–186. [Google Scholar] [CrossRef]
  33. Prochaska, J.O.; DiClemente, C.C. Stages and Processes of Self-Change of Smoking: Toward an Integrative Model of Change. J. Consult. Clin. Psychol. 1983, 51, 390–395. [Google Scholar] [CrossRef]
  34. Romain, A.J.; Bortolon, C.; Gourlan, M.; Carayol, M.; Decker, E.; Lareyre, O.; Ninot, G.; Boiché, J.; Bernard, P. Matched or Nonmatched Interventions Based on the Transtheoretical Model to Promote Physical Activity. A Meta-Analysis of Randomized Controlled Trials. J. Sport Health Sci. 2018, 7, 50–57. [Google Scholar] [CrossRef]
  35. Lerdal, A.; Moe, B.; Digre, E.; Harding, T.; Kristensen, F.; Grov, E.K.; Bakken, L.N.; Eklund, M.L.; Ruud, I.; Rossi, J.S. Stages of Change--Continuous Measure (URICA-E2): Psychometrics of a Norwegian Version. J. Adv. Nurs. 2009, 65, 193–202. [Google Scholar] [CrossRef]
  36. Prochaska, J.O.; Velicer, W.F. The Transtheoretical Model of Health Behavior Change. Am. J. Health Promot. 1997, 12, 38–48. [Google Scholar] [CrossRef]
  37. Nigg, C.; Hellsten, L.; Norman, G.; Braun, L.; Breger, R.; Burbank, P.; Coday, M.; Elliot, D.; Garber, C.; Greaney, M.; et al. Physical Activity Staging Distribution: Establishing a Heuristic Using Multiple Studies. Ann. Behav. Med. 2005, 29, 35–45. [Google Scholar] [CrossRef] [PubMed]
  38. Bernard, P.; Romain, A.-J.; Trouillet, R.; Gernigon, C.; Nigg, C.; Ninot, G. Validation of the TTM Processes of Change Measure for Physical Activity in an Adult French Sample. Int. J. Behav. Med. 2014, 21, 402–410. [Google Scholar] [CrossRef] [PubMed]
  39. Prochaska, J.O.; Wright, J.A.; Velicer, W.F. Evaluating Theories of Health Behavior Change: A Hierarchy of Criteria Applied to the Transtheoretical Model. Appl. Psychol. 2008, 57, 561–588. [Google Scholar] [CrossRef]
  40. Romain, A.J.; Caudroit, J.; Hokayem, M.; Bernard, P. Is There Something beyond Stages of Change in the Transtheoretical Model? The State of Art for Physical Activity. Can. J. Behav. Sci. 2018, 50, 42–53. [Google Scholar] [CrossRef]
  41. Ma, J.; Betts, N.M.; Horacek, T.; Georgiou, C.; White, A.; Nitzke, S. The Importance of Decisional Balance and Self-Efficacy in Relation to Stages of Change for Fruit and Vegetable Intakes by Young Adults. Am. J. Health Promot. 2016, 16, 157–166. [Google Scholar] [CrossRef]
  42. Lee, Y.M.; Park, N.H.; Kim, Y.H. Process of Change, Decisional Balance, Self-Efficacy and Depression across the Stages of Change for Exercise among Middle Aged Women in Korea. J. Korean Acad. Nurs. 2017, 36, 587–595. [Google Scholar] [CrossRef]
  43. Plotnikoff, R.C.; Lippke, S.; Johnson, S.T.; Courneya, K.S. Physical Activity and Stages of Change: A Longitudinal Test in Types 1 and 2 Diabetes Samples. Ann. Behav. Med. 2010, 40, 138–149. [Google Scholar] [CrossRef]
  44. Fernandez, A.C.; Amoyal, N.R.; Paiva, A.L.; Prochaska, J.O. Motivation for HPV Vaccination among Young Adult Men: Validation of TTM Decisional Balance and Self-Efficacy Constructs. Am. J. Health Promot. 2016, 30, 163–171. [Google Scholar] [CrossRef]
  45. Redding, C.A.; Mundorf, N.; Kobayashi, H.; Brick, L.; Horiuchi, S.; Paiva, A.L.; Prochaska, J.O. Sustainable Transportation Stage of Change, Decisional Balance, and Self-Efficacy Scale Development and Validation in Two University Samples. Int. J. Environ. Health Res. 2014, 25, 241–253. [Google Scholar] [CrossRef]
  46. Brug, J.; Conner, M.; Harré, N.; Kremers, S.; McKellar, S.; Whitelaw, S. The Transtheoretical Model and Stages of Change: A Critique Observations by Five Commentators on the Paper by Adams, J. and White, M. (2004) Why Don’t Stage-Based Activity Promotion Interventions Work? Health Educ. Res. 2005, 20, 244–258. [Google Scholar] [CrossRef]
  47. Velicer, W.F.; Prochaska, J.O. Stage and Non-Stage Theories of Behavior and Behavior Change: A Comment on Schwarzer. Appl. Psychol. 2008, 57, 75–83. [Google Scholar] [CrossRef]
  48. Ceccarini, M.; Borrello, M.; Pietrabissa, G.; Manzoni, G.M.; Castelnuovo, G. Assessing Motivation and Readiness to Change for Weight Management and Control: An in-Depth Evaluation of Three Sets of Instruments. Front. Psychol. 2015, 6, 511. [Google Scholar] [CrossRef] [PubMed]
  49. Biehl, A.; Stathopoulos, A. Investigating the Interconnectedness of Active Transportation and Public Transit Usage as a Primer for Mobility-as-a-Service Adoption and Deployment. J. Transp. Health 2020, 18, 100897. [Google Scholar] [CrossRef]
  50. Gatersleben, B.; Appleton, K.M. Contemplating Cycling to Work: Attitudes and Perceptions in Different Stages of Change. Transp. Res. Part A Policy Pract. 2007, 41, 302–312. [Google Scholar] [CrossRef]
  51. Nigg, C.R.; Courneya, K.S. Transtheoretical Model: Examining Adolescent Exercise Behavior. J. Adolesc. Health 1998, 22, 214–224. [Google Scholar] [CrossRef] [PubMed]
  52. Sarkin, J.A.; Johnson, S.S.; Prochaska, J.O.; Prochaska, J.M. Applying the Transtheoretical Model to Regular Moderate Exercise in an Overweight Population: Validation of a Stages of Change Measure. Prev. Med. 2001, 33, 462–469. [Google Scholar] [CrossRef] [PubMed]
  53. McConnaughy, E.A.; Prochaska, J.O.; Velicer, W.F. Stages of Change in Psychotherapy: Measurement and Sample Profiles. Psychotherapy 1983, 20, 368–375. [Google Scholar] [CrossRef]
  54. Russell, K.C. Adolescent Substance-Use Treatment: Service Delivery, Research on Effectiveness, and Emerging Treatment Alternatives. J. Groups Addict. Recovery 2008, 2, 68–96. [Google Scholar] [CrossRef]
  55. Bergly, T.H.; Stallvik, M.; Nordahl, H.M.; Hagen, R. The Predictive Validity of the URICA in a Sample of Patients in Substance Use Treatment. Addict. Disord. Their Treat. 2014, 13, 170–178. [Google Scholar] [CrossRef]
  56. Richards Reed, G. Measuring Stage of Change for Exercise; University of Rhode Island: Kingston, RI, USA, 1995. [Google Scholar]
  57. Cancer Prevention Research Center. Stages of Change (Continuous Measure); Cancer Prevention Research Center: Kingston, RI, USA, 1994. [Google Scholar]
  58. Khalil, M.S. Reliability and Confirmatory Factor Analysis of the Arabic Version of the University of Rhode Island Change Assessment (URICA). Alcohol Alcohol. 2011, 46, 138–142. [Google Scholar] [CrossRef]
  59. Chen, S.H.; Lai, H.R.; Chen, S.R.; Lin, P.C.; Chou, K.R.; Lee, P.H. Validity and Reliability of a Chinese-Language Instrument for Continuous Assessment of Exercise Stages of Change in Adults. J. Nurs. Res. 2019, 27, e37. [Google Scholar] [CrossRef] [PubMed]
  60. Andrés, A.; Saldaña, C.; Gómez-Benito, J. The Transtheoretical Model in Weight Management: Validation of the Processes of Change Questionnaire. Obes. Facts 2011, 4, 433–442. [Google Scholar] [CrossRef] [PubMed]
  61. Ghasemi, A.; Zahediasl, S. Normality Tests for Statistical Analysis: A Guide for Non-Statisticians. Int. J. Endocrinol. Metab. 2012, 10, 486–489. [Google Scholar] [CrossRef] [PubMed]
  62. Prochaska, J.O. Measures—Cancer Prevention Research Center. 2020. Available online: https://web.uri.edu/cprc/transtheoretical-model/ (accessed on 22 November 2023).
  63. Romain, A.J.; Bernard, P.; Attalin, V.; Gernigon, C.; Ninot, G.; Avignon, A. Health-Related Quality of Life and Stages of Behavioural Change for Exercise in Overweight/obese Individuals. Diabetes Metab. 2012, 38, 352–358. [Google Scholar] [CrossRef] [PubMed]
  64. Spearman, C. The Proof and Measurement of Association between Two Things. Am. J. Psychol. 2019, 15, 72–101. [Google Scholar] [CrossRef]
  65. Revelle, W.; Zinbarg, R.E. Coefficients Alpha, Beta, Omega, and the Glb: Comments on Sijtsma. Psychometrika 2008, 74, 145–154. [Google Scholar] [CrossRef]
  66. Costello, A.B.; Osborne, J.W. Best Practices in Exploratory Factor Analysis: Four Recommendations for Getting the Most from Your Analysis. Pract. Assess. Res. Eval. 2005, 10, 7. [Google Scholar]
  67. Howard, M.C. A Review of Exploratory Factor Analysis Decisions and Overview of Current Practices: What We Are Doing and How Can We Improve? Int. J. Hum. Comput. Interact. 2016, 32, 51–62. [Google Scholar] [CrossRef]
  68. Dinno, A. Exploring the Sensitivity of Horn’s Parallel Analysis to the Distributional Form of Random Data. Multivar. Behav. Res. 2009, 44, 362. [Google Scholar] [CrossRef]
  69. Salleh, N.M.; Fueki, K.; Garrett, N.R.; Ohyama, T. Objective and Subjective Hardness of a Test Item Used for Evaluating Food Mixing Ability. J. Oral Rehabil. 2007, 34, 174–183. [Google Scholar] [CrossRef]
  70. Kim, H.-Y. Statistical Notes for Clinical Researchers: Post-Hoc Multiple Comparisons. Restor. Dent. Endod. 2015, 40, 172–176. [Google Scholar] [CrossRef] [PubMed]
  71. Healey, J.F. Statistics: A Tool for Social Research and Data Analysis, Cengage Learning, 10th ed.; Cengage Learning: Boston, MA, USA, 2014; Volume 420, Available online: https://www.amazon.com/Statistics-Research-Joseph-F-Healey/dp/1285458850 (accessed on 22 November 2023).
  72. Bopp, M.; Bopp, C.; Schuchert, M. Active Transportation to and on Campus Is Associated With Objectively Measured Fitness Outcomes Among College Students. J. Phys. Act. Health 2015, 12, 418–423. [Google Scholar] [CrossRef] [PubMed]
  73. Nash, S.; Mitra, R. University Students’ Transportation Patterns, and the Role of Neighbourhood Types and Attitudes. J. Transp. Geogr. 2019, 76, 200–211. [Google Scholar] [CrossRef]
  74. Kalpana, R.; Shibu, N.S. CFA in Organisational Commitment with Special Reference to Women Faculties of Engineering Colleges. Int. J. Manag. 2016, 7, 12–18. [Google Scholar]
  75. Ton, D.; Duives, D.C.; Cats, O.; Hoogendoorn-Lanser, S.; Hoogendoorn, S.P. Cycling or Walking? Determinants of Mode Choice in the Netherlands. Transp. Res. Part A Policy Pract. 2019, 123, 7–23. [Google Scholar] [CrossRef]
  76. Wallén Warner, H.; Björklund, G.; Andersson, J. Using a Three-Stage Model of Change to Understand People’s Use of Bicycle, Public Transport, and Car. Transp. Res. Part F Traffic Psychol. Behav. 2021, 82, 167–177. [Google Scholar] [CrossRef]
  77. Andersson, A.; Winslott Hiselius, L.; Adell, E. Promoting Sustainable Travel Behaviour through the Use of Smartphone Applications: A Review and Development of a Conceptual Model. Travel Behav. Soc. 2018, 11, 52–61. [Google Scholar] [CrossRef]
  78. Kowalski, K.; Jeznach, A.; Tuokko, H.A. Stages of Driving Behavior Change within the Transtheoretical Model (TM). J. Saf. Res. 2014, 50, 17–25. [Google Scholar] [CrossRef]
  79. Douglas, S.P.; Craig, C.S. Collaborative and Iterative Translation: An Alternative Approach to Back Translation. J. Int. Mark. 2018, 15, 30–43. [Google Scholar] [CrossRef]
  80. Romain, A.J.; Abdel-Baki, A. Using the Transtheoretical Model to Predict Physical Activity Level of Overweight Adults with Serious Mental Illness. Psychiatry Res. 2017, 258, 476–480. [Google Scholar] [CrossRef]
Figure 1. Progression of stages of change (SOCs) in association with decision balance and self-efficacy.
Sustainability 16 00472 g001
Figure 2. Progression of subjective use of active transport use in association with decision balance and self-efficacy.
Sustainability 16 00472 g002
Table 1. Sample characteristics.
GenderFrequencyPercentage (%)
None selected10.4
Female14455.4
Male11343.5
Other20.8
Education
Secondary School General8532.7
Technical Secondary School166.2
Higher Education-Not University3915.0
University Degree12046.2
Active Travel Duration per Week (Mins = Minutes)
0–20 min4115.8
20–60 min6525.0
60–100 min5822.3
100–150 min2911.2
>150 min6725.8
Access to Motorised Transport
Yes19273.8
No6826.2
Preferred Transport Mode in Routine Trips
A combination of walking and/or cycling with public transport8432.3
Bicycle7227.7
Car10138.8
Walking31.2
Table 2. RTC score-based stage allocation.
URICAFrequency (n = 260)Percentage (%)ωh
PCB9135.00.87
C11443.80.79
P249.20.65
A2911.20.80
M20.80.81
PCB = pre-contemplation believer, C = contemplation, P = Preparation, A = Action, M = Maintenance.
Table 3. EFA factor extraction and factor loadings of URICA.
URICA Items and Factors 12345
PCBCPAM
Pre-contemplation believer
U110.61
U190.80
U211.03
U240.77
Contemplation
U7 0.74
U13 0.71
U16 0.72
U22 0.49
Preparation
U14 0.35
U17 0.64
U20 0.89
U23 0.21
Action
U4 0.19
U8 0.77
U10 0.77
U12 0.65
Maintenance
U2 0.86
U5 0.84
U15 0.64
U18 0.67
Eigen values3.232.932.462.431.59
Explained variance %151281216
U11 = U refers to URICA and the number i.e., 11 refers to item number of URICA survey item, Appendix A.
Table 4. Results of ANOVA indicating a difference of mean DB and SCQ across URICA-based SOCs and use of active transport modes (minutes) categories.
DBSCQ
FPost-hoc differencesFPost-hoc differences
URICA13.91 *PC < C, P, A22.57 *PC < C, P, A, M
Active transport modes use (AT)6.24 *(0–20 min) < (60–100 min), (>150 min), (100–150 min)15.44 *(0–20 min) < (20–60 min), (60–100 min), (<150 min), (100–150 min)
* = p ≤ 0.01.
Table 5. Mean and Standard Deviation (SD) of DB and SCQ across five stages by URICA and SOC.
URICA-DBURICA-SCQ
MSDMSD
Pre-contemplation (PC)0.650.832.260.84
Contemplation (C)1.350.912.970.67
Preparation (P)1.471.063.250.78
Action (A)1.800.753.470.74
Maintenance (M)1.630.184.080.35
Table 6. Means of and Standard Deviation (SD) of DB and SCQ across categories of use of active transport modes.
Use of Active Transport Modes (AT)AT-DBAT-SCQ
MSDMSD
0–20 min0.640.952.110.78
20–60 min0.970.992.620.81
60–100 min1.450.812.950.63
100–150 min1.340.793.470.56
>150 min1.360.993.010.94
Table 7. Results of contingency analyses to assess the association between nominal variables (Cramer’s V and Lambda).
Cramer’s VLambda (λ)
AT × RICA0.250 *0.199 (AT as dependent)
* = p ≤ 0.01.
Disclaimer/Publisher’s Note: The statements, opinions and data contained in all publications are solely those of the individual author(s) and contributor(s) and not of MDPI and/or the editor(s). MDPI and/or the editor(s) disclaim responsibility for any injury to people or property resulting from any ideas, methods, instructions or products referred to in the content.

