
Enhancing the Fuel Properties of Spent Coffee Grounds through Hydrothermal Carbonization: Output Prediction and Post-Treatment Approaches
 , ,
, ,
Abstract
:1. Introduction
2. Materials and Methods
2.1. Materials
2.2. Overview of HTC Experiments
2.2.1. HTC Reactors
2.2.2. HTC Experimental Set-Up
Design of the HTC Experimental Set-Ups and Evaluation
Experimental Conditions and Procedure
Characterization of SCGs and HTC Products
2.2.3. Comparative Evaluation of Output Predictions after HTC
2.3. Overview of Washing and Agglomeration Methods
2.3.1. Char Washing
2.3.2. Char Agglomeration
Materials and Method
3. Results and Discussion
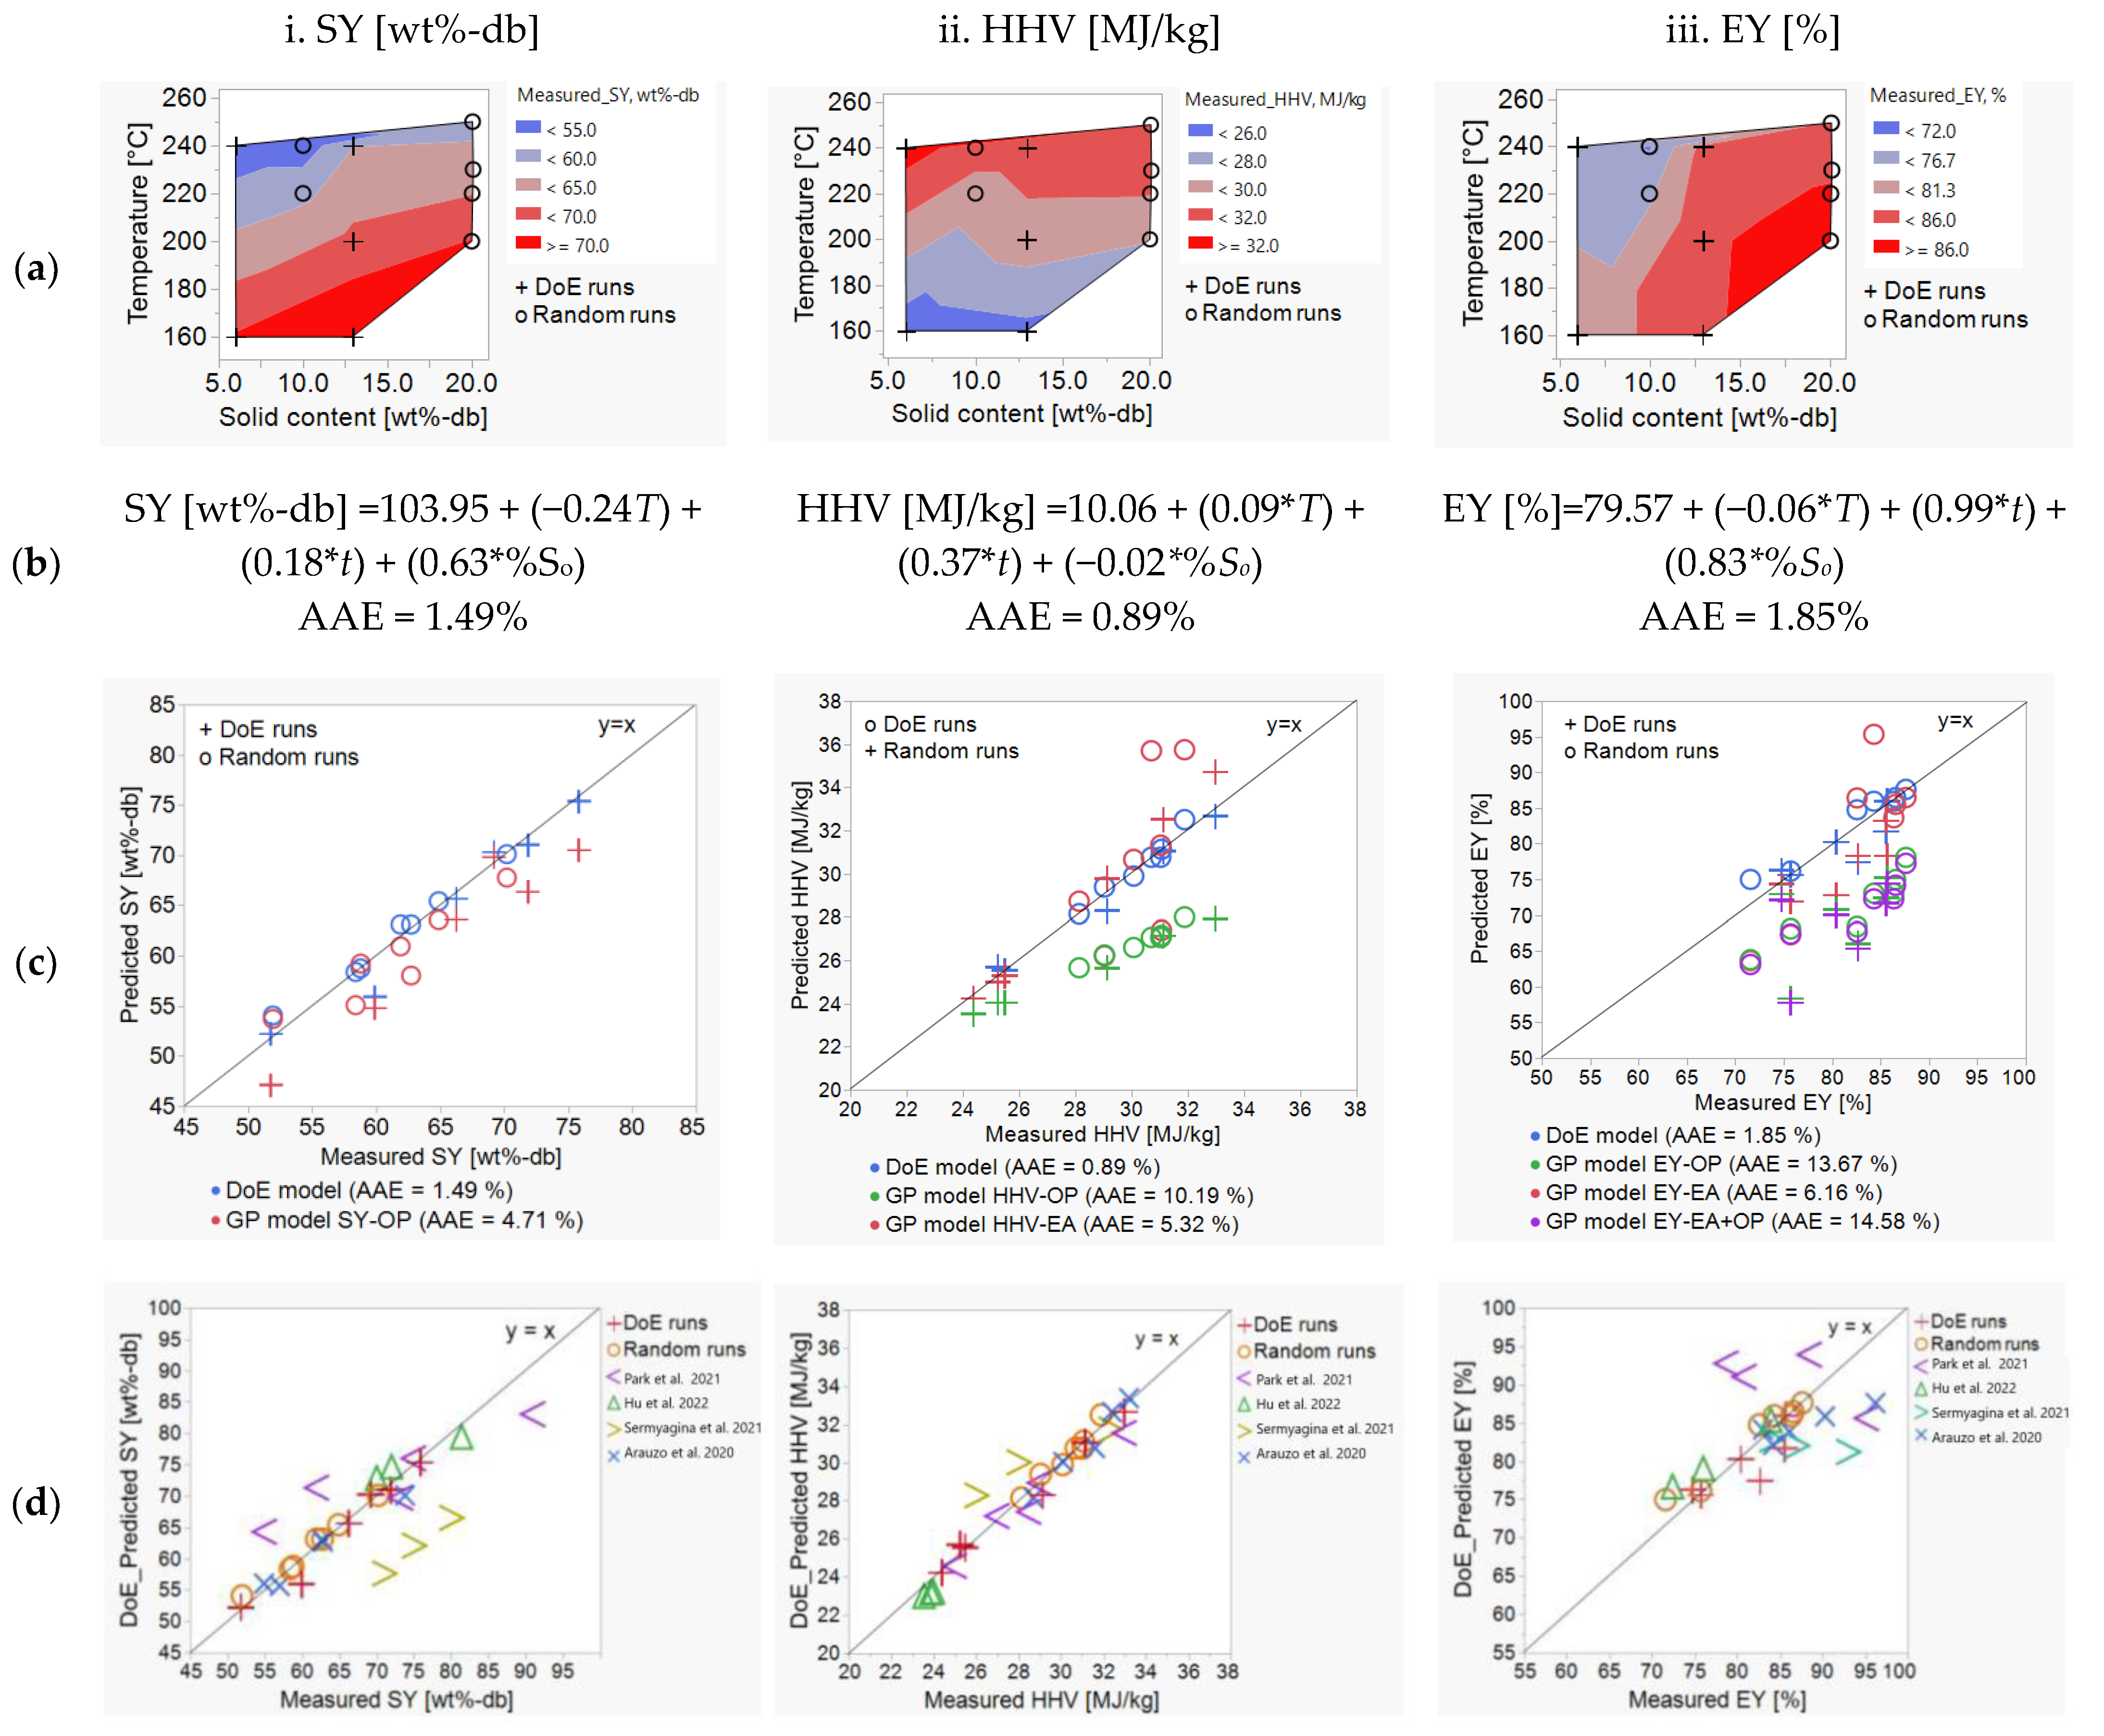
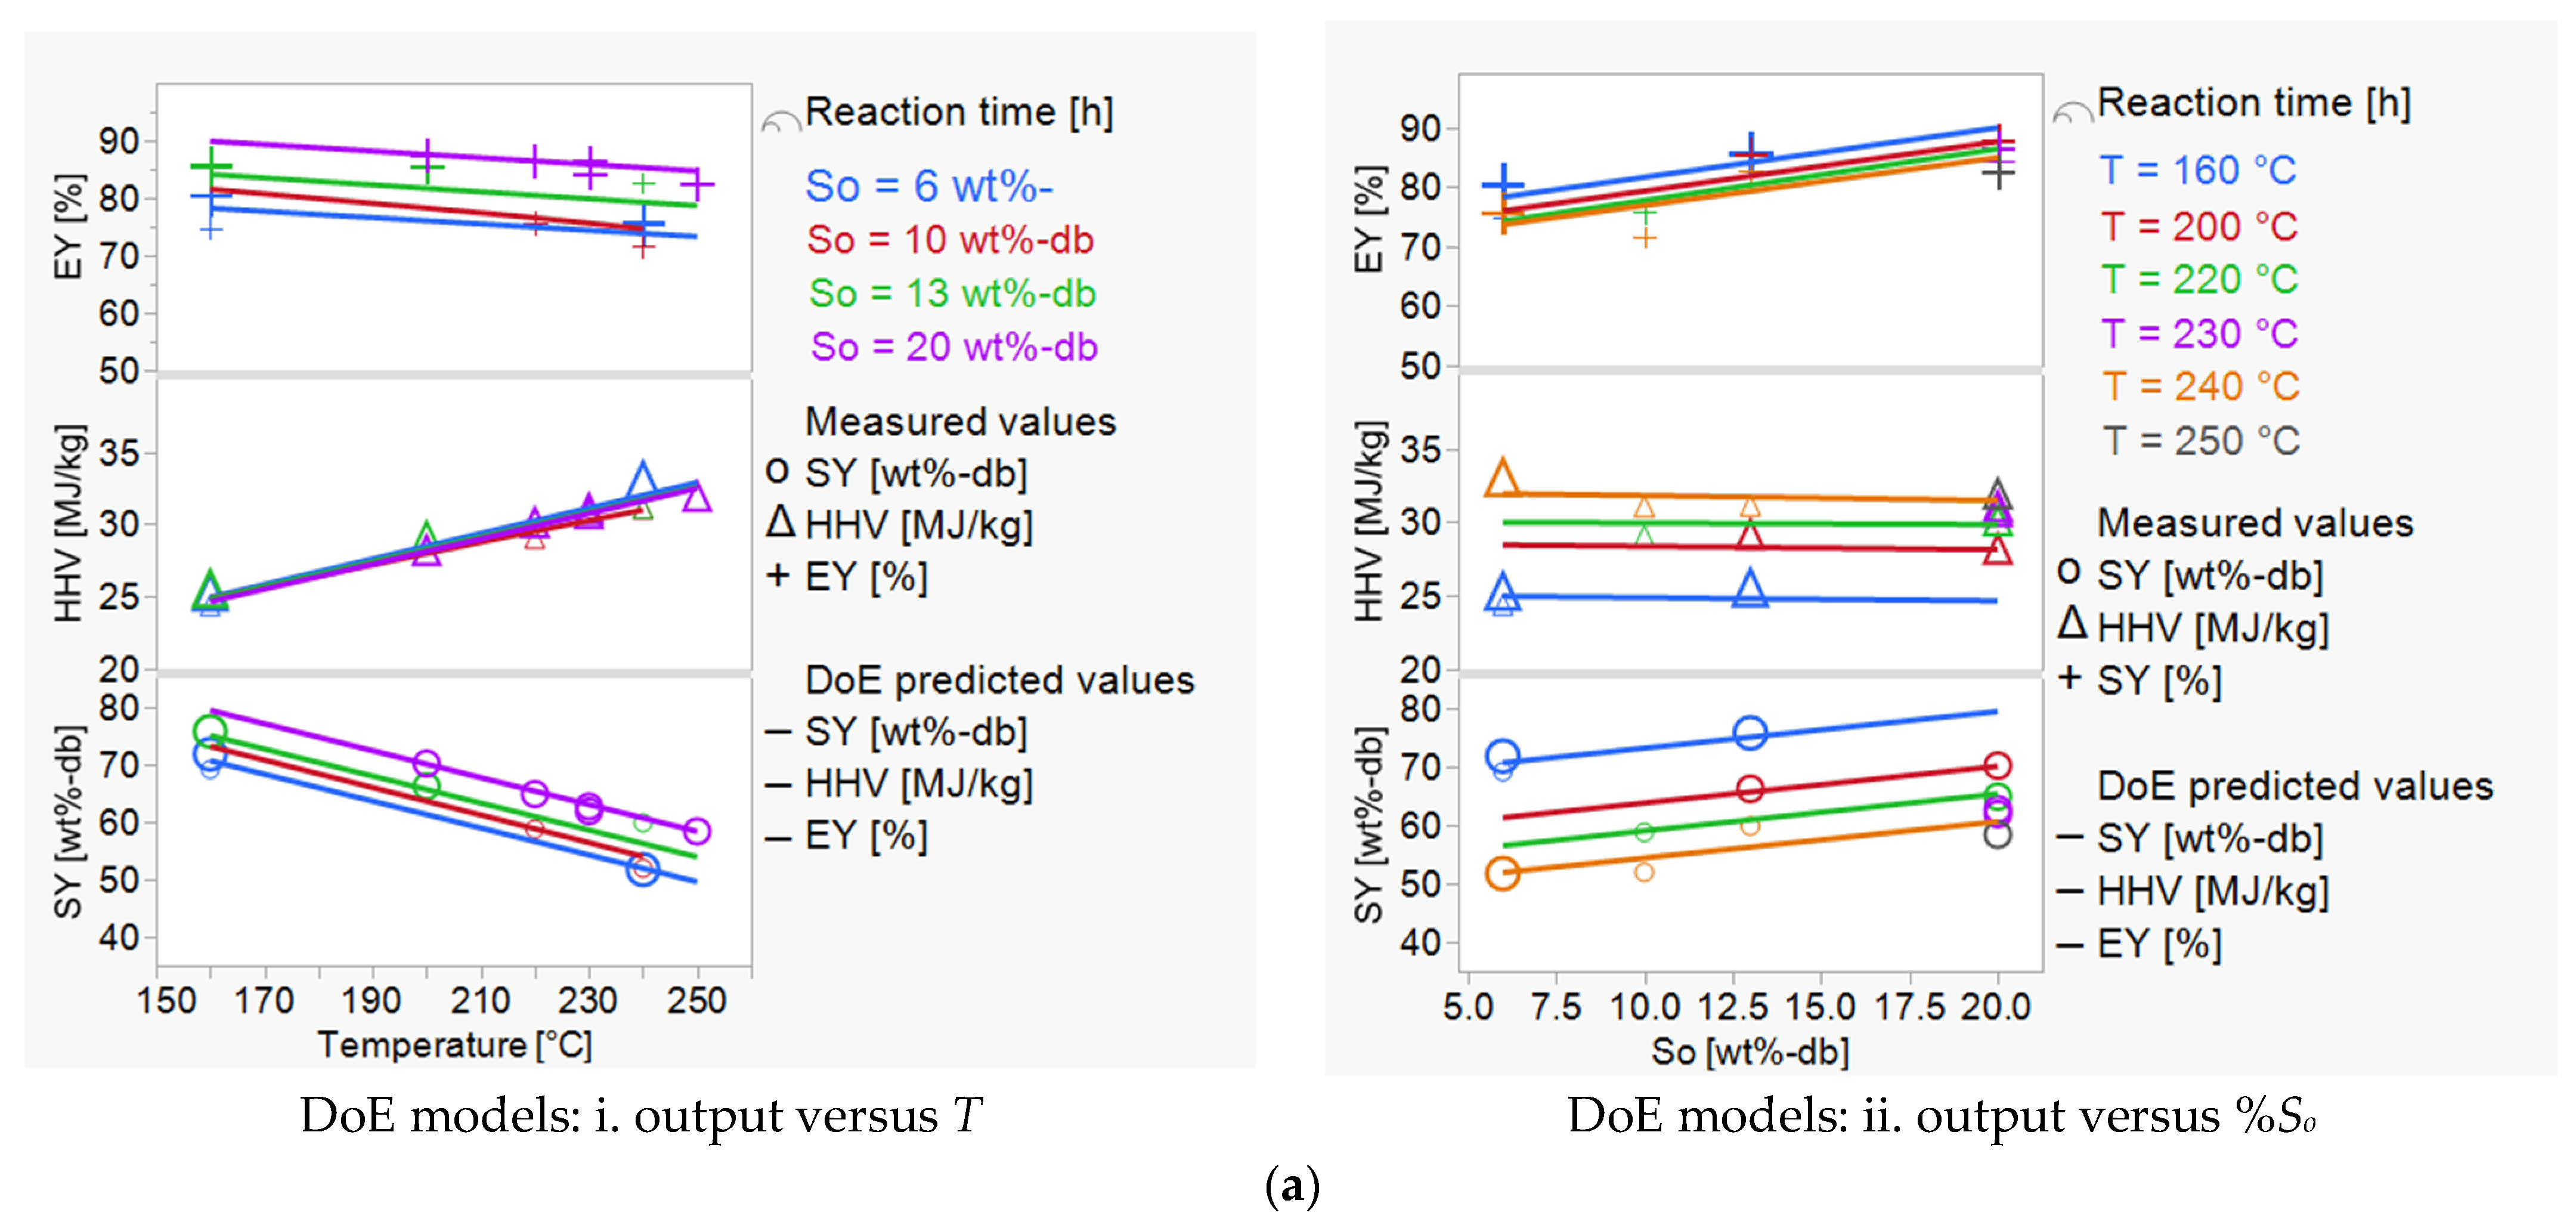
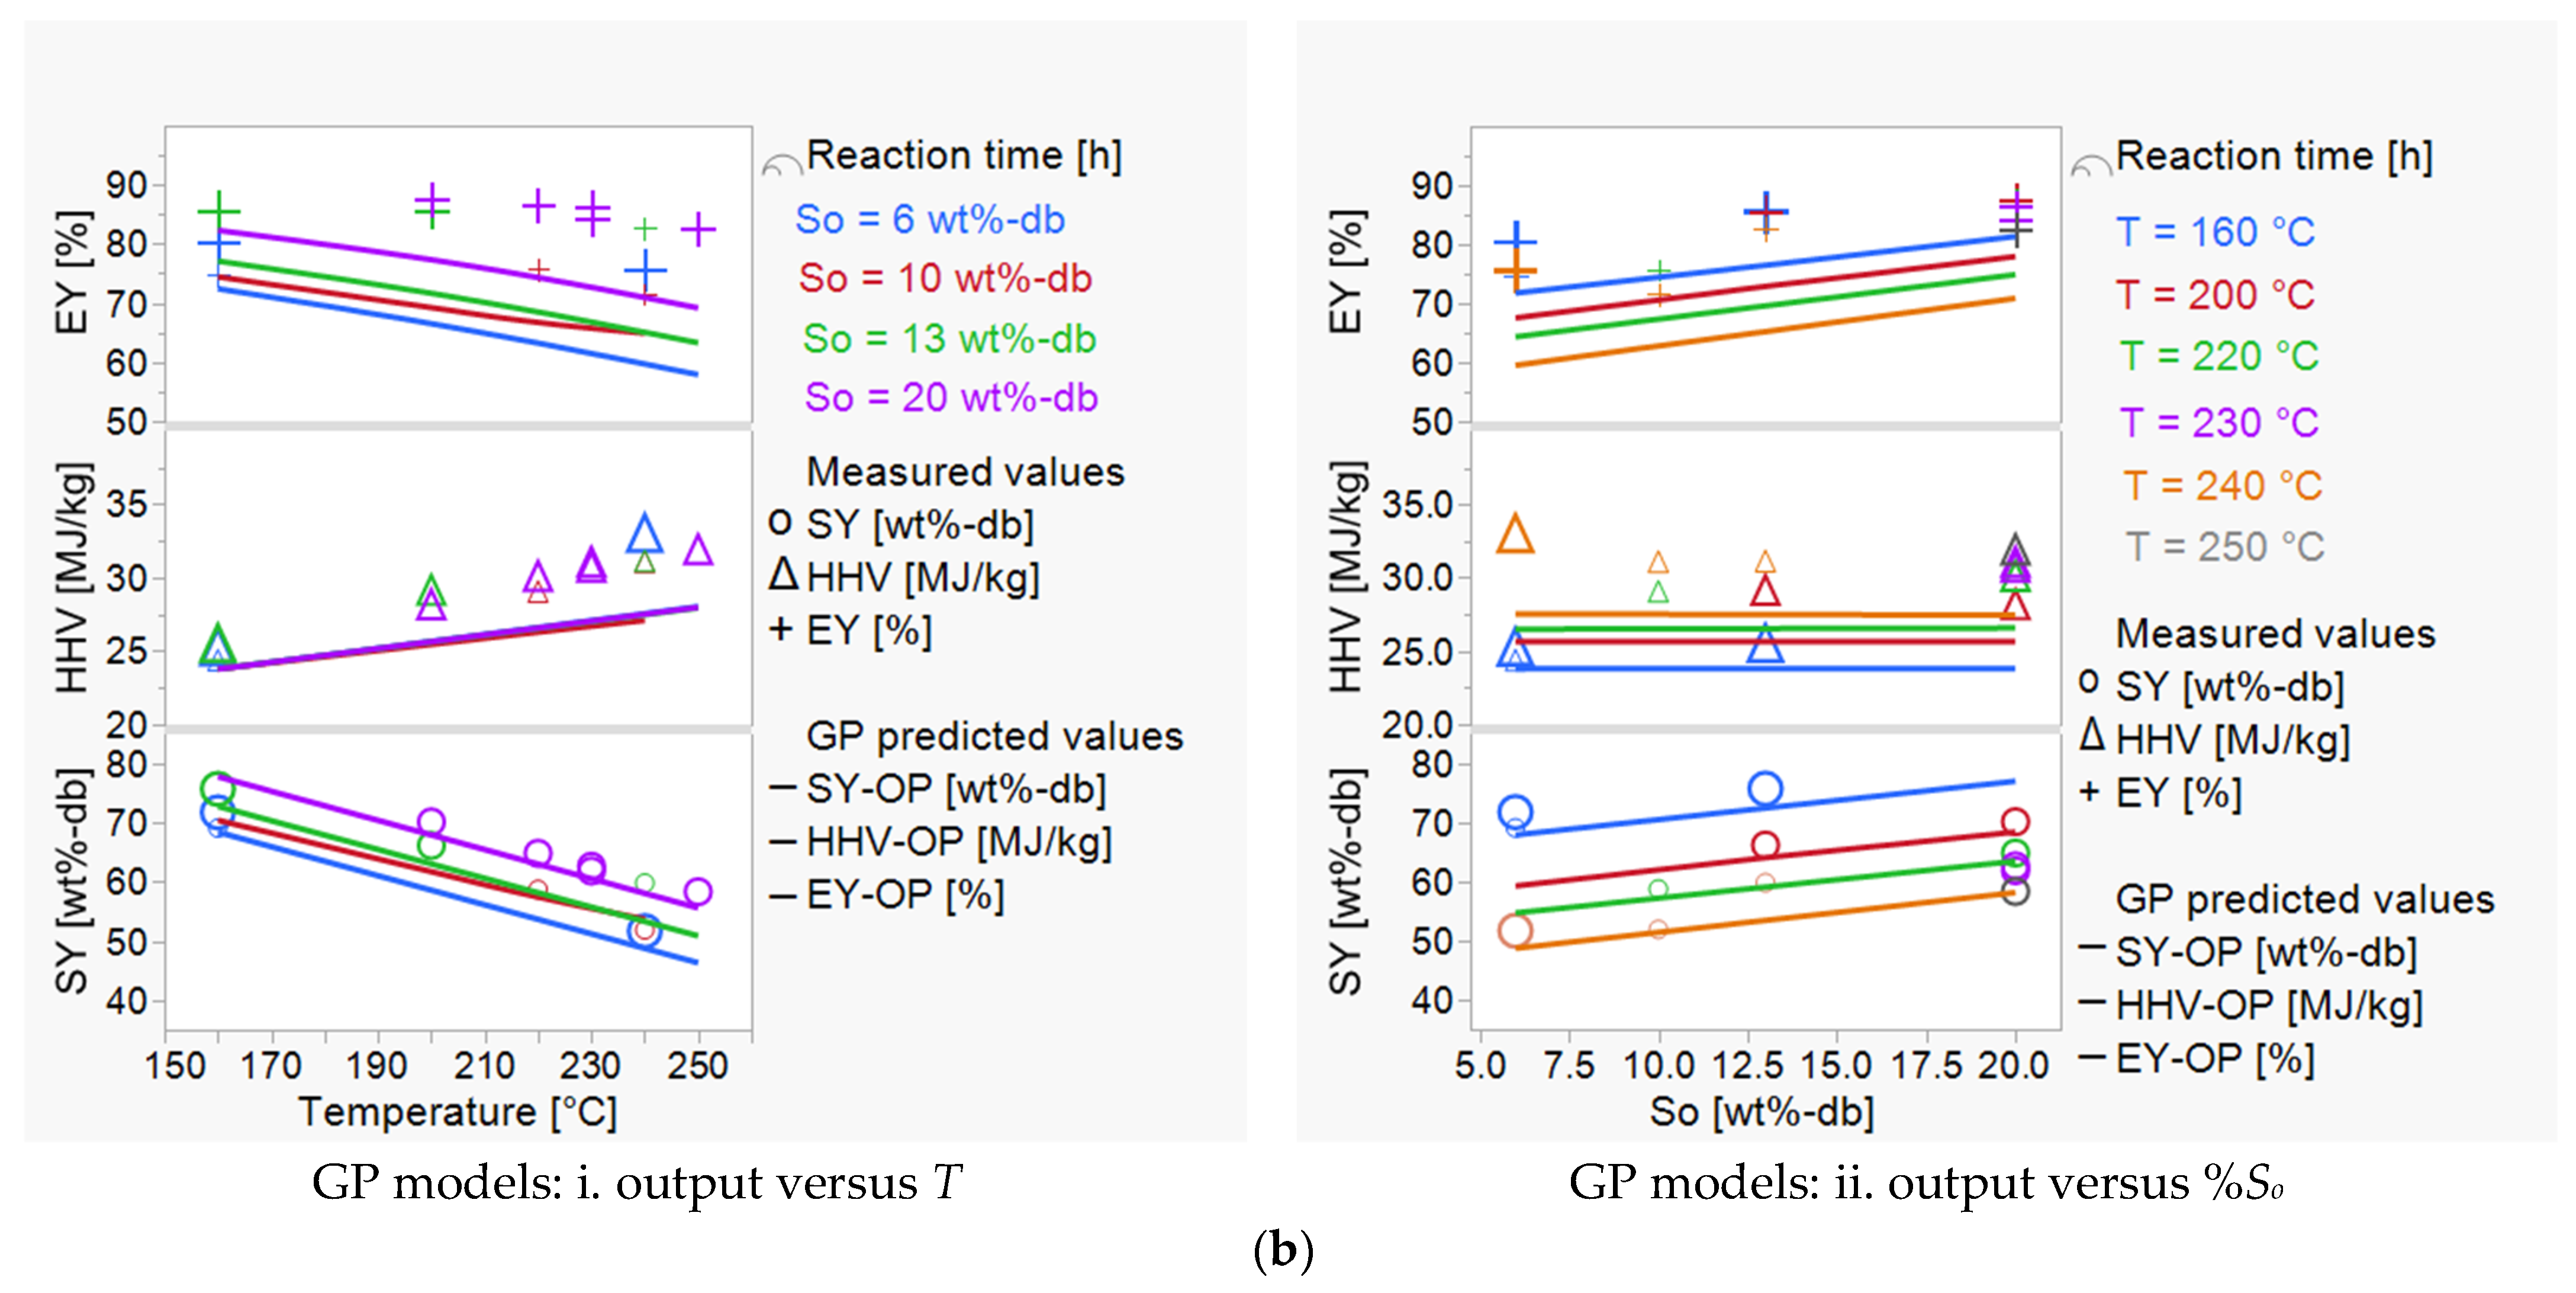
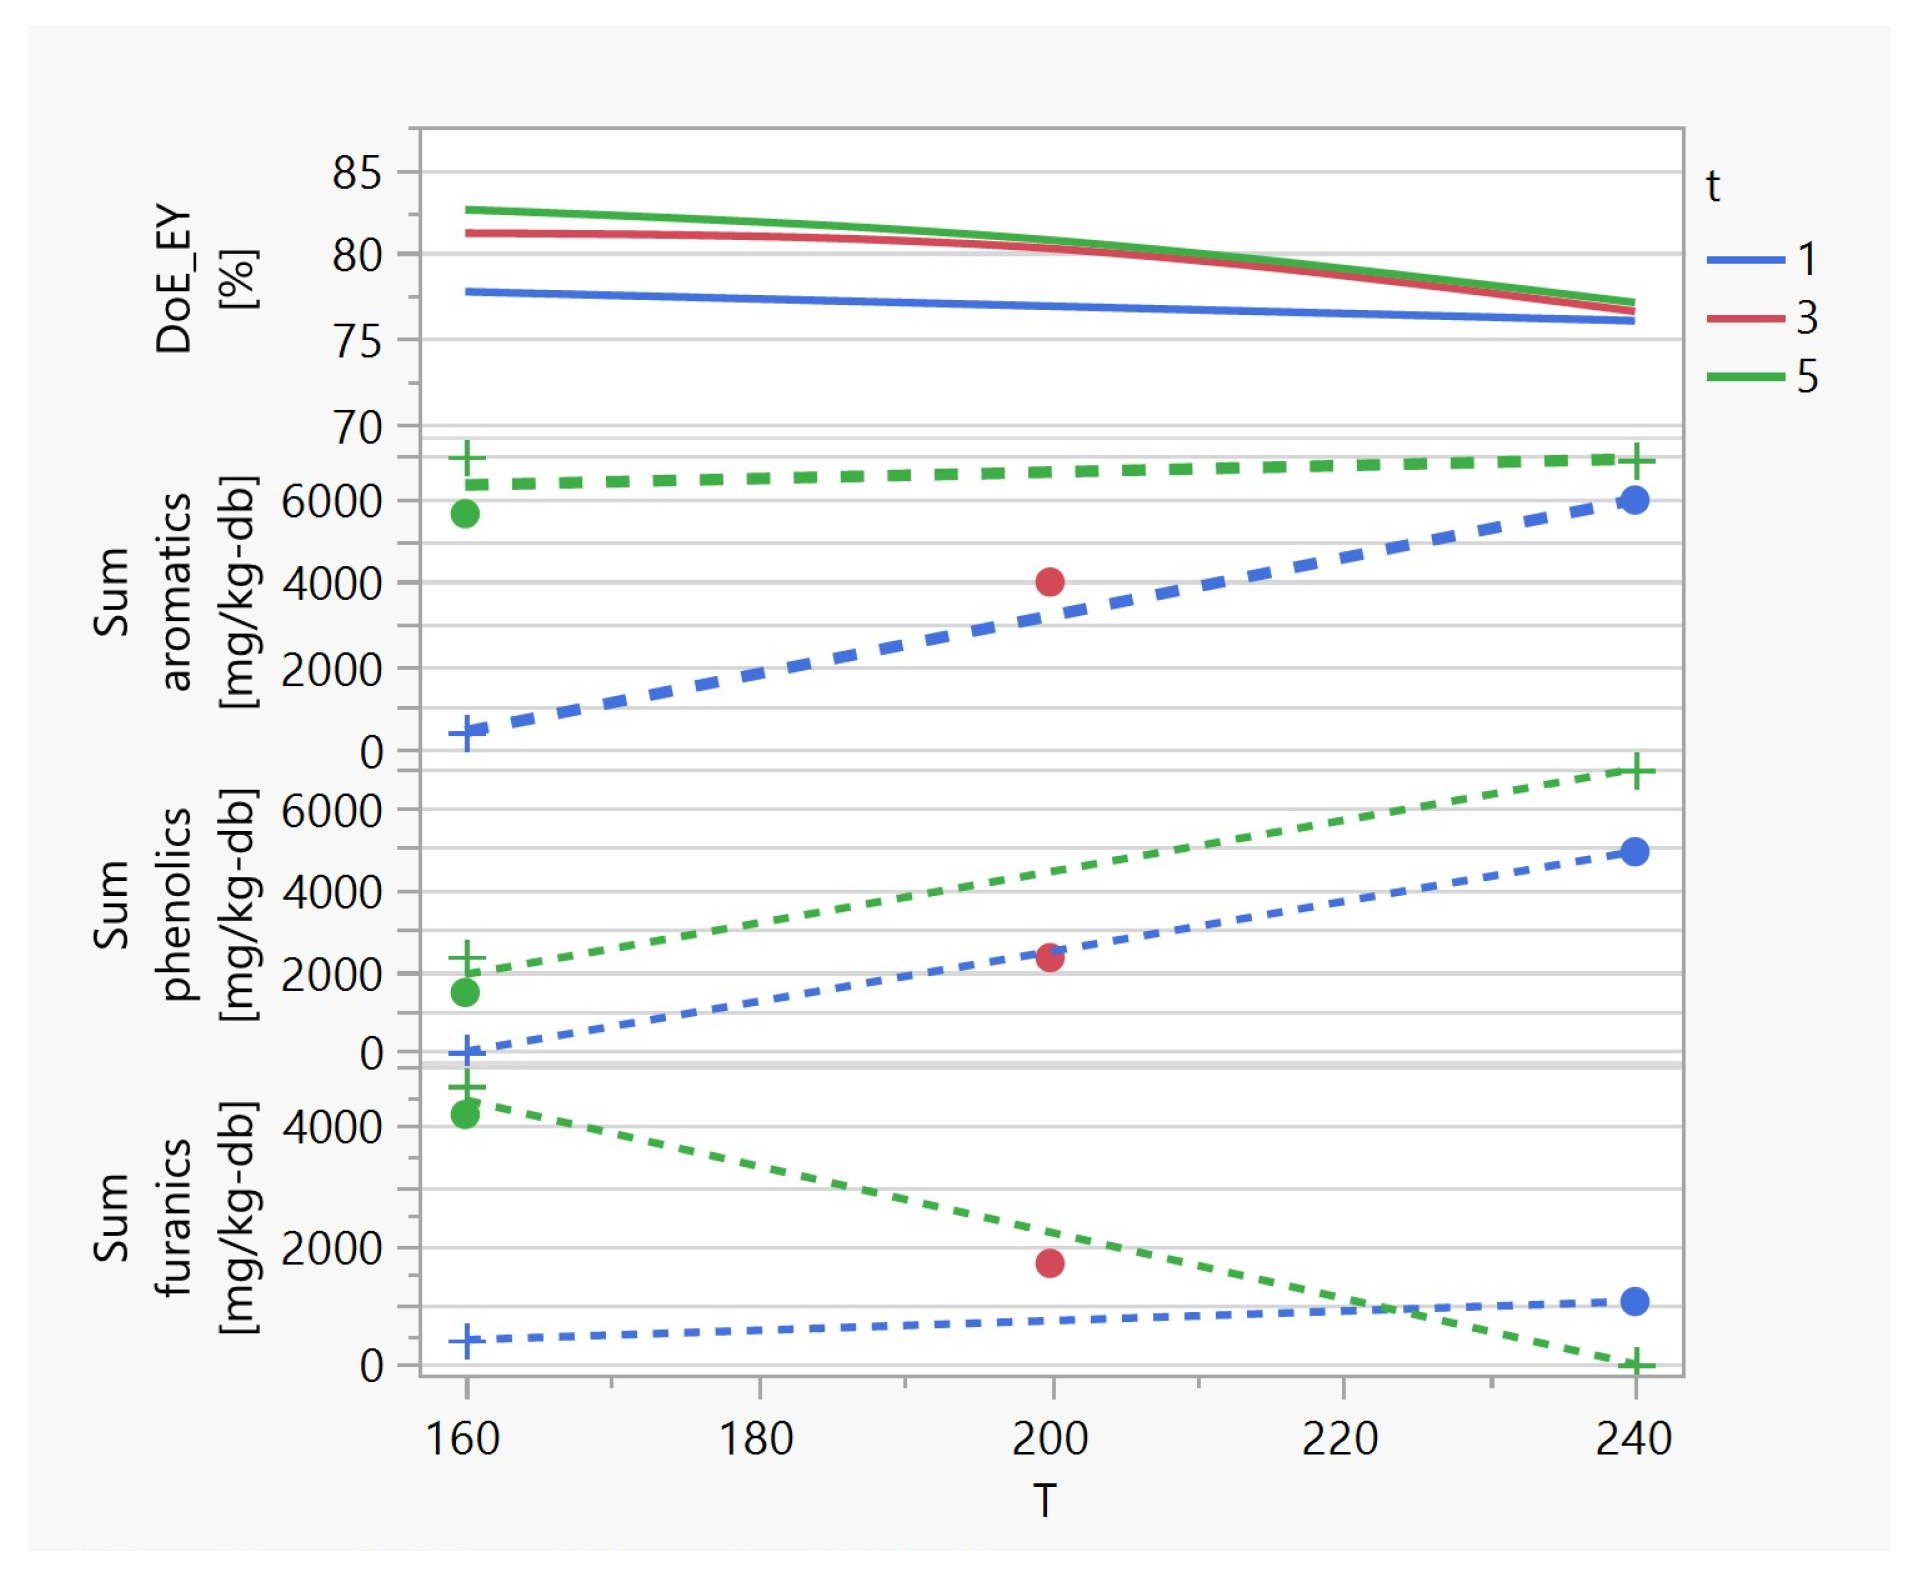
3.1. Investigating the Impact of Input Variables on HTC Treatment and Predicting Outputs
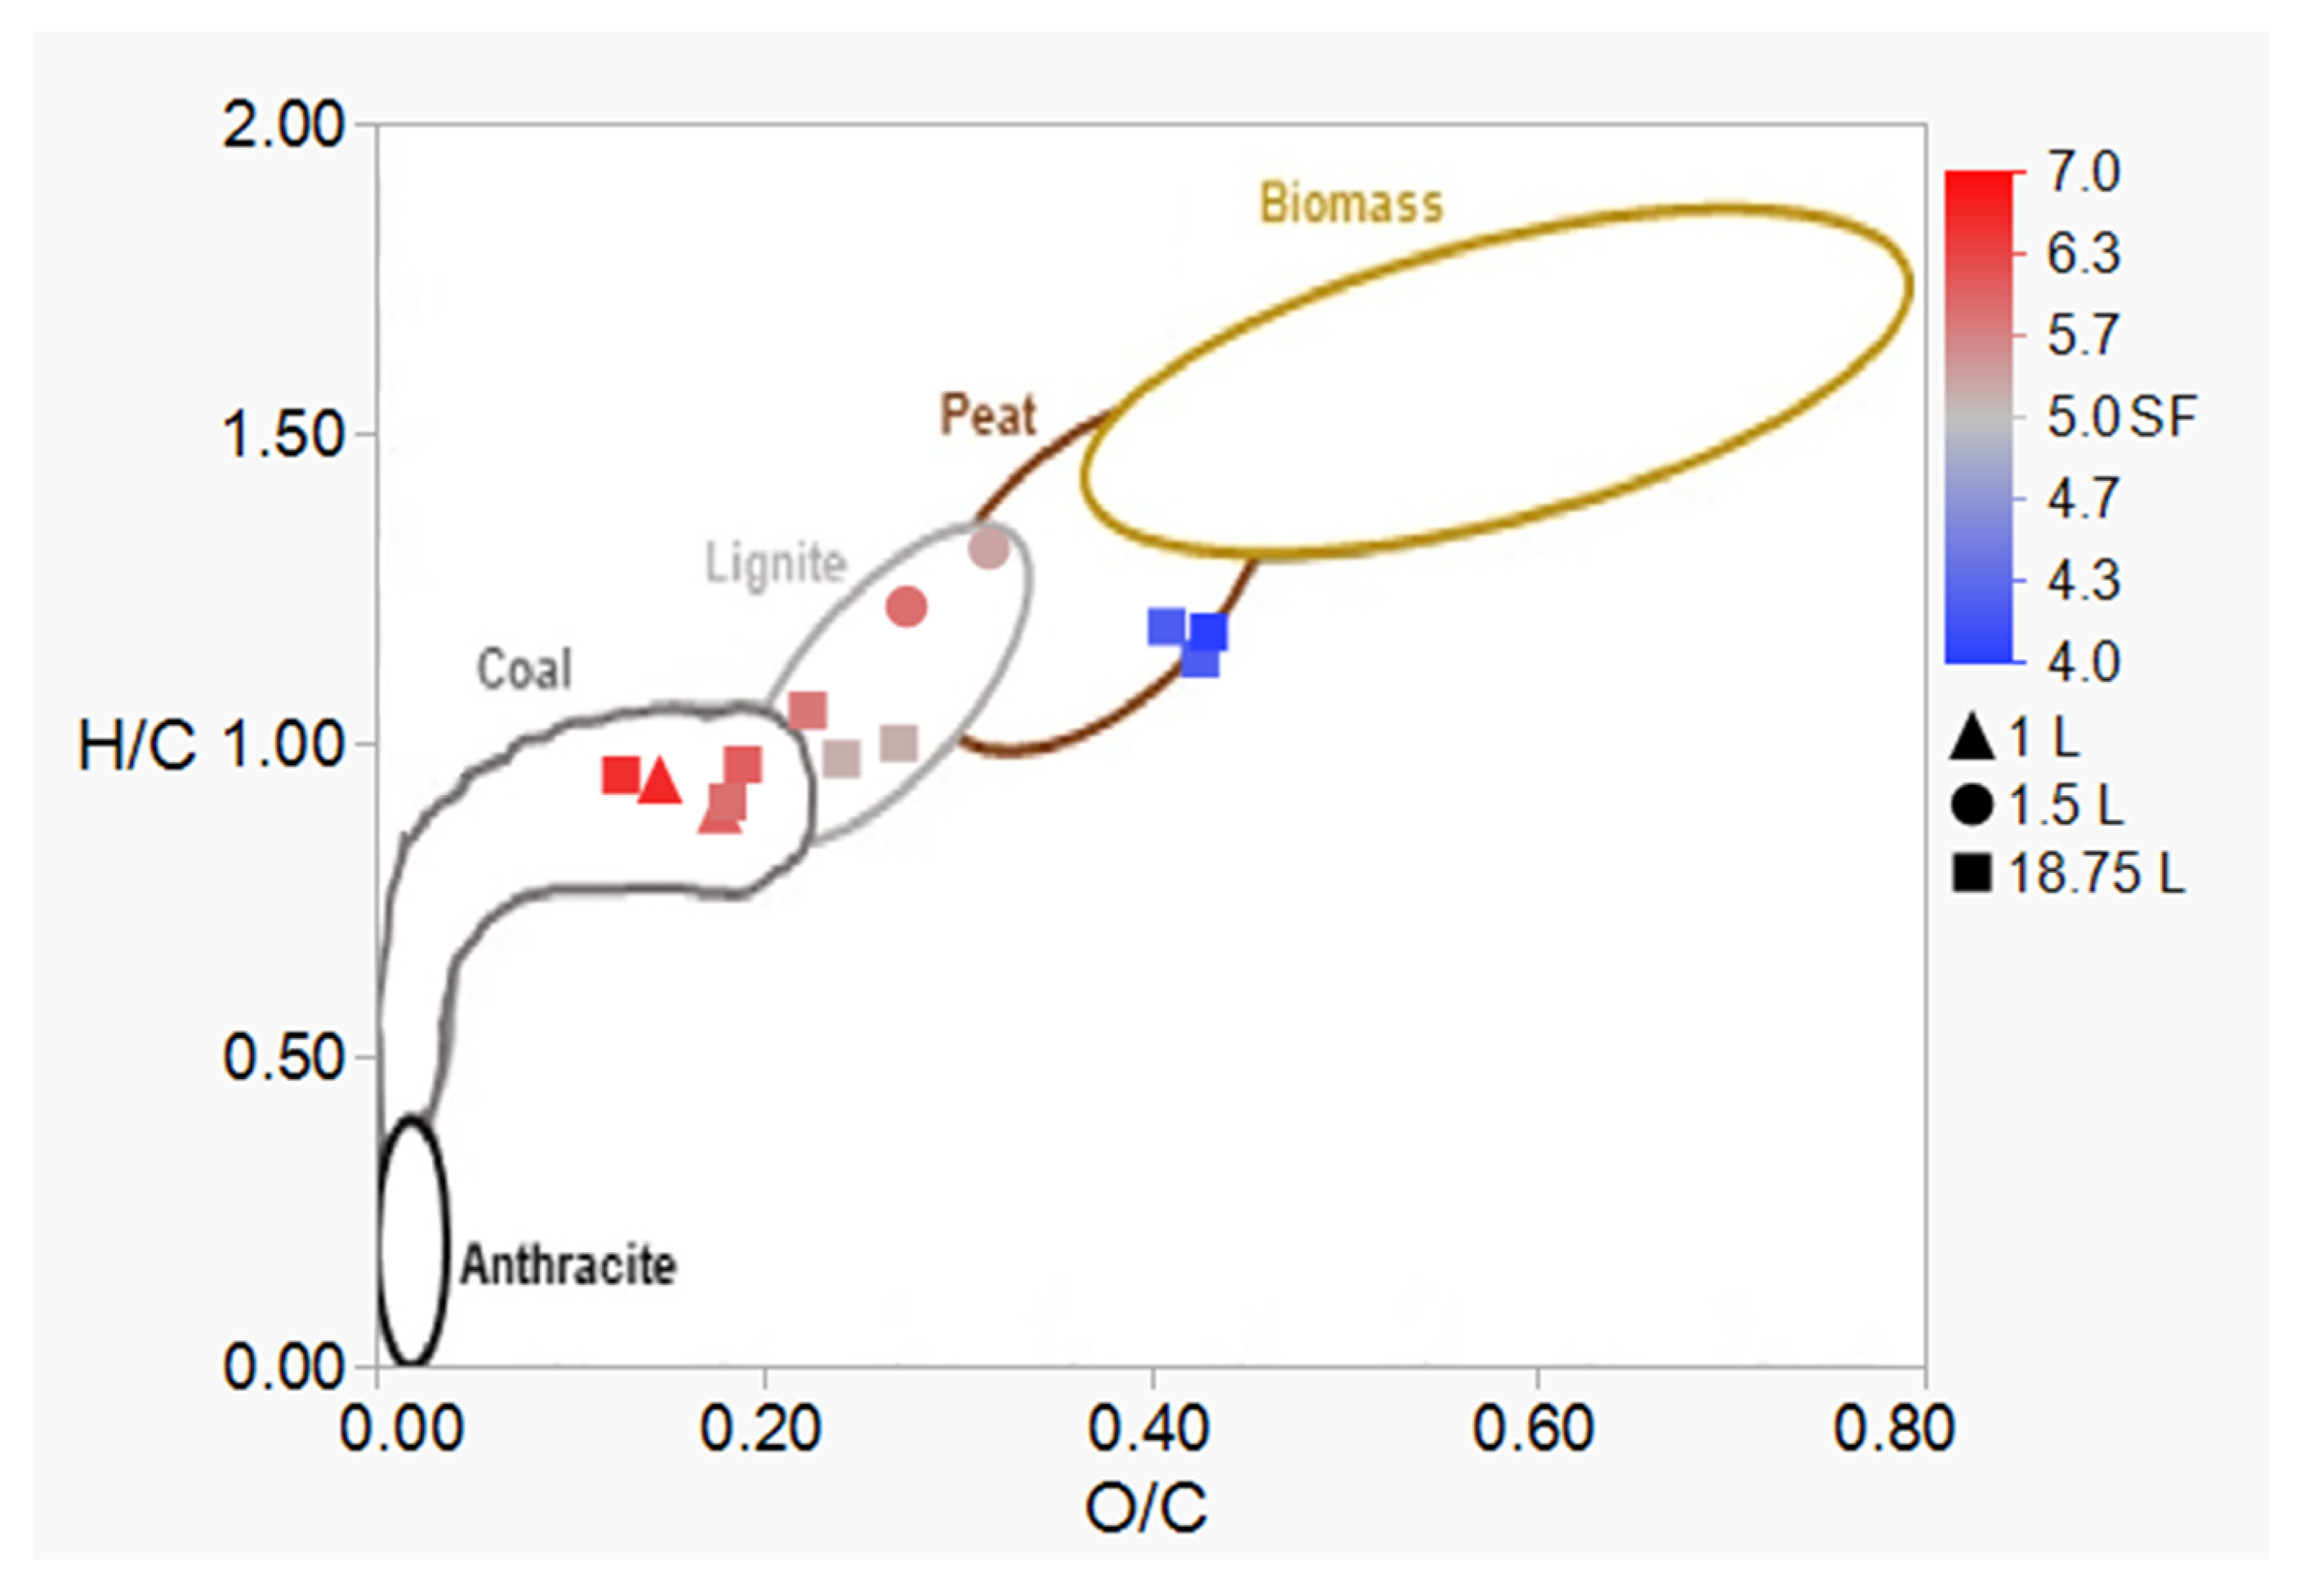
3.2. HTC Treatment: Improving the Energetic Characteristics of Spent Coffee Grounds
3.3. HTC Post-Treatment: Washing to Remove Simple Aromatics
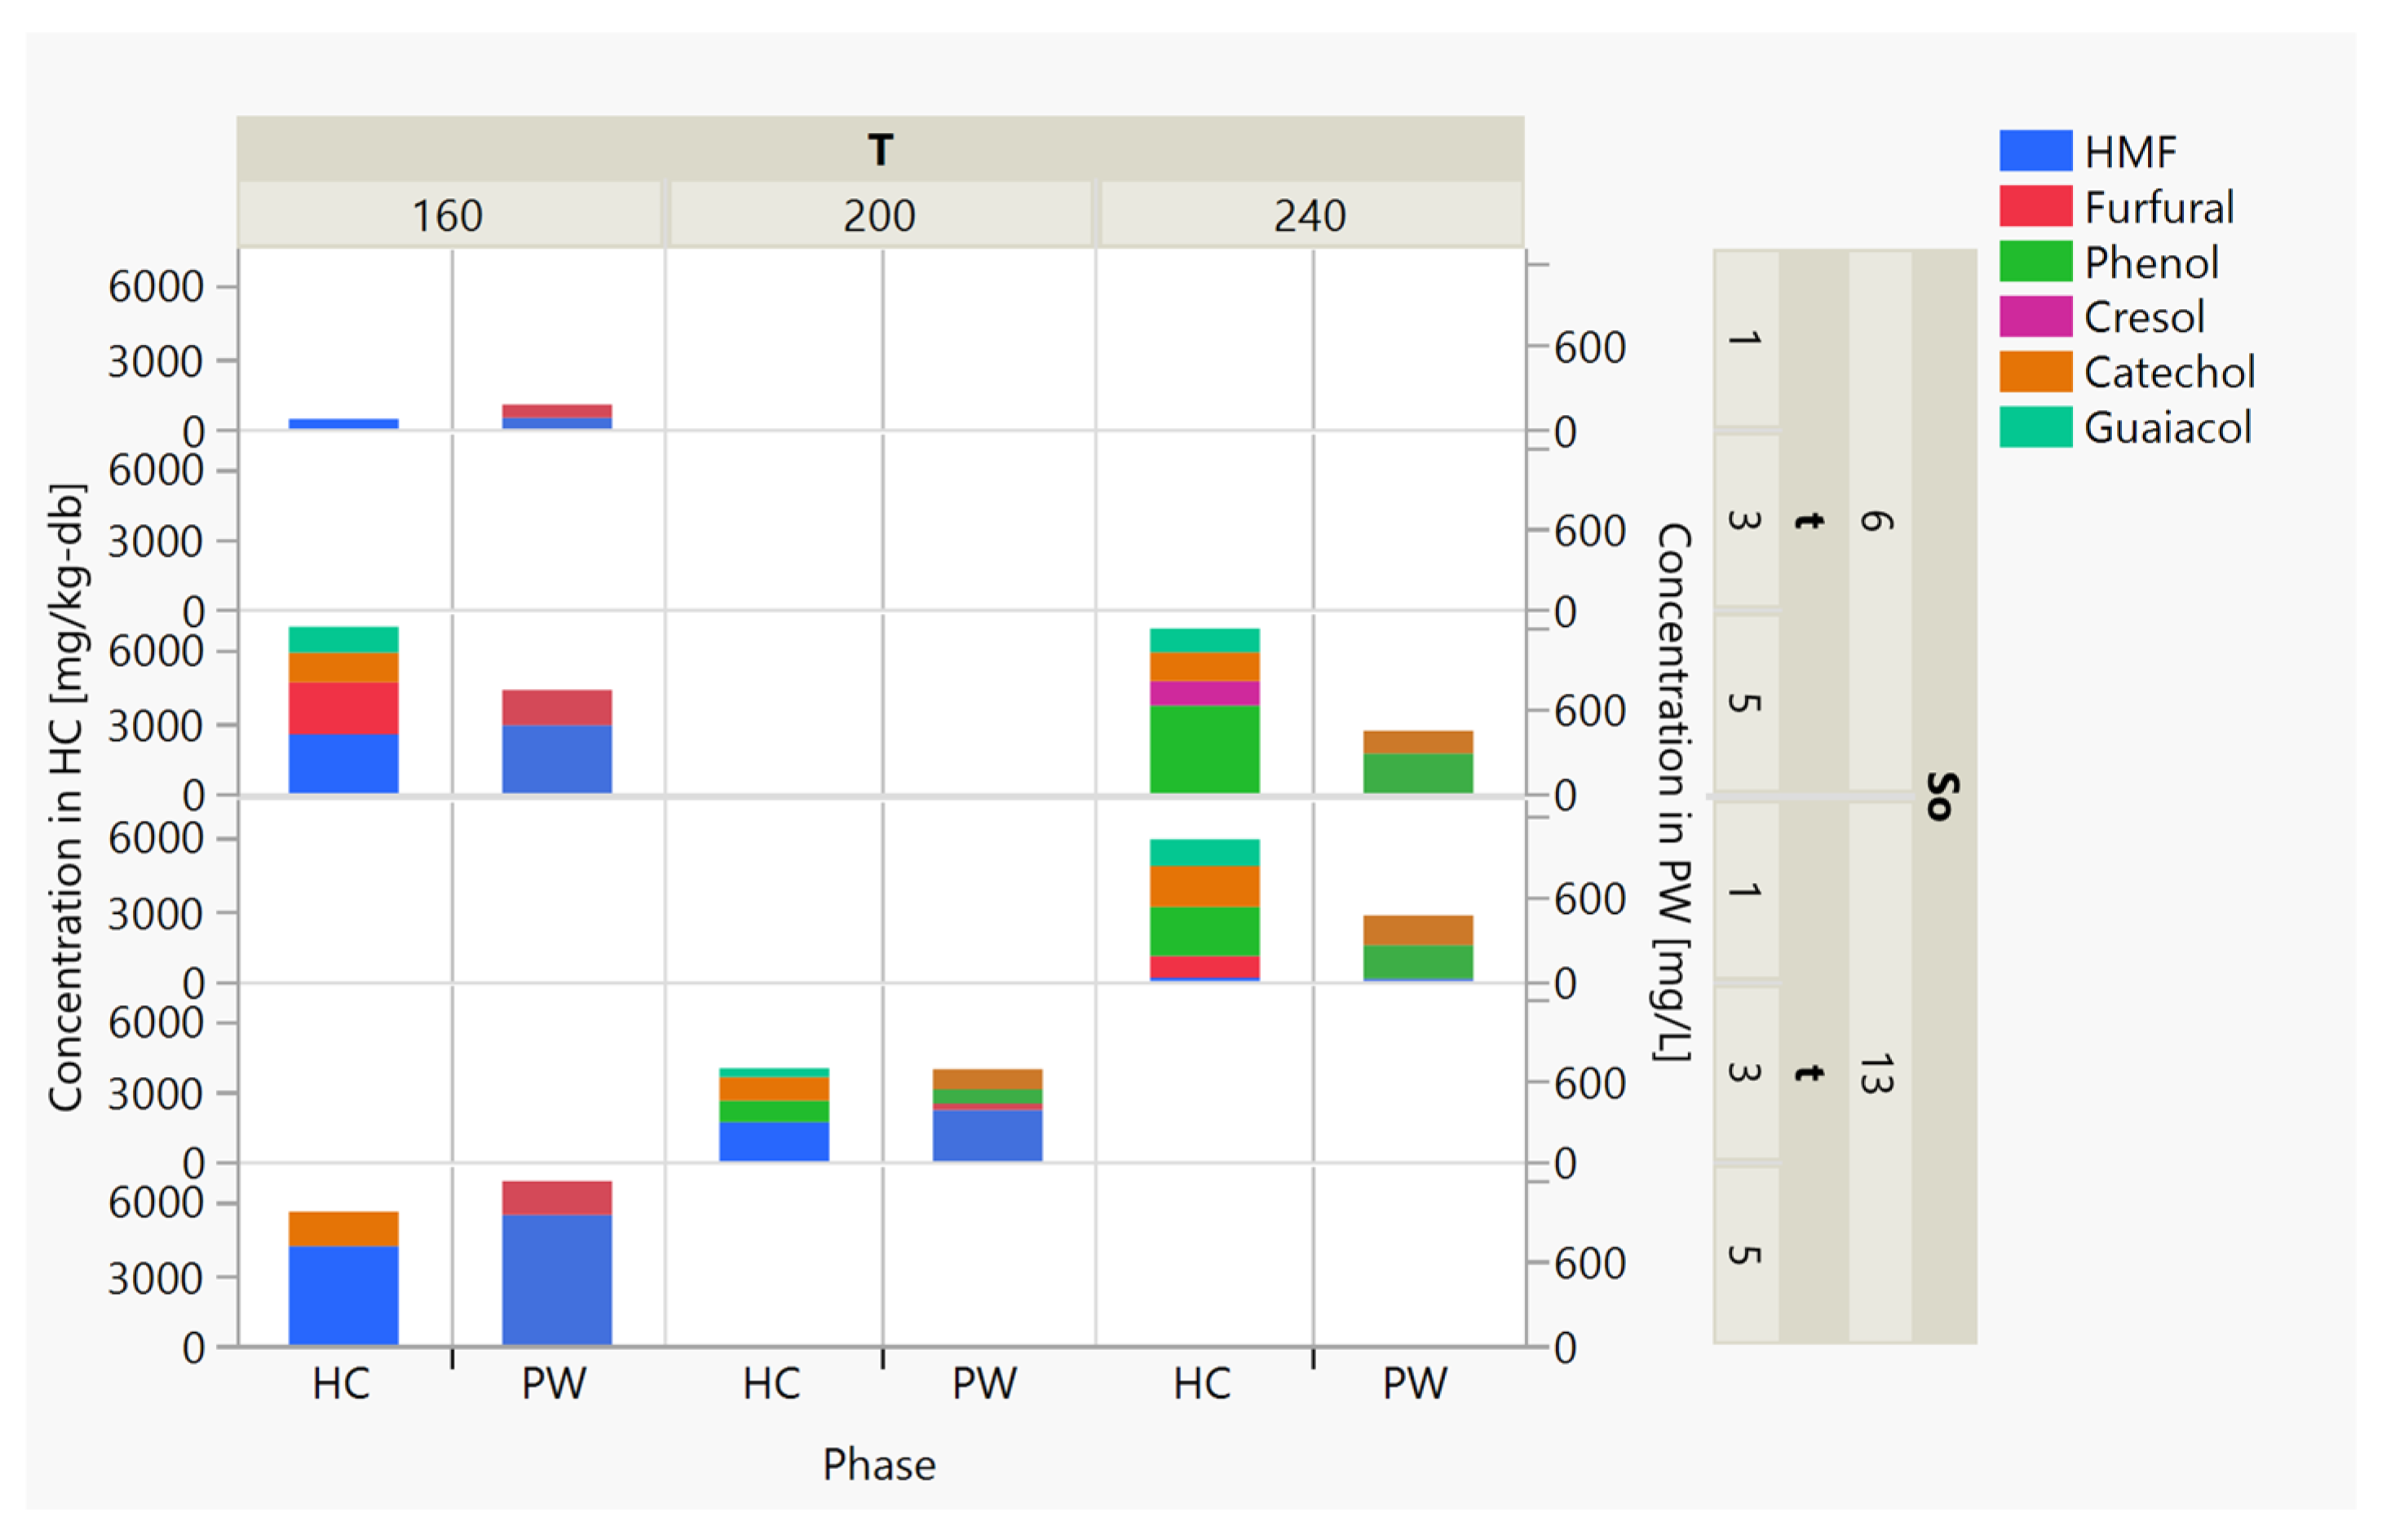
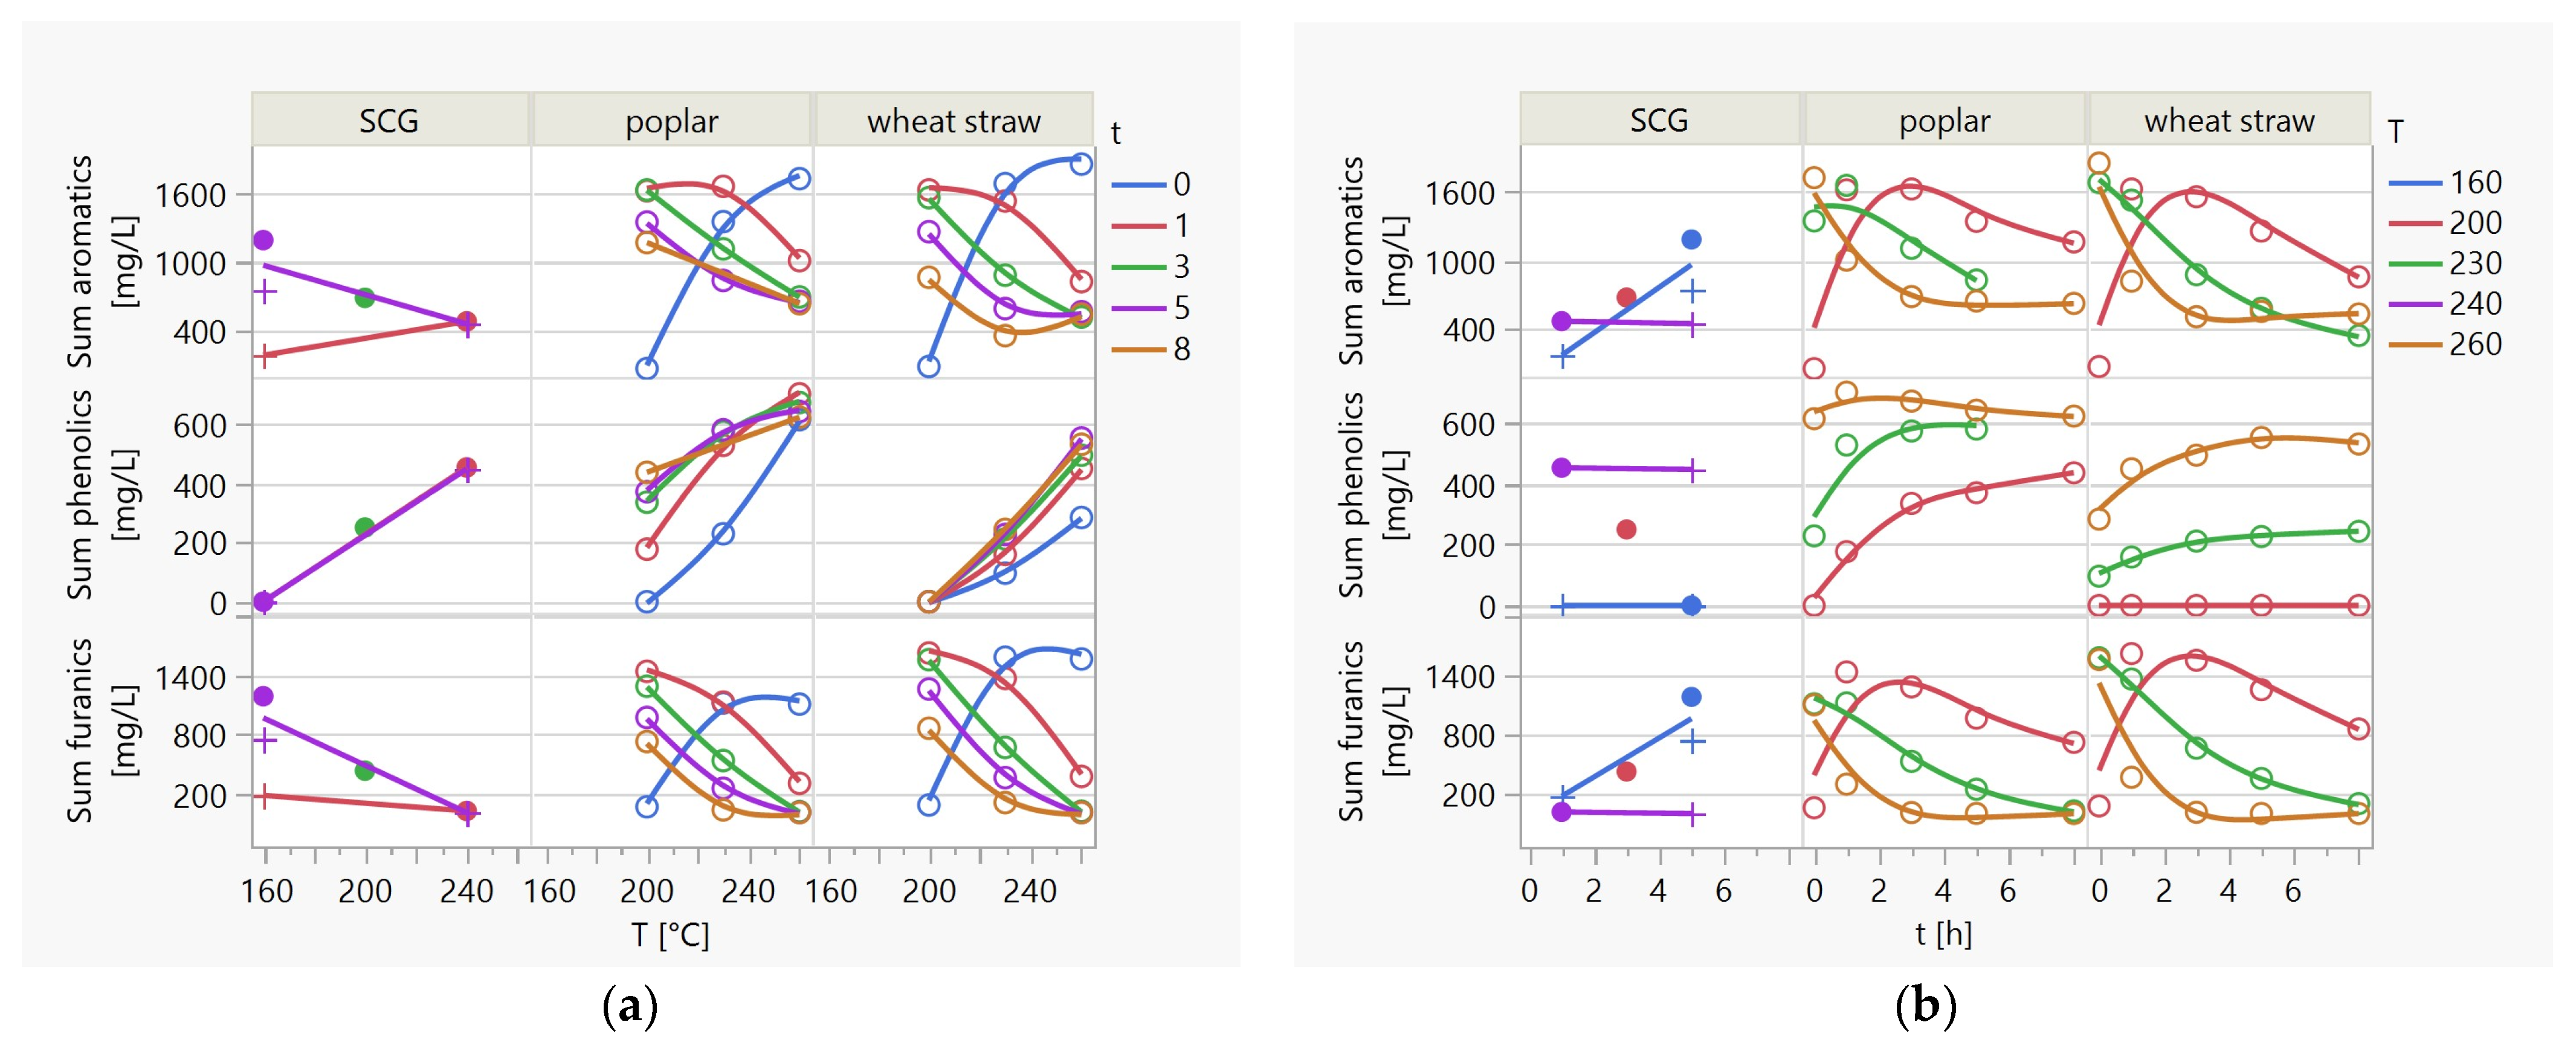
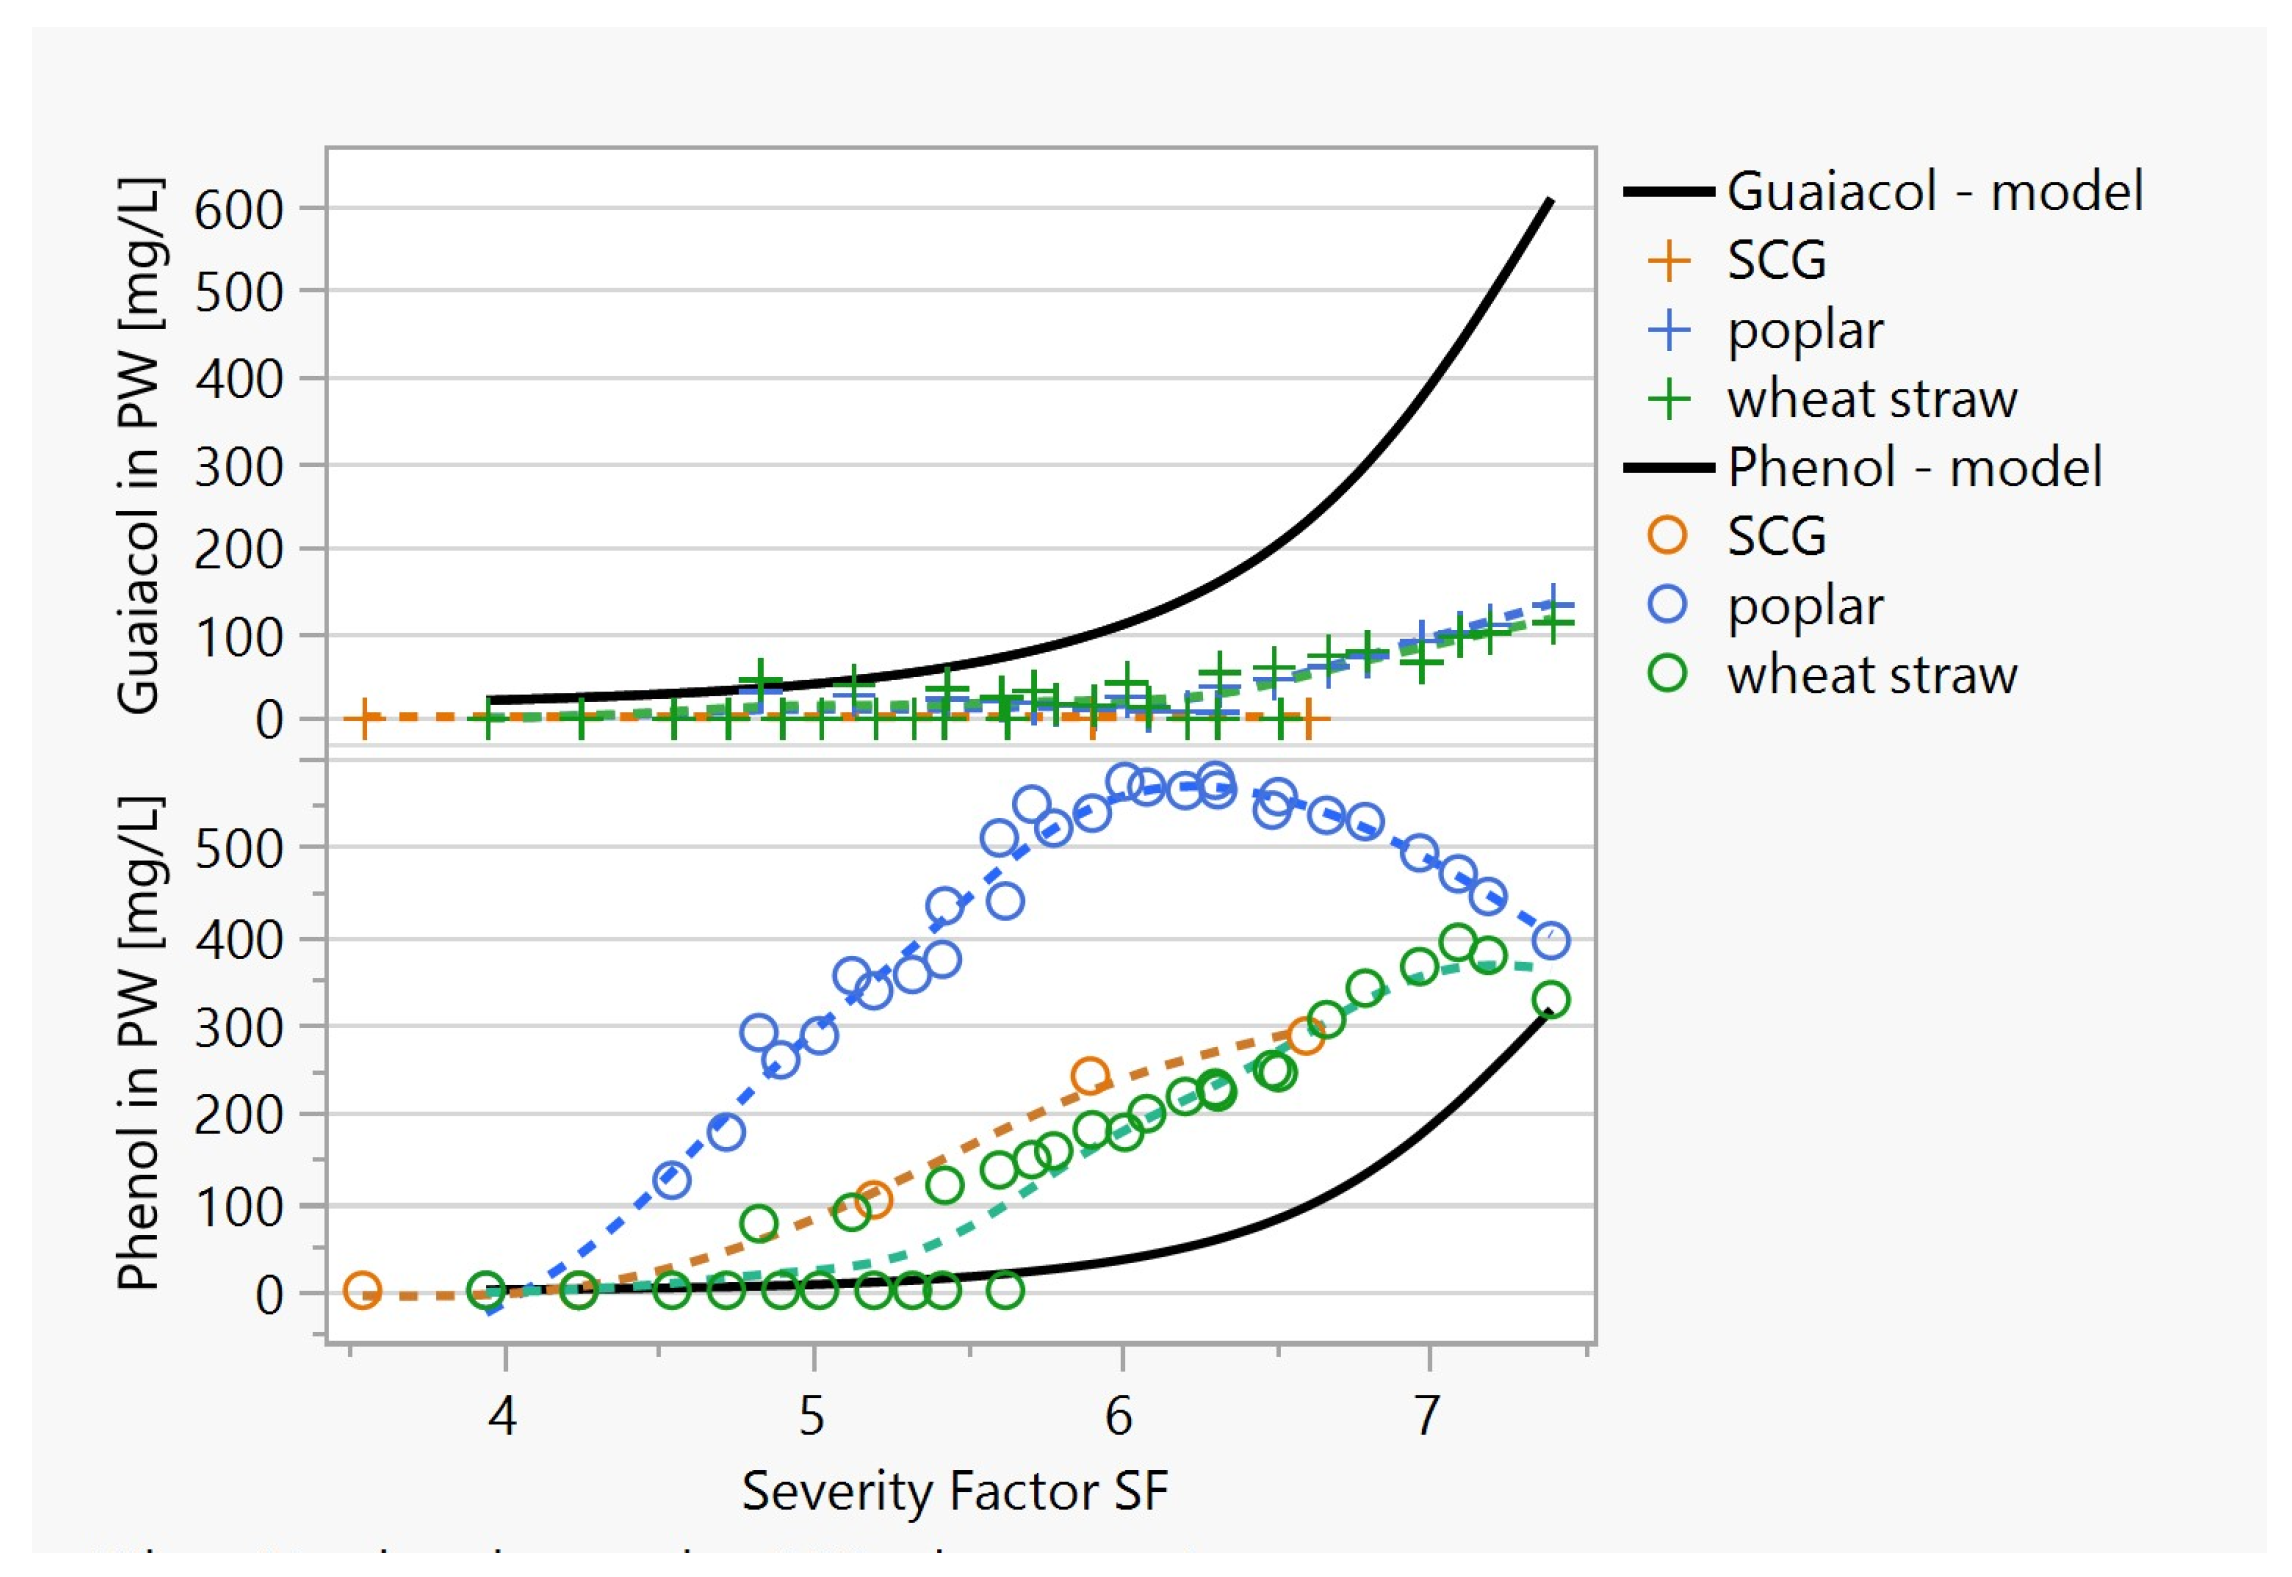
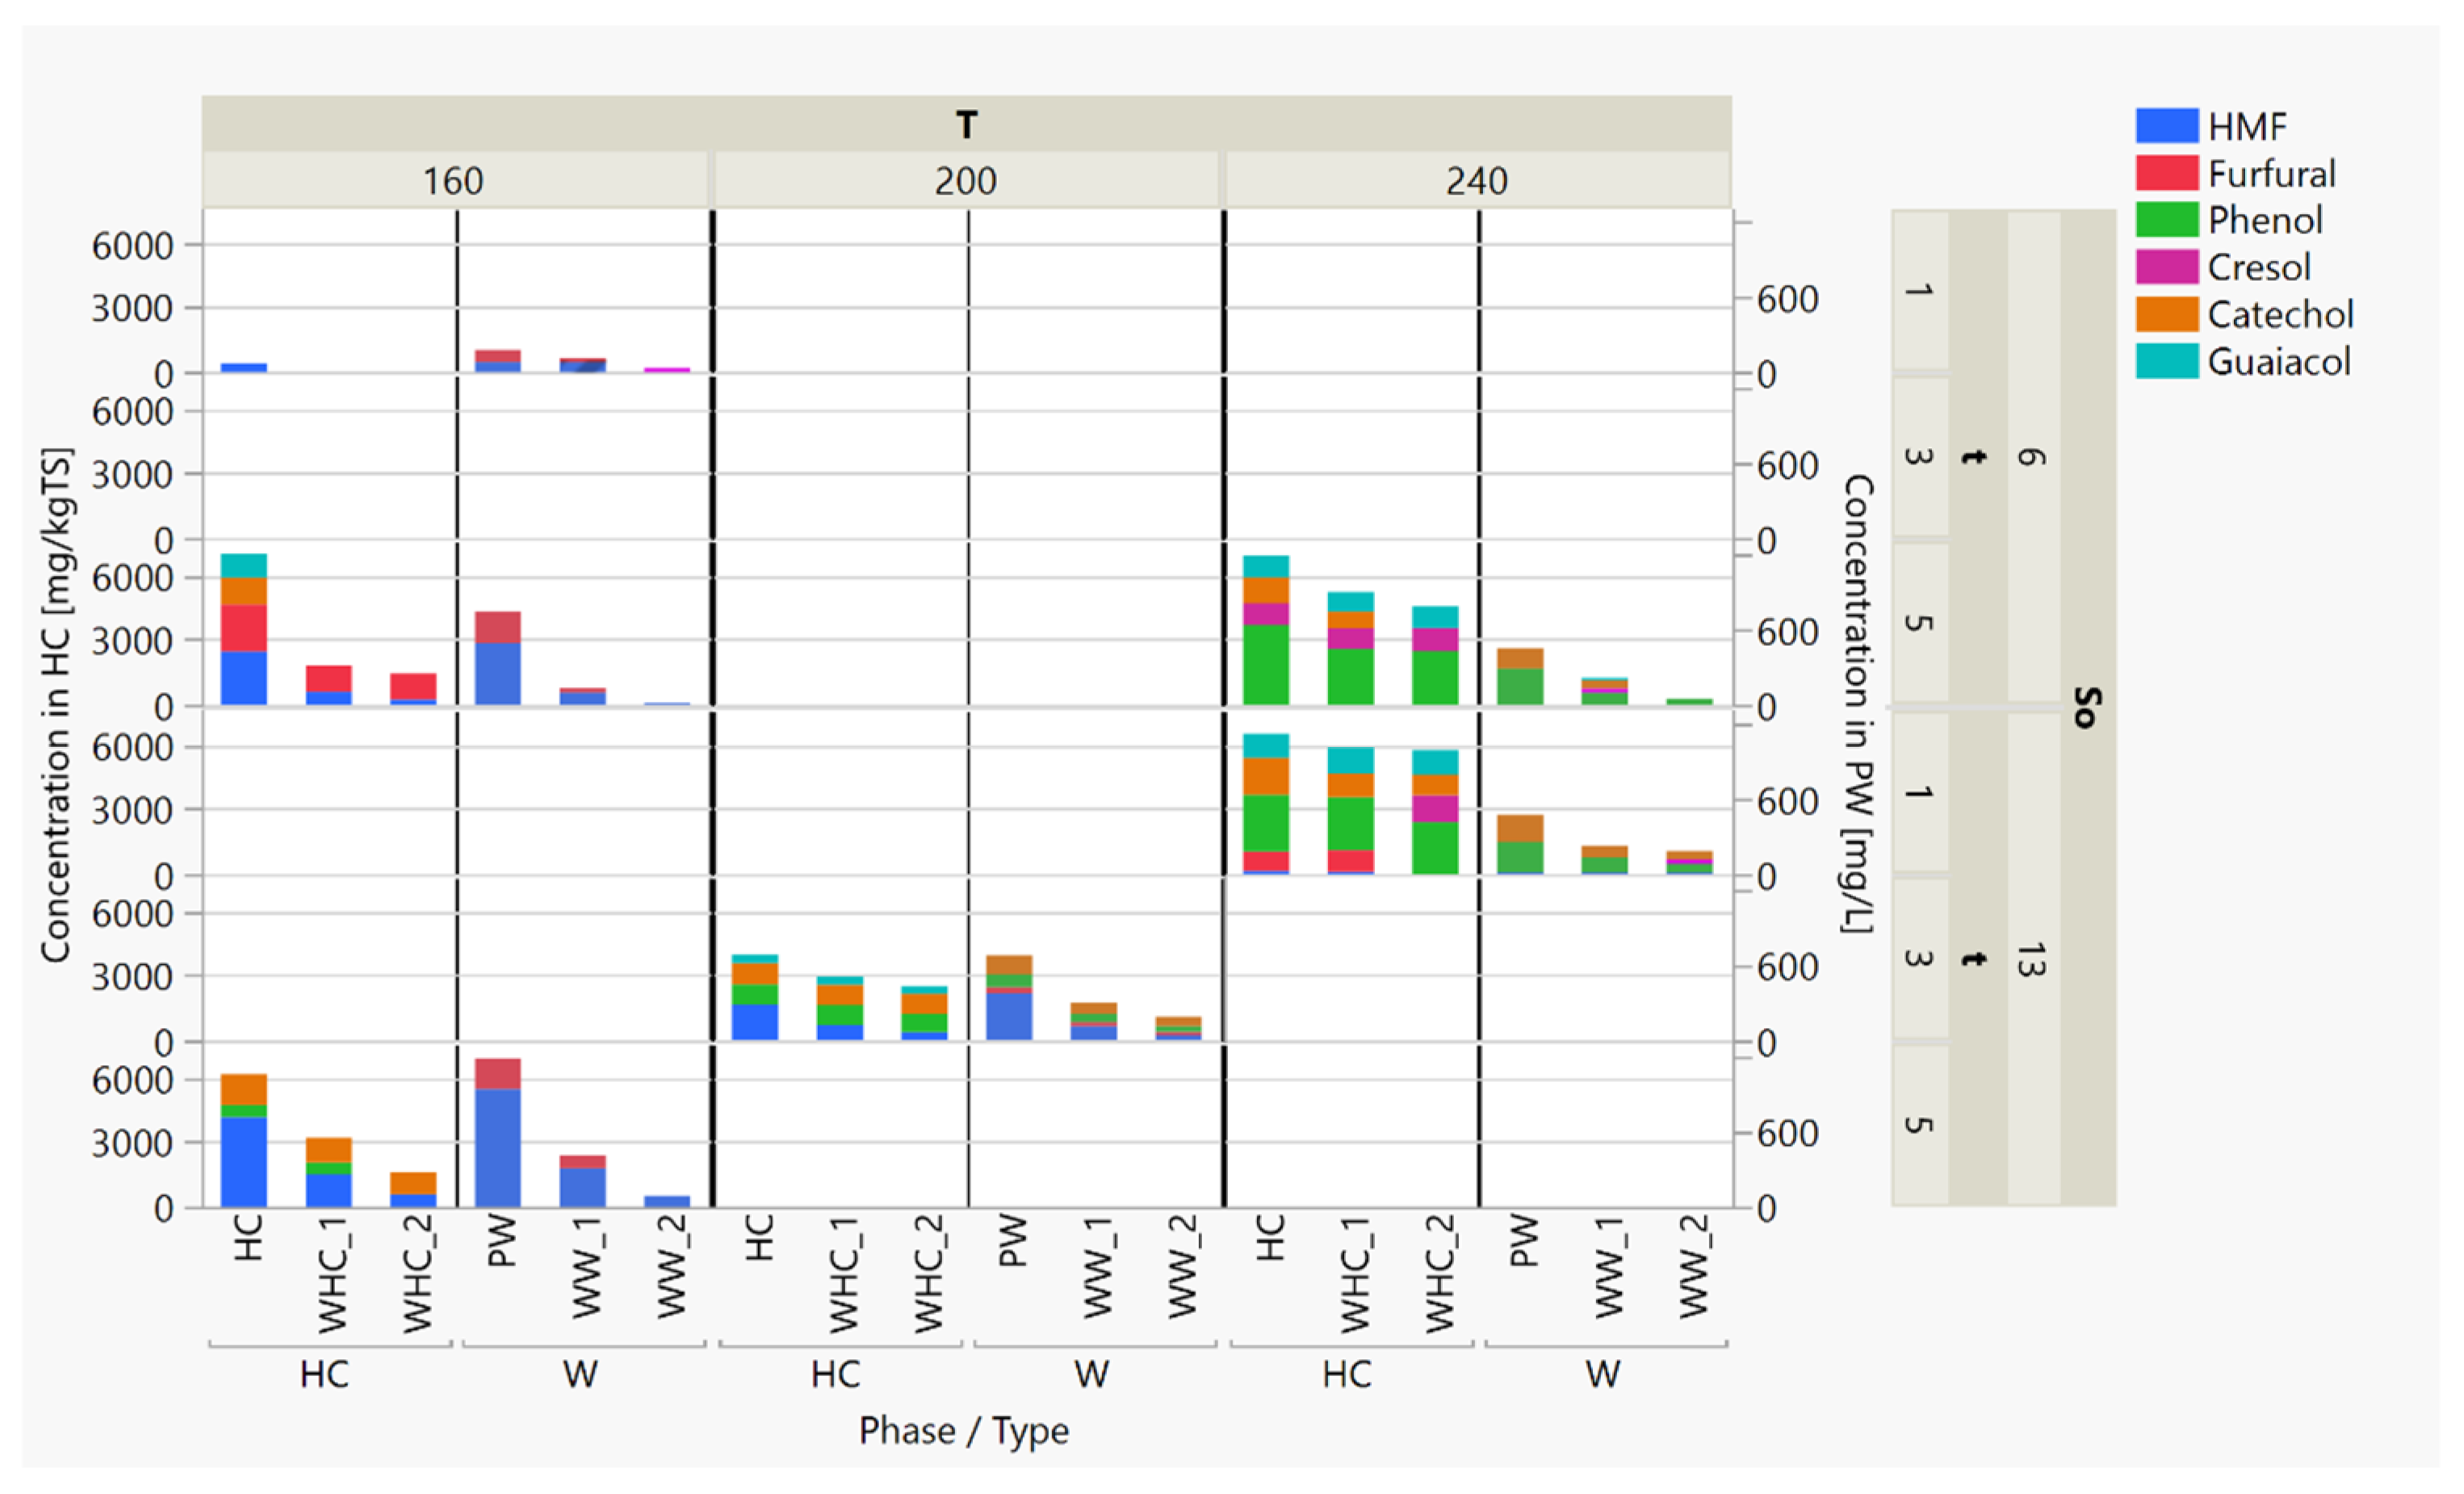
3.3.1. The Production of Simple Aromatic Compounds in the HTC Process
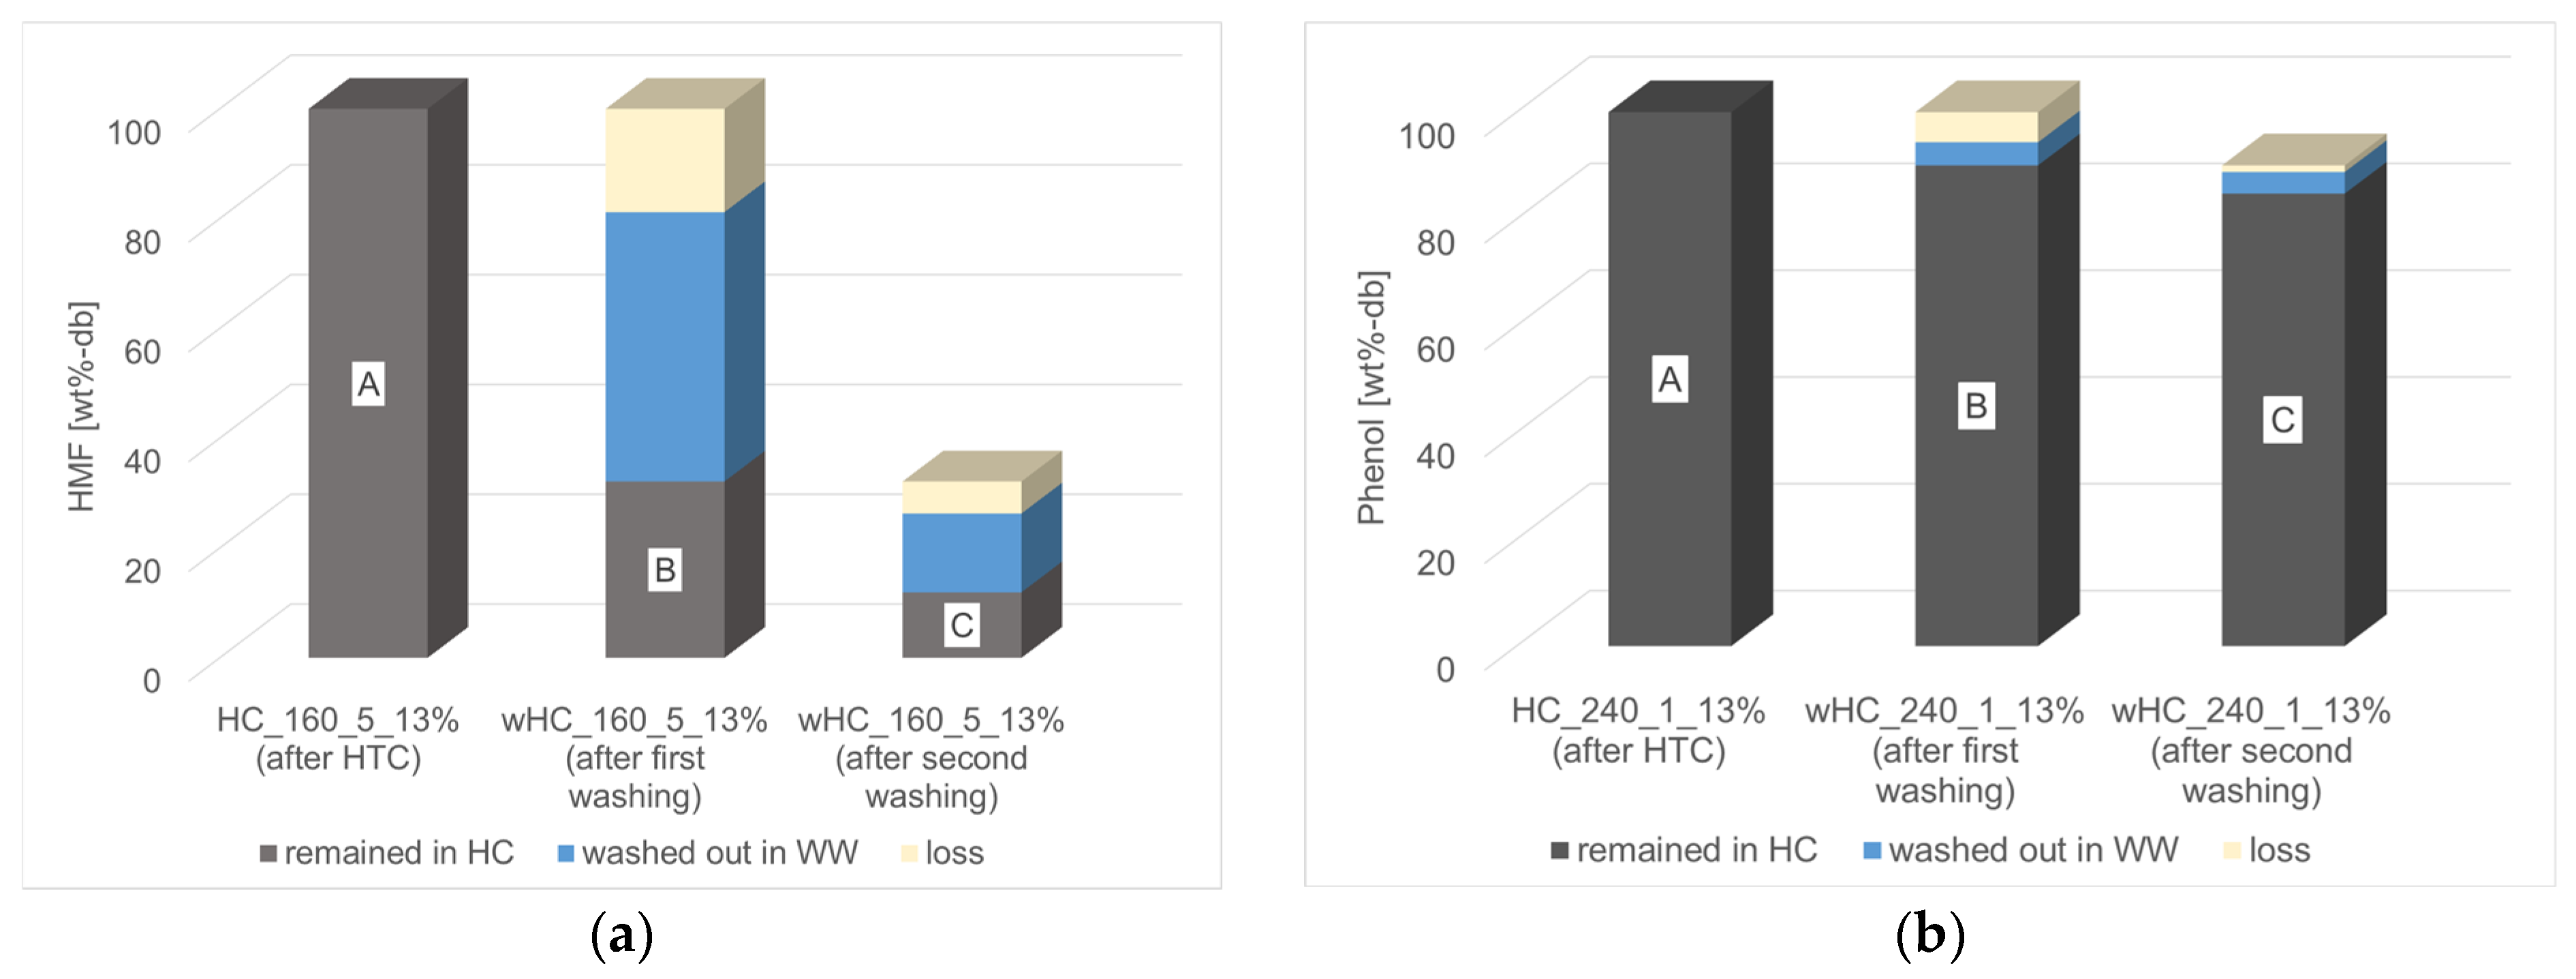
3.3.2. Char Washing
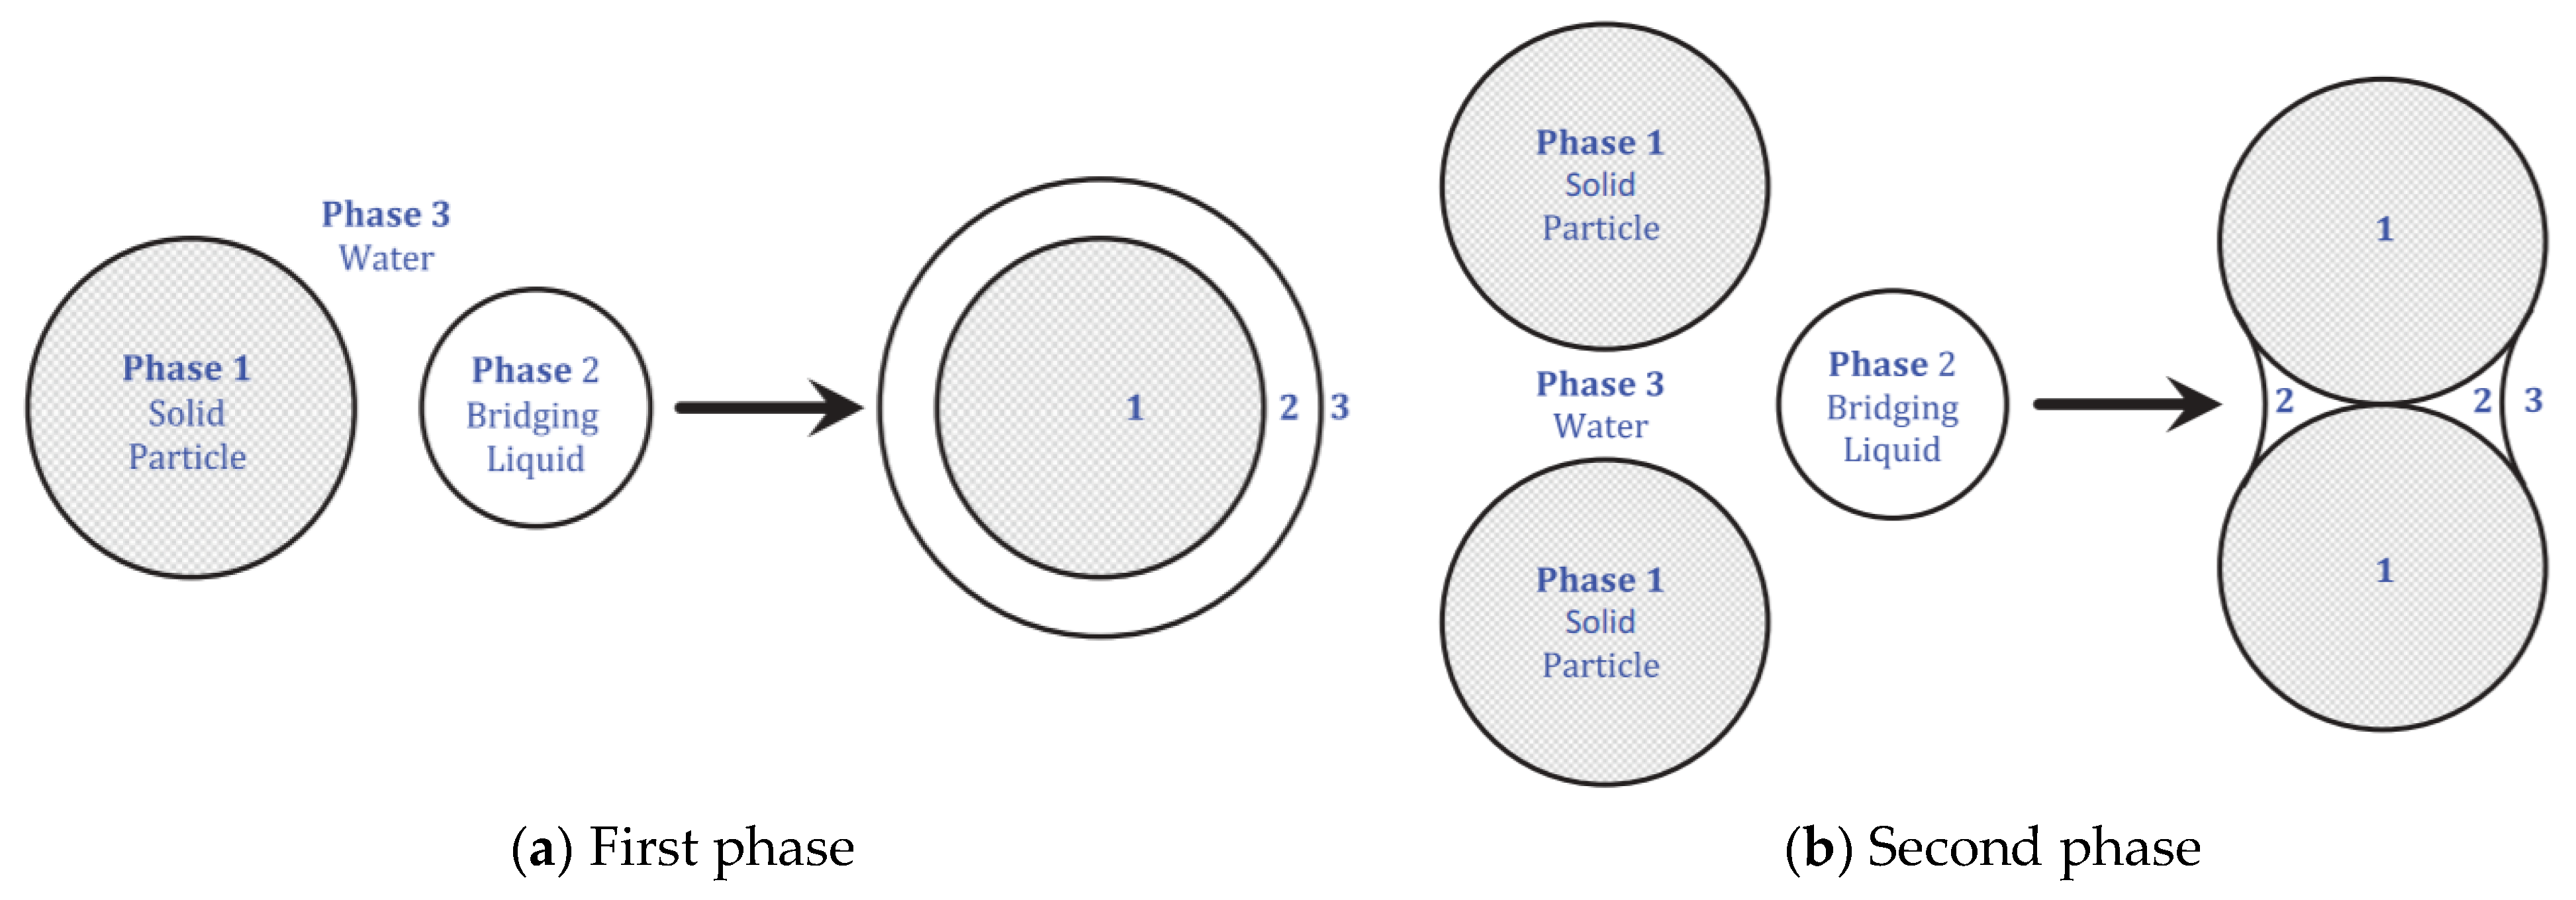
3.4. HTC Post-Treatment: Agglomeration
4. Conclusions
Supplementary Materials
Author Contributions
Funding
Institutional Review Board Statement
Informed Consent Statement
Data Availability Statement
Acknowledgments
Conflicts of Interest
References
- ICO. Coffee Market Report July 2023. Available online: https://icocoffee.org/ (accessed on 12 November 2022).
- Kovalcik, A.; Obruca, S.; Marova, I. Valorization of spent coffee grounds: A review. Food Bioprod. Process. 2018, 110, 104–119. [Google Scholar] [CrossRef]
- Bejenari, V.; Marcu, A.; Ipate, A.-M.; Rusu, D.; Tudorachi, N.; Anghel, I.; Şofran, I.-E.; Lisa, G. Physicochemical characterization and energy recovery of spent coffee grounds. J. Mater. Res. Technol. 2021, 15, 4437–4451. [Google Scholar] [CrossRef]
- Fehse, F.; Kummich, J.; Schröder, H.-W. Influence of pre-treatment and variation of briquetting parameters on the mechanical refinement of spent coffee grounds. Biomass Bioenergy 2021, 152, 106201. [Google Scholar] [CrossRef]
- De Freitas, C.P.M.; Marangon, B.B.; Pereira, E.G.; Renato, N.D.S. Exploring Spent Coffee Grounds Energy Potential In The Brazilian Scenario. Eng. Agríc. 2023, 43, e20220141. [Google Scholar] [CrossRef]
- Santos, C.; Fonseca, J.; Aires, A.; Coutinho, J.; Trindade, H. Effect of different rates of spent coffee grounds (SCG) on composting process, gaseous emissions and quality of end-product. Waste Manag. 2017, 59, 37–47. [Google Scholar] [CrossRef] [PubMed]
- de Bomfim, A.S.C.; de Oliveira, D.M.; Walling, E.; Babin, A.; Hersant, G.; Vaneeckhaute, C.; Dumont, M.-J.; Rodrigue, D. Spent Coffee Grounds Characterization and Reuse in Composting and Soil Amendment. Waste 2022, 1, 2–20. [Google Scholar] [CrossRef]
- Yang, J.; Zhao, Z.; Hu, Y.; Abbey, L.; Cesarino, I.; Goonetilleke, A.; He, Q. Exploring the Properties and Potential Uses of Biocarbon from Spent Coffee Grounds: A Comparative Look at Dry and Wet Processing Methods. Processes 2023, 11, 2099. [Google Scholar] [CrossRef]
- Tun, M.M.; Raclavská, H.; Juchelková, D.; Růžičková, J.; Šafář, M.; Štrbová, K.; Gikas, P. Spent coffee ground as renewable energy source: Evaluation of the drying processes. J. Environ. Manag. 2020, 275, 111204. [Google Scholar] [CrossRef]
- Susilayati, M.; Marwoto, P.; Priatmoko, S. Characterization of Spent Coffee Grounds in the Community as Supporting Materials for Renewable Energy. J. Penelit. Pendidik. IPA 2022, 8, 918–924. [Google Scholar] [CrossRef]
- Turek, M.E.; Freitas, K.S.; Armindo, R.A. Spent coffee grounds as organic amendment modify hydraulic properties in a sandy loam Brazilian soil. Agric. Water Manag. 2019, 222, 313–321. [Google Scholar] [CrossRef]
- Horgan, F.G.; Floyd, D.; Mundaca, E.A.; Crisol-Martínez, E. Spent Coffee Grounds Applied as a Top-Dressing or Incorporated into the Soil Can Improve Plant Growth While Reducing Slug Herbivory. Agriculture 2023, 13, 257. [Google Scholar] [CrossRef]
- de Carvalho Ramos, N.; Campos, T.M.B.; de La Paz, I.S.; Machado, J.P.B.; Bottino, M.A.; Cesar, P.F.; De Melo, R.M. Microstructure characterization and SCG of newly engineered dental ceramics. Dent. Mater. 2016, 32, 870–878. [Google Scholar] [CrossRef] [PubMed]
- Luna-Lama, F.; Rodríguez-Padrón, D.; Puente-Santiago, A.R.; Muñoz-Batista, M.J.; Caballero, A.; Balu, A.M.; Romero, A.A.; Luque, R. Non-porous carbonaceous materials derived from coffee waste grounds as highly sustainable anodes for lithium-ion batteries. J. Clean. Prod. 2019, 207, 411–417. [Google Scholar] [CrossRef]
- Limousy, L.; Jeguirim, M.; Dutournié, P.; Kraiem, N.; Lajili, M.; Said, R. Gaseous products and particulate matter emissions of biomass residential boiler fired with spent coffee grounds pellets. Fuel 2013, 107, 323–329. [Google Scholar] [CrossRef]
- Park, J.E.; Lee, G.B.; Jeong, C.J.; Kim, H.; Kim, C.G. Determination of Relationship between Higher Heating Value and Atomic Ratio of Hydrogen to Carbon in Spent Coffee Grounds by Hydrothermal Carbonization. Energies 2021, 14, 6551. [Google Scholar] [CrossRef]
- Hu, Y.; Gallant, R.; Salaudeen, S.; Farooque, A.A.; He, S. Hydrothermal Carbonization of Spent Coffee Grounds for Producing Solid Fuel. Sustainability 2022, 14, 8818. [Google Scholar] [CrossRef]
- Farru, G.; Dang, C.H.; Schultze, M.; Kern, J.; Cappai, G.; Libra, J.A. Benefits and Limitations of Using Hydrochars from Organic Residues as Replacement for Peat on Growing Media. Horticulturae 2022, 8, 325. [Google Scholar] [CrossRef]
- Zhang, X.; Zhang, Y.; Ngo, H.H.; Guo, W.; Wen, H.; Zhang, D.; Li, C.; Qi, L. Characterization and sulfonamide antibiotics adsorption capacity of spent coffee grounds based biochar and hydrochar. Sci. Total Environ. 2020, 716, 137015. [Google Scholar] [CrossRef]
- Santana, M.S.; Alves, R.P.; Santana, L.S.; Gonçalves, M.A.; Guerreiro, M.C. Structural, inorganic, and adsorptive properties of hydrochars obtained by hydrothermal carbonization of coffee waste. J. Environ. Manag. 2022, 302, 114021. [Google Scholar] [CrossRef]
- Funke, A.; Ziegler, F. Hydrothermal carbonization of biomass: A summary and discussion of chemical mechanisms for process engineering. Biofuels Bioprod. Biorefining 2010, 4, 160–177. [Google Scholar] [CrossRef]
- Libra, J.A.; Ro, K.S.; Kammann, C.; Funke, A.; Berge, N.D.; Neubauer, Y.; Titirici, M.-M.; Fühner, C.; Bens, O.; Kern, J.; et al. Hydrothermal carbonization of biomass residuals: A comparative review of the chemistry, processes and applications of wet and dry pyrolysis. Biofuels 2011, 2, 71–106. [Google Scholar] [CrossRef]
- Ducey, T.F.; Collins, J.C.; Ro, K.S.; Woodbury, B.L.; Griffin, D.D. Hydrothermal carbonization of livestock mortality for the reduction of pathogens and microbially-derived DNA. Front. Environ. Sci. Eng. 2017, 11, 9. [Google Scholar] [CrossRef]
- Román, S.; Nabais, J.M.V.; Laginhas, C.; Ledesma, B.; González, J.F. Hydrothermal carbonization as an effective way of densifying the energy content of biomass. Fuel Process. Technol. 2012, 103, 78–83. [Google Scholar] [CrossRef]
- Kim, D.; Lee, K.; Bae, D.; Park, K.Y. Characterizations of biochar from hydrothermal carbonization of exhausted coffee residue. J. Mater. Cycles Waste Manag. 2017, 19, 1036–1043. [Google Scholar] [CrossRef]
- Afolabi, O.O.D.; Sohail, M.; Cheng, Y.-L. Optimisation and characterisation of hydrochar production from spent coffee grounds by hydrothermal carbonisation. Renew. Energy 2020, 147, 1380–1391. [Google Scholar] [CrossRef]
- Sermyagina, E.; Mendoza, C.; Deviatkin, I. Effect of hydrothermal carbonization and torrefaction on spent coffee grounds. Agron. Res. 2021, 19. [Google Scholar] [CrossRef]
- Marzban, N.; Libra, J.A.; Hosseini, S.H.; Fischer, M.G.; Rotter, V.S. Experimental evaluation and application of genetic programming to develop predictive correlations for hydrochar higher heating value and yield to optimize the energy content. J. Environ. Chem. Eng. 2022, 10, 108880. [Google Scholar] [CrossRef]
- Moloeznik Paniagua, D.; Libra, J.A.; Rotter, V.S.; Ro, K.S.; Fischer, M.; Linden, J. Enhancing Fuel Properties of Napier Grass via Carbonization: A Comparison of Vapothermal and Hydrothermal Carbonization Treatments. Agronomy 2023, 13, 2881. [Google Scholar] [CrossRef]
- Reza, M.T.; Wirth, B.; Lüder, U.; Werner, M. Behavior of selected hydrolyzed and dehydrated products during hydrothermal carbonization of biomass. Bioresour. Technol. 2014, 169, 352–361. [Google Scholar] [CrossRef]
- Borrero-López, A.M.; Masson, E.; Celzard, A.; Fierro, V. Modelling the production of solid and liquid products from the hydrothermal carbonisation of two biomasses. Ind. Crops Prod. 2020, 151, 112452. [Google Scholar] [CrossRef]
- Erdogan, E.; Atila, B.; Mumme, J.; Reza, M.T.; Toptas, A.; Elibol, M.; Yanik, J. Characterization of products from hydrothermal carbonization of orange pomace including anaerobic digestibility of process liquor. Bioresour. Technol. 2015, 196, 35–42. [Google Scholar] [CrossRef]
- Ipiales, R.P.; de la Rubia, M.A.; Diaz, E.; Mohedano, A.F.; Rodriguez, J.J. Integration of Hydrothermal Carbonization and Anaerobic Digestion for Energy Recovery of Biomass Waste: An Overview. Energy Fuels 2021, 35, 17032–17050. [Google Scholar] [CrossRef]
- EPA. Integrated Risk Information System: Phenol. Available online: https://www.epa.gov/iris (accessed on 11 December 2023).
- Downs, J.; Wills, B. Phenol Toxicity. Phenol Toxicity. [Updated 13 March 2023]. In StatPearls; StatPearls Publishing: Treasure Island, FL, USA, 2023. Available online: https://www.ncbi.nlm.nih.gov/books/NBK542311/ (accessed on 13 October 2023).
- Bargmann, I.; Rillig, M.C.; Buss, W.; Kruse, A.; Kuecke, M. Hydrochar and Biochar Effects on Germination of Spring Barley. J. Agron. Crop Sci. 2013, 199, 360–373. [Google Scholar] [CrossRef]
- Karatas, O.; Khataee, A.; Kalderis, D. Recent progress on the phytotoxic effects of hydrochars and toxicity reduction approaches. Chemosphere 2022, 298, 134357. [Google Scholar] [CrossRef] [PubMed]
- Chakrabarti, S.; Dicke, C.; Kalderis, D.; Kern, J. Rice husks and their hydrochars cause unexpected stress response in the nematode Caenorhabditis elegans: Reduced transcription of stress-related genes. Environ. Sci. Pollut. Res. 2015, 22, 12092–12103. [Google Scholar] [CrossRef] [PubMed]
- Fan, G.; Tong, F.; Zhang, W.; Shi, G.; Chen, W.; Liu, L.; Li, J.; Zhang, Z.; Gao, Y. The effect of organic solvent washing on the structure of hydrochar-based dissolved organic matters and its potential environmental toxicity. Environ. Sci. Pollut. Res. 2021, 28, 26584–26594. [Google Scholar] [CrossRef] [PubMed]
- Cervera-Mata, A.; Lara, L.; Fernández-Arteaga, A.; Ángel Rufián-Henares, J.; Delgado, G. Washed hydrochar from spent coffee grounds: A second generation of coffee residues. Evaluation as organic amendment. Waste Manag. 2021, 120, 322–329. [Google Scholar] [CrossRef]
- Hoekman, S.K.; Broch, A.; Felix, L.; Farthing, W. Hydrothermal carbonization (HTC) of loblolly pine using a continuous, reactive twin-screw extruder. Energy Convers. Manag. 2017, 134, 247–259. [Google Scholar] [CrossRef]
- Mohammadi, A. Overview of the Benefits and Challenges Associated with Pelletizing Biochar. Processes 2021, 9, 1591. [Google Scholar] [CrossRef]
- Colantoni, A.; Paris, E.; Bianchini, L.; Ferri, S.; Marcantonio, V.; Carnevale, M.; Palma, A.; Civitarese, V.; Gallucci, F. Spent coffee ground characterization, pelletization test and emissions assessment in the combustion process. Sci. Rep. 2021, 11, 5119. [Google Scholar] [CrossRef]
- Woo, D.-G.; Kim, S.H.; Kim, T.H. Solid Fuel Characteristics of Pellets Comprising Spent Coffee Grounds and Wood Powder. Energies 2021, 14, 371. [Google Scholar] [CrossRef]
- Mort, P.R. Scale-up of binder agglomeration processes. Powder Technol. 2005, 150, 86–103. [Google Scholar] [CrossRef]
- Briens, L.; Bowden-Green, B. A comparison of drum granulation of biochars. Powder Technol. 2019, 343, 723–732. [Google Scholar] [CrossRef]
- Jones, B.; Nachtsheim, C.J. A Class of Three-Level Designs for Definitive Screening in the Presence of Second-Order Effects. J. Qual. Technol. 2011, 43, 1–15. [Google Scholar] [CrossRef]
- Montgomery, D.C. Design and Analysis of Experiments, 8th ed.; Wiley: Hoboken, NJ, USA, 2012; ISBN 978-1-118-14692-7. [Google Scholar]
- Heidari, M.; Norouzi, O.; Salaudeen, S.; Acharya, B.; Dutta, A. Prediction of Hydrothermal Carbonization with Respect to the Biomass Components and Severity Factor. Energy Fuels 2019, 33, 9916–9924. [Google Scholar] [CrossRef]
- Ruiz, H.A.; Galbe, M.; Garrote, G.; Ramirez-Gutierrez, D.M.; Ximenes, E.; Sun, S.-N.; Lachos-Perez, D.; Rodríguez-Jasso, R.M.; Sun, R.-C.; Yang, B.; et al. Severity factor kinetic model as a strategic parameter of hydrothermal processing (steam explosion and liquid hot water) for biomass fractionation under biorefinery concept. Bioresour. Technol. 2021, 342, 125961. [Google Scholar] [CrossRef]
- ISO 17225-8:2023; Solid Biofuels. International Organization for Standardization: Geneva, Switzerland, 2023.
- Özer, M.; Basha, O.M.; Morsi, B. Coal-Agglomeration Processes: A Review. Int. J. Coal Prep. Util. 2017, 37, 131–167. [Google Scholar] [CrossRef]
- Lu, X.; Pellechia, P.J.; Flora, J.R.V.; Berge, N.D. Influence of reaction time and temperature on product formation and characteristics associated with the hydrothermal carbonization of cellulose. Bioresour. Technol. 2013, 138, 180–190. [Google Scholar] [CrossRef]
- Nizamuddin, S.; Baloch, H.A.; Griffin, G.J.; Mubarak, N.M.; Bhutto, A.W.; Abro, R.; Mazari, S.A.; Ali, B.S. An overview of effect of process parameters on hydrothermal carbonization of biomass. Renew. Sustain. Energy Rev. 2017, 73, 1289–1299. [Google Scholar] [CrossRef]
- Ro, K.S.; Flora, J.R.V.; Bae, S.; Libra, J.A.; Berge, N.D.; Álvarez-Murillo, A.; Li, L. Properties of Animal-Manure-Based Hydrochars and Predictions Using Published Models. ACS Sustain. Chem. Eng. 2017, 5, 7317–7324. [Google Scholar] [CrossRef]
- Wüst, D.; Correa, C.R.; Jung, D.; Zimmermann, M.; Kruse, A.; Fiori, L. Understanding the influence of biomass particle size and reaction medium on the formation pathways of hydrochar. Biomass Convers. Biorefin. 2020, 10, 1357–1380. [Google Scholar] [CrossRef]
- Arauzo, P.J.; Lucian, M.; Du, L.; Olszewski, M.P.; Fiori, L.; Kruse, A. Improving the recovery of phenolic compounds from spent coffee grounds by using hydrothermal delignification coupled with ultrasound assisted extraction. Biomass Bioenergy 2020, 139, 105616. [Google Scholar] [CrossRef]
- Shen, H.; Luo, Z.; Xiong, R.; Liu, X.; Zhang, L.; Li, Y.; Du, W.; Chen, Y.; Cheng, H.; Shen, G.; et al. A critical review of pollutant emission factors from fuel combustion in home stoves. Environ. Int. 2021, 157, 106841. [Google Scholar] [CrossRef] [PubMed]
- Pereira, A.P.; Woodman, T.J.; Chuck, C.J. An integrated biorefinery to produce 5-(hydroxymethyl)furfural and alternative fuel precursors from macroalgae and spent coffee grounds. Sustain. Energy Fuels 2021, 5, 6189–6196. [Google Scholar] [CrossRef]
- Kruse, A.; Funke, A.; Titirici, M.-M. Hydrothermal conversion of biomass to fuels and energetic materials. Curr. Opin. Chem. Biol. 2013, 17, 515–521. [Google Scholar] [CrossRef]
- Park, J.; Nkurunziza, D.; Roy, V.C.; Ho, T.C.; Kim, S.; Lee, S.; Chun, B. Pretreatment processes assisted subcritical water hydrolysis for valorisation of spent coffee grounds. Int. J. Food Sci. Technol. 2022, 57, 5090–5101. [Google Scholar] [CrossRef]
- Upadhyay, R.; Mohan Rao, L.J. An Outlook on Chlorogenic Acids—Occurrence, Chemistry, Technology, and Biological Activities. Crit. Rev. Food Sci. Nutr. 2013, 53, 968–984. [Google Scholar] [CrossRef]
- Clifford, M.N. Miscellaneous phenols in foods and beverages–nature, occurrence and dietary burden. J. Sci. Food Agric. 2000, 80, 1126–1137. [Google Scholar] [CrossRef]
- Murkovic, M.; Bornik, M.-A. Formation of 5-hydroxymethyl-2-furfural (HMF) and 5-hydroxymethyl-2-furoic acid during roasting of coffee. Mol. Nutr. Food Res. 2007, 51, 390–394. [Google Scholar] [CrossRef]
- Liu, Q.; Zhou, P.; Luo, P.; Wu, P. Occurrence of Furfural and Its Derivatives in Coffee Products in China and Estimation of Dietary Intake. Foods 2023, 12, 200. [Google Scholar] [CrossRef]
- Panigrahy, N.; Priyadarshini, A.; Sahoo, M.M.; Verma, A.K.; Daverey, A.; Sahoo, N.K. A comprehensive review on eco-toxicity and biodegradation of phenolics: Recent progress and future outlook. Environ. Technol. Innov. 2022, 27, 102423. [Google Scholar] [CrossRef]
- Borrero-López, A.M.; Masson, E.; Celzard, A.; Fierro, V. Modelling the reactions of cellulose, hemicellulose and lignin submitted to hydrothermal treatment. Ind. Crops Prod. 2018, 124, 919–930. [Google Scholar] [CrossRef]
- Al-Wabel, M.I.; Rafique, M.I.; Ahmad, M.; Ahmad, M.; Hussain, A.; Usman, A.R.A. Pyrolytic and hydrothermal carbonization of date palm leaflets: Characteristics and ecotoxicological effects on seed germination of lettuce. Saudi J. Biol. Sci. 2019, 26, 665–672. [Google Scholar] [CrossRef] [PubMed]
- Johansen, A.; Schæfer, T. Effects of interactions between powder particle size and binder viscosity on agglomerate growth mechanisms in a high shear mixer. Eur. J. Pharm. Sci. 2001, 12, 297–309. [Google Scholar] [CrossRef]
- Incitec Pivot. Density and Sizing Report 2019. Available online: https://www.incitecpivotfertilisers.com.au/ (accessed on 13 November 2023).


| Codes | HTC Process Parameters | |||||||||
|---|---|---|---|---|---|---|---|---|---|---|
| Set | Runs | Unwashed HCs | Washed HCs | WCSCG [wt%] | Sizereactor [L] | %So [wt%-db] | T [°C] | t [h] | a [rpm] | SF [-] |
| DoE set-up | D_240_1_13% | HC_240_1_13% | wHC_ | 8 | 18.75 | 12.98 | 240 | 1 | 200 | 5.90 |
| D_160_5_6% | HC_160_5_6% | wHC_ | 8 | 18.75 | 6.02 | 160 | 5 | 200 | 4.24 | |
| D_240_5_6% | HC_240_5_6% | wHC_ | 8 | 18.75 | 6.00 | 240 | 5 | 200 | 6.60 | |
| D_160_1_6% | HC_160_1_6% | wHC_ | 8 | 18.75 | 6.02 | 160 | 1 | 200 | 3.54 | |
| D_200_3_13% | HC_200_3_13% | wHC_ | 8 | 18.75 | 12.96 | 200 | 3 | 200 | 5.20 | |
| D_160_5_13% | HC_160_5_13% | wHC_ | 8 | 18.75 | 12.94 | 160 | 5 | 200 | 4.24 | |
| Random set-up | R_230_3_20% | HC_230_3_20% | 55 | 1 | 20.11 | 230 | 3 | 90 | 6.08 | |
| R_250_3_20% | HC_250_3_20% | 55 | 1 | 20.07 | 250 | 3 | 90 | 6.67 | ||
| R_220_1_10% | HC_220_1_10% | 55 | 1.5 | 10.00 | 220 | 1 | 0 | 5.31 | ||
| R_240_1_10% | HC_240_1_10% | 55 | 1.5 | 10.00 | 240 | 1 | 0 | 5.90 | ||
| R_200_3_20% | HC_200_3_20% | 8 | 18.75 | 20.02 | 200 | 3 | 90 | 5.20 | ||
| R_220_3_0% | HC_220_3_20% | 8 | 18.75 | 20.04 | 220 | 3 | 90 | 5.79 | ||
| R_230_3_20% | HC_230_3_20% | 8 | 18.75 | 20.10 | 230 | 3 | 90 | 6.08 | ||
| Dependent Parameters | Correlations for HTC Outputs (SY, HHV, EY): from DoE Model (This Study) and GP Models (from Marzban et al., 2022) [28] | |
|---|---|---|
| For calculations from measured values | ||
| SY [wt%-db] | = (mass of HC/mass of FS) * 100% | (2) |
| EY [%] | = SY*(HHVHC/HHVFS) | (3) |
| So [wt%-db] | = (mass dry FS/(mass water in FS + mass added water)) * 100% | (4) |
| R [-] | = mass dry FS/mass total water | (5) |
| Developed in this study—DoE models | ||
| SY [wt%-db] | = 103.95 + (−0.24*T) + (0.18*t) + (0.63*%So) | (6) |
| HHV [MJ/kg] | = 10.06 + (0.09*T) + (0.37*t) + (−0.02*%So) | (7) |
| EY [%] | = 79.57 + (−0.06*T) + (0.99*t) + (0.83*%So) | (8) |
| For comparison—GP models | ||
| SY-OP [wt%-db] | based on the operating conditions = 82.96 + 48.95*R – 0.01454*t – 0.0006*T2 | (9) |
| HHV-EA [MJ/kg] | based on elemental composition of the HC (or FS) = 0.3853*Cchar + 44.98/Ochar | (10) |
| HHV-OP [MJ/kg] | based on measured HHV0–FS and HTC-operating conditions | (11) |
| EY-EA [%] | based on the elemental composition of FS and HC (no measured HHV) and SY-OP | (12) |
| EY-OP [%] | based on measured HHV0–FS value and HTC-operating conditions—using the HHV-OP and SY-OP correlations | (13) |
| EY-EA+OP [%] | based on the HHV-EA for FS, HHV-OP for HC and SY-OP correlations | (14) |
| HCs | mHC [g] | WCHC [wt%] | VWW1 = VWW2 [L] | TWW1 = TWW2 [°C] | tmix [mins] | wHCs |
|---|---|---|---|---|---|---|
| HC_240_1_13% | 3656.22 | 74.49 | 8.00 | 34.80 | 3–5 | wHC_240_1_13% |
| HC_160_5_6% | 2374.55 | 76.18 | 8.00 | 33.80 | 3–5 | wHC_160_5_6% |
| HC_240_5_6% | 1249.81 | 70.20 | 8.00 | 33.70 | 3–5 | wHC_240_5_6% |
| HC_160_1_6% | 2198.26 | 77.29 | 8.00 | 34.80 | 3–5 | wHC_160_1_6% |
| HC_200_3_13% | 4316.67 | 76.13 | 8.00 | 34.80 | 3–5 | wHC_200_3_13% |
| HC_160_5_13% | 4941.04 | 78.14 | 8.00 | 33.30 | 3–5 | wHC_160_5_13% |
| Materials, Additives, Binder | TS105 | Mass [g-db] | ||||||
|---|---|---|---|---|---|---|---|---|
| [wt%-db] | Exp. 1 (SCG_M) | Exp. 2 (SCG_gSM) | Exp. 3 (SCG_HM) | Exp. 4 (wHC160_M) | Exp. 5 (wHC200_St) | Exp. 6 (Mix_HC 200_St) | Exp. 7 (wHC240_HM) | |
| SCG | 96.10 | 192.20 | 172.98 | 172.98 | ||||
| wHC_160_5_13% | 19.70 | 29.55 | ||||||
| wHC_200_3_13% | 95.20 | 666.40 | 285.60 | |||||
| HC_200_3_20% | 25.34 | 51.95 | ||||||
| wHC_240_1_13% | 22.80 | 41.04 | ||||||
| Corn starch (St) | 96.90 | 145.35 | 29.07 | |||||
| Ground corn straw (gSt) | 97.30 | 19.46 | ||||||
| Ground hemp leaves (H) | 95.10 | 19.02 | 19.02 | |||||
| Methylcellulose acetate (M) | - | 10.26 | 28.88 | 28.69 | 7.60 | 0.00 | 0.00 | 28.12 |
| Total mass of mixture [g-db] | - | 202.46 | 221.32 | 220.69 | 37.15 | 811.75 | 366.62 | 88.18 |
| Total mass of water added [g-wb] | 267.54 | 738.68 | 734.31 | 312.85 | 38.25 | 168.38 | 851.82 | |
| Total mass of mixture [g-wb] | 470.00 | 960.00 | 955.00 | 350.00 | 850.00 | 535.00 | 940.00 | |
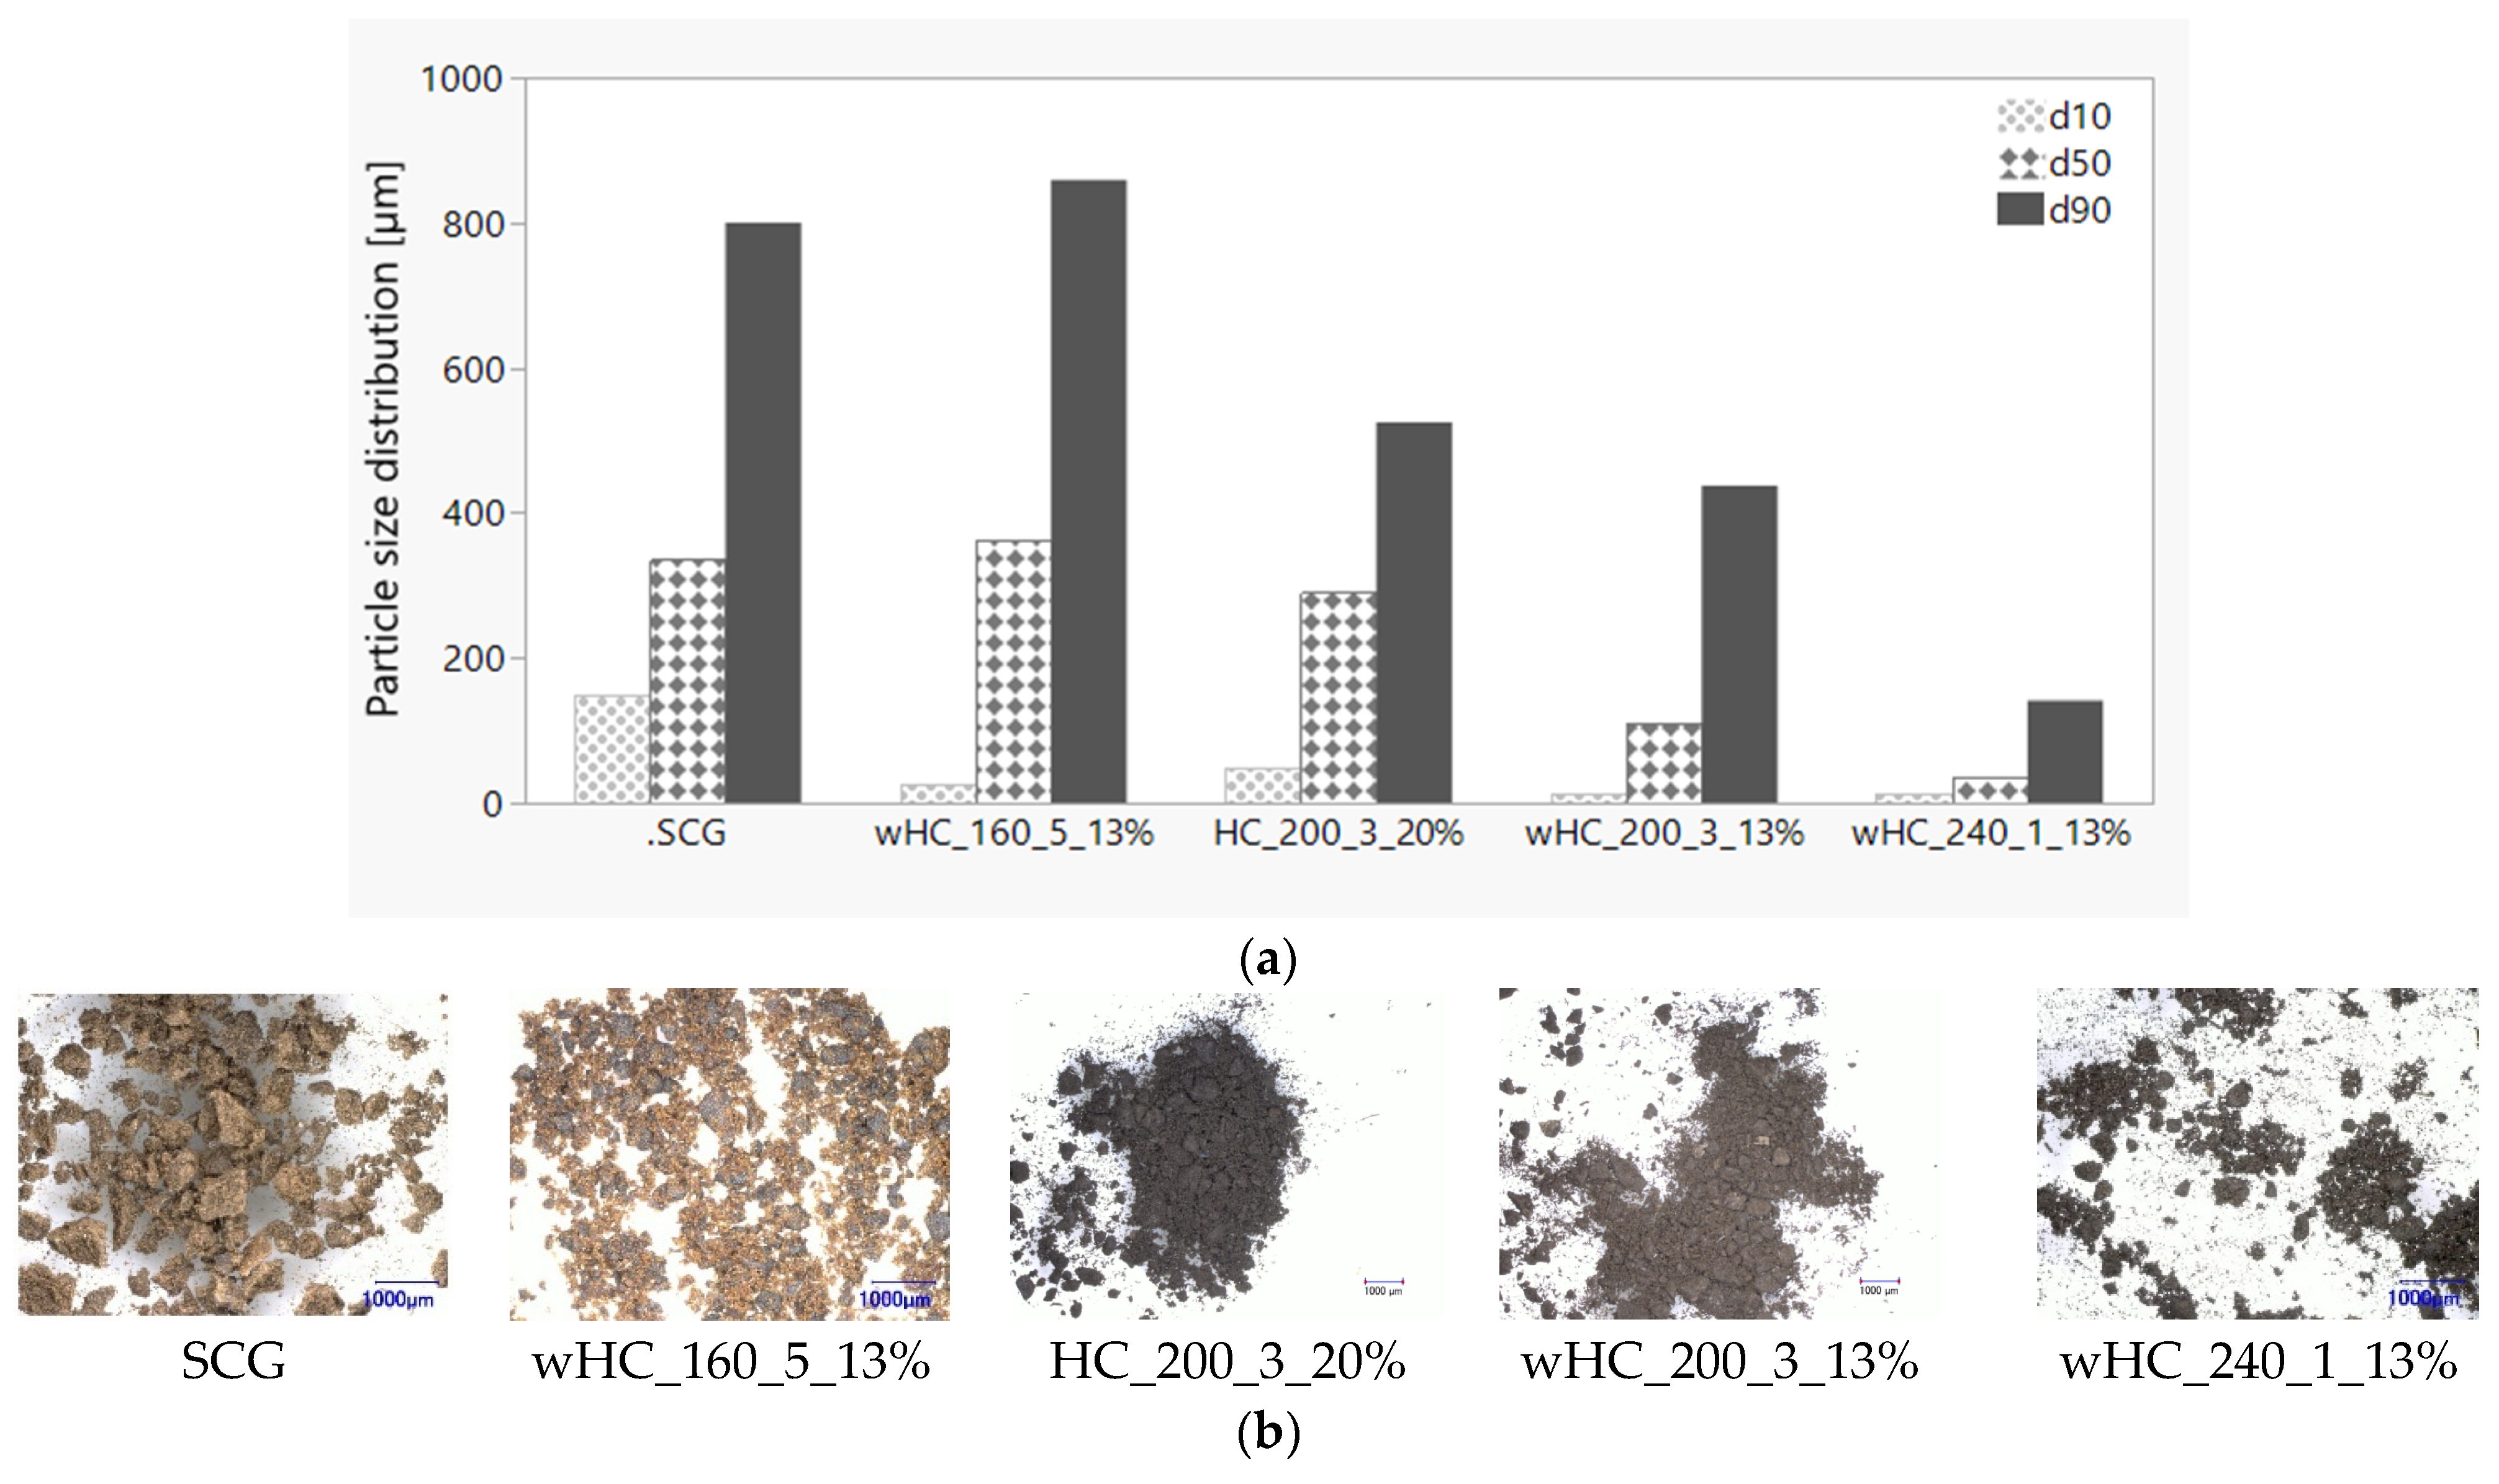
| Materials | Particle Size Distribution | ||
|---|---|---|---|
| d10 [µm] | d50 [µm] | d90 [µm] | |
| SCG | 150.00 | 335.00 | 800.00 |
| wHC_160_5_13% | 31.00 | 406.00 | 885.00 |
| wHC_200_3_13% | 14.30 | 111.00 | 437.00 |
| HC_200_3_20% | 50.00 | 290.00 | 525.00 |
| wHC_240_1_13% | 13.70 | 36.10 | 141.00 |
| Corn starch | 7.20 | 14.40 | 22.70 |
| Ground corn straw | 29.60 | 166.00 | 501.00 |
| Ground hemp leaves | 4.80 | 20.90 | 75.50 |
Disclaimer/Publisher’s Note: The statements, opinions and data contained in all publications are solely those of the individual author(s) and contributor(s) and not of MDPI and/or the editor(s). MDPI and/or the editor(s) disclaim responsibility for any injury to people or property resulting from any ideas, methods, instructions or products referred to in the content. |
© 2023 by the authors. Licensee MDPI, Basel, Switzerland. This article is an open access article distributed under the terms and conditions of the Creative Commons Attribution (CC BY) license (https://creativecommons.org/licenses/by/4.0/).
Share and Cite
Dang, C.H.; Farru, G.; Glaser, C.; Fischer, M.G.; Libra, J.A. Enhancing the Fuel Properties of Spent Coffee Grounds through Hydrothermal Carbonization: Output Prediction and Post-Treatment Approaches. Sustainability 2024, 16, 338. https://doi.org/10.3390/su16010338
Dang CH, Farru G, Glaser C, Fischer MG, Libra JA. Enhancing the Fuel Properties of Spent Coffee Grounds through Hydrothermal Carbonization: Output Prediction and Post-Treatment Approaches. Sustainability. 2024; 16(1):338. https://doi.org/10.3390/su16010338
Chicago/Turabian StyleDang, Chau Huyen, Gianluigi Farru, Claudia Glaser, Marcus G. Fischer, and Judy A. Libra. 2024. "Enhancing the Fuel Properties of Spent Coffee Grounds through Hydrothermal Carbonization: Output Prediction and Post-Treatment Approaches" Sustainability 16, no. 1: 338. https://doi.org/10.3390/su16010338