Article

Hydraulic Effect of Vegetation Zones in Open Channels: An Experimental Study of the Distribution of Turbulence

Institute of Environmental Engineering, Wrocław University of Environmental and Life Sciences, pl. Grunwaldzki 24, 50-363 Wrocław, Poland
*
Author to whom correspondence should be addressed.
Sustainability 2024, 16(1), 337; https://doi.org/10.3390/su16010337
Submission received: 9 September 2023 / Revised: 23 December 2023 / Accepted: 26 December 2023 / Published: 29 December 2023

Abstract

:
The development of vegetation in riverbeds is an important part of river engineering, and an in-depth understanding of its hydraulic influence is greatly needed. Our research focuses primarily on common reed (Phragmites australis) in riverbeds. To date, little is known about the hydraulic impact of the Phragmites australis reed and both field and laboratory data are still very scarce. Consequently, the main goal of our study was to evaluate the effect of vegetation zones on the spatial distribution of turbulence. Based on laboratory measurements of local instantaneous velocities, the values of the turbulence intensity (degree) Tu were determined, and its spatial distribution was illustrated. Analysis of the results showed that the relatively dense clusters of plants (reeds) act as “openwork deflectors” of the current and very clearly shape its spatial distribution. This can also be observed in the case of the distribution of the turbulence parameter Tu. For example, in the case of the development of riparian vegetation in the form of quasi-triangular communities of common reed (Phragmites australis) located alternately, there is a channelization of the flow, but also spatial changes in its character that occur. This work only presents results for preliminary hydraulic tests for Phragmites reed. These experiments should also be continued for other species of flexible riparian vegetation such as wicker. In the laboratory, the hydraulic influence of only triangle-shaped vegetation zones has been studied. Therefore, there is also a need for further hydraulic studies on vegetation zones of shapes other than triangular, e.g., rectangular, as well as vegetation zones with irregular shapes The authors see the need for such research and have already planned its continuation. Research on the interactions between vegetation and the structure of water flow in the riverbed is a very important aspect of contemporary trends in river environment management. Conscious, planned, and model-tested locating (or removing) of vegetation in a stream allows for shaping hydraulic and morphological conditions, thus controlling the processes of erosion, transport, and accumulation of debris.

1. Introduction

Vegetation development in the riverbed is an important part of river engineering and there is a need for a good understanding of its hydraulic impact. Research on the interactions between vegetation and the structure of water flow in the riverbed is a very important aspect of contemporary trends in river environment management. Model studies on species-specific, measured plant clusters with known morphological and biomechanical characteristics make it possible to determine the disturbances in the distribution of velocity and turbulence in the river channel, as presented in this article. Knowledge of the magnitude of these impacts allows for practical activities in river engineering: firstly, assessing whether vegetation in a given area of the river does not limit the minimum capacity and therefore requires its removal; and secondly, verification of the introduction of plants where they currently do not occur as a river restoration activity that builds biodiversity and hydraulic variability of the stream. Conscious, planned, and model-tested locating (or removing) of vegetation in a stream allows for shaping hydraulic and morphological conditions, thus controlling the processes of erosion, transport, and accumulation of debris. In modern, eco-friendly river engineering, hydromorphological conditions in the riverbed can be regulated and shaped by conscious, planned plantings.
The occurrence of plant communities, such as shrubs of purple willow (Salix purpurea L.) or rushes of common reed (Phragmites australis), influences the flow conditions in the riverbed, and affects, in particular, the spatial distribution of flow velocity and stream turbulence [1,2,3,4]. Such plant hydraulic interaction is not easy to determine as it depends on many variable factors, e.g., plant species and mechanical characteristics [5,6,7] and their stage of development including the density of the plant zone [3,4,7,8]. This interaction also depends on the spatial configuration of the vegetation zone (quasi-regular vegetation development, e.g., in the form of a triangle, circle, rectangle, etc., or the opposite, very irregular) and on the location of the plant community (at riverside (Figure 1), or directly in the river current (Figure 2)). According to Kubrak et al. [9], the greatest impact on reducing the channel capacity and disturbing the flow field is that of the vegetation found along the banks of the main channel. For this reason, it is preferable when there are no shrubs and dense reed communities along the river shoreline. On the other hand, plants are a fundamental and indispensable part of the natural environment. It is also important to realize that shrubs and reeds become “sealed” by grasses and leaves carried by water, which, if they are dense enough, results in the exclusion of this part of the section from the flow and additional damming of water in the channel.
In addition to the biomechanical characteristics of plants [5,7,10], it is equally important to have a good understanding of water flow characteristics. Among those occurring in nature, especially in rivers, the turbulent flows prevail, their dominant feature being the chaotic and irregular movement of fluid. The high intensity of transport processes is due to the complex movement of vortices of different scales and energies [11,12,13,14]. There are chaotic fluctuations of hydrodynamic parameters, e.g., velocity, the values of which change both in time and in space. According to the Reynolds hypothesis, the turbulent flow is a superposition of averaged and fluctuating flow [11,13,14,15,16]:
v = v m + v   [ m / s ]
where v’ is the velocity fluctuation around the mean motion, and vm is the time averaged velocity:
v m = 1 T t ( T / 2 ) t + ( T / 2 ) v d t   [ m / s ]
Study of flow velocity and turbulence distribution in a vegetated channel is possible either on objects in nature (rivers) or by using either 2D or 3D-numerical simulation or physical models in a laboratory. A quantitative measure of the magnitude of flow velocity fluctuations is provided by the intensity (degree) of turbulence Tu (also known as the “Tu-number”), which can be determined separately for each direction of flow [15,16,17,18] or from the following formula [13,15]:
T u = 1 3 ( v x 2 + v y 2 + v z 2 ) v m , x 2 + v m , y 2 + v m , z 2   [ - ]
where:
  • vx, vy, vz—velocity fluctuation components [m/s], vm,x, vm,y, vm,z—average velocity components [m/s].
According to Koziol [19], the turbulence intensity Tu is the most commonly studied turbulence characteristic both in science and in practice, but equally important are the turbulent flow analyses related to energy transformations, including the so-called turbulent kinetic energy (TKE or k). The TKE parameter is characterized by the mean square velocity fluctuation and can be calculated from the following relationship [20,21]:
T K E = k = 1 2 ( v x 2 + v y 2 + v z 2 )   [ J / kg ]
When flowing through the plant zone, the generated turbulent kinetic energy (TKE) is the result of tangential stresses and frictional forces and the vortex path behind the flowing plant stems [19,22,23,24]. By comparing Formulas (3) and (4), we finally obtain:
T u = 1 v m 2 3 k   [ - ]
Apart from the degree of turbulence Tu, the so-called turbulence scale is also introduced to characterize the turbulent flow. It determines the size of the vortices that form in turbulent motion [25,26]. Although the analysis of the vorticity of flow in riverbeds is a complex problem of paramount importance [27,28], it is, however, not the main focus of this research. Instead, we focused primarily on the reeds in a riverbed.
It should be assumed that with the conscious and planned location of the reed zones and with appropriately choosing their shape, it is possible to shape the spatial distribution of turbulent kinetic energy (TKE) of the stream in the river. This is of great importance, for example, in the analysis of erosion, transport, and sedimentation processes of river debris. Erosion processes of river material are to be expected in this concentrated main stream. On the other hand, in the zones with low intensity of turbulence, sedimentation and accumulation of river debris is possible.
In studying the literature, the authors’ particular attention was drawn to several recent research papers that deal with the hydraulic effects of plants. The conclusions of these studies are interesting, e.g., Tang et al. (2021) find that the stem-near-field turbulence inside a dense vegetation zone could be similar to that around a single cylinder. In fact, the results referring to a single generic cylinder are representative only for such a case [29]. Additionally, Penna et al. (2020) studied turbulence characteristics for stiff riparian vegetation. Their results show that flow depth is important in this case. In the flow zone close to the bottom, there may be a combined effect of hydraulic action of the vegetation and frictional forces on the channel bottom. However, moving towards the free water surface, the flow conditions are strongly influenced by the vegetation. The analysis of spatial distribution of the TKE-parameter (Equation (4)) revealed high values below the water level and also in the near-bed flow zone in the stream wise direction. A strong lateral variation of the TKE from the flume centerline to the cylinders occurred in the intermediate zone [30].
Valyrakis et al. (2021) focused their study mainly on the role of riparian vegetation density in riverbed hydrodynamics. Based on an extensive experimental study, spatial distributions of flow velocities were determined and then roughness coefficients and tangential stresses were analyzed in terms of the density and location of riparian vegetation zones. According to Valyrakis et al.: (1) as stem density increases, mean flow velocity in the main channel increases while mean flow at the riverbank decreases; and (2) the arrangement of riparian vegetation can be as important as that of the density in modifying the mean flow field of the main channel for low riparian densities [31].
In a mountain riverbed with plants and a gravelly bottom, Wos and Ksiazek (2022) studied the spatial distributions of velocity, turbulence intensity, turbulent kinetic energy TKE, shear stress and Froude number. Although there was a wide dispersion of the turbulence variable distributions, a standard tendency of decreased mean velocity and increased turbulence towards the bottom was observed [32].
Soltani et al. (2020), on the other hand, conducted their study of turbulent flow characteristics on the Plusjan River (Iran) with a very rough, gravelly riverbed. Their results show that hydraulic interactions between riparian vegetation, unsteady flows, and the roughness of the riverbed lead to highly irregular spatial distributions of turbulent velocity and intensity [33].
Afzalimehr et al. (2019) also studied distributions of flow velocity and turbulence intensity. Based on field measurements, they compared such distributions for riverine gravel bedforms with and without vegetation. They found that a change in bed roughness from gravel to vegetated bedforms results in a different shape of velocity distributions, increases turbulence anisotropy, generates strong secondary currents, and influences the location of erosion-prone zones in the riverbed [34].
Still, little is known about this aspect of the hydraulic impact of vegetation (Phragmites australis), and there is still little field or laboratory data available. Therefore, the main aim of our research was to gain more insight into the phenomena related to the distribution of turbulence and their influence on flow conditions in a small lowland river. We were particularly interested in evaluating the effect of vegetation zones on the spatial distribution of the “Tu-number”. It should be emphasized that the presented laboratory experiments were carried out without using plant substitutes (rigid and smooth plastic cylinders are commonly used), but with natural reed vegetation of the Phragmites species, which is flexible and rough with branches and leaves. For this reason, the results of the presented laboratory research are closer to nature and to the actual flow conditions in the river.

2. Materials and Methods

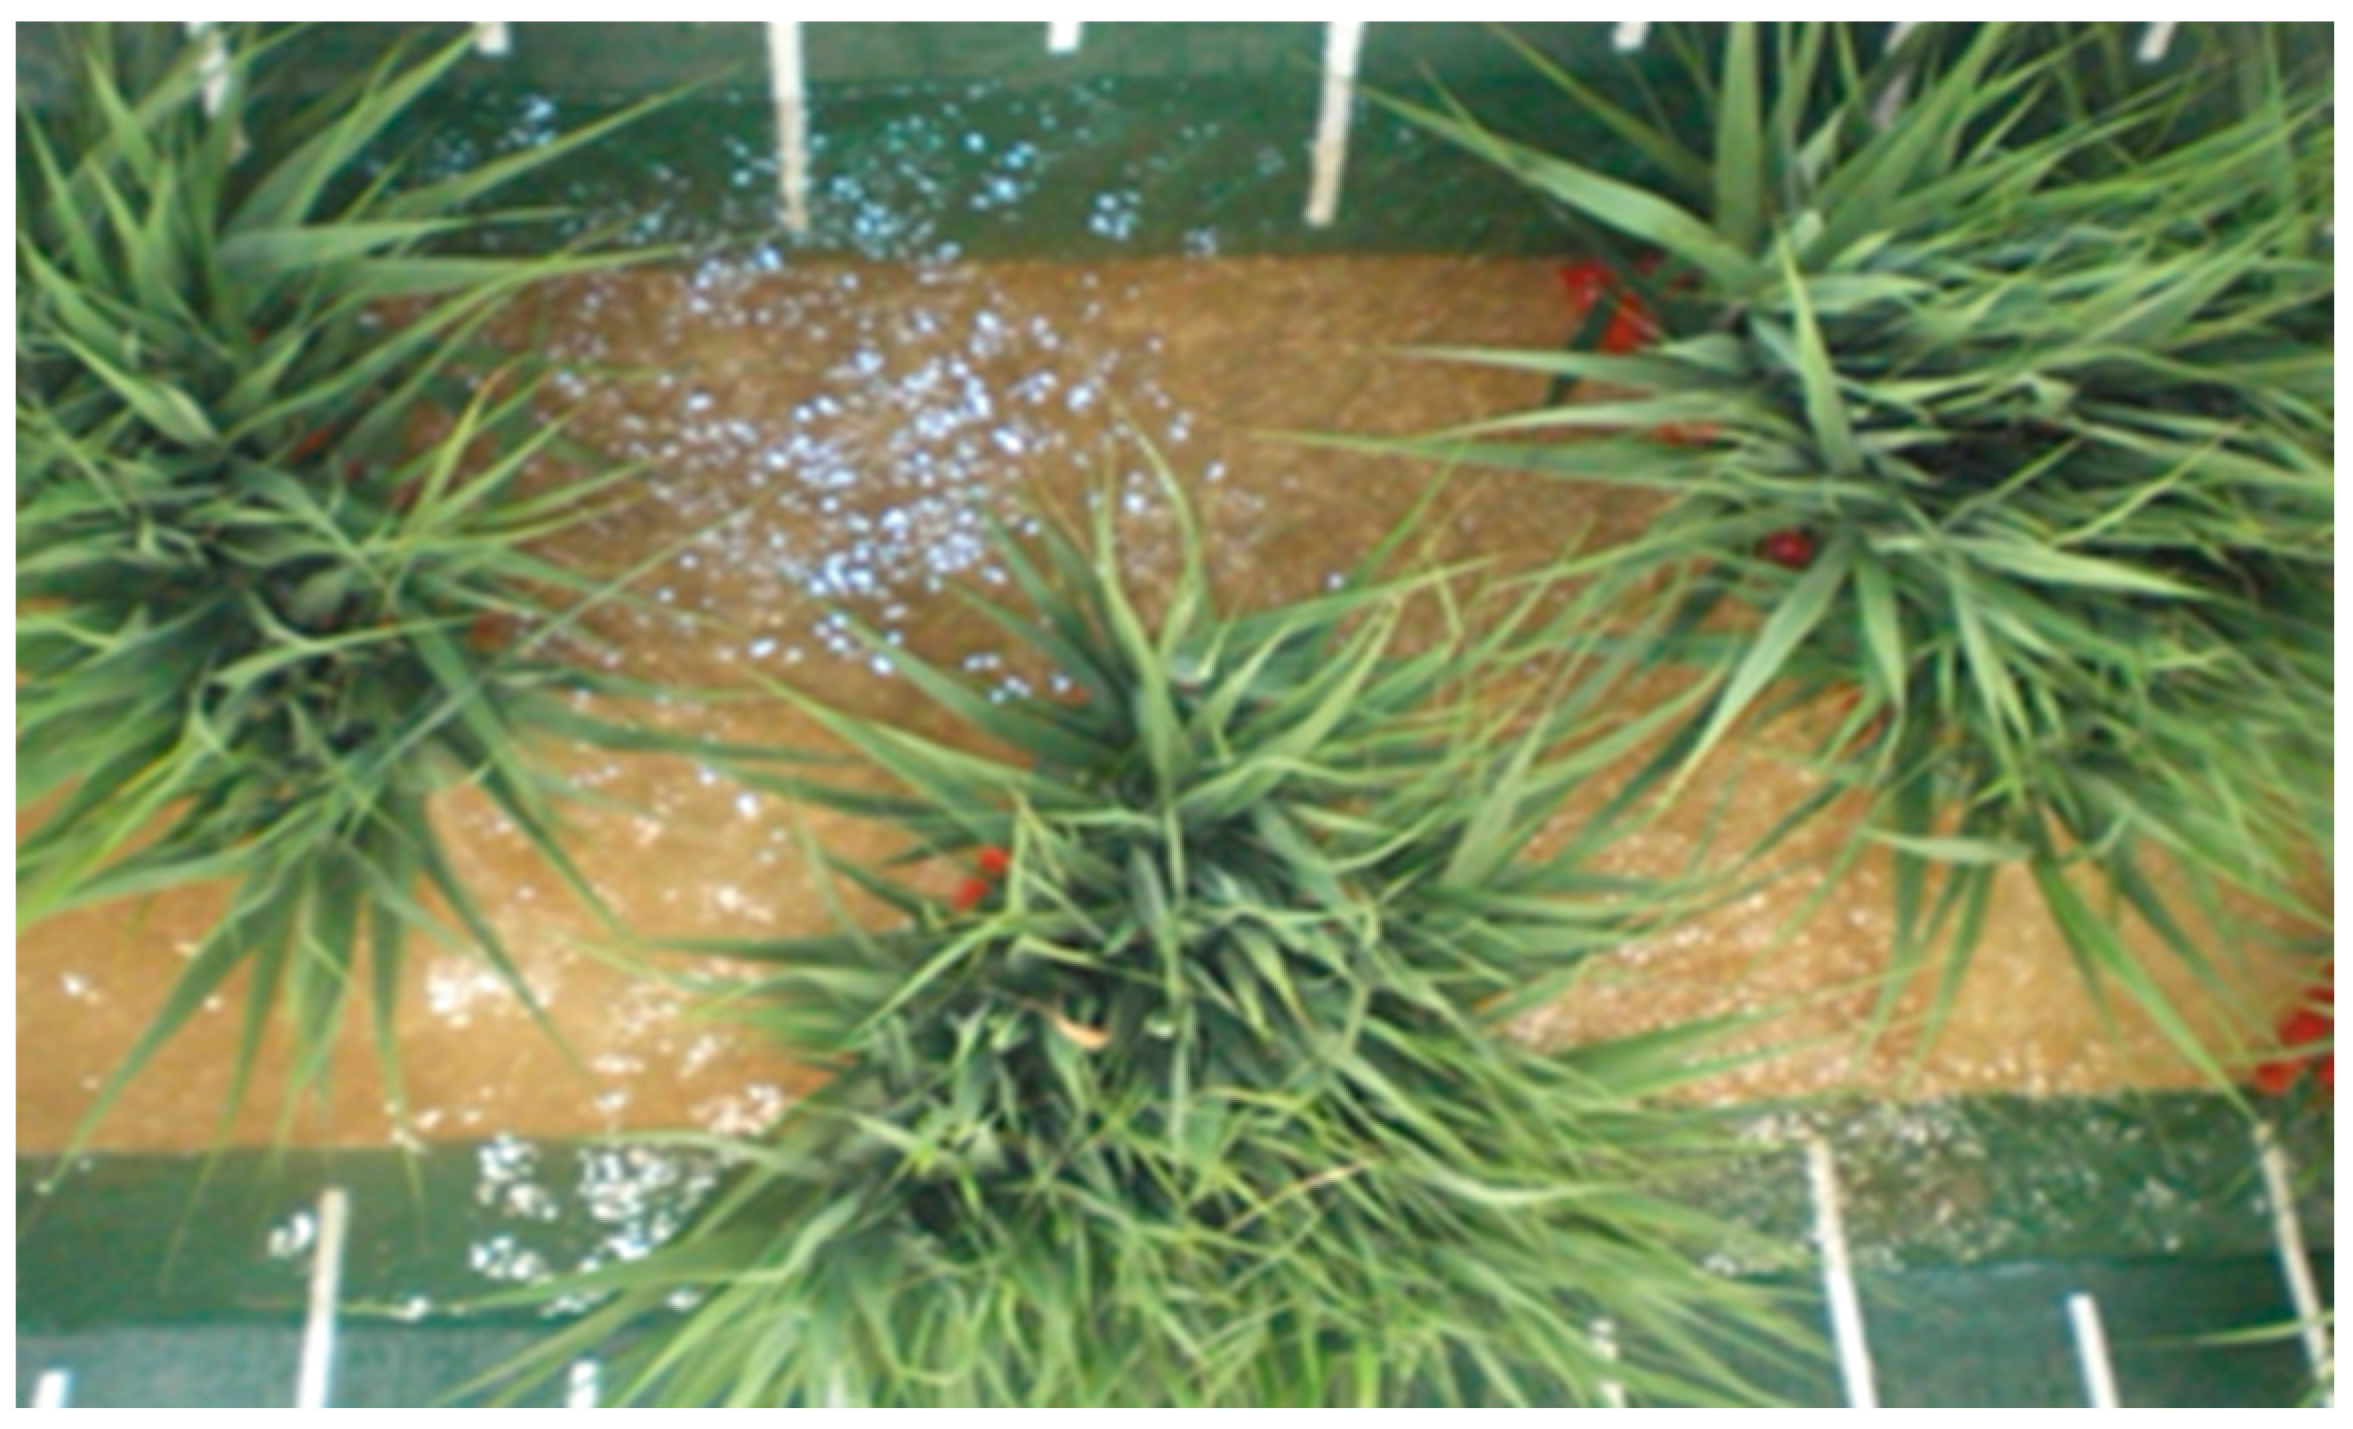
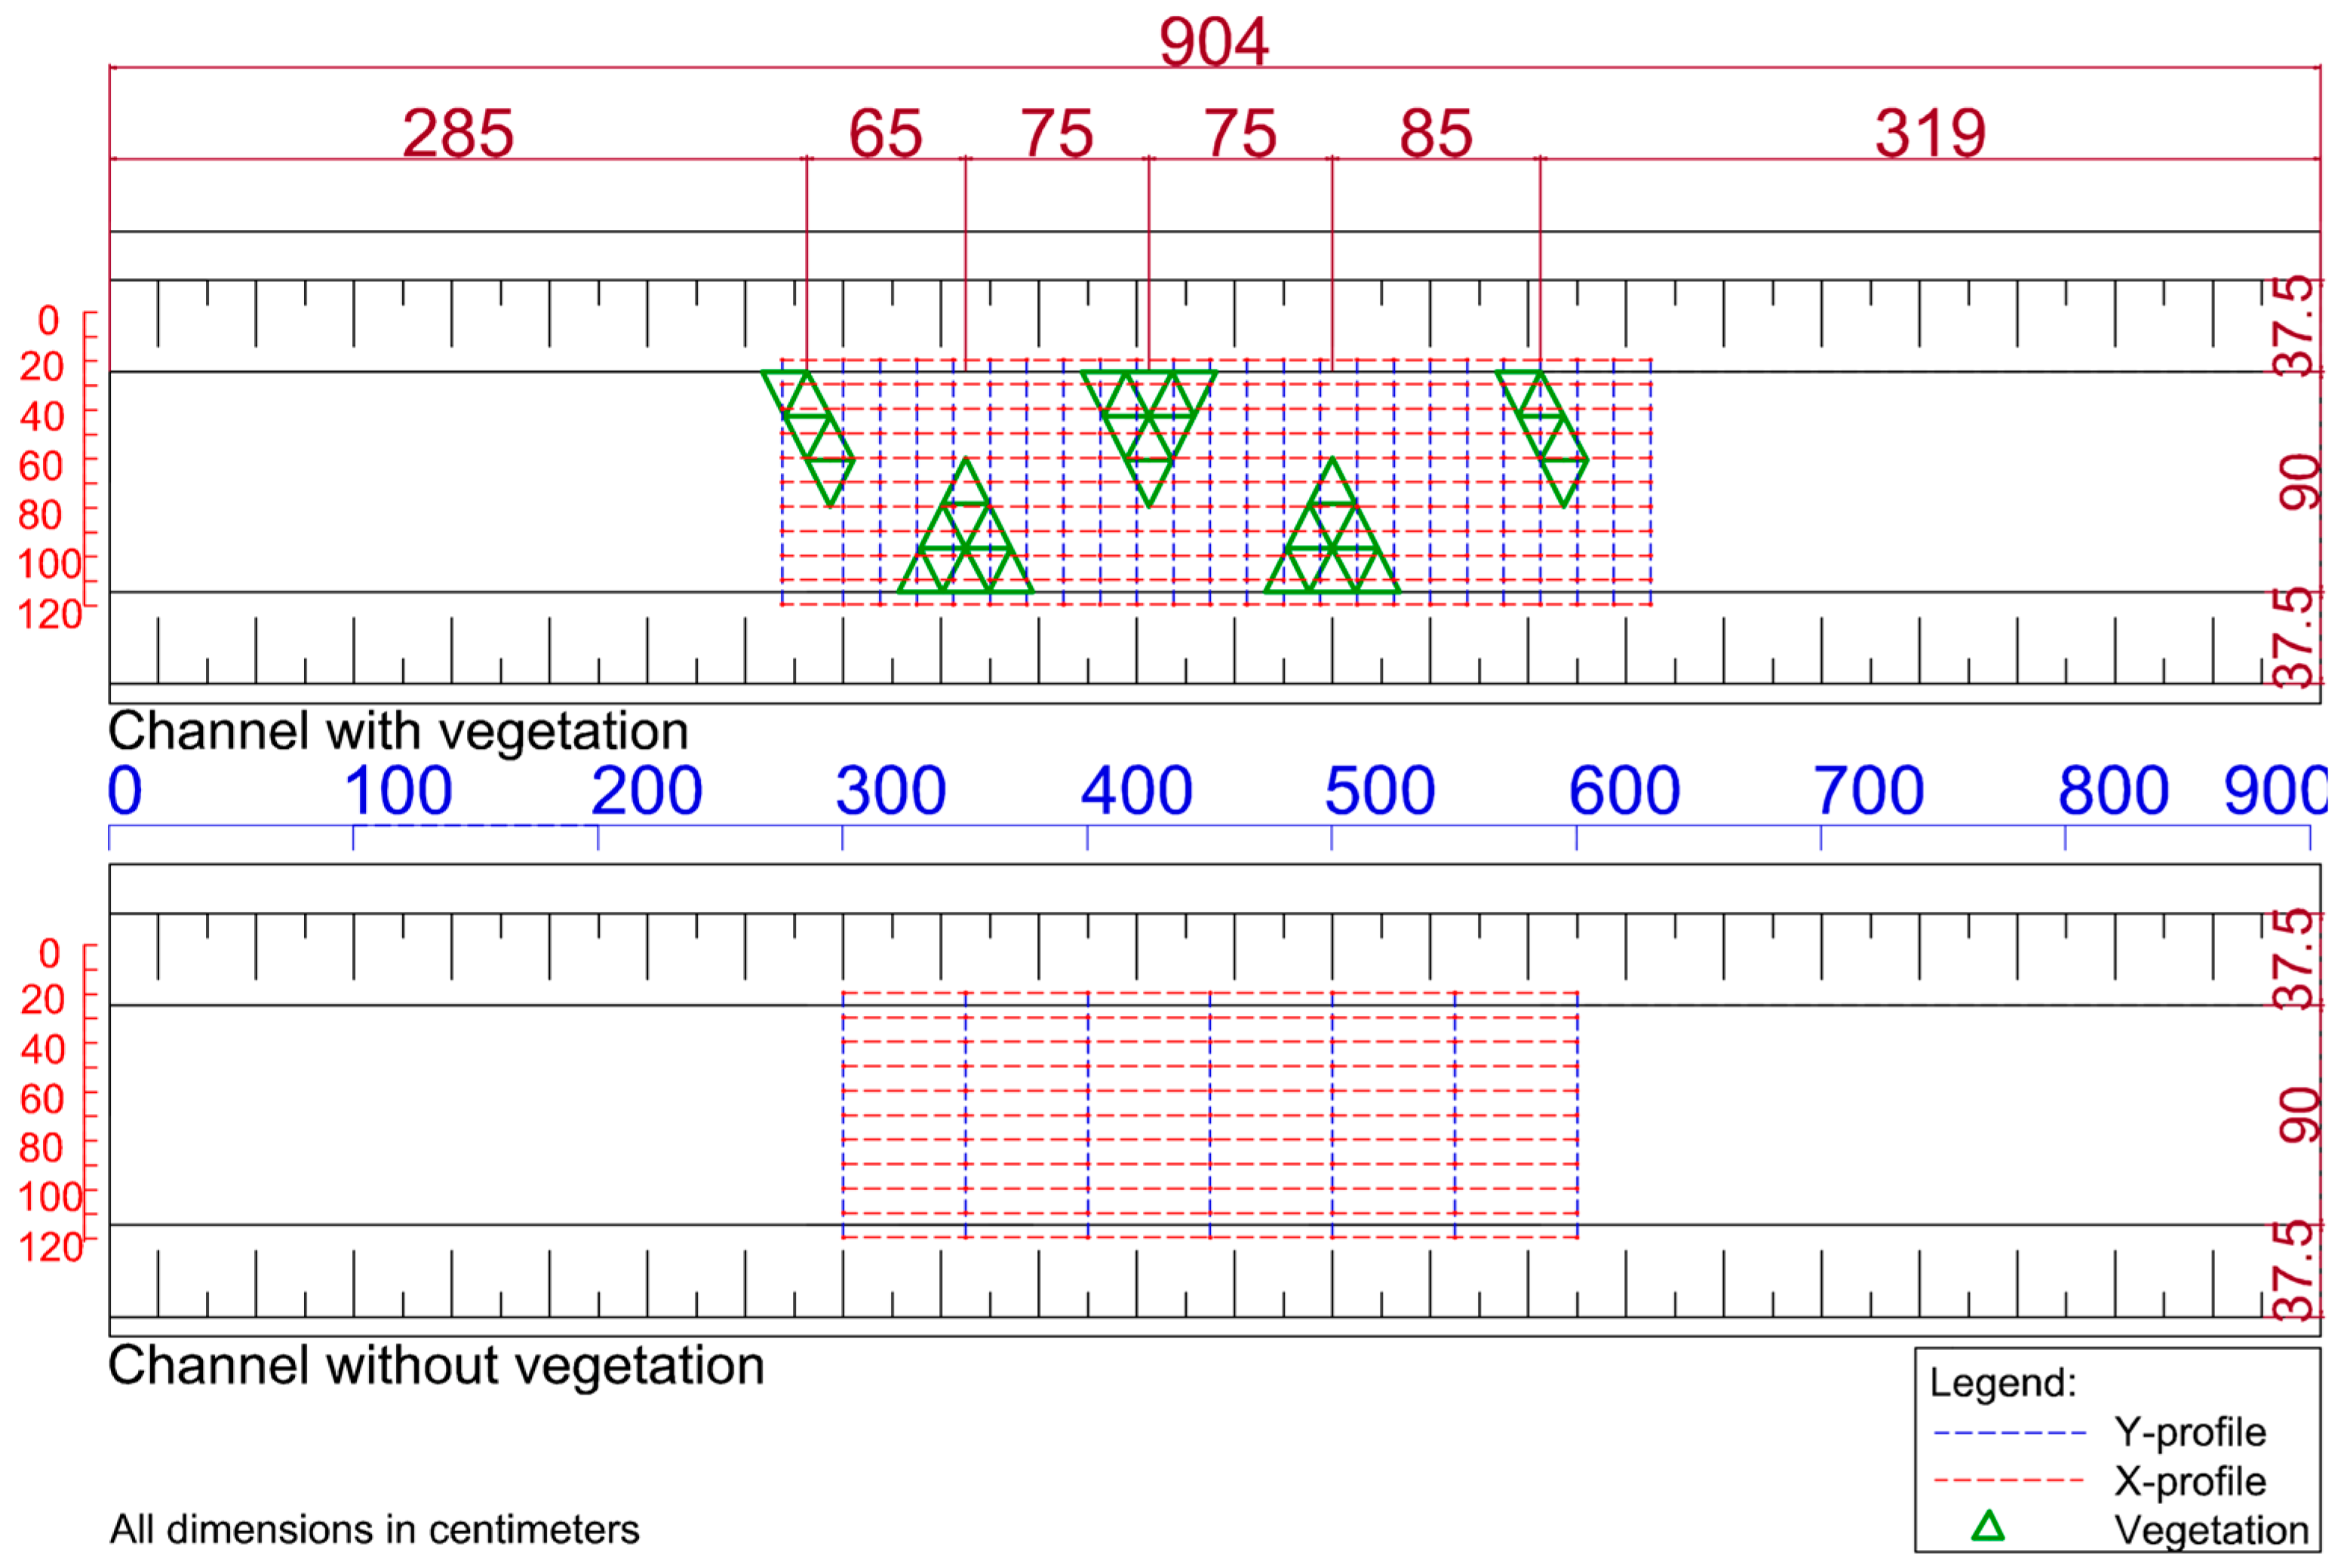
2.1. Modelling Research

The laboratory model research was conducted for the Sleza River (Poland), which is a small lowland river with vegetational build-up containing mainly flexible reeds (Figure 1). The modelled short section of the Sleza River is located in the geographical location 16°58′36″ east longitude and 51°04′53″ north latitude. The physical model of the river was built (at a scale of 1:4) in a trapezoid flume measuring 15 m in length. The side slope was 1:1 and the bottom width −0.9 m. The bottom slope was constant over the entire flume length: J = 12‰. Our research focused mainly on qualitative analysis of the hydraulic effects of flexible Phragmites reed. The drag resistance of this type of plant is dominant compared to the frictional resistance of the bottom of a lowland riverbed [1,2,3,6,10,18]. The Manning–Strickler roughness coefficient for the entire length of the flume bottom was kSt = 80 [16]. The main flume with plants measured 3 m in length. The plant zones consisted of configurations of triangular (0.6 × 0.6 × 0.6 m) very flat flowerpots, in which plant stems were placed (Figure 3 and Figure 4). Common reed (Phragmites australis) with a stem diameter of about 4 mm was used for the experiments. The density of the vegetation zones was 578 plants/m2, with the stem spacing of ax = ay = 0.05 m. This species of reed (Phragmites australis) is common throughout the entire world and can withstand long periods of immersion [5,35,36].

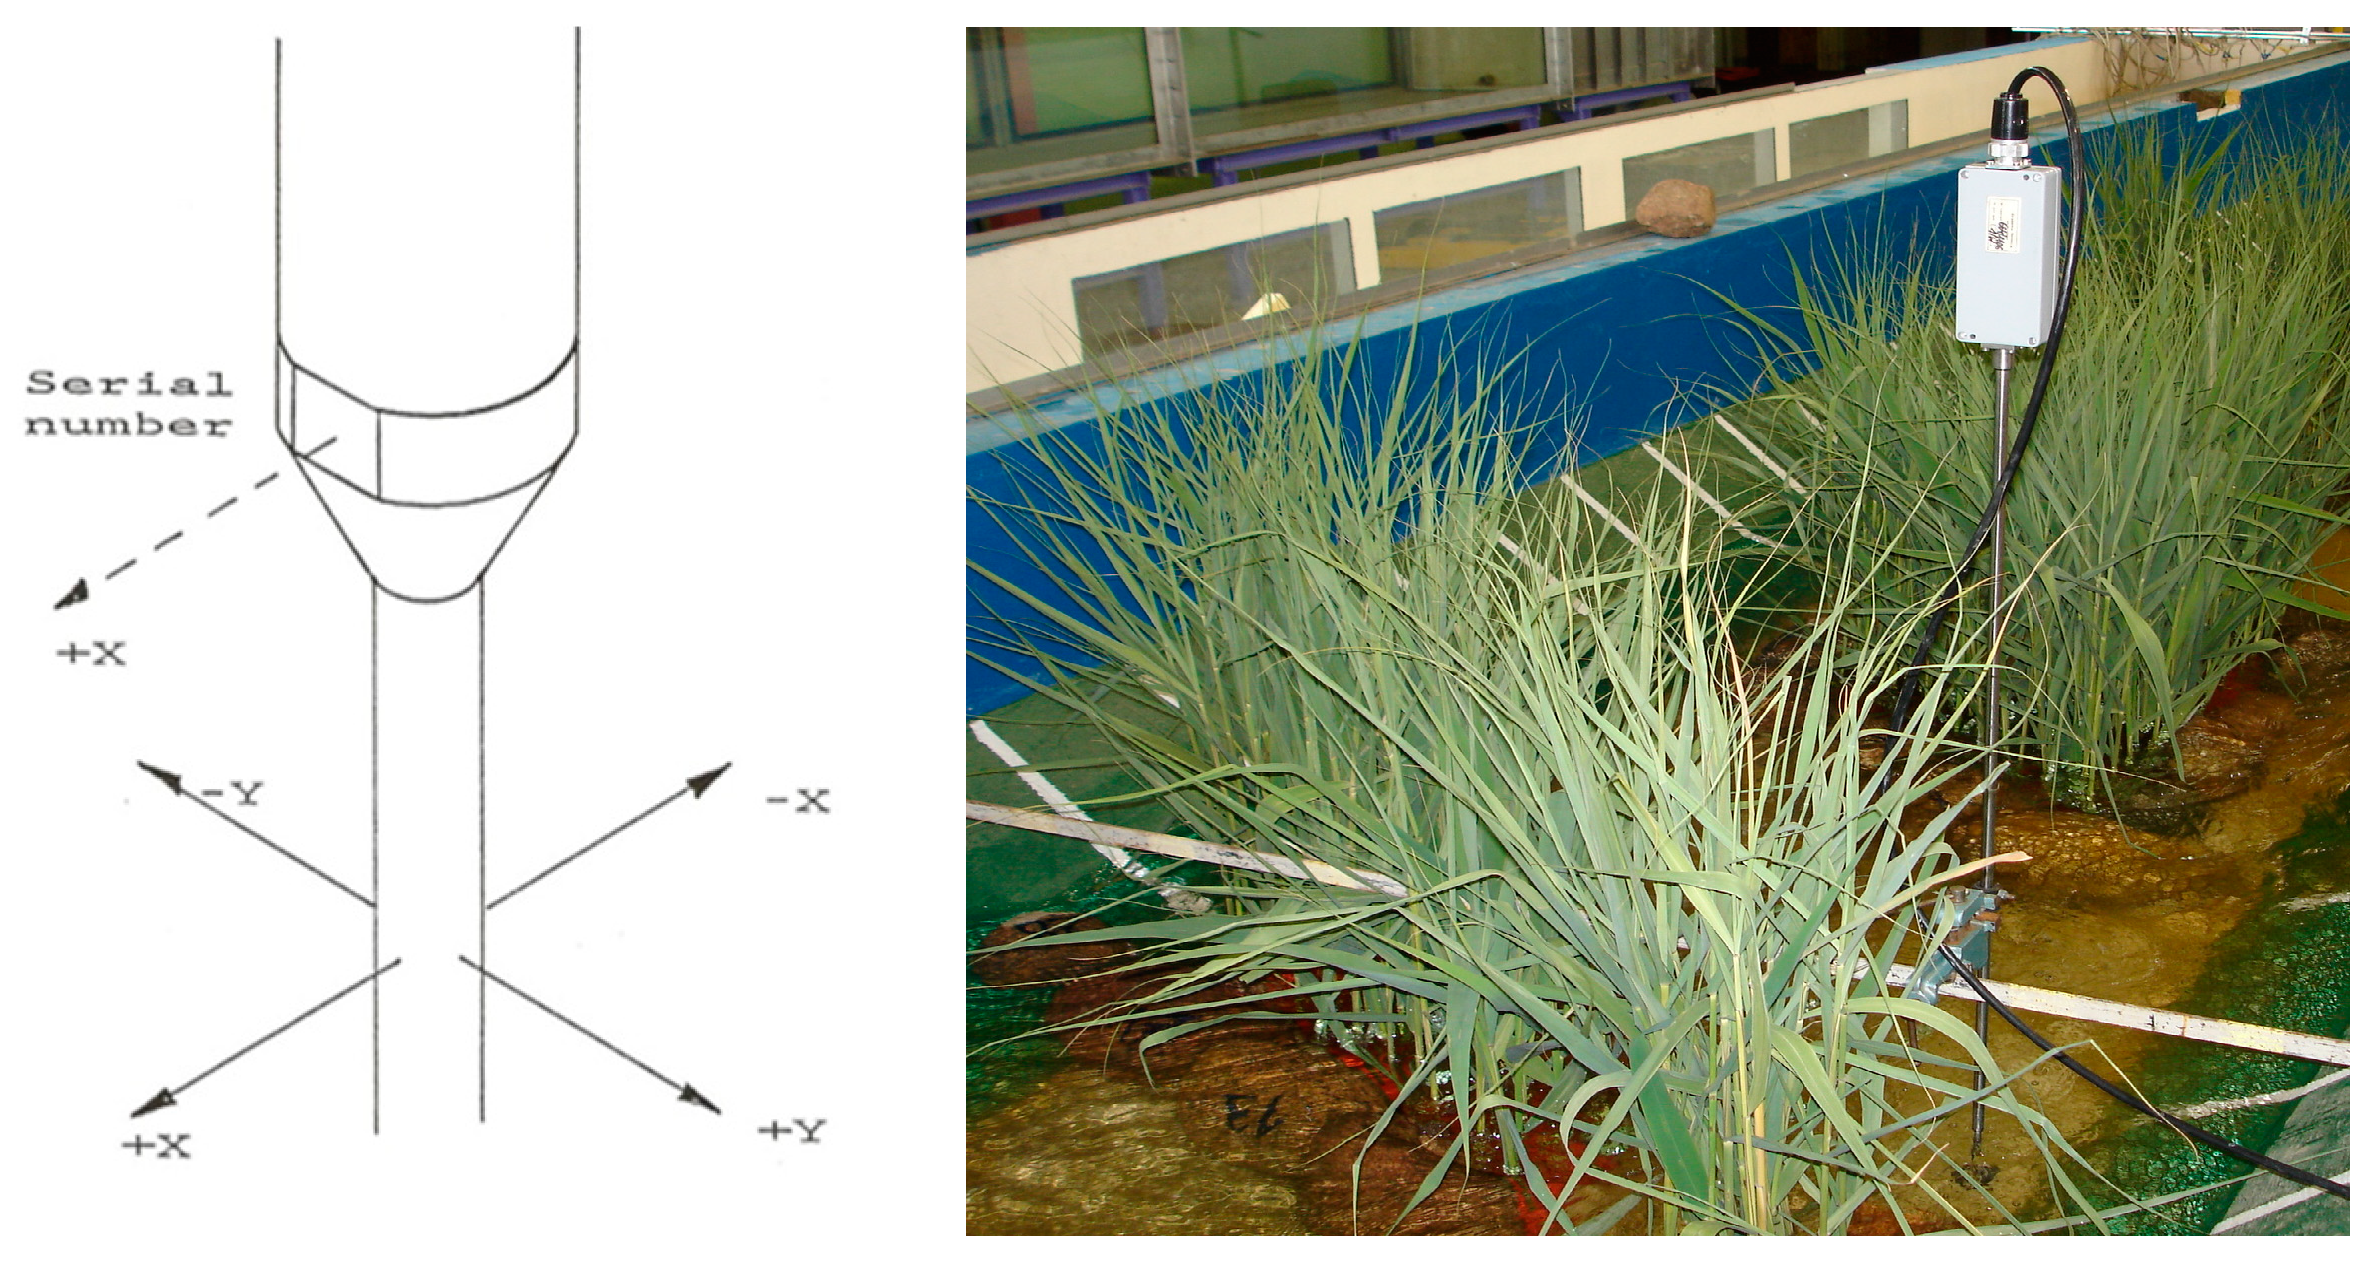
2.2. Methods and Scope of Research

The hydraulic experiments carried out in a lab consisted of the measurements of flow depth, local velocity and stream distribution for a given flow rate Q. A picture of the velocity field was obtained from the measurements taken using an electromagnetic multidirectional velocity meter PEMS (Figure 5) at a total of 360 measurement points. The measurements were taken at the nodes of a 0.10 × 0.15 m mesh and at the characteristic points of flow disturbance. The PEMS type electromagnetic velocity meter (Figure 5) is equipped with an E30 measuring probe. It is a disk-shaped probe with dimensions of 33 × 11 mm, mounted on a rod. This meter enables the measurement of the longitudinal component of velocity ±vx and the transverse component ±vy, the value of the resultant velocity ve and the angle of its deviation α from the direction of the positive semi-axis vx. The minimum sampling time of the meter is 0.1 s, and the velocity measurement accuracy is ±0.01 m/s. In our laboratory tests, the range of hydraulic parameters was as follows: (1) flow rate Q = 30–50 dm3/s, (2) average instantaneous velocities v = 0–1 m/s, and (3) flow depth H = 0.15–0.28 m.
Based on the laboratory measurements of local instantaneous velocities, values of the degree of turbulence Tu were determined and its spatial distribution was illustrated. The hydraulic influence of vegetation zones in the channel on the spatial distribution of flow velocity and the degree of turbulence were thoroughly analyzed. All data analyzed in our study were developed and converted according to the scale (1:4) based on the hydrodynamic criterion for Froude similarity [11,14].

3. Results and Discussion

Laboratory measurements of the velocity field allowed us to determine the Formula (3) for the degree of turbulence Tu. For the purpose of analysis of flow conditions, graphic illustrations of the flow velocity and turbulence distribution for all the tested configurations of the vegetation zones have been made. The hydraulic analysis was carried out for two main study options: (1) laboratory flume with vegetation, and (2) laboratory flume without vegetation. An example of the results of our laboratory experiments for a specific flow qLAB = 0.033 m3/(s·m) and flow depth h = 0.25 m is shown below in Figure 6, Figure 7, Figure 8, Figure 9 and Figure 10. This paper presents the results of preliminary laboratory tests for only one measurement series. Equation (3) assumes vz = 0 due to the limitations of the PEMS apparatus. Our study will continue for greater flow depths and will use a three-way ADV probe.

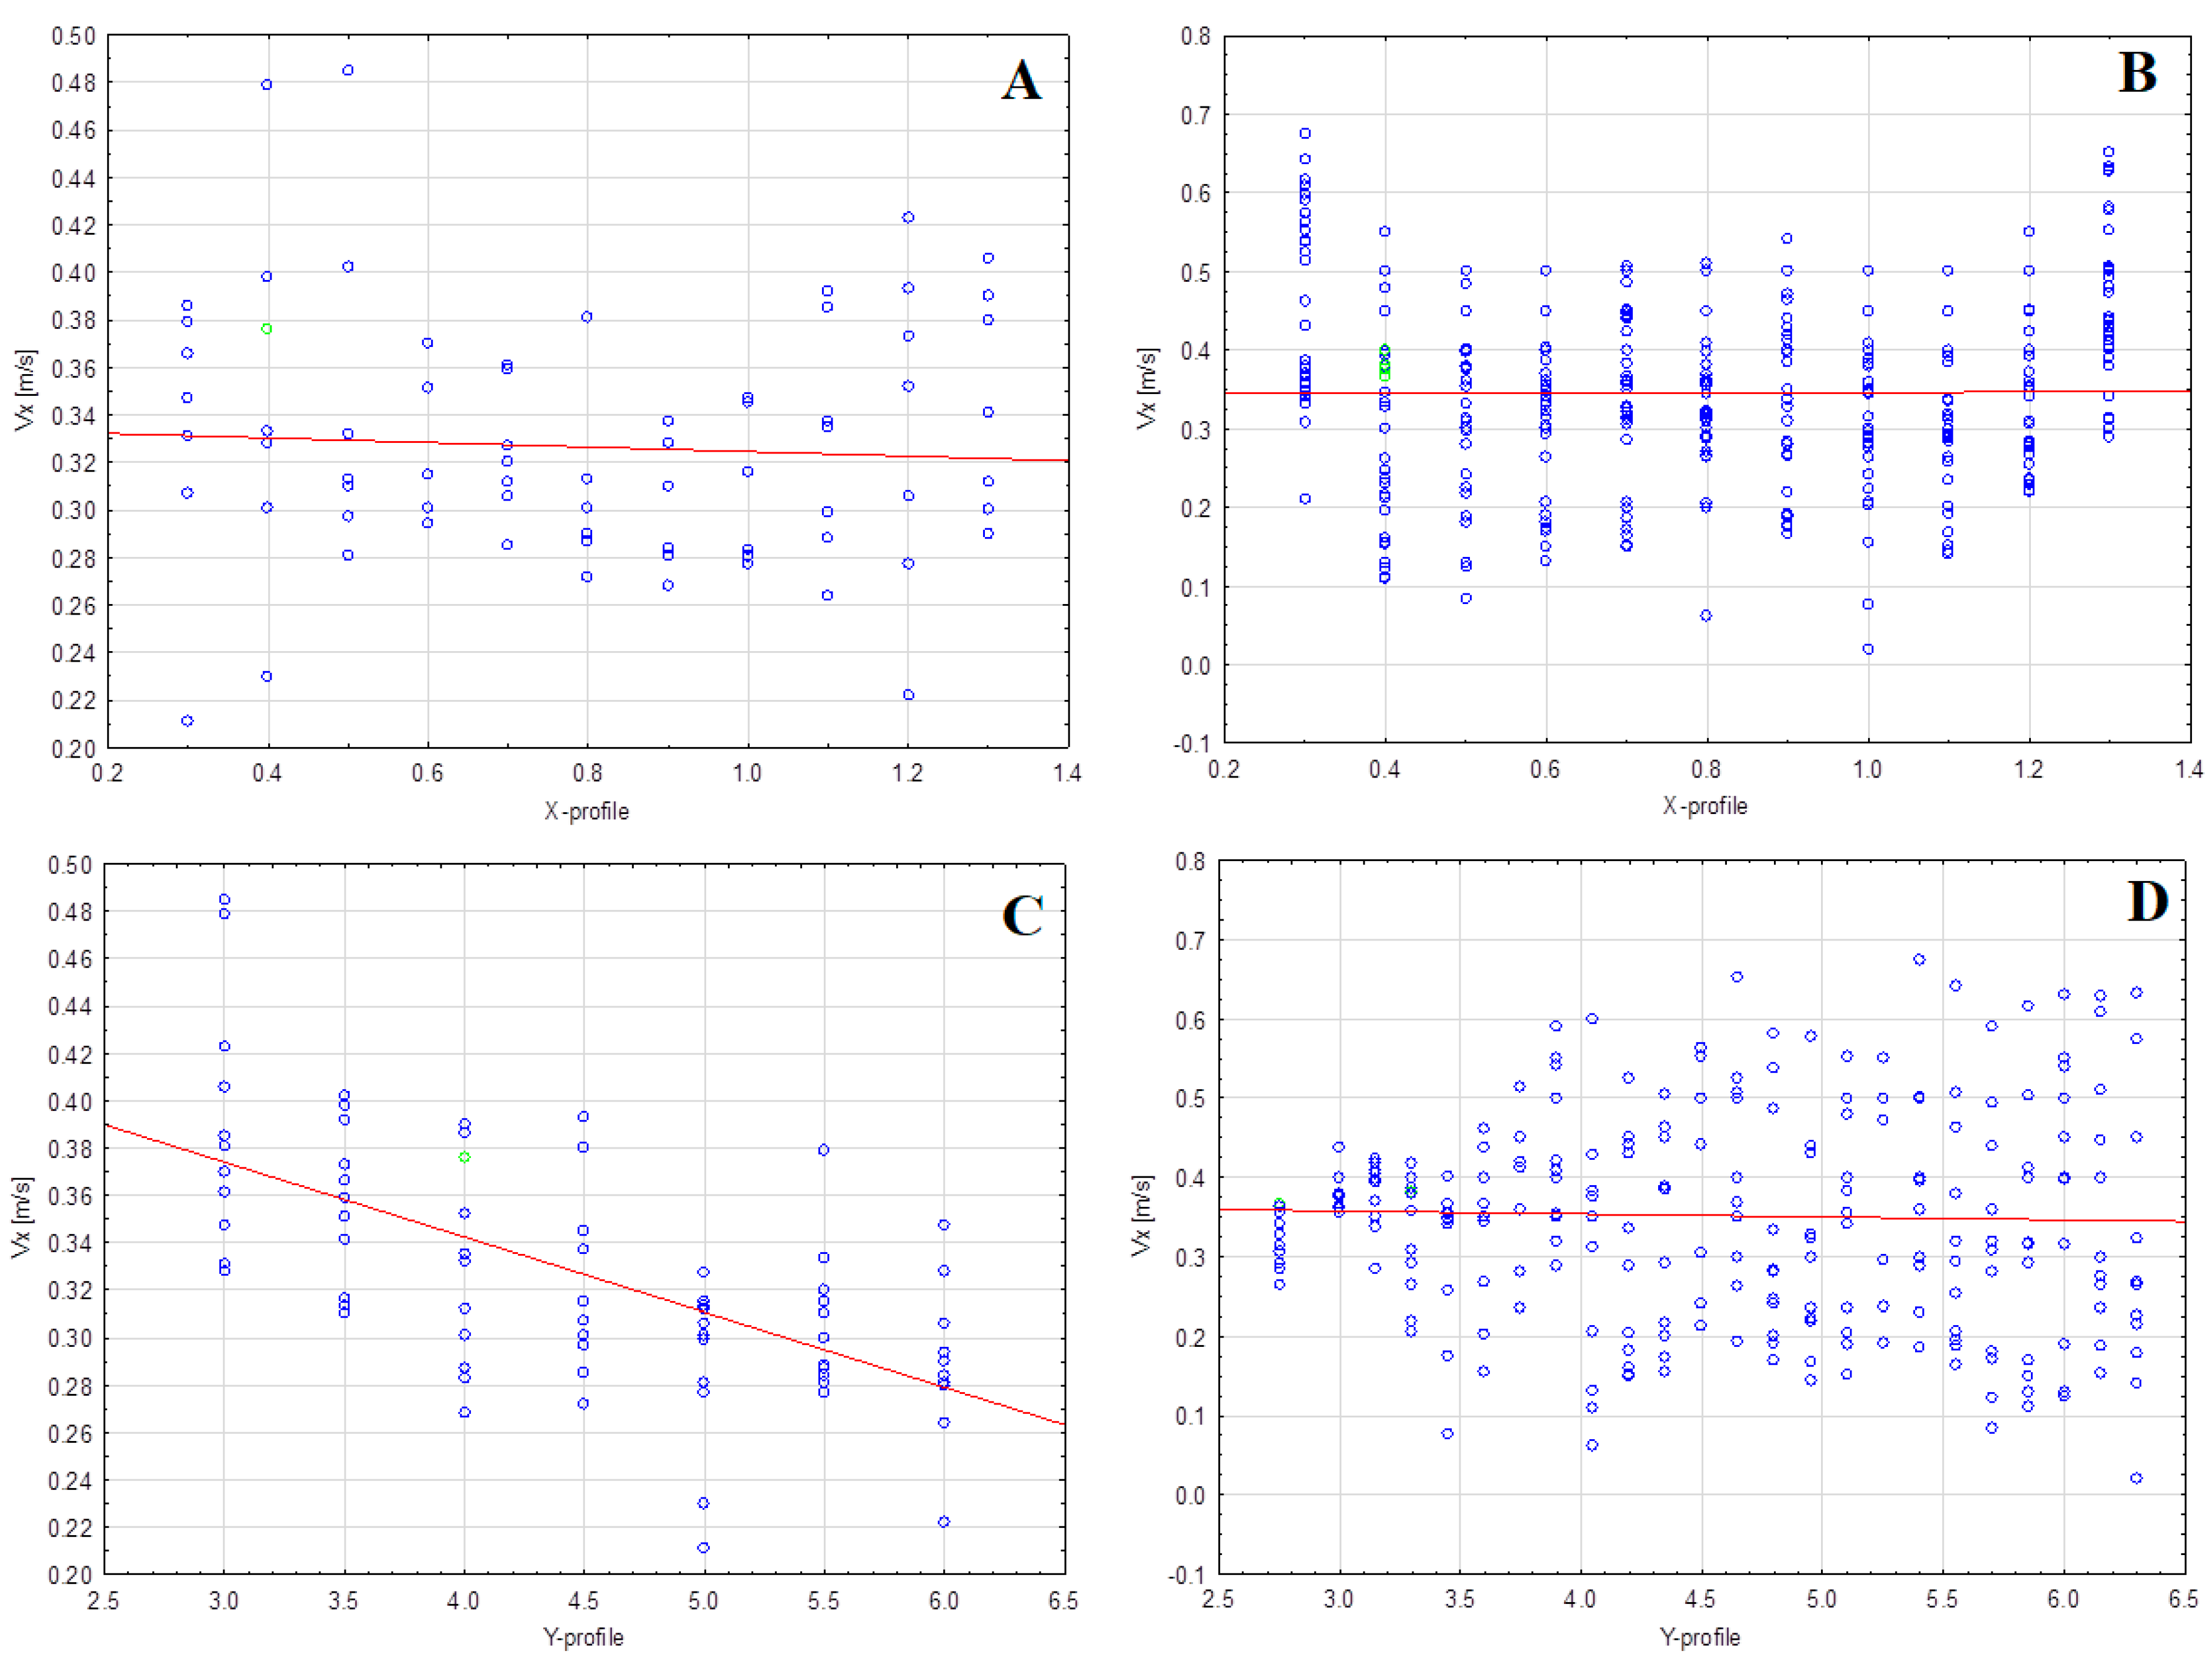
3.1. Spatial Distribution of the vx Velocity (the Longitudinal Component of Flow Velocity)

In the analyzed flow field, the average vx values for both variants being studied (plants or no plants) are at similar levels of approximately 0.33–0.35 m/s. However, the distribution of the velocity component vx along the channel relative to the X-profiles (lengthwise) differs significantly for these two cases. The velocity distributions in Figure 6 show a slight rightward deviation of the values from the flow axis. This, however, occurs for all conditions (test variants) and is probably due to the laboratory flow instability and insufficient alignment in flow in the flume from the pumping station. Importantly though, this does not affect, in any way, the conclusions of our study.
For the vegetation-free channel (Figure 6A), the measured flow velocities are in the range of 0.21–0.49 m/s (with up to 90% of our observations relating to velocities between 0.27 and 0.40 m/s). Flow velocities in the vegetation-free channel show only a slight variation with respect to the X-profile (lengthwise).
In the variant with vegetation (Figure 6B), the distribution of flow velocity vx along the channel is much more complex. The range of vx is significantly wider both over the entire analyzed flow area (from 0.04 to 0.67 m/s) and for individual X-profiles, which is due to the alternating arrangement of vegetation communities.
In the distribution of the velocity component vx, five zones are clearly distinguishable. At the riverbank (in our laboratory model), where there are very few plant stems and the plant community density is low, there are zones of significantly increased flow velocity. According to Liu et al. [37], this is due to an increased “flow agitation” effect from the individual vegetation elements when located in a sparse arrangement. This mechanism is largely silenced by the “flow blockage” effect which increases with the increase in vegetation density [31,37]. Next (Figure 6B), closer to the center of the channel, there is a zone with a wide range of changes in vx, which results from the alternating location of plant communities and zones of free flow in the channel. Lastly, in the central part of the cross-section, there is a zone where the values of vx are higher, although not as high as near the channel banks.
In the distribution of velocity vx relative to the Y-profiles (crosswise), the differences between the channel variants with and without vegetation concern two main features: (1) the magnitude of the velocity component vx recorded in successive Y cross-sections, and (2) the variability of vx.
For the variant without vegetation (Figure 6C), there is a very clear change in the overall average velocity vx in successive Y-sections, while there is little variation in vx at individual cross-sections. In the analyzed area, the velocity vx along the riverbed clearly decreases (cf. the red, sloping, straight line in Figure 6C).
For flow conditions in a flume with vegetation (Figure 6D), the average velocities vx basically do not change at all in successive Y-profiles. However, the variability of vx clearly increases with the size of the vegetated flume development zone (along the direction of flow). Undoubtedly, this high variability of the velocity component vx is due to the alternating distribution of plants in the channel, the significantly higher flow disturbances, and the higher “flow intensity”. Here, the hydraulic effect of plants on flow conditions is evident, and our laboratory observations in this case corroborate scientific reports from other research teams [19,23,35,38,39,40,41,42,43].

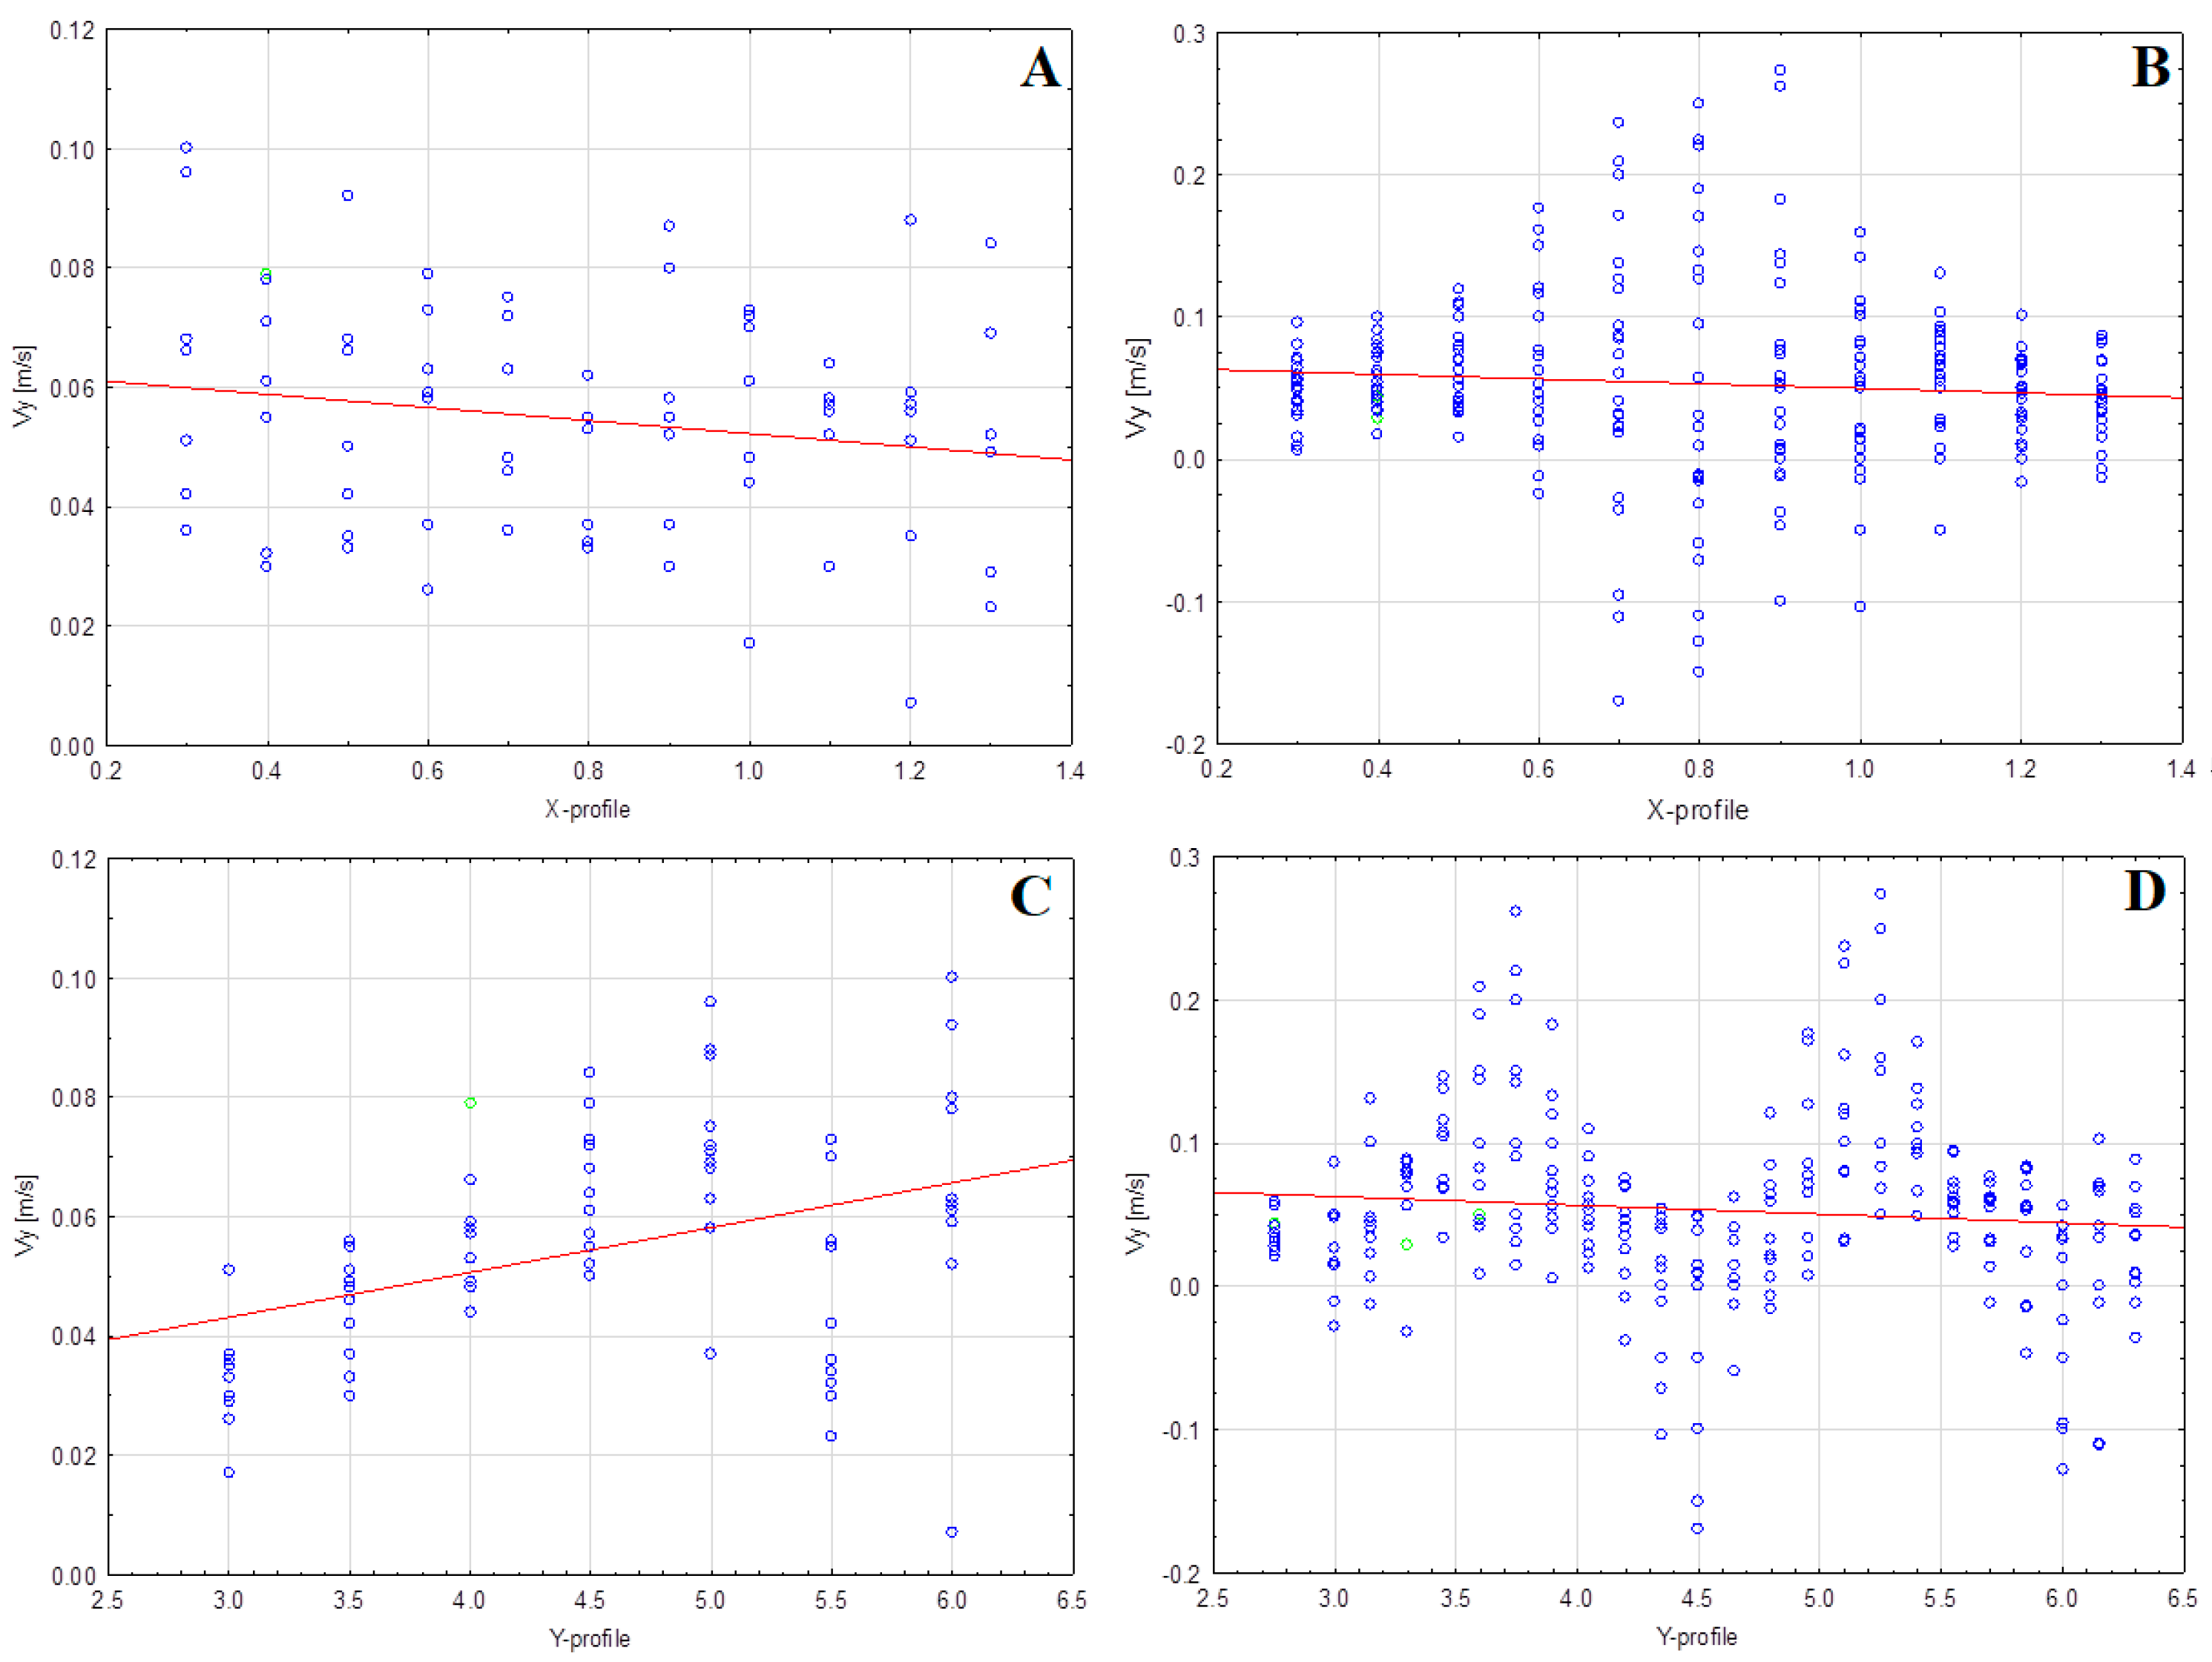
3.2. Spatial Distribution of the vy Velocity (the Lateral Component of Flow Velocity)

It is especially the instantaneous transverse velocity vy that largely characterizes the turbulent nature of the flow stream. The values of vy measured in the laboratory flume show very significant differences between the variants with and without vegetation. For the flow in the channel without vegetation (Figure 7A), the transverse velocities vy analyzed in successive X-profiles (lengthwise) are relatively insignificant (about 0.05 m/s on average) throughout the channel. In the analyzed flow field, the positive values of the vy component indicate, throughout the entire channel, a slight deviation of the flow in one direction, as mentioned earlier when characterizing the vy velocity.
When analyzing the distribution of the velocity component vy in the Y-profiles (crosswise), it is noticeable that the values of vy increase slightly with the length of the flume (Figure 7C). Moreover, the values of average crosswise velocity vy in the flume with plant zones are at a very similar level as in the variant without plants. This shows that the influence of flow instability in the flume can be ignored in the comparative analysis of the two variants (plants or no plants) [3,19,35]. However, the value and distribution of the transverse velocity vy in the studied variant of the channel with vegetation is clearly influenced by the location of alternating zones of bank vegetation.
In the distribution of velocity vy relative to the X-profiles (lengthwise), the greatest variation in vy occurs in the central part of the channel (from −0.18 to 0.27 m/s). In this area, the direction of flow changes frequently, as water meanders between the successive zones of plants.
As one approaches the banks of the channel, the range of variability of vy narrows and vy nears its mean value. On the other hand, in the analysis against Y-profiles (Figure 7D), the fluctuation of the transverse velocity vy along the length of the channel caused by the hydraulic influence of alternating vegetation zones is most clearly visible (Figure 3 and Figure 4). This hydraulic phenomenon has also been observed by several other research teams [44,45,46,47,48].

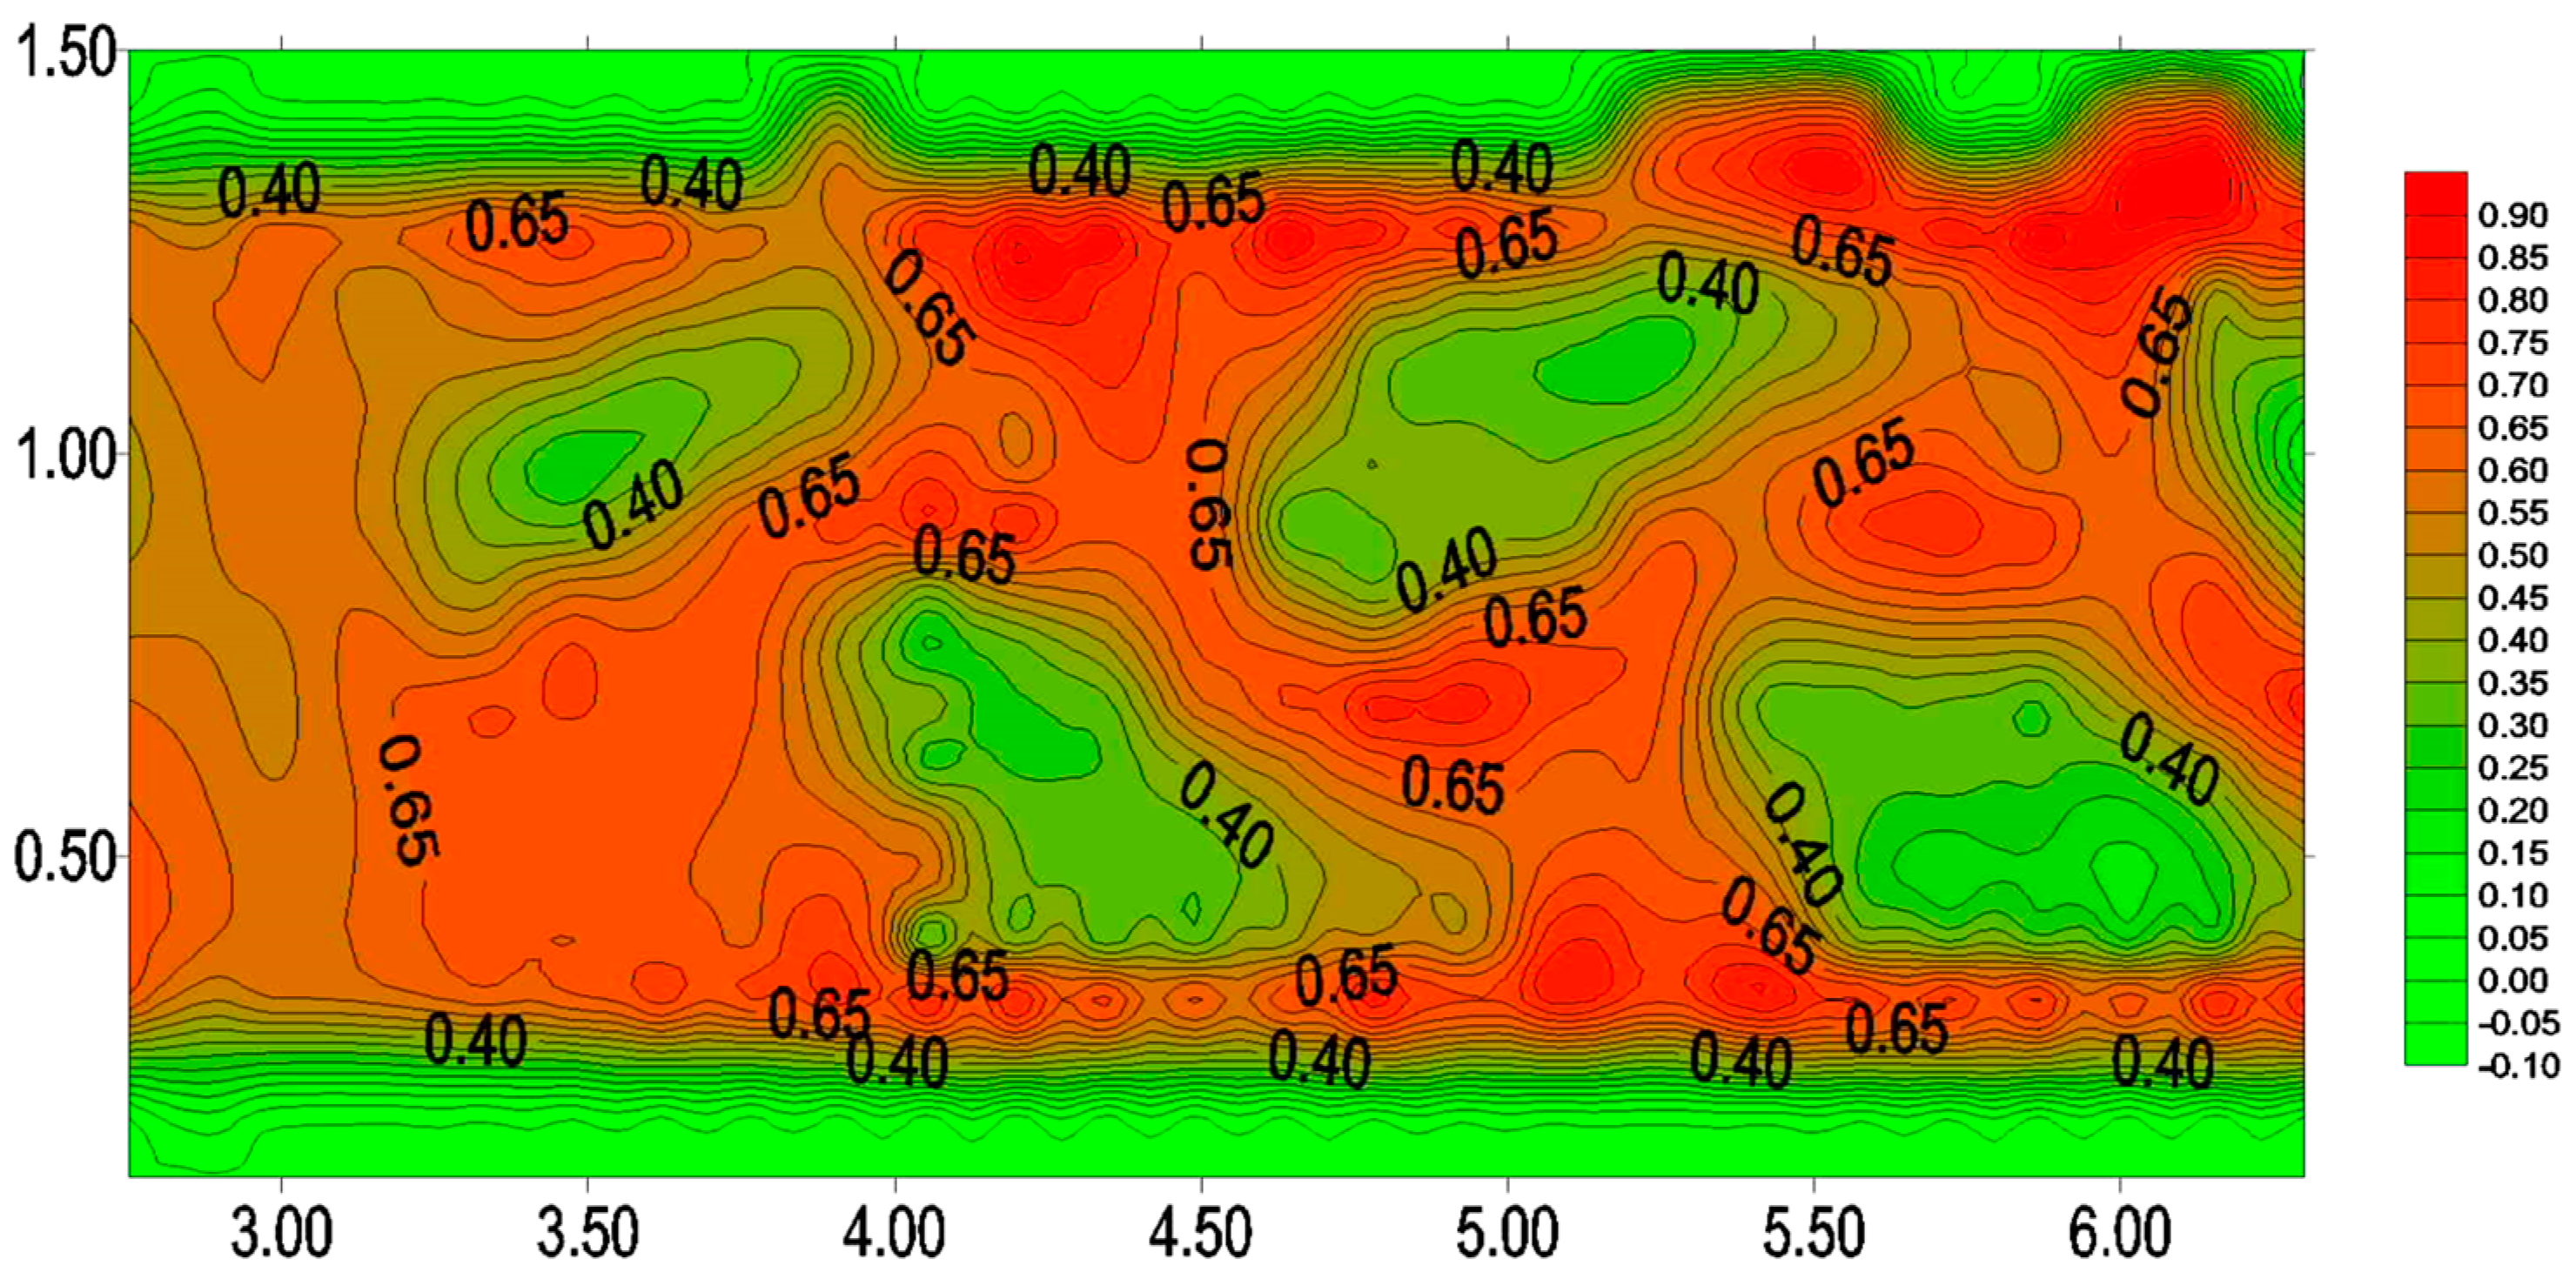
3.3. Intensity of Turbulence

In the analysis of the distribution of the degree of turbulence Tu relative to successive X-profiles (lengthwise), it is apparent that there is a very clear difference in the values of the Tu-parameter determined for flow in a channel with plant zones compared to flow conditions in a channel without plants (Figure 8A,B). In this case, the hydraulic impact of plants is particularly significant, which is also confirmed by literature reports [15,19,44,48,49,50,51].
In the distribution of the Tu-parameter in the laboratory channel without plants (Figure 8A), the maximum Tu turbulence values occur near the banks. As the distance from the banks of the channel toward the main current increases, turbulence decreases, and the water flow stabilizes.
In the variant with plants in the channel (Figure 8B), the trend described above is somewhat similar. However, the minimum turbulence values of Tu do not occur in the center of the channel cross-section, as there is an increase in longitudinal velocity vx and it is a zone of increased stream turbulence. Other researchers have also noted this hydraulic effect of plants [19,31,32,33,34,35,36,37,51,52].
In the analysis of the distribution of the Tu parameter against Y-profiles (crosswise) for the variant without plants (Figure 8C), there are no statistically significant changes along the length of the flume. On the other hand, the changes in the degree of turbulence Tu in the variant with vegetation in the laboratory flume (Figure 8D) are very interesting and visible. An increase in the variability of Tu turbulence already occurs before the first vegetation obstacle (Figure 4), after which this variability gradually increases. The average value of Tu turbulence in the cross-section of the channel reaches its maximum just at the first vegetation obstacle. After that, the average value of Tu turbulence lightly decreases, gradually along the length of the channel, and with the appearance of subsequent alternating vegetation zones. The turbulence-dampening and flow-calming effect of plant zones in a channel has been reported in several scientific studies [3,15,35,53,54,55].
Analysis of the results also showed that relatively dense clusters of plants (reed) act as “openwork deflectors” of the stream and shape its spatial distribution very clearly. This can also be observed with the distribution of the turbulence parameter Tu. For example, for riverside vegetation development in the shape of quasi-triangular reed communities (Phragmites australis) located alternately (Figure 3 and Figure 4), there is channelization of the flow, but also a spatial change in its flow character (Figure 9 and Figure 10).
Compared to the flume without plants (Figure 9), the mean value of Tu increased by ca. 20%. However, immediately upstream of the plant zone, Tu increased by up to about 40% (Tu = 0.65), and downstream of the plant zone, this parameter decreased by about 11% (Tu = 0.40). The highest turbulence was measured in the main current, especially in the corridors between vegetation zones {Tu(max) = 0.80}. The values of Tu = 0.24–0.80 obtained by the authors are comparable with literature data. For example, according to Mazurczyk [15], the parameter Tu increases with, among other factors, plant density in the riverbed and takes on values in the range of Tu = 0.05–0.90. The values of Tu obtained by Kałuża [3] are in the range of 0.15–0.75 for plants in his lab flume arranged in a checkerboard pattern. Similar to Kałuża [3], in the spaces between plants on the upstream side of water, we also observed zones of high turbulence muted in the direction of flow.

4. Final Conclusions

To date, many researchers have dealt with the problem of hydraulic flow conditions in rivers. Some of them have also studied the spatial distribution of turbulence [15,17,19,25,28,29,30,31,32,33,34,38,51,52,53,54]. However, those studies focused on a completely different factor that affects the distribution of turbulence. In those cases, they mainly studied the effect of a very rough, gravelly riverbed on the distribution of turbulence and turbulent kinetic energy (TKE). Even when there were plants in the river (often common river hydrophytes rather than reeds), their hydraulic influence was not dominant as in the case of gravel-bed rivers [17,28,32,33,34,52]. There are known laboratory studies where the influence of plant zones on stream turbulence and flow conditions was also tested. However, in these experiments, only plant substitutes were used. These were plastic, rigid cylinders [15,19,25,29,30,31], with geometric and biomechanical characteristics that are very different from those of natural plants. In particular, reeds are flexible, and a stream of water can bend them. These mechanical characteristics of plants are very important in terms of their hydraulic effects [5,7] and it is imperative to take them into account in studies and various hydraulic calculations [6].
Therefore, it should be emphasized that our laboratory experiments were carried out without using plant substitutes, but with natural reed vegetation of the Phragmites species. In a water laboratory, such tests are not easy, but the reliability of the results obtained for natural, flexible plants is better than the results for rigid and smooth plastic cylinders. By using Phragmites reed in our study, the flexibility of the stems was taken into account, as well as the roughness and spatial structure of the plants (shape, branches, leaves etc.). Additionally contributing to the general state of knowledge is the fact that these hydraulic experiments involved a specific plant species called Phragmites australis. There are no reports in the scientific literature of similar hydraulic laboratory tests for just this species of reed, which is found on banks and in riverbeds and is very common in many countries.
Our laboratory tests were aimed at recognizing the problem of hydraulic interaction of Phragmites australis. This work will be continued. Our research has confirmed that dense communities of this common reed species act as openwork deflectors of the stream and shape its spatial distribution in the riverbed. Their influence is visible, among other things, in the distribution of velocity and turbulence. The zones of vegetation (deflectors) channelize and differentiate flow in the channel creating distinct current and calm zones (with reduced stream velocity and turbulence). Alternating dense zones of Phragmites australis gives the stream a clearly meandering character. Our analysis also reveals that by deliberate, planned planting or removal of plants in the riverbed, it is possible to influence the spatial structure of the stream (parameters “v” and “Tu”). Thus, it is possible to control the processes of erosion and accumulation of river material. This aspect, however, should be verified through field research. Moreover, the shape and placement of the Phragmites australis zone has an impact on stream channelization. In the first stage of our project, we only studied triangular reed zones; however, in the next stage we also plan to study stream deflectors of other shapes. So far, it has been shown that triangular zones of Phragmites australis (Figure 1 and Figure 3) located at the riverbank affect the flow conditions significantly. One of the decisive factors in this impact is the density of the Phragmites australis reed community. Where the reed density was lower, higher flow velocities and values of the turbulence parameter “Tu” were measured. Where the reed zones were very dense or even poorly permeable, a more significant effect of the plants as stream deflectors was observed.
As mentioned in Section 1, the riparian plants’ interaction with flow conditions in a river depends, among other factors, on the stage of development (density) and the shape of the plant zone, e.g., on the plan as a quasi-rectangle or a quasi-triangle (Figure 1). This work only presents results for preliminary hydraulic tests for Phragmites reed. These experiments should also be continued for other species of flexible riparian vegetation such as wicker. In the laboratory, the hydraulic influence of only triangle-shaped vegetation zones has been studied (Figure 3 and Figure 4). Therefore, there is also a need for further hydraulic studies on vegetation zones of shapes other than triangular, e.g., rectangular as well as vegetation zones with irregular shapes.
The authors are also aware that their model test is carried out under ideal indoor environmental conditions. In the actual growing environment of the flexible vegetation, there is the influence of weather (such as wind). Similar observations and the so-called Honami effect (stem wobbling) are also reported by Tsujimoto and Kitamura [24]. Field studies of this problem on a river with flexible, riparian vegetation will certainly be of great interest. The authors see the need for such studies and plan to compare the hydraulic effects of Phragmites reed in the laboratory and in nature (river) and also verify the test results of the ideal model with those of the actual engineering environment.

Author Contributions

Conceptualization, T.T. and K.W.; methodology, T.T.; validation, T.T. and K.W.; formal analysis, T.T. and K.W.; investigation, T.T.; resources, T.T. and K.W.; writing—original draft preparation, T.T. and K.W.; writing—review and editing, T.T. and K.W.; visualization, T.T. and K.W. All authors have read and agreed to the published version of the manuscript.

Funding

This research received no external funding.

Institutional Review Board Statement

Not applicable.

Informed Consent Statement

Not applicable.

Data Availability Statement

Data is contained within the article.

Conflicts of Interest

The authors declare no conflicts of interest.

References

  1. Järvelä, J. Flow Resistance of Flexible and Stiff Vegetation: A Flume Study with Natural Plants. J. Hydrol. 2002, 269, 44–54. [Google Scholar] [CrossRef]
  2. Järvelä, J. Flow Resistance in Environmental Channels: Focus on Vegetation; Helsinki University of Technology Water Resources Publications: Espoo, Finland, 2004; ISBN 978-951-22-7074-3. [Google Scholar]
  3. Kałuża, T. Resistance in Floodwater Flow Caused by Floodplain Vegetation. Ph.D. Thesis, Agricultural University Poznan, Poznan, Poland, 2000. (In Polish). [Google Scholar]
  4. Wolski, K.; Tymiński, T. Studies on the Threshold Density of Phragmites Australis Plant Concentration as a Factor of Hydraulic Interactions in the Riverbed. Ecol. Eng. 2020, 151, 105822. [Google Scholar] [CrossRef]
  5. Tymiński, T.; Kałuża, T. Investigation of Mechanical Properties and Flow Resistance of Flexible Riverbank Vegetation. Pol. J. Environ. Stud. 2012, 21, 201–207. [Google Scholar]
  6. Tymiński, T.; Kałuża, T.; Hämmerling, M. Verification of methods for determining flow resistance coefficients for floodplains with flexible vegetation. Sustainability 2022, 14, 16170. [Google Scholar] [CrossRef]
  7. Walczak, N.; Walczak, Z.; Ficner, T. Determination of the Variation of the Geometric and Dynamic Parameters of the Floodplain Vegetation. Water 2022, 14, 1274. [Google Scholar] [CrossRef]
  8. Walczak, N.; Walczak, Z.; Kałuża, T.; Hämmerling, M.; Stachowski, P. The Impact of Shrubby Floodplain Vegetation Growth on the Discharge Capacity of River Valleys. Water 2018, 10, 556. [Google Scholar] [CrossRef]
  9. Kubrak, J.; Żelazo, J.; Kozioł, A.; Kubrak, E.; Kiczko, A. On removing vegetation from river floodplains. Gospod. Wodna 2014, 74, 95–102. (In Polish) [Google Scholar]
  10. Västilä, K.; Järvelä, J. Characterizing natural riparian vegetation for modeling of flow and suspended sediment transport. J. Soils Sediments 2017, 18, 3114–3130. [Google Scholar] [CrossRef]
  11. Finnemore, E.J.; Franzini, J.B. Fluid Mechanics with Engineering Applications, 10th ed.; The McGraw-Hill Series in Civil and Environmental Engineering; McGraw-Hill: Boston, MA, USA, 2002; ISBN 978-0-07-243202-2. [Google Scholar]
  12. Garde, R.J. Turbulent Flow; Wiley & Sons: New York, NY, USA, 1994. [Google Scholar]
  13. Puzyrewski, R.; Sawicki, J. Basic Fluid Mechanics and Hydraulics; Wyd. Nauk. PWN: Warsaw, Poland, 2000; p. 335. (In Polish) [Google Scholar]
  14. Jeżowiecka-Kabsch, K.; Szewczyk, H. Fluid Mechanics; OficynaWyd. PWR: Wroclaw, Poland, 2001; p. 386. (In Polish) [Google Scholar]
  15. Mazurczyk, A.K. Turbulent Velocity Fields in Complex Cross-Section Channels with Wooded Floodplains. Ph.D. Thesis, Institute of Geophysics Polish Academy of Sciences, Warsaw, Poland, 2007. (In Polish). [Google Scholar]
  16. Sigloch, H. Technical Fluidmechanics; VDI-Verlag: Duesseldorf, Germany, 1991; Volume 351. (In German) [Google Scholar]
  17. Carollo, F.G.; Ferro, V.; Termini, D. Analyzing Turbulence Intensity in Gravel Bed Channels. J. Hydraul. Engin. ASCE 2005, 131, 1050–1061. [Google Scholar] [CrossRef]
  18. Pasche, E. Turbulence Mechanism in Natural Streams and the Possibility of Its Mechanical Representation. In Mitteilungen des Instituts Fürwasserbau Und Wasserwirtschaft; TU Aachen: Aachen, Germany, 1984; Volume 52. (In German) [Google Scholar]
  19. Kozioł, A.P. Laboratory Studies of the Effect of Trees in Lowland River Channels on Turbulent Stream Flow Characteristics; Monograph, SGGW-University: Warsaw, Poland, 2019. (In Polish) [Google Scholar]
  20. Kozioł, A.P. Turbulent kinetic energy of water in a compound channel. Ann. Wars. Univ. Life Sci.-SGGW Land Reclam. 2011, 43, 193–205. [Google Scholar] [CrossRef]
  21. Nezu, I.; Onitsuka, K. Turbulent structures in partly vegetated open-channel flows with LDA and PIV measurements. J. Hydraul. Res. 2001, 39, 629–642. [Google Scholar] [CrossRef]
  22. Neary, V.; Constantinescu, S.; Bennett, S.; Diplas, P. Effects of Vegetation on Turbulence, Sediment Transport and Stream Morphology. J. Hydraul. Eng. 2012, 138, 765–776. [Google Scholar] [CrossRef]
  23. Ortiz, A.C.; Ashton, A.; Nepf, H. Mean and turbulent velocity fields near rigid and flexible plants and the implications for deposition. J. Geophys. Res. Earth Surf. 2013, 118, 2585–2599. [Google Scholar] [CrossRef]
  24. Tsujimoto, T.; Kitamura, T. Flow over Flexible Vegetation and Formation of Honami Motion; Monograph of 9th APD-IAHR: Singapore, 1994. [Google Scholar]
  25. Mazurczyk, A.K. Scales of Turbulence in Compound Channels with Trees on Floodplains; Publications of the Institute of Geophysics Polish Academy of Sciences: Warsaw, Poland, 2007; Volume 401, pp. 169–176. [Google Scholar]
  26. Yalin, M.S. Large-scale turbulence and river morphology. In Proceedings of the 3rd International Conference on Fluvial Hydraulics, Lisbon, Portugal, 6–8 September 2006; pp. 6–8. [Google Scholar]
  27. Franca, M.J.; Brocchini, M. Turbulence in Rivers. In Rivers—Physical, Fluvial and Environmental Processes; Rowinski, P., Radecki-Pawlik, A., Eds.; Springer International Publishing: Cham, Switzerland, 2015; pp. 51–78. [Google Scholar]
  28. Książek, L.; Bartnik, W.; Rumian, J.; Zagórowski, P. Turbulent water flow over rough bed. 13th European Turbulence Conference in Warsaw 2011. J. Phys. Conf. Ser. 2011, 318, 022021. [Google Scholar] [CrossRef]
  29. Tang, X.; Lin, P.; Liu, P.L.F.; Zhang, X. Numerical and experimental studies of turbulence in vegetated open-channel flows. Environ. Fluid Mech. 2021, 21, 1137–1163. [Google Scholar] [CrossRef]
  30. Penna, N.; Coscarella, F.; D’Ippolito, A.; Gaudio, R. Bed Roughness Effects on the Turbulence Characteristics of Flows through Emergent Rigid Vegetation. Water 2020, 12, 2401. [Google Scholar] [CrossRef]
  31. Valyrakis, M.; Liu, D.; Turker, U.; Yagci, O. The role of increasing riverbank vegetation density on flow dynamics across an asymmetrical channel. Environ. Fluid Mech. 2021, 21, 643–666. [Google Scholar] [CrossRef]
  32. Woś, A.; Książek, L. Hydrodynamics of the Instream Flow Environment of a Gravel-Bed River. Sustainability 2022, 14, 15330. [Google Scholar] [CrossRef]
  33. Soltani, N.; Afzalimehr, H.; Singh, V.P. Influence of Vegetated Banks on Turbulent Characteristics of Non-uniform Flow in Gravel Bed River. Int. J. Hydraul. Eng. 2020, 9, 15–23. [Google Scholar] [CrossRef]
  34. Afzalimehr, H.; Maddahi, M.R.; Sui, J.; Rahimpour, M. Flow characteristics in gravel-bed rivers. J. Hydrodyn. 2019, 31, 986–998. [Google Scholar] [CrossRef]
  35. Tymiński, T.; Kałuża, T. Effect of Vegetation on Flow Conditions in the “nature-like“ Fishways. Ann. Set Environ. Protect. 2013, 15, 348–360. [Google Scholar]
  36. Wałęga, A.; Kędzior, R.; Książek, L.; Młyński, D.; Strużyński, A.; Grela, J.; Madej, P.; Skalski, T. Flow predictability indicates the ecological quality of the river: A case of invertebrates in Central Europe. Ecol. Indic. 2022, 143, 109308. [Google Scholar] [CrossRef]
  37. Liu, D.; Valyrakis, M.; Williams, R. Flow Hydrodynamics across Open Channel Flows with Riparian Zones: Implications for Riverbank Stability. Water 2017, 9, 720. [Google Scholar] [CrossRef]
  38. Babaeyan-Koopaei, K.; Ervine, D.A.; Carling, P.A.; Cao, Z. Velocity and Turbulence Measurements for Two Overbank Flow Events in River Severn. J. Hydraul. Engin. ASCE 2002, 128, 891–900. [Google Scholar] [CrossRef]
  39. Kubrak, E.; Kubrak, J.; Rowiński, P.M. Vertical Velocity Distributions through and above Submerged, Flexible Vegetation. Hydrol. Sci. J. 2008, 53, 905–920. [Google Scholar] [CrossRef]
  40. Laks, I.; Szoszkiewicz, K.; Kałuża, T. Analysis of in situ water velocity distributions in the lowland river floodplain covered by grassland and reed marsh habitats—A case study of the bypass channel of Warta River (Western Poland). J. Hydrol. Hydromech. 2017, 65, 325–332. [Google Scholar] [CrossRef]
  41. Wolski, K.; Tymiński, T.; Chrobak, G. Numerical modeling of the hydraulic impact of riparian vegetation. In Proceedings of the 10th Conference on Interdisciplinary Problems in Environmental Protection and Engineering EKO-DOK 2018, Polanica-Zdrój, Poland, 16–18 April 2018. [Google Scholar]
  42. Zhang, J.; Zhong, Y.; Huai, W. Transverse distribution of streamwise velocity in open-channel flow with artificial emergent vegetation. Ecol. Eng. 2018, 110, 78–86. [Google Scholar] [CrossRef]
  43. Zhang, M.; Jiang, C.; Huang, H.; Nanson, G.C.; Chen, Z.; Yao, W. Analytical models for velocity distributions in compound channels with emerged and submerged vegetated floodplains. Chin. Geogr. Sci. 2017, 27, 577–588. [Google Scholar] [CrossRef]
  44. Kałuża, T.; Radecki-Pawlik, A.; Szoszkiewicz, K.; Plesiński, K.; Radecki-Pawlik, B.; Laks, I. Plant basket hydraulic structures (PBHS) as a new river restoration measure. Sci. Total Environ. 2018, 627, 245–255. [Google Scholar] [CrossRef]
  45. Mera, I.; Franca, M.J.; Anta, J.; Pena, E. Turbulence anisotropy in a compound meandering channel with different submergence conditions. Adv. Water Resour. 2015, 81, 142–151. [Google Scholar] [CrossRef]
  46. Sukhodolov, A.N. Structure of turbulent flow in a meander bend of a lowland river. Water Resour. Res. 2012, 48, 1–21. [Google Scholar] [CrossRef]
  47. Szałkiewicz, E.; Dysarz, T.; Kałuża, T.; Malinger, A.; Radecki-Pawlik, A. Analysis of in-stream restoration structures impact on hydraulic condition and sedimentation in the Flinta river, Poland. Carpath. J. Earth Environ. Sci. 2019, 14, 275–286. [Google Scholar] [CrossRef]
  48. Zaborowski, S.; Kałuża, T.; Rybacki, M.; Radecki-Pawlik, A. Influence of river channel deflector hydraulic structures on lowland river roughness coefficient values: The Flinta river, Wielkopolska Province, Poland. Ecohydrol. Hydrobiol. 2022, 11, 79–97. [Google Scholar] [CrossRef]
  49. Caroppi, G.; Västilä, K.; Järvelä, J.; Lee, C.; Ji, U.; Kim, H.S.; Kim, S. Flow and Wake Characteristics Associated with Riparian Vegetation Patches: Results from Field-scale Experiments. Hydrol. Process. 2022, 36, e14506. [Google Scholar] [CrossRef]
  50. Ghani, U.; Anjum, N.; Pasha, G.A.; Ahmad, M. Investigating the turbulent flow characteristics in an open channel with staggered vegetation patches. River Res. Appl. 2019, 35, 966–978. [Google Scholar] [CrossRef]
  51. Kubrak, E.; Kubrak, J.; Kiczko, A. Experimental Investigation of Kinetic Energy and Momentum Coefficients in Regular Channels with Stiff and Flexible Elements Simulating Submerged Vegetation. Acta Geophys. 2015, 63, 1405–1422. [Google Scholar] [CrossRef]
  52. Hawryło, A.; Książek, L.; Leja, M. Turbulence intensity in different morphological units using the Skawa River as an example. In Interdisciplinary Issues in Environmental Engineering and Protection; Traczewska, T., Ed.; Wroclaw University of Science and Technology: Wrocław, Poland, 2013; pp. 195–202. (In Polish) [Google Scholar]
  53. Velasco, D.; Bateman, A.; Redondo, J.M.; Demedina, V. An Open Channel Flow Experimental and Theoretical Study of Resistance and Turbulent Characterization over Flexible Vegetated Linings Flow. In Turbulence and Combustion; Kluwer Academic Publishers: London, UK, 2003; Volume 70, pp. 69–88. [Google Scholar]
  54. Kałuża, T.; Sojka, M.; Wróżyński, R.; Jaskuła, J.; Zaborowski, S.; Hämmerling, M. Modeling of River Channel Shading as a Factor for Changes in Hydromorphological Conditions of Small Lowland Rivers. Water 2020, 12, 527. [Google Scholar] [CrossRef]
  55. Kałuża, T.; Sojka, M.; Strzeliński, P.; Wróżyński, R. Application of Terrestrial Laser Scanning to Tree Trunk Bark Structure Characteristics Evaluation and Analysis of Their Effect on the Flow Resistance Coefficient. Water 2018, 10, 753. [Google Scholar] [CrossRef]
Figure 1. Quasi-triangle riverside vegetation zones.
Sustainability 16 00337 g001
Figure 2. Local distribution of velocity around a vegetation zone located directly in the river current (an example simulation for the Sleza River).
Sustainability 16 00337 g002
Figure 3. Laboratory research flume with vegetational build-up (Phragmites australis).
Sustainability 16 00337 g003
Figure 4. Diagram of the arrangement of the plant zones and the measurement site in the laboratory flume.
Sustainability 16 00337 g004
Figure 5. Measuring instruments (the PEMS).
Sustainability 16 00337 g005
Figure 6. (A) Distribution of the flow velocity vx in profiles X (lengthwise) in a channel without vegetation, (B) distribution of the flow velocity vx in profiles X in a channel with vegetation, (C) distribution of the flow velocity vx in profiles Y (crosswise) in a channel without vegetation, (D) distribution of the flow velocity vx in profiles Y in a channel with vegetation.
Sustainability 16 00337 g006
Figure 7. (A) Distribution of the flow velocity vy in profiles X in a channel without vegetation, (B) distribution of the flow velocity vy in profiles X in a channel with vegetation, (C) distribution of the flow velocity vy in profiles Y in a channel without vegetation, (D) distribution of the flow velocity vy in profiles Y in a channel with vegetation.
Sustainability 16 00337 g007
Figure 8. (A) Distribution of the degree of turbulence Tu in profiles X in a channel without vegetation, (B) distribution of the degree of turbulence Tu in profiles X in a channel with vegetation, (C) distribution of the degree of turbulence Tu in profiles Y in a channel without vegetation, (D) distribution of the degree of turbulence Tu in profiles Y in a channel with vegetation.
Sustainability 16 00337 g008
Figure 9. Spatial distribution of the intensity of turbulence Tu in the laboratory flume without vegetation {where: Tu(mean) = 0.45, Tu(min) = 0.28, Tu(max) = 0.58}.
Sustainability 16 00337 g009
Figure 10. An example of spatial distribution of the intensity of turbulence Tu by q = 0.033 m3/(s·m) in the laboratory flume with vegetation {where: Tu(mean) = 0.55, Tu(min) = 0.24, Tu(max) = 0.80}.
Sustainability 16 00337 g010
Disclaimer/Publisher’s Note: The statements, opinions and data contained in all publications are solely those of the individual author(s) and contributor(s) and not of MDPI and/or the editor(s). MDPI and/or the editor(s) disclaim responsibility for any injury to people or property resulting from any ideas, methods, instructions or products referred to in the content.

