Article

Separation, Isolation, and Enrichment of Samples of Phenolic Compounds from Winemaking By-Products

by
Andreas D. Zentelis
1,2,
Michael P. Kodjapashis
1,3,
Nikodimos Kotrotsos
3,
Dimitris P. Zagklis
1,3,
Varvara Sygouni
1,3,
Fotini N. Lamari
2 and
Christakis A. Paraskeva
1,3,*
1
Foundation for Research and Technology, Hellas, Institute of Chemical Engineering Sciences, FORTH/ICE-HT, 26504 Patras, Greece
2
Department of Pharmacy, University of Patras, 26504 Patras, Greece
3
Department of Chemical Engineering, University of Patras, 26504 Patras, Greece
*
Author to whom correspondence should be addressed.
Sustainability 2023, 15(16), 12221; https://doi.org/10.3390/su151612221
Submission received: 22 June 2023 / Revised: 1 August 2023 / Accepted: 7 August 2023 / Published: 10 August 2023
(This article belongs to the Special Issue Agro-Industrial Residues Treatment, Recycling, and Reuse)

Abstract

:
Grapes, especially those of the red varieties, have a high content of polyphenolic compounds. After the removal of the juice during the winemaking process, the grape marc (peels and seeds) remains as waste, making it a promising source for the isolation of polyphenols. The separation, recovery, and enrichment of samples of phenolic compounds offers the possibility of their subsequent utilization in the food, pharmaceutical, and cosmetics industries. In this paper, results are presented on both laboratory and pilot scales, including the effect of basic extraction parameters such as the solvent (water, ethanol, acetone, polyethylene glycol, ethyl acetate, and their respective 50% aqueous solutions), the solid/liquid ratio, the extraction time, and the temperature. The enrichment of the extracts in phenolic compounds was performed with the help of a series of membrane processes and rotary evaporation. The experiments showed the presence of almost all known compounds reported in the literature with pro-anthocyanidins (dimers-trimers) and flavan-3-ols together with various metabolites accompanied by a significant reduction in the values of total organic load.

1. Introduction

In recent years, the interest in the utilization of by-products of agro-industrial origin has increased, especially in those of food products such as wine and olive oil, due to both environmental and pharmaceutical reasons [1,2,3].
The treatment of the specific by-products using processes that are friendly to the environment is recommended. The removal of organic compounds, especially phenols, is very important because phenolics cause an environmental burden due to their toxicity [4]. However, their ability to act as a substrate for the action of free radicals such as Reactive Oxygen and Nitrogen Species (ROS, RNS) makes them antioxidant compounds [5]. Thus, they can be valorized after their optimal separation and isolation as antioxidant reagents in the pharmaceutical and food industries [3]. During vinification and the treatment of Vitis vinifera L. fruits, by-products such as grape marc and wine bottom sludges are produced in large quantities. The quantity of by-products obtained corresponds to approximately 1/3 (w/w) of the mass of the processed grapes [6,7]. The most important of the above by-products are the skin and seeds of the grape marc, which correspond to 20–30% of the fruit mass and are usually disposed of in the environment without any further treatment [7,8,9,10].
Phenolic compounds are synthesized in V. vinifera as secondary metabolites. Their presence confers several functions such as deterrence of herbivores, protection from microbial infections and the harmful effect of ultraviolet radiation, and reduction in cell oxidation due to stress caused by lack of water. At the same time, phenolics give the fruit specific characteristics in terms of color, aroma, and taste. The largest quantity of phenolic compounds is found in the skin and seeds of the fruit, and also in the stems [8,11]. From a chemical point of view, the grape marc is composed of water (55–75%), fiber (43–75%), and proteins (6–10%) [12], while its total phenolic content (TPC) is between 1.2 and 74.8 g/kg of dry mass (DM). The prevalent phenols found in the marc (peels and skins) of fruits of V. vinifera varieties are (+)-catechin, (−)-epicatechin, epigallocatechin, flavan-3-ols, the condensed tannins of proanthocyanins, and gallic acid [10,13].
The composition of grape marc depends on several parameters such as the variety, the stage of the fruit’s development, the climatic conditions, and the stimuli received by the plant from external factors, including infections [9]. The red varieties show significantly higher quantities of total phenols compared to the white varieties, which is attributed to their high content of anthocyanins [14]. Thus, the anthocyanins found in the exocarp of the red varieties provide the characteristic color, while the color in the white varieties is attributed to the contained carotenoids and xanthophylls [9]. This broader category of phenols can be divided into two major categories: non-flavonoid phenols and flavonoid phenols. The first category includes phenolic acids and stilbenes, while the second category includes flavan-3-ols, flavonols, and anthocyanins [15]. Moreover, the phenolic acids of the non-flavonoid category can be divided into hydroxycinnamic and hydroxybenzoic acid derivatives [16].
Therefore, grape marc is a notable source of polyphenols. Due to their chemical structure and their ability to inhibit the action of active free radicals, such as ROS/NOS, as substrates they can delay and/or inhibit the oxidation of cells. In this way, they protect the human body from oxidative stress, which can cause cardiovascular problems, cancer, and many other serious degenerative diseases [17,18,19,20,21]. Thanks to these properties, the isolation of polyphenols from grape marc is an innovative solution, and these can be used in the food and pharmaceutical industries. In the first case, their use is based on the preparation of a product as a food supplement of high added value, while in the second, they can be used in the preparation of a cosmetic product with protective effects [18,19,20].
The large volumes of grape marc that are deposited for biodegradation, amounting to 9 million tons of organic waste per year (20% of the total grapes used for wine production) [3], combined with their high organic load, have led to the appearance of phenomena that are toxic to the environment, such as the degradation of biodiversity. Therefore, it is considered necessary to process the grape marc before its uncontrolled release into the environment and it is important to isolate the most profitable organic compounds from these by-products. These facts have led the scientific community to identify new methods and processes for processing them. Their most important areas of application, as well as their respective uses, are presented in Table 1.
Several processes have been proposed for the management of winery by-products. More specifically, for the treatment of liquid effluents, processes such as electrocoagulation, coagulation, sedimentation, and membrane filtration (physicochemical methods), aerobic and anaerobic digestion (biological methods), and advanced oxidation are used [22]. Regarding solid winery by-products, membrane filtration has been used for the isolation of phenolic compounds [23], as well as other environmentally friendly processes, such as supercritical fluid extraction, use of enzymes, pulsed ohmic heating, and high voltage electric discharge [24].
In the present work, the authors focused on the valorization of the wastes produced during the wine-making processes, isolating the phenolic substances from grape marc through a systematic study of solid–liquid extraction experiments. Further enrichment in phenolics was obtained using membrane filtration. Firstly, a detailed experimental investigation of the effect of the system parameters (solvent, solid/liquid ratio, temperature) during the extraction of phenolic compounds was undertaken. The solids were selected from grapes of the Merlot variety. The extracts obtained from the parametric analysis were tested in a pilot-scale experiment using a membrane system consisting of an ultrafiltration (UF) membrane, two nanofiltration (NF) membranes, and a reverse osmosis (RO) membrane. The products obtained from the extraction were further treated with the pilot-scale membrane system. The final products were characterized for their total phenolic content (TPC), total carbohydrate content (TCC), and antioxidant activity with the FRAP (Ferric Reducing Antioxidant Power) assay.

2. Materials and Methods

2.1. Grape Marc

All experiments were conducted using grape marc of the Merlot variety as raw material, which previously had been dried and pulped (dry mass, DM). The grape marc came from fruits that were harvested in the wider region of Achaia (Greece) in 2019 and were supplied by the winery OINIKI SA–Georgios Karelas in Kato Achaia (Greece). Firstly, the raw material was spread out and dried under ambient conditions. Then, it was pulverized with a grinding device and dried in a thermostatic dryer at 25 °C. In the extraction experiments, 30 g of grape marc was utilized, whereas the pilot plant experiments involved the use of 10 kg of ground solids.

2.2. Extraction Procedure

In the first stage, low-toxicity and environmentally friendly solvents [25,26] were selected and tested. A quantity of 30 g of ground dried grape marc was extracted with 300 mL of different types of solvent (distilled water, ethanol (EtOH) 96.4% v/v, acetone 99.98 (lach:ner), polyethylene glycol (PEG) 400 (Merck) for synthesis, and their corresponding aqueous solutions at a ratio of 50% (v/v), i.e., 50% organic solvent and 50% water). All parameters, other than the type of solvent, remained constant (solid/solvent volume ratio of 1/10 (w/v), for 60 min, at room temperature (RT) and under stirring at 150 rpm). Upon completion of each extraction, the extract was obtained, which was first filtered successively using sieves with a pore size of 2.00 mm, 0.600 mm, and 0.125 mm. The particles that remained in the filtrate were then removed by centrifugation at 4000 rpm (Hettich EBA 20 centrifuge, Hettich, Tuttlingen, Germany). Finally, the supernatant obtained after centrifugation was used for the measurement of total phenolic content (TPC). At the initial stage of the experimental process, the optimal conditions for the extraction of total phenolic compounds from grape marc were investigated to obtain the higher phenolic content with simultaneous limited extraction of carbohydrates (total carbohydrate content, TCC). In these experiments, grape marc collected in a previous harvesting period was used.
In subsequent experiments, extraction was conducted using water and ethanol at a solid/liquid ratio of 1/5 and 1/10 w/v, for 10, 30, and 60 min and at 10, 25, 40, 50, and 65 °C for 2 and/or 3 successive extraction steps. At this stage, the extraction conditions of phenols and carbohydrates from Merlot grape marc were optimized and applied to the pilot-scale extraction.

2.3. Pilot-Scale Extraction Experiments

Considering the results of the laboratory parametric analysis of extractions, the optimal conditions were applied to the final pilot-scale extraction. The pilot-scale extraction was performed in 3 steps (Figure 1).
(1)
Extraction of 6 kg of solid with 30 L of water to reduce the carbohydrate content of the grape marc. At this stage, the supernatant liquid was removed (23.5 L) while the solid was used for the next steps of the pilot-scale extraction.
(2)
A quantity of 6.25 kg from the above solid, which represented half of the total solid (3 kg of solid + 3.25 kg from water absorbed by the solid) was extracted with 26.75 L of 50% ethanol solvent to obtain an extract rich in phenolic compounds with limited carbohydrates. At this point, the appropriate volume of ethanol was calculated, considering the water absorbed by the solid. After the end of the extraction, the solid was removed while the ethanolic extract (24 L) was used in step 3.
(3)
The solid from step 1 was added to the above extract and extraction was performed to further enrich the phenolics while saving solvent. The quantity of the final ethanolic extract obtained was 18 L.
In the first stage, the extraction of phenols (TPC) and sugars (TCC) from Merlot grape marc was investigated. The experimental procedure concerned the successive extractions of the raw material and their effect on the recovery of phenolic compounds combined with a reduced content of sugars. The parameters that were applied to the pilot-scale extraction were, for the first extraction, a 1/5 w/v solid-to-solvent ratio (this ratio exhibited the highest TCC/TPC ratio), 10 min duration (no significant difference was exhibited between the tested durations, with the p-value of their statistical analysis being greater than 0.05 in all cases), and 10 °C to keep the extracted phenols to a minimum. For the second and third extractions, 50% ethanol was used (second-best extraction performance after acetone, but acetone would hinder the membrane filtration process), a 1/10 w/v solid-to-solvent ratio, 60 min extraction duration, and room temperature to minimize the evaporation of the solvent. The resulting extract obtained from the pilot-scale extraction was further processed using a membrane system consisting of a UF membrane, two NF membranes with different molecular weight cut-offs (MWCOs), namely NF600 and NF300, and, finally, an RO membrane. In the resulting extracts, Iwater, Iethanol, and IIethanol, TPC and TCC were measured, as well as their antioxidant activity.

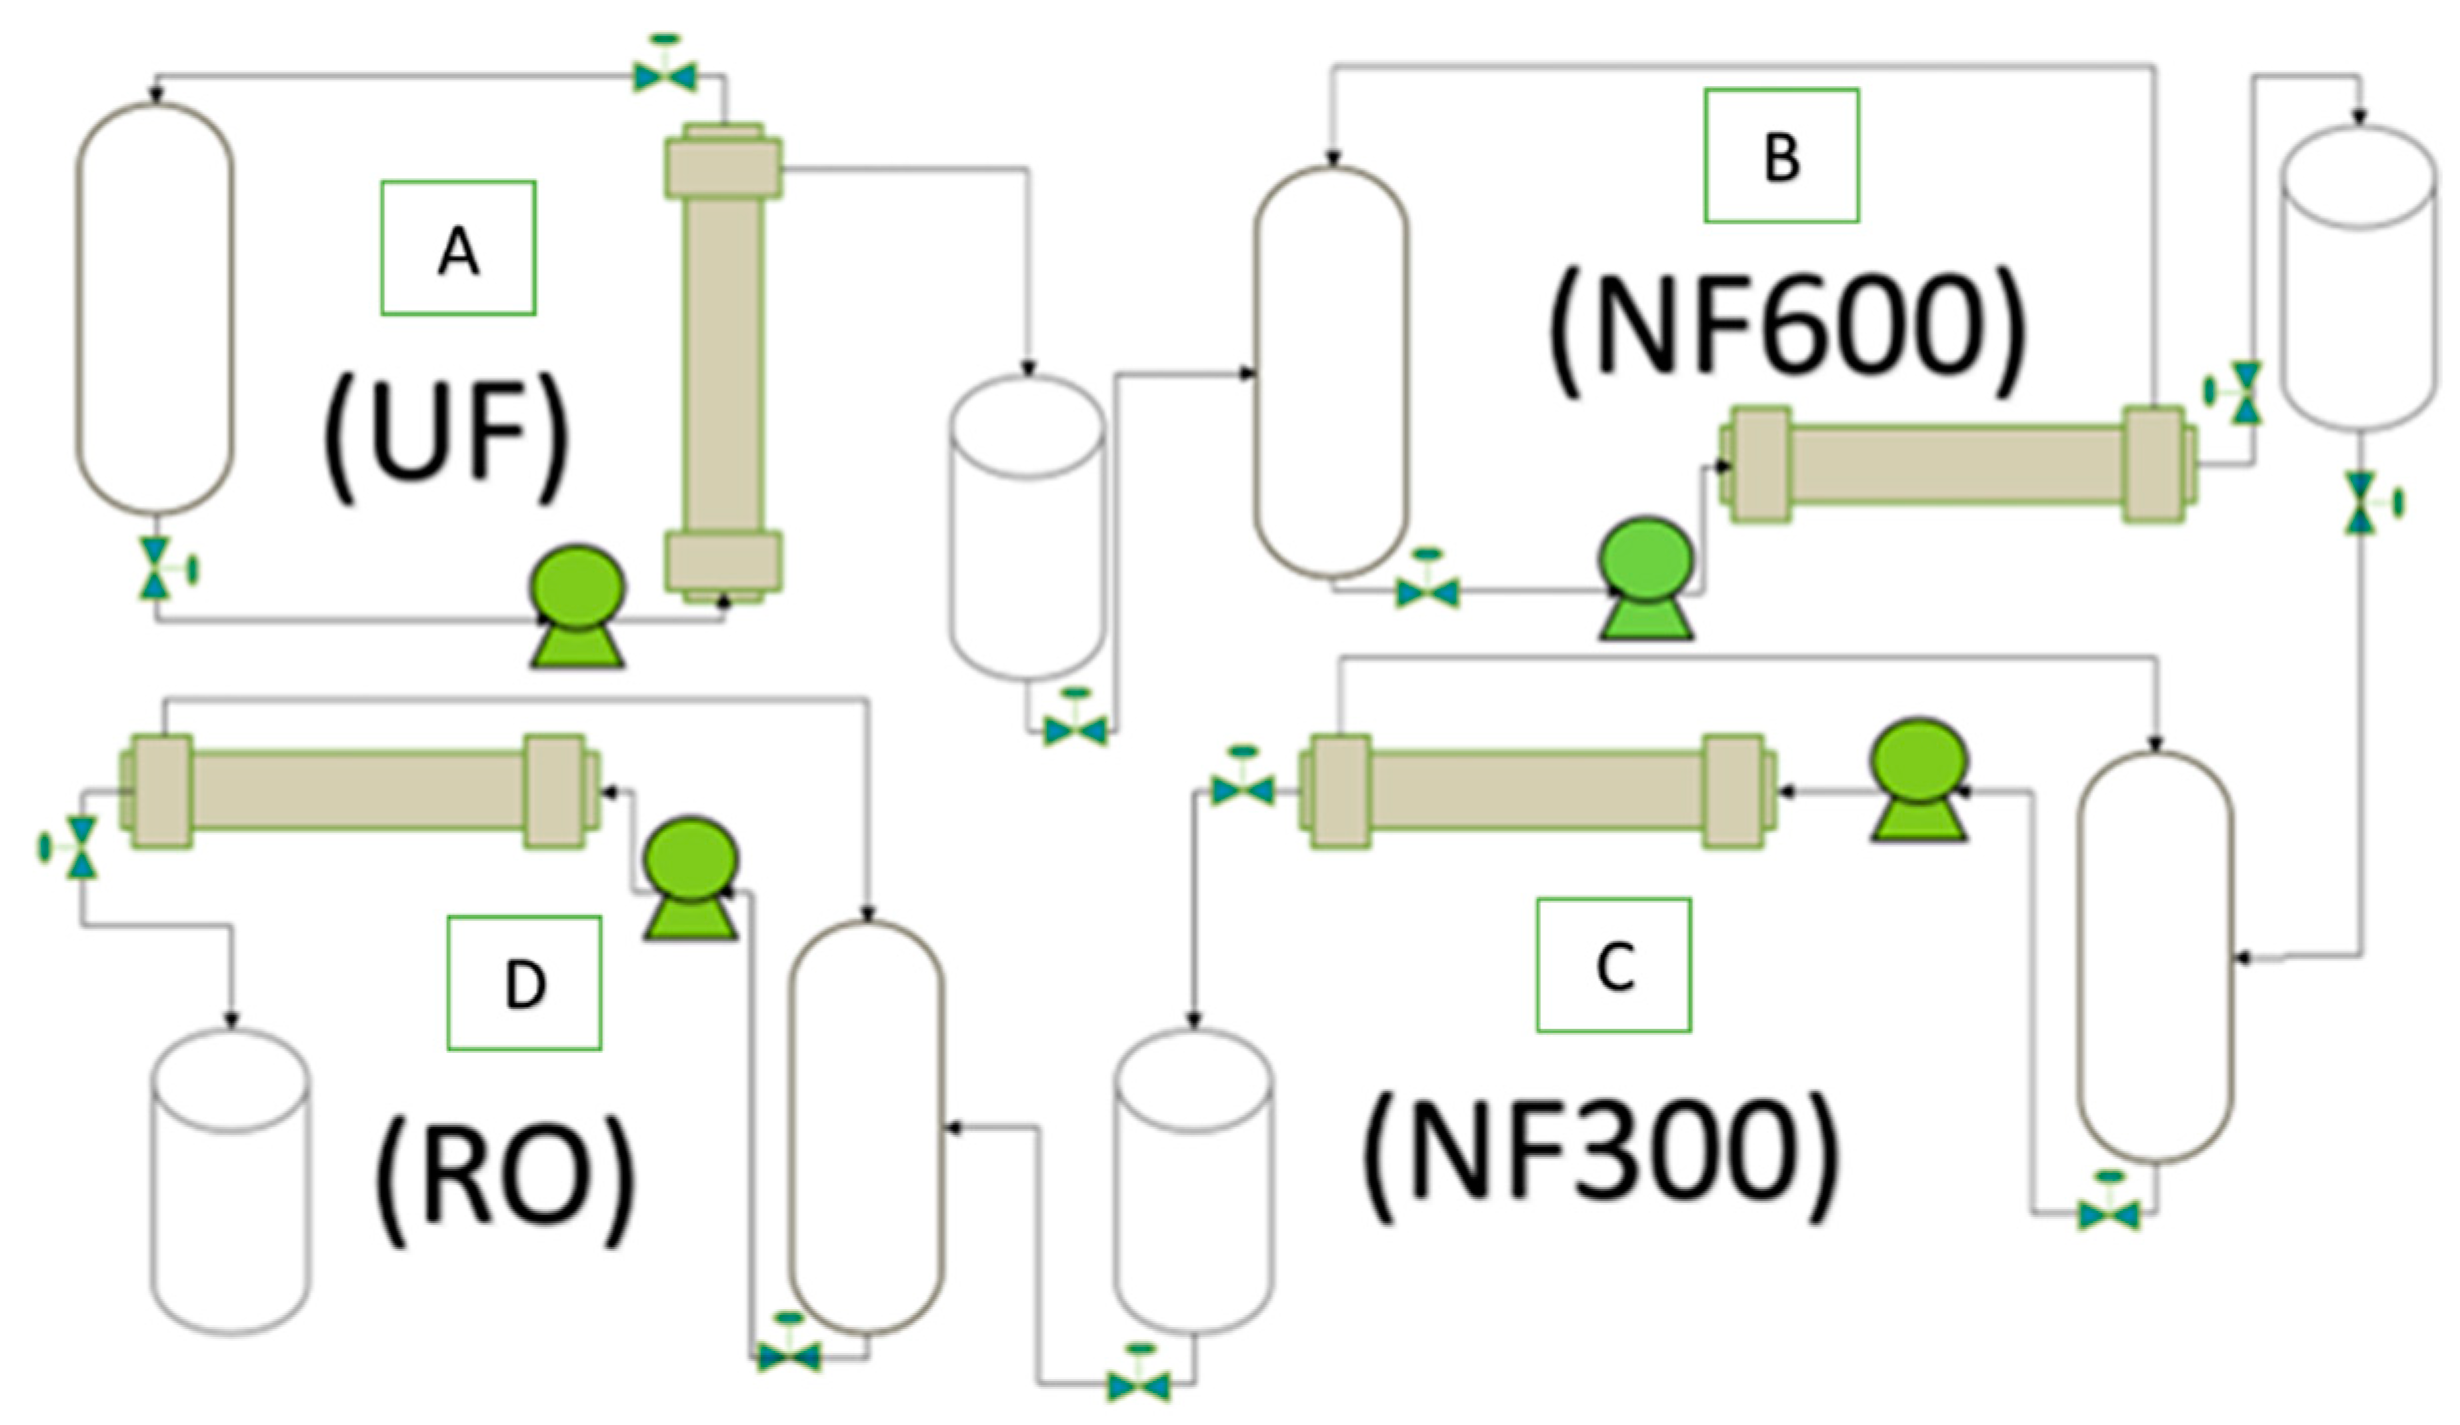
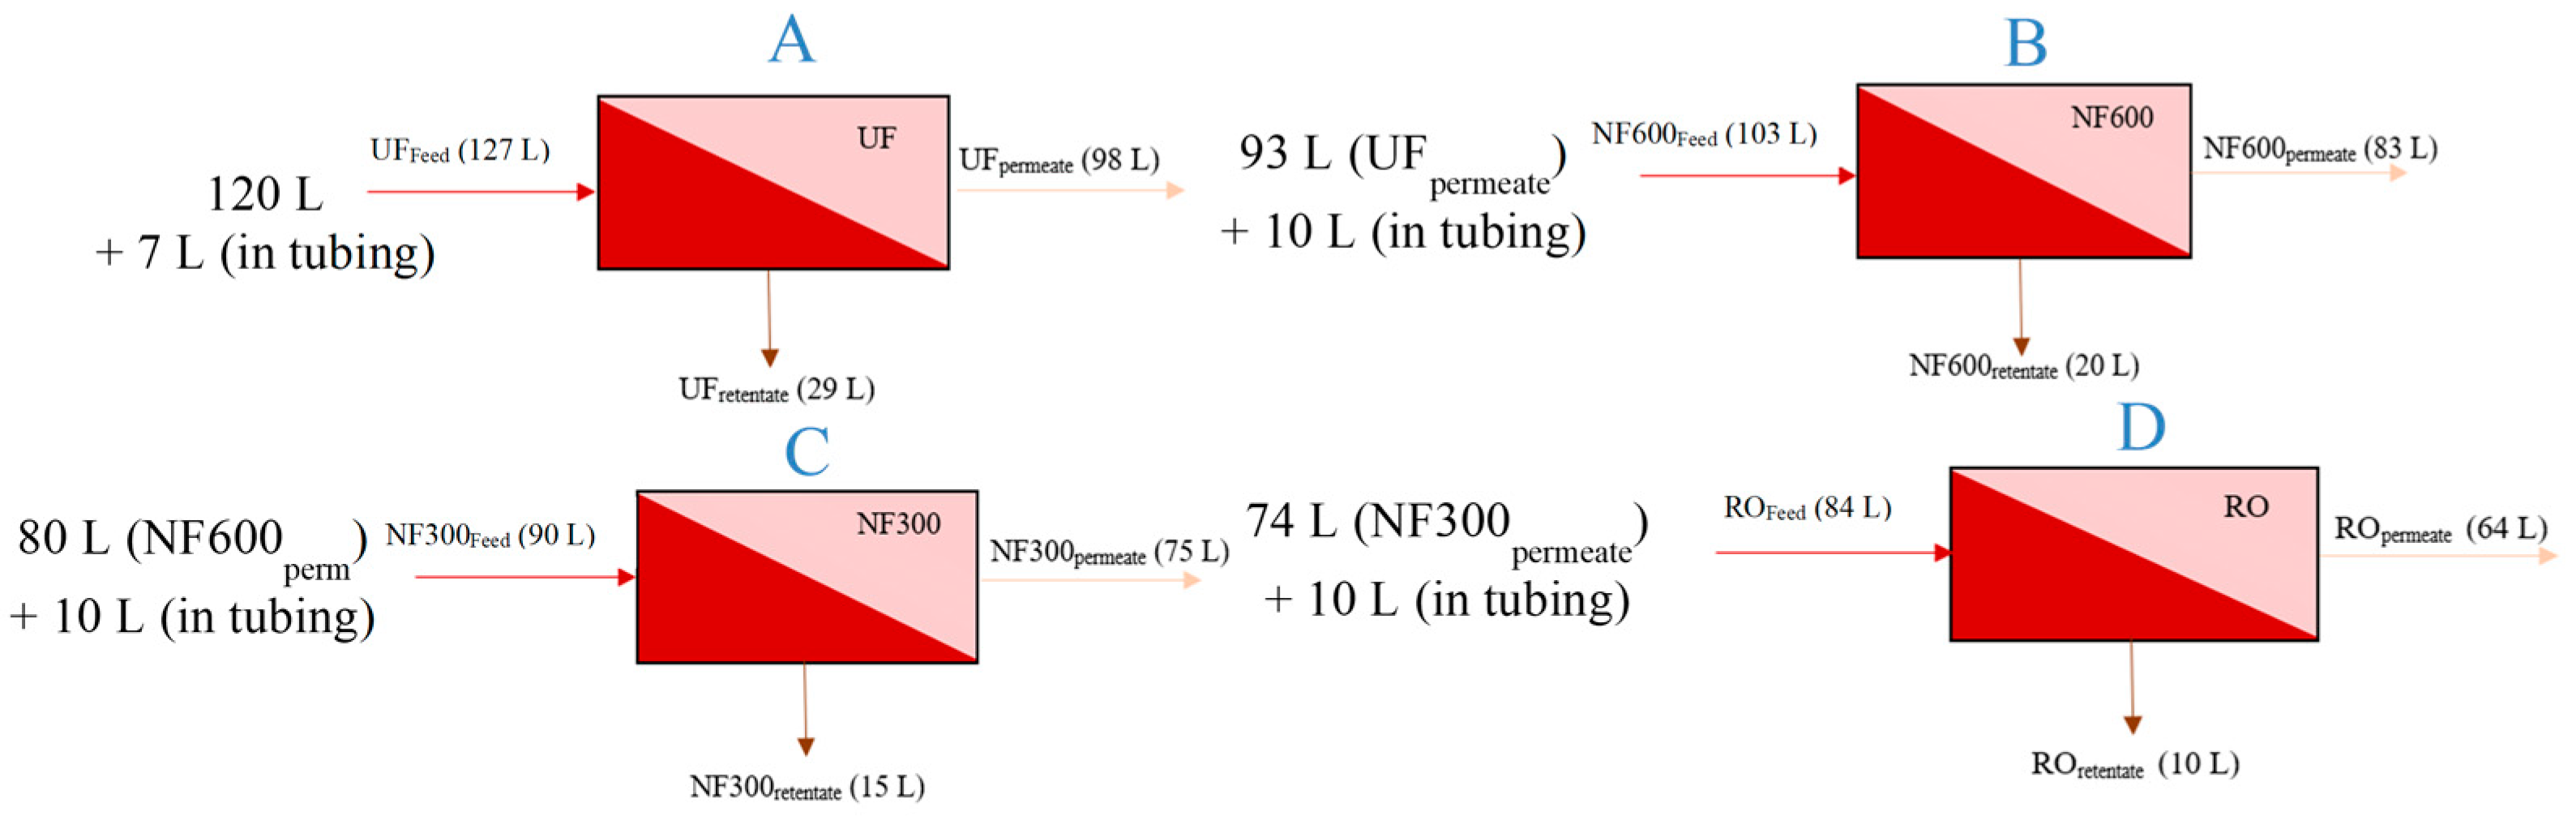
2.4. Membrane Filtration Schemes

Four types of membrane and two types of unit were used for the filtration of the final ethanolic extract through pilot-scale membranes (Figure 2). The ultrafiltration (UF) membrane was permanently installed in one unit, while the two nanofiltration (NF600 and NF300) membranes and one reverse osmosis (RO) membrane were installed one after the other in the second unit.
All membranes used were purchased from Hydro Air Research SPA (Milan, Italy). Table 2 summarizes the characteristics of the membranes and the units used [23,27,28,29].

2.5. Total Phenolic Content (TPC)—Folin–Ciocalteau Assay

The determination of total phenolic content (TPC) in each sample using the Folin–Ciocalteu assay was conducted according to the laboratory protocol [30]. Initially, the construction of the calibration curve (Appendix A), the absorbance (Abs) versus gallic acid concentration (mg GA/L), was performed to determine the TPC concentration of each sample, expressed in gallic acid equivalent (GA) units. The range of gallic acid concentration (mg GAE/L) showing linearity under the given conditions is in the range of 25–250 mg GA/L. The following reagents were used: Folin and Ciocalteu’s phenol reagent 2 N (Sigma Aldrich, Burlington, VT, USA); Νa2CO3–anhydrous ≥ 99.5% (Sigma Aldrich), which was prepared to 200 g/L solution in the laboratory; and gallic acid 97.5–102.5% (titration) (Sigma). The absorbance was measured with a UV-Vis spectrophotometer (Shimadzu UV-1601, Kyoto, Japan) at 760 nm.

2.6. Total Carbohydrate Content (TCC)

Measurement of total carbohydrates (TCC) in the samples was performed using the L-tryptophan reagent, according to the laboratory protocol [31]. The following reagents were used: L-tryptophan (≥98%, Sigma Aldrich), boric acid (≥99.5%, Sigma Aldrich), H2SO4 (96%, Penta Bioscience Products, Mumbai, India), D-glucose anhydrous (Merck, Darmstadt, Germany). The L-tryptophan reagent was prepared in the laboratory as follows: In 500 mL of a solution of H2SO4 that was under constant stirring, 25 g of boric acid was first added, followed by 5 g of L-tryptophan, and the solution was made up to 800 mL using H2SO4. Then, it was left for 6 h in a dark place and under constant stirring. Finally, another 200 mL of H2SO4 was added and the entire reagent was stored in a dark-colored bottle. Regarding the measurement of total sugars, the absorbance calibration curve against the glucose concentration (mg GLU/L) had to be constructed first (Appendix A) to determine the sugar concentration of each sample expressed in glucose units (glucose equivalent, GLU). The absorption was measured with a UV-Vis spectrophotometer (Shimadzu UV-1601) 525 nm.

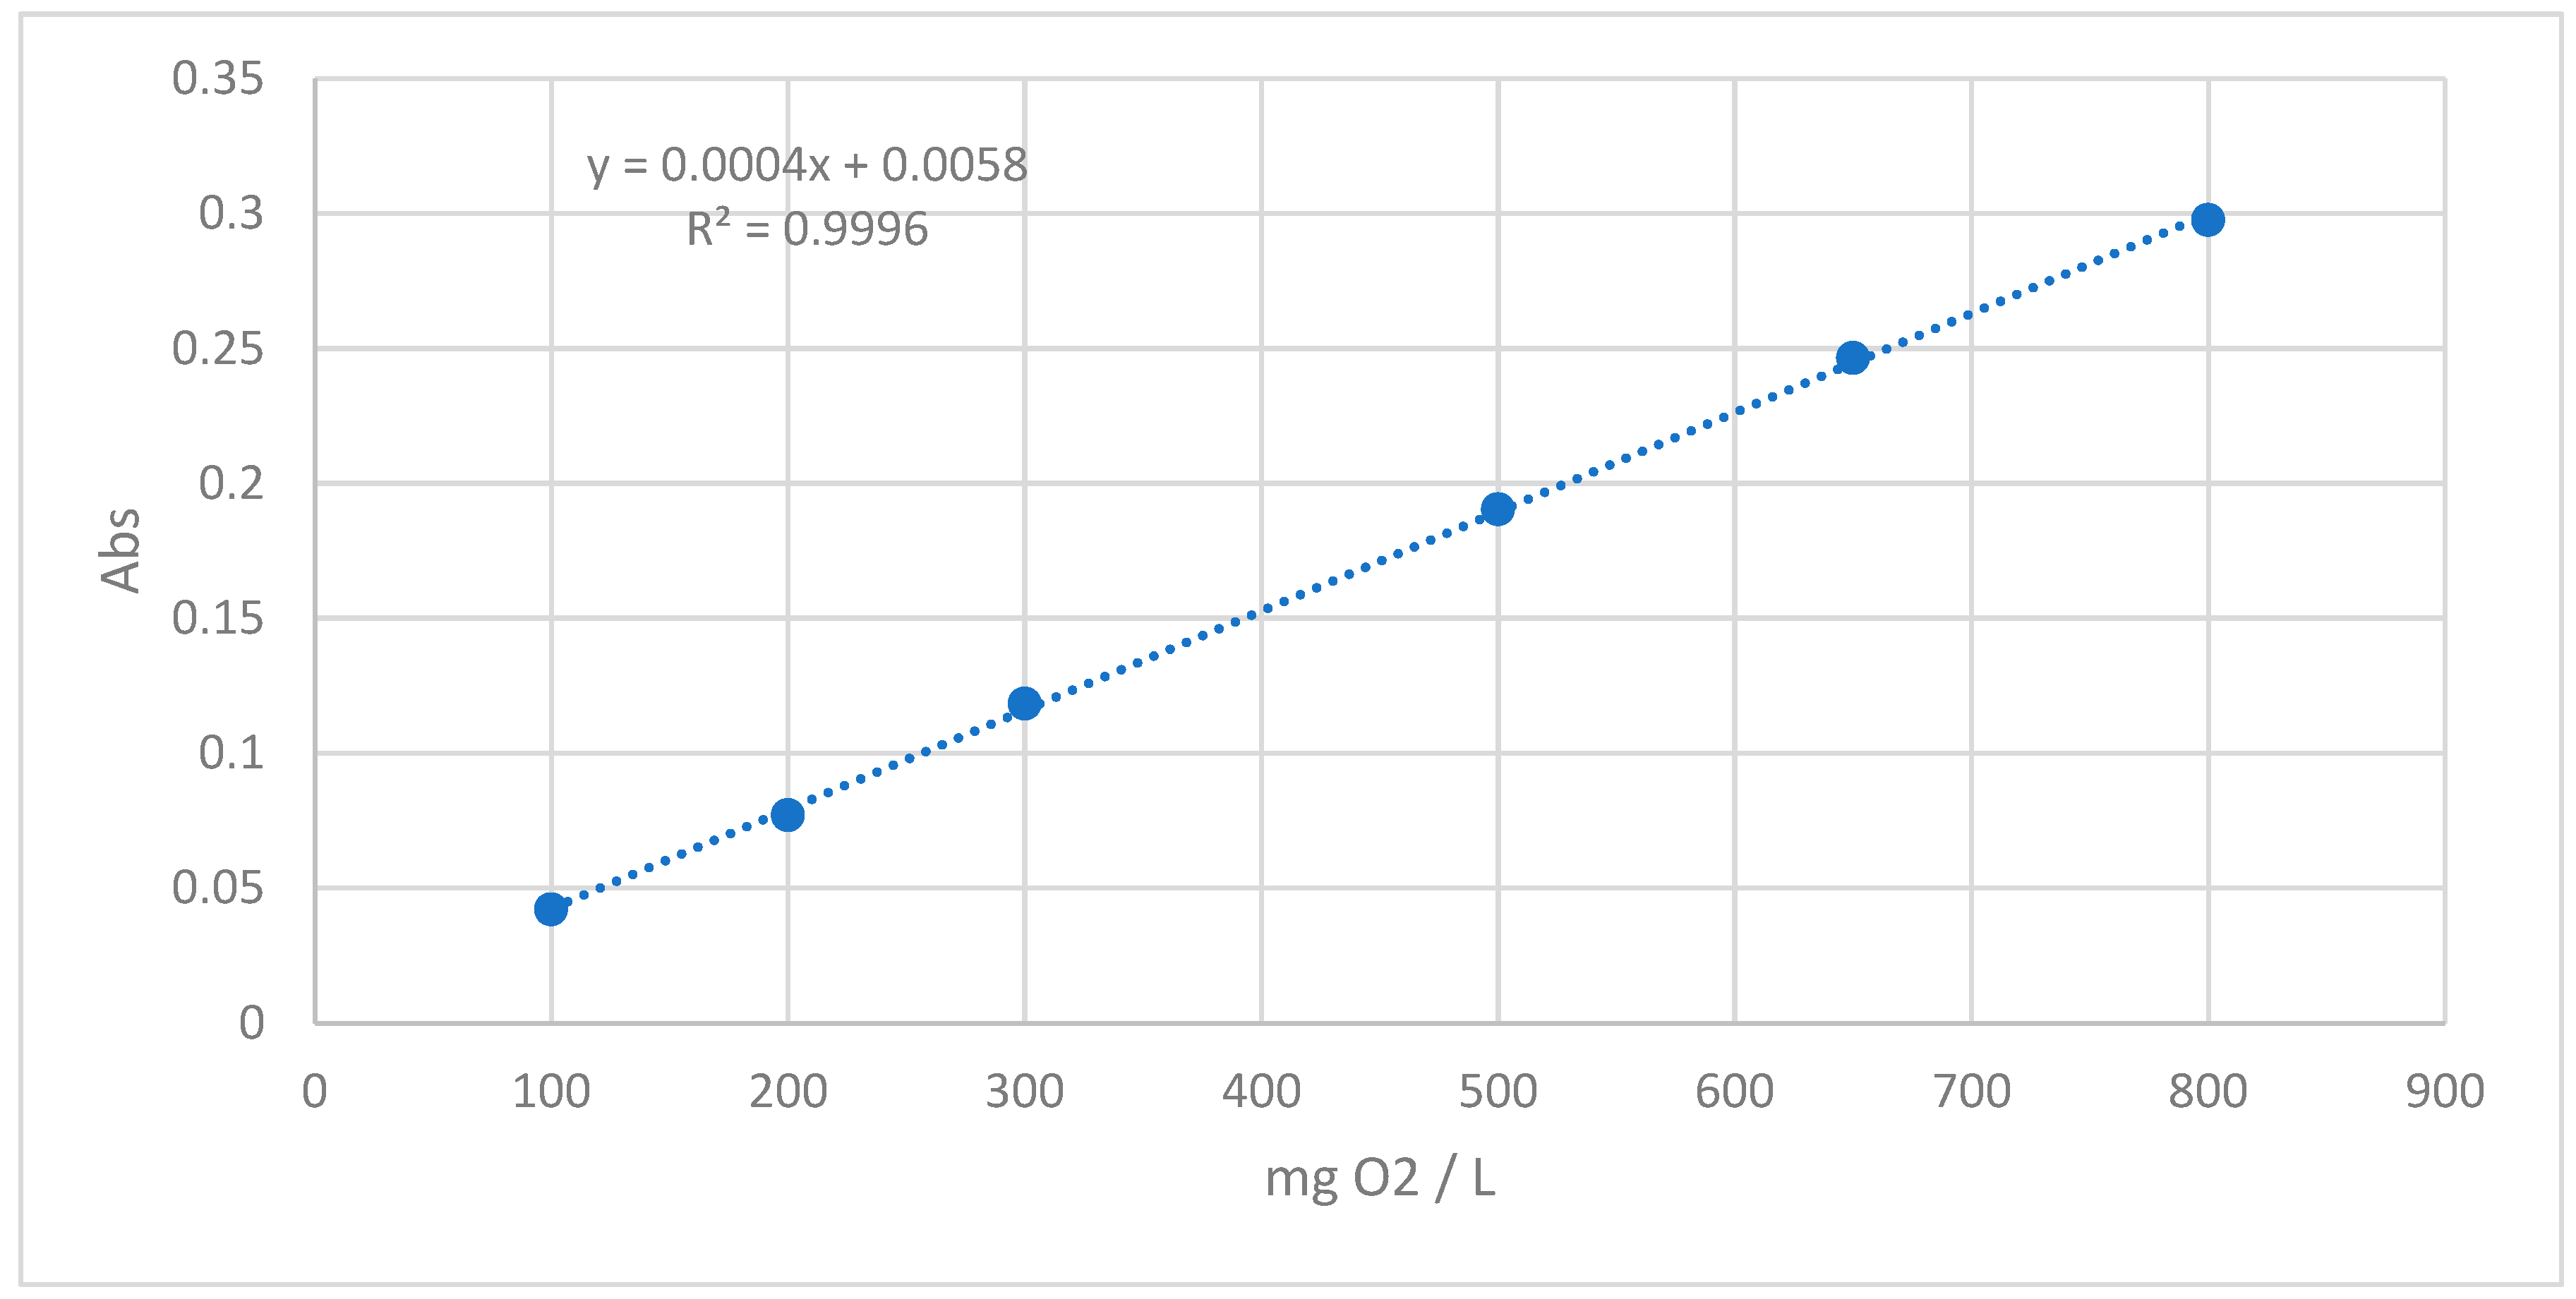
2.7. Chemical Oxygen Demand (COD)

The measurement of chemical oxygen demand (COD) was performed according to the laboratory protocol [32]. First, the digestion reagent and catalyst were prepared. To prepare the digestion reagent, 10.216 g of K2Cr2O7 dried at 105 °C for 2 h was added to 500 mL of dd H2O. Then, 167 mL of H2SO4 and 33.3 g of HgSO4 (II) were added. Finally, after the solution was previously stirred and brought to room temperature, additional H2O was added until the total volume reached 1000 mL. Regarding the preparation of the catalyst, this was performed by adding 2.5 g of AgSO4 to 1 L of H2SO4 and stirring it for 48 h.
The organic compound potassium hydrogen phthalate (KHP), which had previously been placed for drying at 120 °C for 2 h, was used to construct the calibration curve of absorbance versus the concentration of chemically required O2 (mg O2/L) (Appendix A). The reagents needed for the preparation of the chemicals for the measurements were K2Cr2O7 (Merck), H2SO4 96% (Penta Bioscience Products), HgSO4 (II) (lach:ner, Neratovice, Czech Republic), AgSO4 ≥ 99.5% (Sigma Aldrich), potassium hydrogen phthalate 99% (Alfa Aesar, Ward Hill, MA, USA). The devices used for the measurements were a COD Reactor (HACH, Loveland, CO, USA) for the digestion at high temperatures and a SMART3 colorimeter (LaMotte, Chestertown, MD, USA) for the measurement of COD.

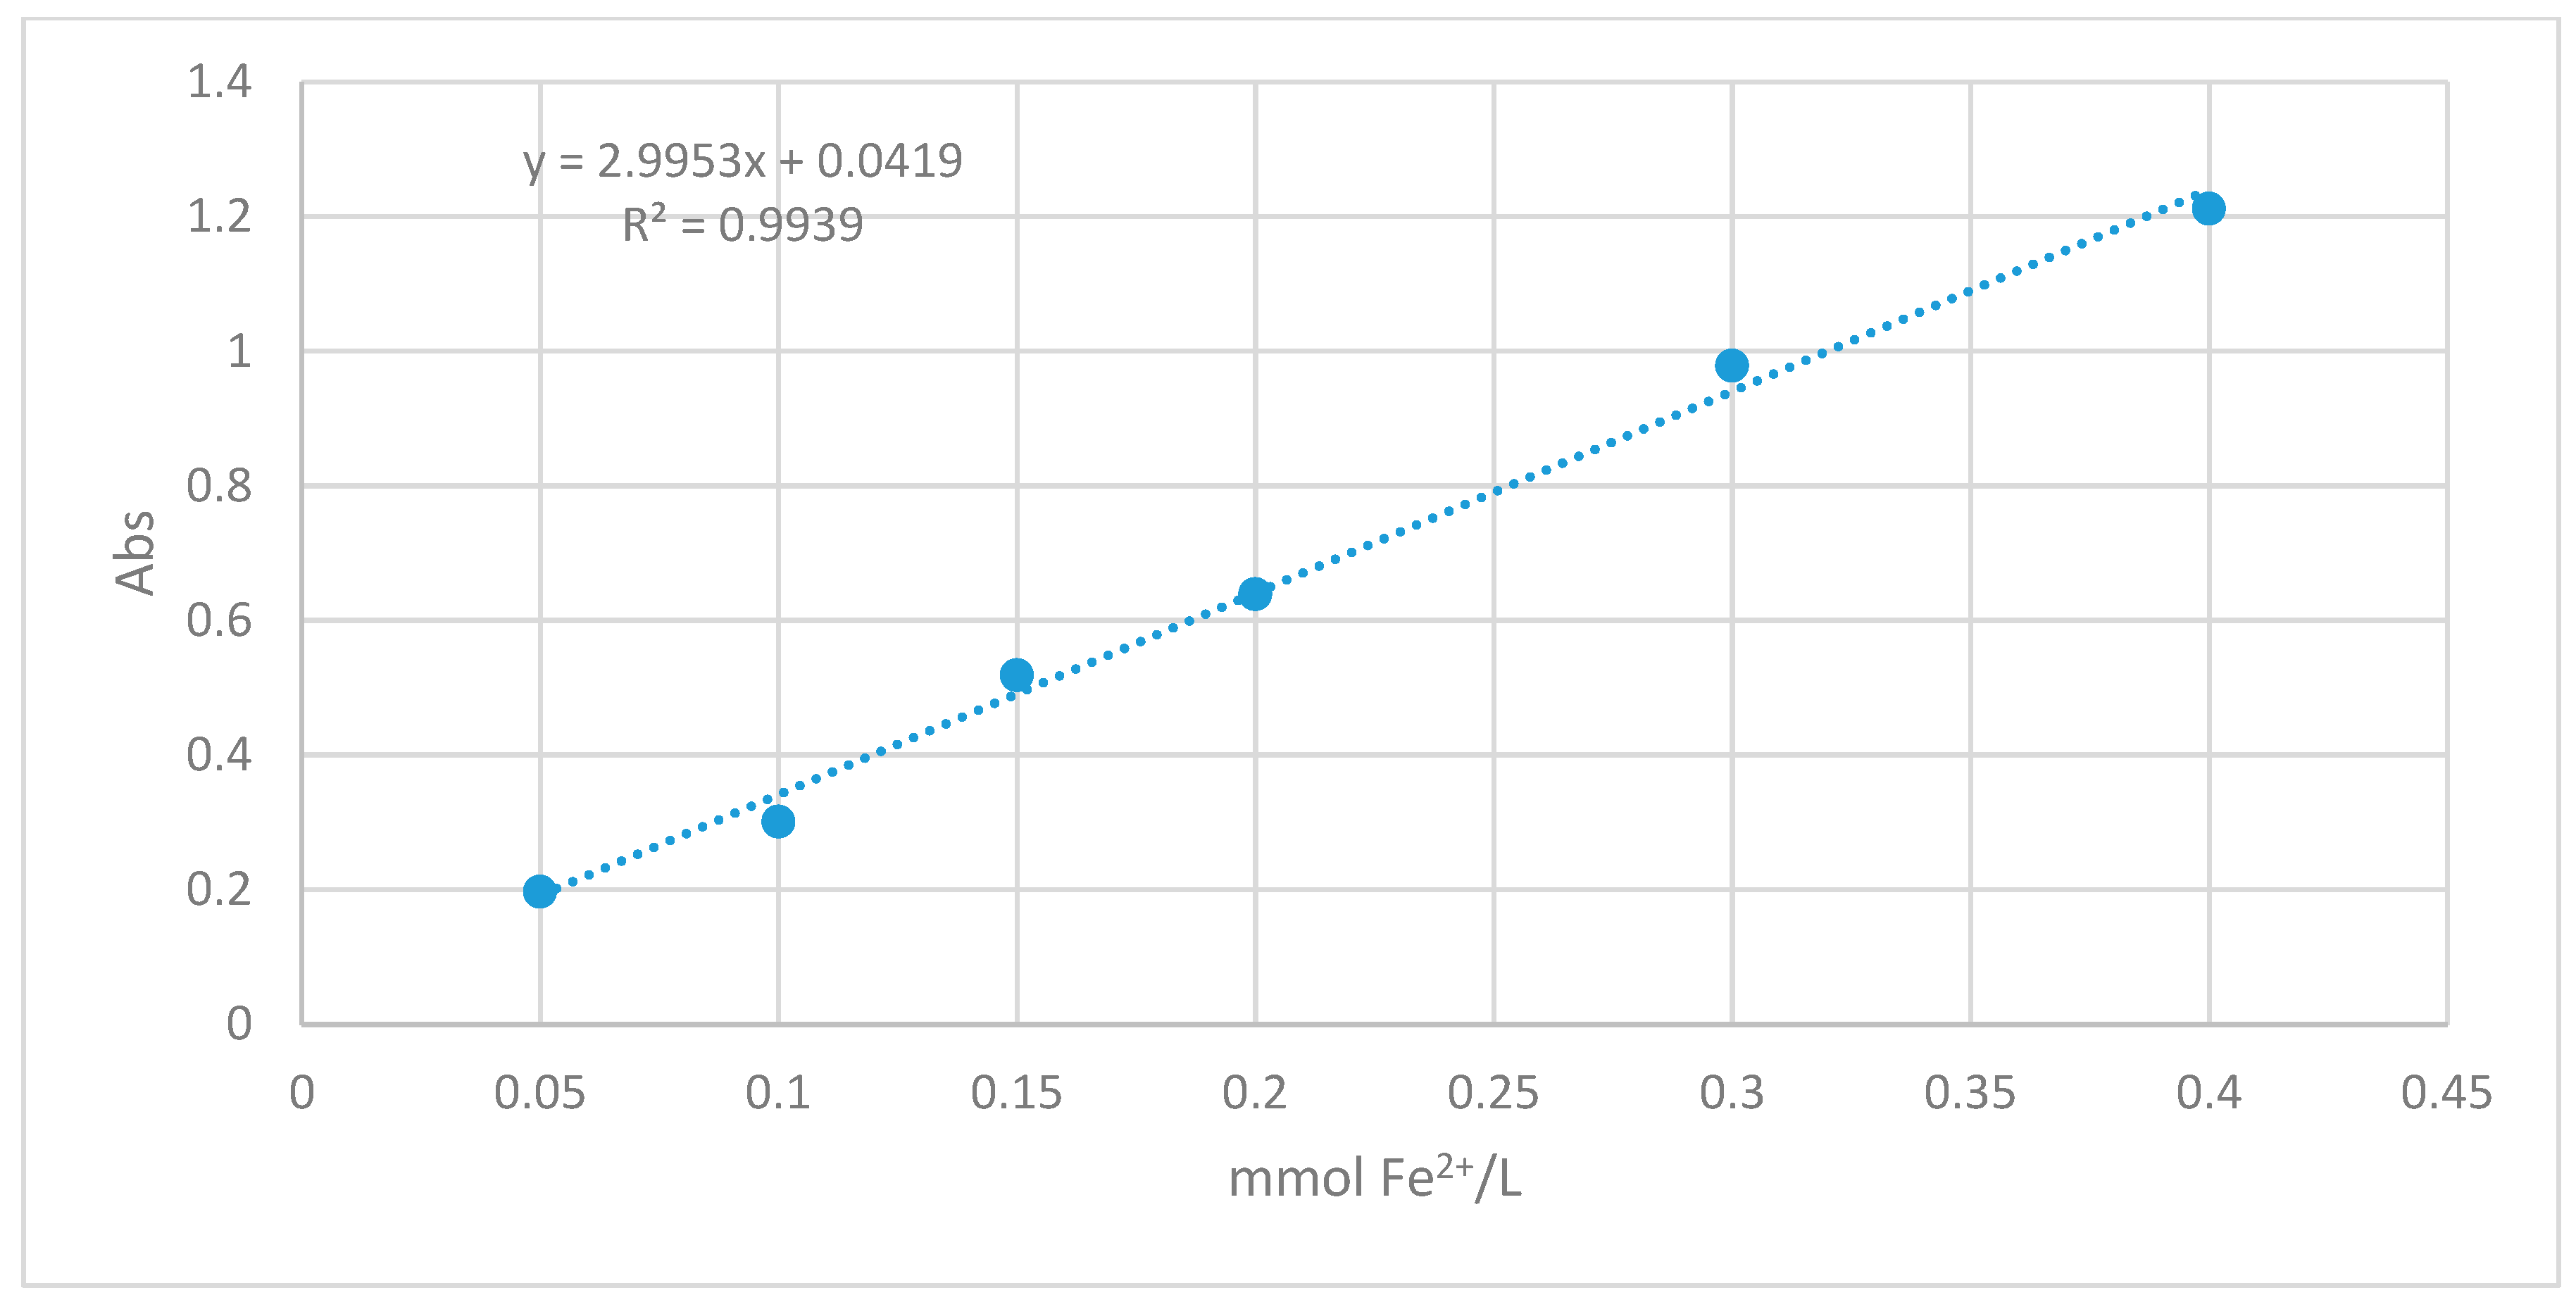
2.8. FRAP Method for the Determination of Antioxidant Capacity of Phenolic Compounds

The total antioxidant activity of some samples was evaluated using the FRAP method, which is based on the ability of compounds with antioxidant properties to reduce [Fe(TPTZ)2]3+ to [Fe(TPTZ)2]2+ [33]. The following reagents were purchased: EtOH absolute >99.5% (Merk), acetic acid (glacial) anhydrous 99.8% (Merk), sodium acetate trihydrate, ACS reagent ≥99% (Sigma Aldrich), 2,4,6-Tris(2-pyridyl)-s-triazine, ≥98% for spectrophotometric det. (TPTZ) (Sigma-Aldrich), iron (III) chloride hexahydrate (FeCl3 × 6H2O) (AppliChem), hydrochloric acid ≥37% (Sigma Aldrich), iron (II) sulfate heptahydrate (FeSO4 × 7H2O) (Sigma Aldrich). Pure water was used for analysis (dd H2O) (Sigma-Aldrich), and an absorbance UV-Vis microplate reader, Sunrise (Tecan Austria), and 96-well Elisa plate were used for the measurements. The required amounts of the solutions for the measurements were prepared as follows: FRAP solution by mixing 300 mM acetate buffer with pH 3.6, 10 mM TPTZ dissolved in 40 mM HCl, and 20 mM FeCl3 × 6H2O in a ratio of 10:1:1; and for the calibration curve of absorbance versus Fe2+ concentration (mmol Fe2+/L or mM Fe2+), the standard solution of 10 mM FeSO4 × 7H2O [34,35]. As the calibration curve (Appendix A) shows linearity between the range of 0.05 and 0.40 mmol Fe2+/L, using the 10 mM FeSO4 × 7H2O standard solution, six FeSO4 × 7H2O solutions of different concentrations and within the linearity range of 0.05–0.40 were prepared using mM Fe2+. All samples were incubated at RT in a dark room for 5 min and measured at 595 nm.

2.9. Qualitative Analysis of Samples Using LC-MS

The qualitative determination of the composition of the final ethanolic extract of the pilot-scale extraction, as well as that of the fractions NF600 retentate, NF300 retentate, and RO retentate that resulted from the separation process using the membranes, was performed in a single quadrupole LC/MS system of LC/MSD 1260 Infinity II (Agilent Technologies, Inc., Santa Clara, CA, USA) equipped with a C18 column, Poroshell 120 EC-C18 (4.6 × 100 mm, 2.7 µm) (Agilent Technologies, Inc.), and 0.45 µm syringe filters. ESI was used as the ion source and nitrogen gas was used for ionization. The solvents (LC-MS grade from Merck) 0.1% formic acid in water (A), methanol (B), and acetonitrile (C) were used in gradient elution under the following conditions: 0–3 min 95% A/5% B, 3–10 min 85% A/15% B, 10–12 min 85% A/15% B, 12–17 min 75% A/15% B/10% C, 17–19 min 75% A/15% B/10% C, 19–29 min 55% A/15% B/30% C, 29–31 min 55% A/15% B/30% C, 31–46 min 0% A/15% B/85% C, 46–47 min 0% A/15% B/85% C, 47–57 min 95% A/5% B, 57–62 min 95% A/5% B. The conditions for the injection volume, flow rate, and mass range were 10 μL, 0.3 mL/min, and 100–1000 m/z, respectively. Before carrying out the analysis of the above samples, their proper preparation was necessary, which is described as follows and applies to all samples: An amount of sample equal to 2 mL was transferred to an Eppendorf tube and centrifuged at 8000 rpm for 10 min, thus forming two phases, sediment and supernatant. A quantity of 1.5 mL of the supernatant was decanted into a different Eppendorf tube and centrifuged under the same conditions. The supernatant resulting from the second centrifugation was completely free of solid particles, a feature that allowed us to proceed with the preparation. Then, 1 mL of the particle-free supernatant was transferred to a new Eppendorf tube and placed in a speed vacuum concentrator to remove the solvent and collect the remaining solid. After determining the mass of the solid, a certain volume of 7% methanol/0.1% formic acid solvent was added so that its concentration was 3.5 mg/mL. The sample was again centrifuged at 8000 rpm for 10 min to exclude the possibility of receiving particles that had not dissolved. Finally, the supernatant liquid was removed with a syringe and filtered through a filter with 0.45 µm pores. The resulting filtrate was used for qualitative LC-MS analysis.

2.10. Statistical Analysis

All measurements, apart from LC-MS, were carried out in quadruplicate. The results are presented as mean values, with their standard deviation as error bars. Finally, statistical analysis of the results was carried out using Student’s t-test, with p-values lower than 0.05 considered to be statistically significant. For the statistical analysis, Microsoft Excel was used.

3. Results and Discussion

3.1. Lab Experiments

At the initial stage of the experimental process, the investigation of the conditions for the extraction of total phenolic compounds (total phenolic content, TPC) from grape marc was carried out to choose an economic method in which the extraction of phenols is favored, while, on the contrary, the extraction of total carbohydrates (TCC) is reduced because they are among the classes of compounds that are extracted in large amounts together with phenols [36]. The investigated parameters were the following: type of solvent, solid–solvent ratio, duration of the extraction, and temperature.

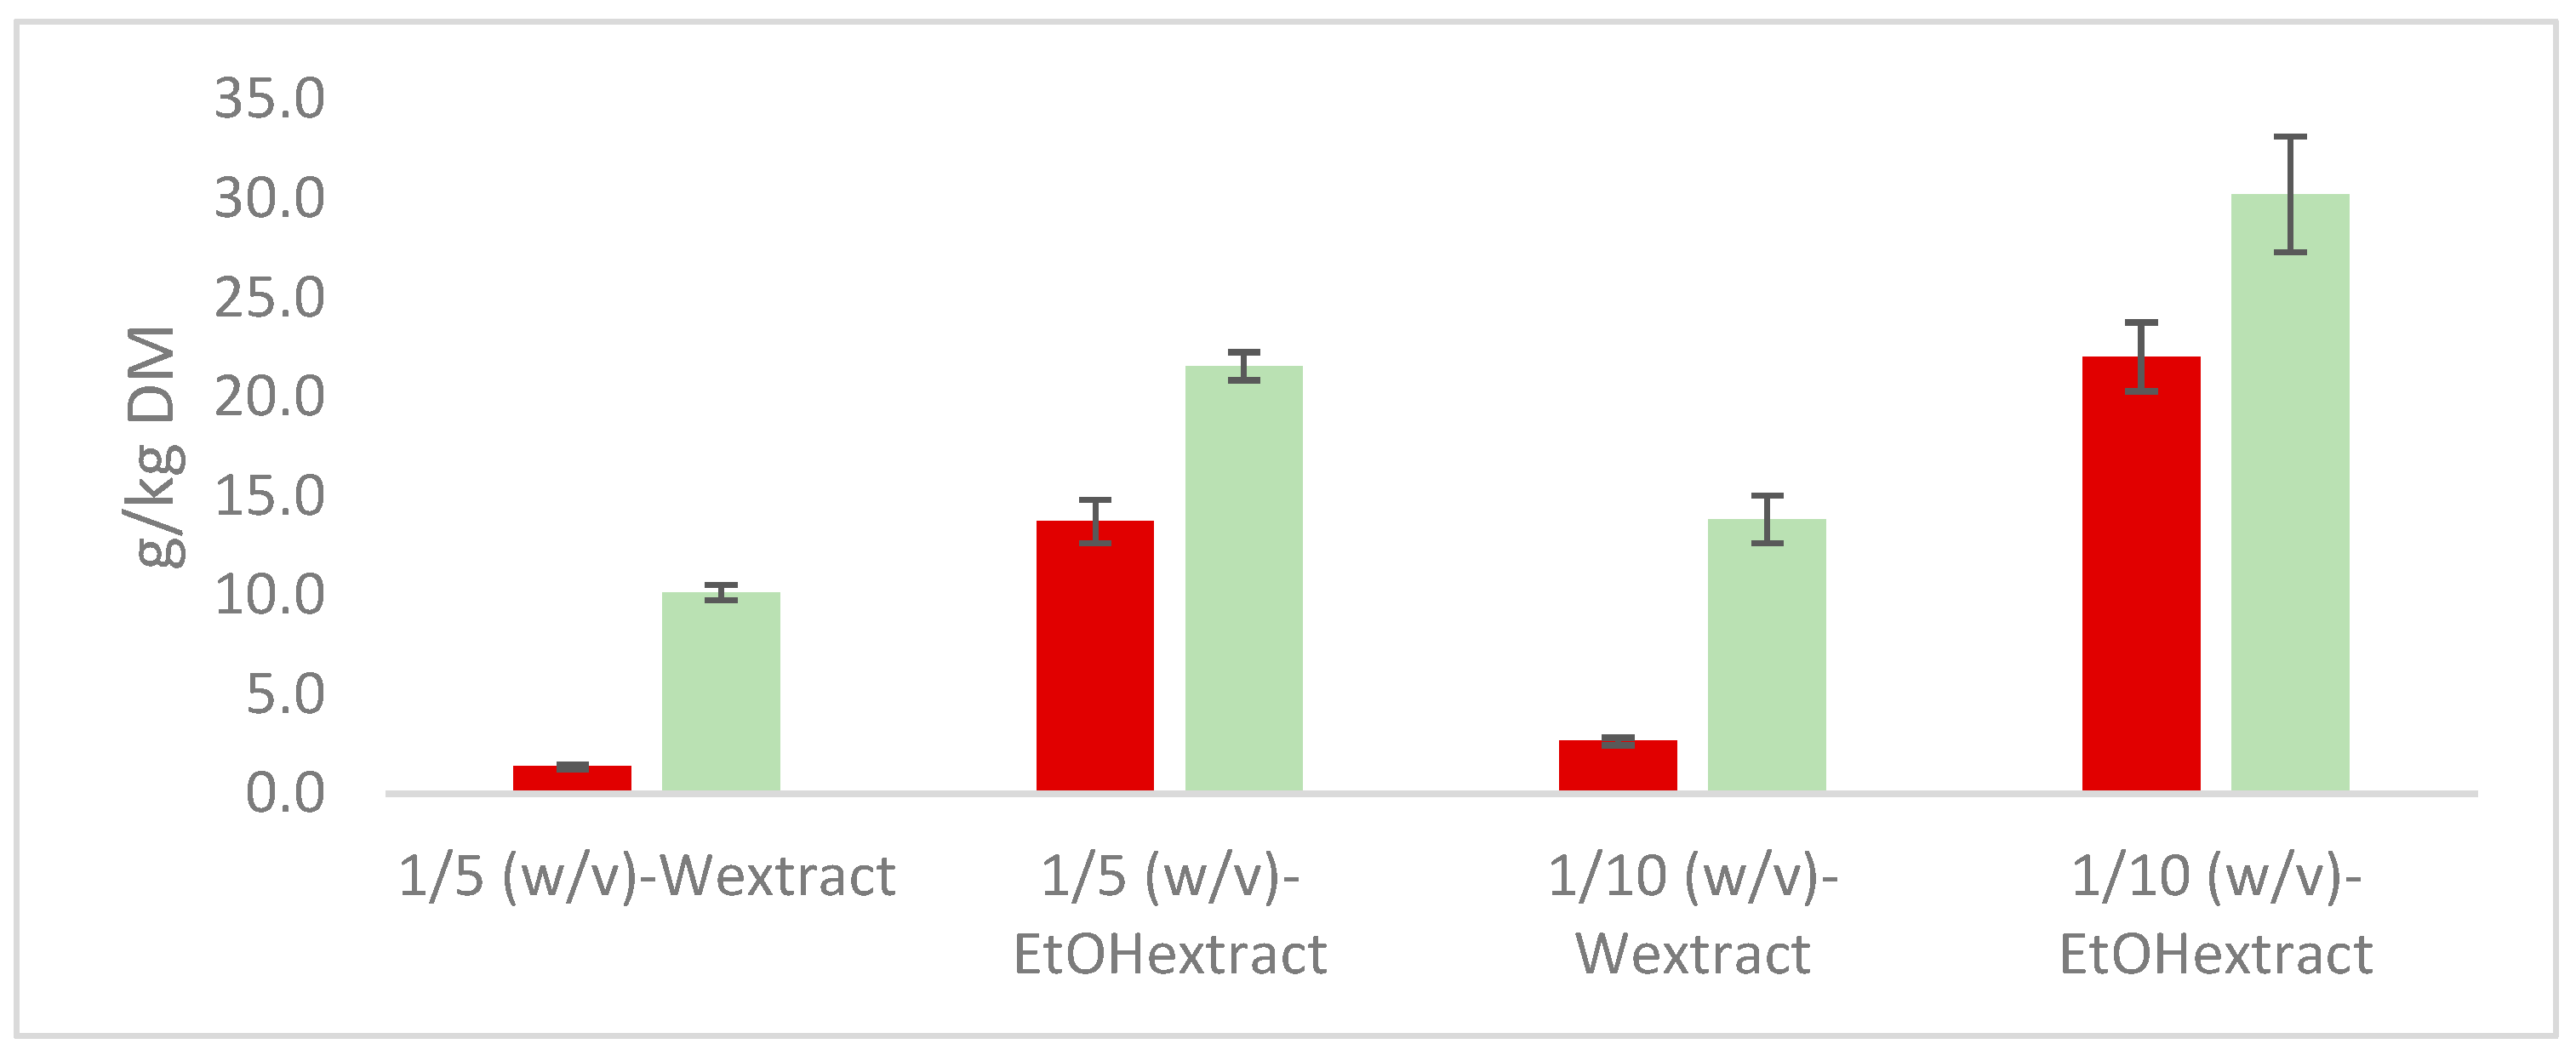
3.2. Effect of Solvent

When extracting a plant raw material to recover phenolic compounds, it is important to use the appropriate solvent that facilitates the efficient extraction of phenolic compounds with the lowest cost. In addition, the solvent should belong to the category of green solvents, i.e., it should be non-toxic for both the human body and the environment [25,26]. Therefore, the solvents used were water, ethanol (EtOH), and the 50% (v/v) hydroethanolic solvent, which can be used in many applications, including in the food and pharmaceutical industries. If the target market is the cosmetic industry, two alternative solvents, such as polyethylene glycol (PEG) and acetone (Acet), and their corresponding aqueous solutions at a rate of 50% (v/v), i.e., 50%, may be used. In addition, the use of acetone can be effective for the extraction of phenolic compounds from grape marc and can be easily removed [24,37].
The extraction of phenolics from grape marc took place with a solid/solvent volume ratio of 1/10 (w/v), for 60 min, at room temperature (RT), and under stirring at 150 rpm. Under these conditions, 30 g of grape marc (raw material of 2019) was used for the extraction of its soluble content, using the respective solvent (300 mL) and with the other parameters remaining constant. The non-recoverable part of the solvent corresponded to 11% for water, 13% for ethanol, 19% for the hydroethanolic mixture, 14% for acetone, 19% for the water–acetone mixture, 15% for ethyl acetate, 37% for the water–ethyl acetate mixture, and 26% for the water–PEG mixture.
In these experiments, the effect displayed by each solvent in terms of its capacity to extract phenolic compounds was studied (Figure 3). The highest total phenolic content (TPC) was obtained using 50% acetone (8.56 ± 0.59 g GA/kg, expressed as g of gallic acid (GA) equivalent per kg dry mass of grape marc), followed by ethanol 50% (6.46 ± 0.31 g/kg DM, which also agrees with the experiments of Rodrigues et al. [37]) and polyethylene glycol (PEG) 50%, with values of 6.46 ± 0.31 g/kg DM and 4.03 ± 0.28 g GA/kg DM, respectively. The lowest TPC values were obtained during the extractions using 100% ethyl acetate (0.161 ± 0.02 g GA/kg DM), 50% ethyl acetate (0.62 ± 0.08 g GA/kg DM), and water with 0.71 ± 0.24 g GA/kg DM. Although the use of the acetone–water co-solvent resulted in the highest extractability of 8.56 ± 0.59 g GA/kg DM, the 100% acetone solvent gave a much lower extractability of 0.74 ± 0.07 g/kg DM, as proven by Rodrigues et al. [37]. The use of pure ethanol showed an intermediate TPC extraction yield (1.73 g GA/kg DM), the value of which is quite low compared to that of 50% ethanol extraction. In conclusion, as shown in Figure 3, the maximum TPC recovery values were obtained from the extractions in which a solvent system of organic solvent and water was used in a ratio of 50:50. Therefore, the use of water in the extractions is deemed imperative.
As discussed above (Figure 3), the use of organic solvents without the presence of water showed a low efficiency in the extraction of phenolic compounds and this difference can also be observed by the color of each extract. This fact is typically observed in the literature [38], as the addition of water seems to make the solvent more suitable for the extraction of phenolic compounds. A special case is the ethanol extract, which is green, characteristic of the high presence of chlorophyll; Figure 4.

3.3. Effect of Solid/Solvent Ratio (w/v)

At this point, it is important to mention that, in all experiments presented in this section, grape marc of the 2019 harvesting period was used. The solid/solvent (w/v) ratio, i.e., the volume of solvent to be used in the solid/liquid extraction process, significantly affects (p-value was lower than 0.05) the extractability of TPCs (Figure 5), as well as the recovered volume of the extract. In addition, it significantly determines the cost of the overall process, as an increasing amount of solvent, in the case of an organic solvent, proportionally increases the cost at the industrial scale, and therefore solid/solvent ratios higher than 1/10 (w/v) were not tested. The solid/liquid ratio (w/v) in experiments using a 50% ethanol–water solvent system (ethanolic extraction) and those using water (aqueous extraction) were examined separately. In both cases, the ratios examined were 1/5 and 1/10 (w/v), while parameters such as extraction duration, temperature, and stirring rate remained constant for all extraction experiments at 60 min, RT, and 150 rpm, respectively.
The effect of the solid/solvent volume ratio was examined in extractions with water (W-extract), as well as in extractions using an ethanol–water co-solvent (EtOH-extract). Regarding studies of the effect of w/v ratio on water extractions, recovery of TPC and TCC at a 1/5 w/v ratio was 1.36 ± 0.12 g GA/kg DM and 10.15 ± 0.39 g GLU/kg DM, respectively. At a ratio of 1/10 w/v, the extraction of TPC increased compared to the use of the ratio of 1/5 by 93.40% and that of TCC by 36.33%, with these values amounting to 2.64 ± 0.19 g GA/kg DM for TPC and 13.83 ± 1.22 g GLU/kg DM for TCC. During ethanol extractions (EtOH-extract), TPC and TCC recoveries were higher than those obtained from water extractions. At a ratio of 1/5 (w/v), TPC extraction reached 13.72 ± 1.08 g GA/kg DM and TCS extraction reached 21.54 ± 0.71 g GLU/kg DM. Increasing the solvent to a ratio of 1/10 (w/v) resulted in enhanced extraction of TPC to 22.01 ± 1.74 g GA/kg DM and that of TCC to 30.21 ± 2.92 g GLU/kg DM, with the increase rate being 60.40% for TPC and 40.65% for TCC. Furthermore, the extractions at a ratio equal to 1/5 (w/v) resulted in a 36–48% loss of the final extract volume, due to absorption by the solid, while, in the case of the solid/liquid ratio equal to 1/10 (w/v), this loss was 22–25%.
According to Table 3 below, the highest TCC/TPC ratio occurred from the extraction with water and a solid-to-liquid ratio value equal to 1/5 (w/v), where TCC was 7.4 times higher than TPC. For the best isolation of phenolics, and in the subsequent steps for the enrichment of phenolic samples, it is especially important to obtain a high ratio of TCC/TPC from the initial extraction step. On the contrary, the lowest values were observed from the extraction conducted using 50% ethanol at a solid/liquid ratio equal to 1/10 (w/v), where the TPC recovered was approximately similar to the TCC (ratio of 1.3). The target not only yielded the highest values of TPC but the lowest ratio of TPC/TCC in order to isolate high-purity phenols. The isolation of carbohydrates from fruit extractions is always a difficult task and efforts to reduce the carbohydrates should be a decisive step when organizing methods for optimum phenolic recovery.

3.4. Effect of Extraction Time

To determine the effect of time (duration of extraction) on the extractability of both TPC and TCC, in experiments where water was used as the extraction medium, time intervals of 10, 30, and 60 min were used. All three of these extraction time intervals were applied at solid/solvent ratios equal to 1/5 and 1/10 (w/v), while, for all experiments, the type of solvent, temperature, and stirring speed of the extraction remained constant.
Focusing on the effect of extraction time on the aqueous extraction process, according to Figure 6, a consistency in the extraction of TPC and TCC at the same solid/solvent ratio (w/v) may be noticed. Thus, the three different time intervals of 10, 30, and 60 min in which the two groups of extractions were made, at a solid/solvent ratio equal to 1/5 (w/v) and 1/10 (w/v), gave similar TPC values to those of the experiments of the same group. As can be seen in Figure 6, the maximum values of TPC and TCC at a solid/solvent ratio equal to 1/5 (w/v) were found in the aqueous extractions of 10 min, with values of 1.36–1.44 g GA/kg DM and 10.14–10.56 g GLU/kg DM, respectively. During the extractions at a solid/solvent ratio equal to 1/10 (w/v), the maximum value for TPC was 2.51–2.64 g GA/kg DM, which occurred during the extraction of 60 min, while the maximum for TCC at 30 min was 12.95–14.61 g GLU/kg DM.
Between these two groups, i.e., the extractions at solid/solvent ratios equal to 1/5 (w/v) and 1/10 (w/v), an increase in the extraction of both TPC and TCC occurred at the ratio equal to 1/10 (w/v). This increase was not of the same magnitude for TPC and TCC; specifically, from the first group to the second, the extraction of TPC increased by 85%, while the extraction of TCC increased by 31%. This explains the reduction in the TCC/TPC ratio from 7.4 for the 1/5 (w/v) extractions to 5.3 for the 1/10 (w/v) ratio; Table 4. The measured volume losses of the extracts in these two extraction groups were 36.7% for the group at a ratio of 1/5 (w/v) and 22% for the group at a ratio of 1/5 (w/v). Overall, the effect of extraction duration did not exhibit p-values lower than 0.05, except for the TCC measurement of the extraction with a 1/10 (w/v) solid-to-solvent ratio and durations of 10 and 30 min.

3.5. Effect of Temperature

The effect of temperature on solid–liquid extractions, using DM of grape marc and water as the extraction solvent, was determined by performing extractions at temperatures of 10 °C, 25 °C, 40 °C, 50 °C, and 65 °C (Figure 7). In all experiments, the other parameters, i.e., the extraction solvent, the solid/solvent ratio (w/v), and the extraction stirring speed, were kept constant. The device in which the extractions were carried out consisted of a commercial borosilicate double-walled vessel, a thermostatic cooling/heating bath (Grant Instruments™ Cambridgeshire, United Kingdom, TC120 Series Digital Heated Circulating Bath), two tubes, and a thermometer.
Temperature plays a significant role in TPC and TCC extraction, i.e., an increase in temperature results in increased content extraction from grape marc. The study was carried out at various temperatures in the range of 10–65 °C. Temperatures above 65 °C were not tested because, according to the literature, a decrease in the capacity and decomposition of polyphenolic compounds may be observed [24], as well as increased energy cost.
TPC showed an increasing trend from 25 °C to 65 °C due to the increase in the solubility of these compounds and the increase in the diffusion coefficient [24]. In the case of TPC, the results seem to be correlated with the extraction temperature, as the p-values of the comparison between the different temperatures examined were lower than 0.05, except for the case of the comparison of 50 °C and 65 °C (p-value = 0.076). On the other hand, the extraction of carbohydrates stabilized below 2% at temperatures up to 40 °C, and at higher temperatures it increased. Regarding the statistical analysis of the TCC measurements, only the extraction performed at 65 °C exhibited significant differences from the rest of the extraction conditions. In general, the percentage increase in carbohydrates did not exceed that of phenols at any transition stage from one temperature to another. This relation between TPC and TCC may be attributed to the low extractability of TPC at low temperatures. The extractability of TCC at low temperatures was not affected to the extent that TPC was affected, so the concentration of these compounds in the extract was high.
This significant effect of temperature is also reflected in the relative TCC/TPC ratios in Table 5, according to which, at low temperatures, the TCC/TPC ratio was between 9.5 and 9.2, i.e., a high presence of TCC and low presence of TPC. The increase in temperature, however, resulted in an increase in phenols, a phenomenon that was also responsible for the relative decrease in the TCC/TPC ratio to 6.1 at 40 °C, 4.5 at 50 °C, and, finally, 4.0 at 65 °C.

3.6. Sequential Extractions

Considering the results of previous parametric research, the effect of successive extractions of the same raw material was investigated, as well as the possibility of enriching the ethanolic extract by using it for the extraction of phenols from an additional amount of raw material. Thus, the effects of adding a new solid to the same solvent (a process in which the extract is enriched) and the combination of extractions, initially with water and then with 50% ethanol, were studied. The goal of this type of extraction was the removal of carbohydrates at the first stage through aqueous extraction and the isolation of an ethanolic extract with an improved TCC/TPC ratio. When investigating the enrichment of the extract, the raw material was initially extracted at a solid/solvent ratio of 1/10 (w/v), during which 30 g of grape marc was extracted with 300 mL EtOH 50% v/v, for 60 min, at ambient temperature, and under 150 rpm of stirring (the first extract is named I-ethanol in tables and figures). Then, the pure ethanolic extract was obtained by removing the solids from the mixture. An amount of solid was then added again in 225 mL of the ethanolic extract (reduction in extract from 300 to 225 mL due to adsorption by the removed solid) at a ratio of 1/10 w/v (22.5 g of grape marc) and re-extraction was carried out (second extract named II-ethanol). At the end of the extraction, the solid was removed, while the extract (II-ethanol) was used for a third extraction of 18 g of grape marc (decrease in extract to 180 mL) under the same extraction conditions. After the third extraction, the extract (third extract named III-ethanol) with a volume of 131 mL was obtained. TPC and TCC were measured in all three extracts. Based on these results, the extraction of grape marc was carried out at a pilot scale.
During the parametric study for the enrichment of the ethanolic extract, the aim was to investigate the ability of a certain amount of solvent to extract the phenolic components of the grape marc after three consecutive additions of solid. The aim of this study was to minimize the use of ethanol. The main results can be observed in Figure 8.
The successive use of the same solvent for the extraction of three batches of fresh grape marc resulted in the enrichment of the solvent in the extracted phenols (Figure 8a). On the other hand, when the results were analyzed according to the efficiency of each individual extraction step, the successive extraction steps slightly diminished the quantity of phenols extracted from the grape marc, as expected, due to the increased concentration of the extracted compounds in the bulk of the solvent. Furthermore, the decrease in the amount (g/kg DM) of TPC and TCC recovered after each extraction (Figure 8b) was mainly due to the loss of the extract due to solid absorption. Finally, applying the technique of successive extractions and first extracting the solid with water favored the removal of carbohydrates, resulting in higher purities of extracted phenols in the next stages of the process, when ethanol was used for the extraction (Figure 8c).

3.7. Pilot Plant Extraction Experiments

Considering the results obtained from the previous parametric studies, those conditions that favored the extractability of total phenolics while reducing the extraction of carbohydrates were applied to the pilot-scale extraction. Enrichment of the extract by adding extra solid was also applied to increase the TPC in a certain volume of ethanolic extract.
Using the above-mentioned process, the extraction was carried out at a pilot scale. The total extract obtained after the three-step ethanol extraction was 18 L. In the aqueous extract (called I-water) obtained during the first stage of extraction, the concentration of TCC amounted to 3.32 ± 0.50 g GLU/L, while that of TPC was only 0.24 ± 0.04 g GA/L. The ethanolic extraction carried out during the second stage gave the ethanolic extract that showed a high concentration in TPC (2.17 ± 0.03 g GA/L), reaching approximately the concentration of TCC of 2.28 ± 0.02 g GLU/L (a ratio of approximately 50/50). Further addition of solid to the ethanol extract to enrich it in TPC led to the acquisition of the ethanolic II-ethanol extract, with the concentration of TPC amounting to 2.65 ± 0.16 g GA/L and that of TCC amounting to 3.12 ± 0.20 g GLU/L, a percentage increase of 22.1% and 36.8%, respectively. Because of the above increase in TCC relative to the increase in TPC, the percentage ratio between them shifted slightly toward TCC, to be 45/55 (Figure 9).
As shown in Table 6, the aqueous extraction that preceded the ethanolic extractions resulted in the removal of 78.02 ± 11.75 g of TCC from the DM grape marc. Notably, the TCC/TPC ratio in this extract (I-water) was equal to 14, i.e., the extractability of TPC was noticeably smaller than that of TCC. In the I-ethanol extract, the significant effect of the 50% EtOH solvent on the extraction of phenolic compounds appeared with a recovery mass of 52.08 ± 0.72 g, which corresponded to an increase of >900% in extracted TPC compared to the aqueous extraction. Finally, the third stage of extraction resulting in the II-ethanol extract consisted of 47.70 ± 2.88 g of TPC and 56.16 ± 3.60 g of TCC, with the corresponding percentage of g of TPC being reduced by 8.4%, while that of TCC increased by 2.6%.
This decrease in the amount of the recovered TPC was attributed to the loss in the extract volume (from 24 L to 18 L) due to the amount that remained adsorbed on the solid, the collection of which was impossible with the existing facilities, and to the filtration processes through sieves.
After quantitative determination of the antioxidant activity with the FRAP assay in the I-water, I-ethanol, and II-ethanol extracts, the ethanolic II-ethanol extract presented the highest value of 30.78 ± 0.42 mmol Fe2+/L. The aqueous I-water extract showed a significantly lower antioxidant power compared to the ethanolic extracts with a concentration equal to 0.13 ± 0.04 mmol Fe2+/L. Finally, the I-ethanol extract showed a high antioxidant power (21.11 ± 0.39 mmol Fe2+/L), but this was lower than that of the II-ethanol ethanolic extract by 46%; Table 7.

3.8. Membrane Filtration of Extracted Samples in a Membrane Array

On further processing of the 18 L of ethanolic extract through pilot-scale membranes, the extract was diluted to 127 L to reduce the concentration of ethanol and facilitate the use of the large-scale equipment. The quantity of 127 L was the volume of the UF feed stream (UF initial). Quantities of 29 L of UF retentate, 20 L of NF600 retentate, and 15 L of NF300 retentate were collected. Moreover, 10 L of RO retentate and 64 L of RO permeate were obtained. Some discrepancies in the volume balance of the process were attributed to the water retention in the piping system of the pilot-scale equipment, as well as the volume loss during ethanol transport and evaporation.
The scheme for the array of UF, NF600, NF300, and RO membranes, together with the mass balance before and after each membrane module, is given in Figure 10.
In all feeds and effluents from each membrane, samples were collected and measurements for their phenolic, carbohydrate, and total organic contents in terms of COD were performed. In previous works [27,28,29], it was noticed that the final effluent is pure water, which is appropriate for irrigation, while the UF retentate contains a large amount of fats and lipids, which can be mixed with other biomass that is available nearby (pulverized pruning, vineyards, olive leaves, animal manure) to obtain a good quality of compost. The concentrated stream of NF600 contains both polyphenols and small-size phenols, which can be further treated with other techniques such as adsorption in specific resins [39] to enrich the specific fractions in terms of phenolic components. NF300 and RO retentates contained mainly sugars, phenolics such as (+)-catechin and (−)-epicatechin, metabolites such as (epi)catechin sulfate, low-molecular-weight procyanidins B2 and C2, and the amino acids L-phenylalanine and L-tryptophan.

3.8.1. TPC and TCC Measurements in UF Fractions

During the first stage of the filtration process and using a UF ultrafiltration membrane, it was necessary to add water to the ethanol extract to obtain a minimum total volume of 120 L. This led, as expected, to the dilution of TPC and TCC concentrations from 2.65 ± 0.16 to 0.34 ± 0.02 g GA/L for the former and from 3.12 ± 0.20 to 0.37 ± 0.02 g GLU/L for the latter in UF (as seen in Table 6 and Table 8). Considering the masses of TPC and TCC in the ethanol extract (47.70 ± 2.88 g TPC, 56.16 ± 3.6 g TCC) and in the initial UF (43.18 ± 2.54 g TPC, 46.99 ± 2.54 g TCC), mass loss was observed due to the volume loss during transfusion and/or a decrease in their solubility from 50% ethanol solvent to 7% ethanol.
The resulting UF permeate fraction showed similar concentrations of TPC and TCC as those of the UF feed; this was also reasonable as the pore size of the UF membrane (MWCO 100 nm) was not able to prevent the passage of these molecules. On the other hand, the UF retentate fraction showed a slight increase in TPC and TCC concentrations as it was the concentrate of the complete process; Table 8.

3.8.2. TPC and TCC Measurements in NF600 Fractions

During the second filtration step, in which the NF600 nanofiltration membrane with a MWCO of 600 Da was used, the NF600 feed stream consisted of 0.24 ± 0.05 g GA/L and 0.33 ± 0.04 g GLU/L for TPC and TCC, respectively. These values were lower than the corresponding values in UF permeate due to the extra amount of water added from the overall setup. Regarding the masses of the TPC and TCC contained in the original NF600, they amounted to 24.72 ± 5.15 g and 33.99 ± 4.12 g, respectively (Table 9).

3.8.3. TPC and TCC Measurements in NF Fractions

Comparing the total masses in the fractions of UF permeate and NF600 feed, reductions of 5.6 g in TPC and 3.2 g in TCC were observed. The NF600 retentate fraction that emerged after this process consisted of a high concentration of TPC (0.82 ± 0.09 g GA/L), which increased by four times, while the concentration of TCC increased by two times, reaching a value of 0.70 ± 0.04 g GLU/L. The retention of phenolic compounds led to a significant improvement in the TCC/TPC ratio from 1.4 to 0.85. In addition, this increase in the concentration of TPC in the NF600 retentate fraction was due to the low ability of these compounds to pass through the pores of the specific membrane, meaning that these compounds were composed of molecular weights around 600 g/mol and above; thus, this fraction was rich in proacyanidins, which was also confirmed using LC-MS. Unfortunately, due to the high concentration of TPC obtained and the low content of organic solvent, the solubility of these compounds decreased to such an extent that particles were formed and deposited on the surface of the membrane, affecting further processing and various measurements. Therefore, the measured TPC g GA/L concentration in the NF600 retentate fraction was considerably lower than the actual concentration. In the NF600 permeate fraction, it was not possible to measure TPC and TCC concentrations because they were too low. Finally, the phenomenon that took place and was described before significantly affected the mass balances of TPC and TCC, as shown in Table 9.
Apart from the NF300 retentate and RO retentate streams, the fractions obtained after filtration through the NF300 (MWCO, 300 Da) and RO membranes were too diluted to allow measurement of TPC or TCC. In both fractions, the contents of TPC and TCC were quite low. This was because, first, two membranes preceded the filtration and most of the compounds had been retained in the respective concentrates; and, second, because of the phenomenon created during the NF600 membrane process, which prevented, to some extent, the complete process of filtration. In the NF300 retentate fraction, the concentration of TPC amounted to 0.09 ± 0.03 g GA/L and that of TCC was 0.27 ± 0.04 g GLU/L, with corresponding masses of 1.35 ± 0.45 g and 4.05 ± 0.60 g. The RO retentate fraction contained approximately 25% of the corresponding TPC and TCC, with a TPC concentration of 0.02 ± 0.01 g GA/L, a TCC concentration of 0.08 ± 0.01 g GLU/L, and corresponding masses of 0.20 ± 0.10 g and 0.80 ± 0.10 g. The TCC/TPC ratio in NF300 retentate was ~3, while, in the fraction RO retentate, it was 4.0, indicating the greater presence of TCC in relation to TPC. Finally, comparing the ratios of these two fractions, NF300 retentate and RO retentate, with those of the previous fractions and the NF600 retentate fraction, it can be concluded that most of the TPC remained in the concentrate of NF600 retentate, while most of the TCC remained in the fractions NF300 retentate and RO retentate; Table 10.

3.8.4. FRAP—Antioxidant Activity

Table 11 summarizes the measured antioxidant activity values of the II-ethanol, UF initial, NF600 retentate, NF300 retentate, and RO retentate extracts. The maximum value was found in the II-ethanol ethanolic extract (30.78 ± 0.42 mmol Fe2+/L) as it showed the highest concentration of TPC. In the initial UF, the value of the antioxidant power amounted to 2.09 ± 0.04 mmol Fe2+/L due to the dilution of the ethanolic extract from 18 L to 127 L. Concerning the remaining fractions, as expected, the one with the highest antioxidant power was the NF600 retentate fraction, where it was 4.36 ± 0.32 mmol Fe2+/L, indicating the high presence of antioxidant compounds, which corresponded to the increased concentration in TPC (0.82 ± 0.09 g GA/L). The remaining fractions, NF300 retentate and RO retentate, showed low antioxidant power, with values of 0.47 ± 0.03 and 0.18 ± 0.03 mmol Fe2+/L, respectively.
An image from all fractions collected in the pilot plant series of experiments is shown in Figure 11. Most of the permeate fractions were almost transparent, while retentate streams were colored because of the organic content.

3.8.5. COD Measurements in Membrane Fractions

The treatment of the raw material to recover the phenolic compounds led to the removal of a large part of COD from it (Table 12). Extraction of the DM of grape marc with water yielded 12.93 ± 7.44 g O2/L COD with a corresponding COD mass of 303.9 ± 174.84 g O2, while the II-ethanol extract diluted to 127 L to be used as the feed stream (UF feed) showed a COD concentration equal to 29.33 ± 0.41 g O2/L and a mass of 3725.33 ± 52.42 g O2. The further treatment of the initial UF led to the reduction in the COD, after which the RO membrane also received a filtrate showing 1/3 of the original COD content. Therefore, the RO permeate filtrate can be reused for other extractions and, in this way, solvent can be saved. Finally, due to the reduction in the organic load in the raw material, the environmental burden would be reduced if it was deposited for biodegradation.

3.8.6. Qualitative Analysis of Samples

The total ion chromatograms of the negative (−MS) and positive (+MS) ionization of the II-ethanol extract from pilot plant extraction consisted of several peaks, with that of (−MS) containing the most. The time interval (retention time, Rt) during which the main peaks corresponding to compounds of the sample appeared was from 7 min to 37 min, while the peaks appearing before 7 min and after 38 min also appeared in the analyses of the blank samples and were not considered in the identification of the compounds. Many compounds were found, most of which were dimeric and trimeric procyanidin isomers, as well as compounds of the flavan-3-ol class such as (+)-catechin and (−)-epicatechin (Appendix B), with the last two showing the greatest intensity in the chromatograms; Figure 12. In addition, two amino acids, L-phenylalanine and L-tryptophan, were identified.
The NF600 retentate fraction showed an equally large number of compounds as in the II-ethanol extract. The use of the NF600 membrane led to the acquisition of a fraction consisting mainly of large-molecular-weight (MW) and high-concentration compounds. The main compounds found in the specific fraction are isomers of procyanidin dimers and flavan-3-ols (Appendix B), while the number of isomers of trimeric procyanidin is limited due to their reduced solubility and/or complexation with other compounds.
The NF300 retentate fraction), as well as the RO retentate fraction (Figure 13), contained a significantly lower number of compounds compared to the previous samples, as well as lower intensity peaks. No procyanidins were found in these samples, even though they consisted of low-molecular-weight compounds. The main compounds found in these samples concerned compounds of the category of amino acids, L-phenylalanine, and L-tryptophan, as well as flavan-3-ols and their metabolites such as (epi)catechin-sulfate (Appendix B). These metabolites were not found in the chromatograms of the ethanolic extract and the NF600 retentate fraction but in the chromatograms of NF300 retentate and RO retentate because, in the first two, their concentration was low and overlapped by the rest of the compounds, while, in the NF300 retentate and RO retentate samples, these compounds were concentrated to such an extent that their determination was possible.

4. Conclusions

The phenolic compounds contained in grape marc of the Merlot variety were successfully extracted using various green solvents and for various parameter values (type of solvent, solid/liquid ratio, duration of the temperature, and sequences of extraction with the same solvent). The best extraction results were those obtained when mixtures of acetone 50%–water, 50% PEG–50% water, and 50% EtOH–50% water were used. The solvent must contain both an organic and water phase because they affect the extraction of both hydrophobic (phenols) and hydrophilic (sugars) compounds. Water can first remove the soluble carbohydrates, and then ethanol can invade the grain structure and extract the phenolic compounds. In the series of laboratory experiments, a parametric study was conducted. Among the tested solid–liquid ratios, the ratio of 1:10 yielded better results in terms of extracted soluble compounds. The optimum duration of the extraction was 60 min and continuous stirring was needed to obtain all the soluble compounds. The temperature played a key role in the rate and the amount of the extracted phenolics; however, one should consider the cost of the energy at elevated temperature values.
The differences in results between 65 °C and ambient temperature were small; thus, the experiments were continued at ambient temperature values. When the extracted solution was used as a solvent to re-extract phenols and carbohydrates for a second and third round, the recovery was enhanced in the second round and less enhanced in the third iteration. The experiments in the pilot plant using the pilot membrane equipment confirmed the laboratory experiments and showed that a configuration of UF–NF600–NF300–RO membranes could help the molecular sieving of organic compounds, while, in each retentate, different compounds and types of phenol could be isolated. The NF600 membrane concentrated most of the phenolic compounds included in the original by-product and NF300 recovered the phenolics that “escaped” from the NF600. The COD value of the final effluent in the permeate stream in RO was lower than one-third of that of the feed solution.
Finally, the qualitative analysis of both the II/ethanol extract and the main fractions from membranes confirmed the presence of phenolic compounds and, in particular, the presence of a significant quantity of procyanidins and flavan-3-ols in the ethanolic extract, as well as in the NF600 retentate fraction, giving it a high antioxidant capacity. The remaining fractions mainly consisted of low-molecular-mass phenols, while their content of total phenolic compounds was much lower than that of the fraction, and most of the carbohydrates remained in them.

Author Contributions

Conceptualization, C.A.P. and F.N.L.; methodology, V.S. and A.D.Z.; validation, D.P.Z., M.P.K. and N.K.; investigation, A.D.Z. and N.K.; resources, C.A.P. and F.N.L.; data curation, A.D.Z. and N.K.; writing—original draft preparation, A.D.Z.; writing—review and editing, D.P.Z., V.S., F.N.L. and C.A.P.; supervision, F.N.L. and C.A.P.; project administration, V.S.; funding acquisition, C.A.P. All authors have read and agreed to the published version of the manuscript.

Funding

This research was funded by the Project “PPP_Phenolics” (code 03828), which is implemented under the Action “2nd Call for H.F.R.I. Research Projects to support Faculty Members and Researchers” funded by Hellenic Foundation for Research and Innovation.

Institutional Review Board Statement

Not applicable.

Informed Consent Statement

Not applicable.

Data Availability Statement

Data is contained within the article, in Section 3 Results and Discussion.

Conflicts of Interest

The authors declare no conflict of interest.

Appendix A

Figure A1. Calibration curve used for the measurement of chemical oxygen demand via the closed reflux colorimetric method.
Sustainability 15 12221 g0a1
Figure A2. Calibration curve used for the measurement of total carbohydrates via the L-tryptophan method.
Sustainability 15 12221 g0a2
Figure A3. Calibration curve used for the measurement of total phenols via the Folin–Ciocalteu method.
Sustainability 15 12221 g0a3
Figure A4. Calibration curve used for the measurement of antioxidant activity via the FRAP method.
Sustainability 15 12221 g0a4

Appendix B

Table A1. Identification of the main compounds of Merlot grape marc II-ethanol extract (EEX) and fractions of membrane separation, NF600 retentate (NF6), NF300 retentate (NF3), and RO retentate (RO) using a single quadrupole LC/MS system.
No.Rt (min)TentativeM.WMolecular FormulaPositive Ionization m/zNegative Ionization m/zReferenceFraction
17.4Unknown258-259 [M + H]+
101 [M + H + 2Na]3+
141 [M + H + Na]2+
257 [M-H]
279 [M + Na-2H]
295 [M + K-2H]
-EEX, NF6, NF3
210.8Gallic acid170.12C7H6O5-169 [M-H]
339 [2M-H]
125 [M-CO2-H]
[40,41,42]EEX, NF6
313.9(epi)catechin sulfate370.3C15H14O9S-369 [M-H]
391 [M + Na-2H]
[42]NF3, RO
414.8L-phenylalanine165.19C9H11NO2166 [M + H]+
120 [M + H-CO-H2O]+
164 [M-H][43]EEX, NF6, NF3, RO
518.9(epi)catechin sulfate370.3C15H14O9S-369 [M-H]
391 [M + Na-2H]
[42]NF3, RO
619.6Procyanidin B3578.52C30H26O12-577 [M-H]
599 [M + Na-2H]
[40,41,44]EEX
720.4Procyanidin B1578.52C30H26O12579 [M + H]+
601 [M + Na]+
309 [M + H + K]2+
577 [M-H]
599 [M + Na-2H]
[40,41,44]EEX, NF6
821.0Procyanidin trimer B type isomer 2866.74C45H38O18867 [M + H]+
889 [M + Na]+
453 [M + H + K]2+
865 [M-H]
887 [M + Na-2H]
[40,41,44]EEX, NF6
921.6L-tryptophan204.23C11H12N2O2205 [M + H]+
227 [M + Na]+
188 [M + H-NH3]+
203 [M-H]
407 [2M-H]
[43]EEX, NF6, NF3, RO
1022.4Procyanidin trimer B type isomer 3866.74C45H38O18-865 [M-H]
887 [M + Na-2H]
[40,41,44]EEX
1122.8(+)-catechin290.26C15H14O6291 [M + H]+
313 [M + Na]+
289 [M-H]
579 [2M-H]
[40,41,44]EEX, NF6, NF3, RO
1223.6Procyanidin B2578.52C30H26O12579 [M + H]+
601 [M + Na]+
309 [M + H + K]2+
577 [M-H]
599 [M + Na-2H]
[40,41,44]EEX, NF6
1324.2Procyanidin trimer B type isomer 4866.74C45H38O18-865 [M-H]
887 [M + Na-2H]
[40,41,44]EEX
1425.4Procyanidin trimer B type isomer 5866.74C45H38O18867 [M + H]+865 [M-H]
887 [M + Na-2H]
[40,41,44]EEX
1526.1(−)-epicatechin290.26C15H14O6291 [M + H]+
313 [M + Na]+
603 [2M + Na]+
289 [M-H]
579 [2M-H]
325 [M-Cl]
[40,41,44]EEX, NF6
1627.0Unknown358-359 [M + H]+357 [M-H]
315 [M-CHCOH-H]
-EEX, NFX
1727.2Procyanidin B2 3,3-di-O-gallate882.73C44H34O20905 [M + Na]+881 [M-H]
903 [M + Na-2H]
[40,41]EEX, NF6
1828.3Myricetin-3-O-glucoside480.4C21H20O13481 [M + H]+
563 [M + 2ACN + H]+
-[40,42]EEX
1928.3Unknown540-563 [M + Na]+
290 [M + H + K]2+
539 [M-H]
585 [M + FA-H]
-EEX. NF6
2028.6Procyanidin trimer B type isomer 6866.74C45H38O18-865 [M-H]
887 [M + Na-2H]
[41,44]EEX
2129.2(epi)catechin-3-O-gallate442.4C22H18O10-441 [M-H]
463 [M + Na-2H]
[40,41,44]EEX
2229.4Procyanidin B5578.5C30H26O12579 [M + H]+
309 [M + H + K]+
331 [M + 2ACN + 2H]+
601 [M + Na]+
577 [M-H]
599 [M + Na-2H]
[41]EEX
2330.6Delphinidin 3-O hexuronide479.08C21H19O13+479 [M]+
501 [M + Na]+
303 (fragment)
259 [M + H + K]2+
477 [M-H]
499 [M + Na-2H]
955 [2M-H]2−
523 [M + FA-H]
[44]EEX, NF6
Quercetin 3-O galactoside464.38C21H20O12547 [M + 2ACN + H]+463 [M-H]
301 (fragment)
[40,41,44]NF6
2431.4Procyanidin B2 3,3-di-O-gallate882.73C44H34O20883 [M + H]+
905 [M + Na]+
881 [M-H]
439 [M-2H]
[41]EEX
2535.1Unknown566-303 [M + H + K]2+
589 [M + Na]+
565 [M-H]
611 [M + FA-H]
679 [M + TFA-H]
-EEX, NF6

References

  1. Anal, A.K.; Panesar, P.S. Valorization of Agro-Industrial Byproducts: Sustainable Approaches for Industrial Transformation; CRC Press: Boca Raton, FL, USA, 2022; ISBN 1000632121. [Google Scholar]
  2. Zagklis, D.P.; Paraskeva, C.A. Membrane Filtration of Agro-Industrial Wastewaters and Isolation of Organic Compounds with High Added Values. Water Sci. Technol. 2014, 69, 202–207. [Google Scholar] [CrossRef] [PubMed]
  3. Tapia-Quirós, P.; Montenegro-Landívar, M.F.; Reig, M.; Vecino, X.; Cortina, J.L.; Saurina, J.; Granados, M. Recovery of Polyphenols from Agri-Food by-Products: The Olive Oil and Winery Industries Cases. Foods 2022, 11, 362. [Google Scholar] [CrossRef]
  4. Mekki, A.; Dhouib, A.; Sayadi, S. Polyphenols Dynamics and Phytotoxicity in a Soil Amended by Olive Mill Wastewaters. J. Environ. Manag. 2007, 84, 134–140. [Google Scholar] [CrossRef] [PubMed]
  5. Morton, L.W.; Caccetta, R.A.; Puddey, I.B.; Croft, K.D. Chemistry and Biological Effects of Dietary Phenolic Compounds: Relevance to Cardiovascular Disease. Clin. Exp. Pharmacol. Physiol. 2000, 27, 152–159. [Google Scholar] [CrossRef] [PubMed]
  6. Hogervorst, J.C.; Miljić, U.; Puškaš, V. Extraction of Bioactive Compounds from Grape Processing By-Products. In Handbook of Grape Processing By-Products; Elsevier: Amsterdam, The Netherlands, 2017; pp. 105–135. [Google Scholar]
  7. Troilo, M.; Difonzo, G.; Paradiso, V.M.; Summo, C.; Caponio, F. Bioactive Compounds from Vine Shoots, Grape Stalks, and Wine Lees: Their Potential Use in Agro-Food Chains. Foods 2021, 10, 342. [Google Scholar] [CrossRef] [PubMed]
  8. Sirohi, R.; Tarafdar, A.; Singh, S.; Negi, T.; Gaur, V.K.; Gnansounou, E.; Bharathiraja, B. Green Processing and Biotechnological Potential of Grape Pomace: Current Trends and Opportunities for Sustainable Biorefinery. Bioresour. Technol. 2020, 314, 123771. [Google Scholar] [CrossRef]
  9. Jackson, R.S. Grapevine Structure and Function. Wine Sci. 2008, 50–107. [Google Scholar]
  10. Pan, Z.; Zhang, R.; Zicari, S. Integrated Processing Technologies for Food and Agricultural By-Products; Academic Press: Cambridge, MA, USA, 2019; ISBN 0128141395. [Google Scholar]
  11. Jordão, A.M.; Ricardo-da-Silva, J.M.; Laureano, O. Evolution of Proanthocyanidins in Bunch Stems during Berry Development (Vitis vinifera L.). Vitis-Geilweilerhof- 2001, 40, 17–22. [Google Scholar]
  12. García-Lomillo, J.; González-SanJosé, M.L. Applications of Wine Pomace in the Food Industry: Approaches and Functions. Compr. Rev. Food Sci. Food Saf. 2017, 16, 3–22. [Google Scholar] [CrossRef]
  13. Milinčić, D.D.; Stanisavljević, N.S.; Kostić, A.Ž.; Bajić, S.S.; Kojić, M.O.; Gašić, U.M.; Barać, M.B.; Stanojević, S.P.; Tešić, Ž.L.; Pešić, M.B. Phenolic Compounds and Biopotential of Grape Pomace Extracts from Prokupac Red Grape Variety. LWT 2021, 138, 110739. [Google Scholar] [CrossRef]
  14. Ivanova, V.; Stefova, M.; Vojnoski, B.; Dörnyei, Á.; Márk, L.; Dimovska, V.; Stafilov, T.; Kilár, F. Identification of Polyphenolic Compounds in Red and White Grape Varieties Grown in R. Macedonia and Changes of Their Content during Ripening. Food Res. Int. 2011, 44, 2851–2860. [Google Scholar] [CrossRef]
  15. Montealegre, R.R.; Peces, R.R.; Vozmediano, J.L.C.; Gascueña, J.M.; Romero, E.G. Phenolic Compounds in Skins and Seeds of Ten Grape Vitis vinifera Varieties Grown in a Warm Climate. J. Food Compos. Anal. 2006, 19, 687–693. [Google Scholar] [CrossRef]
  16. Goleniowski, M.; Bonfill, M.; Cusido, R.; Palazon, J. Phenolic Acids. Nat. Prod. 2013, 1951–1973. [Google Scholar]
  17. Bocsan, I.C.; Măgureanu, D.C.; Pop, R.M.; Levai, A.M.; Macovei, Ș.O.; Pătrașca, I.M.; Chedea, V.S.; Buzoianu, A.D. Antioxidant and Anti-Inflammatory Actions of Polyphenols from Red and White Grape Pomace in Ischemic Heart Diseases. Biomedicines 2022, 10, 2337. [Google Scholar] [CrossRef] [PubMed]
  18. Durazzo, A.; Lucarini, M.; Souto, E.B.; Cicala, C.; Caiazzo, E.; Izzo, A.A.; Novellino, E.; Santini, A. Polyphenols: A Concise Overview on the Chemistry, Occurrence, and Human Health. Phytother. Res. 2019, 33, 2221–2243. [Google Scholar] [CrossRef] [Green Version]
  19. Averilla, J.N.; Oh, J.; Kim, H.J.; Kim, J.S.; Kim, J.-S. Potential Health Benefits of Phenolic Compounds in Grape Processing By-Products. Food Sci. Biotechnol. 2019, 28, 1607–1615. [Google Scholar] [CrossRef] [PubMed]
  20. Działo, M.; Mierziak, J.; Korzun, U.; Preisner, M.; Szopa, J.; Kulma, A. The Potential of Plant Phenolics in Prevention and Therapy of Skin Disorders. Int. J. Mol. Sci. 2016, 17, 160. [Google Scholar] [CrossRef] [Green Version]
  21. Ferrer-Gallego, R.; Silva, P. The Wine Industry By-Products: Applications for Food Industry and Health Benefits. Antioxidants 2022, 11, 2025. [Google Scholar] [CrossRef]
  22. Miklas, V.; Touš, M.; Miklasová, M.; Máša, V.; Hornák, D. Winery Wastewater Treatment Technologies: Current Trends and Future Perspective. Chem. Eng. Trans. 2022, 94, 847–852. [Google Scholar]
  23. Zagklis, D.P.; Paraskeva, C.A. Purification of Grape Marc Phenolic Compounds through Solvent Extraction, Membrane Filtration and Resin Adsorption/Desorption. Sep. Purif. Technol. 2015, 156, 328–335. [Google Scholar] [CrossRef]
  24. Fontana, A.R.; Antoniolli, A.; Bottini, R. Grape Pomace as a Sustainable Source of Bioactive Compounds: Extraction, Characterization, and Biotechnological Applications of Phenolics. J. Agric. Food Chem. 2013, 61, 8987–9003. [Google Scholar] [CrossRef]
  25. Tobiszewski, M.; Tsakovski, S.; Simeonov, V.; Namieśnik, J.; Pena-Pereira, F. A Solvent Selection Guide Based on Chemometrics and Multicriteria Decision Analysis. Green Chem. 2015, 17, 4773–4785. [Google Scholar] [CrossRef]
  26. Capello, C.; Fischer, U.; Hungerbühler, K. What Is a Green Solvent? A Comprehensive Framework for the Environmental Assessment of Solvents. Green Chem. 2007, 9, 927–934. [Google Scholar] [CrossRef]
  27. Paraskeva, C.A.; Papadakis, V.G.; Tsarouchi, E.; Kanellopoulou, D.G.; Koutsoukos, P.G. Membrane Processing for Olive Mill Wastewater Fractionation. Desalination 2007, 213, 218–229. [Google Scholar] [CrossRef]
  28. Paraskeva, C.A.; Papadakis, V.G.; Kanellopoulou, D.G.; Koutsoukos, P.G.; Angelopoulos, K.C. Membrane Filtration of Olive Mill Wastewater and Exploitation of Its Fractions. Water Environ. Res. 2007, 79, 421–429. [Google Scholar] [CrossRef] [Green Version]
  29. Zagklis, D.P.; Paraskeva, C.A. Isolation of Organic Compounds with High Added Values from Agro-Industrial Solid Wastes. J. Environ. Manag. 2018, 216, 183–191. [Google Scholar] [CrossRef] [PubMed]
  30. Waterman, P.G.; Mole, S. Analysis of Phenolic Plant Metabolites; Blackwell: Oxford, UK, 1994. [Google Scholar]
  31. Joseffson, B. Rapid Spectrophotometric Determination of Total Carbohydrates. Methods Seawater Anal. 1983, 340–342. [Google Scholar]
  32. Clesceri, L.S.; Greenberg, A.E.; Eaton, A.D.; Franson, M.A.H. Standard Methods for the Examination of Water and Wastewater; American Public Health Association: Washington, DC, USA, 1989. [Google Scholar]
  33. Benzie, I.F.F.; Strain, J.J. The Ferric Reducing Ability of Plasma (FRAP) as a Measure of “Antioxidant Power”: The FRAP Assay. Anal. Biochem. 1996, 239, 70–76. [Google Scholar] [CrossRef] [PubMed] [Green Version]
  34. Avgeri, I.; Zeliou, K.; Petropoulos, S.A.; Bebeli, P.J.; Papasotiropoulos, V.; Lamari, F.N. Variability in Bulb Organosulfur Compounds, Sugars, Phenolics, and Pyruvate among Greek Garlic Genotypes: Association with Antioxidant Properties. Antioxidants 2020, 9, 967. [Google Scholar] [CrossRef] [PubMed]
  35. Gkioni, M.D.; Andriopoulos, V.; Koutra, E.; Hatziantoniou, S.; Kornaros, M.; Lamari, F.N. Ultrasound-Assisted Extraction of Nannochloropsis Oculata with Ethanol and Betaine: 1, 2-Propanediol Eutectic Solvent for Antioxidant Pigment-Rich Extracts Retaining Nutritious the Residual Biomass. Antioxidants 2022, 11, 1103. [Google Scholar] [CrossRef]
  36. Arboleda Mejia, J.A.; Ricci, A.; Figueiredo, A.S.; Versari, A.; Cassano, A.; Parpinello, G.P.; De Pinho, M.N. Recovery of Phenolic Compounds from Red Grape Pomace Extract through Nanofiltration Membranes. Foods 2020, 9, 1649. [Google Scholar] [CrossRef]
  37. Rodrigues, R.P.; Sousa, A.M.; Gando-Ferreira, L.M.; Quina, M.J. Grape Pomace as a Natural Source of Phenolic Compounds: Solvent Screening and Extraction Optimization. Molecules 2023, 28, 2715. [Google Scholar] [CrossRef] [PubMed]
  38. Lopes, A.P.; Petenuci, M.E.; Galuch, M.B.; Schneider, V.V.A.; Canesin, E.A.; Visentainer, J.V. Evaluation of Effect of Different Solvent Mixtures on the Phenolic Compound Extraction and Antioxidant Capacity of Bitter Melon (Momordica charantia). Chem. Pap. 2018, 72, 2945–2953. [Google Scholar] [CrossRef]
  39. Salehi, B.; Mishra, A.P.; Nigam, M.; Sener, B.; Kilic, M.; Sharifi-Rad, M.; Fokou, P.V.T.; Martins, N.; Sharifi-Rad, J. Resveratrol: A Double-Edged Sword in Health Benefits. Biomedicines 2018, 6, 91. [Google Scholar] [CrossRef] [PubMed] [Green Version]
  40. Flamini, R. Recent Applications of Mass Spectrometry in the Study of Grape and Wine Polyphenols. Int. Sch. Res. Not. 2013, 2013, 813563. [Google Scholar] [CrossRef] [Green Version]
  41. Rockenbach, I.I.; Jungfer, E.; Ritter, C.; Santiago-Schübel, B.; Thiele, B.; Fett, R.; Galensa, R. Characterization of Flavan-3-Ols in Seeds of Grape Pomace by CE, HPLC-DAD-MSn and LC-ESI-FTICR-MS. Food Res. Int. 2012, 48, 848–855. [Google Scholar] [CrossRef] [Green Version]
  42. Stalmach, A.; Edwards, C.A.; Wightman, J.D.; Crozier, A. Identification of (Poly) Phenolic Compounds in Concord Grape Juice and Their Metabolites in Human Plasma and Urine after Juice Consumption. J. Agric. Food Chem. 2011, 59, 9512–9522. [Google Scholar] [CrossRef]
  43. Zhang, P.; Chan, W.; Ang, I.L.; Wei, R.; Lam, M.M.T.; Lei, K.M.K.; Poon, T.C.W. Revisiting Fragmentation Reactions of Protonated α-Amino Acids by High-Resolution Electrospray Ionization Tandem Mass Spectrometry with Collision-Induced Dissociation. Sci. Rep. 2019, 9, 6453. [Google Scholar] [CrossRef] [Green Version]
  44. Šuković, D.; Knežević, B.; Gašić, U.; Sredojević, M.; Ćirić, I.; Todić, S.; Mutić, J.; Tešić, Ž. Phenolic Profiles of Leaves, Grapes and Wine of Grapevine Variety Vranac (Vitis vinifera L.) from Montenegro. Foods 2020, 9, 138. [Google Scholar] [CrossRef] [Green Version]
Figure 1. Schematic diagram of the pilot plant processes with 3 successive steps of extraction.
Sustainability 15 12221 g001
Figure 2. Membrane process array flow diagram. UF (ultrafiltration)—(A), NF600 (nanofiltration with MWCO 600 Da)—(B), NF300 (nanofiltration with MWCO 300 Da)—(C), RO (reverse osmosis)—(D).
Sustainability 15 12221 g002
Figure 3. Total phenolic content of the extracted solution using various solvents (gallic acid/kg DM). (Conditions: 30 g dried mass of grape marc in 300 mL of solvent; solid/liquid ratio (1/10 w/v); temperature, RT; duration of the extraction, 60 min.).
Sustainability 15 12221 g003
Figure 4. Extraction of grape marc using various solvents: (a) water, 100%; (b) ethanol*, 100%; (c) ethanol, 50% water, 50%; (d) acetone, 100%; (e) acetone, 50%, water, 50%; (f) ethyl acetate, 100%; (g) ethyl acetate, 50%, water, 50%; (h) PEG, 50%, water, 50% (* purity of commercial ethanol: 95%).
Sustainability 15 12221 g004
Figure 5. TPC (red bars) and TCC (green) from the extraction experiments with water and ethanolic solvents for the two tested solid/liquid ratio values.
Sustainability 15 12221 g005
Figure 6. Effect of extraction time duration on isolation of phenolics and sugars. Values of TPC in g GA/kg DM (red) and ΤSC in g GLU/kg DM (green) after extraction of 30 g of dried material in 150 mL water (ratio 1/5) and 300 mL (ratio 1/10).
Sustainability 15 12221 g006
Figure 7. Effect of temperature during the extraction experiments with water. Values of TPC g GA/kg DM (red bars) and TCC g GLU/kg DM (green bars) after the extraction of soluble content from 30 g dried mass of grape marc in 150 mL of water at a solid/solvent ratio of 1/5 (w/v).
Sustainability 15 12221 g007
Figure 8. Concentration of TPC (red) and TCC (green) (a) after three extraction steps, (b) g/kg DM values in each extraction separately, and (c) values after successive extractions with water, EtOH 50%, and EtOH 50%.
Sustainability 15 12221 g008
Figure 9. Values of TPC (g GA/L) (red bars) and TCC (g GLU/L) (green bars) (Left) for the three steps of the pilot plant extraction experiments and their respective percentages (Right).
Sustainability 15 12221 g009
Figure 10. Fractions from the extractions of grape marc in a scheme for membrane filtration and mass balances ((A) UF step, (B) NF600 step, (C) NF300 step, and (D) RO step).
Sustainability 15 12221 g010
Figure 11. Photo of the extracted samples; from left to the right: I-ethanol, II-ethanol, UF feed, UF retentate, UF permeate, NF600 retentate, NF600 permeate, NF300 retentate, NF300 permeate, RO retentate, RO permeate.
Sustainability 15 12221 g011
Figure 12. Total ion chromatogram of Merlot grape marc II-ethanol extract from pilot plant extraction. Blue (top) shows the positive ionization (+MS) chromatogram and green (bottom) shows the negative ionization chromatogram (−MS). Numbers from 1 to 25 indicate the most important peaks, which are analyzed in Appendix B. n.d: not determined.
Sustainability 15 12221 g012
Figure 13. Total ion chromatogram of RO retentate (RO). Blue (top) shows the positive ionization (+MS) chromatogram and green (bottom) shows the negative ionization chromatogram (−MS). Numbers 3–5, 9, and 11 indicate the most important peaks, which are analyzed in Appendix B. n.d: not determined.
Sustainability 15 12221 g013
Table 1. Fields in which grape by-products or their isolated products are used, as well as their respective uses [6,12,13].
Field of ApplicationUse
LivestockAnimal Feed
AgriculturalFertilizers
DistilleryAlcohol and alcoholic beverages
Food IndustryAs functional foods, food supplements, preservatives, increasing the added value of food
PharmaceuticsSupplements, improvement in intestinal flora, cosmetics
GastronomyOils
ColoringPigments
Table 2. Membrane material and geometrical characteristics [23,27,28,29].
Membrane TypeUFNF 600NF 300RO
MaterialCeramic, ZirconiaPolyamidePolyamidePolyamide
ConfigurationTubularSpiral woundSpiral woundSpiral wound
MWCO100 nm600 Dalton300 Dalton-
Active surface, m20.242.42.52.5
Length, cm102 cm101.6101.6101.6
Salt rejection-95% of MgSO498% of MgSO499% of NaCl
Table 3. Values of TPC and TCC per kg of dried material (columns b and c, respectively) and their relevant ratio of TCC/TPC (column d) for different solvents and for different solid/liquid ratio values.
(w/v)
(a)
TPC g/kg DM
(b)
TCC g/kg DM
(c)
Ratio TCC/TPC
(d)
1/5 (w/v)/Wextract1.36 ± 0.12 a10.15 ± 0.39 a7.4
1/10 (w/v)/Wextract2.64 ± 0.19 b13.83 ± 1.22 b5.2
1/5 (w/v)/EtOHextract13.72 ± 1.08 c21.54 ± 0.71 c1.5
1/10 (w/v)/EtOHextract22.01 ± 1.74 d30.21 ± 2.92 d1.3
The means that do not share a letter are significantly different.
Table 4. Values of TPC and TCC per kg of dried material (columns b and c, respectively) and their relevant ratio of TCC/TPC (column d) for different solid to solvent ratios and for different values of extraction duration.
(w/v)
(a)
TPC g GA/kg DM
(b)
TCC g GLU/kg DM
(c)
Ratio TCC/TPC
(d)
1/5 (w/v)—10 min1.44 ± 0.07 a10.56 ± 0.33 a,b7.34
1/5 (w/v)—30 min1.41 ± 0.13 a10.49 ± 0.30 a,b7.40
1/5 (w/v)—60 min1.36 ± 0.11 a10.14 ± 0.39 a,b7.46
1/10 (w/v)—10 min2.51 ± 0.11 a12.95 ± 1.47 a5.16
1/10 (w/v)—30 min2.62 ± 0.18 a14.61 ± 1.06 b5.56
1/10 (w/v)—60 min2.64 ± 0.19 a13.83 ± 1.22 a,b5.24
The means that do not share a letter are significantly different.
Table 5. Values of TPC and TCC and the corresponding ratio values of TCC/TPC at different temperatures.
T (°C)TPC (g GA/kg DM)TCC (g GLU/kg DM)Ratio TCC/TPC
10 °C1.37 ± 0.03 a13.07 ± 0.63 a9.5
25 °C1.44 ± 0.07 b13.30 ± 0.30 a,b,c9.2
40 °C2.21 ± 0.02 c13.56 ± 0.10 b6.1
50 °C3.23 ± 0.35 d14.80 ± 0.69 a,b4.5
65 °C3.80 ± 0.57 d15.47 ± 0.57 c4.0
The means that do not share a letter are significantly different.
Table 6. Values of TPC and ΤCC (g/kg), and TCC/TPC ratios found in extracted solutions, I-water, I-ethanol, and II-ethanol.
TPC g GA/LTPC gTCC g GLU/LTCC gRatio TCC/TPC
I/water0.24 ± 0.04 a5.64 ± 0.94 a3.32 ± 0.50 a78.02 ± 11.75 a14.0
I/ethanol2.17 ± 0.03 b52.08 ± 0.72 b2.28 ± 0.02 b54.72 ± 0.48 b1.0
II/ethanol2.65 ± 0.16 c47.70 ± 2.88 b3.12 ± 0.20 a56.16 ± 3.60 b1.2
The means that do not share a letter are significantly different.
Table 7. Values of the antioxidant activity of the I-water, I-ethanol, and II-ethanol extracted samples in the pilot plant extraction experiments.
I/waterI/ethanolII/ethanol
mmol Fe2+/L0.13 ± 0.04 a21.11 ± 0.39 b30.78 ± 0.42 c
The means that do not share a letter are significantly different.
Table 8. Concentrations of TPC and TCC and their masses in the fractions of UF feed, UF retentate, UF permeate.
Parameter/UnitsUF FeedUF RetentateUF Permeate
TPC g GA/L0.34 ± 0.02 a0.45 ± 0.01 b0.31 ± 0.02 a
TPC g43.18 ± 2.54 a13.05 ± 0.29 b30.38 ± 1.96 c
TCC g GLU/L0.37 ± 0.02 a0.42 ± 0.02 b0.38 ± 0.07 a,b
TCC g46.99 ± 2.54 a12.18 ± 0.58 b37.24 ± 6.86 a
Ratio TCC/TPC1.11.071.2
The means that do not share a letter are significantly different.
Table 9. Concentrations of TPC and TCC and their masses in the fractions NF600 feed, NF600 retentate, NF600 permeate.
NF600 FeedNF600 RetentateNF600 Permeate
TPC g GA/L0.24 ± 0.05 a0.82 ± 0.09 b-
TPC g24.72 ± 5.15 a16.4 ± 1.75 b-
TCC g GLU/L0.33 ± 0.04 a0.70 ± 0.04 b-
TCC g33.99 ± 4.12 a14.09 ± 0.88 b-
Ratio TCC/TPC1.40.85-
The means that do not share a letter are significantly different.
Table 10. Concentration of TPC and TCC and their masses in the fractions NF300 retentate and RO retentate.
NF300 RetentateRO Retentate
TPC g GA/L0.09 ± 0.03 a0.02 ± 0.01 b
TPC g1.35 ± 0.45 a0.20 ± 0.10 b
TCC g GLU/L0.27 ± 0.04 a0.08 ± 0.01 b
TCC g4.05 ± 0.60 a0.80 ± 0.10 b
Ratio TCC/TPC3.04.0
The means that do not share a letter are significantly different.
Table 11. Values of TPC and the antioxidant activity of the II-ethanol, UF feed, NF600 retentate, NF300 retentate, and RO retentate fractions.
II/EthanolUF FeedNF600 RetentateNF300 RetentateRO Retentate
TPC g GA/L2.65 ± 0.16 a0.34 ± 0.02 b0.82 ± 0.09 c0.09 ± 0.03 d0.02 ± 0.01 e
mmol Fe2+/L30.78 ± 0.42 a2.09 ± 0.04 b4.36 ± 0.32 c0.47 ± 0.03 d0.18 ± 0.03 e
The means that do not share a letter are significantly different.
Table 12. Quantification of chemical oxygen demand (COD) in the fractions obtained during the separation process.
g O2/Lg O2
I/water12.93 ± 7.44303.9 ± 174.84
UF feed29.33 ± 0.413725.33 ± 52.42
UF retentate32.36 ± 1.55938.62 ± 44.93
UF permeate28.88 ± 3.022830.71 ± 295.88
NF600 retentate47.51 ± 3.05950.29 ± 61.08
NF600 permeate27.34 ± 3.132269.83 ± 259.98
NF300 retentate16.45 ± 3.36246.72 ± 50.42
NF300 permeate29.72 ± 1.16222.15 ± 87.46
RO retentate25.76 ± 2.95257.65 ± 29.46
RO permeate17.22 ± 4.811102.27 ± 307.89
Disclaimer/Publisher’s Note: The statements, opinions and data contained in all publications are solely those of the individual author(s) and contributor(s) and not of MDPI and/or the editor(s). MDPI and/or the editor(s) disclaim responsibility for any injury to people or property resulting from any ideas, methods, instructions or products referred to in the content.

