Article

Co-Digestion-Based Circular Bio-Economy to Improve Biomethane Generation and Production of Nutrient-Enriched Digestate in Bangladesh

1
Department of Farm Power and Machinery, Bangladesh Agricultural University, Mymensingh 2202, Bangladesh
2
Department of Chemical Engineering, Bangladesh University of Engineering and Technology, Dhaka 1000, Bangladesh
*
Author to whom correspondence should be addressed.
Sustainability 2024, 16(1), 104; https://doi.org/10.3390/su16010104
Submission received: 16 November 2023 / Revised: 19 December 2023 / Accepted: 20 December 2023 / Published: 21 December 2023
(This article belongs to the Special Issue Biogenic Waste: Treatment, Reuse and Recycle)

Abstract

:
Anaerobic co-digestion (ACoD) of cow dung (CD) and maize cob (MC) may be envisaged as the best way to enhance biomethane formation and production of nutrient-enriched fertilizer for the implementation of a circular bio-economic system. The study aimed to find out the optimum ratio for the highest biogas production to produce heat and energy and also the generation of nutrient-enriched organic fertilizer to use in crop land. A batch study was carried out for 99 days in an incubator maintaining 35 ± 1 °C temperature for seven different test groups of CD and MC (100:0, 90:10, 70:30, 50:50, 30:70, 10:90, and 0:100). The highest biogas production (356.6 ± 21.2 mL/gVS) was at 50:50 ratio with 138.05% and 32.02% increments compared to the digestion of CD and MC alone, respectively. Kinetic modeling showed the best fit using a Logistic model to evaluate ACoD of CD and MC mathematically. ACoD of available CD and MC in Bangladesh could produce 716.63 GWh/yr electricity for consumption and a large volume of nitrogen-enriched fertilizer to use in nitrogen-deficit soil. There was no significant difference in nutrient enrichment among different test groups. Awareness about ACoD technology and proper use of digestate might bring this technology to field-level utilization and thus help to implement the circular bio-economic concept through zero waste generation.

Graphical Abstract

1. Introduction

The livestock sector plays a significant role in the development of a country by meeting the demand of nutrients and facilitating improved livelihood [1]. The livestock sector in a developing country like Bangladesh includes animals, namely cow, goat, sheep, buffalo, poultry, etc. [2]. This sector has around 1.85% contribution to the GDP of Bangladesh [3]. Dairy farming among various subsectors of livestock farming in Bangladesh has become a significant source of fulfilling protein demand and reducing poverty [4]. In Bangladesh, the annual production of cows is nearly 29.45 million. On average, dairy farming produces around 12.3 million tons of cow dung annually [5]. Managing such a huge amount of cow dung has become a great concern. Some indigenous cow dung management practices include burning, cleaning material, and insect repellent [6]. Cow dung burning in open stoves causes the emission of greenhouse gases (GHGs), organic substances, and particulate materials [7]. Direct contact of air with cow dung due to open dumping and use as cleaning material or insect repellent causes GHG emission, odor problems, water pollution, and negative impacts on the environment [8,9].
The sustainable and proper management of cow dung is important to ensure a safe and quality environment for animals and plants. Anaerobic digestion is a green energy generation process that facilitates biogas production from cow dung along with quality digestate. Cathy et al. [9], Olaoye et al. [10], Saibur et al. [11], Onwukeme et al. [12], Putri et al. [13], and Ukpai et al. [14] reported cow dung as a suitable substrate for anaerobic digestion to produce bio-energy. However, mono-digestion of cow dung results in lower gas yield due to nutrient imbalance, presence of significant non-biodegradable materials on dairy manure composition, and poor microbial activity [15]. The performance of AD technology largely depends on biogas yield, process stability, degradation rate of organic matter, digestate quality, and proper digestate management [16]. So, anaerobic co-digestion (ACoD) of cow dung with another carbon-enriched substrate may increase biogas yield through nutrient balancing and enhancing microbial activity. ACoD is a technique in which microbial breakdown of two or more substrates occurs simultaneously in the absence of oxygen when substrates are mixed to augment the digestion process and improve gas yield. Co-digestion increases biogas yield and improves the quality of biogas and digestate through nutrient balancing by mixing substrates at an optimum ratio while using different additives [17,18,19,20,21], enhancing the digestion process. It is further observed that co-digestion not only increases biogas yield but also maintains digestate stability [22]. Nowadays, researchers are focusing on ACoD due to its superiority [23,24,25]. Several studies showed that anaerobic co-digestion of cow dung with fruit waste [26], waste leaf [27], elephant grass [28], food waste [29], lignocellulosic crop residue [30], and aquatic waste [31], respectively, enhanced biogas and methane yield. Lignocellulosic crop residues contain a higher percentage of carbon; on the other hand, cow dung contains a higher percentage of nitrogen, so anaerobic co-digestion of these two wastes may be best suited for nutrient balancing and enhancing biogas yield from cow dung. Major crop production in Bangladesh includes rice, wheat, maize, jute, sugarcane, pulse, and vegetables [32], which causes the production of lignocellulosic residues like rice straw, wheat straw, maize cob, etc. Rice straw and wheat straw can be used as animal feed and animal bedding, but open dumping and burning of maize cob is a common practice in Bangladesh. Every year, vast amounts of lignocellulosic waste like maize cob are produced during maize cultivation in developing countries like Bangladesh. Around 4.26 million metric tons of maize was produced in Bangladesh [2], which results in 0.92 million ton of maize cob waste. Maize cob is a hard and less biodegradable lignocellulosic waste that has lower contribution as soil amendments [33] and burning it for cooking causes GHG emissions. This high-carbon-contained maize cob can be used as a co-substrate during manure digestion [34]. Increased volume of biogas from anaerobic co-digestion of cow dung and maize cob can be used for lighting, heating, and cooking, and upgraded biogas can also be injected into the national gas grid. Digestate slurry produced from co-digestion can also be utilized as nutrient-enriched soil amendments, which will indirectly help in increasing crop yield, and a solid portion of digestate can be used for animal bedding. Multiple uses of bio-energy and digestate from anaerobic co-digestion for living beings’ welfare and environment will transform the linear system of the waste managing system into a circular bio-economic system. Circular bio-economy is a system of material recovery in which waste from one production system is used as input material for another system [35]. So, ACoD of CD and MC can promote circular bio-economy by using waste from agricultural production systems as the input material for bio-energy production systems and fulfill sustainable development goal 7 (Affordable and Clean Energy). Abdoli et al. [36] and Adebayo et al. [37] reported that co-digestion of maize with CD and maize cob with pig manure enhances biogas generation, respectively. Adebayo et al. [38] found that co-digestion of CD and MC at a mesophilic condition increased biogas production significantly along with enhanced biomethane generation.
However, comprehensive studies showed a lack of information about the proper mixing ratio of CD and MC to maximize the biogas yield and nutrient quality of the digested slurry along with the contribution to the circularity of the bio-economic system. Forecasting of biomethane generation from ACoD is also limited. Hence, this study aimed to find the optimum ratio for biogas production from ACoD of CD and MC, forecasting the ACoD process and investigating the contribution of ACoD of CD and MC in the circularity of bio-economy based on the proposed approach.

2. Materials and Methods

2.1. Process Description

An anaerobic co-digestion process-based circular bio-economic system is illustrated in Figure 1. During maize cultivation, maize cob is produced as by product and maize leave can be used as dairy feed. Maize cob and cow dung from dairy farm can be co-digested to maximize biogas production through nutrient balancing and due to synergy of digestion process. This increased volume of biogas can be used in CHP (Combined Heat and Power) unit for electricity and heat generation. Waste heat from CHP can be used to maintain optimum temperature in digester. Electricity produced from CHP unit can be used in animal farm and household of village. Heat produced from CHP can also be used for drying of grain. Biogas can also be used directly for cooking and up-gradation of biogas, facilitating contribution to natural gas grid. Digestate produced in ACoD can also be an input in production systems such as nutrient-enriched fertilizer in crop fields. Hence, co-digestion may create a close nexus of crop and livestock production along with energy production and facilitate the implementation of a circular bio-economy.

2.2. Collection of Substrate and Inoculum

This batch study was conducted at the Green Energy Knowledge Hub (GEKH), Department of Farm Power and Machinery, Bangladesh Agricultural University (BAU), Mymensingh, Bangladesh. Cow dung was collected from the dairy farm, BAU. Maize cob was collected from the local market of Jamalpur, Bangladesh. Sludge of 30-day-digested cow dung from Continuous Stirred Tank Reactor of GEKH, BAU, was used as inoculum. The inoculum was kept in an incubator for 15 days to inhibit methane production from the inoculum during the batch study. Pretreatment of the substrate increased surface area and degradability rate [39], which is why maize cob was ground to reduce particle size before it was used as feedstock for faster hydrolysis during digestion.

2.3. Analytical Methods

Characteristics of substrates were analyzed including pH, total solid (TS), volatile solid (VS), ash, nitrogen (N), total ammonium nitrogen (TAN), and carbon: nitrogen (C/N) ratio. pH of all biomass was measured using pH meter (MW 150 Milwaukee pH meter). TS, VS, and ash were determined following the procedure described by APHA [40]. The micro-Kjeldahl method [41] was used to determine N, P and K of substrates were determined following the colorimetric method [42] and flame emission spectrophotometric method [43], respectively. TAN was measured using a photometer (NOVA 60, Memmert, Germany). C/N was determined following Equation (1) [44].
C / N = V S d b % / 1.76 × N
where VSdb(%) is the dry basis volatile solid.
Glass syringe (SGC, Australia, capacity: 500 mL) was used to determine the volume of biogas, periodically. The biomethane potentiality of each biomass was analyzed using a gas analyzer (Optima 7 Biogas MRU Instruments, Inc., Humble, TX, USA) for methane (%), carbon dioxide (%), hydrogen sulphide (ppm), and a trace amount of oxygen (%) present in biogas produced during AD of biomass. Periodical biogas volume and gas composition were recorded in MS Excel sheet for further data interpretation to know each biomass’s biomethane potential.

2.4. Experimental Setup

Anaerobic digestion of all biomass was carried out using 500 mL batch bottles as digesters. Batch bottles were air-tightened using butyl rubber stoppers. The amount of biomass was calculated following Equation (2) [24].
P i = M i × C i / M s × C s
where Pi is VS ratio, which is equal to 1. M and C denote mass (g) and VS (g). The subscripts i and s are denoted for inoculum and substrate, respectively. Oxygen was removed by nitrogen flushing for 2 min.
Biomass was added with 250 g inoculum homogeneously. Then, closing with butyl rubber stopper batch, bottles were flushed with nitrogen gas for two minutes to maintain anaerobic condition. All the samples were triplicated for this experiment. Batch bottles were placed in an incubator (Model: ICP 110; manufacturer: Merck, Germany; volume: 108 L) maintaining mesophilic condition (35 ± 1 °C) for 71 days of digestion period. Methane production from inoculum was subtracted from methane production of each substrate during the experiment. The actual biomethane potential of each biomass was calculated using Equation (3) [5].
B M P o b s e r v e d = V ( i n o + b i o m a s s ) V i n o m V S b i o m a s s
where BMPobserved is the biomethane (mL/gVS) potential of biomass, V(ino+biomass) is the volume of methane (mL) from biomass with inoculum, Vino is the volume of methane (mL) from inoculum, and mVSbiomass (gVS) is the mass of volatile solid of biomass added during AD.

2.5. Kinetic Analysis

Kinetic modeling of biogas production trends with digestion times helps to forecast biogas production potentiality and AD efficiency [45]. BMP potentials from all biomass were fitted with first-order model (4) [24], cone model Equation (5) [24], modified Gompertz model Equation (6) [46], and logistic model Equation (7) [47], respectively, to know different kinetic parameters related to AD process of organic substrates.
B ( t ) = B o × 1 e k t
B t = B o 1 + K t n
B ( t ) = B o e x p { e x p [ R m a x × e B o ( λ t ) + 1 ] }
B ( t ) = B o 1 + e x p [ 4 R m a x λ t B o + 2 ]
where B(t) is biomethane potential at time t (d) (mL/gVS), Bo is the highest biomethane potential of a biomass (mL/gVS), k is degradation rate (d−1), the value of e is 2.7183, n is the shape factor, Rmax is the highest biomethane potential of substrates per day (mL/gVS d−1), and λ is lag phase (d). Kinetic models were fitted for experimental data using nonlinear curve fitting toolbox of MATLAB (R2018a).

2.6. Electricity and Heat Production

Heat and electricity generation are the typical uses of biogas generated from anaerobic co-digestion in commercial scale biogas plants to mitigate the energy shortage issue. Thus, with a sustainable renewable energy source and efficient waste-to-energy conversion, the process can convert to a circular bio-economic system. Potential waste production during animal farming and maize cultivation were calculated following Equations (8) and (9) [48].
W c = N × R G R
W m = P × R Y R × R R F × S A F
where Wc is the net cow dung production (kg/yr), Wm is the net available maize cob (kg/yr), N is the number of cows available in Bangladesh, RGR is the CD production rate (kg/yr), P is the maize production in Bangladesh, RYR is the MC-to-maize yield ratio, RRF is the MC recovery factor, and SAF is the surplus MC availability factor. In this study, RGR was considered based on 8.87 kg/day CD production per cow [49]. The values of RYR, RRF, and SAF for substrates were considered from Rahman et al. [48] during calculation.
Potential biogas electricity and heat production from co-digestion of CD and MC were calculated following Equations (10)–(12), respectively.
B G = b g × W c m × V S c m
E l e c t r i c i t y ( M J y r ) = B G × C v o f b i o g a s × E l e c t r i c a l e f f i c i e n y o f C H P u n i t
H e a t ( M J y r ) = B G × C v o f b i o g a s × H e a t e f f i c i e n y o f C H P u n i t
where BG is the potential biogas production from co-digestion of available CD and MC at optimum ratio (m3/yr), bg is the cumulative biogas production potential from ACoD of CD and MC from this batch study (m3/kgVS), Wcm is the mass of CD and MC (available in Bangladesh) at optimum ratio, VScm is the volatile solid content of CD and MC at optimum ratio, and Cv is the calorific value of biogas. In this study, heat and electricity generation from anaerobic co-digestion of cow dung and maize cob available in Bangladesh was calculated based on the CHP unit (GE Jenbacher gas) with 36.3% electrical and 44.4% heat efficiency [50]. Calorific value of biogas was considered as 22 MJ/m3 [51]. Waste heat produced during CHP operation was not calculated. During calculation of energy and heat generation, the energy requirement for CHP operation was not considered.

2.7. Nutrient Analysis of Digestate

Anaerobic co-digestion is a technology which increases the nutrient quality of digestate compared to raw substrate [35]. Nutrient-enriched digestate could be used in crop fields, which will facilitate the conversion of waste to nutrients for plants and reduce the use of organic fertilizer, thus developing a circular bio-economic system. Nutrient content of digestate was found following Equation (13).
N C = D i g e s t a t e × T S   % × n c   %
where NC is the nutrient content (kg/yr), Digestate is the amount of slurry after digestion (kg/yr), TS (%) is the total solid percentage of digestate, and nc (%) is the nutrient percentage in digestate based on total solid.

3. Results and Discussion

3.1. Characterization of Substrate during ACoD

The physical and chemical composition of substrates and feedstock (substrates with inoculum) are listed in Table 1. Biomethane generation largely influenced by the initial properties of substrates and inoculums. In this batch assay, pH levels of raw CD and MC were about 7.59 and 7.55 (Table 1), respectively. Previous studies resulted in pH levels of CD and MC of 7.08 [44] and 6.83 [52], respectively, which were close to the value of the samples used in this experiment. This slight difference might be due to the source of waste collection. The production of biogas from ACoD significantly depends on the C/N ratio [24]. TS of cow dung and maize cob (Table 1) was nearest to the previous study with percentages of 17.30% [44] and 82.85% [53]. The C/N ratio of CD and MC were 32.15 and 42.72, respectively. According to previous studies, the C/N ratios of CD and MC were 25 [54] and 49.19 [55], respectively. The C/N ratio might be due to difference in feed of cow dung, source of maize cob collection, and method of C and N determination. Comparison of characteristics of substrates and feedstock showed that when substrates mixed with inoculums, the physical and chemical characteristics changed. The addition of inoculum brought the pH of all test groups in between 7.20 and 7.5, which was the nearest to optimum for ACoD, as Rabi et al. [23] reported optimum pH for biogas production is between 6.5 and 7.2. When substrates were mixed with inoculums, the TSs of all test groups were in between 8 and 11.5% (Table 1), which was favorable for biogas production, as according to Budiyono et al. [56], optimum TS for biogas production is from 7 to 9%. TAN, which has an adverse effect on AD process, was also reduced when substrates mixed with inoculum. The addition of inoculum brought the C/N ratio of substrates in between 31.83 and 39.84, which is slightly higher than the optimum range (20–30). This might not cause any major impact as optimum range of C/N ratio may vary depending on the substrates from 9 to 50, as reported by Guarino et al. [57]. Furthermore, Rahman et at. [5] observed optimum gas production at 32.02 C/N ratio during co-digestion of poultry droppings and wheat straw.
Characteristics of digestate after 99 days of digestion are shown in Table 2. Comparison of Table 1 and Table 2 showed a lower value of VS in digestate, which indicated degradation of substrates and production of biogas. An overall increase in the N percentage was observed in digestate (Table 2) compared to that of parent feedstock (Table 1). This implies that nutrient concentrations are getting higher in digestate for ACoD under these conditions.

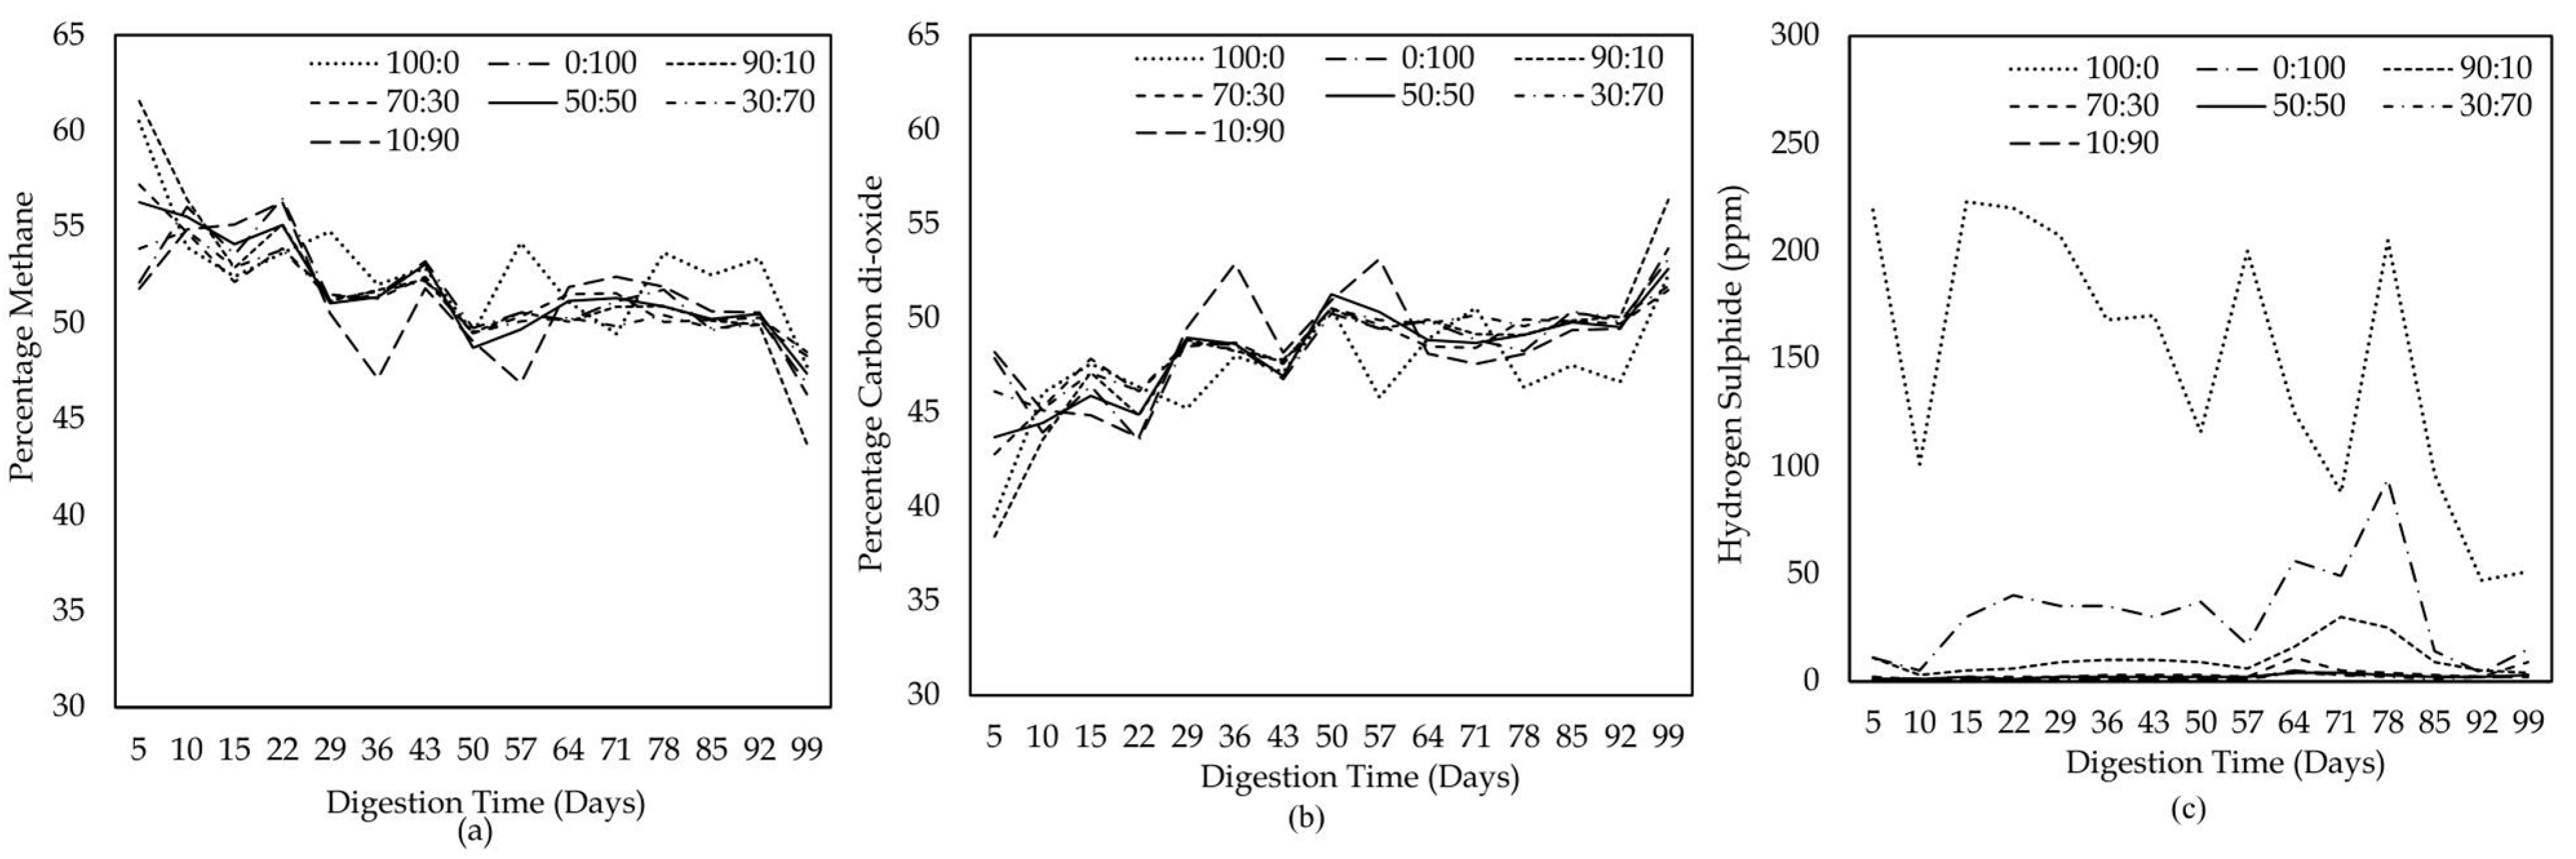
3.2. Analysis of Biogas Composition

Biogas composition including methane, carbon dioxide, and hydrogen sulphide are demonstrated in Figure 2a–c, respectively. Methane and carbon dioxide have a major portion in biogas mixture, and the other components are present in small amounts depending on substrate characteristics, as Czekała et al. [58] reported substrates with higher portions of carbohydrate and protein have a high hydrolysis rate, but substrates with fat have a comparatively high methane content in biogas. Methane contents of biogas produced from 100:0, 90:10, 70:30, 50:50, 30:70, 10:90, and 0:100 test groups were 52.78%, 51.80%, 51.68%, 51.76%, 51.25%, 51.15%, and 51.61%, respectively (Figure 2c). Khatun et al. [24] found methane content in a range of 36–58% during co-digestion of animal manure and fruit waste. So, methane content of biogas during anaerobic co-digestion was within the range for using an energy source, which is in accordance with the findings of Fagerström et al. [59]. Percentages of carbon dioxide of all test groups of CD and MC were in between 45% and 55% (Figure 2b). Nandi et al. [44] also reported carbon dioxide content in between 25% and 50% during digestion of cow dung at different temperatures. Carbon dioxide content was suddenly increased in between 92 and 99 days of digestion, and it might be due to the poor activity of methanogenic microbial group that converts carbon dioxide into methane. Co-digestion significantly reduced the hydrogen sulphide content of biogas for all test groups (Figure 2c), which was beneficial as hydrogen sulphide hinders the growth of methanogenic bacteria [60].

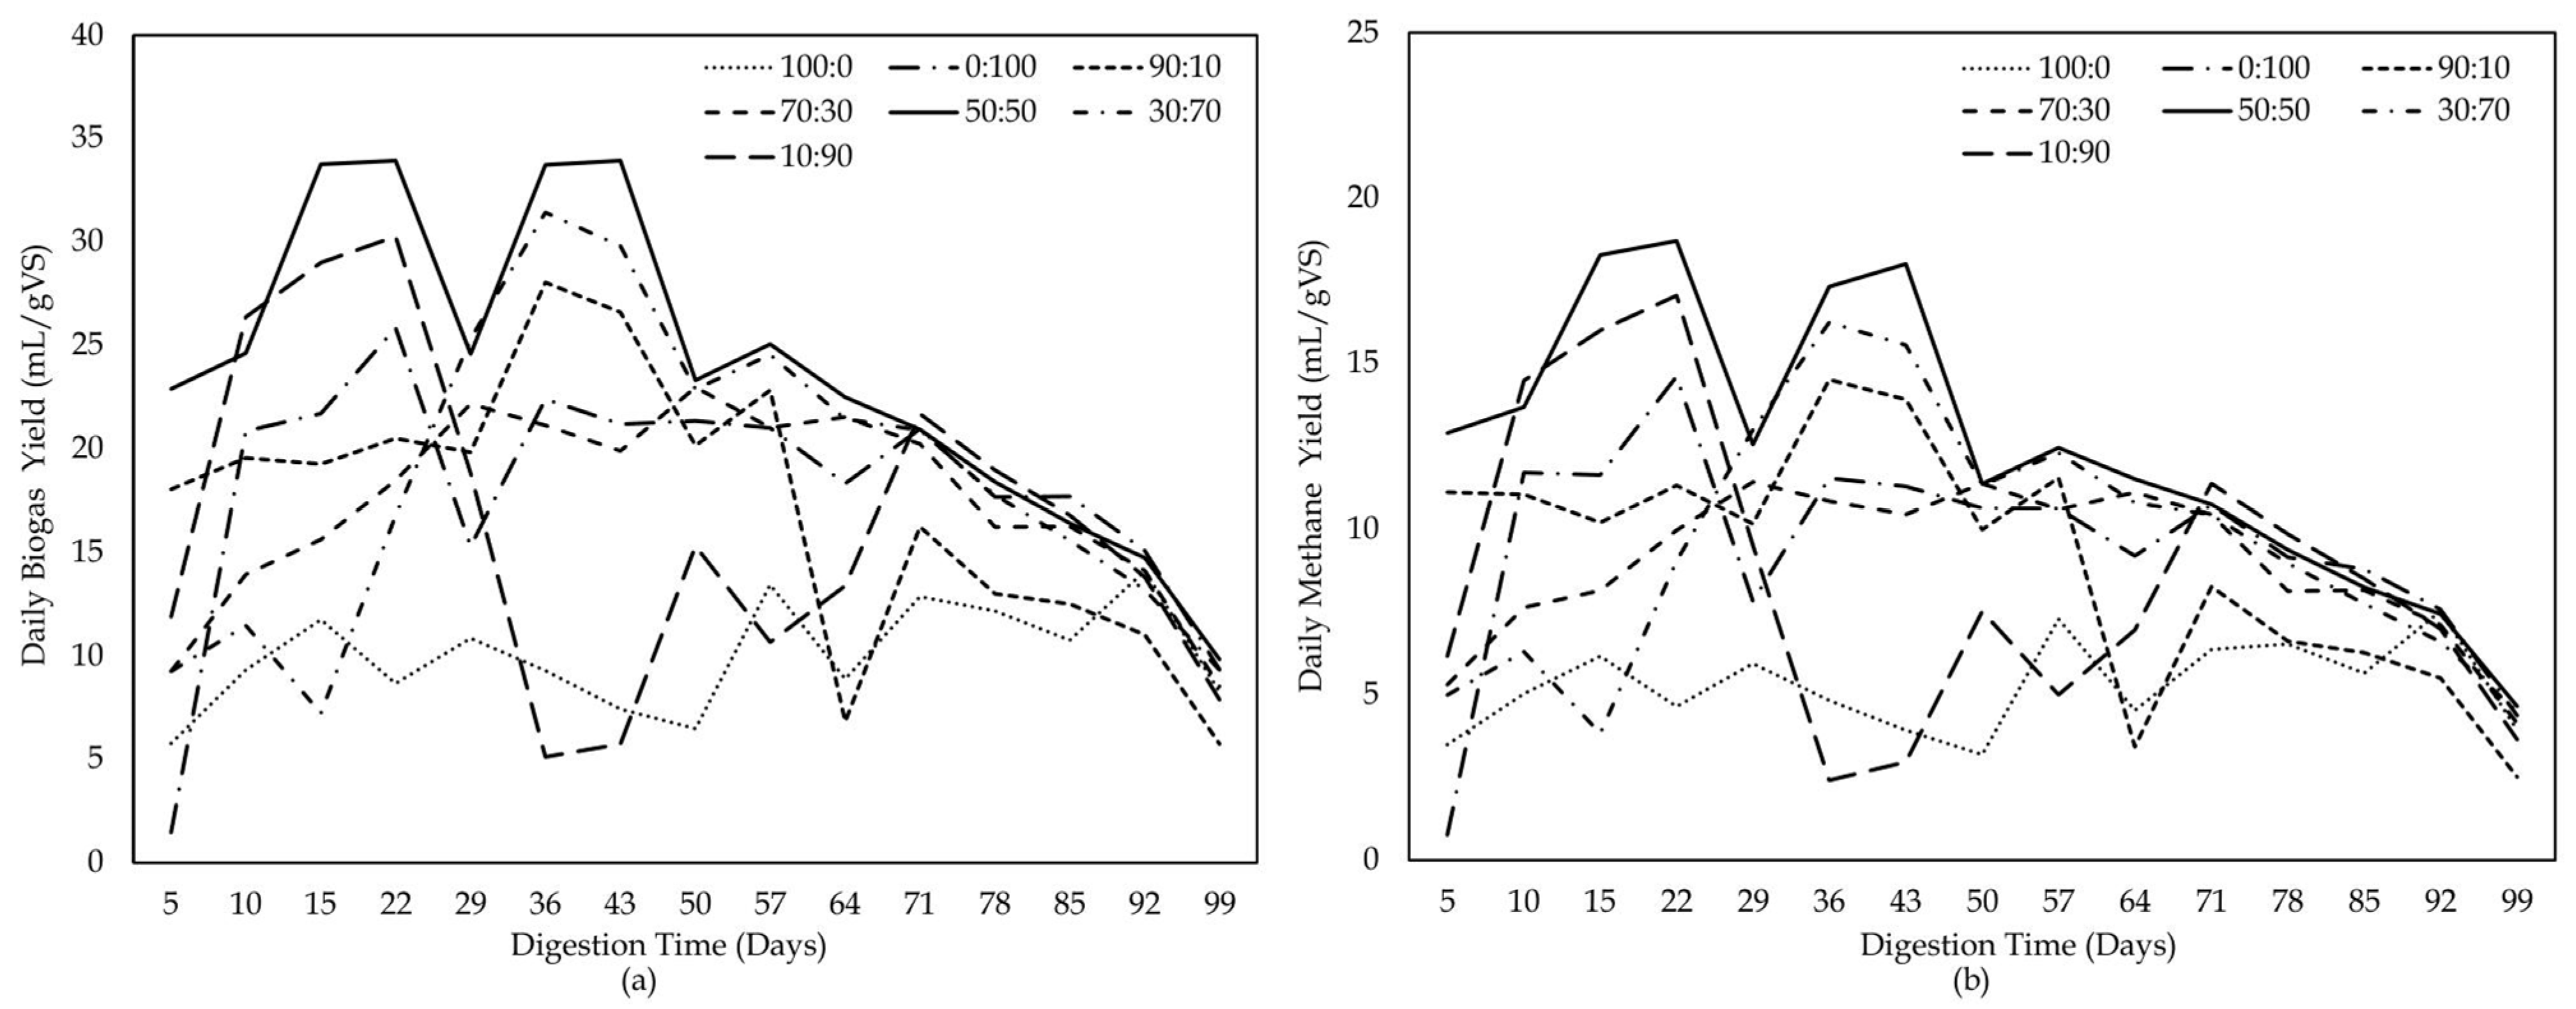
3.3. Daily Biogas and Methane Production

Biogas and methane production from all test groups of CD and MC per day during ACoD process is demonstrated in Figure 3a,b, respectively. Daily methane production followed a similar trend to biogas yield (Figure 3a,b). From Figure 3, the biogas production was low at 5 days of digestion time and then increased significantly. An initial lower biogas might be due to slower activity of microorganism and lower hydrolysis rate, as raw substrates were used as feedstock without any chemical or biological pretreatment to speed up hydrolysis in the lignocellulose. Biogas yield was high for all test groups in between 10 and 50 days and then reduced gradually. The conversion of volatile solids into biogas might be the cause of the reduced daily production after 50 days. The highest daily biogas and methane yield was found in the 10th and 36th days of digestion (Figure 3). These peaks might be due to breakdown of carbohydrates and complex organic compounds, respectively. Wang et al. [47] also reported two peaks during biogas production from cow dung for carbohydrates decomposition and breakdown of organic molecules, respectively.

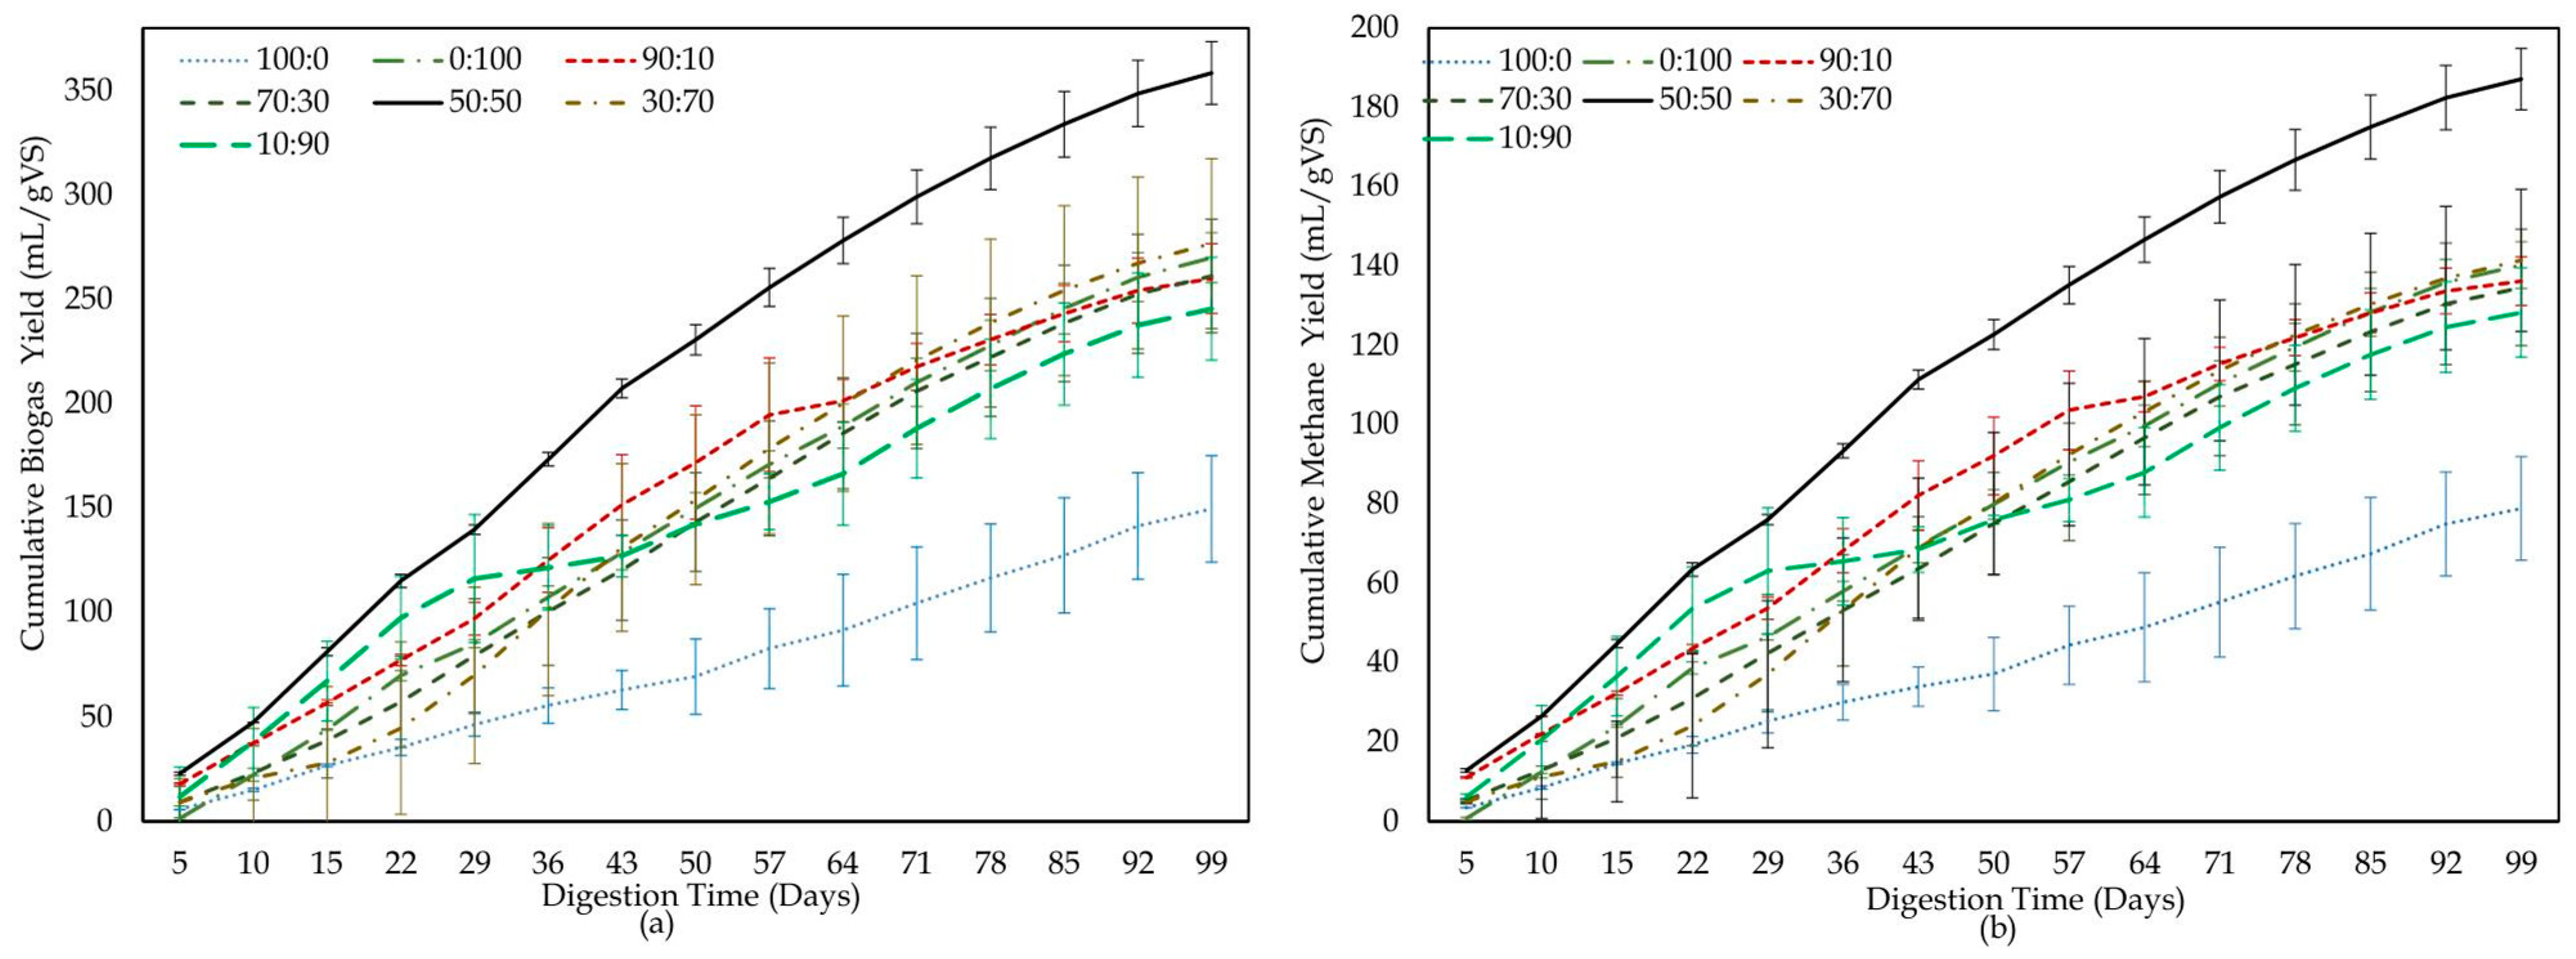
3.4. Biogas and Methane Production Potential from ACoD

Cumulative biogas and methane yield from this co-digestion study for all test groups of CD and MC is demonstrated in Figure 4a and Figure 4b, respectively. Biogas production from 100:0, 90:10, 70:30, 50:50, 30:70, 10:90, and 0:100 test groups of CD and MC were 149.8 ± 36.1, 260.0 ± 16.7, 261.3 ± 38.5, 356.6 ± 21.2, 276.8 ± 56.7, 245.6 ± 34.9, and 270.1 ± 20.6 mL/gVS, respectively. Biomethane generation followed a similar trend with 78.9 ± 18.5, 136.24 ± 8.63, 134.7 ± 20.8, 187.14 ± 10.84, 141.5 ± 31.0, 128.3 ± 16.0, and 140.39 ± 10.17 mL/gVS methane yield from 100:0, 90:10, 70:30, 50:50, 30:70, 10:90, and 0:100 ratios of CD and MC, respectively. Shah and Tabassum [61] found 136.8 mL/gVS methane yield from chemically pretreated maize cob, which was slightly lower than the gas yield (Figure 4b) from this experiment. Difference in gas production might be due to source of waste and type of pretreatment used for maize cob before using it as feedstock for anaerobic digestion. Methane yield from mono-digestion of CD was comparatively lower than the results Li et al. [62] found during anaerobic digestion of cow dung (146 mL/gVS), and the difference in biogas yield might be due to difference in feedstock property of cattle, characteristics of CD used, and method of anaerobic digestion. The highest biogas and methane production (Figure 4a,b) was found at 50:50 ratio of CD and MC. This might be due to the optimum pH (7.32), TS (9.2%), and C/N ratio of feedstock. Kelly [63] reported that 10% total solid in feedstock is best suited for wet anaerobic digestion. Biogas production was 138.05% and 32.02% higher than mono-digestion of CD and MC, respectively. Methane yields also showed 137.18% and 33.30% higher increments than digestion of CD and MC alone. Biogas production from all other test groups (90:10, 70:30, 30:70, and 10:90) also increased with time but not as much as 50:50 ratio. This might be due to higher degradation of volatile solid (Table 1 and Table 2) and higher positive synergy of 50:50 ratio during anaerobic digestion. Khatun et al. [24] also reported maximum biomethane potential at 50:50 ratio of banana peel and poultry droppings due to optimum process parameters and positive synergy of co-digestion. Biogas production at 50:50 ratio was 2.38, 1.37, 0.137, 1.29, 1.45, and 1.32 times higher than 100:0, 90:10, 70:30, 30:70, 10:90, and 0:100 ratios of CD and MC, respectively.

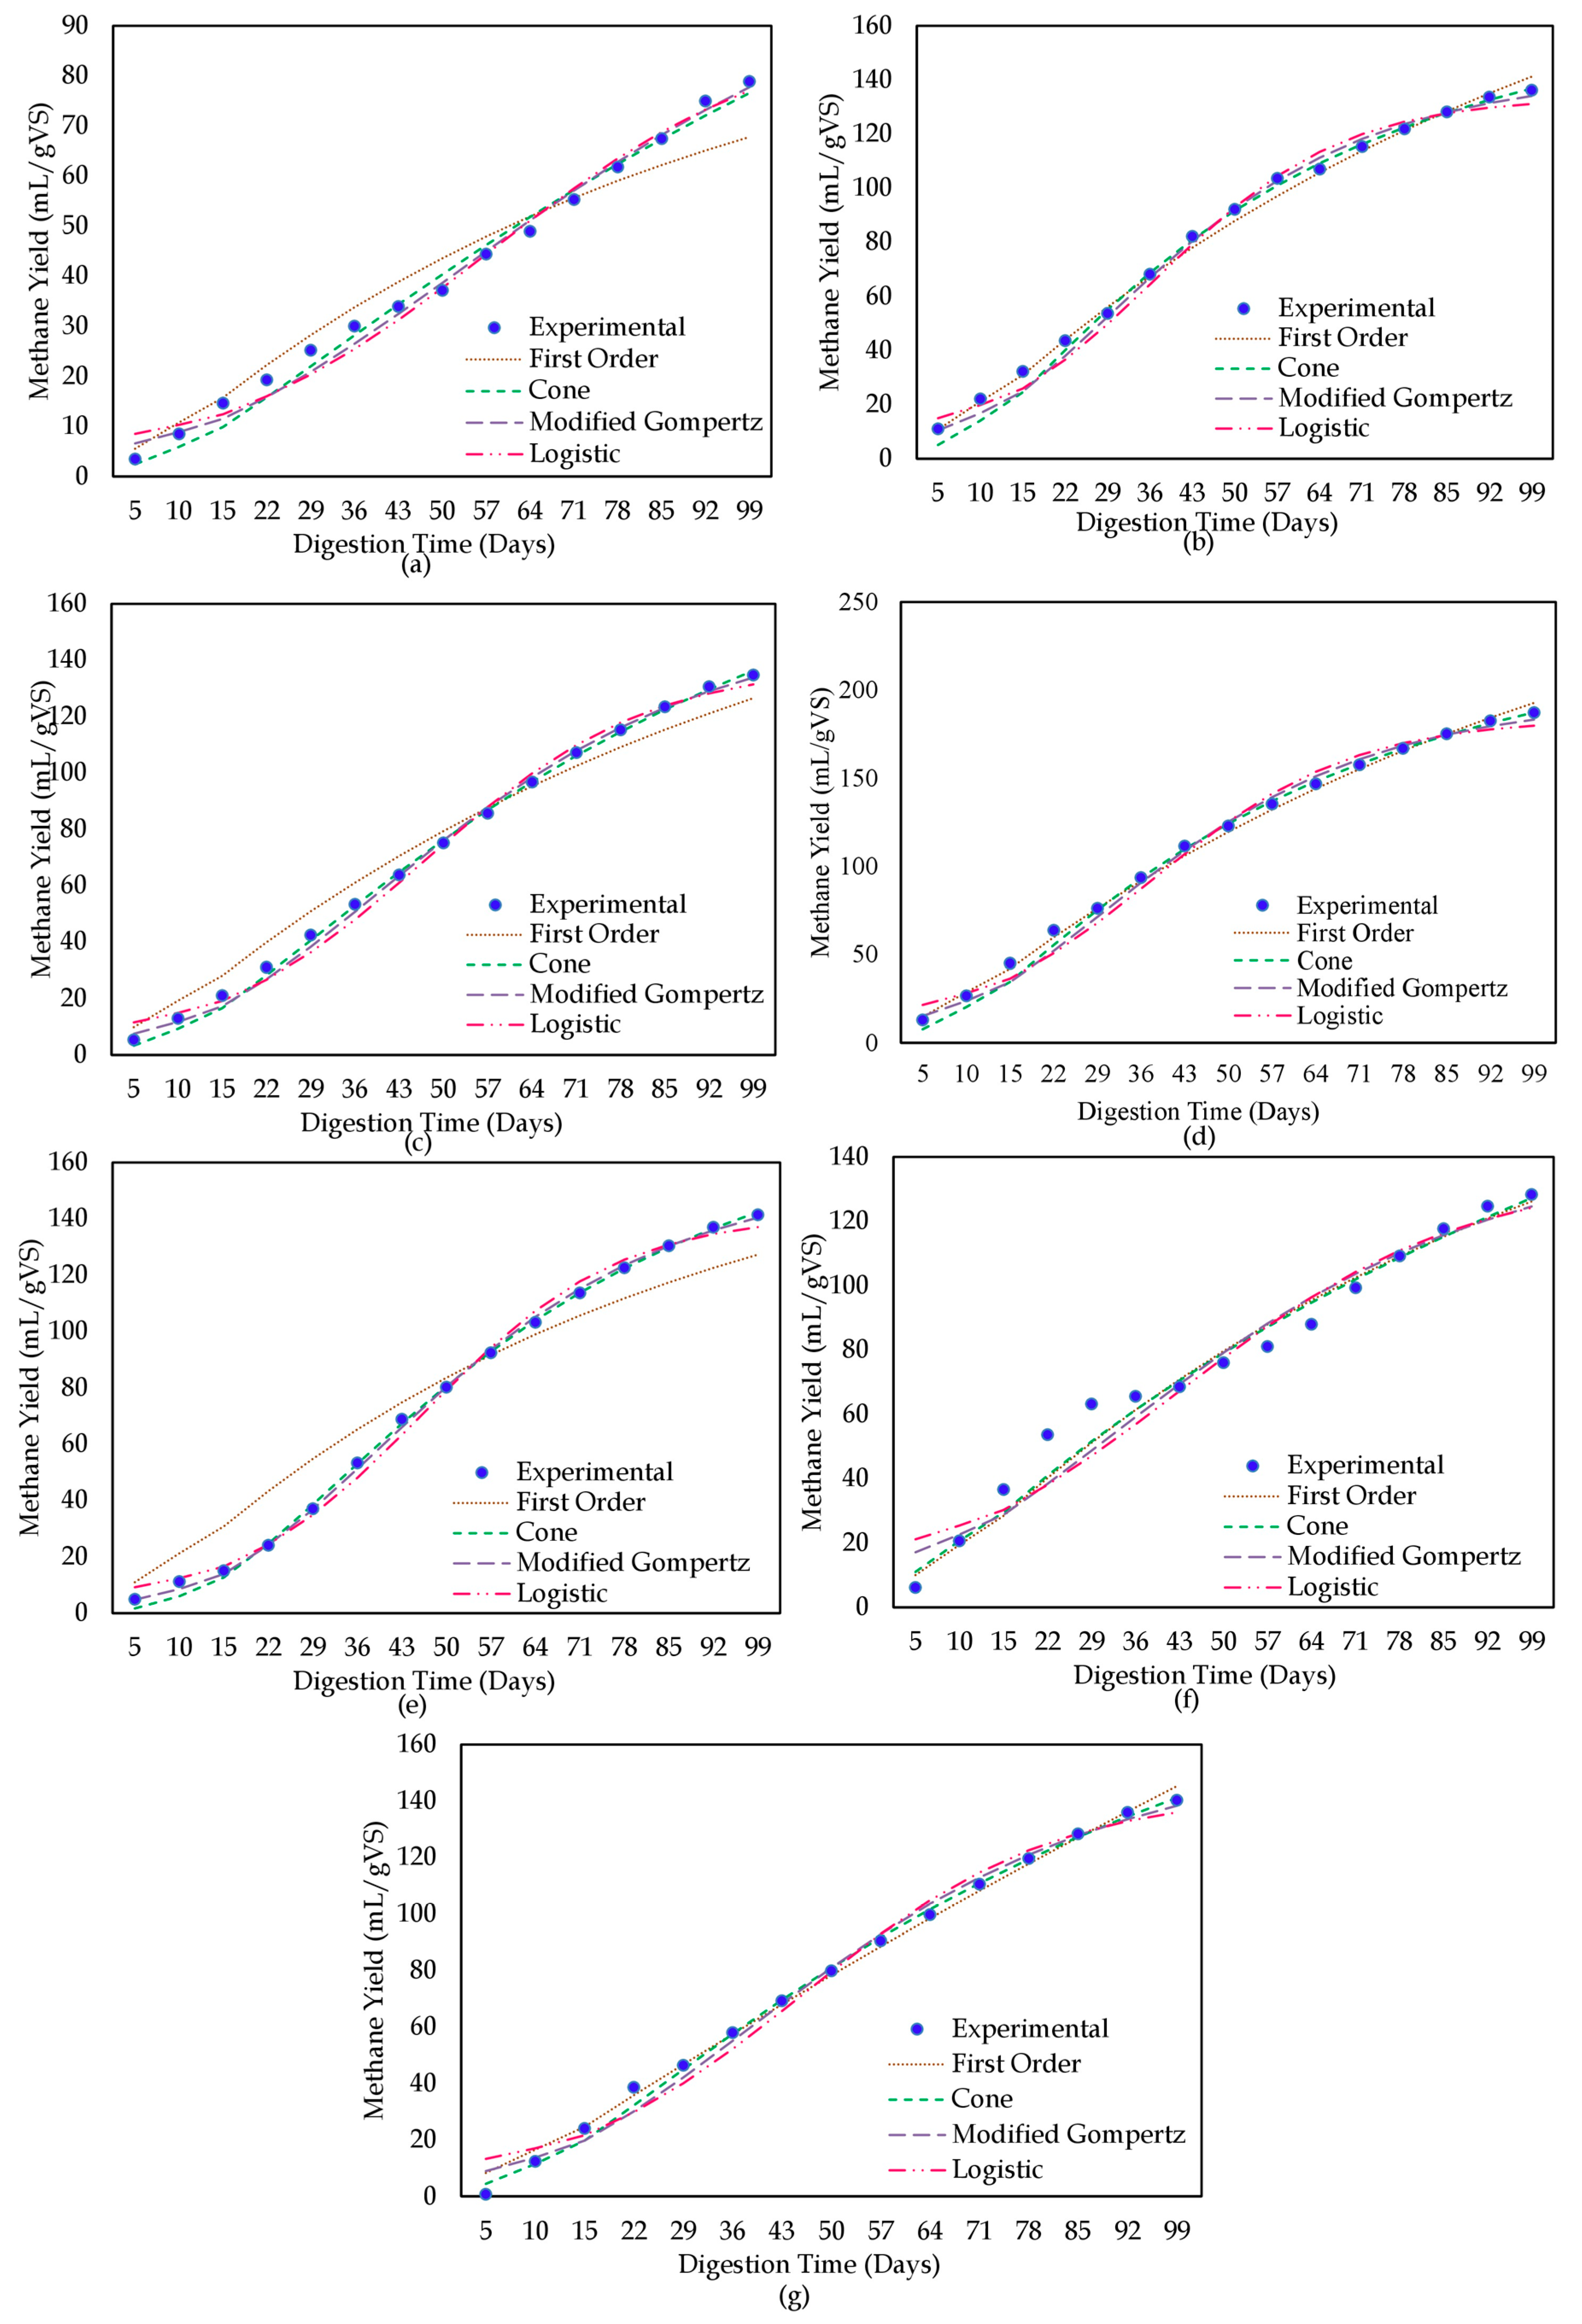
3.5. Prediction of ACoD of CD and MC from Kinetic Modeling

Kinetic analysis of biogas yield ensures the accuracy of data from the anaerobic digestion process [18]. Predicted kinetics parameters based on total methane yield during 99 days of digestion time are listed in Table 3. All four kinetic models showed the coefficient of correlation value (R2) for model fitting was greater than 0.9. But, the predicted methane yield of the first-order model did not follow the similar trend of the methane yield in the cases of 100:0 (Figure 5a), 70:30 (Figure 5c), and 30:70 (Figure 5e), and the value of R2 was also lower for all test groups than the other models. So, this was not the best-suited model for predicting the ACoD process. Cone model fitting for 100:0, 90:10, 70:30, 50:50, 30:70, 10:90, and 0:100 resulted in maximum biomethane production (Bo), and they were 153.39%, 36.66%, 78.17%, 41.81%, 205.02%, 84.74%, and 24.67% higher than the experimental yield, respectively (Table 3 and Figure 4b). Such a huge difference makes it difficult to forecast accurate biomethane generation and resulted in invalid parameters. Both the modified Gompertz models and Logistic model showed that lag phase reduced during co-digestion of CD and MC at 50:50 ratio, which indicates faster degradation during ACoD. The addition of substrates at proper ratio reduces lag phase due to nutrient balancing and active microbial growth. Li et al. [18] found that using additives at proper percentages reduced the lag phase for ACoD systems. Although the R2 values of the modified Gompertz model and Logistic model were almost the same and the RMSE of the modified Gompertz model was slightly lower, the modified Gompertz model showed 42.53%, 4.59%, 15.33%, 4.78%, 10.82%, 13.31%, and 13.25% deviations (for predicted methane yield) from experimental methane yield for 100:0, 90:10, 70:30, 50:50, 30:70, 10:90, and 0:100 test groups of CD and MC, respectively. This model was also not accurate enough, as Raposo et al. [64] reported a deviation greater than 10% that indicated the invalidation of proposed model. The Logistic model showed comparatively better performance with higher R2 (>0.93) and lower difference between predicted and experimental methane yield (<10%), with an exception for mono-digestion of CD alone. However, this result was contradicted with Wang et al. [47], where they reported a lower deviation of predicted and experimental yield using the modified Gompertz model compared to the logistic model (2.1–5.3%) in the case of anaerobic digestion of cattle manure adding binary and ternary trace elements. This contradiction might be due to the type of substrate and trend of biomethane production. Both the modified Gompertz model and logistic model revealed that the time required for initialization of methanization (λ) during co-digestion was lower than mono-digestion, except for the 30:70 ratio, which might be due to the antagonistic effect of mixing substrate at this ratio and process instability. Therefore, among these four models, the logistic model should be used to predict biomethane production from anaerobic co-digestion.

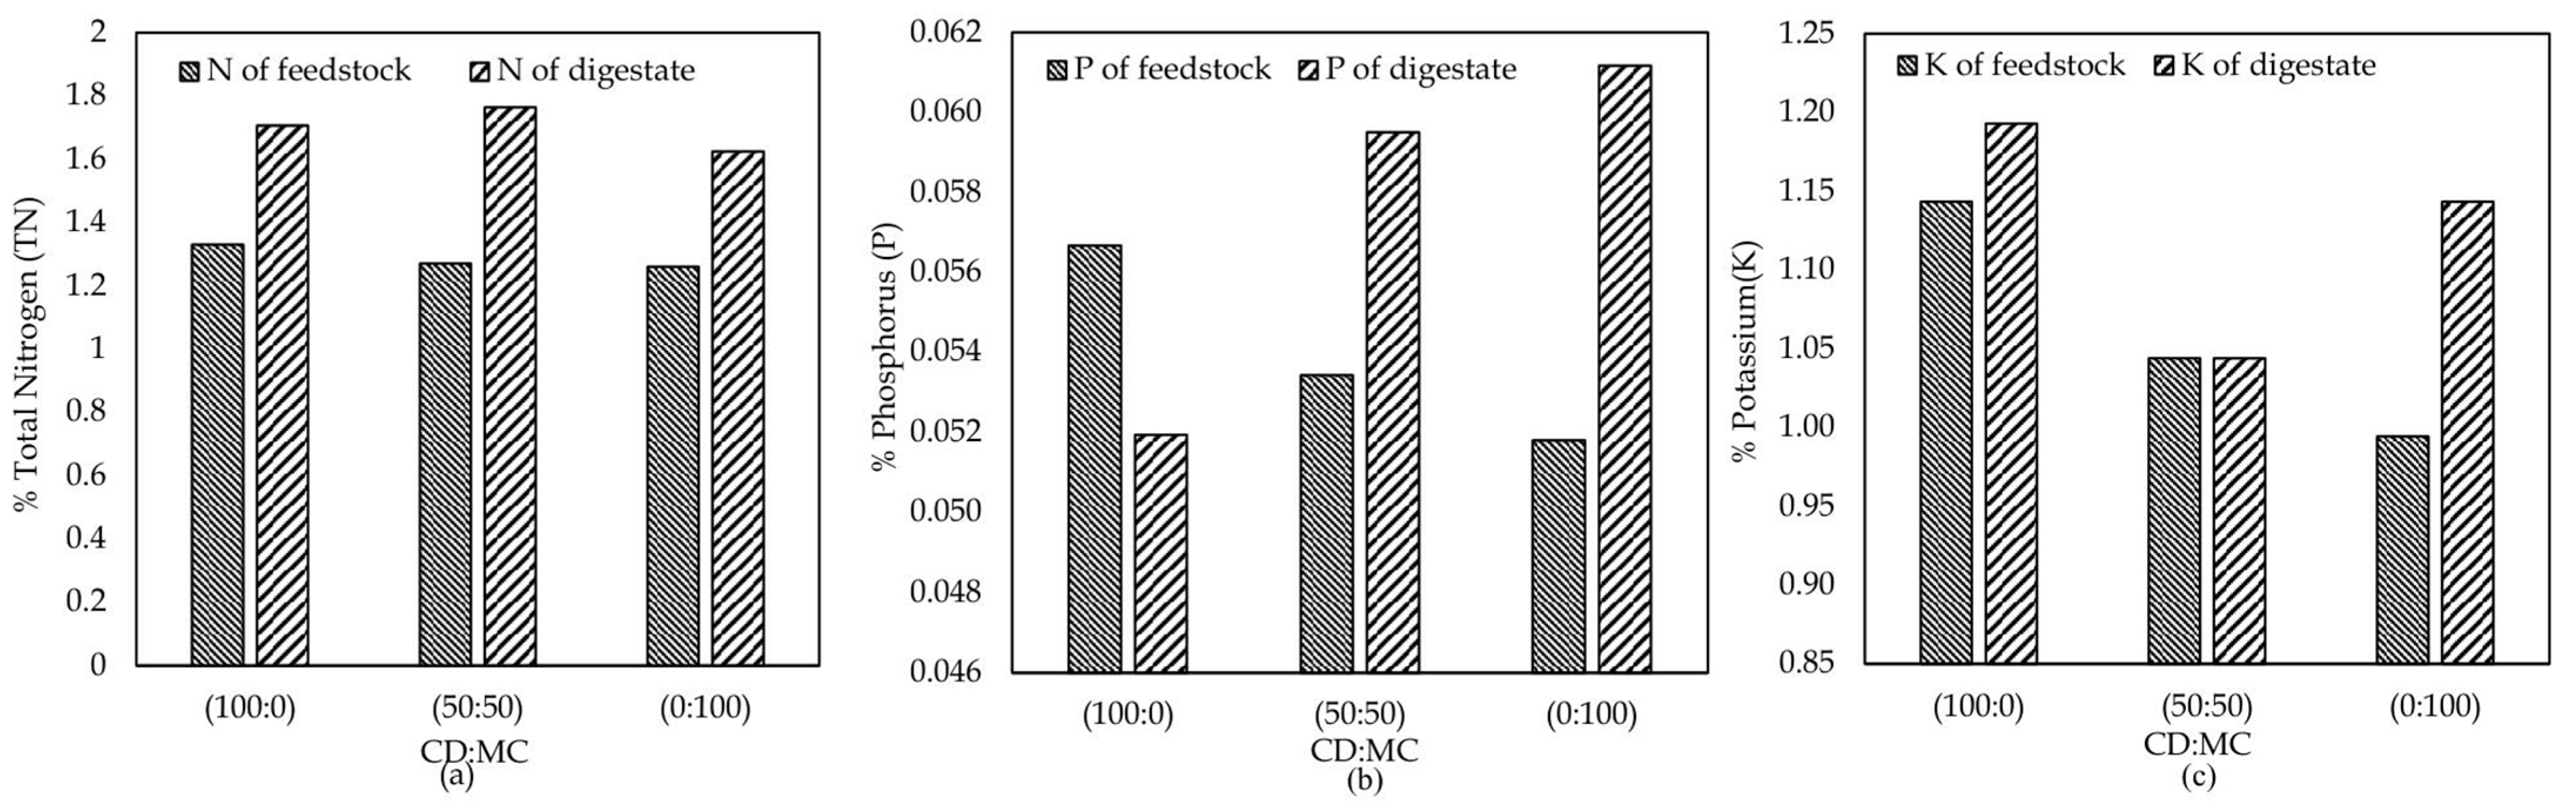
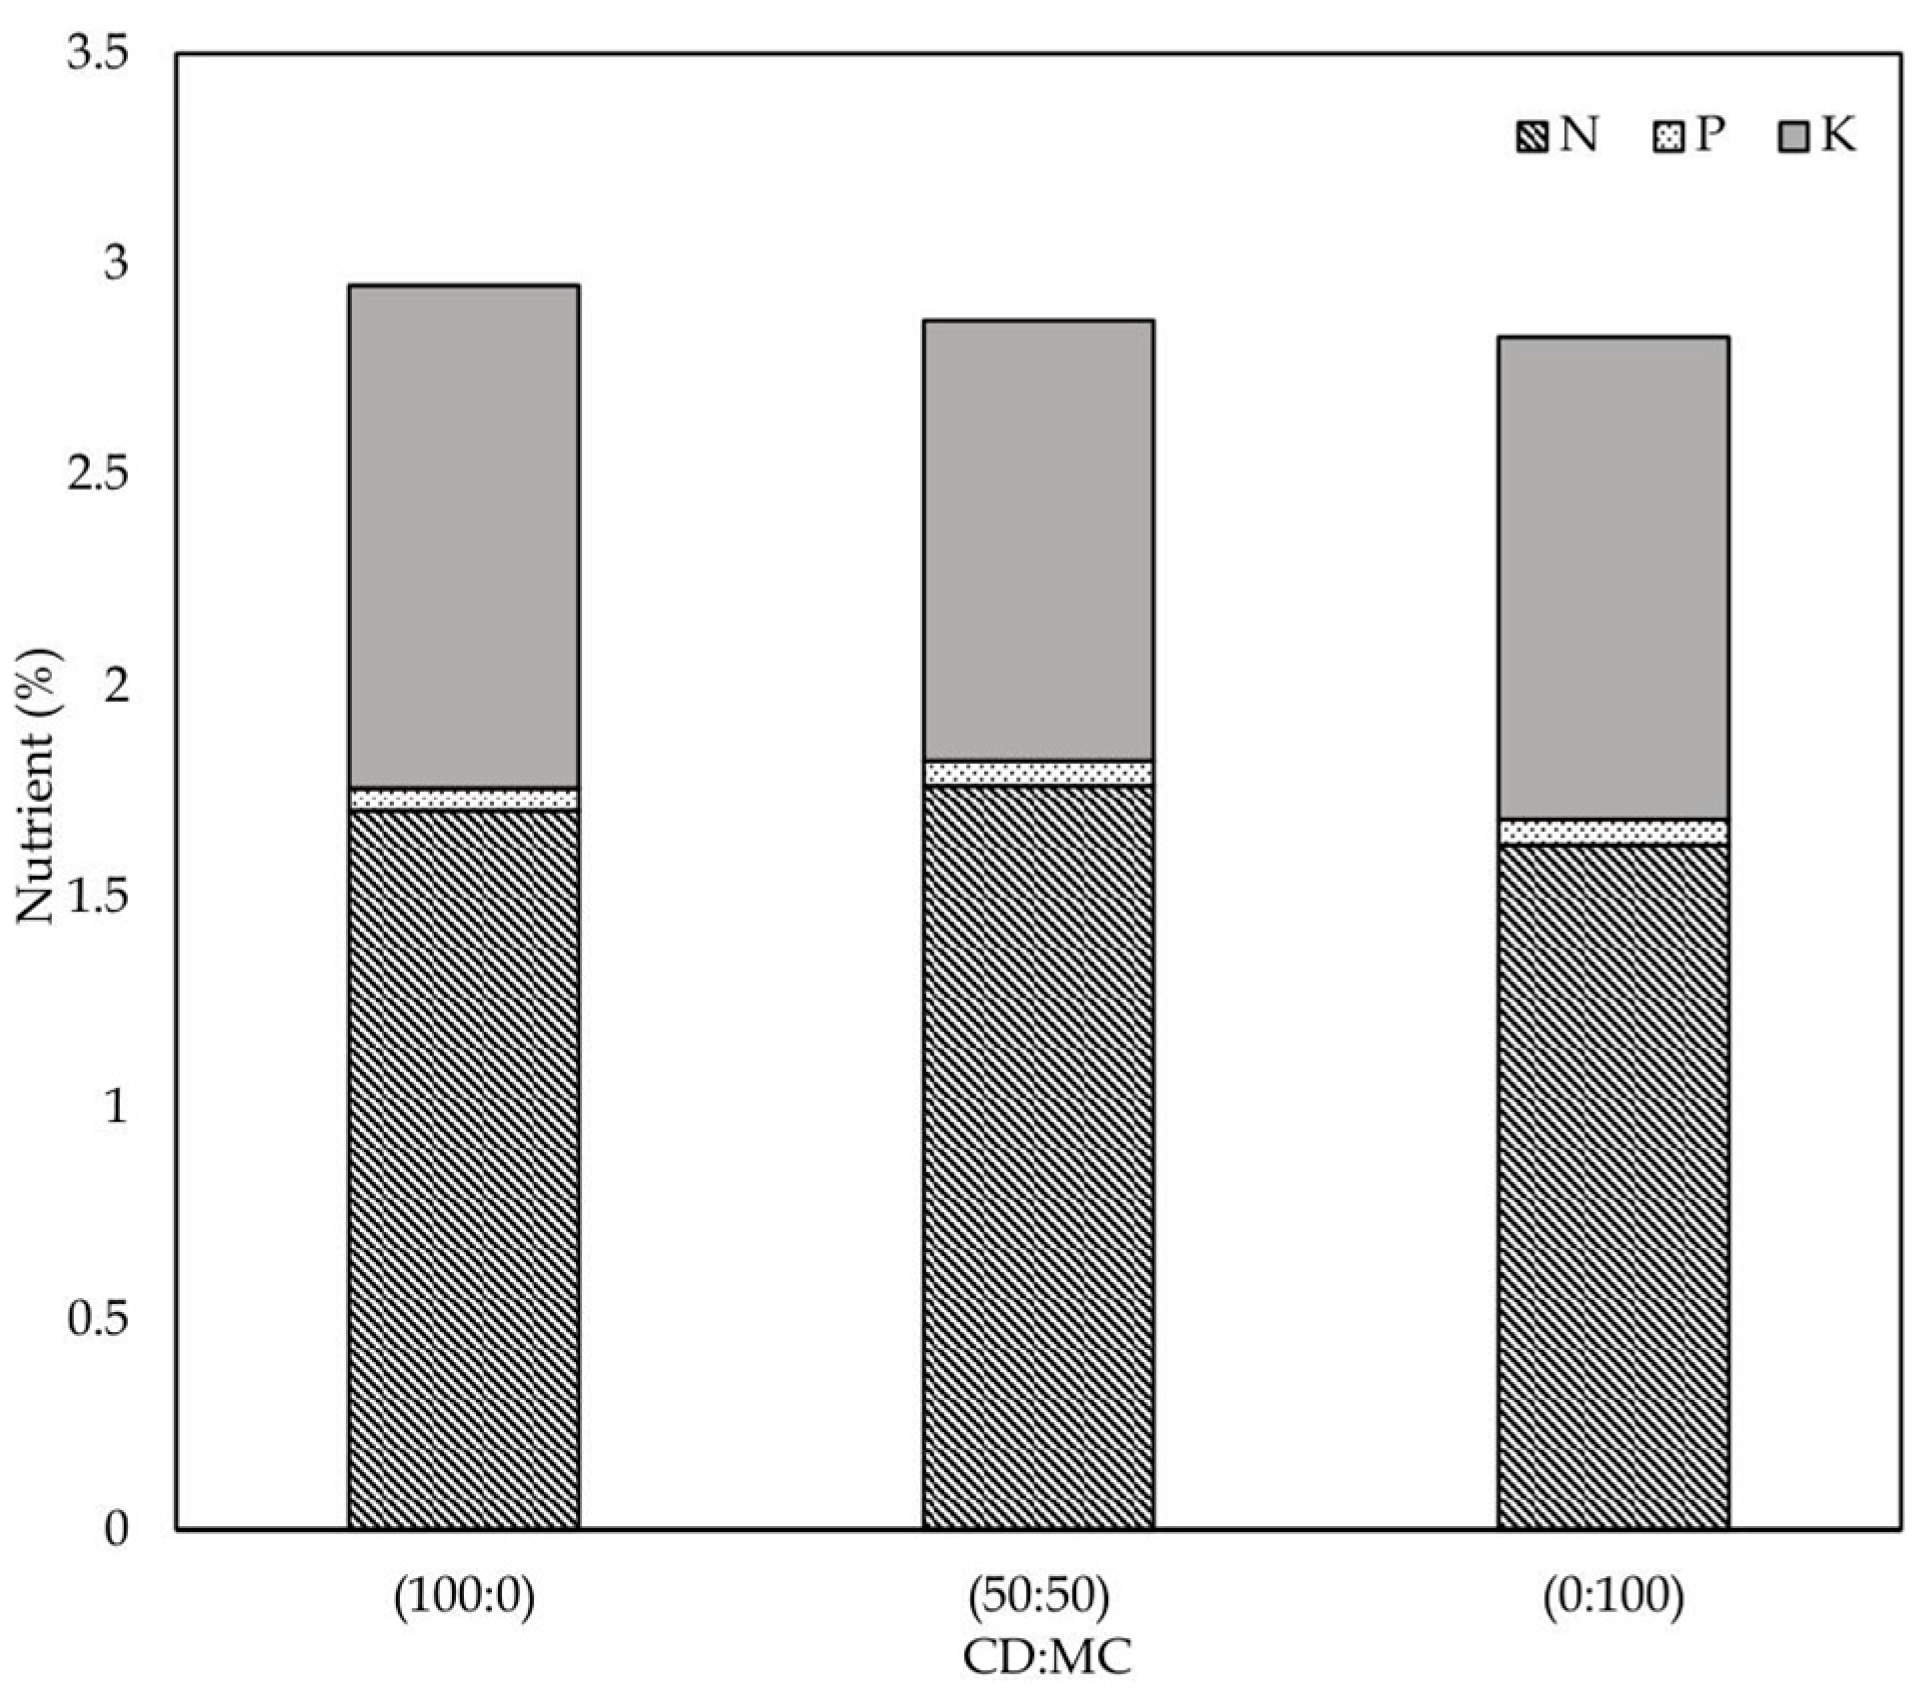
3.6. Nutrient Increments of Digestate from ACoD

N, P, and K contents of feedstock and digestate are shown in Figure 6a, Figure 6b, and Figure 6c, respectively. N content was increased for all test groups after digestion (Figure 5a). The 50:50 ratio has the highest increment of N, which might be due to improved mineralization of organic matter. N content of 50:50 ratio was found to be 1.746% after digestion, and according to Abbas et al. [15], the N content of soil and fertilizer were 0.5% and 1.71%, respectively. So, digestate of ACoD at 50:50 ratio of CD and MC can be used in nitrogen-deficit soil. According to Wang et al. [47], AD of substrates increases nutrient content of fertilizer such as N, P, and K. The P content of all test groups increased after digestion, except for the 100:0 ratio, which might be due to nutrient imbalance as it was mono-digestion of CD. Möller and Müller [65] also reported that manure digestion has a negative influence on P content availability to plant. As cow dung was mixed with maize cob at a 50:50 ratio, that is why an increment in P content was also lower in this ratio compared to MC alone. The K content was increased for CD and MC alone but there was no significant change in the 50:50 ratio of CD and MC after digestion. This might be due to microbial activity. Total nutrient content (NPK) after 99 days digestion of different test groups is illustrated in Figure 7. Total nutrient content after digestion did not show significant differences during co-digestion. This result might be contradictory with Abbas et al. [15], who found that co-digestion of cow manure with food waste increased nutrient content after digestion when compared to mono-digestion. This difference in results might be due to the type of co-substrates, as Edith et al. [66] also did not find significant difference in P and K contents between digestate of urine with manioc effluent and digestate of mixture of urine and cow dung with manioc effluent. This batch study showed percent increments of total nutrient after the digestion 100:0, 50:50, and 0:100 ratios were 14.39%, 21.12%, and 15.20%, respectively, compared to feedstock (Figure 6). This implies that anaerobic co-digestion can not only enhance the biogas production but can also produce nitrogen-enriched digestate, which can be used in nitrogen-deficit soil. Further enhancement of digestate quality is also possible with the addition of suitable additives including composite [67], vermiculite [68], bio-based carbon [69], and different salts of iron [70].

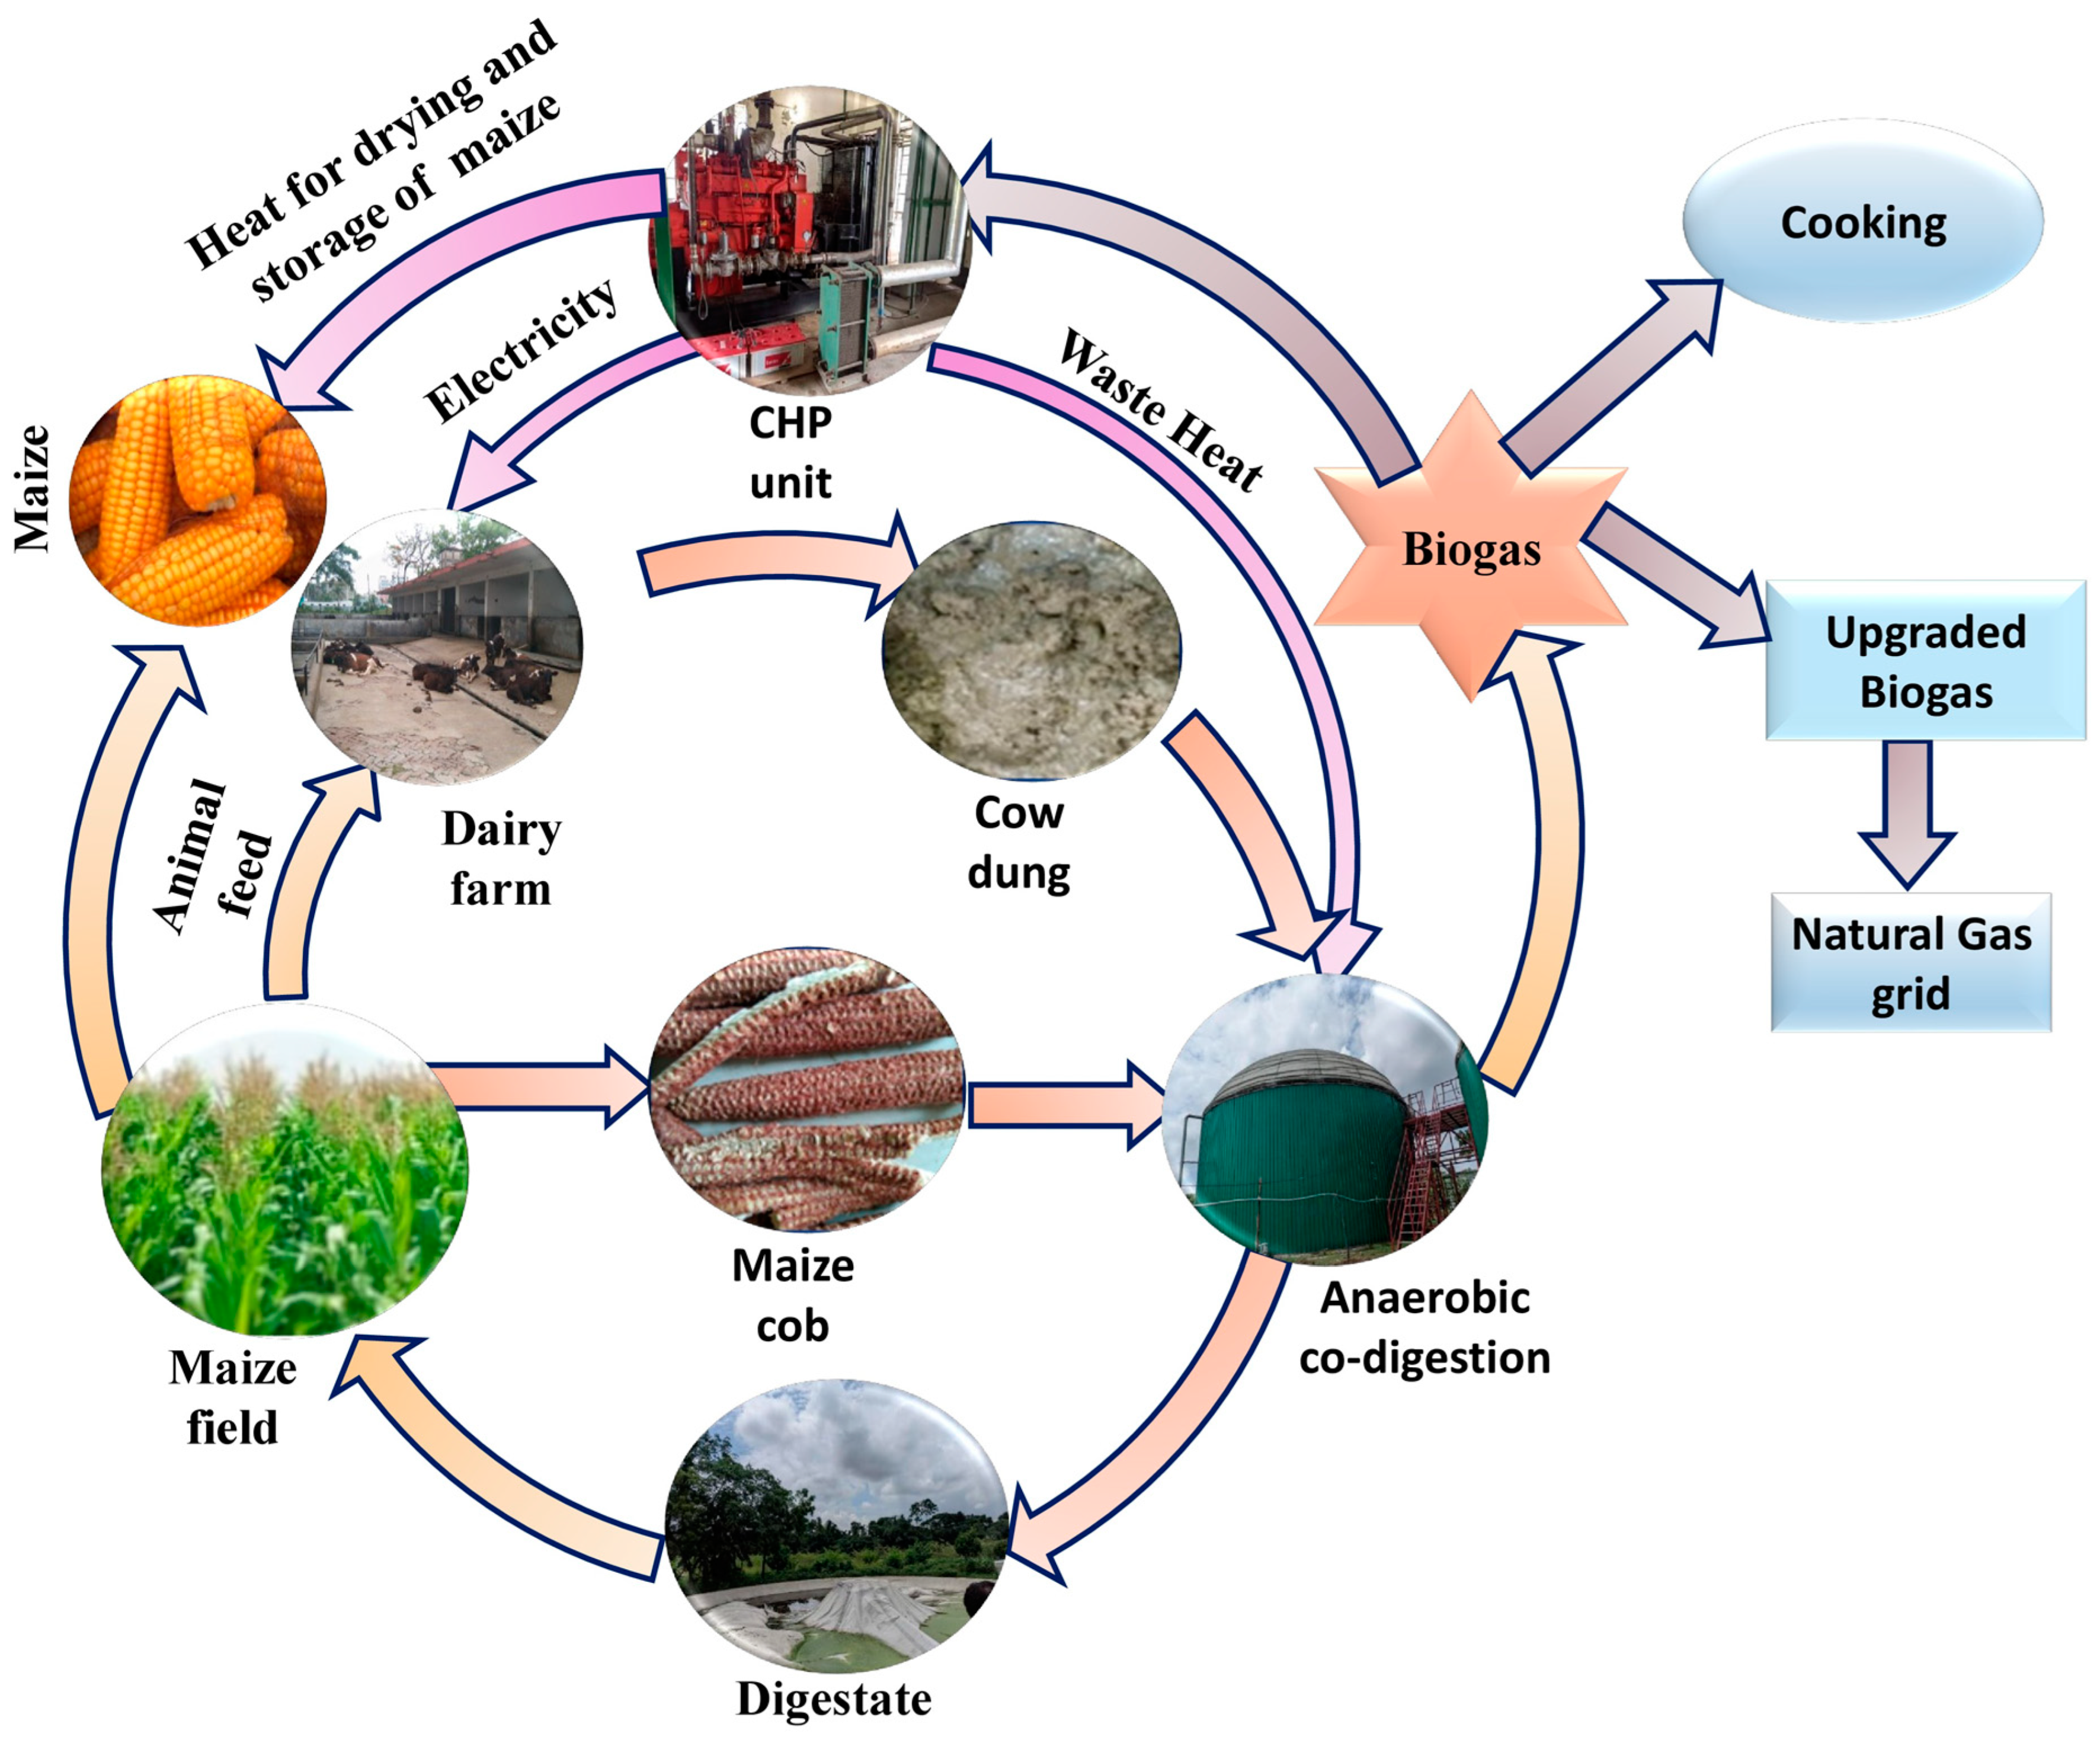
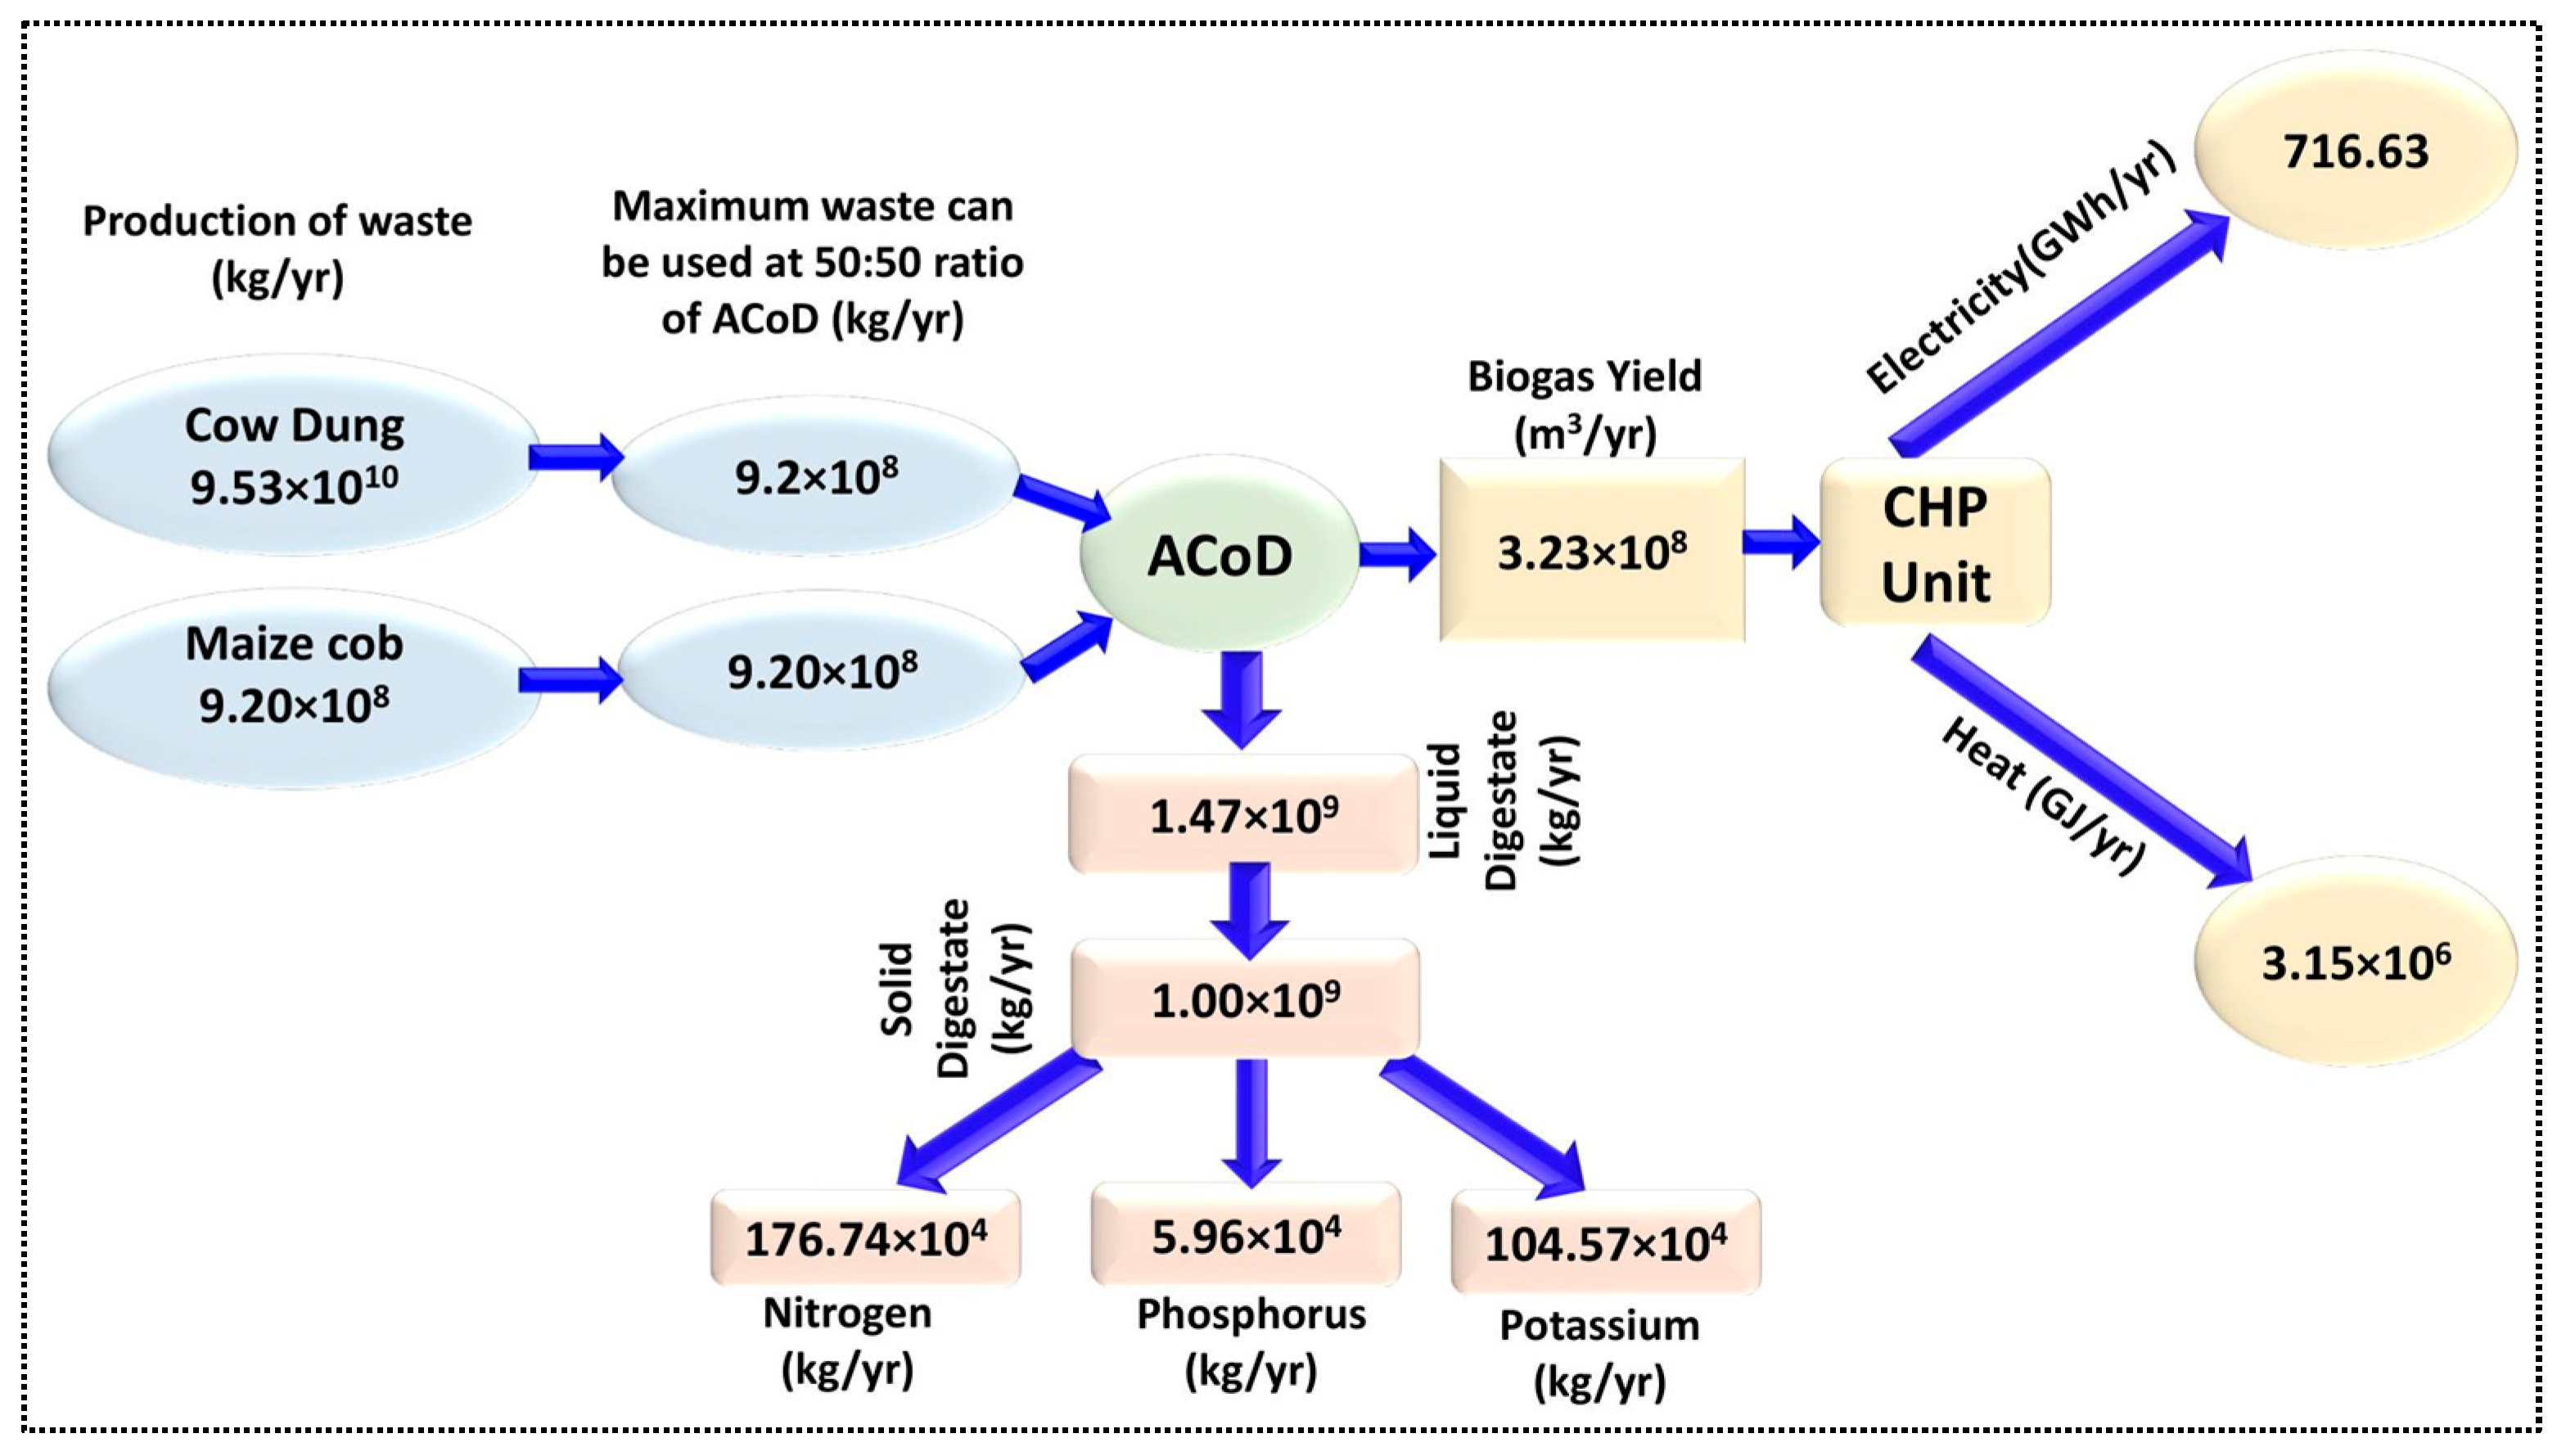
3.7. Circular Bio-Economy and Anaerobic Co-Digestion of CD and MC

Contribution of biogas and digestate produced from anaerobic co-digestion of cow dung and maize cob at optimum ratio (50:50 of CD and MC) is demonstrated in Figure 8 based on the biogas and digestate production in this batch study. Every year, use of maize cob waste and cow dung for anaerobic co-digestion could produce a high volume of biogas. Full-scale use of maize cob produced in Bangladesh with abundant cow dung produced around 3.23 × 10⁸ m3 biogas annually (Figure 8). Among various uses, this biogas could be converted into 3.15 × 10⁶ GJ heat and 716.63 GWh electricity using CHP (Combined Heat and Electricity) (Figure 8). Such vast amounts of heat could be used for heating animal farms, drying grain and storage of food product maintaining optimum temperature, and such use of heat would reduce cost of extra heat generation and may contribute to the national energy security of the country. Electricity produced from biogas may also contribute to the electricity supply chain reducing the dependence on fossil fuel sources. During co-digestion, along with biogas, around 1.00 × 10⁹ kg solid digestates are produced annually, which contain 176.74 × 10⁴, 5.96 × 10⁴, and 104.57 × 10⁴ kg nitrogen phosphorus, and potassium, respectively (Figure 8). Proper use of digestate might also reduce production and use of organic fertilizer. Use of digestate as fertilizer and electricity produced from biogas for animal farming and other purposes might decrease both crop and livestock production cost, which would ultimately define circular bio-economy with zero waste generation, as waste was converted into energy and organic fertilizer.

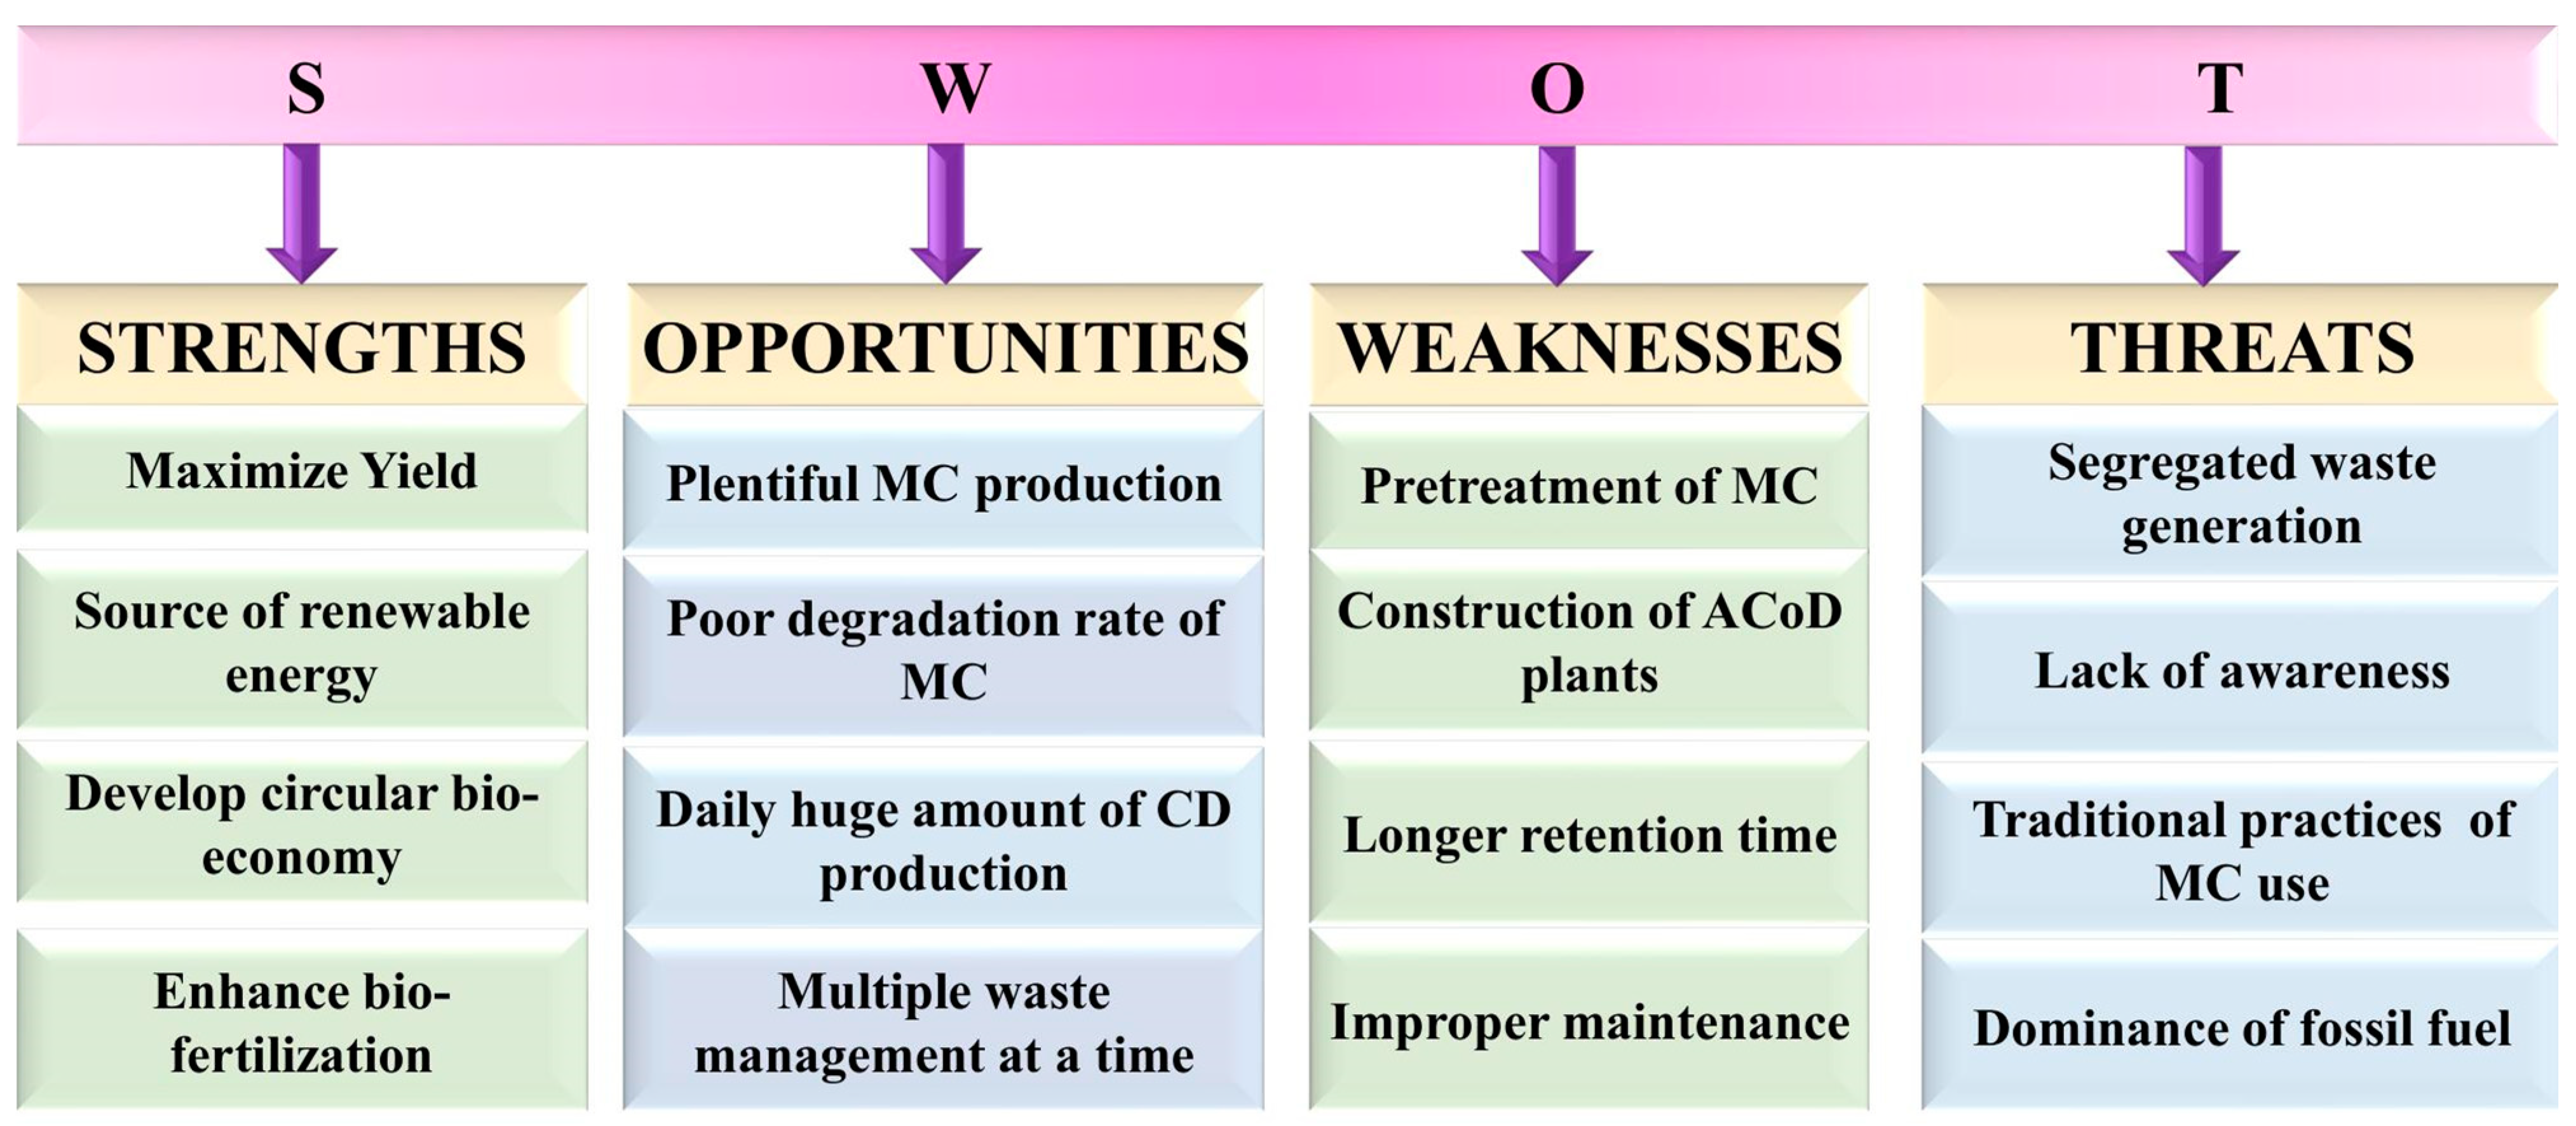
3.8. SWOT Analysis of Anaerobic Co-Digestion of CD and MC

SWOT analysis is a structured method to develop strategy of an organization to achieve its objectives considering all the factors affecting the system including strength, weakness, opportunity, and threats to achieve the goal [71]. So, SWOT analysis results of the anaerobic digestion system showed the possibility and future of implementing this system in field levels with probable risk and benefits. SWOT analysis results of ACoD of CD and MC for circular economy are demonstrated in Figure 9. Abundant production of CD and MC per year [3] was considered as the main motivation along with management of vast amounts of waste to reduce greenhouse gas emissions. Major strengths included implementation of circular bio-economy through contributing renewable energy sources by maximizing gas production (Figure 4) and providing nutrient-enriched fertilizer (Figure 7 and Figure 8). Weaknesses of ACoD of CD and MC included construction of plant, as Nsair et al. [72] reported biogas plant design considers type of substrate used as feedstock, mixing type, dry matter content, and organic loading rate. Pretreatment of substrates is another weakness of ACoD, as in this experiment, mechanical pretreatment of MC was required for faster degradation, which involves energy requirement for large-scale digestion plant. In fact, longer retention time is also required in the case of lignocellulosic waste (up to 99 days were required in this study). But, there will be a difference in all of these factors in the case of construction of a plant for ACoD instead of AD. Until now, dominance of fossil fuel is observed in Bangladesh, and Saha et al. [73] reported AD of animal manure is practiced. So, creating awareness for implementing ACoD technology at the field level is also a great threat. Moreover, the collection issue due to the segregated generation of waste over the whole country poses a threat to the successful implementation of the ACoD system. In fact, waste collection from different areas also increases the cost involved in the ACoD process. In this experiment MC was collected from Jamalpur, Bangladesh, where incineration is the traditional practice. So, incineration of MC is also a threat.

4. Conclusions

Production of gigantic agricultural waste causes faster proliferation of pollution. This batch assay on ACoD of CD and MC resulted in better gas yield in co-digestion compared to mono-digestion of substrates. Biogas production at a 50:50 ratio resulted in maximum gas yield for optimum process parameters and synergy. Kinetic modeling showed lag phase was reduced during co-digestion at a 50:50 ratio, and the logistic model was best suited with higher R2 and lower deviation between predicted and estimated biogas yield. Biogas production from co-digestion of CD with annually produced MC could result in a great contribution to electricity generation and heat production, which can be used in various sectors for human livelihood and animal farming. Digestate produced from 50:50 ratio had no significant difference than the other ratios, but its nutrient increment efficiency was higher than mono-digestion, which promoted the co-digestion at this ration. Percentage nitrogen increment was also high during co-digestion, which indicated use of digestate in nitrogen-deficit soil. Such a system of waste management may contribute in the establishment of circular bio-economy with production of renewable energy and fertilizer by converting waste to energy. Hence, co-digestion not only increased biogas production but also produced nutrient-enriched fertilizer, representing the circular bio-economic model. These results will also help policy makers in implementing the circular bio-economic model worldwide. Further research on pretreatment of maize cob may help to enhance biomethane production, and the use of biogas and digestate as fertilizer in the field will provide an idea about the extent of implementation of the circular economic system.

Author Contributions

Conceptualization, C.K.S., M.L.K. and K.K.; methodology, C.K.S., M.L.K. and J.N.; software, M.L.K.; validation, C.K.S., K.K. and M.M.A.; formal analysis, M.L.K.; investigation, C.K.S.; resources, C.K.S., K.K. and M.M.A.; data curation, M.L.K. and J.N.; writing—original draft preparation, M.L.K.; writing—review and editing, C.K.S., K.K. and M.M.A.; supervision, C.K.S.; project administration, C.K.S., K.K. and M.L.K.; funding acquisition, C.K.S., K.K. and M.M.A. All authors have read and agreed to the published version of the manuscript.

Funding

This article is derived from the Subject Data funded in whole or part by NAS and USAID under the USAID Prime Award Number AID-OAA-A-11-00012, and any opinions, findings, conclusions, or recommendations expressed in such article are those of the authors alone and do not necessarily reflect the views of USAID or NAS.

Data Availability Statement

Data can be available upon request.

Acknowledgments

The authors would like to thank NAS and USAID for funding the ReHyCaRe Project (Renewable Hydrogen Generation and Carbon Recycling from Biogenic Residue in Bangladesh) to allow this research to be undertaken. Authors would also like to express our gratitude to Bangladesh Agricultural University’s Green Energy Knowledge Hub for providing the facilities.

Conflicts of Interest

The authors declare no conflicts of interest.

References

  1. Moller, K.; Eeswaran, R.; Nejadhashemi, A.P.; Hernandez-Suarez, J.S. Livestock and Aquaculture Farming in Bangladesh: Current and Future Challenges and Opportunities. Cogent Food Agric. 2023, 9, 2241274. [Google Scholar] [CrossRef]
  2. BBS. Statistical Yearbook Bangladesh 2022. Available online: https://bbs.portal.gov.bd/sites/default/files/files/bbs.portal.gov.bd/page/b2db8758_8497_412c_a9ec_6bb299f8b3ab/2023-06-26-09-19-2edf60824b00a7114d8a51ef5d8ddbce.pdf (accessed on 3 October 2023).
  3. DLS. Livestock Economy at a Glance. 2023. Available online: https://dls.portal.gov.bd/sites/default/files/files/dls.portal.gov.bd/page/ee5f4621_fa3a_40ac_8bd9_898fb8ee4700/2023-07-23-12-04-afbcccb96f8b27d4bab6501aa8c2c2ff.pdf (accessed on 23 July 2023).
  4. Datta, A.K.; Haider, M.Z.; Ghosh, S.K. Economic Analysis of Dairy Farming in Bangladesh. Trop. Anim. Health Prod. 2019, 51, 55–64. [Google Scholar] [CrossRef] [PubMed]
  5. Rahman, M.A.; Saha, C.K.; Wahid, R.; Feng, L. Optimal Ratio for Anaerobic Co-Digestion of Poultry Droppings and Lignocellulosic-Rich Substrates for Enhanced Biogas Production. Energy Sustain. Dev. 2017, 39, 59–66. [Google Scholar] [CrossRef]
  6. Gupta, K.K.; Aneja, K.R.; Rana, D. Current Status of Cow Dung as a Bioresource for Sustainable Development. Bioresour. Bioprocess. 2016, 3, 28. [Google Scholar] [CrossRef]
  7. Mudway, I.S.; Duggan, S.T.; Venkataraman, C.; Habib, G.; Kelly, F.J.; Grigg, J. Combustion of Dried Animal Dung as Biofuel Results in the Generation of Highly Redox Active Fine Particulates. Part. Fibre Toxicol. 2005, 2, 6. [Google Scholar] [CrossRef]
  8. Cathy, M. Importance of Cow Manure Management: Environmental Challenges and Solutions. Int. Sched. J. 2023, 11, 001. [Google Scholar]
  9. Wang, K.; Yun, S.; Ke, T.; An, J.; Abbas, Y.; Liu, X. Use of bag-filter gas dust in anaerobic digestion of cattle manure for boosting the methane yield and digestate utilization. Bioresour. Technol. 2022, 348, 126729. [Google Scholar] [CrossRef]
  10. Olaoye, R.A.; Olalere, A.S.; Oluremi, J.R.; Ojoawo, S.O. Sustainable Management of Cow Dung From Slaughter Houses. LAUTECH J. Eng. Technol. 2018, 12, 36–42. [Google Scholar]
  11. Shaibur, M.R.; Husain, H.; Arpon, S.H. Utilization of Cow Dung Residues of Biogas Plant for Sustainable Development of a Rural Community. Curr. Res. Environ. Sustain. 2021, 3, 100026. [Google Scholar] [CrossRef]
  12. Onwukeme, V.I.; Etienajirhevwe, O.F.; Mokobia, E.K. Production of Biogas from Cow Dung, Weeds and Domestic Wastes. Ethiop. J. Environ. Stud. Manag. 2017, 10, 482–491. [Google Scholar] [CrossRef]
  13. Putri, D.A.; Saputro, R.R.; Budiyono, B. Production from Cow Manure. Int. J. Renew. Energy Dev. 2012, 1, 61–64. [Google Scholar] [CrossRef]
  14. Ukpai, P.A.; Nnabushi, M.N. Comparative Study of Biogas Production from Cow Dung, Cow Pea and Cassava Peeling using 45 Litres Biogas Digester. Adv. Appl. Sci. Res 2012, 3, 1864–1869. [Google Scholar]
  15. Abbas, Y.; Yun, S.; Mehmood, A.; Ali, F.; Wang, K.; Tag, E.; Al-qahtani, W.H.; Ali, S.; Bocchetta, P. Chemosphere Co-digestion of Cow Manure and Food Waste for Biogas Enhancement and Nutrients Revival in Bio-Circular Economy. Chemosphere 2023, 311, 137018. [Google Scholar] [CrossRef] [PubMed]
  16. Yun, S.; Xing, T.; Wang, Y.; Chen, R.; Han, F.; Zhang, C.; Zou, M. Mineral Residue Accelerant-Enhanced Anaerobic Digestion of Cow Manure: An Evaluation System of Comprehensive Performance. Sci. Total Environ. 2023, 858, 159840. [Google Scholar] [CrossRef] [PubMed]
  17. Abbas, Y.; Yun, S.; Wang, Z.; Zhang, Y.; Zhang, X.; Wang, K. Recent Advances in Bio-Based Carbon Materials for Anaerobic Digestion: A Review. Renew. Sustain. Energy Rev. 2021, 135, 110378. [Google Scholar] [CrossRef]
  18. Li, B.; Yun, S.; Xing, T.; Wang, K.; Ke, T.; An, J. A Strategy for Understanding the Enhanced Anaerobic Co-Digestion via Dual-Heteroatom Doped Bio-Based Carbon and Its Functional Groups. Chem. Eng. J. 2021, 425, 130473. [Google Scholar] [CrossRef]
  19. Xing, T.; Yun, S.; Li, B.; Wang, K.; Chen, J.; Jia, B.; Ke, T.; An, J. Coconut-Shell-Derived Bio-Based Carbon Enhanced Microbial Electrolysis Cells for Upgrading Anaerobic Co-Digestion of Cow Manure and Aloe Peel Waste. Bioresour. Technol. 2021, 338, 125520. [Google Scholar] [CrossRef]
  20. Liu, L.; Yun, S.; Ke, T.; Wang, K.; An, J.; Liu, J. Dual Utilization of Aloe Peel: Aloe Peel-Derived Carbon Quantum Dots Enhanced Anaerobic Co-Digestion of Aloe Peel. Waste Manag. 2023, 159, 163–173. [Google Scholar] [CrossRef]
  21. Liu, L.; Yun, S.; Wang, K.; Ke, T.; Liu, J.; Gao, Y.; Zhang, X. Enhanced Anaerobic Co-Digestion under a Magnetic Field by a Synergistic Host–Guest Strategy: Focusing on Accelerant, Biogas Yield, Fertilization and Coupled Effect. Chem. Eng. J. 2023, 476, 146508. [Google Scholar] [CrossRef]
  22. Huang, X.; Yun, S.; Zhu, J.; Du, T.; Zhang, C.; Li, X. Mesophilic Anaerobic Co-Digestion of Aloe Peel Waste with Dairy Manure in the Batch Digester: Focusing on Mixing Ratios and Digestate Stability. Bioresour. Technol. 2016, 218, 62–68. [Google Scholar] [CrossRef]
  23. Rabii, A.; Aldin, S.; Dahman, Y.; Elbeshbishy, E. A Review on Anaerobic Co-Digestion with a Focus on the Microbial Populations and the Effect of Multi-stage Digester Configuration. Energies 2019, 12, 1106. [Google Scholar] [CrossRef]
  24. Khatun, M.L.; Nime, J.; Nandi, R.; Alam, M.M.; Saha, C.K. Co-digestion of Poultry Droppings and Banana Waste for Maximizing Biogas Production in Bangladesh. Fuel 2023, 346, 128346. [Google Scholar] [CrossRef]
  25. Rahman, M.A.; Møller, H.B.; Saha, C.K.; Alam, M.M.; Wahid, R.; Feng, L. Anaerobic Co-Digestion of Poultry Droppings and Briquetted Wheat Straw at Mesophilic and Thermophilic Conditions: Influence of Alkali Pretreatment. Renew. Energy 2018, 128, 241–249. [Google Scholar] [CrossRef]
  26. Hamzah, A.F.A.; Hamzah, M.H.; Mazlan, F.N.A.; Jamali, N.S.; Siajam, S.I.; Man, H.C. Anaerobic Co-digestion of Pineapple Wastes with Cow Dung: Effect of Different Total Solid Content on Bio- methane Yield. Adv. Agric. Food Res. J. 2020, 1, a0000109. [Google Scholar] [CrossRef]
  27. Kumar, V.; Khayum, N.; Sivalingam, M.; Subramanian, A. Biogas Production from Anaerobic Co-Digestion of Cow Dung and Waste Leaf and Its Purification. In Proceedings of the National Conference on Waste to Energy Carbon Capture and Storage (NCWECCS-17), Rourkela, India, 3–5 August 2017; Available online: https://www.researchgate.net/publication/324182575_Biogas_Production_from_Anaerobic_Co-Digestion_of_Cow_Dung_and_Waste_Leaf_and_Its_Purification (accessed on 4 April 2018).
  28. Haryanto, A.; Hasanudin, U.; Afrian, C.; Zulkarnaen, I. Biogas Production from Anaerobic Codigestion of Cowdung and Elephant Grass (Pennisetum purpureum) Using Batch Digester. IOP Conf. Ser. Earth Environ. Sci. 2018, 141, 012011. [Google Scholar] [CrossRef]
  29. Hilmi, N.A.M.; Zakarya1, I.A.; Gunny, A.A.N.; Izhar, T.N.T.; Zaaba, S.K.; Samah, M.F.; Daud, Z.A.A.M.; Beson, M.R.C. Co-digestion of Food Waste with Cow Dung by Anaerobic Digestion for Biogas Production. In Proceedings of the IOP Conference Series: Earth and Environmental Science, International Conference on Civil and Environmental Engineering, Penang, Malaysia, 29–30 August 2022. [Google Scholar] [CrossRef]
  30. Khan, S.I.; Aftab, S.; Chaudhry, T.A.; Younis, M.N. Production of Biogas by the Co-Digestion of Cow Dung and Crop Residue at University of the Punjab, Lahore, Pakistan. Afr. J. Environ. Sci. Technol. 2018, 12, 91–95. [Google Scholar] [CrossRef]
  31. Tasnim, F.; Iqbal, S.A.; Chowdhury, A.R. Biogas Production from Anaerobic Co-Digestion of Cow Manure with Kitchen Waste and Water Hyacinth. Renew. Energy 2017, 109, 434–439. [Google Scholar] [CrossRef]
  32. Mahbubul, I.M.; Himan, M. Prospects of Bioethanol from Agricultural Residues in Bangladesh. Energies 2023, 16, 4657. [Google Scholar] [CrossRef]
  33. Surra, E.; Bernardo, M.; Lapa, N.; Esteves, I.A.A.C.; Fonseca, I.; Mota, J.P.B. Biomethane Production Through Anaerobic Co-Digestion with Maize Cob Waste Based on a Biorefinery Concept: A Review. J. Environ. Manag. 2019, 249, 109351. [Google Scholar] [CrossRef]
  34. Jivini, Z.S.; Ikwebe, J.; Abah, M.A.; Okoli, E.C.; Habibu, B.; Saaku, A.S. Biochemical Generation of Biogas from Corn Cobs using Cow Dung as a Source of Microbial Catalyst. Glob. Sci. J. 2021, 9, 1875–1879. [Google Scholar]
  35. Chojnacka, K.; Moustakas, K.; Witek-Krowiak, A. Bio-based Fertilizers: A Practical Approach towards Circular Economy. Bioresour. Technol. 2020, 295, 122223. [Google Scholar] [CrossRef] [PubMed]
  36. Abdoli, M.A.; Amiri, L.; Baghvand, A.; Nasiri, J.; Madadian, E. Methane Production from Anaerobic Co-Digestion of Maize and Cow Dung. Environ. Prog. Sustain. Energy 2014, 33, 597–601. [Google Scholar] [CrossRef]
  37. Adebayo, A.O.; Jekayinfa, S.O.; Linke, B. Effect of Co-Digestion on Biogas Production—A Case Study of Cow Slurry with Maize Cob. In Proceedings of the American Society of Agricultural and Biological Engineers Annual International Meeting 2012, Dallas, TX, USA, 29 July–1 August 2012; pp. 3890–3906. [Google Scholar] [CrossRef]
  38. Adbeayo, A.O.; Jekayinfa, S.O.; Linke, B. Effect of Co-Digestion on Anaerobic Digestion of Cattle Slurry with Maize Cob at Mesophilic Temperature. J. Energy Technol. Policy 2013, 3, 47–55. [Google Scholar]
  39. Tiong, J.S.M.; Chan, Y.J.; Lim, J.W.; Mohamad, M.; Ho, C.D.; Ur Rahmah, A.; Kiatkittipong, W.; Sriseubsai, W.; Kumakiri, I. Simulation and Optimization of Anaerobic Co-digestion of Food Waste with Palm Oil Mill Effluent for Biogas Production. Sustainability 2021, 13, 13665. [Google Scholar] [CrossRef]
  40. APHA. Standard Methods for the Examination of Water and Wastewater, 23rd ed.; American Public Health Association: Washington, DC, USA, 2017. [Google Scholar]
  41. Bremner, J.M.; Mulvaney, C.S. Nitrogen-Total. In Methods of Soil Analysis, Part 2; American Society of Agronomy Inc.: Madison, WI, USA, 1982; pp. 595–622. [Google Scholar]
  42. Page, A.L.; Miller, R.H.; Keeney, D.R. Methods of Soil Analysis, Part 11; American Society of Agronomy Inc.: Madison, WI, USA, 1982. [Google Scholar]
  43. Ghosh, A.B.; Bajaj, J.C.; Hasan, R.; Singh, D. Soil and Water Testing Method: A Laboratory Manual; Division of Soil Science and Agricultural Chemisiry, IARI: New Delhi, India, 1983; pp. 221–226. [Google Scholar]
  44. Nandi, R.; Saha, C.K.; Sarker, S.; Huda, M.S.; Alam, M.M. Optimization of Reactor Temperature for Continuous Anaerobic Digestion of Cow Manure: Bangladesh Perspective. Sustainability 2020, 12, 8772. [Google Scholar] [CrossRef]
  45. Deepanraj, B.; Sivasubramanian, V.; Jayaraj, S. Experimental and Kinetic Study on Anaerobic Digestion of Food Waste: The Effect of Total Solids and pH. J. Renew. Sustain. Energy 2015, 7, 063104. [Google Scholar] [CrossRef]
  46. Zhang, H.; An, D.; Cao, Y.; Tian, Y.; He, J. Modeling the Methane Production Kinetics of Anaerobic Co-Digestion of Agricultural Wastes Using Sigmoidal Functions. Energies 2021, 14, 258. [Google Scholar] [CrossRef]
  47. Wang, K.; Yun, S.; Xing, T.; Li, B.; Abbas, Y.; Liu, X. Binary and ternary trace elements to enhance anaerobic digestion of cattle manure: Focusing on kinetic models for biogas production and digestate utilization. Bioresour. Technol. 2021, 323, 124571. [Google Scholar] [CrossRef]
  48. Rahman, M.A.; Møller, H.B.; Alam, M.M. Assessing the Energy Potential of Agricultural Residues and an Approach to Meet the Rural Energy Demand: The Bangladesh Perspective. Biomass Convers. Biorefinery 2018, 8, 925–934. [Google Scholar] [CrossRef]
  49. Akhter, T.; Ashraf, M.A.; Hassan, M.M.; Akhter, F.; Riza, A.N. Agricultural Waste Management Practices in Trishal Upazilla, Mymensingh. Res. Agric. Livest. Fish. 2016, 3, 395–402. [Google Scholar] [CrossRef]
  50. Wu, B.; Zhang, X.; Shang, D.; Bao, D.; Zhang, S.; Zheng, T. Energetic-environmental-economic assessment of the biogas system with three utilization pathways: Combined heat and power, biomethane and fuel cell. Bioresour. Technol. 2016, 214, 722–728. [Google Scholar] [CrossRef] [PubMed]
  51. Suhartini, S.; Lestari, Y.P.; Nurika, I. Estimation of methane and electricity potential from canteen food waste. IOP Conf. Ser. Earth Environ. Sci. 2019, 230, 012075. [Google Scholar] [CrossRef]
  52. Berber-Villamar, N.K.; Netzahuatl-Muñoz, A.R.; Morales-Barrera, L.; Chávez-Camarillo, G.M.; Flores-Ortiz, C.M.; Cristiani-Urbina, E. CornCob as an Effective, Eco-Friendly, and Economic Biosorbent for Removing the Azo Dye Direct Yellow 27 from Aqueous Solutions. PLoS ONE 2018, 13, e0196428. [Google Scholar] [CrossRef] [PubMed]
  53. Okewale, A.O.; Babayemi, K.A.; Adesina, O. Biogas Production from Anaerobic Co–Digestion of Corn Cobs, Pig and Poultry Droppings. J. Eng. Res. Dev. 2018, 1, 273–282. [Google Scholar]
  54. TG, I.; Haq, I.; Kalamdhad, A.S. 14—Factors affecting anaerobic digestion for biogas production: A review. In Advanced Organic Waste Management: Sustainable Practices and Approaches; Elsevier: Amsterdam, The Netherlands, 2022; pp. 223–233. ISBN 978-0-323-85792-5. [Google Scholar] [CrossRef]
  55. Maramba, F.D. Biogas and Waste Recycling—The Phillipine Experience; Maya Farms Division, Liberty Flour Mills: Manila, Phillipines, 1978; p. 43. [Google Scholar]
  56. Budiyono, I.S.; Sumardiono, S. Kinetic model of biogas yield production from vinasse at various initial pH: Comparison between modified gompertz model and first order kinetic model. Res. J. Appl. Sci. Eng. Technol. 2014, 13, 2798–2805. [Google Scholar] [CrossRef]
  57. Guarino, G.; Carotenuto, C.; Di Cristofaro, F.; Papa, S.; Morrone, B.; Minale, M. Does the C/N Ratio Really Affect the Bio-Methane Yield? A Three Years Investigation of Buffalo Manure Digestion. Chem. Eng. Trans. 2016, 49, 463–468. [Google Scholar] [CrossRef]
  58. Czekała, W.; Nowak, M.; Bojarski, W. Characteristics of Substrates Used for Biogas Production in Terms of Water Content. Fermentation 2023, 9, 449. [Google Scholar] [CrossRef]
  59. Fagerstrom, A.; Al Seadi, T.; Rasi, S.; Briseid, T. The Role of Anaerobic Digestion and Biogas in the Circular Economy; IEA Bioenergy Task 37; IEA Bioenergy: Paris, France, 2018; Available online: https://www.ieabioenergy.com/wp-content/uploads/2018/08/anaerobic-digestion_web_END.pdf (accessed on August 2018).
  60. Kavuma, C. Variation of Methane and Carbon Dioxide Yield in a Biogas Plant. Master’s Thesis, Department of Energy Technology, KTH Royal Institute of Technology, Stockholm, Sweden, 2013; pp. 1–46. Available online: http://www.diva-portal.org/smash/get/diva2:604559/FULLTEXT02 (accessed on 29 January 2013).
  61. Shah, T.A.; Tabassum, R. Enhancing Biogas Production from Lime Soaked Corn Cob Residue. Int. J. Renew. Energy Res. 2018, 8, 761–766. [Google Scholar] [CrossRef]
  62. Li, Y.; Achinas, S.; Zhao, J.; Geurkink, B.; Krooneman, J.; Euverink, G.J.W. Co-digestion of Cow and Sheep Manure: Performance Evaluation and Relative Microbial Activity. Renew. Energy 2020, 153, 553–563. [Google Scholar] [CrossRef]
  63. Orhorhoro, E.K.; Ebunilo, P.O.; Sadjere, G.E. Experimental Determination of Effect of Total Solid (TS) and Volatile Solid (VS) on Biogas Yield. Am. J. Mod. Energy 2017, 3, 131–135. [Google Scholar] [CrossRef]
  64. Raposo, F.; Fernández-Cegrí, V.; de la Rubia, M.A.; Borja, R.; Béline, F.; Cavinato, C.; Demirer, G.; Fernández, B.; Fernández-Polanco, M.; Frigon, J.C.; et al. Biochemical Methane Potential (BMP) of Solid Organic Substrates: Evaluation of Anaerobic Biodegradability Using Data from an International Interlaboratory Study. J. Chem. Technol. Biotechnol. 2011, 86, 1088–1098. [Google Scholar] [CrossRef]
  65. Möller, K.; Müller, T. Effects of Anaerobic Digestion on Digestate Nutrient Availability and Crop Growth: A Review. Eng. Life Sci. 2012, 12, 242–257. [Google Scholar] [CrossRef]
  66. Edith, K.-K.N.; Francis, K.Y.; Martin, K.K.; Felix, K.K. Characterization of Digestates from Anaerobic Co-Digestion of Manioc Effluent, Human Urine and Cow Dung. J. Water Resour. Prot. 2019, 11, 777–788. [Google Scholar] [CrossRef]
  67. Zhang, C.; Yun, S.; Li, X.; Wang, Z.; Xu, H.; Du, T. Low-Cost Composited Accelerants for Anaerobic Digestion of Dairy Manure: Focusing on Methane Yield, Digestate Utilization and Energy Evaluation. Bioresour. Technol. 2018, 263, 517–524. [Google Scholar] [CrossRef] [PubMed]
  68. Xu, H.; Yun, S.; Wang, C.; Wang, Z.; Han, F.; Jia, B.; Chen, J.; Li, B. Improving Performance and Phosphorus Content of Anaerobic Co-Digestion of Dairy Manure with Aloe Peel Waste Using Vermiculite. Bioresour. Technol. 2020, 301, 122753. [Google Scholar] [CrossRef] [PubMed]
  69. Yun, S.; Fang, W.; Du, T.; Hu, X.; Huang, X.; Li, X.; Zhang, C.; Lund, P.D. Use of Bio-Based Carbon Materials for Improving Biogas Yield and Digestate Stability. Energy 2018, 164, 898–909. [Google Scholar] [CrossRef]
  70. Yun, S.; Zhang, C.; Wang, Y.; Zhu, J.; Huang, X.; Du, T.; Li, X.; Wei, Y. Synergistic Effects of Fe Salts and Composite Additives on Anaerobic Digestion of Dairy Manure. Int. Biodeterior. Biodegrad. 2019, 136, 82–90. [Google Scholar] [CrossRef]
  71. Taherdoost, H.; Madanchian, M. Determination of Business Strategies Using SWOT Analysis; Planning and Managing the Organizational Resources to Enhance Growth and Profitability. Macro Manag. Public Policies 2021, 3, 19–22. [Google Scholar] [CrossRef]
  72. Nsair, A.; Cinar, S.O.; Alassali, A.; Qdais, H.A.; Kuchta, K. Operational Parameters of Biogas Plants: A Review and Evaluation Study. Energies 2020, 13, 3761. [Google Scholar] [CrossRef]
  73. Saha, C.K.; Nandi, R.; Rahman, M.A.; Alam, M.M.; Møller, H.B. Biogas Technology in Commercial Poultry and Dairy Farms of Bangladesh: Present Scenario and Future Prospect. Biomass Convers. Biorefin. 2022. [Google Scholar] [CrossRef]
Figure 1. Circularity of anaerobic co-digestion system on cow dung and maize cob.
Sustainability 16 00104 g001
Figure 2. Composition of biogas (a) methane, (b) carbon dioxide, and (c) hydrogen sulphide.
Sustainability 16 00104 g002
Figure 3. Daily (a) biogas and (b) methane yield during ACoD of CD and MC.
Sustainability 16 00104 g003
Figure 4. Cumulative (a) biogas and (b) methane yield during ACoD of CD and MC.
Sustainability 16 00104 g004
Figure 5. Plots of measured and predicted cumulative methane yields of CD:MC: (a) 100:0, (b) 90:10, (c) 70:30, (d) 50:50, (e) 30:70, (f) 10:90, and (g) 0:100.
Sustainability 16 00104 g005
Figure 6. Nutrient contents of feedstock and digestate of (a) N, (b) P, and (c) K.
Sustainability 16 00104 g006
Figure 7. Total nutrient content after digestion at different mixing ratios of CD and MC.
Sustainability 16 00104 g007
Figure 8. Energy and nutrient production from optimum ratio of CD and MC.
Sustainability 16 00104 g008
Figure 9. SWOT analysis of using ACoD of CD and MC for circular bio-economy.
Sustainability 16 00104 g009
Table 1. Characteristics of raw substrates and feedstock.
Characteristics of raw substrates
SubstratespHTS (%)VSwb (%)Ash (%)TAN (g/L)N (%)C/N
CD7.59 ± 0.0213.45 ± 0.3711.30 ± 0.3115.98 ± 0.054.15 ± 01.4932.15 ± 0.92
MC6.55 ± 0.0487.77 ± 1.4283.16 ± 1.295.26 ± 1.240.68 ± 01.2642.72 ± 0.64
Inoculum7.29 ± 0.027.01 ± 0.294.85 ± 0.1530.83 ± 0.162.18 ± 0.011.2631.19 ± 0.93
Characteristics of feedstock
Mixing RatiopHTS (%)VSwb (%)Ash (%)TAN (g/L)N (%)C/N
CD:MC100:07.41 ± 0.059.07 ± 0.156.75 ± 0.302.32 ± 0.152.75 ± 0.021.32831.83 ± 0.94
90:107.34 ± 0.048.65 ± 0.346.56 ± 0.222.09 ± 0.122.65 ± 0.011.30033.13 ± 0.22
70:307.28 ± 0.079.10 ± 0.147.42 ± 0.081.68 ± 0.052.33 ± 0.031.28036.18 ± 0.19
50:507.32 ± 0.039.24 ± 0.057.74 ± 0.041.51 ± 0.011.98 ± 0.021.27037.44 ± 0.03
30:707.24 ± 0.0610.00 ± 168.62 ± 0.041.38 ± 0.021.83 ± 0.011.26538.71 ± 0.02
10:907.24 ± 0.0311.22 ± 0.039.92 ± 0.011.30 ± 0.011.88 ± 0.031.26139.84 ± 0.05
0:1007.20 ± 0.0710.68 ± 0.069.02 ± 0.111.65 ± 0.052.08 ± 0.021.26038.10 ± 0.29
Table 2. Characteristics of digestate.
Mixing RatiopHTS (%)VSwb (%)Ash (%)TAN (g/L)N (%)C/N
CD:MC100:0±6.92 ± 037.22 ± 0.475.42 ± 0.471.80 ± 0.162.13 ± 0.021.7124.96 ± 0.81
90:10±6.83 ± 0.086.30 ± 0.214.84 ± 0.171.46 ± 0.061.98 ± 0.011.4829.40 ± 0.25
70:30±6.73 ± 0.056.41 ± 0.194.93 ± 0.161.48 ± 0.061.75 ± 0.021.6226.90 ± 0.24
50:50±6.80 ± 0.066.82 ± 0.295.48 ± 0.0.281.33 ± 0.041.60 ± 0.031.7625.91 ± 0.23
30:70±6.86 ± 0.077.14 ± 7.145.74 ± 0.281.39 ± 0.021.78 ± 0.011.0941.86 ± 0.16
10:90±6.91 ± 0.047.86 ± 0.157.42 ± 0.241.47 ± 0.081.73 ± 0.021.5729.46 ± 0.45
0:100±6.87 ± 0.056.26 ± 0.364.94 ± 0.371.31 ± 0.021.78 ± 0.031.6227.63 ± 0.47
Table 3. Parameters from different kinetic modeling.
Name of Kinetic ModelParameters100:090:1070:3050:5030:7010:900:100
First-Order ModelBo100.00229.00200.10316.50177.80195.50602.40
K0.010.010.010.010.010.010.00
R20.940.970.960.980.930.960.99
RMSE6.427.799.339.9413.668.495.25
Cone ModelBo200.00186.20239.90265.40198.60391.40259.20
K0.010.020.010.020.020.010.01
n1.311.541.521.471.920.941.42
R20.980.980.990.980.990.960.99
RMSE3.536.843.968.852.638.704.02
Modified Gompertz ModelBo112.50142.50155.30196.10156.80145.40158.90
Rmax0.902.091.832.792.121.501.89
λ6.853.928.373.4511.87−3.536.76
R20.980.980.990.980.990.940.99
RMSE3.746.844.369.452.6410.075.25
Logistic ModelBo90.26133.60138.30183.90141.60134.70143.10
Rmax0.972.151.962.842.291.491.99
λ11.116.0411.995.3315.40−2.2210.02
R20.980.980.990.970.990.930.98
RMSE4.287.715.6611.044.5511.036.92
Disclaimer/Publisher’s Note: The statements, opinions and data contained in all publications are solely those of the individual author(s) and contributor(s) and not of MDPI and/or the editor(s). MDPI and/or the editor(s) disclaim responsibility for any injury to people or property resulting from any ideas, methods, instructions or products referred to in the content.

