Article

Plastic Management and Sustainability: A Data-Driven Study

Martin Tuchman School of Management, New Jersey Institute of Technology, Newark, NJ 07102, USA
*
Author to whom correspondence should be addressed.
Sustainability 2023, 15(9), 7181; https://doi.org/10.3390/su15097181
Submission received: 22 December 2022 / Revised: 22 February 2023 / Accepted: 18 April 2023 / Published: 25 April 2023
(This article belongs to the Special Issue Sustainable Innovation in Logistics and Supply Chain Management)

Abstract

:
The world is experiencing a rapidly increasing plastic production and consumption trend. The exacerbating plastic crisis has attracted various initiatives and actions across numerous organizations to foster stakeholder collaboration. In particular, academic researchers have paid considerable attention to the inherent supply chain sustainability. This study aims to (1) examine the status quo of plastic management research and provide recommendations and directions gleaned from the literature survey using text mining; and (2) perform descriptive and predictive analysis based on datasets collected from governmental, public, private, and not-for-profit institutions in the United States between 2016 and 2021 to quantify the size and severity of the crisis on various levels. Echoing the same global plastic production trend, our study reveals that the plastic debris that ends up in the ocean is growing exponentially, and global plastic production is expected to fluctuate between 500 and 600 million metric tons by 2025. From a research perspective, there is a remarkable shortage of publications empowering Blockchain technology (BCT) to address the plastic crisis. Little research is related to scaling up the plastic waste collection and re-thinking or re-designing products. There is no significant connection between ‘re-purpose’ and ‘innovation’. The industry and not-for-profit organizations are typically the forerunners of the campaign compared to academia in terms of investigating the adoption of technology to address the plastic crisis. This study features rich data-driven results and interpretation.

1. Introduction

Over the past 70 years, plastic has become a fundamental and essential component across various industries. Plastic consumption is increasing, as well as plastic waste. As a result, plastic has been classified as a type of supply chain disruption [1]. Mismanaging plastic and plastic waste poses various negative consequences jeopardizing the whole planet. In particular, plastics could contaminate food [2], kill animals [3], impose health threats, increase CO2 emissions [4], contaminate marine areas and rivers [5,6,7], cause pollution [8,9], and much more. In addition, plastic remains are often found in the soil, atmosphere, animal biomass [10], sea salt [11], and food and beverages [5]. The low density of plastics (compared to dust) leads to long-span transportation [12,13]. For instance, Kim et al. investigated 39 table salt brands across 16 countries, including the United States (U.S.), to measure the number of microplastics found per kilogram of salt and found 300 particles/kg in sea salt brands produced in the west coast of the U.S. At the same time, the highest number of microplastic particles/kg was found in Senegal’s, Thailand’s, and Himalayan salt [14]. Furthermore, hundreds of marine species either ingest or become entangled in marine debris microplastics [15,16].
Plastic that fits the purpose it is developed for while minimizing the amount of waste generated is considered ‘sustainable plastic’ [17]. In principle, plastic waste is categorized into ‘meso-plastic’ [18], ‘macro-plastic’, ‘micro-plastic’ [19], and ‘nano-plastic’ [20]. Micro-plastic is defined as fragments of plastic < 5 mm. Micro-beads are a type of microplastic that are very tiny and primarily used in personal care, health, and beauty products [21]. The U.S. banned microbeads in 2015 [19], but still, the U.S. is one of the top countries producing, consuming, and mismanaging plastics (www.epa.gov, accessed on 15 October 2022; www.mckinsey.com, accessed on 3 August 2022) [22,23,24,25,26]. Carpenter et al. were among the first researchers to point out the deleterious impact of the increased plastic production on the oceanic organisms in the sea [21].
In terms of chemical components, plastics are mainly carbon, with various carbon levels based on the polymer types [12]. Macro-plastics may break down into smaller pieces (e.g., microplastics and nano-plastics). Microplastic degradation into the environment is still poorly understood or not well documented [27]. Until recently, Liang et al. highlighted how the fates and destinations of river-borne microplastics are related to the rising growth of microplastics in the marine environment (such as the beaches across the U.S. coast) from the modeling perspective [13]. In addition, DiBenedetto et al. also demonstrated the importance of the rising speed of microplastics in their vertical distribution in the water column, which depends on the density of microplastics, from the laboratory perspective [27].
The life cycle of plastics includes production, use, recycling, incineration, landfill, marine litter, or global waste trade [28]. The value chain of plastic typically starts with the production of ‘virgin’ resin from hydrocarbon feedstocks (i.e., oil and natural gas liquids) that is processed and formed into plastic pellets. Then, these pellets are converted into containers or packages (e.g., bottles, boxes, jugs, film, bags, tubs, etc.). Sequentially, these packages are used to pack products and transport/deliver them to consumers. After products are consumed, plastic is collected for recycling, incineration, or landfill disposal. The majority of the prevailing recycling operations are mechanical recycling. However, chemical recycling is more promising than mechanical recycling, as the latter downgrades the polymers and may not be recyclable after a couple of recycling rounds [29].
Two trending terms put under the spotlight in recent years and closely tied to supply chain sustainability are ‘circular economy (CE)’ and ‘closed loops’. The CE is an economic system that endeavors to extend the lifetime of products by keeping them in use, recovering materials across the production, distribution, and consumption processes, and regenerating natural/renewable resources [30,31,32]. At the same time, closed loops refer to the processes for waste collection and control to be re-used or refurbished in a product the same way it was used initially (i.e., electronics parts) [25]. Therefore, the CE considers economic growth and is more comprehensive in scope than the closed loop [32,33]. For instance, Stubbins et al. developed a model to reflect the plastic–carbon cycle, representing the annual flow of plastic fluxes and stocks across the land, air [12], and ocean [12,13].

2. Literature Review

There is no doubt that plastic imposes detrimental risks on various layers and levels, yet the majority still depend on plastic due to its convenience, resistance, transparency, and lightweightness [34]. Stubbins et al. studied plastics’ distribution, transportation, and fates within and across the Earth system to widen the understanding of plastics [12]. The developed data-driven model Plastic-to-Ocean (P2O) evaluates five scenarios of micro-plastic flow on the global level between 2016 and 2040 to determine the effectiveness of five scenarios concerning the annual plastic waste rate entering the environment. The five scenarios are ‘business as usual’, ‘collect and dispose’, ‘recycling’, ‘reduce and substitute’, and ‘system change’. The scenarios were examined through 300 Monte Carlo simulations, assuming the global targets to tackle the crisis were achieved. The best results were attained in the ‘system change’ (i.e., new delivery model, ‘plastic-to-fuel’, and ‘plastic-to-plastic’ chemical conversion, incineration), followed by ‘reduce and substitute’ and ‘collect and dispose’ [10]. An experiment based on 216 microplastic particles traced found the two main mechanisms that control the flow of microplastics at the ocean surface are particle buoyancy and water friction velocity [27].
Even though 52–60% of the annually produced plastic is recyclable [35], only a tiny proportion of plastics is recycled. For example, 18–28% of recyclable plastic in Thailand, the Philippines, and Malaysia is recycled [36]. Unfortunately, most of the non-recycled plastic ends up being dumped in landfill or the ocean [35]. Vora et al. analyzed the circumstances under which ‘polydiketoenamine’ resins would outperform polymers in terms of cost, greenhouse gas (GHG) emission, and life cycle [29].
Although a one-size-for-all solution does not exist to tackle the plastic crisis, multiple solutions are needed in parallel on various levels to address the crisis efficiently and effectively [37]. Accelerating innovations across the value chains is crucial to tackling the plastic problem [10]. Creating an innovative value chain ecosystem involves suppliers, manufacturers, logistics providers, distributors, retailers, end-users, and governmental and non-governmental agencies, especially in developing economies [38]. A transparent global evidence-based measurable strategy to reduce plastic pollution does not exist yet [10]. Organizations need to adopt and leverage Industry 4.0 technologies to ensure environmental sustainability [39]. An expert group set by one of the largest German Engineering Societies (VDI) (www.vdi.de/eng/home; www.carbios.com, accessed on 10 November 2022) found that technology and data are not appropriately utilized. They propose that Industry 4.0 has the potential to foster the ‘servicification’ of products and ‘platformization’ toward a wasteless future [25]. Based on a recent survey with 3057 participants from global organizations, 60% of the surveyed firms confirmed having a sustainability strategy; some of the top issues that need to be investigated are the dearth of consumer interest and demand toward sustainable products, the short-term thinking of organizations, and measuring the impact and effect of sustainability [40].
Another study [7] investigated the status of the global plastic waste trade over 30 years in 40 countries to unravel the trend, specifically after (1) the changes in regulations and policies across various countries related to plastic waste, in addition to (2) the decrease in the interests of plastic waste trade. They found that the import center was shifted from China to Southeast Asia, followed by Africa. The top countries the U.S. exports its plastic scrap to are Canada, Malaysia, Mexico, and Vietnam. Sun et al. designed a cooperation model to evaluate policies in the Southern China Sea Region and to what extent the clean-up system enables cooperation [41]. Re-designing plastics to be traceable by BCT is a suggestion toward a CE [42]. Experiments have been run in a research center in Indonesia to find microbes that can munch and eat plastic to be used to tackle the overwhelming plastic waste [43]. Meanwhile, in Japan, enzymes were found in mud near a plastic recycling factory with an appetite for Polyethylene terephthalate (PET) [44]. Carbios is a French recycling factory that creates enzymes to biologically recycle PET despite its color used in packaging, textiles, and fibers (www.vdi.de/eng/home, accessed 1 December 2022).

3. Problem Statement

Plastic pollution is a critical crisis threatening the whole planet disastrously (specifically in the U.S.). The U.S. is a leading country exporting plastic [45]. In addition, the U.S. is ranked first in terms of the annual average plastic waste per capita, estimated to be around 231 lbs [25]. Following the same production and consumption pattern, plastic waste (specifically that ends up in the ocean) will triple by the year 2040 [46]. On top of all these facts, plastic production is expected to increase by 70% by 2050 [43]. Based on data collected from the U.S. State Department between 2016 and 2021, marine debris items are following an exponential distribution. In addition, more than 80% of the plastic that ends up in the ocean is from mismanaged municipal solid waste [31].

4. Objectives, Novelty, and Contributions of the Study

It is challenging to manage a problem when no sufficient or up-to-date analysis exists for a data-driven decision [29]. Accordingly, the objective of this study is to use the data collected from the U.S. State Department between 2016 and 2021, in addition to the thousands of abstracts collected about the topic from the Scopus database, to (1) quantify and describe the status of the plastic crisis from production and waste perspectives; (2) extend on the analysis done by [26,36,46] using recently collected data to provide up-to-date insights for policymakers and practitioners; and (3) analyze and summarize the status of the literature using text mining and clustering techniques to support the academic community in investigating and tackling the research gaps related to plastic management. The novelty of this study is evaluating the status of the plastic management research area. To the best of our knowledge, most studies evaluate the plastic crisis from environmental or social perspectives, while we investigate the status of research from environmental, technological, and business perspectives. The significance of this study relies on the analysis performed on the recently collected data. Many recent studies published over the past two years are based on data that goes back to 2015, 2012, and even earlier. That may not enable researchers to build or replicate it if no data covers the range of years in between. In that capacity, this study provides analysis based on more recent data to provide a recent view of researchers and scientists to help support the field of plastic management research.

5. Research Questions

Through this study, we aim to address the following three questions:
(1)
What is the status quo of the research regarding plastic management?
(2)
What is the size and severity of plastic production and waste from various perspectives (i.e., production, consumption, and waste)?
(3)
What new research ideas can we stimulate and propose under the umbrella of plastic management, precisely technology-related solutions?

6. Methodology

Our methodology includes quantitative and qualitative analysis, which is elaborated on in Section 6.1 and Section 6.2 respectively.

6.1. Quantitative Analysis Methodology

This study is promising with data-driven findings and interpretation. The discussions and implications are derived based on the analysis of large-scale datasets. To fulfill the objectives of the study and build on the previous analysis [26,36,46], most of the analyses on these sources return to the year 2016 and earlier. Secondary data is collected from various sources to run the descriptive and predictive analysis (see Table 1 for the list of the datasets used). For the datasets that were not found publicly, we communicated with the State Department to gain access to the data collected between 2016 and 2021 (approximately a total of one million records). After the data collection, the datasets were cleaned and prepared to put the raw data in a structure to extend the analysis made by [26,36,46], where the measures evaluated in these previous studies were re-run in our study with recent data to examine the change and status of the plastic crisis over time. To illustrate, considering that the measures of plastic waste were reported in [26] primarily based on data collected in the year 2016, we extended that study with the most recent data to represent plastic waste on the global level until the year 2020 and the plastic waste and combustion in the U.S. until the year 2018 (see Section 7.2.2). In addition, we examined the recycling status in the U.S. following the same method as [36]. Furthermore, [46] presented analysis on plastic generation and production until the year 2015, while further analysis was conducted in Section 7.2.1 to cover the time span until the year 2019; in addition, we enriched the study with projections until the year 2025 following the business as usual scenario ceteris paribus (i.e., assuming no change in plastic management methods).

6.2. Qualitative Analysis Methodology

The literature on the plastic crisis was evaluated based on the collection of thousands of abstracts and keywords from 5267 publications from the Scopus database and then analyzed via the VOSviewer tool (VOS—Visualization of Similarities), which is a two-dimensional visualization software (www.vosviewer.com, accessed 1 May 2021). VOSviewer is an open Natural Language Processing (NLP) library for creating scientific landscape visualizations. The tool enables the development of distance-based maps based on network data on scientific publications from various dimensions (citation, co-occurrence, co-authorship, etc.). The technique upon which the tool is based is composed of the following steps: (a) ‘copyright’ statements in the abstract are eliminated. (b) A sentence detection algorithm splits the abstract into sentences. (c) A ‘part-of-speech’ tagging algorithm is applied to break down the sentence into fragments (i.e., verb, adjective, preposition, noun, etc.). (d) Convert plural to singular terms. (e) Finally, remove the stop words. Our algorithm is presented after Figure 1. It delineates the process with further details on the clustering technique.
In what follows, we describe the process of data collection and preparation.
(1) The publications studied were collected from the Scopus database under specific themes. These themes were selected based on a manual evaluation of randomly selected literature from Harvard Business Review (HBR), MIT Sloan Management Review, Science Direct, and Google Scholar. The themes are: ‘plastic business models’, ‘plastic and circular economy’, ‘plastic and consumers, ‘plastic and closed loop’, ‘plastic and value chain’, and ‘plastic and technology’. For the themes of ‘technology’ and ‘plastic’, the results were generic and unrelated. Accordingly, we decided to examine the technological dimension through the other five themes listed above. (2) The publications obtained under each theme were extracted in a separate dataset with details about authors, year of publication, journal, volume number, issue number, number of citations, affiliation, abstract, author keywords, index keywords, references, publisher, corresponding author details, document type, and publication stage. Then, the generated dataset was used for cluster, text, and bibliometric analysis. (3) The top 20,000 publications in 2021 that include the keyword ‘plastic’ were retrieved. That sample represents 50% of the publications on the Scopus database in 2021 that have the term ‘plastic’. Only the top 20,000 were retrieved due to a restriction on the Scopus database that limits the records that can be exported. (4) The 20,000 publications were screened manually to exclude non-business-related publications. (5) The remaining subset was merged with the publications under the themes in stage (1) to remove the duplicates and the publications not available in full text (see Figure 1).
In view of Figure 1, there are six main themes represented by the rectangular entities, where the number in each entity reflects the number of occurrences of publications within the range of years selected. The direction of the arcs represents the perspective upon which a theme is assessed, whereas the thickness of the arc represents the level of detail and relevancy between the entities it connects. For the ‘technology’ theme, the arcs are only flowing in, as that theme is studied from the perspectives of the other themes as discussed above. At the same time, the ‘stakeholder’ term was very generic to collect a separate dataset evaluating that dimension; hence, we decided to study the ‘stakeholder’ dimension through the ‘consumers’ entity (For any further details on VOSviewer Algorithm 1, readers are referred to [48]).
Algorithm 1. Terms Clustering and Mapping.
Step 1: A similarity matrix is developed based on the co-occurrence matrix
  S i j = C i j ω i ω j , (1)
where  S i j  is the similarity between two items i and j c i j  denotes the co-occurrence of items i and j, and ( ω i ω j ) represents the total frequency of each term.
Step 2: Let t denote the number of ‘terms’ to be mapped, and i = 1 and j = 1.
Each node (term t) is placed on a 2-dimension grid.
For i  i n  t:
For j  i n   t :
t 1 , , t n = i < j t i t j 2 S i j ,(2)
subject to
2 t t 1 Σ t i t j = 1 .(3)
Step 3: In case the optimal solution that minimizes Equation (2) subject to Equation (3) does not have a global optimal solution, the algorithm enables:
Step 3.1: Translation
The solution is centered at the origin.
Step 3.2: Rotation
σ 2  (variance) on the horizontal dimension is maximized following the Principle Component Analysis (PCA) transformation.
Step 3.3: Reflection
The solution is reflected on a horizontal or vertical axis based on the median location of the nodes.
Step 4: Return the results.
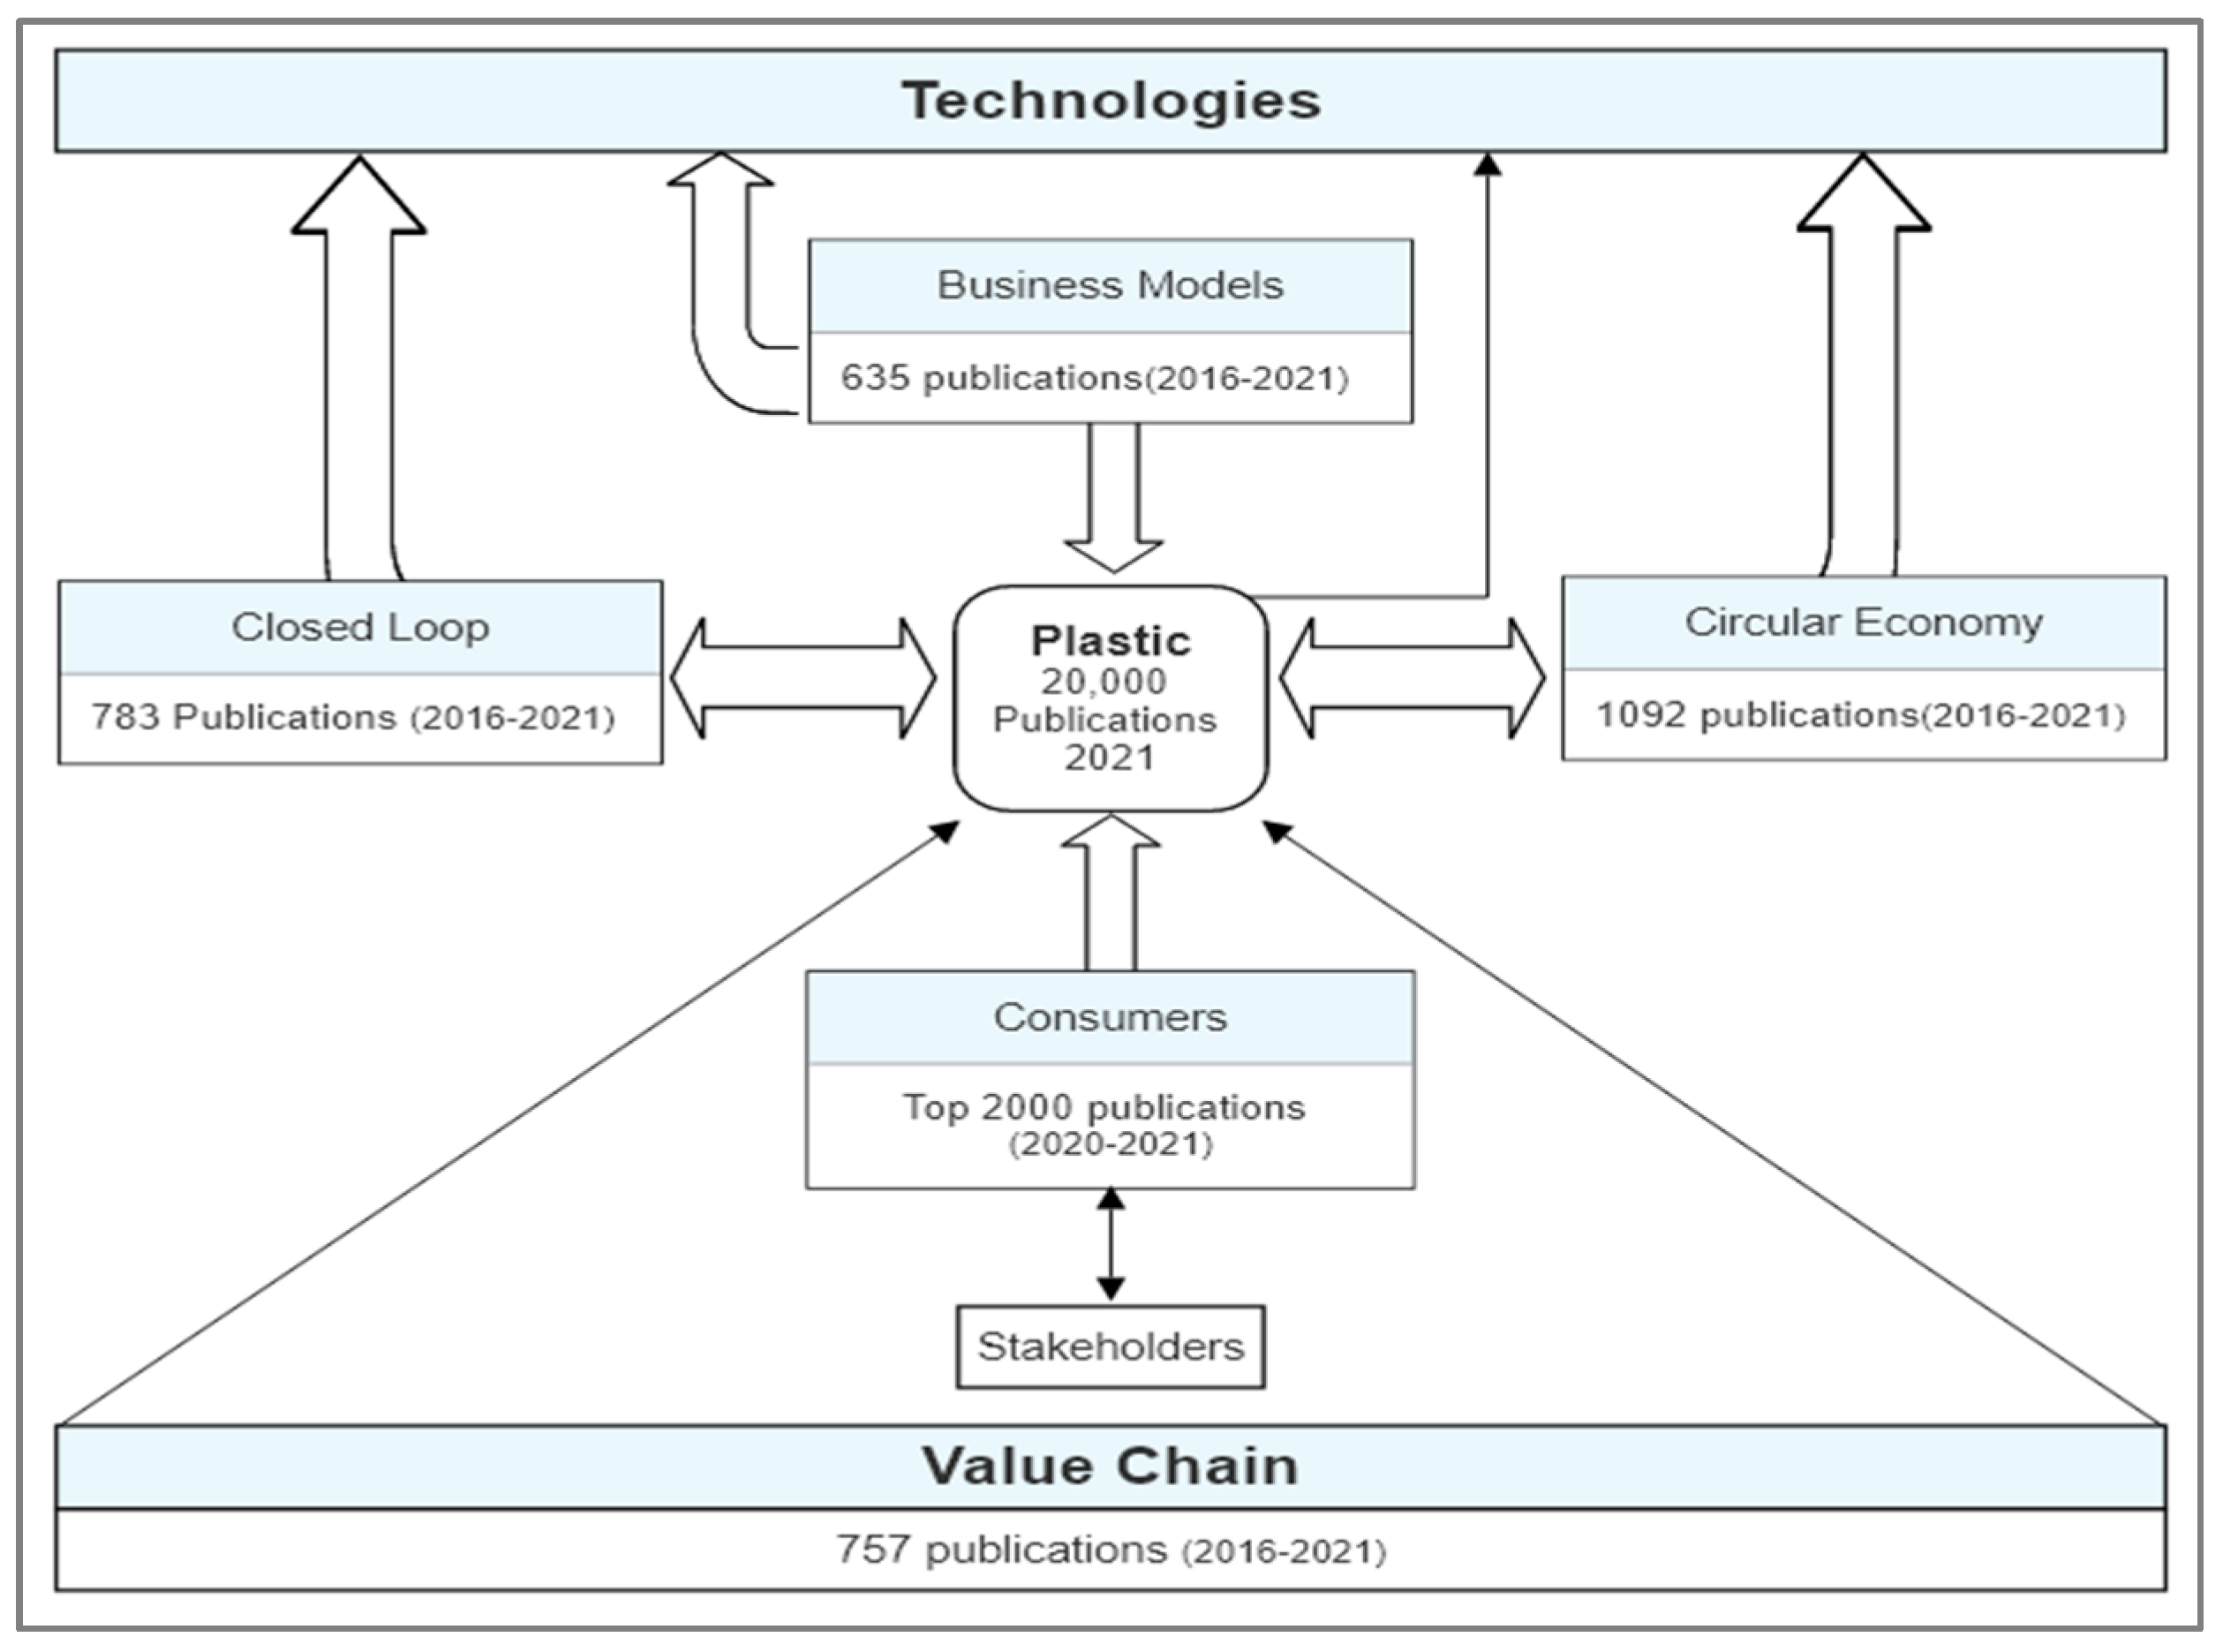
7. Results

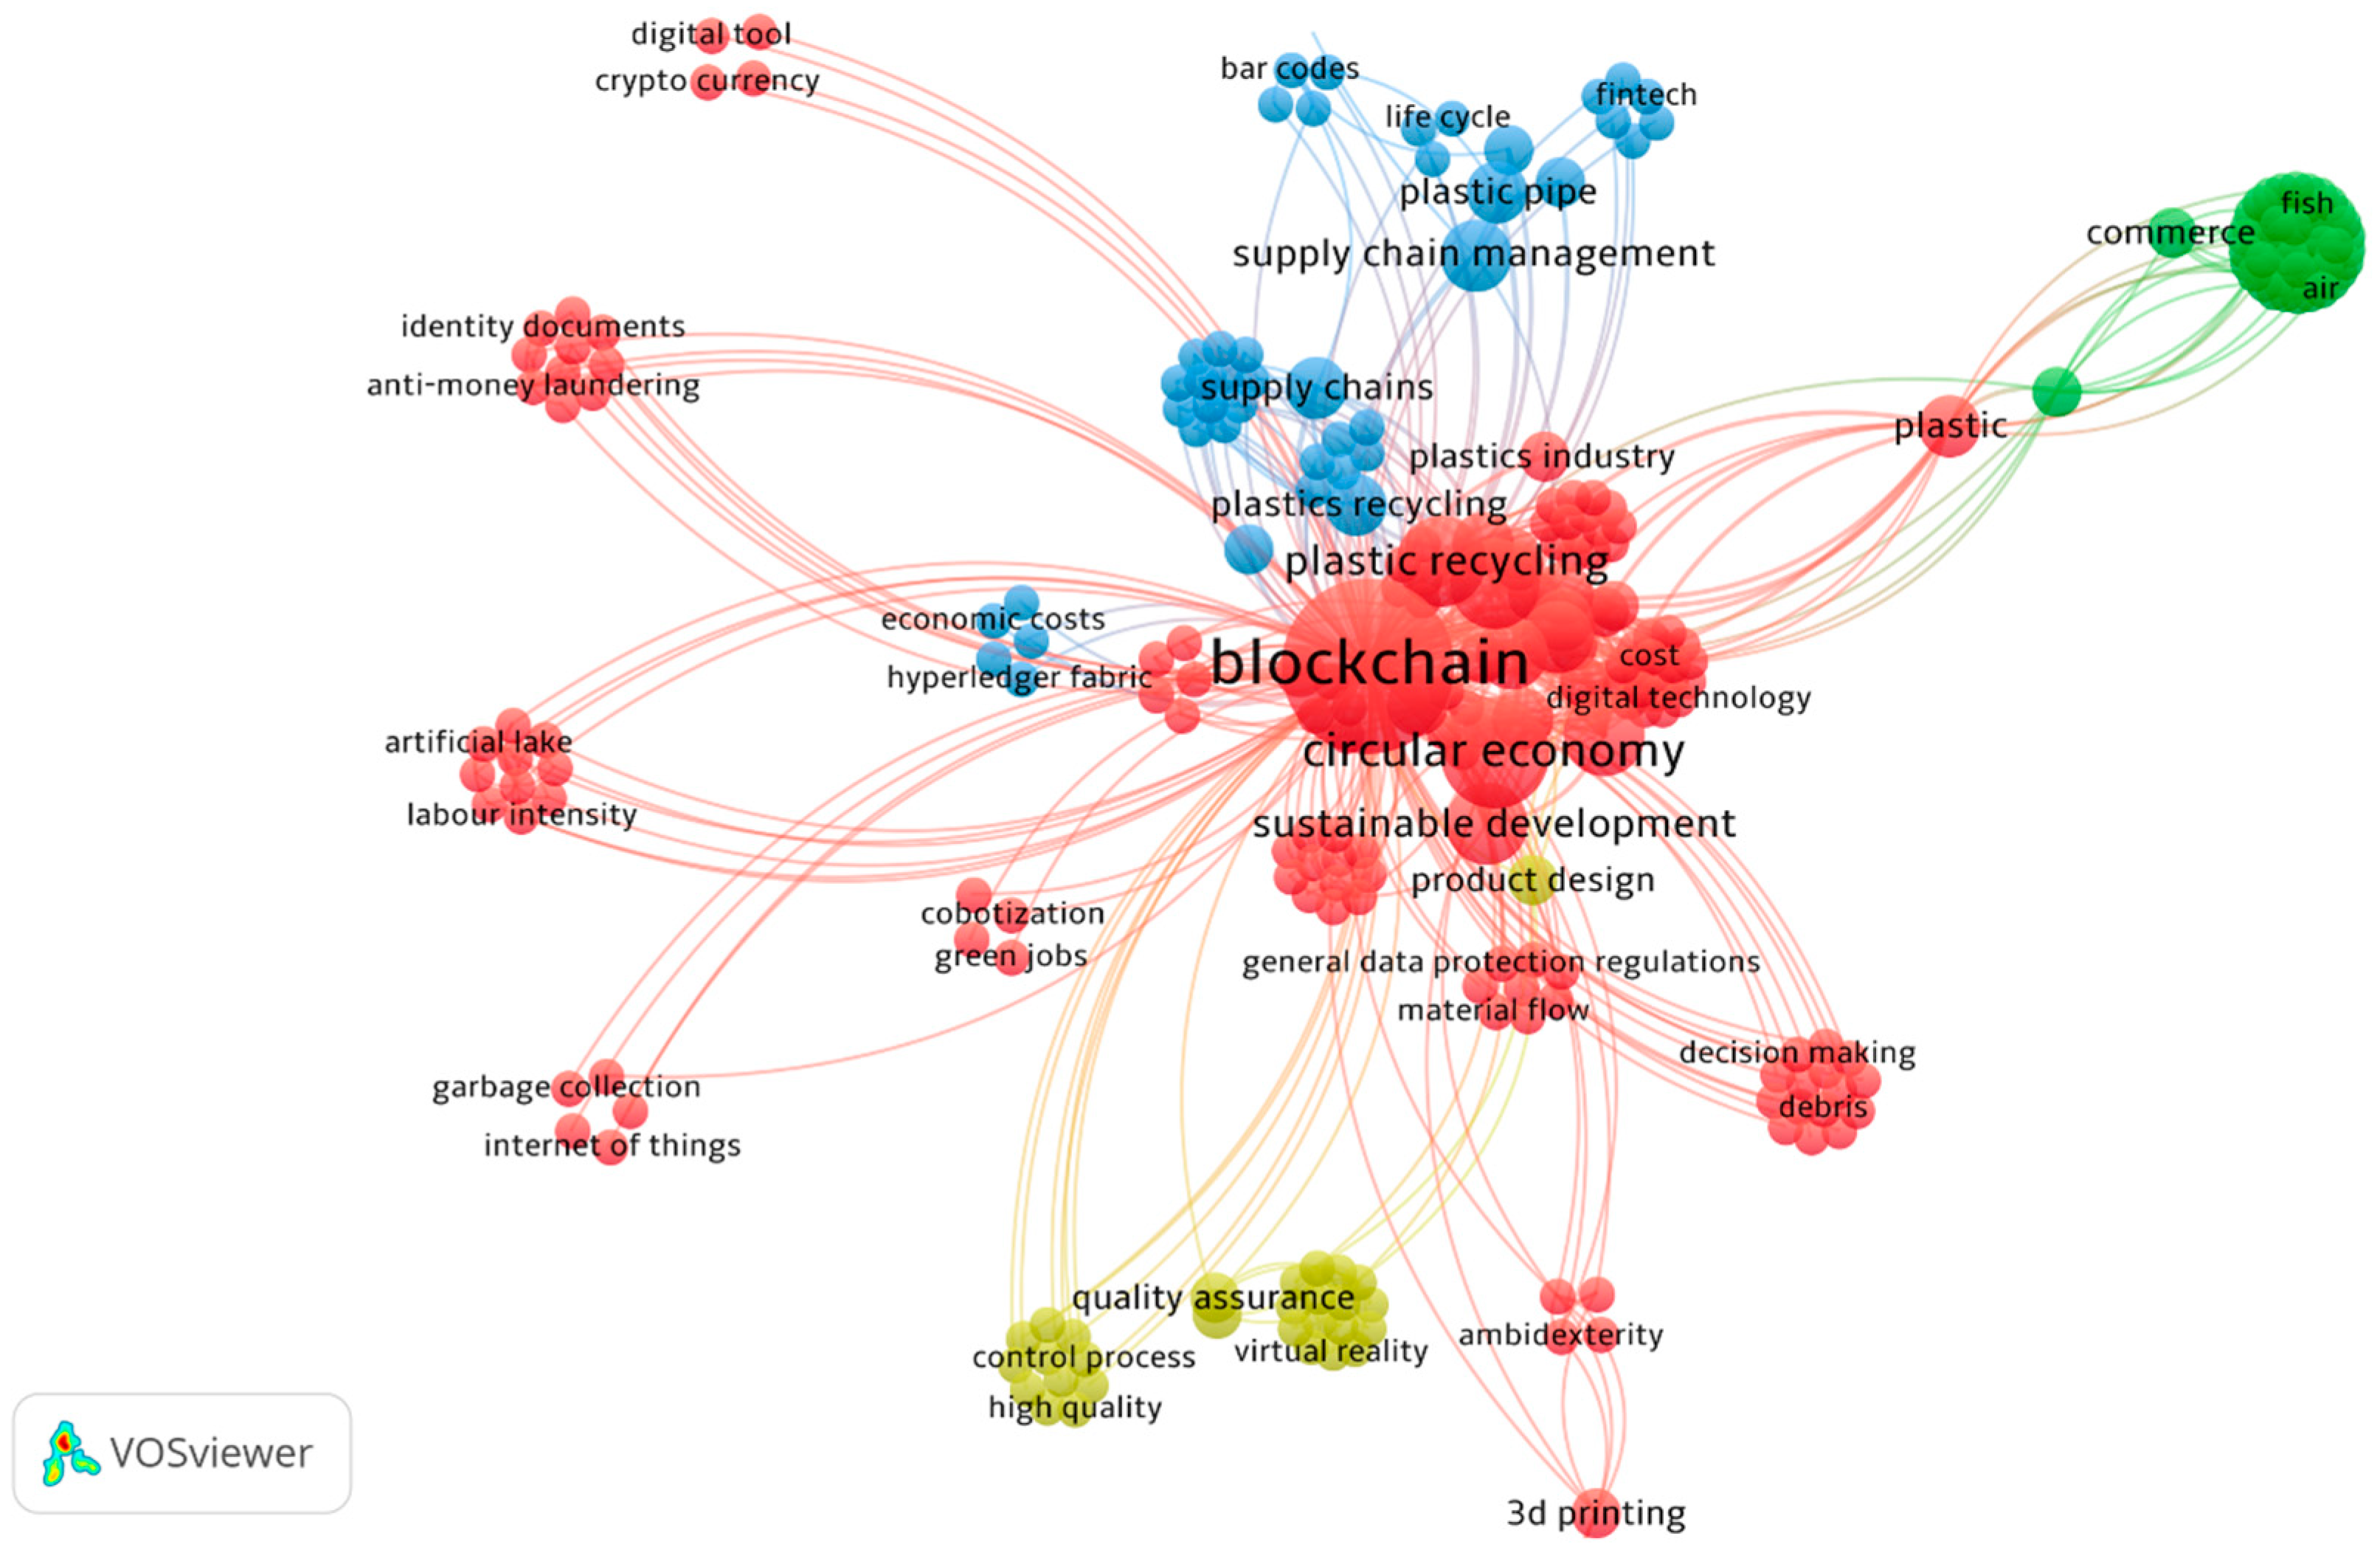
7.1. Research Status

We found a plethora of recent studies on plastic policies and regulations in the literature. However, there is a scarcity of mechanisms and measurement tools to concisely control the plastic crisis and ensure the enforcement of policies and regulations. Moreover, we found a little business-related research to scale up the collection of plastic waste and re-thinking or re-designing products and packaging to minimize the plastic portion included in the product. There is no clear evidence or connection between ‘innovation’ and ‘re-purpose’. Particular nodes are related to product development or ‘re-design’, but that is insufficient to foster a ‘re-purpose’ initiative, especially on the research level. Recycling is covered thoroughly within the themes studied. Even though the result shows no connection between ‘reduce’ and ‘re-purpose’, that could be due to the ambiguity of their definitions. There is an overlap in the semantics for ‘refuse and reduce’, ‘re-purpose’, and ‘reuse’. Accordingly, giving the 5 ‘R’ a clear definition and enhancing the public’s awareness about the difference between those ‘R’ terms is necessary.
For business models, there are many publications, but most of the business models have been developed by commercial companies rather than academic studies. Figure 2 depicts the 5 ‘R’ mapping throughout the themes investigated. In the figure, the horizontal bars represent the existence of related research. ‘Re-use’ has a minor existence under the business model theme.
As shown, industrial practices are ahead of the game compared to academia, especially regarding exploring the impact of technologies on tackling the problem [38]. However, the literature about technology applications in the plastic crisis is very general, and the most innovative and disruptive technology has not been discussed with enough attention. Although ‘Industry 4.0’ covers most of the technologies not mentioned in the literature, the term ‘Industry 4.0’ is still very generic. The term was either absent or existed with a small node size on the outer layer of the different network diagrams across the themes studied. For example, Industry 4.0 technologies, ‘Artificial Intelligence (AI)’, ‘Blockchain Technology (BCT)’, ‘Machine Learning’, ‘Robotics’, and ‘Cloud Computing (CC)’, in addition to ‘Internet of Things (IoT)’, did not appear in any of the themes; in other words, they either appeared less than 10 times or even never appeared at all.
Taking Blockchain Technology as an example, BCT is widely studied in applications other than finance (e.g., supply chain management, etc.) [49], and even though BCT has been considered a viable solution to the plastic crisis [35,50,51,52,53,54,55,56], there is still a shortage of research investigating this area despite the promising expected results. The Scopus database’s earliest publication on blockchain and plastic returns to 2019. Researchers of such studies are mainly from India, China, and the United Kingdom. In contrast, the U.S. is only listed once. The projections reflect that the number of BCT for plastic publications is expected to fluctuate between four and ten publications by 2025. Comparing the occurrence of ‘blockchain’ with six selected areas, which are ‘supply chain’, ‘sustainability’, ‘environment’, ‘finance’, ‘fintech’, and ‘plastic’, shows a shortage of publications, including ‘blockchain’ and ‘plastic’ (see Figure 3). Figure 4 depicts the terms in the abstracts, keywords (author and index terms), and titles, where the colors reflect the cluster to which each term belongs. We find four main clusters, colored red, blue, green, and yellow.
The primary cluster, the ‘red cluster’, includes publications about digital technologies (i.e., BCT, AI, IoT, Big Data, and 3D printing) and related applications. We find that the term ‘plastic’ is not only mentioned exclusively to reflect the plastic crisis side, but also as a material or tool for the application investigated. This cluster focuses on Industry 4.0 technologies for smart cities, energy management, climate change, manufacturing, digital monetary transactions (cryptocurrency and electronic wallets), debris management, and removal from landfills and water surfaces.
Cluster two, the ‘green cluster’, includes publications related to food (safety, contamination, waste, control, inspection, etc.); in most cases, the plastic is mentioned from a packaging perspective.
Cluster three, the ‘yellow cluster’, includes studies on quality/information/process (assurance, assessment, and control).
Finally, cluster four, the ‘blue cluster’, is related to plastic-tackling solutions and recommendations. This cluster includes publications on plastic recycling and using BCT as a reward system, in addition to studies related to biological recycling, chemical recycling, mechanical recycling, waste incineration, and pollution control.
Again, most terms closely tied to plastic management and control were listed only once across all the studies. Furthermore, the link length between nodes reflects the strength of the connection between terms, as reflected in the algorithm. Hence, in Figure 4, the ‘plastic’ and ‘plastic recycling’ are relatively far from the red nodes on the left side of the chart (i.e., nodes related to Industry 4.0 technologies). In that capacity, the results in this section confirm the urge to explore the area of research of business data science and analytics to manage and control the plastic crisis. Moreover, only 3% of the abstracts in Figure 3 (plastic and Blockchain sector) mentioned the ‘circular economy’. Therefore, in addition to the scarcity in research for BCT and plastic, as reflected in Figure 3, Figure 4 reveals that even for the small proportion of documents found, in many cases, ‘plastic’ is referred to by researchers in a different context.

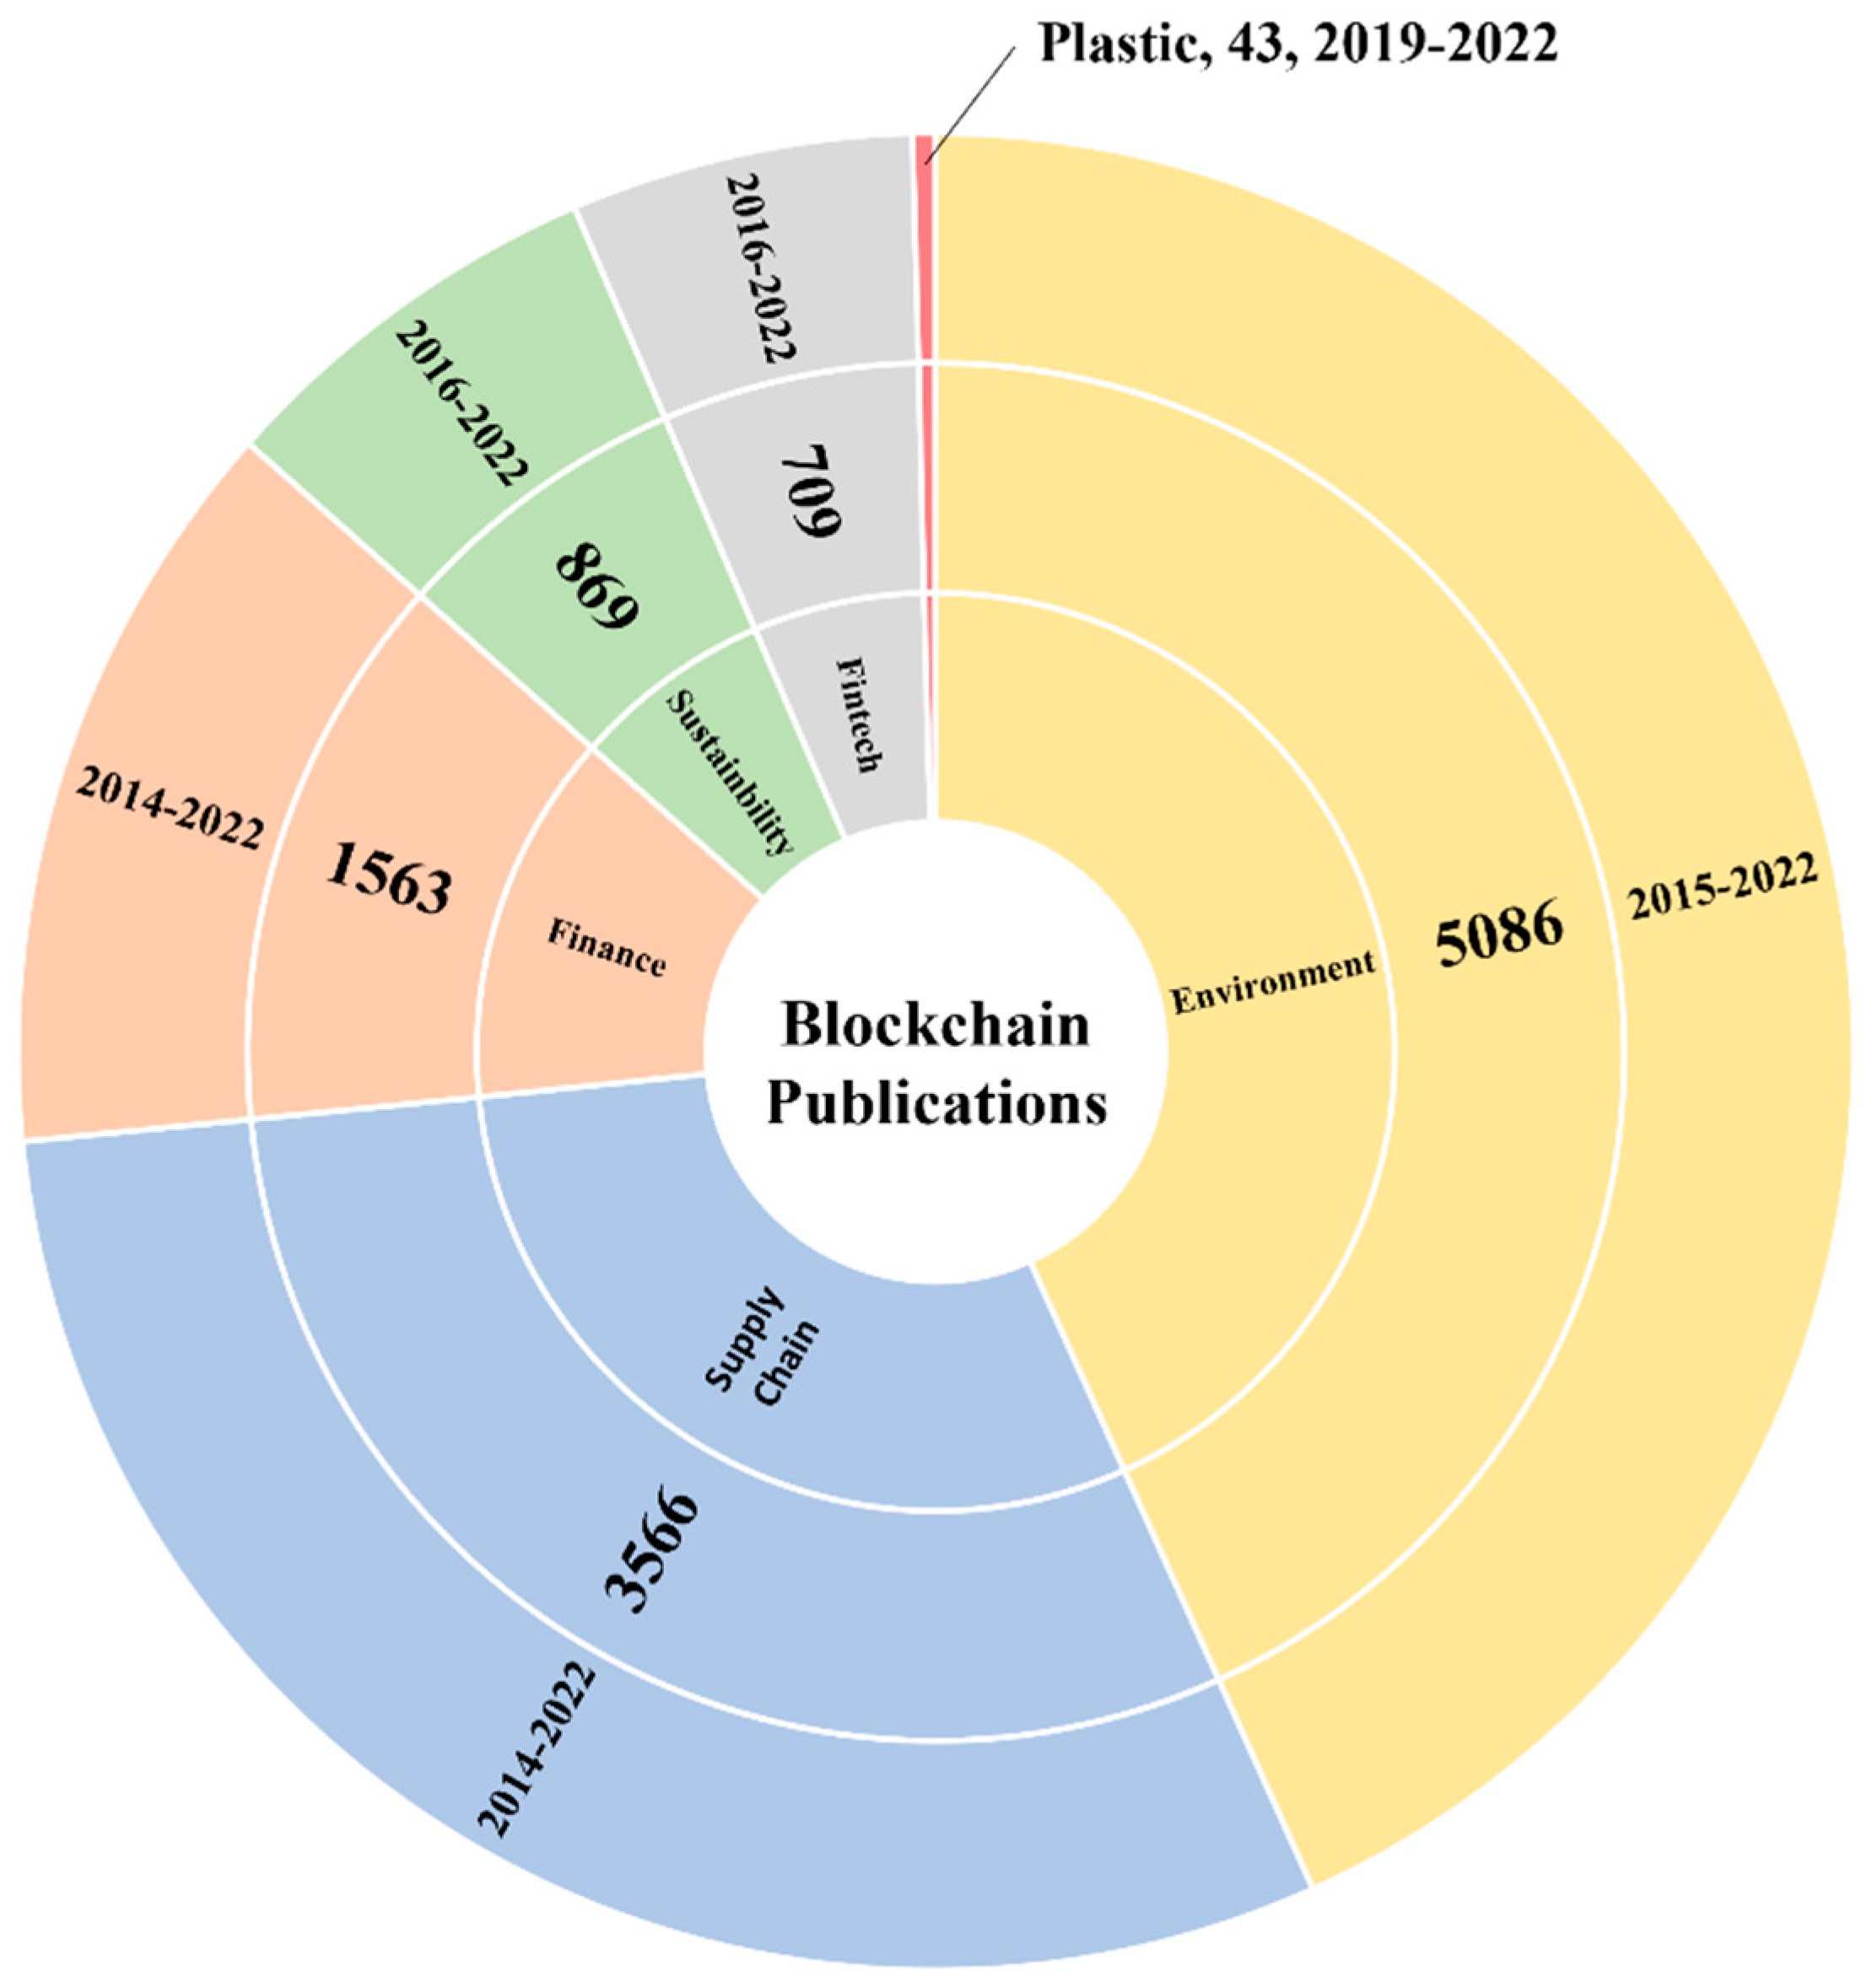
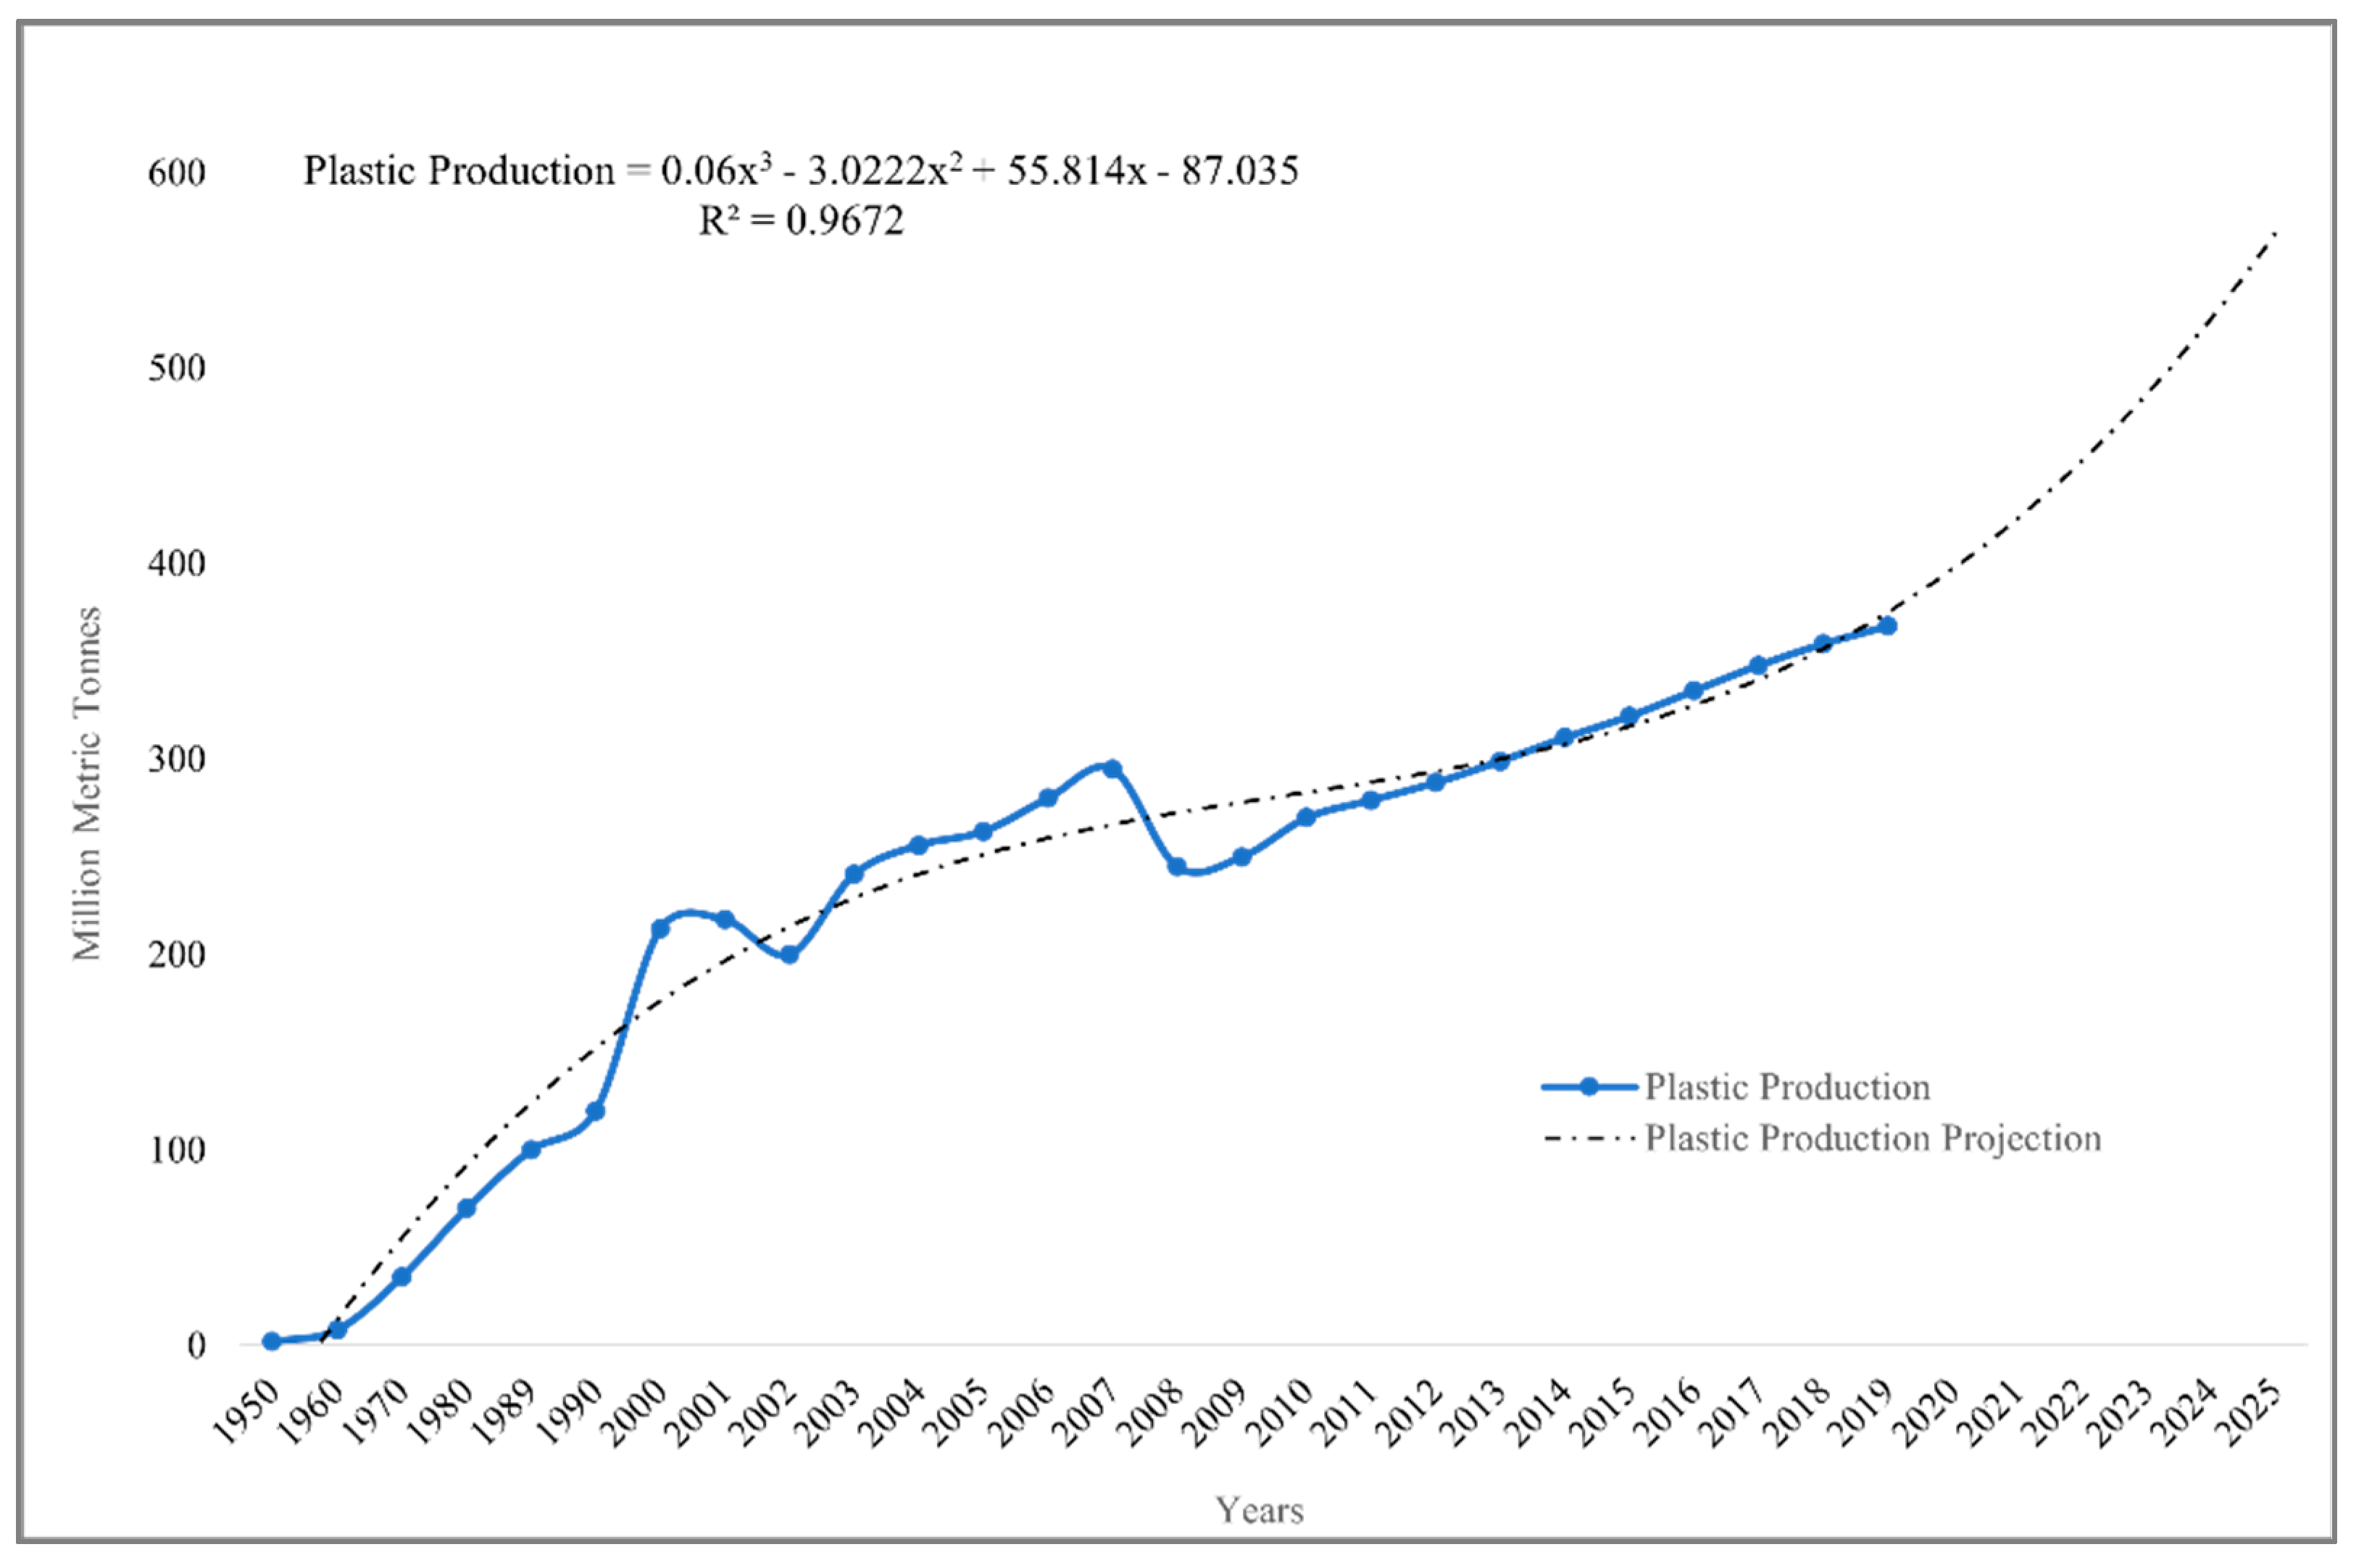
7.2. Plastic Production, Consumption, and Waste

This section includes all the results on plastic data referred to in Table 1. Based on the data collected by OECD between the years 1990 and 2018, there has been a decrease in the technological advancement and frequency of patents related to plastic and rubber recycling developed by South Korea, the U.S., Germany, and Japan, despite the need for technological innovation to tackle the plastic waste crisis. Some of the reasoning behind that could be tied to (1) the difficulty of recycling, (2) motivating the public to be involved in the plastic collection, (3) the costly process for plastic cleaning before recycling, or (4) safety concerns and handling contaminated plastic waste or plastic mixed with hazardous materials before recycling it. On the other hand, now is a suitable time to promote plastic recycling, especially with the global gas price fluctuations along with the uncertainty of energy supply globally. Rising gas prices lead to a soaring price of virgin plastic, which may boost the demand for recycled materials (www.millerrecycling.com/oil-prices-recycling, accessed 5 February 2023/; www.plasticexpert.co.uk/oil-prices-plastic-recycling, accessed 5 February 2023) Additionally, the production cost is 30-fold higher than the recycling cost for polymers [29].

7.2.1. Plastic Production and Consumption

Global plastic production increased by 183% from 1950 to 2019 following the same pattern; global plastic production is expected to fluctuate between 500 and 600 Million Metric Tons (MMT) in 2025 (see Figure 5). The total plastic production in the U.S. in the year 2021 reached approximately 124 million pounds (www.americanchemistry.com, accessed 1 November 2022).
In Europe, approximately 40% of the plastic consumed is used for packaging, followed by usage for building and construction, automotive, electronics, household products, and agriculture (www.plasticsoupfoundation.org/en/, accessed 1 March 2022). Meanwhile, in the U.S., the International Bottled Water Association (IBWA) reported an increase in the consumption of bottled water from 16.7 gallons per capita in the year 2000 to 45.2 gallons per capita in the year 2020 (www.bottledwater.org, accessed 1 December 2021), which reflects the increase in plastic bottles. Based on the bag tax data collected from Data Montgomery, the top three states in terms of average bag consumption are Pennsylvania, Indiana, and Arizona.

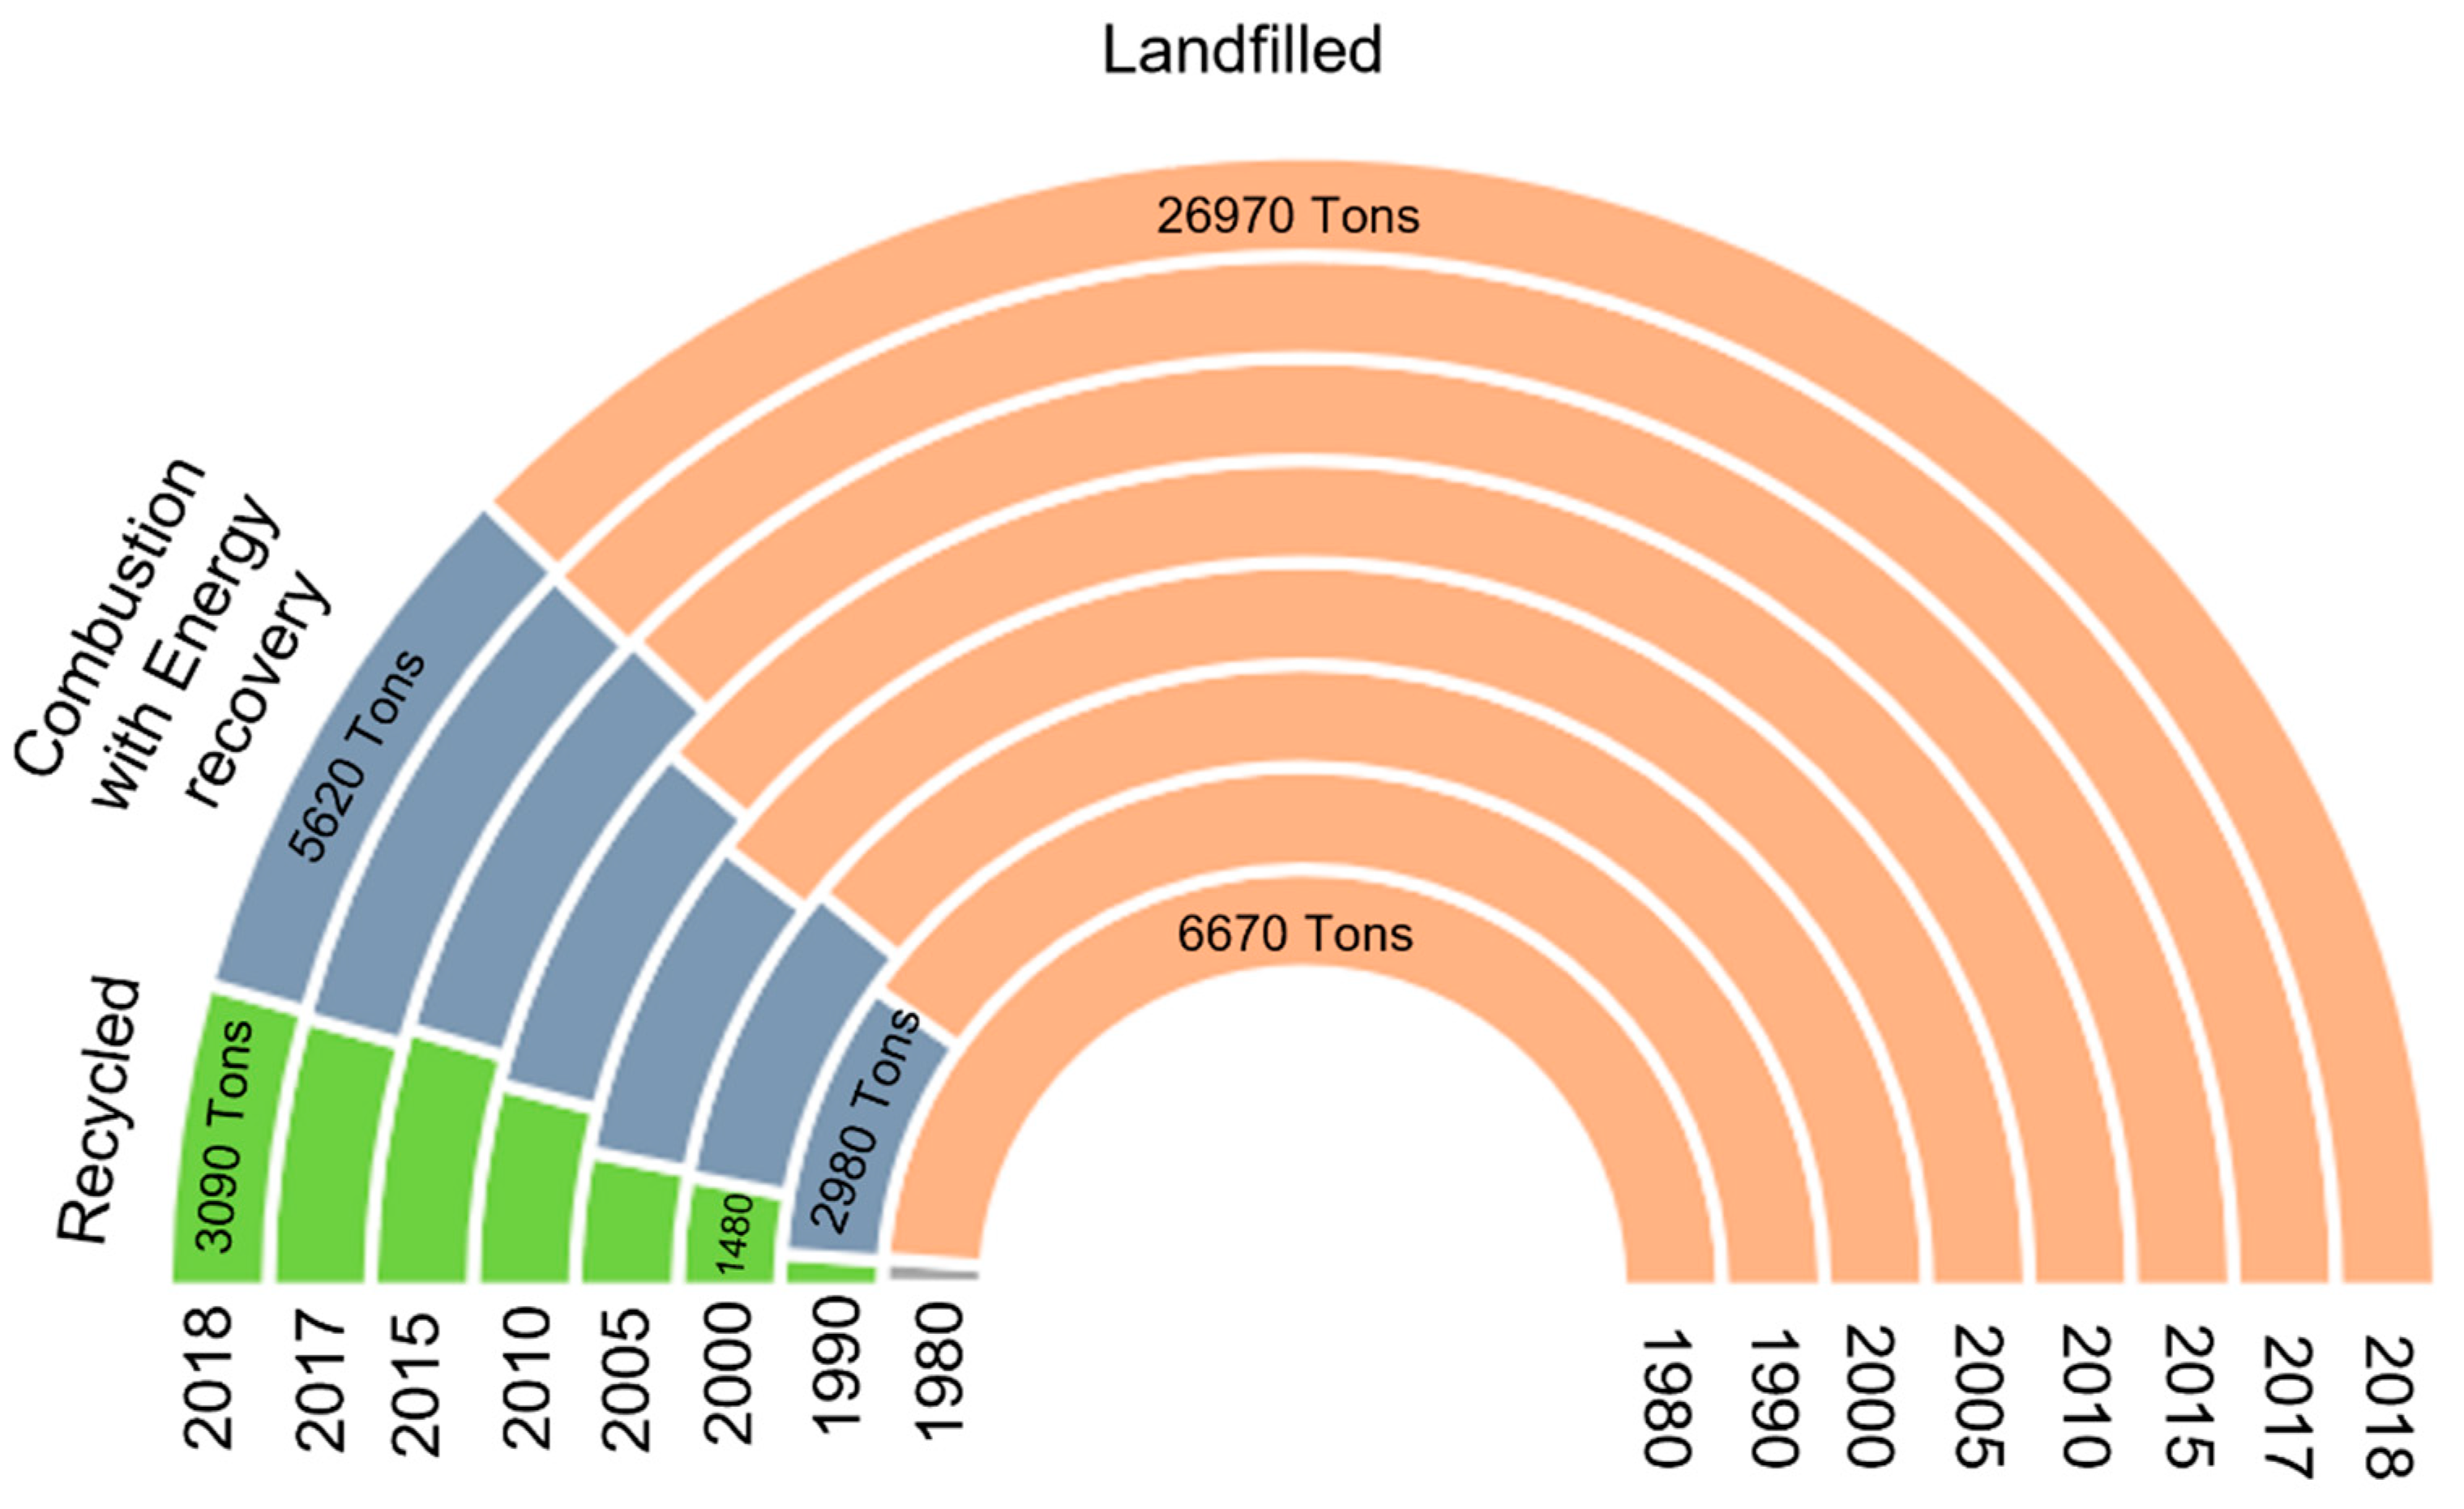
7.2.2. Plastic Waste

The plastic waste is 6.3 billion metric tons (as of 2015). The cumulative plastic waste is anticipated to grow steadily to 12 billion tons by 2050 (www.statista.com/statistics/1019774/plastic-waste-volume-globally/, accessed 1 November 2021). Plastic waste is more in countries classified by the World Bank as low-middle or upper-middle income [26]. According to the data obtained from the U.S. Department of State, the top three single-use plastic items collected in the U.S. are (1) cigarette butts, (2) bottles, and (3) caps or lids. The top states from which the plastic waste was collected were Florida, California, Illinois, Hawaii, and Texas (see Table 2 for the top single-use plastic items collected globally).
The marine debris in the U.S. increased from 32 K to 115 K from the year 2016 to 2020. Following the same exponential growth, marine debris waste is expected to fluctuate around 249 K items by the end of 2023 in the U.S. alone. Figure 6 reflects the severity of mismanaged plastic waste and the urgency for actions to minimize the plastic waste that is dumped in landfills. Figure 6 does not even include industrial waste. For example, in 2018, recycled consumer plastic represented 9% of the plastic generated (see Figure 6). In contrast, Japan’s plastic waste recycling rate hit 84% in the same year.

8. Discussion and Conclusions

This study sheds light on the prevailing crisis of plastic with rich insights derived from real-world data across various levels. In this study, we propose multiple key research directions to react to the needs of practitioners and regulators regarding the exacerbated plastic crisis.
Many recent studies focus on plastic management policies and regulations. However, there is a lack of mechanisms, methods, and measurement tools to concisely manage, control, and improve the effectiveness of the policies and regulations. In addition, collection infrastructure is essential to transport plastic waste from bins to sorting facilities in residential settings. This includes haulers providing curbside service and consumers transporting waste to recycling depots in areas without curbside service. BCT, IoT, and AI are three promising technologies for battling the plastic crisis [35,52,58]. Using BCT to share with the consumers the information about the plastic quantity and proportion in products and if it comes from sustainable sources may help put pressure on large corporations to re-think and re-design their supply chain to close the loop. Nevertheless, in many cases, technology adoption is typically slow and incomplete, impacting sustainability performance [59].
The dataset for this study comprises thousands of abstracts retrieved and analyzed from various perspectives (i.e., five themes) to lay the foundation for this study and future studies interested in extending and building on our findings. Following the same pattern, the projected publications related to BCT as a solution for plastic are expected to fluctuate between four and ten publications annually by 2025; that is insufficient with this uncontrolled crisis’s massive size and growth. Additionally, most publications do not go beyond the foundational basis for broadly illustrating the technology. That sheds light on the area of research that overlaps business data science, analytics, and plastic management. Although Industry 4.0 covers most of the technologies not mentioned in the literature, the term Industry 4.0 is still very generic. The term was either absent or existed with a small node size across the themes studied. Leveraging Industry 4.0 technologies might make organizations more economical, resilient, robust, flexible, and sustainable.
Some areas that had a shortage in the literature reviewed are ‘green supply chain’, social media’s role in tackling environmental issues, and ‘circular business models’. Using different social media platforms to raise public awareness regarding the plastic crisis and management is worth investigating. New business models need to be developed to deal with the discrepancies in the body of literature. Moreover, a data-driven framework infrastructure is needed for waste management (especially in the U.S.). In contrast, some terms existed across all the themes (e.g., ‘3D printing’, ‘behavior change’, ‘innovation’, and ‘carbon emission’). Nevertheless, there is no clear evidence or connection between ‘innovation’ and ‘re-purpose’. Some nodes are associated with ‘product development’ or ‘re-design’, but that is inadequate to foster a ‘re-purpose’ initiative.
Finally, cooperation and collaboration are essential among the key players (e.g., researchers, industry leaders, government, and consumers) to promote a radical shift to tackle the root causes hindering the transition towards a circular economy for plastics. To this end, a system of supporting guidelines and policies need to be set in place. The funders, governments, and relevant organizations are expected to take responsibility and commit to the leadership.

9. Future Work

Organizations are eager to explore and adopt new technologies, e.g., Big Data, AI, CC, and BCT. We are examining the usage and inclusion of BCT as a new era for tackling the plastic crisis [53] across the various activities of the plastics value chain, starting from raw material production to end-of-life and disposal. Furthermore, other burgeoning powerful technologies such as ‘Metaverse’, ‘Virtual Reality (VR)’, and ‘Augmented Reality (AR)’, as well as ‘Non-Fungible Token (NFT)’, will be explored as methods for scaled-up plastic collection [53]. On the other hand, although Multi-Agent optimization has grasped the attention of researchers over the past two decades, multi-objective optimization problems, along with multiple-agent systems, have not been fully explored [60]. Accordingly, Multi-Agent optimization may be studied from Environmental, Social, and Governance (ESG) perspectives.

Author Contributions

Conceptualization, N.E.-R., A.C. and J.S.; methodology, N.E.-R., A.C. and J.S.; software, N.E.-R.; validation, A.C. and J.S.; formal analysis, N.E.-R., A.C. and J.S.; investigation, N.E.-R., A.C. and J.S.; resources, A.C. and J.S.; data curation, N.E.-R. and A.C.; writing—original draft preparation, N.E.-R., A.C. and J.S.; writing—review and editing, N.E.-R., A.C. and J.S.; visualization, N.E.-R.; supervision, A.C. and J.S.; project administration, J.S.; funding acquisition, A.C. and J.S. All authors have read and agreed to the published version of the manuscript.

Funding

This research was funded by the United States Department of Agriculture (USDA) grants (Award Numbers AM21TMATRD00C003 and 22-TMTSD-NJ-0003), and the third author was funded by Leir Foundation and Leir Chair endowment at NJIT.

Institutional Review Board Statement

Not applicable.

Informed Consent Statement

Not applicable.

Data Availability Statement

In this study, the data supporting reported results are sourced mainly from secondary data of multiple data sets, including the American Chemistry Council, National Association for PET Container Resources, Association of Plastic Recyclers, American Association for the per capita and Advancement of Science, Citizen Science, Data Montgomery, Global Change Data Lab, Organization for Economic and Co-operation, U.S. Department of State, World Bank, etc. The relevant data can be accessible from the following website: https://github.com/El-Rayes/Plastic-Management-and-Sustainability.git (updated on 22 April 2023).

Acknowledgments

The authors are grateful to Landon Van Dyke, the State Department Senior Advisor for Environmental Performance and Sustainability, for his valuable support in sharing the latest data sets that allow us to perform this project timely with the most up-to-date data. The third author is grateful to the United States Department of Agriculture (USDA, Award Numbers AM21TMATRD00C003 and 22-TMTSD-NJ-0003), the Leir Research Institute (LRI), as well as the Leir Chair and Hurlburt Chair Endowments at NJIT.

Conflicts of Interest

The authors declare no conflict of interest.

References

  1. Vakil, B. The latest supply chain disruption: Plastics. Harv. Bus. Rev. 2021, 67, 9–11. [Google Scholar]
  2. Fadare, O.O.; Wan, B.; Guo, L.-H.; Zhao, L. Microplastics from consumer plastic food containers: Are we consuming it? Chemosphere 2020, 253, 126787. [Google Scholar] [CrossRef] [PubMed]
  3. Barboza, L.G.A.; Vethaak, A.D.; Lavorante, B.R.; Lundebye, A.-K.; Guilhermino, L. Marine microplastic debris: An emerging issue for food security, food safety and human health. Mar. Pollut. Bull. 2018, 133, 336–348. [Google Scholar] [CrossRef] [PubMed]
  4. Klemeš, J.J.; Van Fan, Y.; Jiang, P. The energy and environmental footprints of COVID-19 fighting measures–PPE, disinfection, supply chains. Energy 2020, 211, 118701. [Google Scholar] [CrossRef] [PubMed]
  5. Barboza, L.G.A.; Cunha, S.C.; Monteiro, C.; Fernandes, J.O.; Guilhermino, L. Bisphenol A and its analogs in muscle and liver of fish from the North East Atlantic Ocean in relation to microplastic contamination. Exposure and risk to human consumers. J. Hazard. Mater. 2020, 393, 122419. [Google Scholar] [CrossRef] [PubMed]
  6. Grbić, J.; Helm, P.; Athey, S.; Rochman, C.M. Microplastics entering northwestern Lake Ontario are diverse and linked to urban sources. Water Res. 2020, 174, 115623. [Google Scholar] [CrossRef]
  7. Zhao, C.; Liu, M.; Du, H.; Gong, Y. The Evolutionary Trend and Impact of Global Plastic Waste Trade Network. Sustainability 2021, 13, 3662. [Google Scholar] [CrossRef]
  8. Sharma, H.B.; Vanapalli, K.R.; Cheela, V.S.; Ranjan, V.P.; Jaglan, A.K.; Dubey, B.; Goel, S.; Bhattacharya, J. Challenges, opportunities, and innovations for effective solid waste management during and post COVID-19 pandemic. Resour. Conserv. Recycl. 2020, 162, 105052. [Google Scholar] [CrossRef]
  9. Aragaw, T.A. Surgical face masks as a potential source for microplastic pollution in the COVID-19 scenario. Mar. Pollut. Bull. 2020, 159, 111517. [Google Scholar] [CrossRef]
  10. Lau, W.W.Y.; Shiran, Y.; Bailey, R.M.; Cook, E.; Stuchtey, M.R.; Koskella, J.; Velis, C.A.; Godfrey, L.; Boucher, J.; Murphy, M.B.; et al. Evaluating scenarios toward zero plastic pollution. Science 2020, 369, 1455–1461. [Google Scholar] [CrossRef]
  11. Peixoto, D.; Pinheiro, C.; Amorim, J.; Oliva-Teles, L.; Guilhermino, L.; Vieira, M.N. Microplastic pollution in commercial salt for human consumption: A review. Estuar. Coast. Shelf Sci. 2019, 219, 161–168. [Google Scholar] [CrossRef]
  12. Stubbins, A.; Law, K.L.; Muñoz, S.E.; Bianchi, T.S.; Zhu, L. Plastics in the Earth system. Science 2021, 373, 51–55. [Google Scholar] [CrossRef] [PubMed]
  13. Liang, J.H.; Liu, J.; Benfield, M.; Justic, D.; Holstein, D.; Liu, B.; Hetland, R.; Kobashi, D.; Dong, C.; Dong, W. Including the effects of subsurface currents on buoyant particles in Lagrangian particle tracking models: Model development and its application to the study of riverborne plastics over the Louisiana/Texas shelf. Ocean Model. 2021, 167, 101879. [Google Scholar] [CrossRef]
  14. Kim, J.-S.; Lee, H.-J.; Kim, S.-K.; Kim, H.-J. Global Pattern of Microplastics (MPs) in Commercial Food-Grade Salts: Sea Salt as an Indicator of Seawater MP Pollution. Environ. Sci. Technol. 2018, 52, 12819–12828. [Google Scholar] [CrossRef] [PubMed]
  15. Rochman, C.M.; Browne, M.A.; Underwood, A.J.; van Franeker, J.A.; Thompson, R.C.; Amaral-Zettler, L.A. The ecological impacts of marine debris: Unraveling the demonstrated evidence from what is perceived. Ecology 2016, 97, 302–312. [Google Scholar] [CrossRef]
  16. Gall, S.; Thompson, R. The impact of debris on marine life. Mar. Pollut. Bull. 2015, 92, 170–179. [Google Scholar] [CrossRef] [PubMed]
  17. Landon-Lane, M. Corporate social responsibility in marine plastic debris governance. Mar. Pollut. Bull. 2018, 127, 310–319. [Google Scholar] [CrossRef]
  18. Blettler, M.; Ulla, M.A.; Rabuffetti, A.P.; Garello, N. Plastic pollution in freshwater ecosystems: Macro-, meso-, and microplastic debris in a floodplain lake. Environ. Monit. Assess. 2017, 189, 581. [Google Scholar] [CrossRef]
  19. Lucas, I. All About Plastics: An Introduction to Micro and Macro Plastic Materials. Sustainably Vegan. 2018. Available online: https://sustainablyvegan.org/week-2-plastix/2018/10/11/all-about-plastics-an-introduction-to-micro-and-macro-plastic-materials (accessed on 14 August 2022).
  20. Halle, A.T.; Ghiglione, J.F. Nanoplastics: A complex, polluting terra incognita. Environ. Sci. Technol. 2021, 55, 14466–14469. [Google Scholar] [CrossRef]
  21. Carpenter, E.J.; Smith, K.L. Plastics on the Sargasso Sea Surface. Science 1972, 175, 1240–1241. [Google Scholar] [CrossRef]
  22. Brooks, A.L.; Wang, S.; Jambeck, J.R. The Chinese import ban and its impact on global plastic waste trade. Sci. Adv. 2018, 4, eaat0131. [Google Scholar] [CrossRef] [PubMed]
  23. Xanthos, D.; Walker, T.R. International policies to reduce plastic marine pollution from single-use plastics (plastic bags and microbeads): A review. Mar. Pollut. Bull. 2017, 118, 17–26. [Google Scholar] [CrossRef] [PubMed]
  24. Law, K.L.; Starr, N.; Siegler, T.R.; Jambeck, J.R.; Mallos, N.J.; Leonard, G.H. The United States’ contribution of plastic waste to land and ocean. Sci. Adv. 2020, 6, eabd0288. [Google Scholar] [CrossRef] [PubMed]
  25. Vetter, D. Guess Which Two Countries Produce the Most Plastic Trash Per Person? Forbes. Available online: https://www.forbes.com/sites/davidrvetter/2020/11/11/which-two-countries-produce-the-most-plastic-trash-per-person/ (accessed on 11 September 2022).
  26. Kaza, S.; Yao, L.; Bhada-Tata, P.; Van Woerden, F. What a Waste 2.0: A Global Snapshot of Solid Waste Management to 2050; World Bank Publications: Washington, DC, USA, 2018. [Google Scholar]
  27. DiBenedetto, M.H.; Donohue, J.; Tremblay, K.; Edson, E.; Law, K.L. Microplastics segregation by rise velocity at the ocean surface. Environ. Res. Lett. 2023, 18, 024036. [Google Scholar] [CrossRef]
  28. Regional Activity Center for Sustainable Consumption and Production; UNEP; Mediterranean Action Plan Barcelona Convention; BRS Conventions; IPEN for a Toxics-Free Future. Plastic’s Toxic Additives and the Circular Economy. 2020. Available online: https://ipen.org/sites/default/files/documents/plastics_and_additives_final-low-o-en.pdf (accessed on 19 August 2022).
  29. Vora, N.; Christensen, P.R.; Demarteau, J.; Baral, N.R.; Keasling, J.D.; Helms, B.A.; Scown, C.D. Leveling the cost and carbon footprint of circular polymers that are chemically recycled to monomer. Sci. Adv. 2021, 7, eabf0187. [Google Scholar] [CrossRef]
  30. Kirchherr, J.; Reike, D.; Hekkert, M. Conceptualizing the circular economy: An analysis of 114 definitions. Resour. Conserv. Recycl. 2017, 127, 221–232. [Google Scholar] [CrossRef]
  31. Mavropoulos, A.; Nilsen, A.W. Industry 4.0 and Circular Economy: Towards a Wasteless Future or a Wasteful Planet? John Wiley & Sons: Hoboken, NJ, USA, 2020. [Google Scholar]
  32. Kara, S.; Hauschild, M.; Sutherland, J.; McAloone, T. Closed-loop systems to circular economy: A pathway to environmental sustainability? CIRP Ann. 2022, 71, 505–528. [Google Scholar] [CrossRef]
  33. Prendeville, S.; Sanders, C.; Sherry, J.; Costa, F. Circular economy: Is it enough, EcoDesign Cent. Wales 2014, 21, 2014. Available online: https://www.researchgate.net/profile/Sharon-Prendeville-2/publication/301779162_Circular_Economy_Is_it_Enough/links/5727a2be08aef9c00b8b4ddd/Circular-Economy-Is-it-Enough.pdf (accessed on 1 July 2022).
  34. Heidbreder, L.M.; Steinhorst, J.; Schmitt, M. Plastic-Free July: An Experimental Study of Limiting and Promoting Factors in Encouraging a Reduction of Single-Use Plastic Consumption. Sustainability 2020, 12, 4698. [Google Scholar] [CrossRef]
  35. Chidepatil, A.; Bindra, P.; Kulkarni, D.; Qazi, M.; Kshirsagar, M.; Sankaran, K. From Trash to Cash: How Blockchain and Multi-Sensor-Driven Artificial Intelligence Can Transform Circular Economy of Plastic Waste? Adm. Sci. 2020, 10, 23. [Google Scholar] [CrossRef]
  36. Plastic Waste Is a Growing Menace, and a Wasted Opportunity. Available online: https://blogs.worldbank.org/eastasiapacific/plastic-waste-growing-menace-and-wasted-opportunity (accessed on 15 October 2022).
  37. Hardesty, B.D.; Harari, J.; Isobe, A.; Lebreton, L.; Maximenko, N.; Potemra, J.; van Sebille, E.; Vethaak, A.D.; Wilcox, C. Using Numerical Model Simulations to Improve the Understanding of Micro-plastic Distribution and Pathways in the Marine Environment. Front. Mar. Sci. 2017, 4, 30. [Google Scholar] [CrossRef]
  38. Lee, H.L. Value Chain Innovations to Foster Development. In Responsible Business Operations; Springer: Berlin/Heidelberg, Germany, 2021; pp. 1–18. [Google Scholar]
  39. Zhang, F.; Wu, X.; Tang, C.S.; Feng, T.; Dai, Y. Evolution of operations management research: From managing flows to building capabilities. Prod. Oper. Manag. 2020, 29, 2219–2229. [Google Scholar] [CrossRef]
  40. Unruh, G.; Kiron, D.; Kruschwitz, N.; Reeves, M.; Rubel, H.; Felde, A.M.Z. Investing for a sustainable future: Investors care more about sustainability than many executives believe. MIT Sloan Manag. Rev. 2016, 57, 4. [Google Scholar]
  41. Sun, J.; Fang, C.; Chen, Z.; Chen, G. Regional cooperation in marine plastic waste cleanup in the south China sea region. Sustainability 2021, 13, 9221. [Google Scholar] [CrossRef]
  42. Bhubalan, K.; Tamothran, A.M.; Kee, S.H.; Foong, S.Y.; Lam, S.S.; Ganeson, K.; Vigneswari, S.; Amirul, A.A.; Ramakrishna, S. Leveraging blockchain concepts as watermarkers of plastics for sustainable waste management in progressing circular economy. Environ. Res. 2022, 213, 113631. [Google Scholar] [CrossRef]
  43. Cornwall, W. The plastic eaters. American Association for the Advancement of Science. Science 2021, 373, 36–39. [Google Scholar] [CrossRef]
  44. Yoshida, S.; Hiraga, K.; Takehana, T.; Taniguchi, I.; Yamaji, H.; Maeda, Y.; Toyohara, K.; Miyamoto, K.; Kimura, Y.; Oda, K. A bacterium that degrades and assimilates poly (ethylene terephthalate). Science 2016, 351, 1196–1199. [Google Scholar] [CrossRef]
  45. Plastic or Rubber Exports by Country & Region US$000 2018|WITS Data. Available online: https://wits.worldbank.org/CountryProfile/en/Country/WLD/Year/2018/TradeFlow/Export/Partner/All/Product/39-40_PlastiRub (accessed on 14 August 2022).
  46. PEW. Breaking the Plastic Wave: Top Findings for Preventing Plastic Pollution. Available online: https://pew.org/2WmV10d (accessed on 14 August 2022).
  47. El-Rayes, N.; Shi, J. A Paradigm Shift for Tackling the Plastic Crisis: A Data-Driven Study. In Proceedings of the 2022 DSI Annual Conference Proceeding, Houston, TX, USA, 19–21 November 2022; pp. 71–83. [Google Scholar]
  48. van Eck, N.J.; Waltman, L. Software survey: VOSviewer, a computer program for bibliometric mapping. Scientometrics 2010, 84, 523–538. [Google Scholar] [CrossRef]
  49. Chang, A.J.; El-Rayes, N.; Shi, J. Blockchain Technology for Supply Chain Management: A Comprehensive Review. FinTech 2022, 1, 191–205. [Google Scholar] [CrossRef]
  50. Artificial Intelligence for Recycling: AMP Robotics. Available online: https://ellenmacarthurfoundation.org/circular-examples/artificial-intelligence-for-recycling-amp-robotics (accessed on 25 September 2022).
  51. Artificial Intelligence and the Circular Economy. Available online: https://ellenmacarthurfoundation.org/artificial-intelligence-and-the-circular-economy (accessed on 25 September 2022).
  52. How Blockchain Can Facilitate the Transition to a Circular Economy. Available online: https://ellenmacarthurfoundation.org/tech-enablers-series/part-2 (accessed on 25 September 2022).
  53. Dell Technologies. Plastics: Rethinking the Cycle. Available online: https://www.dell.com/en-us/perspectives/plastics-rethinking-the-cycle/ (accessed on 14 August 2022).
  54. Liu, C.; Zhang, X.; Medda, F. Plastic credit: A consortium blockchain-based plastic recyclability system. Waste Manag. 2021, 121, 42–51. [Google Scholar] [CrossRef]
  55. Khadke, S.; Gupta, P.; Rachakunta, S.; Mahata, C.; Dawn, S.; Sharma, M.; Verma, D.; Pradhan, A.; Krishna, A.M.S.; Ramakrishna, S.; et al. Efficient Plastic Recycling and Remolding Circular Economy Using the Technology of Trust–Blockchain. Sustainability 2021, 13, 9142. [Google Scholar] [CrossRef]
  56. Steenmans, K.; Taylor, P.; Steenmans, I. Blockchain Technology for Governance of Plastic Waste Management: Where Are We? Soc. Sci. 2021, 10, 434. [Google Scholar] [CrossRef]
  57. Geyer, R.; Jambeck, J.R.; Law, K.L. Production, use, and fate of all plastics ever made. Sci. Adv. 2017, 3, e1700782. [Google Scholar] [CrossRef] [PubMed]
  58. The Global Commitment. Available online: https://ellenmacarthurfoundation.org/global-commitment/overview (accessed on 14 August 2022).
  59. Erhun, F.; Kraft, T.; Wijnsma, S. Sustainable triple-A supply chains. Prod. Oper. Manag. 2021, 30, 644–655. [Google Scholar] [CrossRef]
  60. Blondin, M.J.; Hale, M. An algorithm for multi-objective multi-agent optimization. In Proceedings of the 2020 American Control Conference (ACC), Denver, CO, USA, 1–3 July 2020; pp. 1489–1494. [Google Scholar]
Figure 1. Retrieval and review process on publications [47].
Sustainability 15 07181 g001
Figure 2. The 5 ‘R’ throughout the themes reviewed [47].
Sustainability 15 07181 g002
Figure 3. ‘Blockchain’ and publications across research areas (Note: The year 2022 is also included until October 2022).
Sustainability 15 07181 g003
Figure 4. Clusters of research on ‘Blockchain’ and ‘plastic’.
Sustainability 15 07181 g004
Figure 5. Global plastic production (2015–2019) and prediction (2020–2025). Source Date: Statista (2022) and [57].
Sustainability 15 07181 g005
Figure 6. U.S. consumers plastic waste management. Data Source: the American Chemistry Council, the National Association for PET Container Resources, and the Association of Plastic Recyclers.
Sustainability 15 07181 g006
Table 1. Datasets collected (similar data source as used in [47]).
Data SetSourceYearRecords
Plastic wasteAAAS2016C
Marine Debris TrackerCS Cloud (USDS)2016–2020≈1.04 Million
Top Items (by Continent)CS Cloud (USDS)2015–2018153
Bag TaxDM2010–2020≈50.9 K
Plastic PackagingData. World201945
Plastic WasteGCDL2016125
Population SizeOECD2010–2016125
Waste ManagementOECD2010–201623
Economic statusWB & AAAS2016125
Plastic WasteTides (USDS)2015–2020≈83 K
Acronyms & Abbreviation: AAAS: American Association for the per capita and Advancement of Science; CS: Citizen Science; DM: Data Montgomery; GCDL: Global Change Data Lab; OECD: Organization for Economic and Co-operation; USDS: U.S. Department of State; WB: World Bank.
Table 2. Top plastic waste items collected under Marine Debris Tracker (items collected by NOAA, GA Sea Turtle Center, and other institutions).
ItemsYear
(2015–2020)
ItemYear
(2015–2020)
Plastic pieces≈113 MillionBags≈10.5 Million
Packaging/Wrappers≈27 MillionUtensils≈9.5 Million
Bottles≈14.6 MillionBottle caps≈9.2 Million
Straws/Stirrers≈10.9 MillionLids≈4.5 Million
Disclaimer/Publisher’s Note: The statements, opinions and data contained in all publications are solely those of the individual author(s) and contributor(s) and not of MDPI and/or the editor(s). MDPI and/or the editor(s) disclaim responsibility for any injury to people or property resulting from any ideas, methods, instructions or products referred to in the content.

