
Integrated Optimization of Order Allocation and Last-Mile Multi-Temperature Joint Distribution for Fresh Agriproduct Community Retail


Abstract
:1. Introduction
2. Literature Review
3. Problem Description and Model Formulation
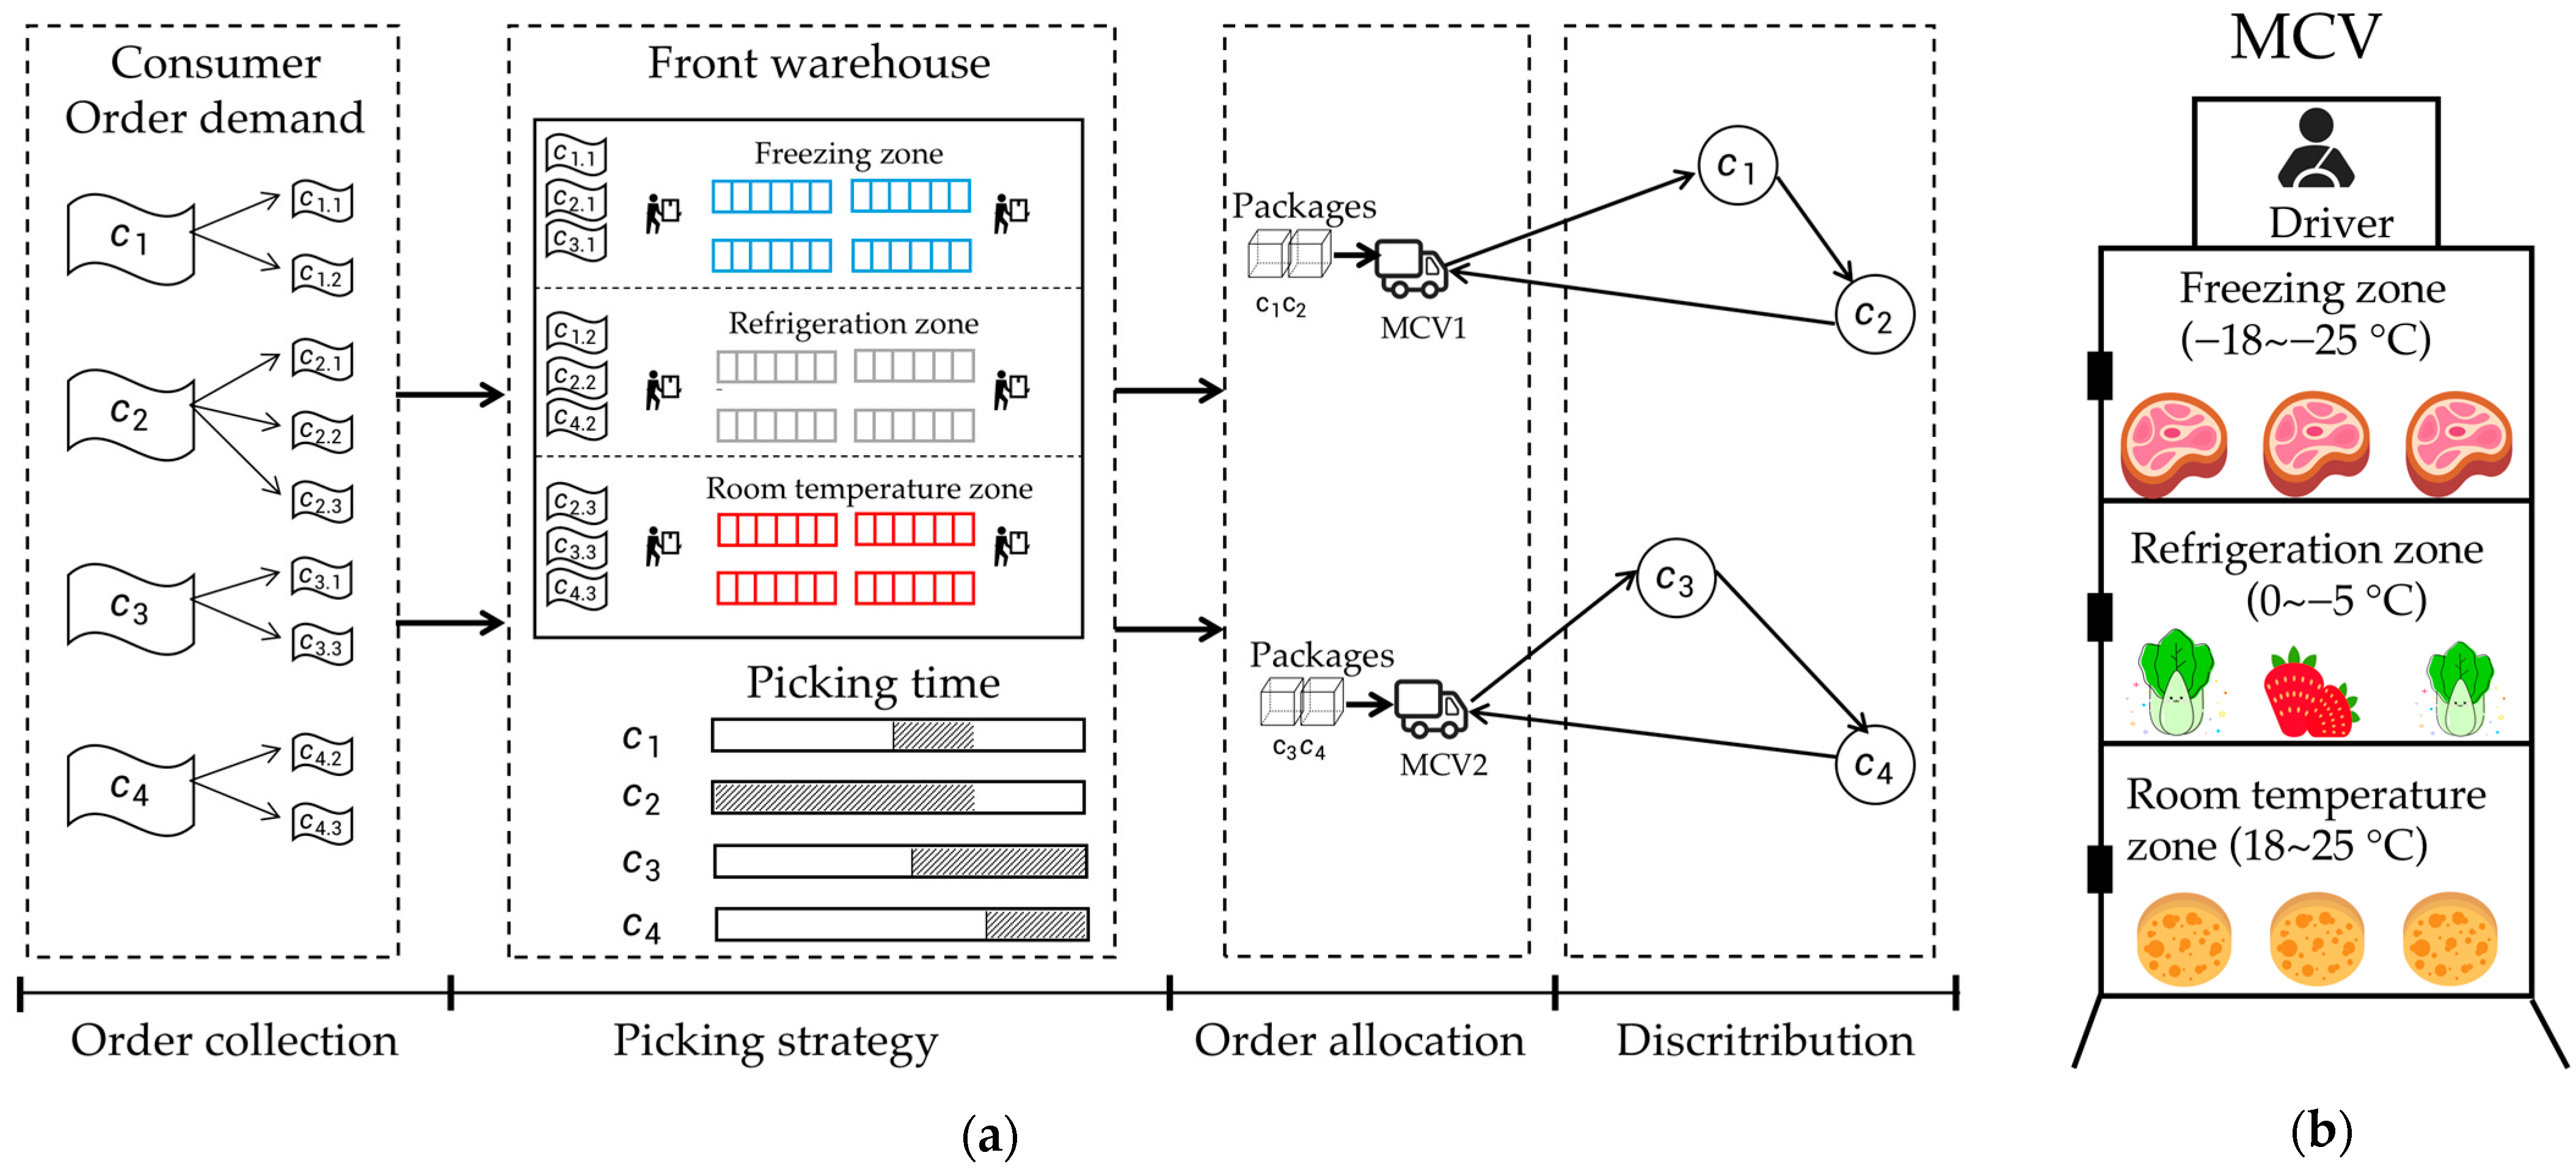
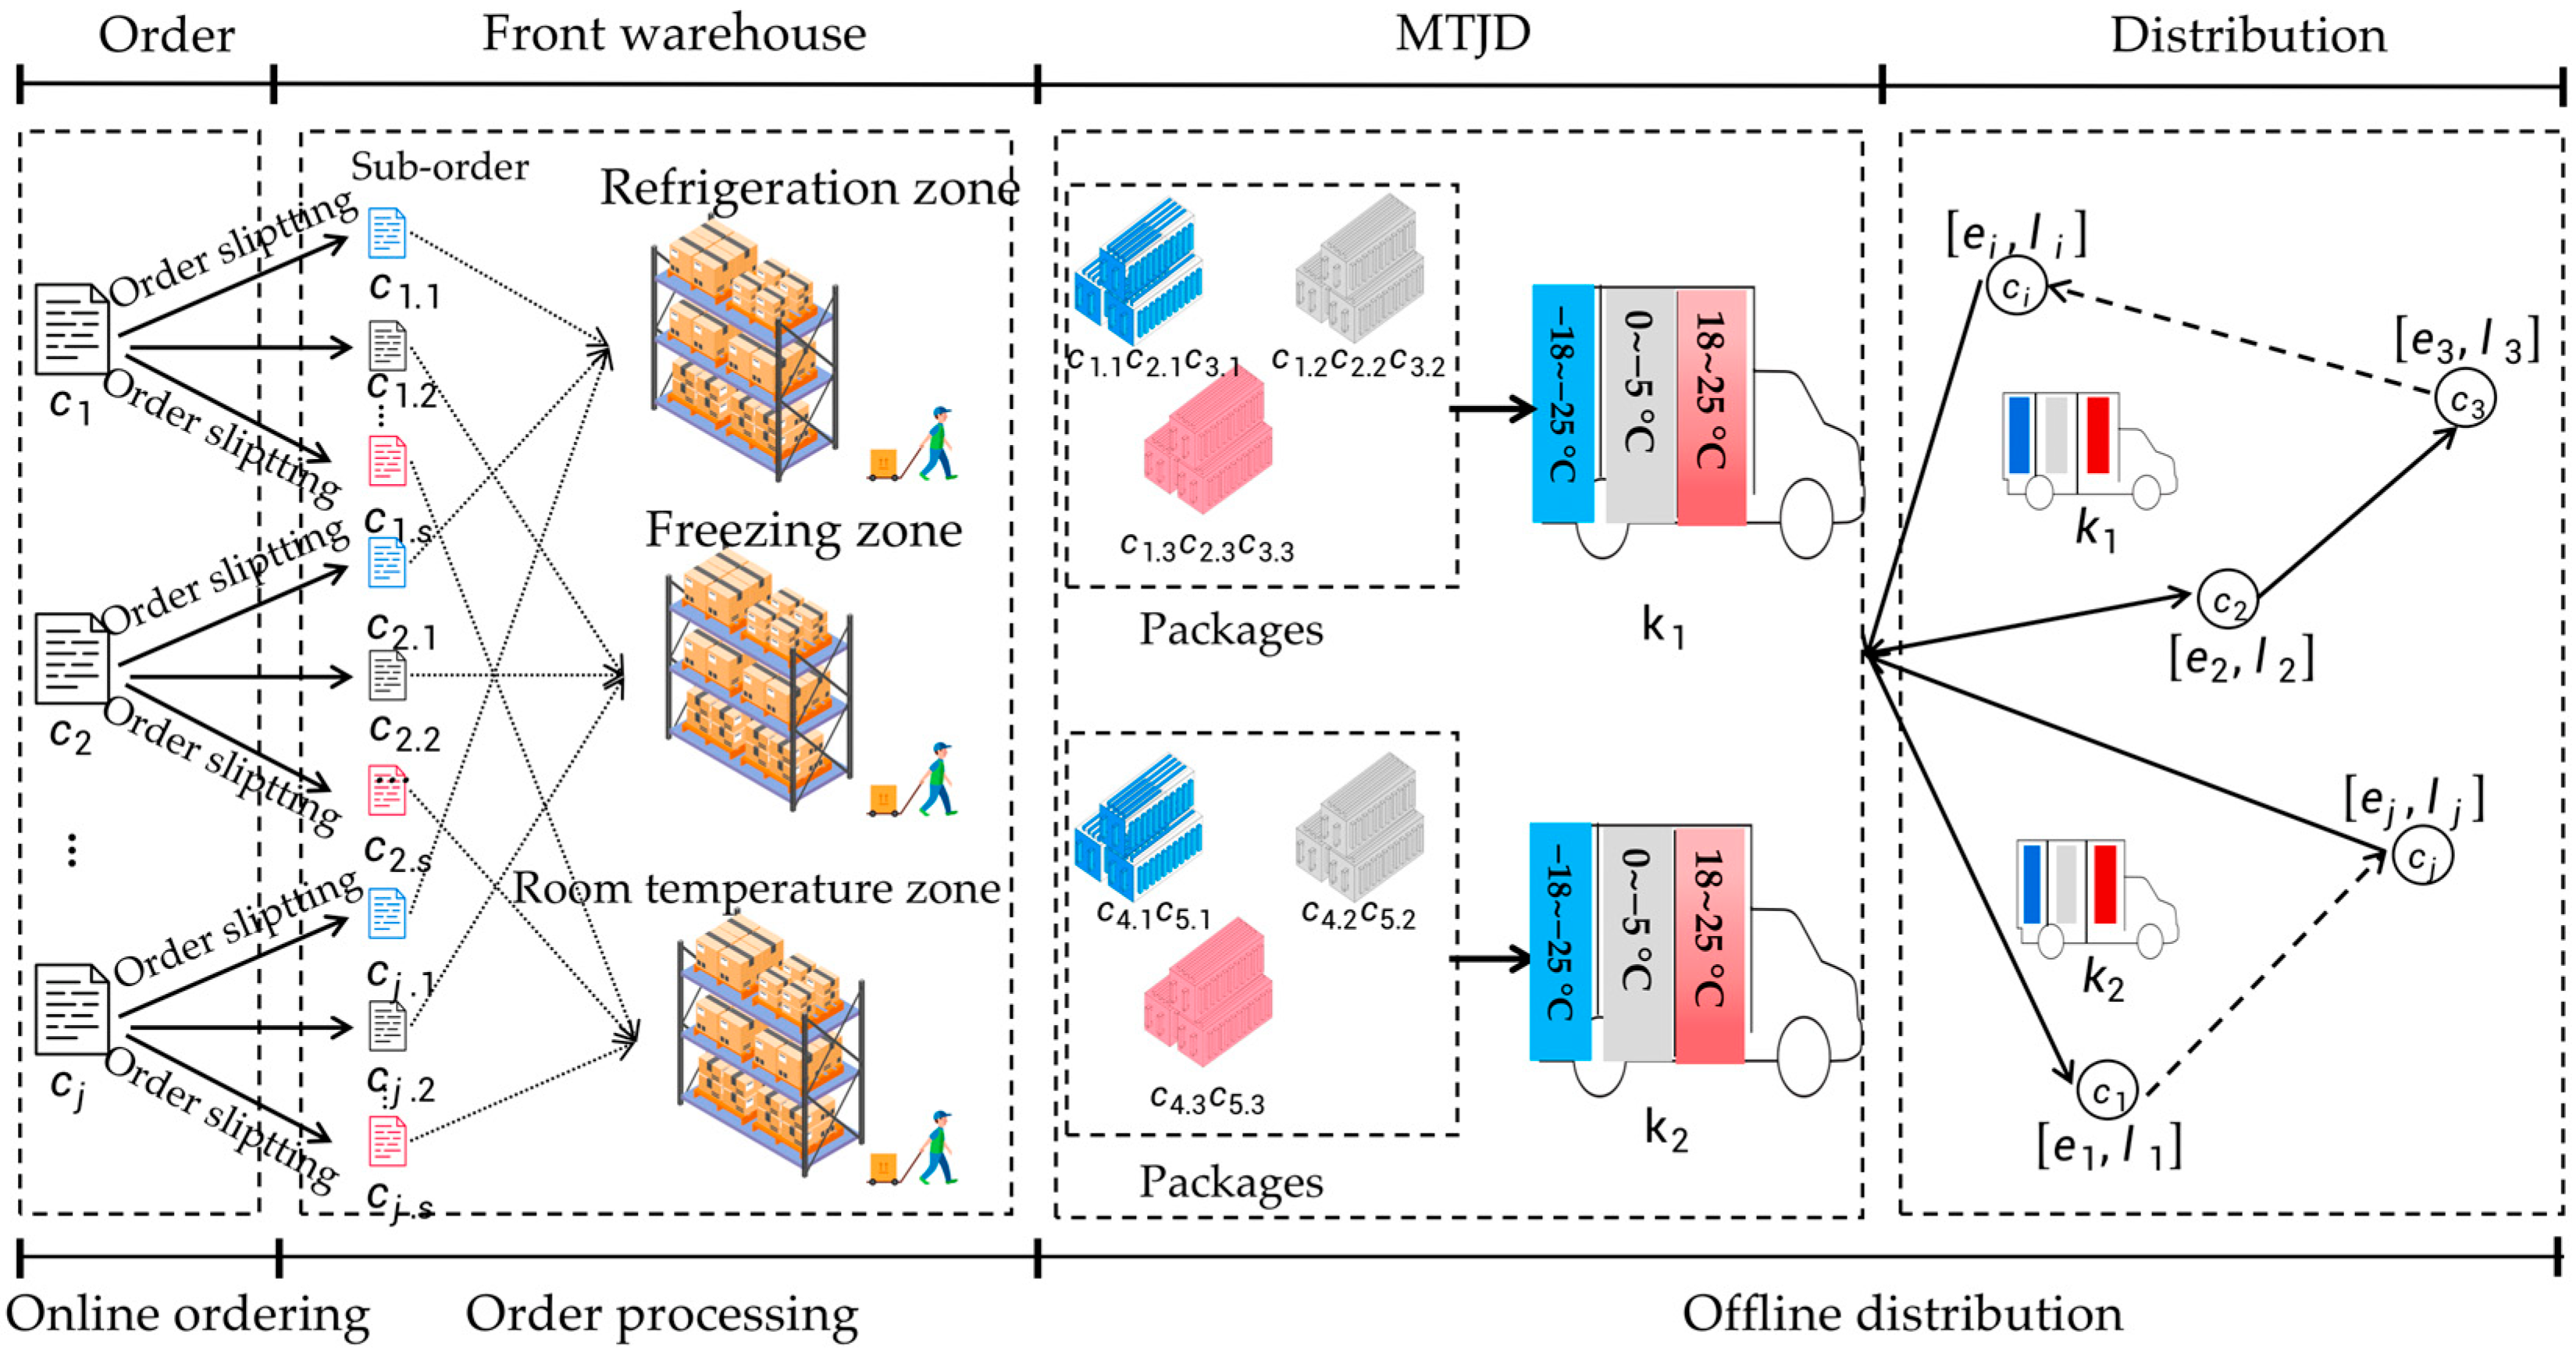
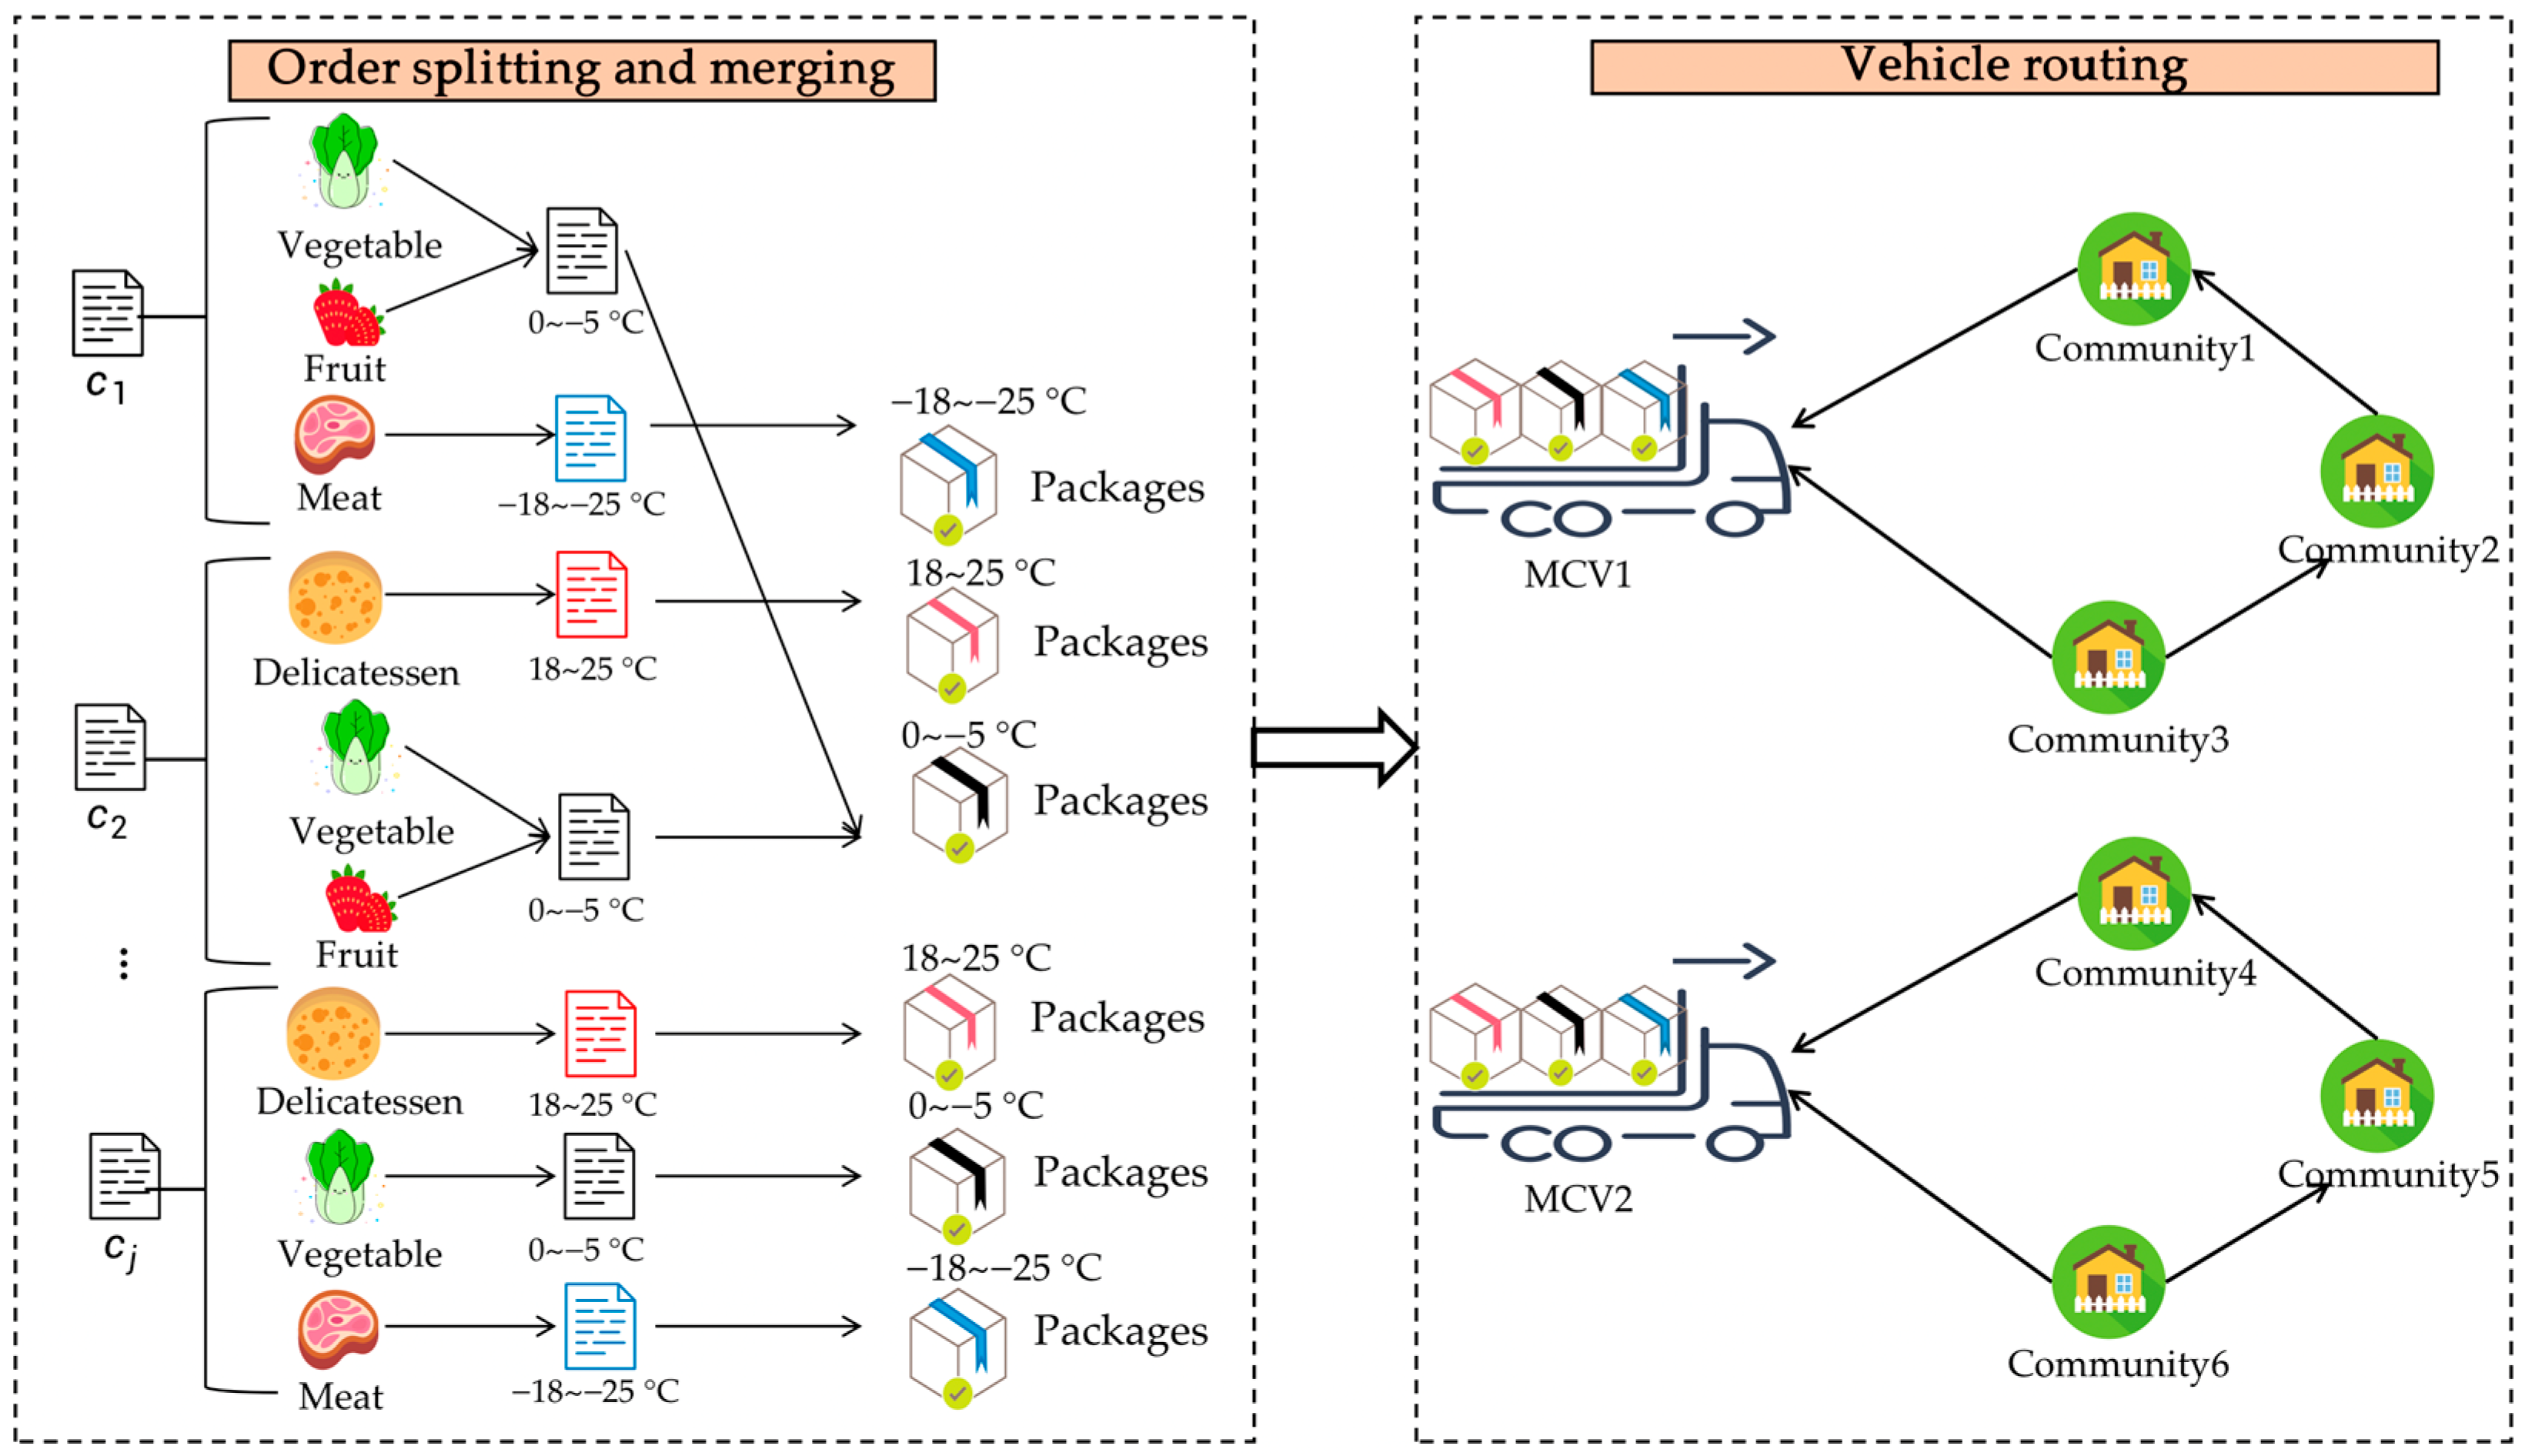
3.1. Problem Description
3.2. Objective Function
3.2.1. Maturity Penalty Cost
3.2.2. Distribution Cost
3.2.3. Refrigeration Cost
3.3. Constraints
3.4. Model Formulation
4. Mixed Genetic Algorithm
4.1. Reduction of Solution Space
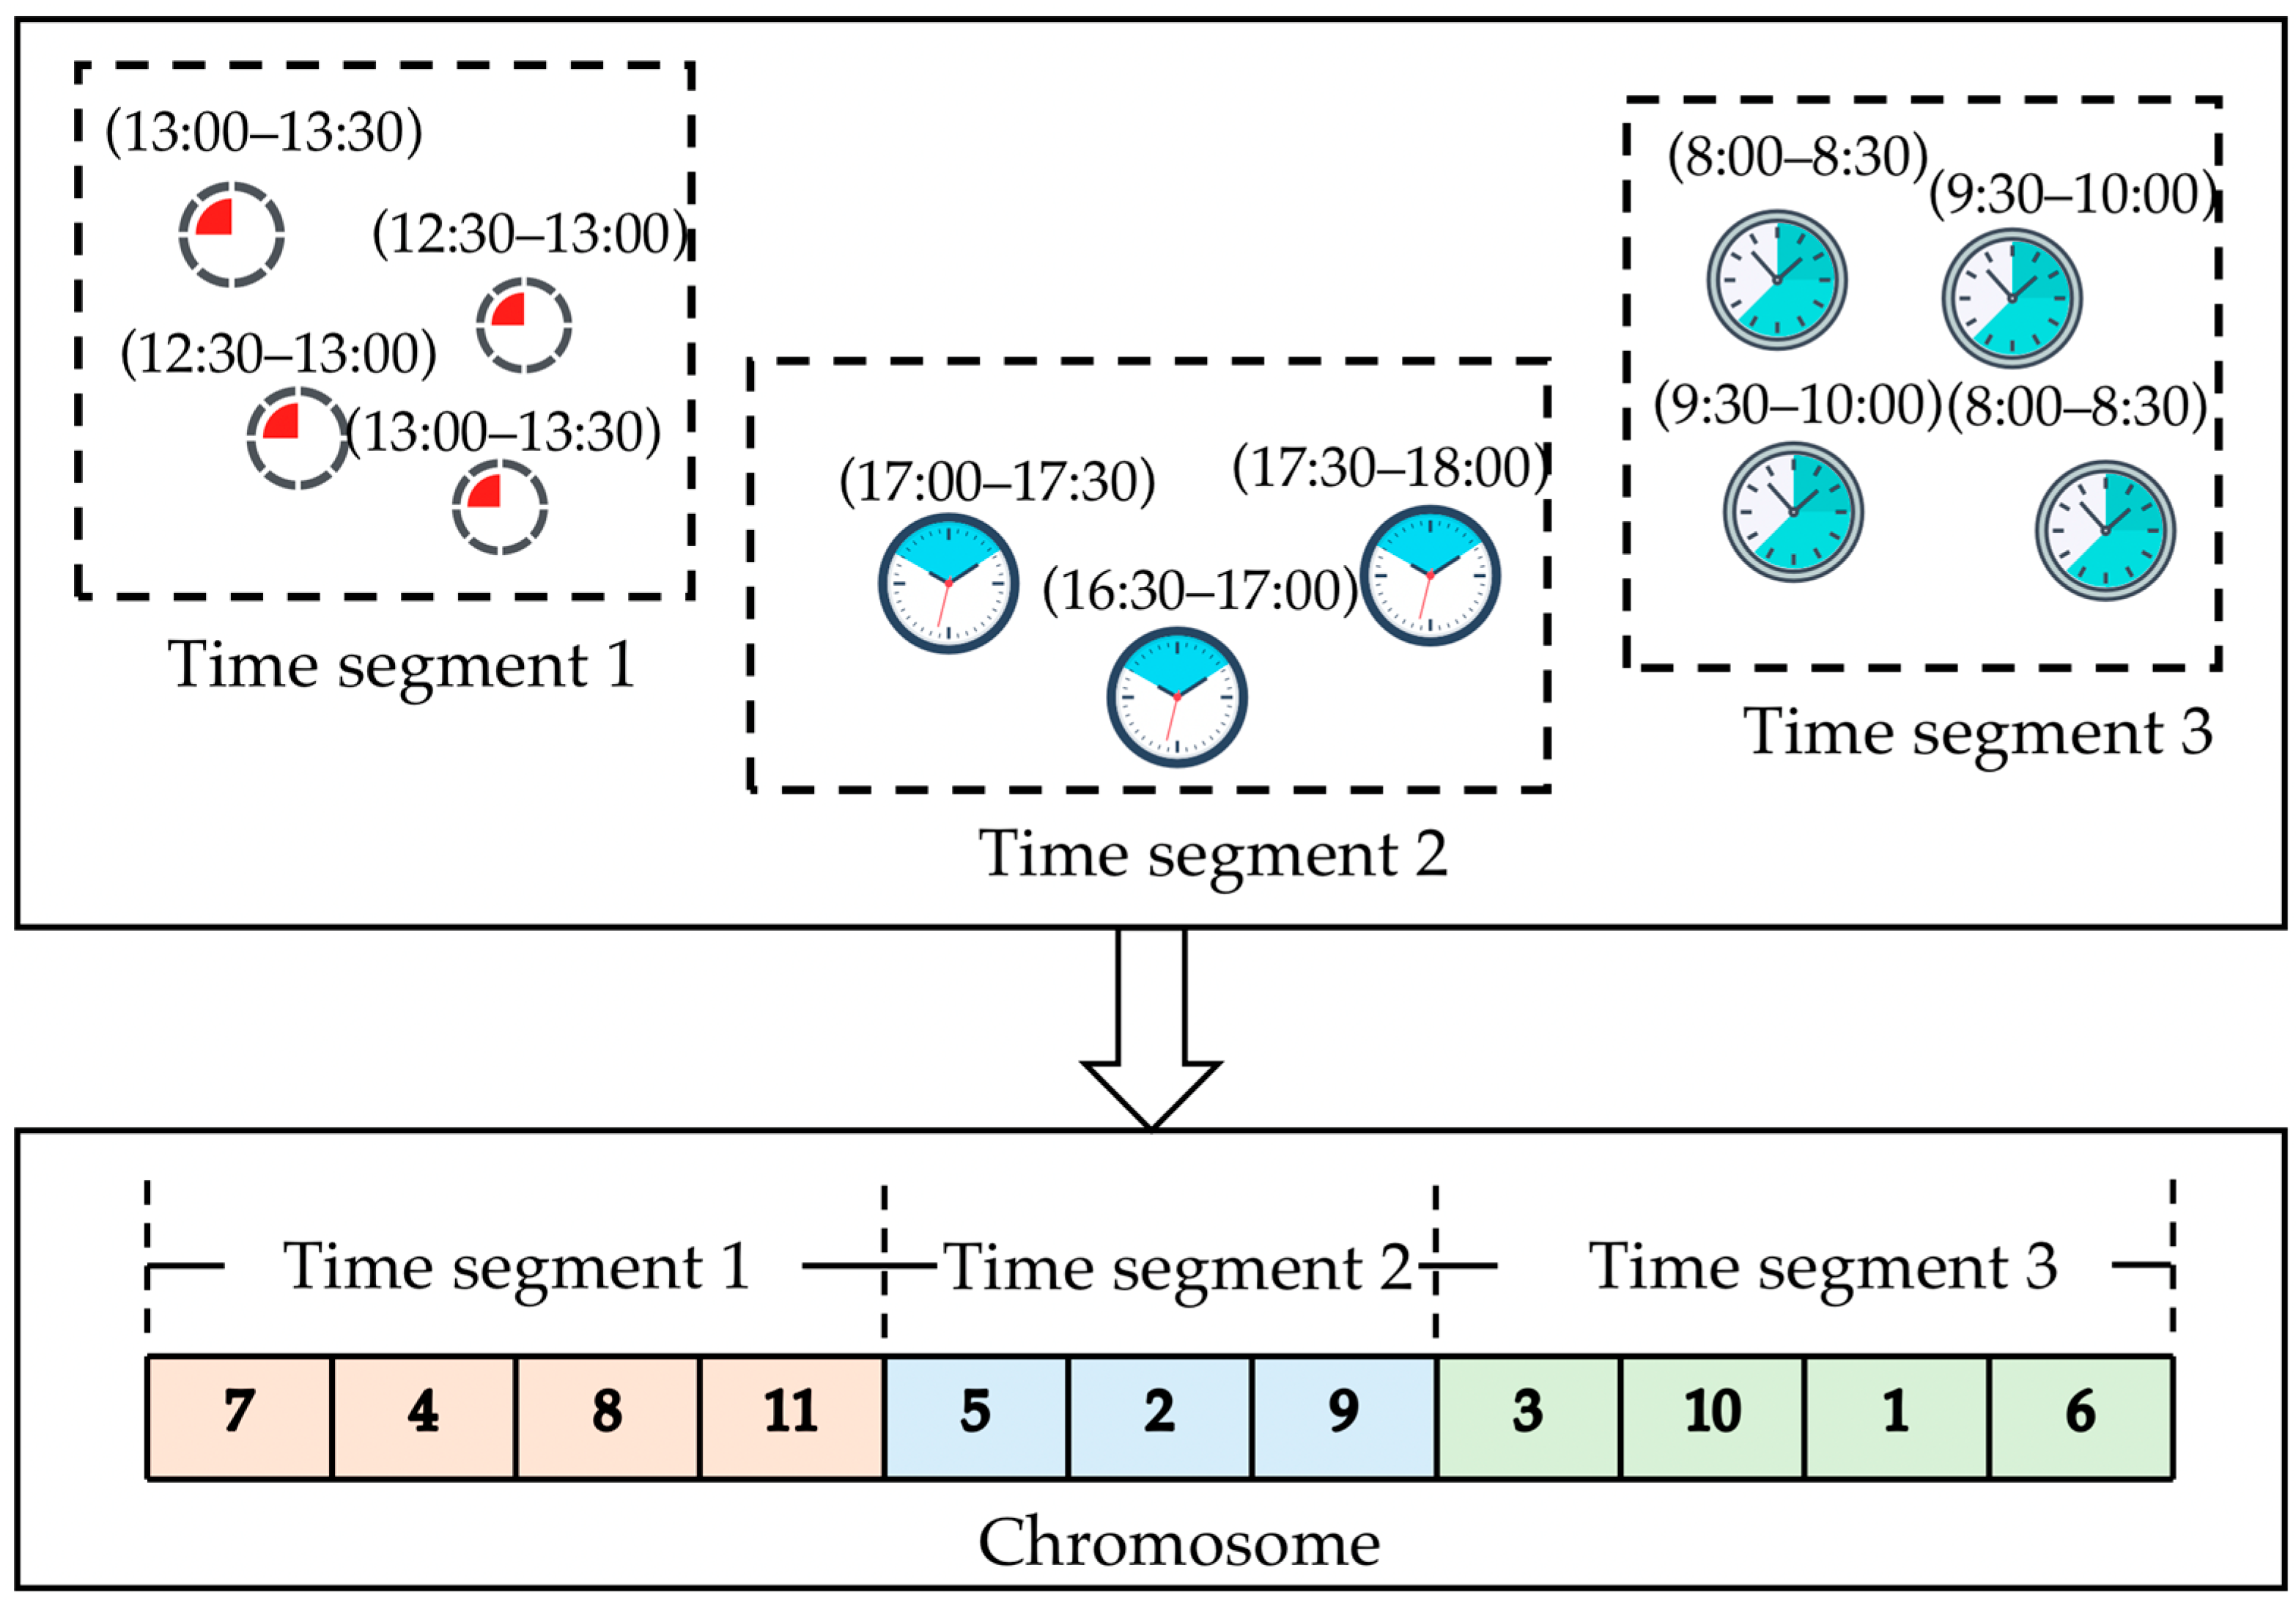
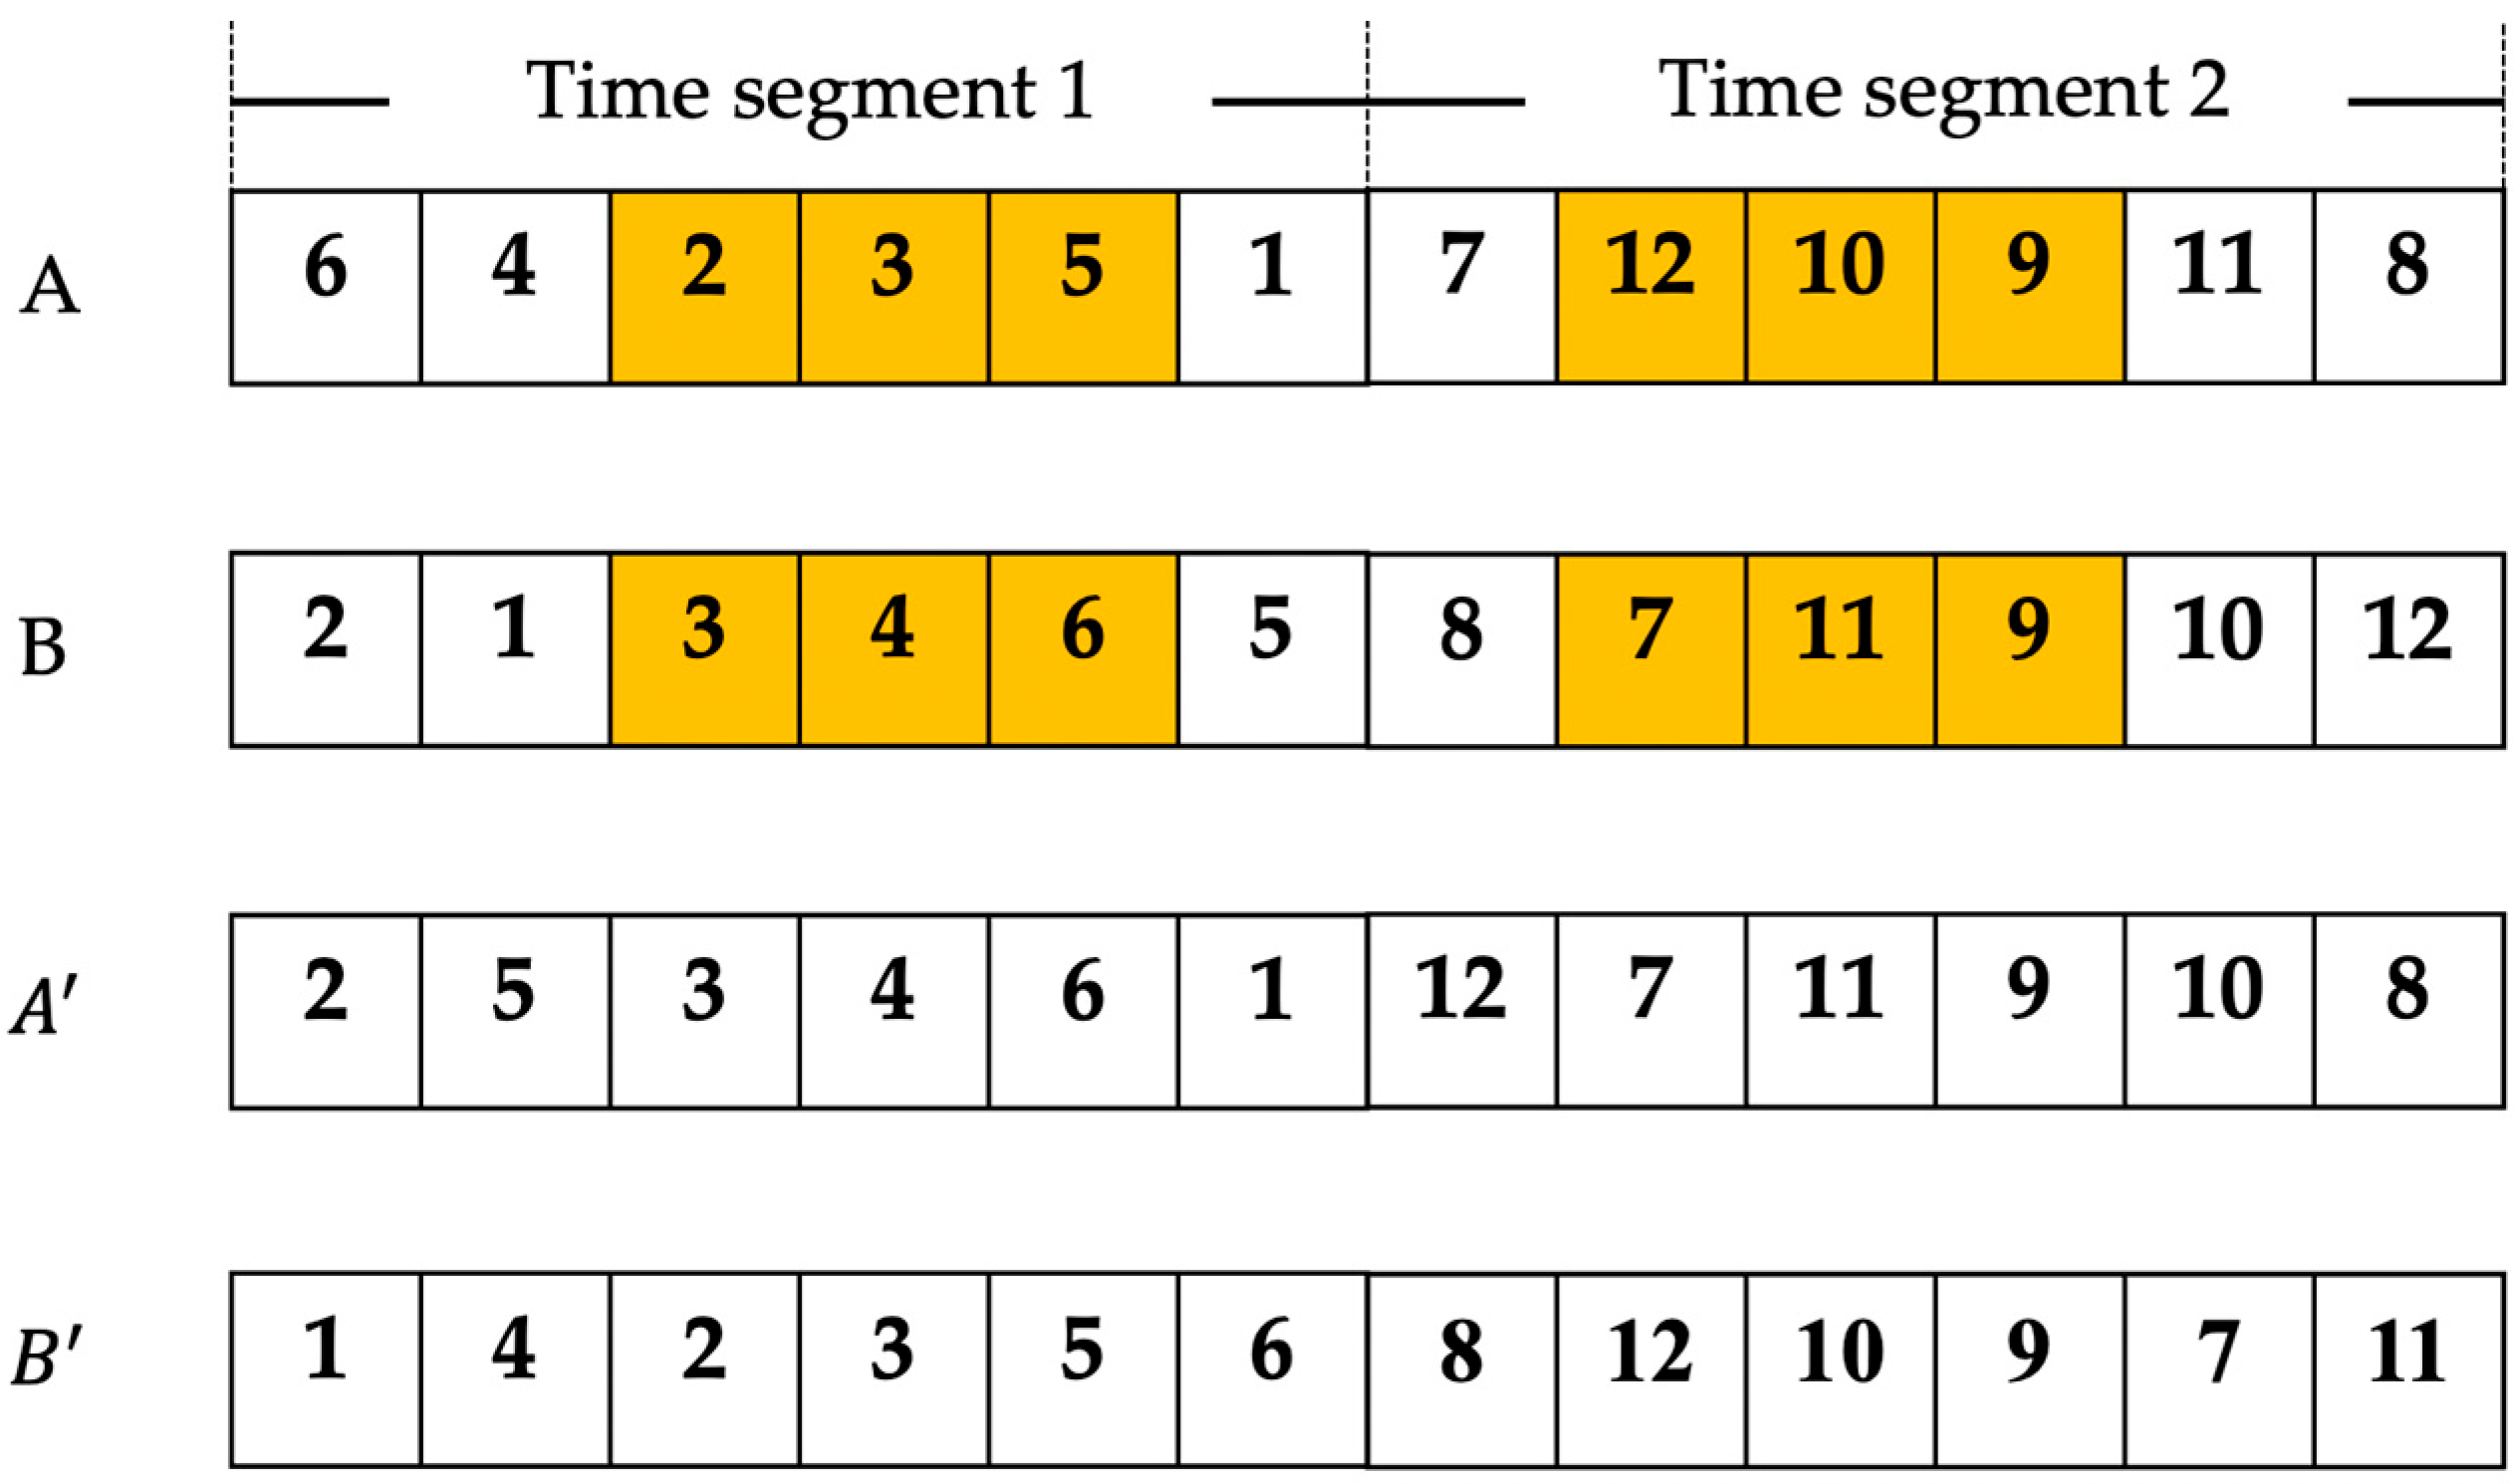
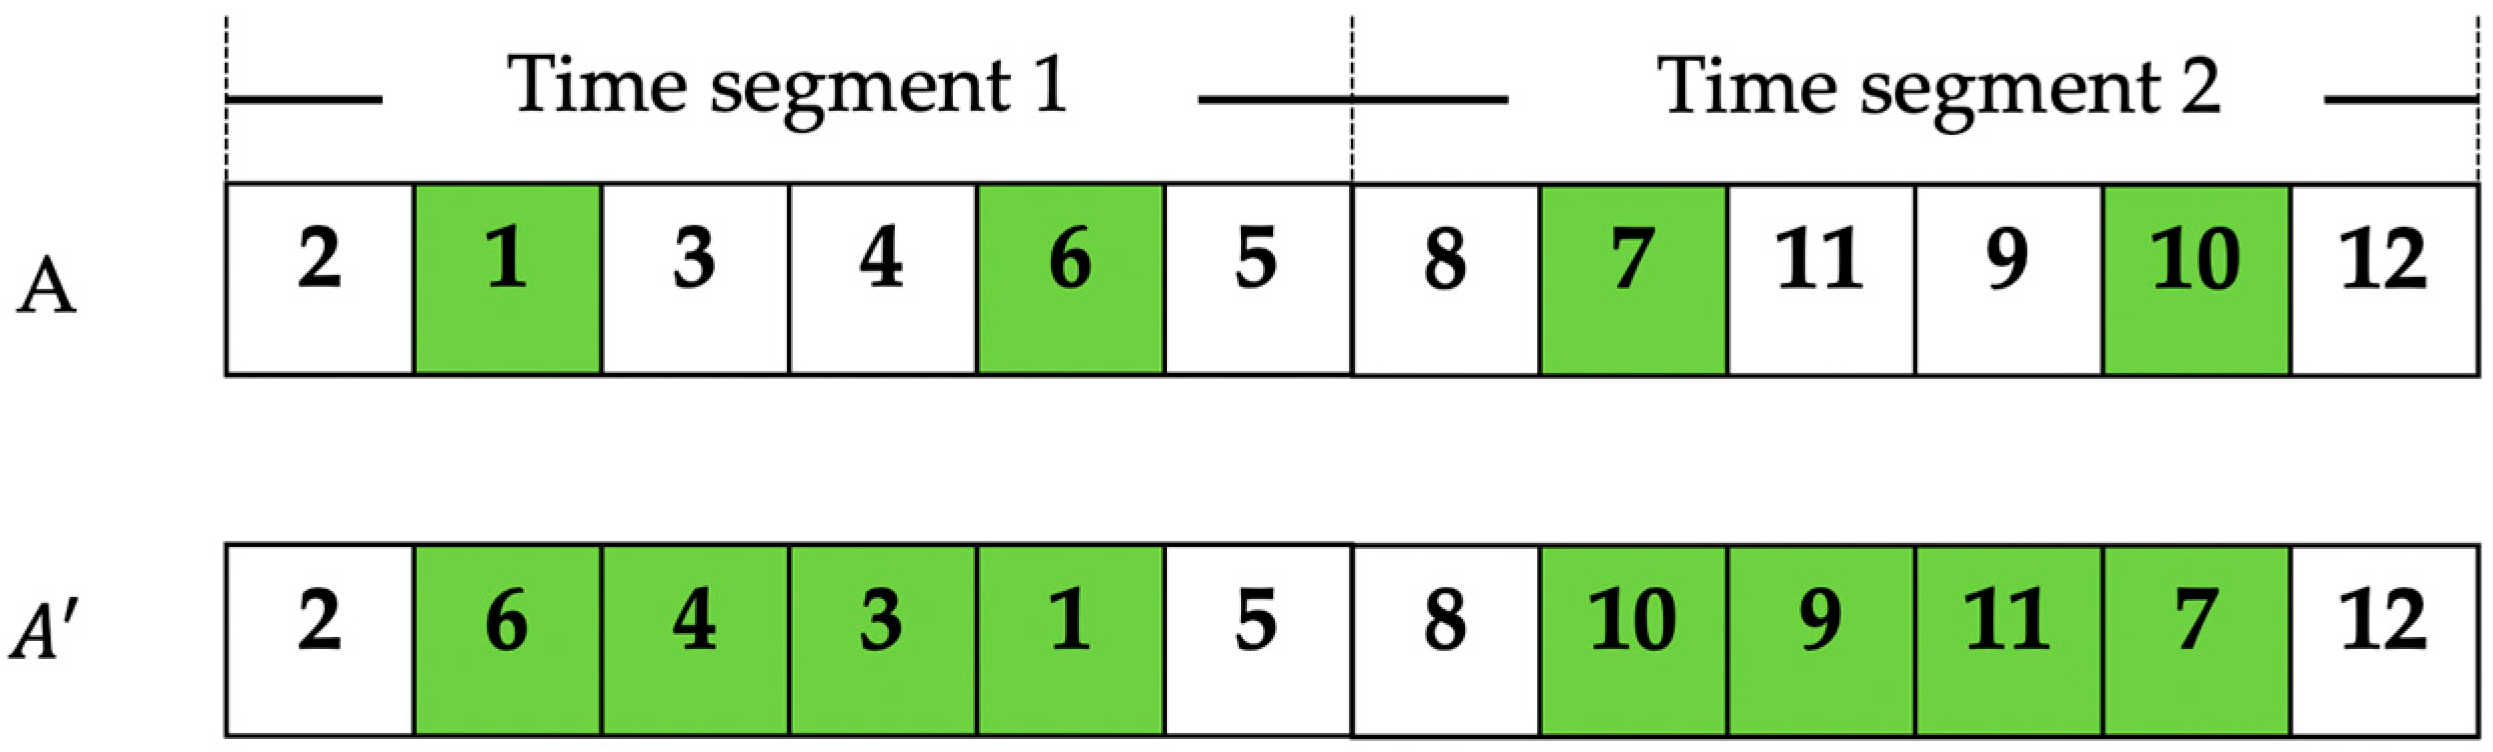
4.2. Efficient Chromosome Coding Method
4.3. Implementation of MGA
| Algorithm 1. MGA | ||
| Input: (Initialize Solution , set crossover probability , mutation probability , population size , the number of evolutionary iterations .) | ||
| 1: | generate a solution using the k-means clustering method | Section 4.1 |
| 2: | set | |
| 3: | While) | Section 4.2 |
| 4: | for to | |
| 5: | evaluation of individual populations | |
| 6: | end for | |
| 7: | select parents from using roulette selection | |
| 8: | select parents from using crossover and mutation | |
| 9: | generate solution | |
| 10: | if is better than then | |
| 11: | ||
| 12: | ||
| 13: | end if | |
| 14: | end while | |
| 15: | return | |
5. Numerical Experiments
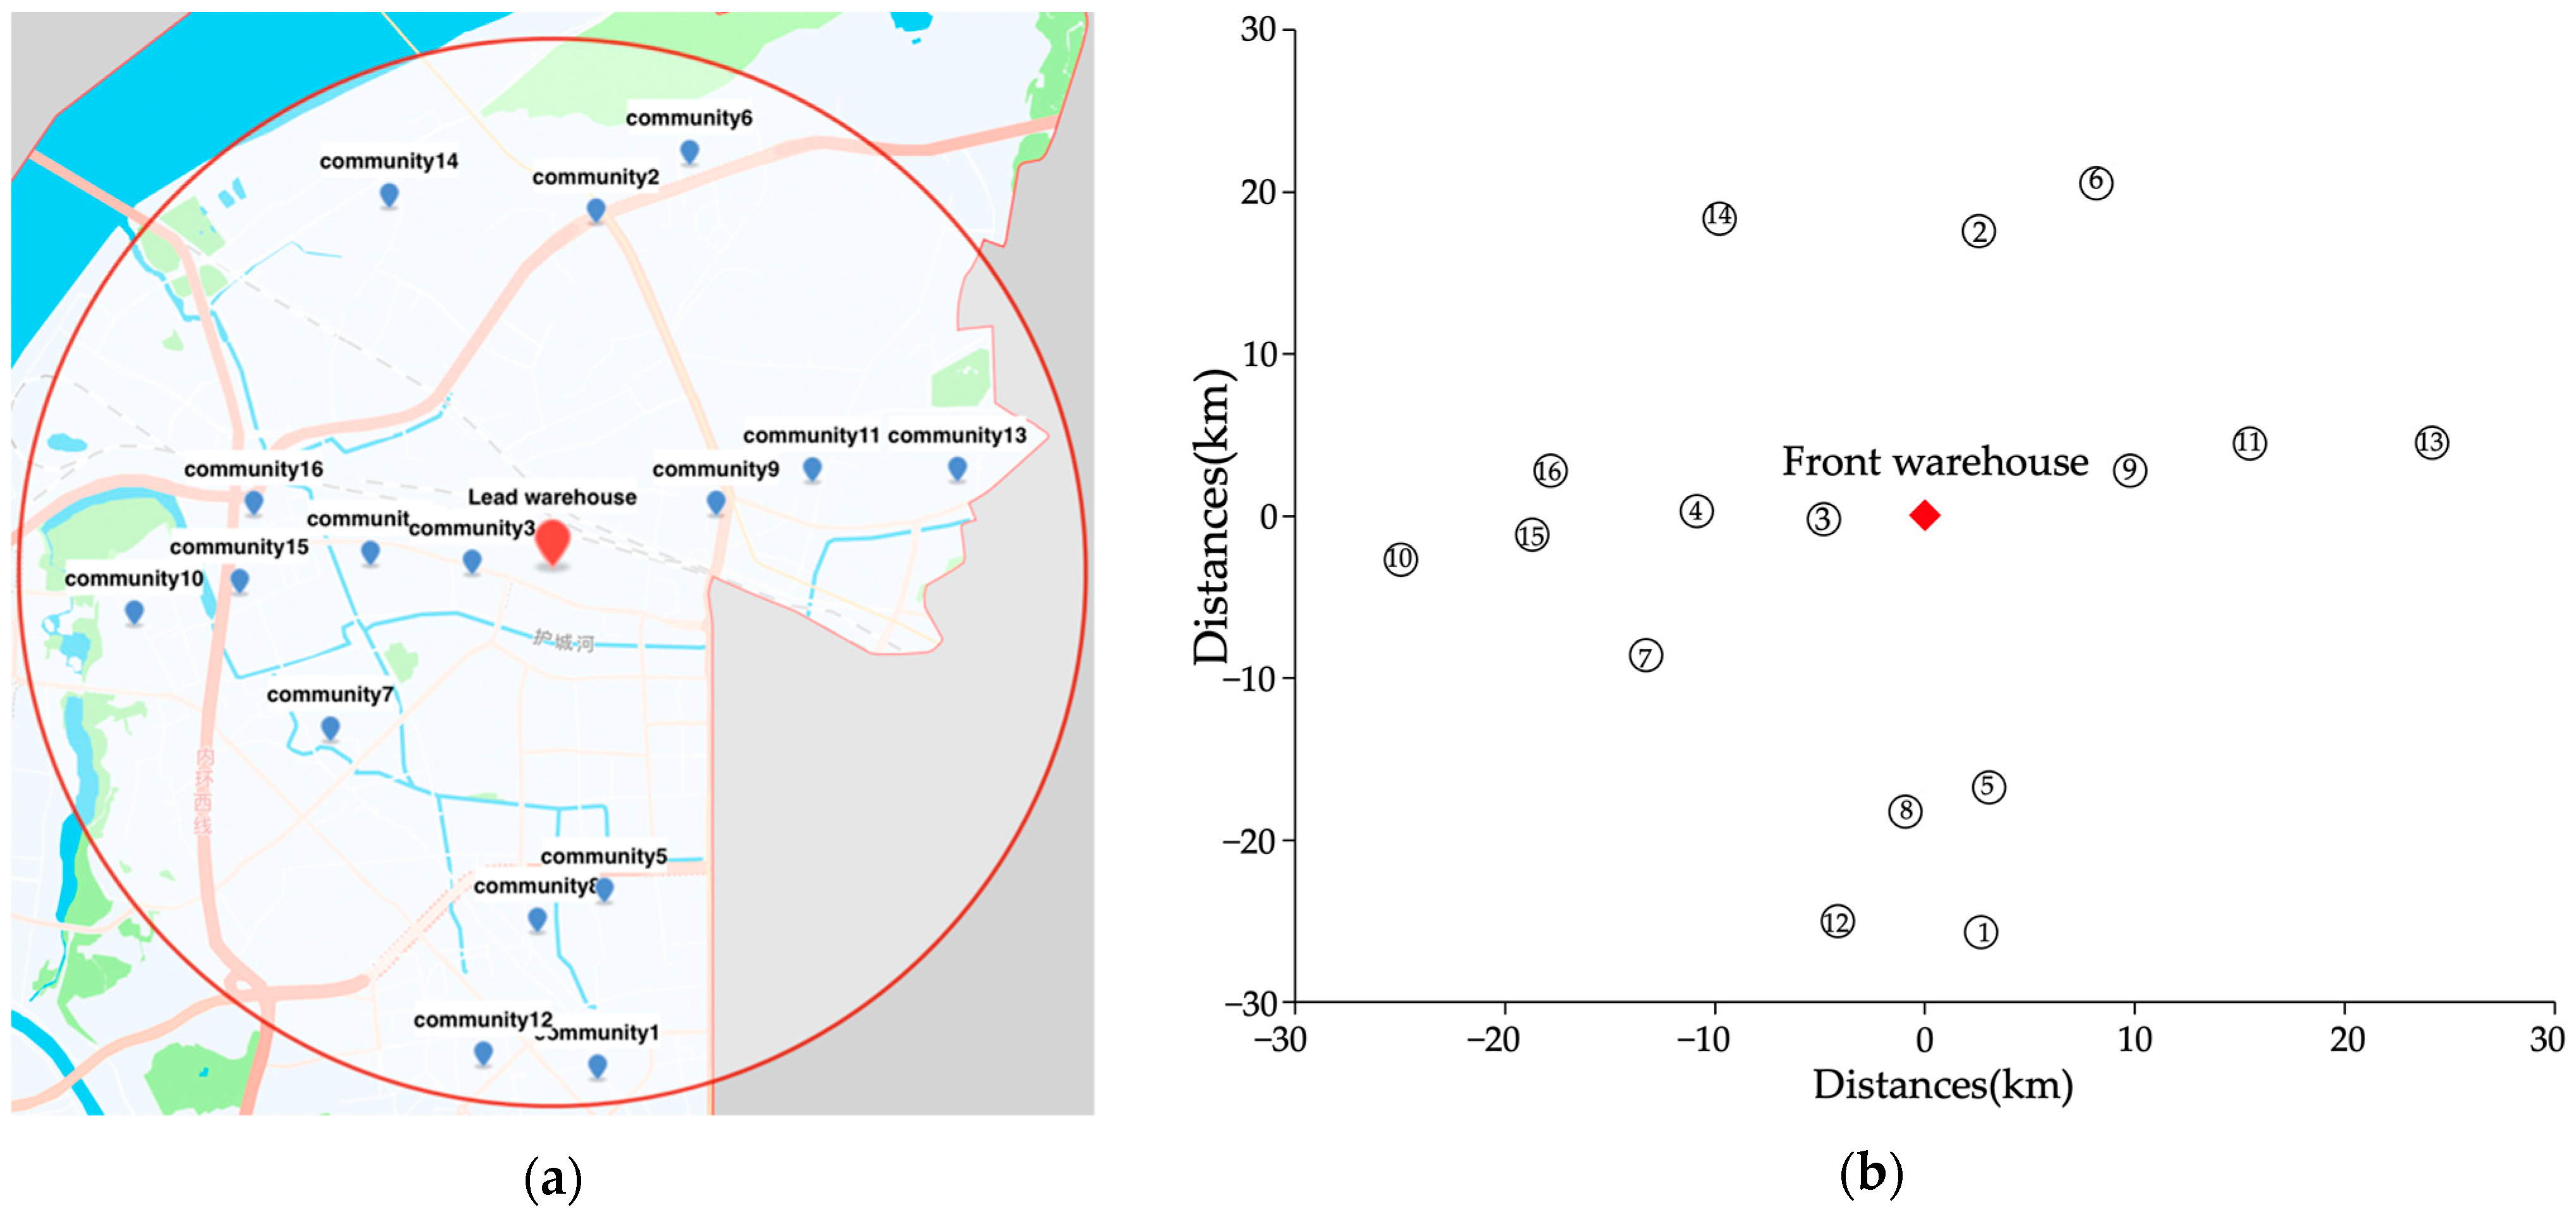
5.1. A Case Study of Fresh E-Commerce in the Gulou District of Nanjing City
5.2. Medium- to Large-Scale Numerical Experiments
6. Discussion and Conclusions
6.1. Academic Implications
6.2. Managerial Implications
6.3. Limitations and Future Research
Author Contributions
Funding
Institutional Review Board Statement
Informed Consent Statement
Data Availability Statement
Conflicts of Interest
Abbreviations
| Notations | |
| If , front warehouse, else , community nodes | |
| If , front warehouse, else , community nodes | |
| Vehicle, | |
| Temperature zone type | |
| Commodity type, | |
| Commodity type, | |
| Index Sets | |
| N | Set of nodes including one front warehouse and multiple consumers |
| N′ | Set of consumer nodes, N′ = N/{0} |
| K | Set of vehicles |
| S | Set of temperature zone types |
| P | Set of commodity types purchased by customers |
| Parameters | |
| The demand quantity of category of customers (kg) | |
| Unit increase rate of earliness penalty cost (CNY/min) | |
| Unit increase rate of tardiness penalty cost (CNY/min) | |
| Fixed usage cost of vehicle (CNY) | |
| Unit distribution cost of vehicle (CNY/kCal/h) | |
| Number of vehicles | |
| Loading capacity of vehicle temperature layer (ton) | |
| Order unit weight picking time (min/kg) | |
| Distribution time between consumer and (min) | |
| Unit refrigerant price (CNY/kCal) | |
| Heat load coefficient during loading and unloading process (CNY/kCal) | |
| Heat transfer coefficient () | |
| Average surface area of refrigerator () | |
| The temperature difference between inside and outside of the room temperature compartment (°C) | |
| The temperature difference between inside and outside of the refrigerated compartment (°C) | |
| The temperature difference between inside and outside of the frozen compartment (°C) | |
| Customer Satisfaction Time Window (h) | |
| A large positive constant | |
| Decision Variables | |
| Binary decision variable. If , vehicle k serves from consumer to consumer | |
| Binary decision variable. If , consumer is served by vehicle k | |
| Binary decision variable. If , the vehicle is used to deliver temperature zone product | |
| Binary decision variable. If , the category of consumer is loaded in vehicle | |
| Binary decision variable. If , categories and of fresh food are incompatible in temperature layer and they should be loaded in different temperature zones of fresh food are incompatible in temperature layer and they should be loaded in different temperature zones | |
| Arrival time of vehicle at consumer | |
| Start picking time of vehicle for consumer order | |
| Finish picking time of vehicle for consumer order | |
References
- China Fresh E-Commerce Industry Report 2021. Available online: http://www.ifastdata.com/article/index/id/2705/cid/2 (accessed on 21 April 2022).
- Chen, M.C.; Lu, C.C.; Liu, Y.C. Optimal consolidation of fresh agricultural products in a multi-temperature joint distribution system. Int. J. Logist. Manag. 2018, 29, 887–901. [Google Scholar] [CrossRef]
- Chen, L.; Liu, Y.; Langevin, A. A multi-compartment vehicle routing problem in cold-chain distribution. Comput. Oper. Res. 2019, 111, 58–66. [Google Scholar] [CrossRef]
- Yaghin, R.G.; Sarlak, P. Joint order allocation and transportation planning under uncertainty within a socially responsible supply chain. J. Model. Manag. 2019, 15, 531–565. [Google Scholar] [CrossRef]
- Jiang, Y.P.; Bian, B.; Li, L. Integrated Harvest and Farm-to-Door Distribution Scheduling with Postharvest Quality Deterioration for Vegetable Online Retailing. Agronomy 2019, 9, 724. [Google Scholar] [CrossRef] [Green Version]
- Binos, T.; Adamopoulos, A.; Bruno, V. Decision support research in warehousing and distribution: A systematic literature review. Int. J. Inf. Technol. Decis. Mak. 2020, 19, 653–693. [Google Scholar] [CrossRef]
- Montanari, R. Cold chain tracking: A managerial perspective. Trends Food Sci. Technol. 2008, 19, 425–431. [Google Scholar] [CrossRef]
- Kuo, J.C.; Chen, M.C. Developing an advanced multi-temperature joint distribution system for the food cold chain. Food Control 2010, 21, 559–566. [Google Scholar] [CrossRef]
- Hsu, C.I.; Liu, K.P. A model for facilities planning for multi-temperature joint distribution system. Food Control 2011, 22, 1873–1882. [Google Scholar] [CrossRef]
- Cho, Y.J.; Li, C.C. Application of multi-temperature refrigerated container to improve the distribution of cold logistics. J. East. Asia Soc. Transp. Stud. 2005, 6, 2794–2808. [Google Scholar]
- Wang, Z.; Li, Y.; Hu, X. A heuristic approach and a tabu search for the heterogeneous multi-type fleet vehicle routing problem with time windows and an incompatible loading constraint. Comput. Ind. Eng. 2015, 89, 162–176. [Google Scholar] [CrossRef]
- Zhang, Y.; Chen, X.D. An Optimization Model for the Vehicle Routing Problem in Multi-product Frozen Food Delivery. J. Appl. Res. Technol. 2014, 12, 239–250. [Google Scholar] [CrossRef]
- Tsang, Y.P.; Wu, C.H.; Lam, H.Y.; Ho, G.T.S.; Choy, K.L. Integrating internet of things and multi-temperature delivery planning for perishable food e-commerce logistics: A model and application. Int. J. Prod. Res. 2021, 59, 1534–1556. [Google Scholar] [CrossRef]
- Martins, S.; Ostermeier, M.; Amorim, P. Product-oriented time window assignment for a multi-compartment vehicle routing problem. Eur. J. Oper. Res. 2019, 26, 893–909. [Google Scholar] [CrossRef]
- Hou, D.; Fan, H.; Lv, Y. Dynamic multicompartment refrigerated vehicle routing problem with multigraph based on real-time traffic information. J. Adv. Transp. 2022, 2022, 5538113. [Google Scholar] [CrossRef]
- Golestani, M.; Moosavirad, S.H.; Asadi, Y. A multi-objective green hub location problem with multi item-multi temperature joint distribution for perishable products in cold supply chain. Sustain. Prod. Consum. 2021, 27, 1183–1194. [Google Scholar] [CrossRef]
- Sun, Y.L.; Guo, S.C.; Li, X.P. An order-splitting model for supplier selection and order allocation in a multi-echelon supply chain. Comput. Oper. Res. 2021, 137, 105515. [Google Scholar] [CrossRef]
- Co, H.C.; Miller, R.H.; Xu, X. Clustering of skus to reduce split delivery cost and improve on-time delivery in online merchandising. Calif. J. Oper. Manag. 2007, 6, 45–51. [Google Scholar]
- Jasin, S.; Sinha, A. An lp-based correlated rounding scheme for multi-item ecommerce order fulfillment. Oper. Res. 2015, 63, 1245–1546. [Google Scholar] [CrossRef]
- Arezo, G.; Mehdi, S. Approximate analysis and simulation of a three-echelon inventory system with order splitting between two suppliers. Econ. Comput. Econ. Cybern. Stud. Res./Acad. Econ. Stud. 2020, 54, 231–248. [Google Scholar] [CrossRef]
- Vahid, R.; Curtiss, L.; David, U. Propagating logic-based Benders’ decomposition approaches for distributed operating room scheduling. Eur. J. Oper. Res. 2017, 257, 439–455. [Google Scholar]
- Zhang, Y.; Lin, W.H.; Huang, M. Multi-warehouse package consolidation for split orders in online retailing. Eur. J. Oper. Res. 2021, 289, 1040–1055. [Google Scholar] [CrossRef]
- Naccache, S.; Montreuil, B. Optimizing consumer order delivery consolidation in drop-ship based B2C distribution. IFAC-PapersOnLine 2015, 48, 1996–2001. [Google Scholar] [CrossRef]
- Zhang, Y.; Huang, M.; Hu, X. Package consolidation approach to the split-order fulfillment problem of online supermarkets. J. Oper. Res. Soc. 2018, 69, 127–141. [Google Scholar] [CrossRef]
- Gzara, F.; Elhedhli, S.; Yildiz, U. Data-driven modeling and optimization of the order consolidation problem in e-warehousing. INFORMS J. Optim. 2020, 2, 229–346. [Google Scholar] [CrossRef]
- Song, H.; Hsu, V.N.; Cheung, R.K. Distribution coordination between suppliers and customers with a consolidation center. Oper. Res. 2008, 56, 1264–1277. [Google Scholar] [CrossRef]
- Johansson, L.; Sonntag, D.R.; Marklund, J. Controlling distribution inventory systems with shipment consolidation and compound Poisson demand. Eur. J. Oper. Res. 2020, 280, 90–101. [Google Scholar] [CrossRef]
- Thierry, V.; Lieven, D.; Hove, V. Commonly used e-commerce supply chains for fast moving consumer goods: Comparison and suggestions for improvement. Int. J. Logist. 2013, 16, 243–256. [Google Scholar]
- Shavaki, F.; Jolai, F. A rule-based heuristic algorithm for joint order batching and delivery planning of online retailers with multiple order pickers. Appl. Intell. 2021, 51, 3917–3935. [Google Scholar] [CrossRef]
- Chen, W.; Zhang, Y.; Zhou, Y. Integrated scheduling of zone picking and vehicle routing problem with time windows in the front warehouse mode. Comput. Ind. Eng. Vol. 2022, 163, 107823. [Google Scholar] [CrossRef]
- Hewitt, M.; Nowak, M.; Gala, L. Consolidating home meal delivery with limited operational disruption. Eur. J. Oper. Res. 2015, 243, 281–291. [Google Scholar] [CrossRef]
- Wei, L.; Kapuscinski, R.; Jasin, S. Shipping consolidation across two warehouses with delivery deadline and expedited options for e-commerce and omni-channel retailers. Manuf. Serv. Oper. Manag. 2020, 23, 1333–1682. [Google Scholar] [CrossRef]
- Acimovic, J.; Graves, S.C. Making better fulfillment decisions on the fly in an online retail environment. Manuf. Serv. Oper. Manag. 2015, 17, 34–51. [Google Scholar] [CrossRef]
- Subramanyam, A.; Mufalli, F.; Laínez-Aguirre, J.M. Robust multiperiod vehicle routing under customer order Uncertainty. Oper. Res. 2021, 69, 30–60. [Google Scholar] [CrossRef]
- Torabi, S.A.; Hassini, E.; Jeihoonian, M. Fulfillment source allocation, inventory transshipment, and customer order transfer in e-tailing. Transp. Res. Part E Logist. Transp. Rev. 2015, 79, 128–144. [Google Scholar] [CrossRef]
- Liu, S.; He, L.; Shen, Z. On-time last-mile delivery: Order assignment with travel-time predictors. Manag. Sci. 2020, 67, 3985–4642. [Google Scholar] [CrossRef]
- Pulido, R.; Muñoz, J.C.; Gazmuri, P. A continuous approximation model for locating warehouses and designing physical and timely distribution strategies for home delivery. EURO J. Transp. Logist. 2015, 4, 399–419. [Google Scholar] [CrossRef]
- Wang, B.C.; Qian, Q.Y.; Gao, J.J. The optimization of warehouse location and resources distribution for emergency rescue under uncertainty. Adv. Eng. Inform. 2021, 48, 101278. [Google Scholar] [CrossRef]
- Mausser, H. Normalization and other topics in multi-objective optimization. In Proceedings of the First Fields—MITACS Industrial Problems Workshop, Toronto, ON, Canada, 14–18 August 2006. [Google Scholar]
- Huang, M.; Li, L.; Hu, X. Time-space network optimization method for split order consolidation on sorting center of large-scale online supermarket. J. Ind. Eng. Eng. Manag. 2021, 35, 163–172. [Google Scholar]
- Nodali, N.; Hsiao, H.I.; Jelena, V. Time-temperature abuse in the food cold chain: Review of issues, challenges, and recommendations. Food Control 2018, 89, 12–21. [Google Scholar]
- Nanjing Statistical Yearbook. Available online: http://tjj.nanjing.gov.cn/material/njnj_2021/ (accessed on 18 April 2022).
- Schubert, D.; Kuhn, H.; Andreas, H. Same-day deliveries in omnichannel retail: Integrated order picking and vehicle routing with vehicle-site dependencies. Nav. Res. Logist. 2021, 68, 721–744. [Google Scholar] [CrossRef]


| Stream | Literature | Research Problem |
|---|---|---|
| VRP with MTJD | [8] | Developing an advanced MTDJ system for the cold food delivery chain. |
| [9] | Suitable operational networks of MTJD technique. | |
| [10] | The optimal routing distance, as generated by MTDJ. | |
| [13] | Design a multi-temperature packaging model for perishable foods to optimize routing. | |
| VRPTW under MTJD | [11] | The heterogeneous multi-type fleet vehicle routing problem, with time windows and an incompatible loading constraint. |
| [12] | Analyzing the constraints of loading volume. | |
| [14] | Addressing the time window allocation problem for product complexity. | |
| [15] | Based on real-time traffic information to solve the dynamic multi-compartment VRP. | |
| [16] | Jointly optimized hub location and MTJD for the perishable product supply chain. |
| Stream | Literature | Research Problem |
|---|---|---|
| Order splitting | [18] | Reducing distribution costs by clustering SKUs. |
| [19] | Deciding from which facility the items in the order should be fulfilled. | |
| [20] | Multi-echelon inventory control and order splitting problems. | |
| [21] | Splitting a single multi-item order in the distribution center. | |
| [22] | Integrating multi-suborder models via transshipment between warehouses. | |
| Order merging | [23] | Order delivery consolidation-based business-to-consumer (B2C) distribution. |
| [24] | Package consolidation approach to the split-order fulfillment problem. | |
| [25] | Optimizing e-commerce warehouse order processing. | |
| [26] | Coordinating distribution between suppliers and customers via integration centers. | |
| [27] | Merging distribution from central warehouses to retailers. |
| Stream | Literature | E-Commerce Mode |
|---|---|---|
| Order picking + distribution | [29] | Online retailing |
| [30] | Front warehouse mode | |
| Order integration + distribution | [31] | Takeaway system |
| [32] | E-commerce | |
| Order splitting + distribution | [33] | O2O |
| [34] | Online retailing | |
| Order allocation + distribution | [35] | E-tailing |
| [36] | Last-mile delivery | |
| Warehouse distribution integration | [37] | On-line purchasing |
| [38] | Emergency rescue |
| Community Number | Coordinates (km) | Time Window | Community Number | Coordinates (km) | Time Window |
|---|---|---|---|---|---|
| 1 | (2.685, −25.687) | (8:00–8:30) | 9 | (9.763, 2.793) | (12:00–12:30) |
| 2 | (2.6, 17.556) | (10:00–10:30) | 10 | (−24.949, −2.746) | (17:30–18:00) |
| 3 | (−4.799, −0.186) | (17:00–17:30) | 11 | (15.499, 4.483) | (12:30–13:00) |
| 4 | (−10.866, 0.266) | (17:00–17:30) | 12 | (−4.133, −25.03) | (8:00–8:30) |
| 5 | (3.088, −16.762) | (8:00–8:30) | 13 | (24.157, 4.51) | (13:00–13:30) |
| 6 | (8.178, 20.509) | (9:30–10:00) | 14 | (−9.741, 18.33) | (9:30–10:00) |
| 7 | (−13.247, −8.611) | (15:00–15:30) | 15 | (−18.668, −1.16) | (16:30–17:00) |
| 8 | (−0.907, −18.268) | (8:00–8:30) | 16 | (−17.818, 2.789) | (17:30–18:00) |
| Community Number | Room Temperature 18~25 °C (s = 1) | Refrigeration 0~5 °C (s = 2) | Refrigeration −18~−25 °C (s = 3) | |
|---|---|---|---|---|
| Delicatessen (kg) | Vegetables (kg) | Fruit (kg) | Meat (kg) | |
| 1 | 106.2 | 96.4 | 66.1 | 43.3 |
| 2 | 83.4 | 75.8 | 51.9 | 34.0 |
| 3 | 194.1 | 176.3 | 120.8 | 79.2 |
| 4 | 38.8 | 35.2 | 24.2 | 15.8 |
| 5 | 775.8 | 704.6 | 482.9 | 316.7 |
| 6 | 129.9 | 117.9 | 80.8 | 53.0 |
| 7 | 207.8 | 188.7 | 129.4 | 84.8 |
| 8 | 176.4 | 160.2 | 109.8 | 72.0 |
| 9 | 423.4 | 384.5 | 263.5 | 172.8 |
| 10 | 103.8 | 94.3 | 64.6 | 42.4 |
| 11 | 168.2 | 152.7 | 104.7 | 68.6 |
| 12 | 147.8 | 134.2 | 92.0 | 60.3 |
| 13 | 211.6 | 192.1 | 131.7 | 86.4 |
| 14 | 91.8 | 83.4 | 57.2 | 37.5 |
| 15 | 97.1 | 88.2 | 60.5 | 39.6 |
| 16 | 188.7 | 171.4 | 117.5 | 77.0 |
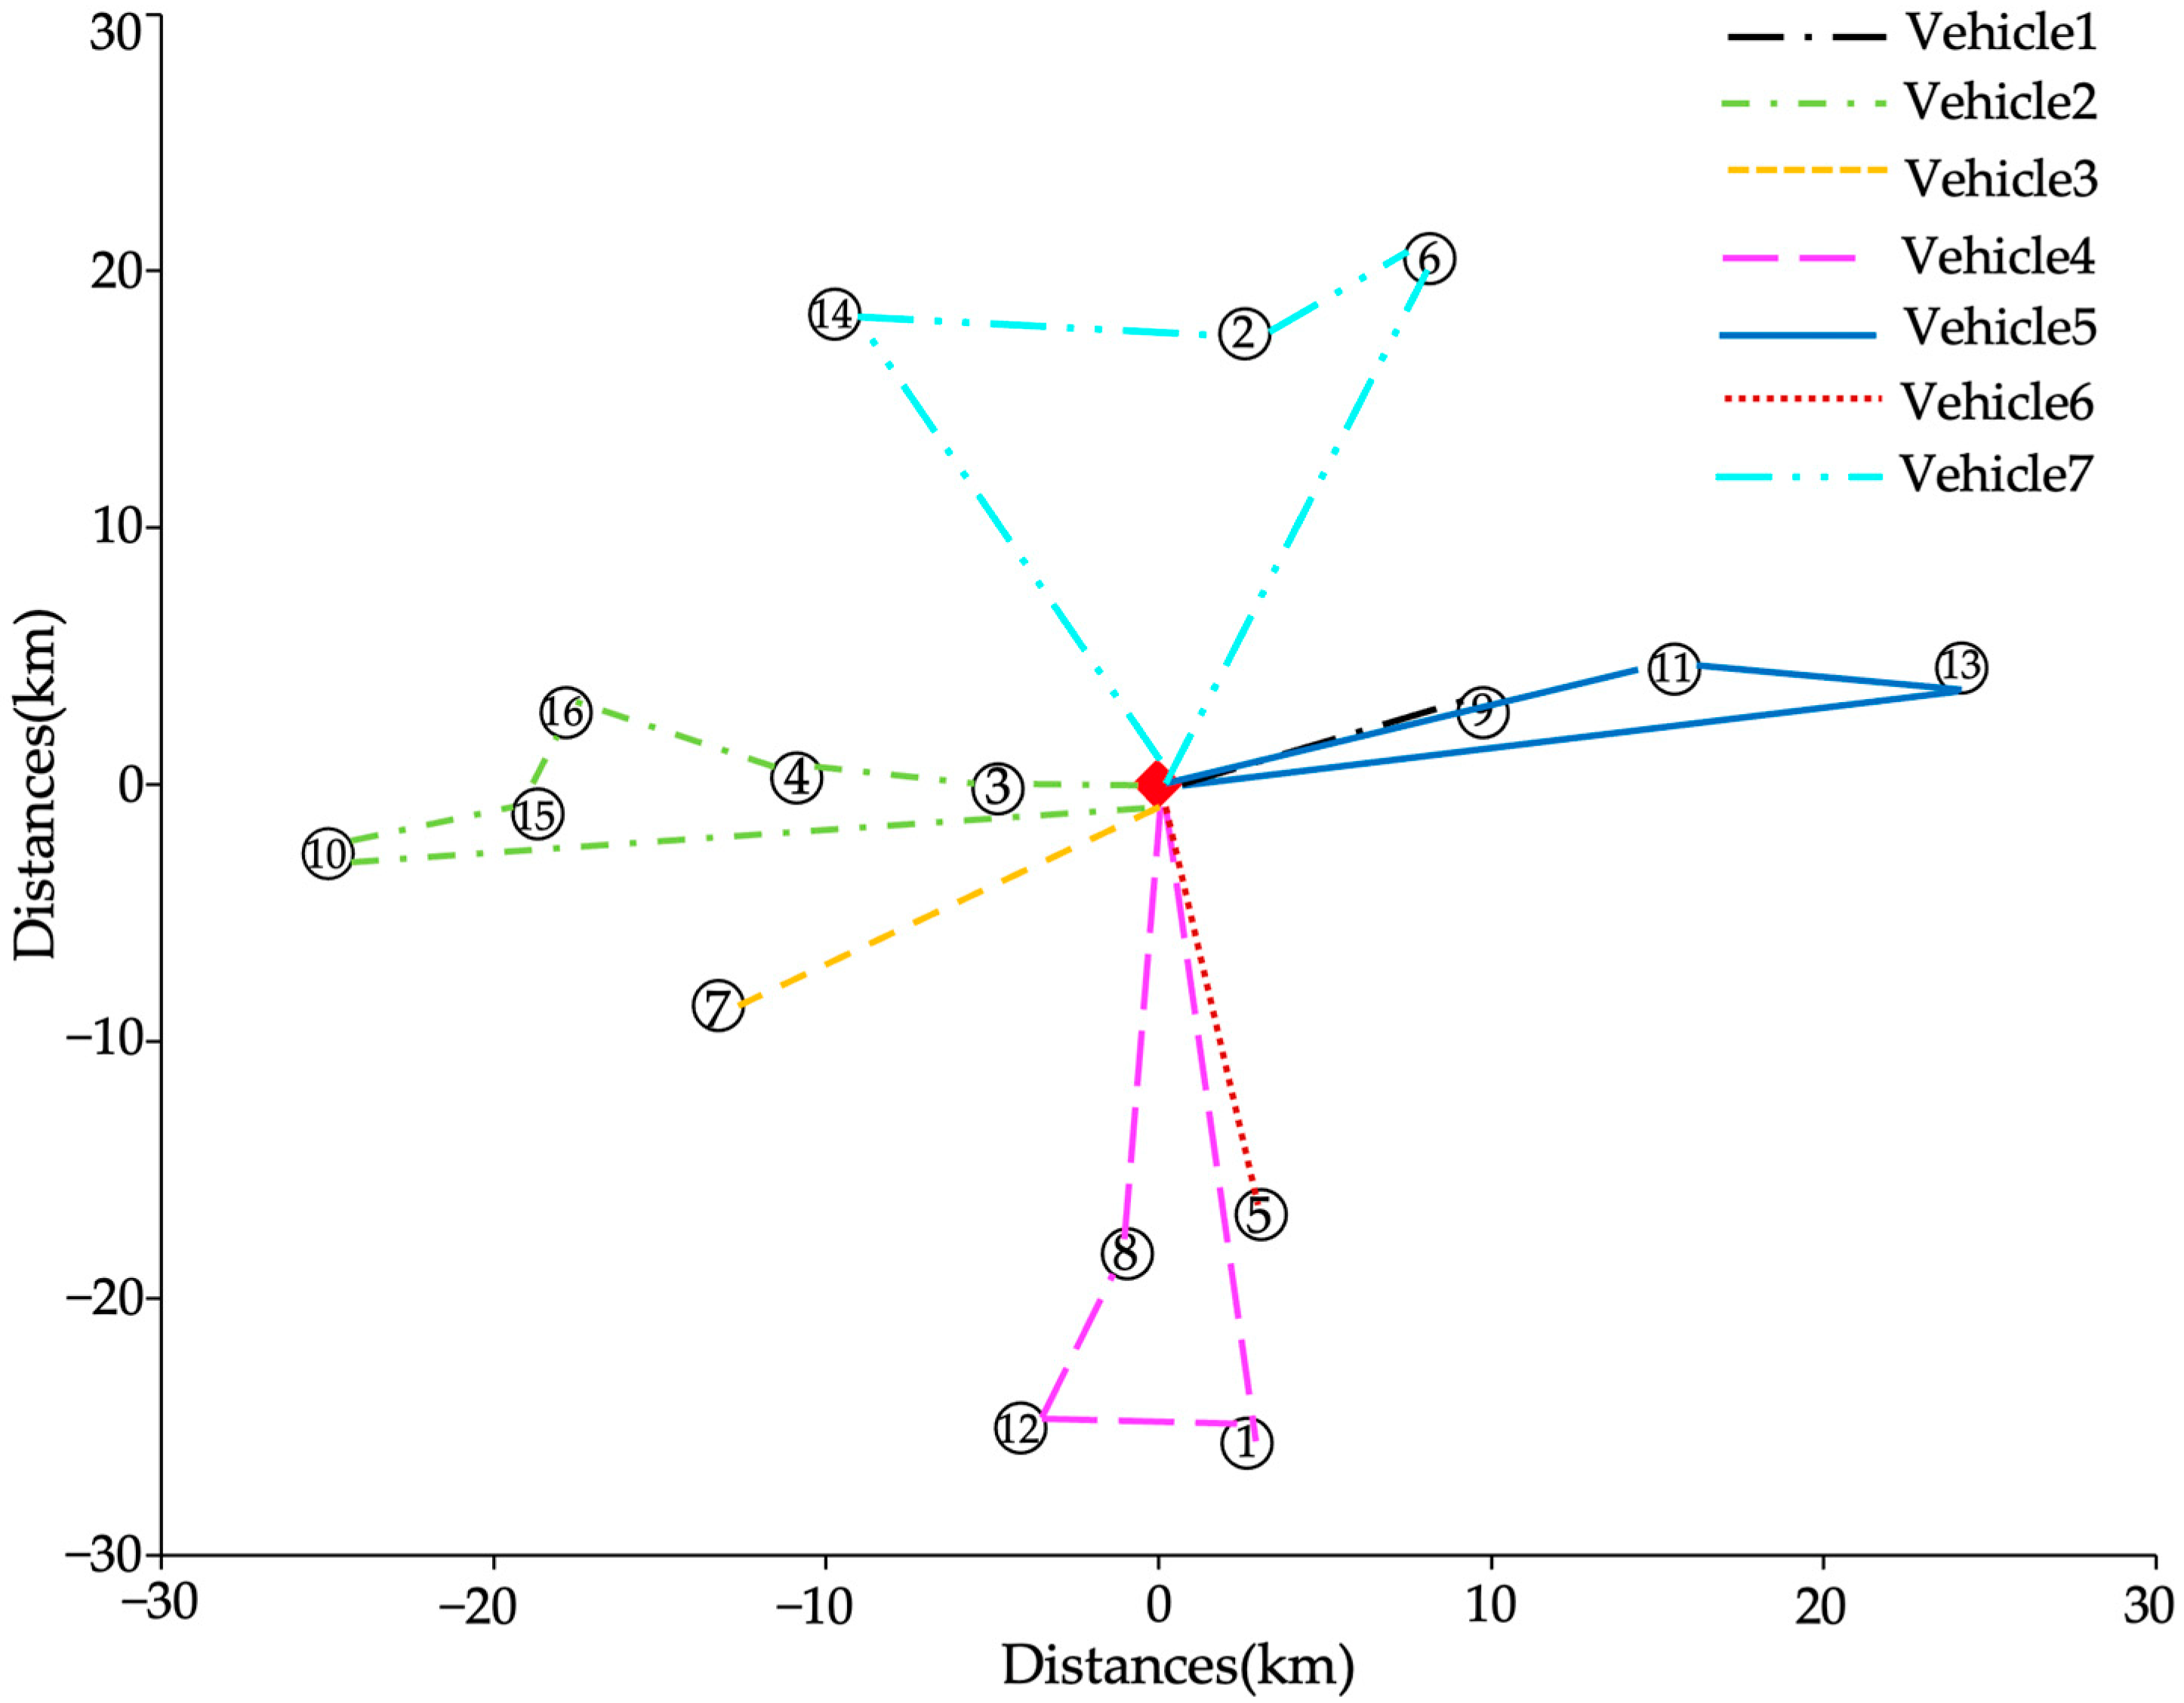
| Number | Optimal Vehicle Routing | |
|---|---|---|
| Vehicle 1 | 0 → 9 → 0 | |
| Vehicle 2 | 0 → 3 → 4 → 16 → 15 → 10 → 0 | |
| Vehicle 3 | 0 → 7 → 0 | |
| Vehicle 4 | 0 → 8 → 12 → 1 → 0 | |
| Vehicle 5 | 0 → 11 → 13 → 0 | |
| Vehicle 6 | 0 → 5 → 0 | |
| Vehicle 7 | 0 → 14 → 12 → 6 → 0 | |
| Experimental results | Number of vehicles | Iteration time [s] |
| 7 | 59.9 | |
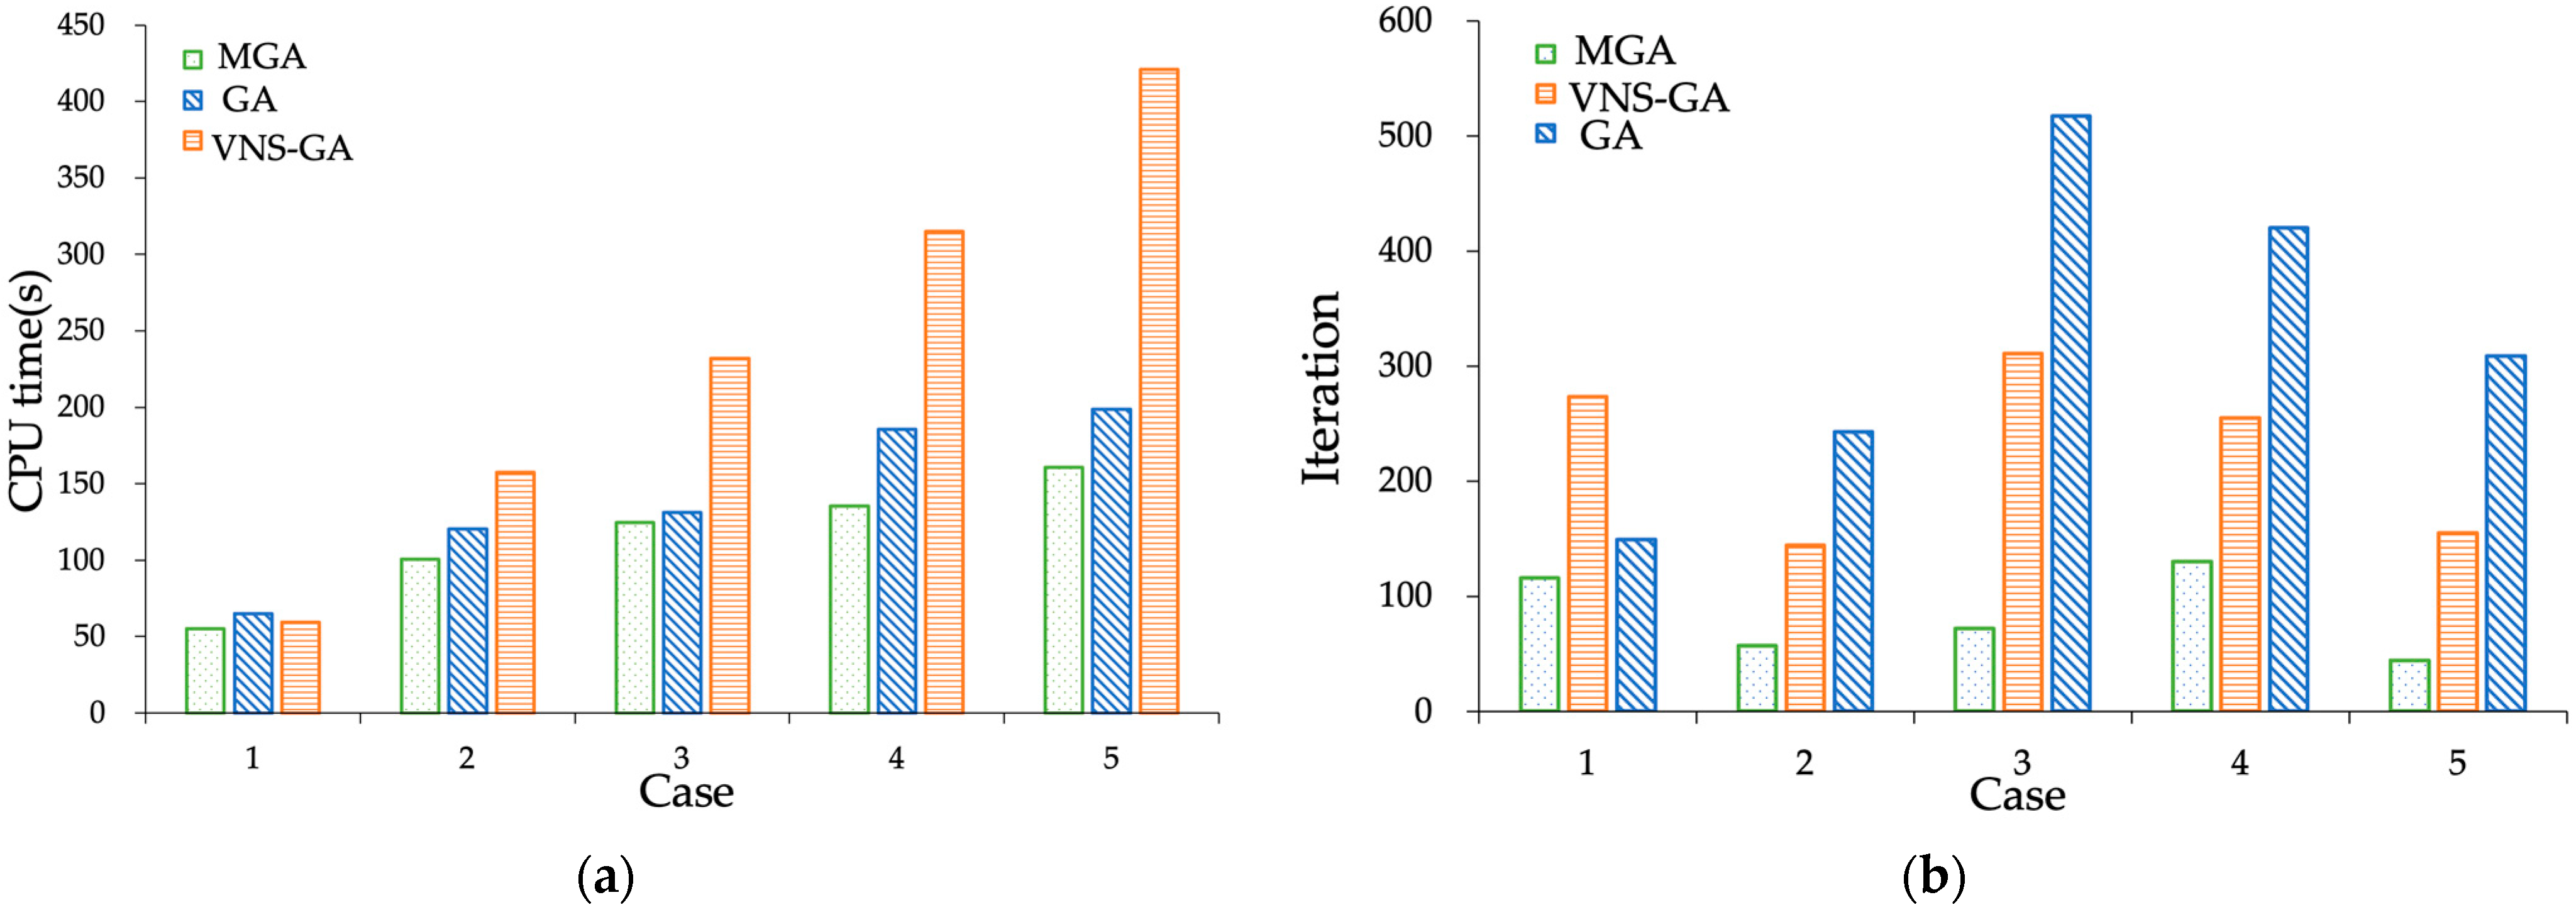
| Case | No. Comm. | GA | VNS | MGA | |||
|---|---|---|---|---|---|---|---|
| CPU Time (s) | Iteration | CPU Time (s) | Iteration | CPU Time (s) | Iteration | ||
| 1 | 20 | 64.98 | 149 | 59.46 | 273 | 55.33 | 116 |
| 2 | 40 | 120.10 | 243 | 157.46 | 144 | 100.45 | 57 |
| 3 | 60 | 131.25 | 517 | 231.92 | 311 | 124.73 | 72 |
| 4 | 80 | 185.36 | 420 | 315.07 | 255 | 135.48 | 130 |
| 5 | 100 | 198.60 | 309 | 421.19 | 155 | 160.86 | 44 |
Publisher’s Note: MDPI stays neutral with regard to jurisdictional claims in published maps and institutional affiliations. |
© 2022 by the authors. Licensee MDPI, Basel, Switzerland. This article is an open access article distributed under the terms and conditions of the Creative Commons Attribution (CC BY) license (https://creativecommons.org/licenses/by/4.0/).
Share and Cite
Zhan, Y.; Jiang, Y. Integrated Optimization of Order Allocation and Last-Mile Multi-Temperature Joint Distribution for Fresh Agriproduct Community Retail. Sustainability 2022, 14, 9790. https://doi.org/10.3390/su14159790
Zhan Y, Jiang Y. Integrated Optimization of Order Allocation and Last-Mile Multi-Temperature Joint Distribution for Fresh Agriproduct Community Retail. Sustainability. 2022; 14(15):9790. https://doi.org/10.3390/su14159790
Chicago/Turabian StyleZhan, Yajun, and Yiping Jiang. 2022. "Integrated Optimization of Order Allocation and Last-Mile Multi-Temperature Joint Distribution for Fresh Agriproduct Community Retail" Sustainability 14, no. 15: 9790. https://doi.org/10.3390/su14159790