Article

MOUNTAINPLAST: A New Italian Plastic Footprint with a Focus on Mountain Activities

by
Antonella Senese
1,*,
Massimo Pecci
2,
Roberto Ambrosini
1 and
Guglielmina Adele Diolaiuti
1
1
Dipartimento di Scienze e Politiche Ambientali, Università degli Studi di Milano, via Celoria 2, 20133 Milan, Italy
2
Presidenza del Consiglio dei Ministri, Dipartimento per gli Affari Regionali e le Autonomie (DARA), Via della Stamperia, 8, 00187 Roma, Italy
*
Author to whom correspondence should be addressed.
Sustainability 2023, 15(8), 7017; https://doi.org/10.3390/su15087017
Submission received: 27 January 2023 / Revised: 13 April 2023 / Accepted: 18 April 2023 / Published: 21 April 2023

Abstract

:
The plastic footprint is defined as a science-based tool for quantifying the amount of plastic (in kg) one contributes to the world’s plastic waste (from plastic wraps to anything containing plastics, such as clothes). Making consumers aware of their total plastic footprint and of how it is divided among their various daily life activities can promote concrete eco-sustainable actions aimed at reducing it and consequently plastic consumption. To this aim, we developed a free online plastic footprint calculator for making users aware of how much plastic they introduce into the environment through individual consumption, from food to clothing or leisure. In this tool, we also considered the consumption of plastics during mountain activities as it leads to the production of specific plastic waste. We tested the beta version of this tool on a small sample of users, including students, living in the mountains. Our results show that the sector with the greatest impact is food consumption (72.8%, mainly due to plastic drink bottles), followed by mountain activities (17.4%), a sector that was investigated in more detail (i.e., with more questions) than food consumption. Considering only mountain activities, synthetic fleeces are the most widely used and incorrectly managed items (34.7%), followed by shoes for mountain running or hiking (20.8%). We hope this tool will contribute to more aware use and management of plastic items during mountain activities and daily life and help reduce the distribution of plastics into the environment.

1. Introduction

Despite the extraordinary versatility of plastic products [1], the negative impacts of their growing use have become increasingly evident, starting from the consumption of non-renewable resources. After their use, if the plastic products are not correctly processed and managed, they become waste with damaging impacts on the environment. To determine whether a plastic product is “good” to use or when it should be substituted, the concept of the ‘materiality’ of plastic could be applied [2]. The materiality of plastic is a function of the magnitude of the functionality (i.e., added service) and intensity and duration of use of this service. Accordingly, single-use plastics and packaging may be instances where plastic should be replaced or reduced: even though these kinds of plastic products may provide some services, their intensity and duration of use are almost null [2]. However, up to now, there is no fully quantitative methodology to assess the materiality of plastic, as added value is highly subjective [3].
In addition, most plastics are highly resistant to biodegradation. However, the joint action of chemical, physical, mechanical and biological processes can contribute to the ageing of plastics [4], causing their degradation and fragmentation into smaller parts [5,6] which, depending on their size, are classified as mesoplastics (25–5 mm), microplastics (<5 mm) or nanoplastics (<1 μm) [7]. Microplastics can be released directly into the environment as particles included in their micrometric size in commonly used products (primary microplastics, e.g., raw materials for industry or abrasive components in chemicals and cosmetics) or can derive from the degradation of larger pieces of plastic (secondary microplastics) [8,9].
Global plastic production was estimated at 360 million tons in 2018, 62 million tons of which were produced in Europe (i.e., EU27 + Norway, Switzerland and the United Kingdom) [10]. Plastics are dispersed into the environment mainly as mismanaged waste, polluting water, soil and air [11]. Dispersion occurs mostly through urban point source contamination and the low efficiency of water waste management plants [12]. Recent studies have demonstrated that microplastics can be transported anywhere, including to the so-called remote areas of the globe. Indeed, plastic fragments have been found in the deep sea, the Southern Ocean, the Arctic and Antarctica [13], as well as in sub-alpine lake sediments [14], pelagic water and shoreline debris from high-mountain lakes [15,16], floodplain soils in Alpine valleys [17] and supraglacial debris [18]. Natural forces such as storms or wind can contribute to the dispersion of plastic particles. Allen et al. (2019) [19] suggested that fibers up to 750 μm and fragments ≤ 300 μm can reach remote areas through atmospheric transportation. Ambrosini et al. (2019) [18] were the first to verify the presence of microplastics in an Alpine glacier environment (the Forni Glacier, a wide valley glacier located in the Italian Alps [20,21]), detecting concentrations comparable with those previously found in marine and coastal areas [18]. Crosta et al. (2022) [22] found microplastics on other glaciers in the Italian Alps [22], suggesting the urgent necessity of actions to reduce the spread of microplastics in mountain glacierized areas. These microplastics could have both local (e.g., through mountaineers transiting the glacier) and remote origins (reaching the glacier via medium- and long-distance atmospheric transport). Indeed, the equipment, technical clothing, food packaging and management operations of ski slopes and ski lifts can contribute to contamination by all types of plastics, including microplastics.
One strategy that can be pursued to reduce the presence of plastics in these fragile and remote environments is to reduce the production of plastic waste which is a potential source of macro- and microplastics in the environment. According to an online survey by Coleman Parkes Research commissioned by Pro Carton [23], 75% of European consumers said that the environmental impact of a product’s packaging affects their purchasing decisions, and 77% were willing to pay more for “green” options. Not all these data are not published in peer-reviewed journals, but they indicate that consumers can influence the plastic footprints of goods and services through their purchasing decisions.
It is therefore important to assess the impact of human activities on the release of plastic pollution and to propose concrete strategies to raise the public’s awareness of the environmental consequences of their choices, especially in more fragile mountain areas. Moreover, it is important to inform consumers about the possibility of promoting truly sustainable development for mountain environments. To quantify the environmental performance of products and services, different environmental indicators known as ‘footprints’ have been developed to assess human pressures on nature [24]. Therefore, in this context, a very useful tool is the assessment of the individual (i.e., personal) plastic footprint. Marques et al. (2017) [25] use the term ‘footprint’ to refer to “metrics that capture the direct effects of an activity as well as the indirect effects that are transferred along a supply chain”. A broad range of footprint methodologies have been developed in the past two decades to inform companies, policymakers and the public about the magnitude of consumption and production activities’ effects on the environment [26]. Plastic footprints based on a Life Cycle Assessment (LCA) methodology are typically applied to a specific product or company and are predictive methodologies based on modelling that compiles data on industry and product life cycles [26]. Alternatively, descriptive methods based on field measurements can be used, based on data on plastic concentrations collected in situ [26]. Neither of these approaches is suitable for estimating the plastic footprint of common people, as they require highly specific data and information that make the methodology too complex to be applied to an individual level.
During the last decades, some online user-friendly tools were developed to overcome the limits of the abovementioned methods, but most of them promote a reduction in the use of plastic products (i.e., the so-called ‘plastic diet’) instead of a quantification of the amount eventually released (i.e., the plastic footprint). In addition, all of them are available in English only (see the Methods section for further details).
This study aims to develop a science-based tool to quantify the plastic footprint of an individual over a year, specifically designed to focus on mountain activities and to define the amount of plastic (both macro- and microplastic) potentially dispersed into the environment by their activities. To develop this tool, we conduct a preliminary survey to assess the level of knowledge of common people about environmental problems deriving from plastic release. We also compare the available methodologies for developing this online tool and explain the pros and cons of each approach. Our goal is to find the best solution to raise awareness of the amount of plastic that both daily activities and activities conducted in mountain environments can release. The preliminary survey was carried out during the MeetMeTonight 2019 (MMT2019) event held in Milan. During that event, we also proposed an innovative application of virtual tools for education and outreach activities: through 360° contents, the virtual tourers can enjoy an immersive experience to (i) visit an alpine glacier, (ii) see researchers working directly in the field and (iii) observe the microplastic on the glacier surface (among other important findings) [27].
Our tool can potentially be used on a broader scale. Indeed, we developed it in English, but it can be easily translated into other languages if used in countries where English is not widely spoken. For instance, we translated our tool into Italian for our survey.

2. Methods

2.1. A Commented Review of the Available Tools for an Individual-Level Plastic Footprint

As reported by Boucher et al. (2019) [26], there are only three individual-level (i.e., intended to be used by citizens and consumers) plastic footprint tools: My Little Plastic Footprint by PSF, Plastic Footprinter by R4W and Plastic Calculator by Greenpeace. However, the last two no longer work. In contrast, 13 tools are available for assessing the business- or product-level plastic footprint (i.e., intended to be used by companies of the private sector), and three additional tools are intended for the public sector, as they assess plastic footprints at the national or regional level.
My Little Plastic Footprint by PSF (http://mylittleplasticfootprint.org, accessed on 26 January 2023) is an app that helps reduce the so-called ‘plastic diet’ by estimating the user’s Plastic Mass Index (PMI), that is, a measure to calculate the individual’s contribution to plastic release. PMI values range from 0 to 100, with smaller values indicating a lower contribution by the user. The PMI for each item is based on the average values of its mass, frequency of use, probability of leakage, availability and potential environmental impact. The proposed categories are (i) cosmetics and personal care, (ii) soap and shampoos, (iii) toothbrushes, (iv) exfoliator loofah, sponges, (v) plastic containers, (vi) plastic spatulas and (vii) plastic bottles. The user can customize these categories by choosing among macro-sectors: bathroom, kitchen, leisure, travel, garden and house. In each one, the users can select the products that they effectively use. At each item, some tips are provided for replacing the common products with plastic-free ones; in this way, the users can reduce their PMI. However, this is not a true plastic footprint calculator since it does not provide an accurate amount of plastic consumed depending on, for example, the frequency of actual use. Therefore, it is a tool useful only to increase knowledge and awareness about possible solutions for replacing plastic-made products.
Two other available tools to determine an individual-level plastic footprint are the Omni calculator and the plastic-pollution-calculator. The former was developed by Hanna Pamuła (https://www.omnicalculator.com/ecology/plastic-footprint, accessed on 26 January 2023) and refers to (i) “Food & Kitchen Needs”, with questions about pet bottles, plastic bags, food wrappers and yoghurt containers; (ii) “Bathroom & Laundry”, with questions about cotton swabs, detergent, cleaning products bottles, shampoo or shower gel or cosmetics bottles, refill packets, toothbrushes and toothpaste; (iii) “Disposable Containers and Packaging”, with questions about plastic takeaway boxes, plastic takeaway cups, straws, disposable cutlery and plastic plates; and (iv) “Other”, with only one question that encompasses toys, furniture, etc. The calculator is based on the frequency of use (inserted by the user) and mass of each item (assumed constant). The advantage is that the user can choose the time interval over which to quantify the number of products used, which can range from per day up to per year. In addition, for some items, explanations are available to better clarify the type of product to be considered. The main issue we see in this approach is regarding the last category (i.e., “other”), which asks the user to quantify the consumption of all other products (e.g., toys and furniture) in kilograms; we think it is very difficult for a user to provide a reasonable estimate of this quantity.
The plastic-pollution-calculator is available at https://www.earthday.org/plastic-pollution-calculator-2/ (accessed on 26 January 2023). It allows for estimating the total annual consumption of some proposed items by filling in data about their daily consumption. In addition, users can provide yearly personal reduction, i.e., the number of plastic items that they think they could reduce against their current yearly total. Therefore, it is not an actual plastic footprint, but it applies an approach similar to that of My Little Plastic Footprint by PSF by promoting the reduction of plastic use.
From this review of the available plastic footprint calculators or similar tools, it appears that the best solution is to build a questionnaire starting from a modified version of the Omni calculator.

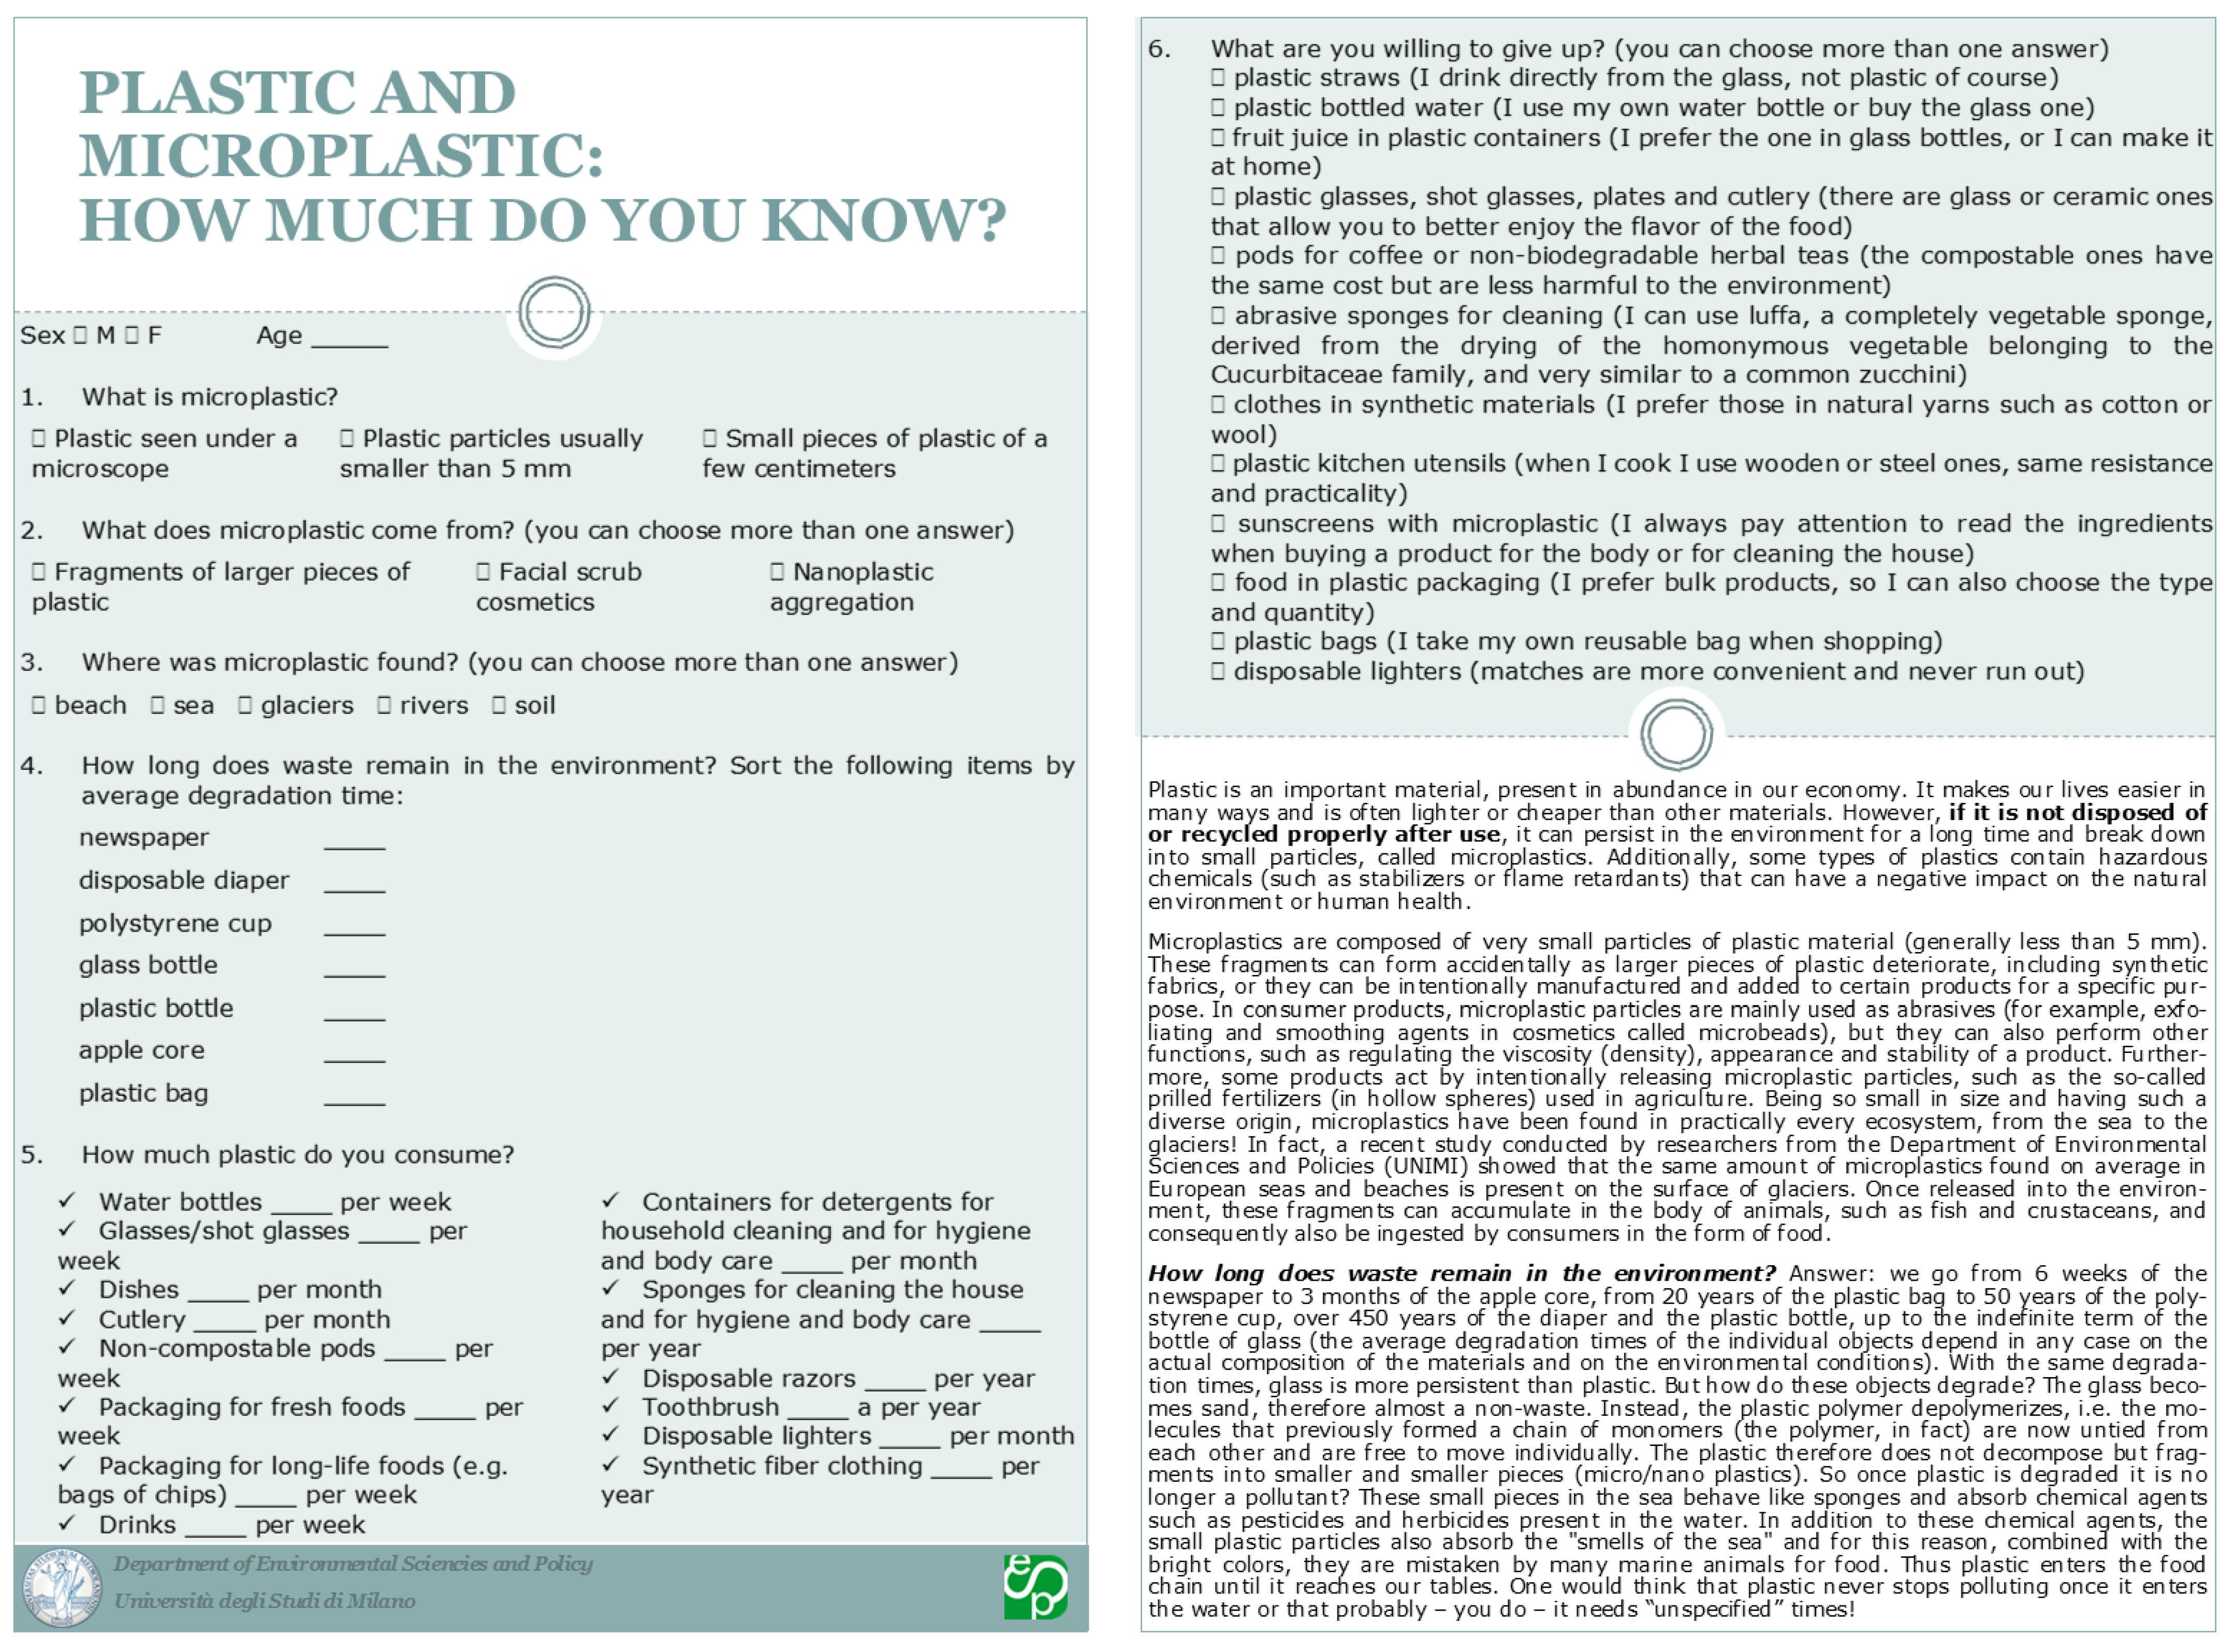
2.2. The Questionnaire to Define the Level of Knowledge about Plastics

We developed a simple questionnaire entitled “Plastic and microplastic: how much do you know?” to ascertain the user’s level of knowledge about plastics (Figure 1). We focused our questions on (i) the degradation time of several products (not only ones made of plastic); (ii) the frequency of use of several plastic products; (iii) which products made of plastic the user is willing to renounce; (iv) the definition of microplastics; (v) their origin; and (vi) in which environment they were found.
We conducted this survey during the MMT2019 (a free event organized for the European Researchers’ Night) held in Milan on the 27th and 28th of September 2019. We collected about 270 questionnaires and then provided each user with a brochure with more information about the topics covered in the questionnaire (Figure 1).
Once the MMT2019 was over, the survey results were digitalized, and a data quality control was carried out to remove potentially extreme values before elaboration.

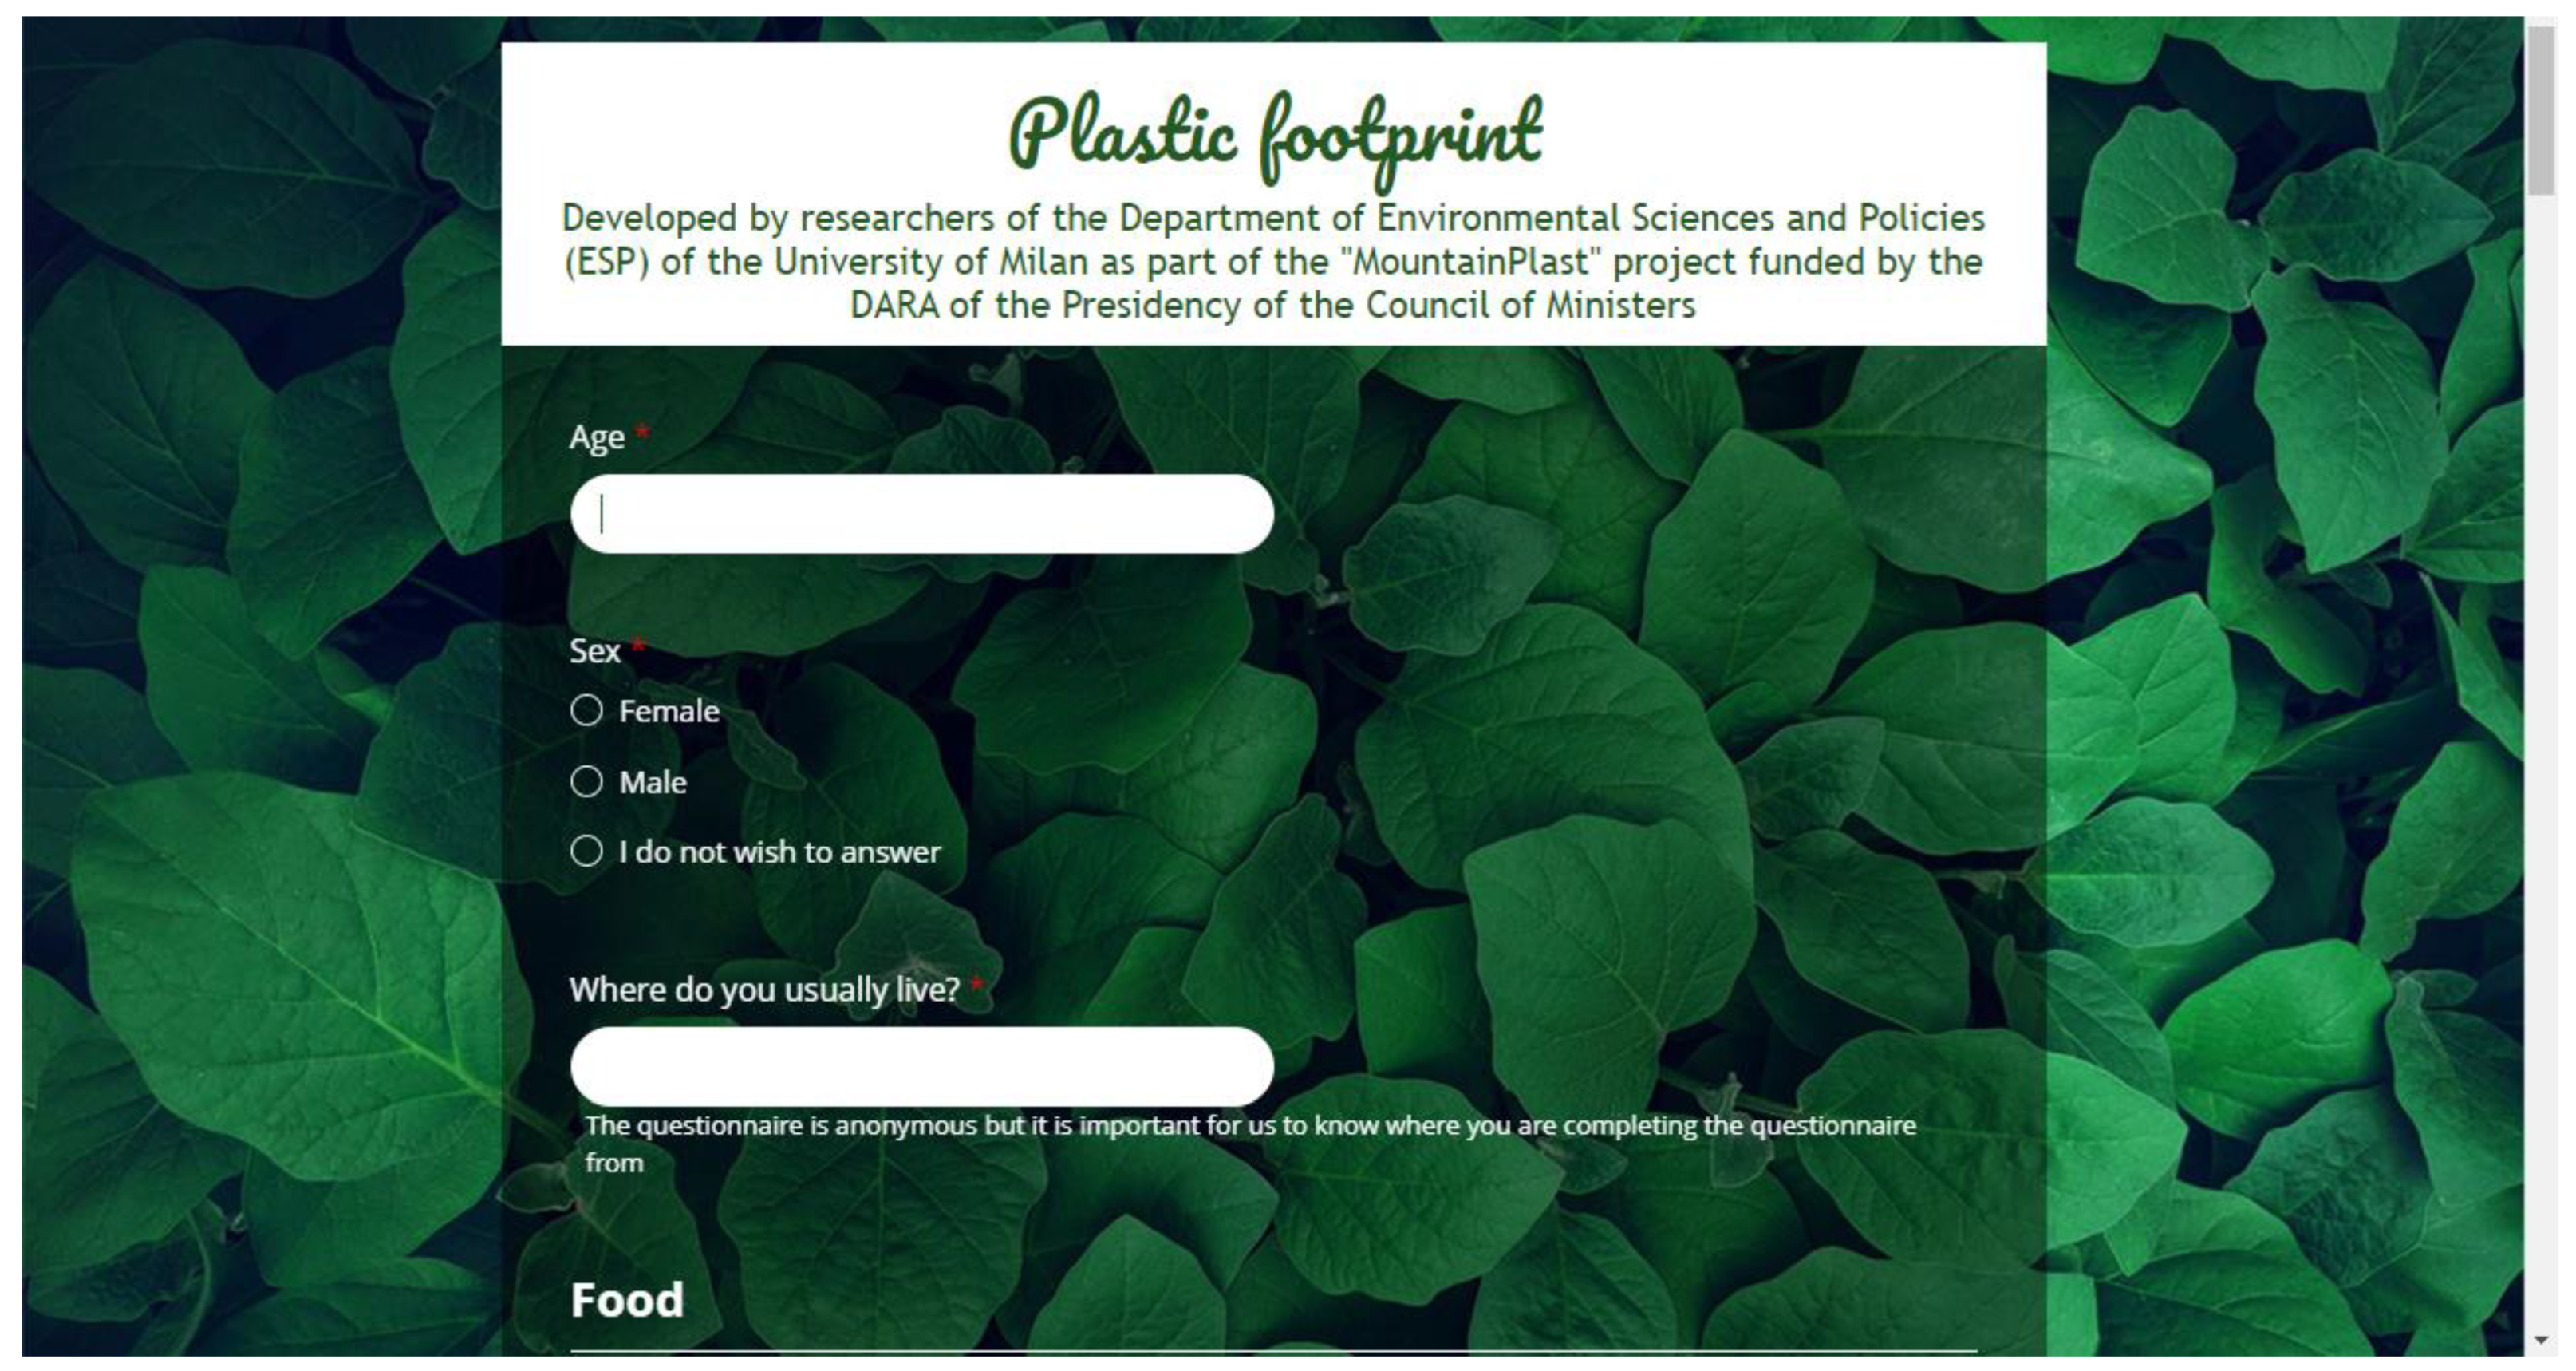
2.3. The Plastic Footprint Calculator

We developed the plastic footprint calculator (available both in Italian and in English) using Zoho Forms online and free softwares for creating modules (Figure 2 and Figure 3). We considered three main categories: (i) the consumption of plastic for food considering plastic bottles for water and other drinks, plastic bags (including those for food conservation in freezers) and plastic disposable tableware; (ii) the release of microplastics in the wastewater by clothes laundering; and (iii) the consumption of plastic for sports and free time activities considering athletic shoes and various sport balls. In addition, we proposed a part dedicated to the consumption and the (probably involuntary) release of plastics through mountain activities.
To include in this test a representative sample of people who perform mountain sport activities, we also proposed the tool to students attending degree courses given in Edolo (a village in the Alps) by the University of Milan, see https://www.unimontagna.it/en/, accessed on 26 January 2023).
Regarding food, we considered the consumption of plastic-made products regardless of how their disposal is managed. The aim is to quantify the consumption of plastic in a sector where plastic could be largely replaced. The second sector regards clothing and plays the key role of making consumers aware of the unintentional (and likely unknown) release of microplastic through clothes washing and drying. Finally, in both parts concerning mountain activities and sports and free time activities, users have to consider only the items whose release they do not manage correctly or which are involuntarily lost into the environment.
In this way, our tool allows for quantifying users’ potential plastic input into the environment due to a set of user activities, including those in high-altitude areas. The plastic footprint calculator, if repeated, can also allow the individual to evaluate the amount of plastic whose introduction into the environment could be avoided by different commercial choices or more virtuous behaviors.
During the development of the online tool, we opted for a user-friendly online questionnaire that can be filled out in a short time (approximately 10 min). Moreover, the questions should be easy to answer and should not require information that most users would probably not be able to provide. To this end, we had to make a set of assumptions.
Regarding plastic bottles for water and other drinks, we assumed an average weight of 34 g. Indeed, considering all soft drinks (including still and sparkling water), 13.7 billion liters packaged in PET bottles were consumed in 2019 in Italy. This value represents approximately 78% of the more than 17.5 billion liters of soft drinks consumed in this country in all types of packaging and corresponds to a total weight of 460,000 tons of plastic (from the Greenpeace Report available at https://www.greenpeace.org/static/planet4-italy-stateless/2021/07/27cdee4e-linsostenibile-peso-delle-bottiglie-di-plastica.pdf, accessed on 26 January 2023). This is a unique parameter calculated specifically for the Italian context. Nevertheless, it is very similar to that used for the Omni calculator tool developed in Poland and equal to 36 g. We can therefore assume that this value is valid for other countries.
As regards plastic bags, we applied an average weight of 7 g, obtained considering a mean thickness of 20 µm and a mean capacity of 6.5 L (https://materbi.com/scegli-lo-spessore-e-calcola-il-peso-medio-dei-tuoi-sacchi-e-shopper/, accessed on 26 January 2023), slightly lower than the 8 g used in Omni calculator.
Regarding plastic disposable tableware, about 114,200 tons are sold every year in Italy both for the management of large events and for private and public canteens, which translates into an individual consumption of 1.9 kg [28]. A set of disposable tableware consisting of a plate, a glass and two pieces of plastic cutlery weighs about 40 g. We decided to ask the users for the frequency of use per year and not per week as for the other items, since disposable tableware could be used only on rather rare occasions such as parties or holidays.
Regarding clothing, 62.9 Mt of polyester fibers were produced throughout the world in 2015 [29]. Synthetic textile fibers include polyamide, polyvinyl chloride, polyurethane/elastane, modacrylic, polyacrylonitrile, polyethylene terephthalate (PET) and other polyesters. Most microfiber pollution in water is due to effluent from clothes washing, often via wastewater treatment plants (WWTPs) [30]. Nevertheless, a considerable quantity of textile microfibers is also present in the air [31]. De Falco et al. (2020) [32] reported that the release of microfibers per person per year into the air is in the same order of magnitude as that released into wastewater by laundering. The lowest releases into both air and water were recorded for a garment with a very compact woven structure and highly twisted yarns made of continuous filaments, compared with those with a looser structure (knitted, short-staple fibers, lower twist).
Since the release of microfibers into washing water is due not only to the use of different materials but also to different washing methods (e.g., domestic or laboratory washing machines), we focused our questionnaire on the frequency of use of the washing machine or the dryer. We considered an average release of 0.2 g kg−1 from the washing machine and 0.8 g kg−1 from the dryer [29] and a mean capacity of a washing machine and dryer of 7 kg. In addition, users can insert the percentage of their clothes made with synthetic textile fibers to calculate the release of plastic during washing and drying more precisely.
A particular section was dedicated to mountain activities. As very few data are available about the plastic waste generated during this kind of activity [33], we considered the most widely used items for hiking, mountain running, skiing, climbing and mountain cycling (Table 1). In particular, we specified that the users have to quantify only the items that they throw away without evaluating their possible reuse or more sustainable waste management.
Plastic is widespread in items related to sports and free time activities, from clothes worn by athletes to the artificial turf in stadiums to the signage, tickets, products and packaging of shops and eateries [34]. Therefore, it is very difficult to estimate the individual plastic footprint of sportsmen and sportswomen. For this reason, we focused on the most common items, such as athletic (or football) shoes, tennis balls (with a weight ranging from 56 to 59.4 g), footballs (410–450 g), and basketballs (510–650 g). Athletic shoes are generally made entirely of plastic, from the laces to the mesh. As Newton Running’s web page reports, each pair of shoes is made from four plastic bottles; thus, we assume a plastic weight of 132 g per pair of shoes (https://www.newtonrunning.com/blogs/the-running-front/newton-running-releases-spring-2021-line-with-focus-on-sustainability, accessed on 26 January 2023). As for mountain equipment, the app specifies that the users have to quantify only the items that they throw away, not those that are reused for other purposes (e.g., a climbing rope that is too worn for a safe climbing activity can be reused for packing) or more sustainable waste management (e.g., conferring old clothes in containers for separate collection).
Similarly to the MMT2019 data, the results from this online survey were checked and validated to remove potentially extreme values before elaboration.

3. Results

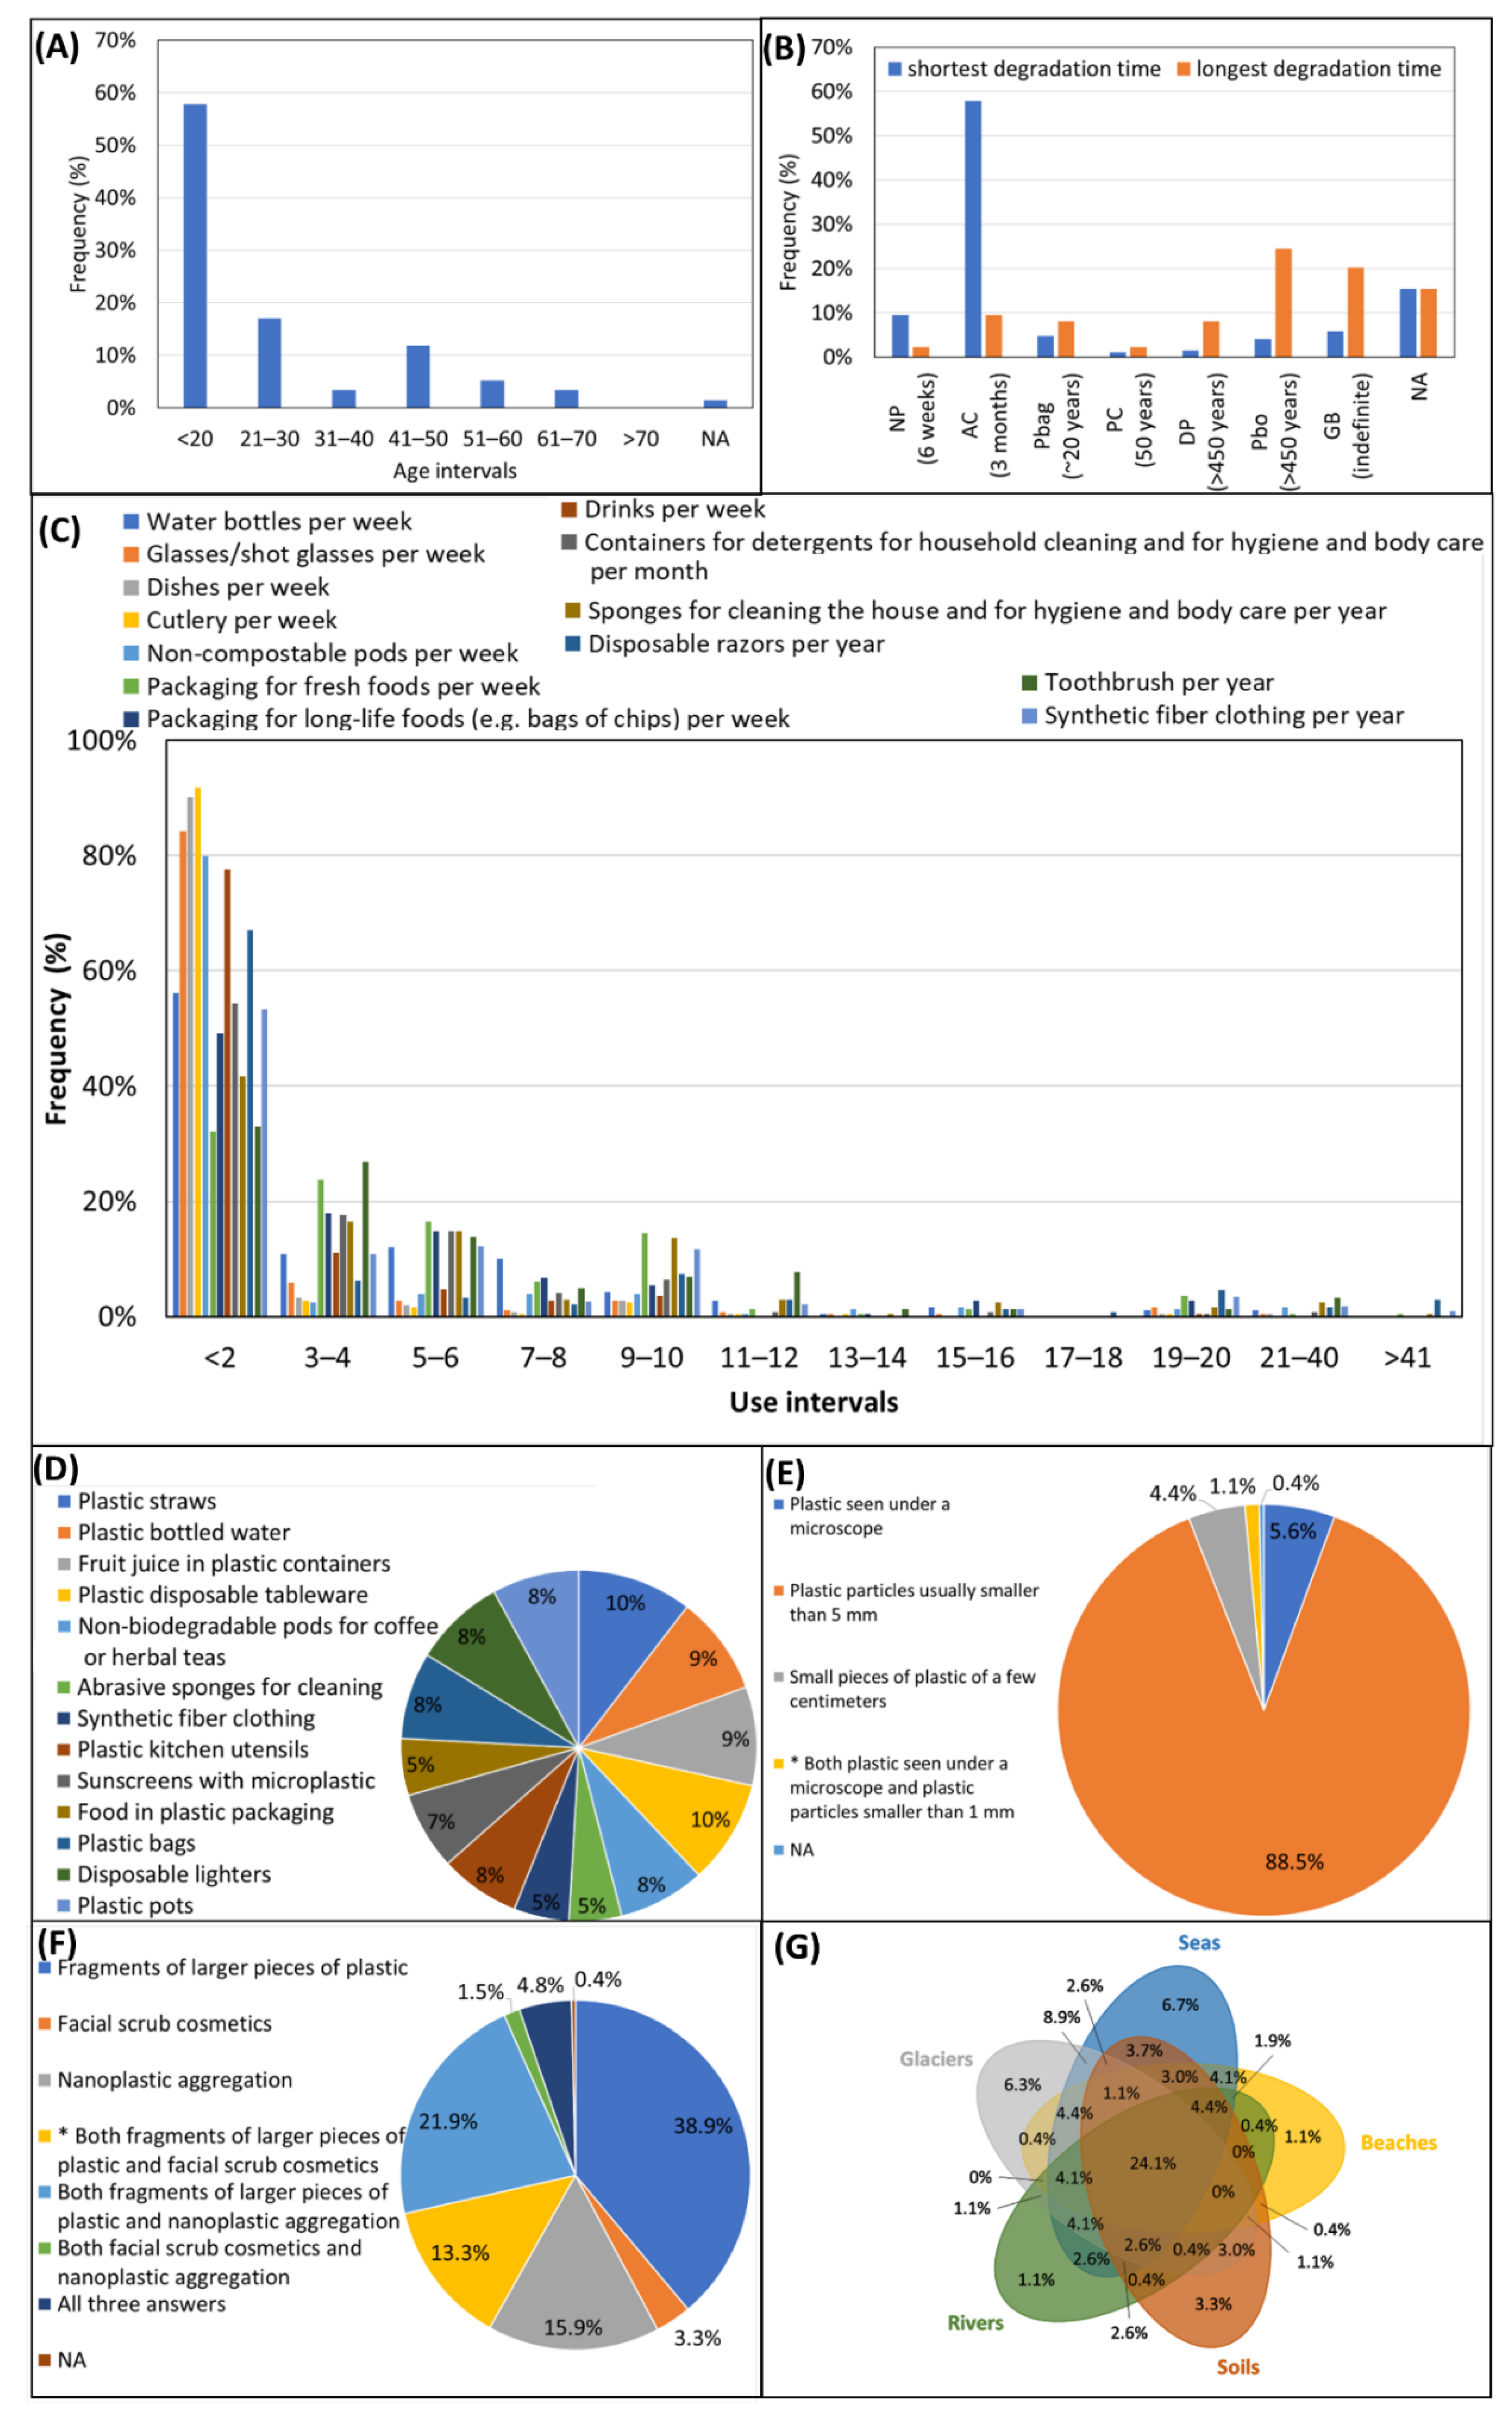
3.1. Level of Knowledge about Plastics

We proposed the first questionnaire to 270 persons (58% female and 42% male), 57.8% of whom were <20 years old, and 17% between 20 and 30 years old (Figure 4A).
Regarding the degradation time (Figure 4B) [35], most answers (57.9%) indicated apple cores as items with the lowest degradation time, with a not negligible amount of no reply (15.4%). Thus, most people erroneously consider apple cores to biodegrade more quickly than newspapers.
As regards the frequency of use of products made of plastics (Figure 4C), 56.2% of interviewed people consume fewer than two plastic bottles per week, and 32.7% between three and eight plastic bottles per week. More than 80% consume fewer than two glasses/shot glasses per week (84.1%), dishes per week (90.1%), cutlery per week (91.8%) and non-compostable pods per week (79.9%). The frequencies of use of packaging for fresh foods and long-life foods (e.g., bags of chips) per week are more variable, with almost all responders indicating up to 10 times a week (92.8% and 94.1%, respectively). More than 80% consume fewer than four drinks per week (88.6%). Regarding personal and home care, most of the users consume fewer than six containers of detergents for household cleaning and for hygiene and body care per month (86.7%), fewer than six sponges for cleaning the house and for hygiene and body care per year (73.1%), fewer than two disposable razors per year (76.5%) and fewer than six toothbrushes per year (73.6%). Finally, most consume fewer than two disposable lighters per month (93.4%) and fewer than 10 items of synthetic fiber clothing per year (90.5%).
Moreover, in the survey, users could select which plastic-made products they were willing to renounce. They could choose among plastic straws, plastic bottled water, fruit juice in plastic containers, single-use plastic disposable tableware, non-biodegradable pods for coffee or herbal teas, abrasive sponges for cleaning, synthetic fiber clothing, plastic kitchen utensils, sunscreens with microplastic, food in plastic packaging, plastic bags, disposable lighters and plastic pots (Figure 4D). The results are noticeably uniform, with no product receiving more preference: choices range from 5% for abrasive sponges for cleaning, synthetic fiber clothing and food in plastic packaging to 10% for plastic straws and plastic disposable tableware.
In addition, we proposed some questions for assessing the level of knowledge about microplastic. To the question “What is microplastic?” 88.5% answered correctly (Figure 4E). Regarding its origin (Figure 4F), according to 38.9% of the users, microplastic derives from fragments of larger pieces of plastic; only 13.3% selected the two correct answers, i.e., from fragments of larger pieces of plastic and from facial scrub cosmetics. Overall, 23.0% knew that microplastic is also contained in cosmetics.
Finally, 24.1% knew that microplastic fragments can be found in all environments, but 6.7% thought they can only be found in the sea (Figure 4G). Importantly, 21.5% were aware that microplastics have also been found on glaciers.

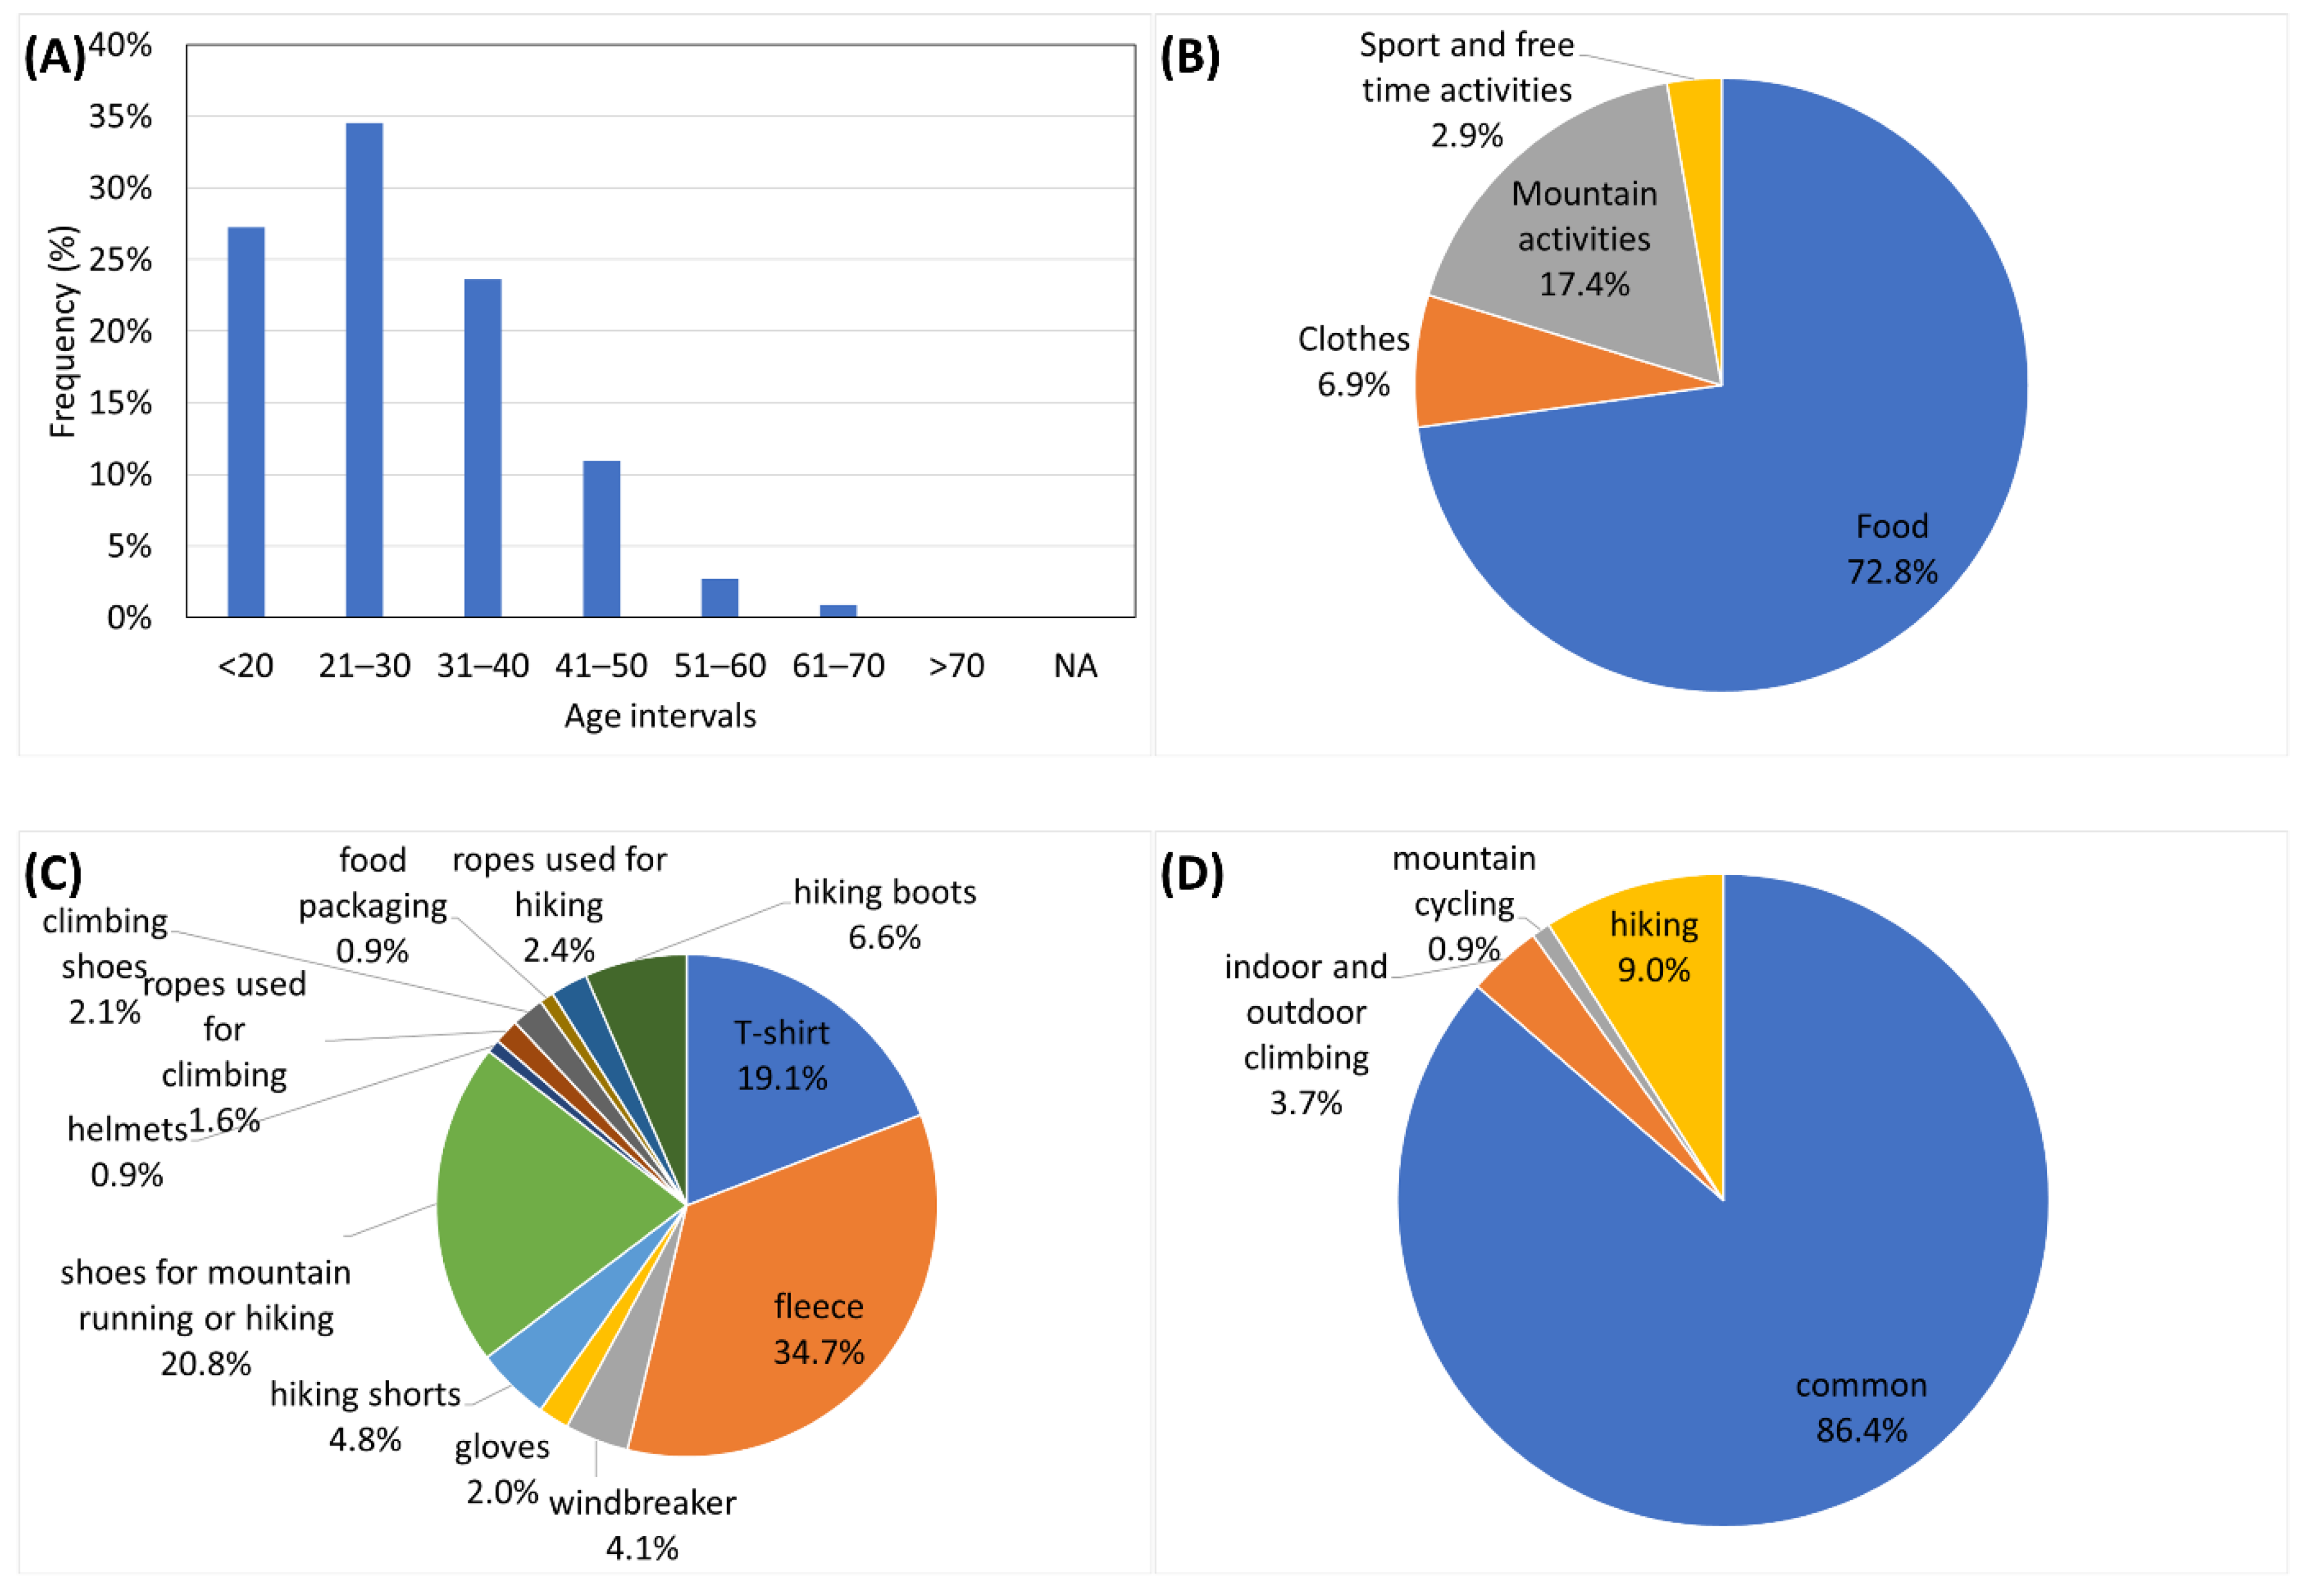
3.2. The Plastic Footprint of a Sample of Consumers

We proposed the online tool to 150 people (49.1% females, 49.1% males, and 1.8% not responding), 60.9% of whom were between 10 and 30 years old, and 23.6% between 30 and 40 years old (Figure 5A).
Even if the majority of the questions in the tool focused on mountain activities, the sector with the greatest impact was found to be food (72.8% of total plastic produced, Figure 5B). Considering only the food sector, drink bottles were responsible for 76.7% of the total food plastic footprint, followed by bags (16.4%) and disposable tableware (7.0%).
Considering only mountain activities (Figure 5C), synthetic fleeces were the most widely used and incorrectly managed items (34.7% of the total mountain plastic footprint), followed by shoes for mountain running or hiking (20.8%) and T-shirts (19.1%). As fleeces are also washed and dried during their use, their plastic release would noticeably increase: 12–100 mg kg−1 per wash cycle [29]. Focusing on the type of mountain activities, the items common to all (i.e., T-shirts, fleeces, windbreakers, gloves, hiking shorts, shoes for mountain running or hiking, helmets) provided 86.4% of the plastic waste; items specific to mountaineering numbered only two (i.e., synthetic ropes and boots) and contributed only 9.0% of released plastics.

4. Discussion

This paper presents an online tool to quantify the plastic footprint of an individual. It also summarizes the data collected by this tool on a small sample of people to illustrate its potential use. Finally, it reports the data of a survey conducted to assess the level of knowledge of common people about environmental problems deriving from plastic release.

4.1. The Preliminary Survey

The preliminary survey highlighted poor knowledge (or a greater uncertainty among users) of the degradation time of objects. Indeed, most users (24.5%) indicated plastic bottles as the items that need the longest time to degrade, while only 20.1% correctly indicated glass bottles (Figure 4B). In addition, a not negligible number of people (9.5%) indicated an apple core as the item with the longest degradation time. This may be due to a complete misunderstanding of the question, with people erroneously selecting the item with the shortest, rather than the longest, degradation. Indeed, 57.9% indicated it as the item with the shortest degradation time, while only 9.5% correctly indicated a newspaper.
During the MMT2019 event, we also proposed an immersive experience to visit an alpine glacier through 360° contents [27]. The immersive videos were recorded during scientific activities performed by researchers from the University of Milan on the Forni Glacier. One of these videos showed the sampling of supraglacial debris to measure plastic contamination. The viewing of this video by people who then answered the questionnaire (during the MMT2019 we could not prevent people from answering the questionnaire after viewing the immersive videos) may have contributed to increasing the proportion (21.5%) of those who were aware that microplastics have also been found in glaciers, which was surprisingly high given that the first evidence of microplastic contamination on glaciers was published in a scientific journal in 2019 [18]. On the other hand, such a high percentage at least indicates that our immersive experience is effective and fulfilled its educational and informative goals.

4.2. The Plastic Footprint Tool

In our plastic footprint tool, the only parameter calculated specifically for Italy was the average weight of plastic bottles for water and other drinks, which we assumed was equal to 34 g. However, this value is very similar to that used by the Omni calculator (36 g) developed in Poland. To better investigate the sensitivity of the results of our tool to slightly different values of the average bottle weight, we re-calculated the plastic footprint of all respondents using 36 g as the average weight of drink bottles (instead of 34 g): the contribution of drink bottles to the total food plastic footprint increased by only 1% (77.7% instead of 76.7%), indicating the negligible impact of slightly different values of this parameter. This suggests that our plastic footprint tool may be portable to other countries with no further adjustment.
From both our surveys (i.e., the preliminary MMT2019 questionnaire and our plastic footprint online tool), food was found to be the sector that contributed most to the plastic footprint. Indeed, the results of the first questionnaire showed that the most widely used single-use plastic material is packaging for fresh and long-life foods, followed by drinking bottles and non-compostable pods. Food packaging is a key aspect of successful food industries serving fast foods, ready meals, on-the-go beverages and snacks, among others [36]. Other studies [37,38] indicated that the most common single-use plastic packaging waste materials are (in decreasing order) drinking bottles, bottle caps, food wrappers, grocery bags, lids, straws, stirrers and foam takeaway containers. The problem of food packaging is also due to the expansion of fast-food outlets in the world and the increasing amount of waste they produce [39], which is mostly composed of food packaging [40]. Indeed, the evolution of on-the-go food and drink consumption is driving the growth of single-use plastic packaging [41], the bulk of which becomes post-consumer waste [42,43]. In developed countries, packaging accounts for about 2% of the gross national product, and most packaging materials are used in the food industry [44]. Annually, Europe alone produces 23 million tons of plastic packaging, and current projections forecast 92 million tons by the year 2050 [45]. Globally, there are low recycling rates for single-use plastic packaging materials, with only 14% of plastic packaging being collected for recycling and only 5% of it being successfully recycled into new plastic [46,47]. The European Union has introduced amendments to the directives on packaging waste that indicate that 75% of it should be recycled by the year 2030. As reported by Toniolo et al. (2013) [48], recycling can greatly reduce the environmental burdens posed by food packaging waste. Therefore, to deal with food packaging waste, there is an urgent need for integrated waste management schemes that can sustainably control waste generation without compromising the needs of both society and the environment.
From the results of our online plastic footprint tool, washing and drying clothes have a not negligible impact. The main cause of this is the increased use of synthetic fibres in the clothing industry, partly due to the rise of fast fashion, which relies on cheap manufacturing, frequent consumption and short-lived garment use. By selling large quantities of clothing at cheap prices, fast fashion has emerged as a dominant business model, causing garment consumption to skyrocket [49]. While this transition is sometimes heralded as the “democratization” of fashion, in which the latest styles are available to all classes of consumers, the environmental health risks associated with inexpensive clothing are hidden throughout the life cycle of each garment [49]. Indeed, each production step has an environmental impact due to water, material, chemical and energy use. Environmental impacts from the fashion industry include over 92 million tons of waste produced per year and 79 trillion liters of water consumed [50]. In addition, most environmental impacts occur in textile-manufacturing and garment-manufacturing countries, but textile waste is found globally. Indeed, current fashion-consumption practices result in large amounts of textile waste, most of which is incinerated, landfilled or exported to developing countries [51]. As an alternative to fast fashion, some brands are trying to reduce their use of plastic and their environmental impact, such as companies that are part of ClimatePartner (e.g., Ortovox). Another choice for a more sustainable management of clothes is their reuse. For example, if used shoes are in good condition they could be used for donation or could be destined to become “secondary raw material” to build shockproof terrain for playgrounds or athletics tracks.
Sports have a great and well-known impact on plastic release [34]; we therefore decided to consider mountain activities and more general free time activities in our plastic footprint. Indeed, plastic can be found in a great number of products pertaining to sports, such as food containers, straws, cups and drink bottles, clothing, gadgets and bags, which become waste mostly on the same day in which the sport is practiced due to their short use [34]. To encourage environmental sustainability, since the 2000s different organizations have provided guidelines for promoting concrete practices to make sports events more sustainable [33]. An example is the report published by the International Olympic Committee in collaboration with the UN Environment [34] that provides ideas for getting started and examples of progress from across the sporting community for creating a plastic plan and for working with suppliers, athletes and fans to reduce, reuse and recycle. Therefore, planning and implementing an effective waste management system can be a solution to make sporting events more sustainable. Nevertheless, hiking, mountaineering and snow sports involve consuming food and beverages during the activities, thus reducing the possibility of ensuring the correct and differentiated collection of plastic waste.
Since clothes have a remarkable impact, the part of our plastic footprint tool relative to mountain activities focuses mainly on mountain and high-mountain technical clothing. This must be light, warm, breathable and comfortable to allow mountaineers and other mountain professionals (mountain guides, ski instructors, etc.) to carry out their work in safety and comfort. Unfortunately, these characteristics are often associated with plastic raw materials. In fact, from our results, fleeces are the item with the greatest impact. It is therefore essential to inform mountain professionals of the potential impact of their clothing if it becomes waste and is abandoned at high altitudes (after an expedition) as ordinary waste. The reuse, resale or donation of technical material has great value for the environment. For this reason, specific questions in our questionnaire focused on this topic.
Fast fashion has also increasingly interested mountain lovers by offering technical garments at very low prices, which on the one hand allows many people to visit mountains with comfortable, warm and breathable clothing obtained at low cost. On the other hand, this kind of industry promotes the rapid replacement of technical clothes and their very rapid transformation into waste, thus increasing plastic textile waste amounts. It is therefore important to introduce “zero impact mountaineering”, “zero impact hiking” and “zero impact snow sports”, otherwise the democratization of technical and sporting fashion will lead to the very rapid degradation of the mountain environment. The “zero environmental impact” is related not only to the clothing sector but to all aspects of mountain activity. For example, a high-altitude mountaineering expedition, especially in the extra-alpine areas, requires tents, sleeping bags, ropes, containers for water and food, technical clothing and specialized equipment made of metal and plastic. Napper et al. (2020) [52] measured the concentration of microplastics in the snow and water near the Everest summit and found values of contamination definitely connected to mountaineering activities. Therefore, each mountain activity should minimize the amount of material used and, above all, the amount of it that is abandoned into the environment.
To minimize the environmental impact derived from clothing, there are a lot of studies looking for sustainable fibres in the textile industry [49]. For example, fabrics such as Lyocell, made from the cellulose of bamboo, are made in a closed-loop production cycle in which 99% of the chemicals used to develop fabric fibres are recycled. Moreover, Ohn et al. (2021) [53] discussed the potential of Cupriavidus necator (a versatile microorganism found in both soil and water) for producing Polyhydroxyalka oates (PHAs), a promising polyester alternative to petroleum-based synthetic polymers.
However, the complete replacement of plastic products in the short term, above all at large public events, may not be the most sustainable solution, especially from the economic point of view [33]. Indeed, single-use plastic products still have properties that cannot be rivalled by any other material available today. These fundamental characteristics are hygiene, practicality, user safety and low cost for the organization. The adoption of strategies based on the Circular Economy concept to manage plastic waste would allow all the positive properties to be retained and prevent their negative impact on the environment [54].
Finally, in addition to a constant search for alternative products to plastic, trade policies and regulations would be the most effective solutions in bringing about large-scale change to the “plastic” industry [49]. Governments around the world have introduced policies involving incentives and penalties to promote the recycling of plastic waste. Following Wang et al. (2020) [55], an increase in incentives or penalties increases the probability that collectors and recyclers will participate in the recycling process; secondly, policy support incentives encourage collectors and recyclers to participate in plastic waste recycling earlier than subsidy incentives do; and finally, recyclers are more sensitive than collectors to government-imposed penalties. Moreover, awareness campaigns aimed at generating and developing environmental consciousness among consumers are widely recognized as effective in modifying their consumption preferences and avoiding environmentally unfriendly products [56]. Thanks to our tool, consumers can understand their role in the consumption and release of plastics. They can realize that the release of plastic into the environment can be intentional (such as during a field trip) or unintentional (e.g., during washing their clothes). In this way, they can be aware of their role in solving some of the environmental problems related to plastics.

5. Conclusions

To reduce the negative impacts of the release of plastics into the environment, three different approaches could be applied: waste disposal regulations, consumer education and production tax schemes. Consumers have a key role in supporting companies and practices that minimize their negative impact on the environment. Therefore, education campaigns that increase consumers’ environmental sensitivity are crucial. A plastic footprint calculator, such as the one reported in this study, can be a useful tool to reach this goal. In this way, users can be educated, informed and trained on the actual presence of plastics in everyday products and can develop their sense of responsibility during product choice.
Estimating the individual plastic footprint allows people to pay more attention to how they dispose of plastic products. Choosing to adopt correct waste management habits in everyday life is not only a gesture of civility, but it is above all a way to increase awareness in order to (i) decrease waste and resources, (ii) save energy used to create new products from the initial raw material, (iii) reduce greenhouse gas emissions and (iv) sustain the environment for future generations.

Author Contributions

Conceptualization, A.S. and G.A.D.; methodology, A.S. and G.A.D.; software, A.S.; validation, A.S. and G.A.D.; formal analysis, A.S.; investigation, A.S. and G.A.D.; resources, G.A.D., M.P. and R.A.; data curation, A.S.; writing—original draft preparation, A.S. and G.A.D.; writing—review and editing, A.S. and R.A.; visualization, A.S. and G.A.D.; supervision, A.S. and G.A.D.; project administration, G.A.D., M.P. and R.A.; funding acquisition, G.A.D., M.P. and R.A. All authors have read and agreed to the published version of the manuscript.

Funding

This research was developed in the framework of the “MountainPlast” research project supported by the Department for Regional Affairs and Autonomies (DARA) of the Italian Presidency of the Council of Ministers of Italian Government (Convention for the co-operation in MountainPlast-Glacier research project with the University of Milan and Mountain Plast-Ecosystems research project with University of Milan Bicocca, both signed the 18 December 2019).

Institutional Review Board Statement

Not applicable.

Informed Consent Statement

Not applicable.

Data Availability Statement

Data used in the study are available upon request to the authors.

Acknowledgments

The results from the questionnaires proposed during the MMT2019 event were digitalized by two bachelor students of the University of Milan in the framework of their degree thesis (Chiara Artioli and Maya Mariani). The researchers at the University of Milan are also grateful to Sanpellegrino-Levissima S.P.A., Stelvio National Park (ERSAF), AlbaOptics, Ecofibre s.r.l., Edilfloor S.p.A., Geo&tex 2000 S.p.A., and Manifattura Fontana S.p.A. for funding and support.

Conflicts of Interest

The authors declare no conflict of interest.

References

  1. Boucher, J.; Friot, D. Primary Microplastics in the Oceans: A Global Evaluation of Sources; IUCN: Gland, Switzerland, 2017. [Google Scholar]
  2. Boucher, J.; Billard, G.; Simeone, E.; Sousa, J. The Marine Plastic Footprint; IUCN: Gland, Switzerland, 2020. [Google Scholar]
  3. Wu, S.R.; Shao, C.; Chen, J. Approaches on the Screening Methods for Materiality in Sustainability Reporting. Sustainability 2018, 10, 3233. [Google Scholar] [CrossRef]
  4. Singh, B.; Sharma, N. Mechanistic Implications of Plastic Degradation. Polym. Degrad. Stab. 2008, 93, 561–584. [Google Scholar] [CrossRef]
  5. Andrady, A.L. The Plastic in Microplastics: A Review. Mar. Pollut. Bull. 2017, 119, 12–22. [Google Scholar] [CrossRef] [PubMed]
  6. Ter Halle, A.; Ladirat, L.; Gendre, X.; Goudouneche, D.; Pusineri, C.; Routaboul, C.; Tenailleau, C.; Duployer, B.; Perez, E. Understanding the Fragmentation Pattern of Marine Plastic Debris. Environ. Sci. Technol. 2016, 50, 5668–5675. [Google Scholar] [CrossRef] [PubMed]
  7. Gigault, J.; Ter Halle, A.; Baudrimont, M.; Pascal, P.Y.; Gauffre, F.; Phi, T.L.; El Hadri, H.; Grassl, B.; Reynaud, S. Current Opinion: What Is a Nanoplastic? Environ. Pollut. 2018, 235, 1030–1034. [Google Scholar] [CrossRef] [PubMed]
  8. Li, P.; Wang, X.; Su, M.; Zou, X.; Duan, L.; Zhang, H. Characteristics of Plastic Pollution in the Environment: A Review. Bull. Environ. Contam. Toxicol. 2021, 107, 577–584. [Google Scholar] [CrossRef] [PubMed]
  9. Cole, M.; Lindeque, P.; Halsband, C.; Galloway, T.S. Microplastics as Contaminants in the Marine Environment: A Review. Mar. Pollut. Bull. 2011, 62, 2588–2597. [Google Scholar] [CrossRef]
  10. PlasticsEurope. The Circular Economy for Plastics—A European Overview; PlasticsEurope: Brussels, Belgium, 2019. [Google Scholar]
  11. Windsor, F.M.; Durance, I.; Horton, A.A.; Thompson, R.C.; Tyler, C.R.; Ormerod, S.J. A Catchment-Scale Perspective of Plastic Pollution. Glob. Chang. Biol. 2019, 25, 1207–1221. [Google Scholar] [CrossRef] [PubMed]
  12. Wagner, M.; Lambert, S. Freshwater Microplastics Emerging Environmental Contaminants; Springer: Berlin/Heidelberg, Germany, 2018. [Google Scholar]
  13. Shahul Hamid, F.; Bhatti, M.S.; Anuar, N.; Anuar, N.; Mohan, P.; Periathamby, A. Worldwide Distribution and Abundance of Microplastic: How Dire Is the Situation? Waste Manag. Res. 2018, 36, 873–897. [Google Scholar] [CrossRef] [PubMed]
  14. Imhof, H.K.; Ivleva, N.P.; Schmid, J.; Niessner, R.; Laforsch, C. Contamination of Beach Sediments of a Subalpine Lake with Microplastic Particles. Curr. Biol. 2013, 23, R867–R868. [Google Scholar] [CrossRef]
  15. Free, C.M.; Jensen, O.P.; Mason, S.A.; Eriksen, M.; Williamson, N.J.; Boldgiv, B. High-Levels of Microplastic Pollution in a Large, Remote, Mountain Lake. Mar. Pollut. Bull. 2014, 85, 156–163. [Google Scholar] [CrossRef] [PubMed]
  16. Zhang, K.; Su, J.; Xiong, X.; Wu, X.; Wu, C.; Liu, J. Microplastic Pollution of Lakeshore Sediments from Remote Lakes in Tibet Plateau, China. Environ. Pollut. 2016, 219, 450–455. [Google Scholar] [CrossRef]
  17. Scheurer, M.; Bigalke, M. Microplastics in Swiss Floodplain Soils. Environ. Sci. Technol. 2018, 52, 3591–3598. [Google Scholar] [CrossRef] [PubMed]
  18. Ambrosini, R.; Azzoni, R.S.; Pittino, F.; Diolaiuti, G.; Franzetti, A.; Parolini, M. First Evidence of Microplastic Contamination in the Supraglacial Debris of an Alpine Glacier. Environ. Pollut. 2019, 253, 297–301. [Google Scholar] [CrossRef] [PubMed]
  19. Allen, S.; Allen, D.; Phoenix, V.R.; Le Roux, G.; Durántez Jiménez, P.; Simonneau, A.; Binet, S.; Galop, D. Atmospheric Transport and Deposition of Microplastics in a Remote Mountain Catchment. Nat. Geosci. 2019, 12, 339–344. [Google Scholar] [CrossRef]
  20. Senese, A.; Maugeri, M.; Meraldi, E.; Verza, G.P.; Azzoni, R.S.; Compostella, C.; Diolaiuti, G. Estimating the Snow Water Equivalent on a Glacierized High Elevation Site (Forni Glacier, Italy). Cryosphere 2018, 12, 1293–1306. [Google Scholar] [CrossRef]
  21. Senese, A.; Maugeri, M.; Ferrari, S.; Confortola, G.; Soncini, A.; Bocchiola, D.; Diolaiuti, G. Modelling Shortwave and Longwave Downward Radiation and Air Temperature Driving Ablation at the Forni Glacier (Stelvio National Park, Italy). Geogr. Fis. E Din. Quat. 2016, 39, 89–100. [Google Scholar] [CrossRef]
  22. Crosta, A.; De Felice, B.; Antonioli, D.; Chiarcos, R.; Perin, E.; Ortenzi, M.A.; Gazzotti, S.; Azzoni, R.S.; Fugazza, D.; Gianotti, V.; et al. Microplastic Contamination of Supraglacial Debris Differs among Glaciers with Different Anthropic Pressures. Sci. Total Environ. 2022, 851, 158301. [Google Scholar] [CrossRef]
  23. PRO CARTON Studio Sulla Percezione Del Packaging Da Parte Dei Consumatori Europei. 2018. Available online: https://www.procarton.com/wp-content/uploads/2018/10/STM101-Pro-Carton-Brochure-ITA4.pdf (accessed on 26 January 2023).
  24. Martinez, S.; del Mar Delgado, M.; Martinez Marin, R.; Alvarez, S. Science Mapping on the Environmental Footprint: A Scientometric Analysis-Based Review. Ecol. Indic. 2019, 106, 105543. [Google Scholar] [CrossRef]
  25. Marques, A.; Verones, F.; Kok, M.T.; Huijbregts, M.A.; Pereira, H.M. How to Quantify Biodiversity Footprints of Consumption? A Review of Multi-Regional Input–Output Analysis and Life Cycle Assessment. Curr. Opin. Environ. Sustain. 2017, 29, 75–81. [Google Scholar] [CrossRef]
  26. Boucher, J.; Dubois, C.; Kounina, A.; Puydarrieux, P. Review of Plastic Footprint Methodologies: Laying the Foundation for the Development of a Standardised Plastic Footprint Measurement Tool. Accessed March 2019, 15, 2020. [Google Scholar]
  27. Diolaiuti, G.; Maugeri, M.; Senese, A.; Panizza, M.; Ambrosini, R.; Ficetola, G.F.; Parolini, M.; Fugazza, D.; Traversa, G.; Scaccia, D.; et al. Immersive and Virtual Tools to See and Understand Climate Change Impacts on Glaciers: A New Challenge for Scientific Dissemination and Inclusive Education. Geogr. Fis. E Din. Quat. 2021, 44, 67–77. [Google Scholar] [CrossRef]
  28. Razza, F.; Fieschi, M.; Innocenti, F.D.; Bastioli, C. Compostable Cutlery and Waste Management: An LCA Approach. Waste Manag. 2009, 29, 1424–1433. [Google Scholar] [CrossRef] [PubMed]
  29. Gaylarde, C.; Baptista-Neto, J.A.; da Fonseca, E.M. Plastic Microfibre Pollution: How Important Is Clothes’ Laundering? Heliyon 2021, 7, e07105. [Google Scholar] [CrossRef] [PubMed]
  30. Browne, M.A.; Crump, P.; Niven, S.J.; Teuten, E.; Tonkin, A.; Galloway, T.; Thompson, R. Accumulation of Microplastic on Shorelines Woldwide: Sources and Sinks. Environ. Sci. Technol. 2011, 45, 9175–9179. [Google Scholar] [CrossRef] [PubMed]
  31. González-Pleiter, M.; Edo, C.; Aguilera, Á.; Viúdez-Moreiras, D.; Pulido-Reyes, G.; González-Toril, E.; Osuna, S.; de Diego-Castilla, G.; Leganés, F.; Fernández-Piñas, F.; et al. Occurrence and Transport of Microplastics Sampled within and above the Planetary Boundary Layer. Sci. Total Environ. 2021, 761, 143213. [Google Scholar] [CrossRef]
  32. De Falco, F.; Cocca, M.; Avella, M.; Thompson, R.C. Microfiber Release to Water, Via Laundering, and to Air, via Everyday Use: A Comparison between Polyester Clothing with Differing Textile Parameters. Environ. Sci. Technol. 2020, 54, 3288–3296. [Google Scholar] [CrossRef] [PubMed]
  33. Bianchini, A.; Rossi, J. Design, Implementation and Assessment of a More Sustainable Model to Manage Plastic Waste at Sport Events. J. Clean. Prod. 2021, 281, 125345. [Google Scholar] [CrossRef]
  34. International Olympic Committee; UN Environment. Plastic Game Plan for Sport. In Sustainability Essentials: A Series of Practical Guides for the Olympic Movement; International Olympic Committee: Lausanne, Switzerland; UN Environment: Nairobi, Kenya, 2020. [Google Scholar]
  35. U.S. National Oceanic; Atmospheric Administration. Decomposition Rates of Marine Debris Items; U.S. National Oceanic; Atmospheric Administration: Sarasota, FL, USA, 2018.
  36. Imam, S.H.; Glenn, G.M.; Chiellini, E. Utilization of Biobased Polymers in Food Packaging: Assessment of Materials, Production and Commercialization. In Emerging Food Packaging Technologies: Principles and Practice; Elsevier: Amsterdam, The Netherlands, 2012. [Google Scholar]
  37. UNEP. Plastics: A Roadmap for Sustainability; UNEP: Athens, Greece, 2018. [Google Scholar]
  38. Chitaka, T.Y.; Russo, V.; von Blottnitz, H. In Pursuit of Environmentally Friendly Straws: A Comparative Life Cycle Assessment of Five Straw Material Options in South Africa. Int. J. Life Cycle Assess. 2020, 25, 1818–1832. [Google Scholar] [CrossRef]
  39. Ncube, L.K.; Ude, A.U.; Ogunmuyiwa, E.N.; Zulkifli, R.; Beas, I.N. An Overview of Plasticwaste Generation and Management in Food Packaging Industries. Recycling 2021, 6, 12. [Google Scholar] [CrossRef]
  40. Aarnio, T.; Hämäläinen, A. Challenges in Packaging Waste Management in the Fast Food Industry. Resour. Conserv. Recycl. 2008, 52, 612–621. [Google Scholar] [CrossRef]
  41. Lau, W.W.Y.; Shiran, Y.; Bailey, R.M.; Cook, E.; Stuchtey, M.R.; Koskella, J.; Velis, C.A.; Godfrey, L.; Boucher, J.; Murphy, M.B.; et al. Evaluating Scenarios toward Zero Plastic Pollution. Science 2020, 369, 1455–1461. [Google Scholar] [CrossRef]
  42. Tencati, A.; Pogutz, S.; Moda, B.; Brambilla, M.; Cacia, C. Prevention Policies Addressing Packaging and Packaging Waste: Some Emerging Trends. Waste Manag. 2016, 56, 35–45. [Google Scholar] [CrossRef]
  43. Ragaert, K.; Delva, L.; Van Geem, K. Mechanical and Chemical Recycling of Solid Plastic Waste. Waste Manag. 2017, 69, 24–58. [Google Scholar] [CrossRef] [PubMed]
  44. Robertson, G.L. Food Packaging, Principle and Practices; CRC Press: Boca Raton, FL, USA, 2013. [Google Scholar]
  45. Guillard, V.; Gaucel, S.; Fornaciari, C.; Angellier-Coussy, H.; Buche, P.; Gontard, N. The Next Generation of Sustainable Food Packaging to Preserve Our Environment in a Circular Economy Context. Front. Nutr. 2018, 5, 121. [Google Scholar] [CrossRef] [PubMed]
  46. Hahladakis, J.N.; Iacovidou, E. Closing the Loop on Plastic Packaging Materials: What Is Quality and How Does It Affect Their Circularity? Sci. Total Environ. 2018, 630, 1394–1400. [Google Scholar] [CrossRef]
  47. Dauvergne, P. Why Is the Global Governance of Plastic Failing the Oceans? Glob. Environ. Chang. 2018, 51, 22–31. [Google Scholar] [CrossRef]
  48. Toniolo, S.; Mazzi, A.; Niero, M.; Zuliani, F.; Scipioni, A. Comparative LCA to Evaluate How Much Recycling Is Environmentally Favourable for Food Packaging. Resour. Conserv. Recycl. 2013, 77, 61–68. [Google Scholar] [CrossRef]
  49. Bick, R.; Halsey, E.; Ekenga, C.C. The Global Environmental Injustice of Fast Fashion. Environ. Health 2018, 17, 1–4. [Google Scholar] [CrossRef]
  50. Niinimäki, K.; Peters, G.; Dahlbo, H.; Perry, P.; Rissanen, T.; Gwilt, A. The Environmental Price of Fast Fashion. Nat. Rev. Earth Environ. 2020, 1, 189–200. [Google Scholar] [CrossRef]
  51. Hobson, J. To Die for? The Health and Safety of Fast Fashion. Occup. Med. 2013, 63, 317–319. [Google Scholar] [CrossRef] [PubMed]
  52. Napper, I.E.; Davies, B.F.R.; Clifford, H.; Elvin, S.; Koldewey, H.J.; Mayewski, P.A.; Miner, K.R.; Potocki, M.; Elmore, A.C.; Gajurel, A.P.; et al. Reaching New Heights in Plastic Pollution—Preliminary Findings of Microplastics on Mount Everest. One Earth 2020, 3, 621–630. [Google Scholar] [CrossRef]
  53. Sohn, Y.J.; Son, J.; Jo, S.Y.; Park, S.Y.; Yoo, J.I.; Baritugo, K.A.; Na, J.G.; Choi, J.; Kim, H.T.; Joo, J.C.; et al. Chemoautotroph Cupriavidus Necator as a Potential Game-Changer for Global Warming and Plastic Waste Problem: A Review. Bioresour. Technol. 2021, 340, 125693. [Google Scholar] [CrossRef] [PubMed]
  54. Gong, Y.; Putnam, E.; You, W.; Zhao, C. Investigation into Circular Economy of Plastics: The Case of the UK Fast Moving Consumer Goods Industry. J. Clean. Prod. 2020, 244, 118941. [Google Scholar] [CrossRef]
  55. Wang, Z.; Huo, J.; Duan, Y. The Impact of Government Incentives and Penalties on Willingness to Recycle Plastic Waste: An Evolutionary Game Theory Perspective. Front. Environ. Sci. Eng. 2020, 14, 29. [Google Scholar] [CrossRef]
  56. Hamoudi, H.; Avilés-Palacios, C. Awareness Campaigns in a Horizontally Differentiated Market with Environmentally Conscious Consumers, Private Versus Public Duopoly. Int. J. Environ. Res. Public Health 2022, 19, 12891. [Google Scholar] [CrossRef]
Figure 1. The first tool for understanding users’ level of knowledge about plastics. It was designed in Italian, but here we report the English version.
Sustainability 15 07017 g001
Figure 2. QR code for the online plastic footprint (English version), also available at the following link https://zfrmz.eu/EXBJ8KvMLwFOg3c9KiYP (accessed on 26 January 2023).
Sustainability 15 07017 g002
Figure 3. The beginning part of the online tool for the plastic footprint calculator (English version). Required questions are marked by red stars.
Sustainability 15 07017 g003
Figure 4. Results of the first survey to define users’ level of knowledge about plastics. Each graph reports the proportion of answers regarding (A) age, (B) the degradation time of different potential wastes in ascending order based on their degradation time (NS: newspaper, AC: apple core, PBag: plastic bag, PC: polystyrene cup, DP: disposable diaper, Pbo: plastic bottle, GB: glass bottle), (C) the frequency of use of different plastic products, (D) which plastic products the user is willing to renounce, (E) the definition of the microplastics (the asterisk indicates the correct answer), (F) the origin of the microplastics (the asterisk indicates the correct answer), and (G) in which environments microplastics were found.
Sustainability 15 07017 g004
Figure 5. Results of the online plastic footprint calculator. Each graph reports the proportion of answers regarding (A) age, (B) all the sections, (C) the items used only for mountain activities and (D) the impact of the activities practised on the mountain.
Sustainability 15 07017 g005
Table 1. The items considered in the section dedicated to mountain users.
ItemMean Weight (g)
synthetic T-shirt140
synthetic fleece250
synthetic windbreaker400
synthetic gloves for skiing and mountaineering160
synthetic hiking shorts250
shoes for mountain running or hiking600
helmets of synthetic material250
synthetic ropes (5.5 mm thickness)23 per meter
climbing shoes500
packaging of snacks, bars and energy drinks involuntarily lost15
hiking boots1200
Disclaimer/Publisher’s Note: The statements, opinions and data contained in all publications are solely those of the individual author(s) and contributor(s) and not of MDPI and/or the editor(s). MDPI and/or the editor(s) disclaim responsibility for any injury to people or property resulting from any ideas, methods, instructions or products referred to in the content.

