Article

The Spatiotemporal Measurement of Coordinated Development of Resource-Environment-Economy Based on Empirical Analysis from China’s 30 Provinces

1
School of Management, Shanghai University, Shanghai 200444, China
2
School of Management, University of Shanghai for Science and Technology, Shanghai 200093, China
*
Author to whom correspondence should be addressed.
Sustainability 2023, 15(8), 6995; https://doi.org/10.3390/su15086995
Submission received: 11 March 2023 / Revised: 14 April 2023 / Accepted: 19 April 2023 / Published: 21 April 2023
(This article belongs to the Special Issue Environment and Sustainable Economic Growth)

Abstract

:
The coordinated development of resource–environment–economy is the strategic choice to realize sustainable development. To explore the historical pattern of the coordinated development of resource–environment–economy, showing the logic of the spatiotemporal evolution of the system in China, this paper conducts a measurement study. Based on the actual data of 30 provinces in China from 2005 to 2019, the paper constructs an evaluation index system for the coordinated development of resource–environment–economy and establishes a coupling coordination degree (CCD) model and a spatial autocorrelation analysis model. The results show that the mean value of the coupled coordination of the three systems (resource–environment–economy) gradually increased from the stage of near dissonance (0.479) in 2005 to the stage of good coordination (0.853) in 2019. The global Moran’s I was 0.349, indicating that there is a certain spatial aggregation of resource–environment–economy at the province level. Coastal areas have a higher degree, while inland areas have a lower degree. In the spatial correlation analysis, the resource–environment–economy coupling coordination degree of 30 provinces in China is significantly positively correlated. Low–low clusters are found mainly in the Northwest (e.g., Xinjiang, Qinghai). Furthermore, the findings provide some targeted international recommendations. Relevant policies should encourage sustainable development and promote green transformation of industrial structure.

1. Introduction

In the 21st century, China’s economic development has been remarkable worldwide. The total economic volume of China is second only to the American total economic volume and still has great potential for development. However, some researchers point out that in the process of rapid development of China’s economy, the traditional crude economic development model has caused serious resource shortages and environmental pollution, relying on high consumption of resources [1,2,3]. The over-exploitation of mineral resources and the massive consumption of fossil energy are the main resource problems facing China [4]. Inefficient use of resources leads to exceeding the limit of ecological and environmental carrying capacity. The harsh ecological environment, in turn, inhibits the development of resources and the economy. The price of rapid economic development in some regions of China is an increasingly polluted environment and a lack of resources, which is inconsistent with the concept of sustainable development [5].
There is no doubt that the poor development patterns of the three subsystems of resource, environment, and economy will further intensify the conflicts among the three systems. If we do not take action, resource shortage will deteriorate into resource depletion [6], environmental pollution will cause ecological degradation [7], and economic development space will be extremely compressed and lack developmental momentum [8]. The government has proposed focusing on resource utilization efficiency and ecological environmental protection while developing the economy, prompting the Chinese economy to enter a stage of high-quality economic development. In this context, this paper conducts a spatial–temporal measurement study of the resource–environment–economy system, aiming to provide a scientific basis for promoting China’s high-quality economic development and ecological civilization construction and to formulate scientific policies according to local conditions. This paper also has implications for the sustainable development of similar countries and regions in the world.
We note that the current research is focused mainly on comprehensive assessment and simple quantitative analysis on the one hand, which presents only the overall characteristics and patterns of the region and does not analyze the reasons for the incoordination among the systems in depth from within each system. On the other hand, there is still a need to refine the impact of resource systems such as resource consumption and resource utilization efficiency. The innovations are as follows. (1) A set of scientific and reasonable evaluation index systems of coordinated resource–environment–economy development is constructed, which involves mainly key analysis indexes at the national level. (2) A multivariate, coupled-coordination degree model is established based on the indicator system. (3) Spatial autocorrelation analysis is used to further analyze the spatial relationship among resource, environment, and economic coupling and coordination. (4) The study reflects a comparative analysis of the binary and multivariate coupling coordination degree model, which is precisely what the existing literature in the database lacks. Through comparative analysis, we can not only comprehensively grasp the evolution law of the resource–environment–economy system but also grasp the particularity of coordinated development between different regions. This renders the policy recommendations that we propose more valuable for implementation. This study systematically sorts out the spatiotemporal evolution patterns of resource–environment–economy at a national level, filling the research gap in this field. This paper can be used as a major guidance of the formulation of national sustainable development strategies.
The structure of the remaining parts is as follows. Section 2 presents a literature review, mainly summarizing the previous non-linear methods of research. Section 3 establishes the coordinated development evaluation system and regression model. The analysis of results is shown in Section 4. Section 5 presents the conclusions of the study. Section 6 is the discussion and policy recommendations.

2. Literature Review

Grossman and Krueger initially proposed the Environmental Kuznets Curve (EKC), which argued the relationship of the subsystems as “inverted U-shaped” [9], in which the economy affects the environment through scale [10], technology [11], and structural effects [6]. Since then, the researchers have given substantial attention to the correlation between the environmental and economic systems. Wilfred suggested that the economy and the environment can be developed in harmony [12]. The relationship between the subsystems was also found to be “U-shaped” [13], “N-shaped” [14], monotonically increasing, or decreasing. Nevertheless, some studies have found that the relationship between environmental pollution and economic growth is not an inverted “U” shape [15,16,17].
In fact, the introduction of the Environmental Kuznets Curve (EKC) provided a number of econometric methods for environmental and economic research [18]. Cantele et al. used an equilibrium model to expand the connection between the economic system and environmental change [19]. As the research has progressed, it has been found that environmental problems are closely related to human exploitation of resources. Natural resources are an important material basis and spatial carrier for high-quality economic and social development. Yu et al. used methods such as structural decomposition to study the impact of CO2 generated from energy utilization in China’s light and chemical industries on sustainable development [20,21]. Scholars have gradually started to research the coordinated development of the three systems: resource–environment–economy. Research in this area focuses mainly on the construction of an evaluation index system and the application research of methodological models. The evaluation index system of the resource–environment–economy was constructed to measure the coordinated development of different regions [22,23,24]. Zhang et al. used the entropy value method and local coordinated development measure to measure the comprehensive evaluation system of regional coordinated development and its spatial and temporal differentiation characteristics with the help of the σ coefficient, variation coefficient, and GIS visualization [25]. By taking China as an example, a two-line comprehensive evaluation system of sea–land coordination was constructed [26]. In terms of the construction and application of the methodological models for coordinated development, the commonly used ones include the coupled coordination degree model, system dynamics model, grey correlation analysis, fuzzy hierarchy analysis, etc. The studies based on the system dynamics model found the coordinated development of resource, environment, and economy as the optimal path [27]. Combined with the coupled coordination degree model, the system dynamics model under the different intensities of resource–environmental control can be further measured for its coordinated development level [28]. Existing studies have measured the coupling coordination degree in the four major regions of China from 1995 to 2014 by constructing a three-system coupling coordination model of energy–economy–environment [29]. Xing et al. used a system dynamics model to simulate four typical scenarios (i.e., current, economic, resource, and environmental scenarios) in Wuhan to develop a coupled coordination model to evaluate the city’s resource–environment–economy [30]. Yang et al. measured the linkages and spatiotemporal heterogeneity between sustainable development and ecosystem services [31]. The coupled coordination model can show the spatiotemporal heterogeneity of the resource–environment–economy. Combining the geographic detector model, the study level can be either a county or a town [32], a region divided by geographical location [33], or a region divided by climate type [34]. Economic corridors, such as the Silk Road Economic Belt in China, also have study value [35]. The level of coordinated development can also be measured by using principal component analysis and a fuzzy mathematical affiliation function [36,37]. There are also studies using Markov chains to explore the spatiotemporal characteristics of the resource–environment–economy pattern in urban agglomerations [38], and the Tapio decoupling model is applied to analyze the decoupling changes [39].
In addition, the coordinated development of resource, environment, and economy can be measured and predicted by the grey correlation model [40], ARMA model [41], and the innovative numerical evaluation scheme [42]. Zhang et al. measured the coupled coordination between economic development and water resources in China [43]. Bildirici et al. focused on the impact of CO2 generated by human use of fossil energy on economic growth by using a smooth transition autoregressive model [44] and a Markov switching vector autoregressive neural network approach [45]. Tomal explored the coupled coordination of the development of all urban areas in Poland by using an ordered classification rating model [46]. Naikoo et al. used an integrated fuzzy logic and coupled coordination model to evaluate the impact of land use expansion on land resources in India [47]. These studies reveal the level of influence of resource use, environmental change, and economic activities on the overall sustainability of the resource–environment–economy system.

3. Research Methods

3.1. Indicator System Construction

Sustainable development is a global issue. How to achieve economic development and environmental protection with limited resources has become an urgent issue. Therefore, it is particularly important to establish a resource–environment–economy evaluation index system that can comprehensively, scientifically, and objectively evaluate the sustainable development status. A set of scientific and reasonable evaluation indicator systems is constructed in this paper based on previous studies [22,23,24,48,49], which includes 31 indicators in 7 dimensions, as shown in Table 1.
The resource subsystem includes indicators such as fossil energy, electricity, and water resources. The environmental subsystem takes industrial pollution as the main indicator, which can better reflect the drawbacks of the research area. The economic subsystem includes indicators such as GDP and urbanization. This work provides reliable support for the study of the coordinated development level of China’s resource–environment–economy system and the spatial differentiation between provinces.

3.2. Research Data and Processing

3.2.1. Research Data

Data on the evaluation indicators of coordinated resource–environment–economy development in 30 provinces (excluding Tibet, Hong Kong, Macao, and Taiwan) were selected for empirical analysis. The statistics are so massive that we list the database at the end of the paper. Some of the data for indicators that are not directly available were obtained through relevant calculations, and some missing data were obtained by mean interpolation.

3.2.2. Data Processing

The basic indicators have different indicator attributes and measurement units, and the indicator data need to be processed according to the indicator meanings and calculation methods. The choice of the standardization method will affect the results of the comprehensive evaluation of the indicator system. This paper refers to the common method of data pre-processing and selects the extreme difference method to standardize the indicators [50,51,52]. The specific formula for standardization is as follows.
Stimulant :   x i j = x i j m i n 1 i m x i j m a x 1 i m x i j m i n 1 i m x i j
Destimulant :   x i j = m a x 1 i m x i j x i j m a x 1 i m x i j m i n 1 i m x i j
where m a x x i j and m i n x i j are the maximum and minimum. x i j   is the value standardized to the data of x i j . The term stimulants means the positive indicators that their higher values indicate that the they contribute more to the system and vice versa [30].

3.3. Empowerment of Indicators

The entropy method is a method to determine the weight of indicators by calculating the size of the information contained in each indicator [53], which give weights to the evaluation indicators of coordinated resource–environment–economy development in this study. It is an objective assignment method, which can prevent the error caused by subjective factors [52,53]. The specific operational steps are as follows.
(1) Indicators weighting ( p i j )…… i —years; j —specific indicators
p i j = x i j / i = 1 m x i j
(2) Calculating the entropy.
e j = K i = 1 m p i j × l n p i j , 0 e j 1 , K = 1 / l n   m
(3) Calculating the redundancy.
d j   =   1     e j
(4) Indicator weights.
w j = d j / j = 1 n d j , j = 1 , 2 , , n

3.4. Evaluation Model Designing

3.4.1. Integrated Evaluation Function

The weights of the indicators of each subsystem of resource, environment, and economy are obtained by assigning weights through the entropy method, and then the comprehensive evaluation score of each subsystem is calculated each year.
Next are the comprehensive evaluation functions of resource, environment, and economy, respectively, as shown in Formula (7) [54].
f i x = j = 1 10 w j × x i j g i y = j = 11 19 w j × x i j h i z = j = 20 33 w j × x i j , i = 1 , 2 , , m

3.4.2. Coupling Coordination Model

This study establishes a multi-faceted coupled coordination model. The two-system coupled coordination model includes three forms: resource–environment, resource–economy, and environment-economy and measures the coordination relationship between the three subsystems: resource, environment, and economy [55]. At the same time, a three-system coupled coordination model of the resource–environment–economy system is established in China’s provincial areas.
(1) Two-system coupled coordination model
To analyze the current situation of coordinated development between the two systems of resource, environment, and economy, a two-element coupling coordination degree model is established by taking the coupling coordination degree model of the two systems of resource–environment as an example. The formulas are as follows.
C i = f i x × g i y / 1 2 f i x + g i y 2
D i = C i × T i T i = α f i x + β g i y
(2) Three-system coupled coordination model
The three-system coupled resource–environment–economy coordination model is formulated as follows.
C i = f i x × g i y × h i z / 1 3 f i x + g i y 3 3
D i = C i × T i T i = α f i x + β g i y + γ h i z
where D i is the degree of coupling coordination. f i x ,   g i y ,   h i z denotes the evaluation functions of the resource, environmental, and economic subsystems, respectively. C i is the coupling degree of the two, the C i 0 , 1 , and D i is the degree of coupling coordination. T i is the comprehensive evaluation index of the three systems [56]. α ,   β ,   γ are the coefficient to be determined and satisfy α + β + γ = 1 . This study considered that the 3 subsystems of resource, environment, and economy are equally important, so the 2-element system is α = β = 1 / 2 . The ternary system is α = β = γ = 1 / 3 [33].
There is no unified standard for the classification of coupling coordination. This study combines the criteria of Chen et al. [51] for classifying the types of coupling coordination with the current development status of resource, environment, and economic systems and divides the coupling coordination degree into two categories, including “dysfunctional and declining” and “coordinated development”, with a total of ten levels (Table 2). The coupling coordination value directly reflects the coupling coordination levels. “Dysfunctional and declining” indicates that the coordinated development of each system is poor, and the composite system is in the stage of dysfunctional and declining. “Coordinated development” indicates that the system is beginning to develop together. When the system is in the quality coordination stage, it reaches the optimal state and achieves synergistic development among the systems.

3.4.3. Spatial Autocorrelation Analysis

Spatial autocorrelation analysis is conducted to study the spatial correlation and variability of the coordinated development of resource, environment, and economy among 30 provinces in China. Spatial autocorrelation analysis uses the Moran’s I to determine the degree of correlation within a spatial range. Compared to traditional regression models, spatial autocorrelation analysis can better consider the specificity of spatial data. According to the different spatial scope of the study, it can be separated into global and local spatial autocorrelation.
(1) The global Moran’s I
The global Moran’s I (GMI) was used for measurement, analyzing the spatial correlation and degree of variation in the coupled coordination of resource, environment, and economy.
0 < Moran s   I 1 ; the spatial relationship is positive. As the value increases, the spatial correlation becomes more significant.
Moran s   I = 0 ; the spatial relationship is a randomly distributed state.
1 Moran s   I < 0 ; the spatial relationship is negative. As the value decreases, the spatial correlation becomes slender, and the spatial difference increases.
Moran s   I = i = 1 n j = 1 n w ij x i x ¯ x j x ¯ S 2 i = 1 n j = 1 n w ij
(2) The LISA statistic
Local spatial autocorrelation can analyze the local spatial incongruity that exists in the coupled coordination of resource, environment, and economy, and to discover the spatially heterogeneous characteristics of the degree of coupled coordination among provinces. The LISA statistic of Local Moran’s I is tested via the following formula, where S 2 = 1 n i = 1 n x i x ¯ 2 .
L I S A = x i x ¯ S 2 j = 1 n w i j x i x ¯
n , the number of subjects studied
x i , x j , the value of the object attribute
x ¯ , the mean of x i
w i ,   j , the matrix of weights between objects i and j

4. Results

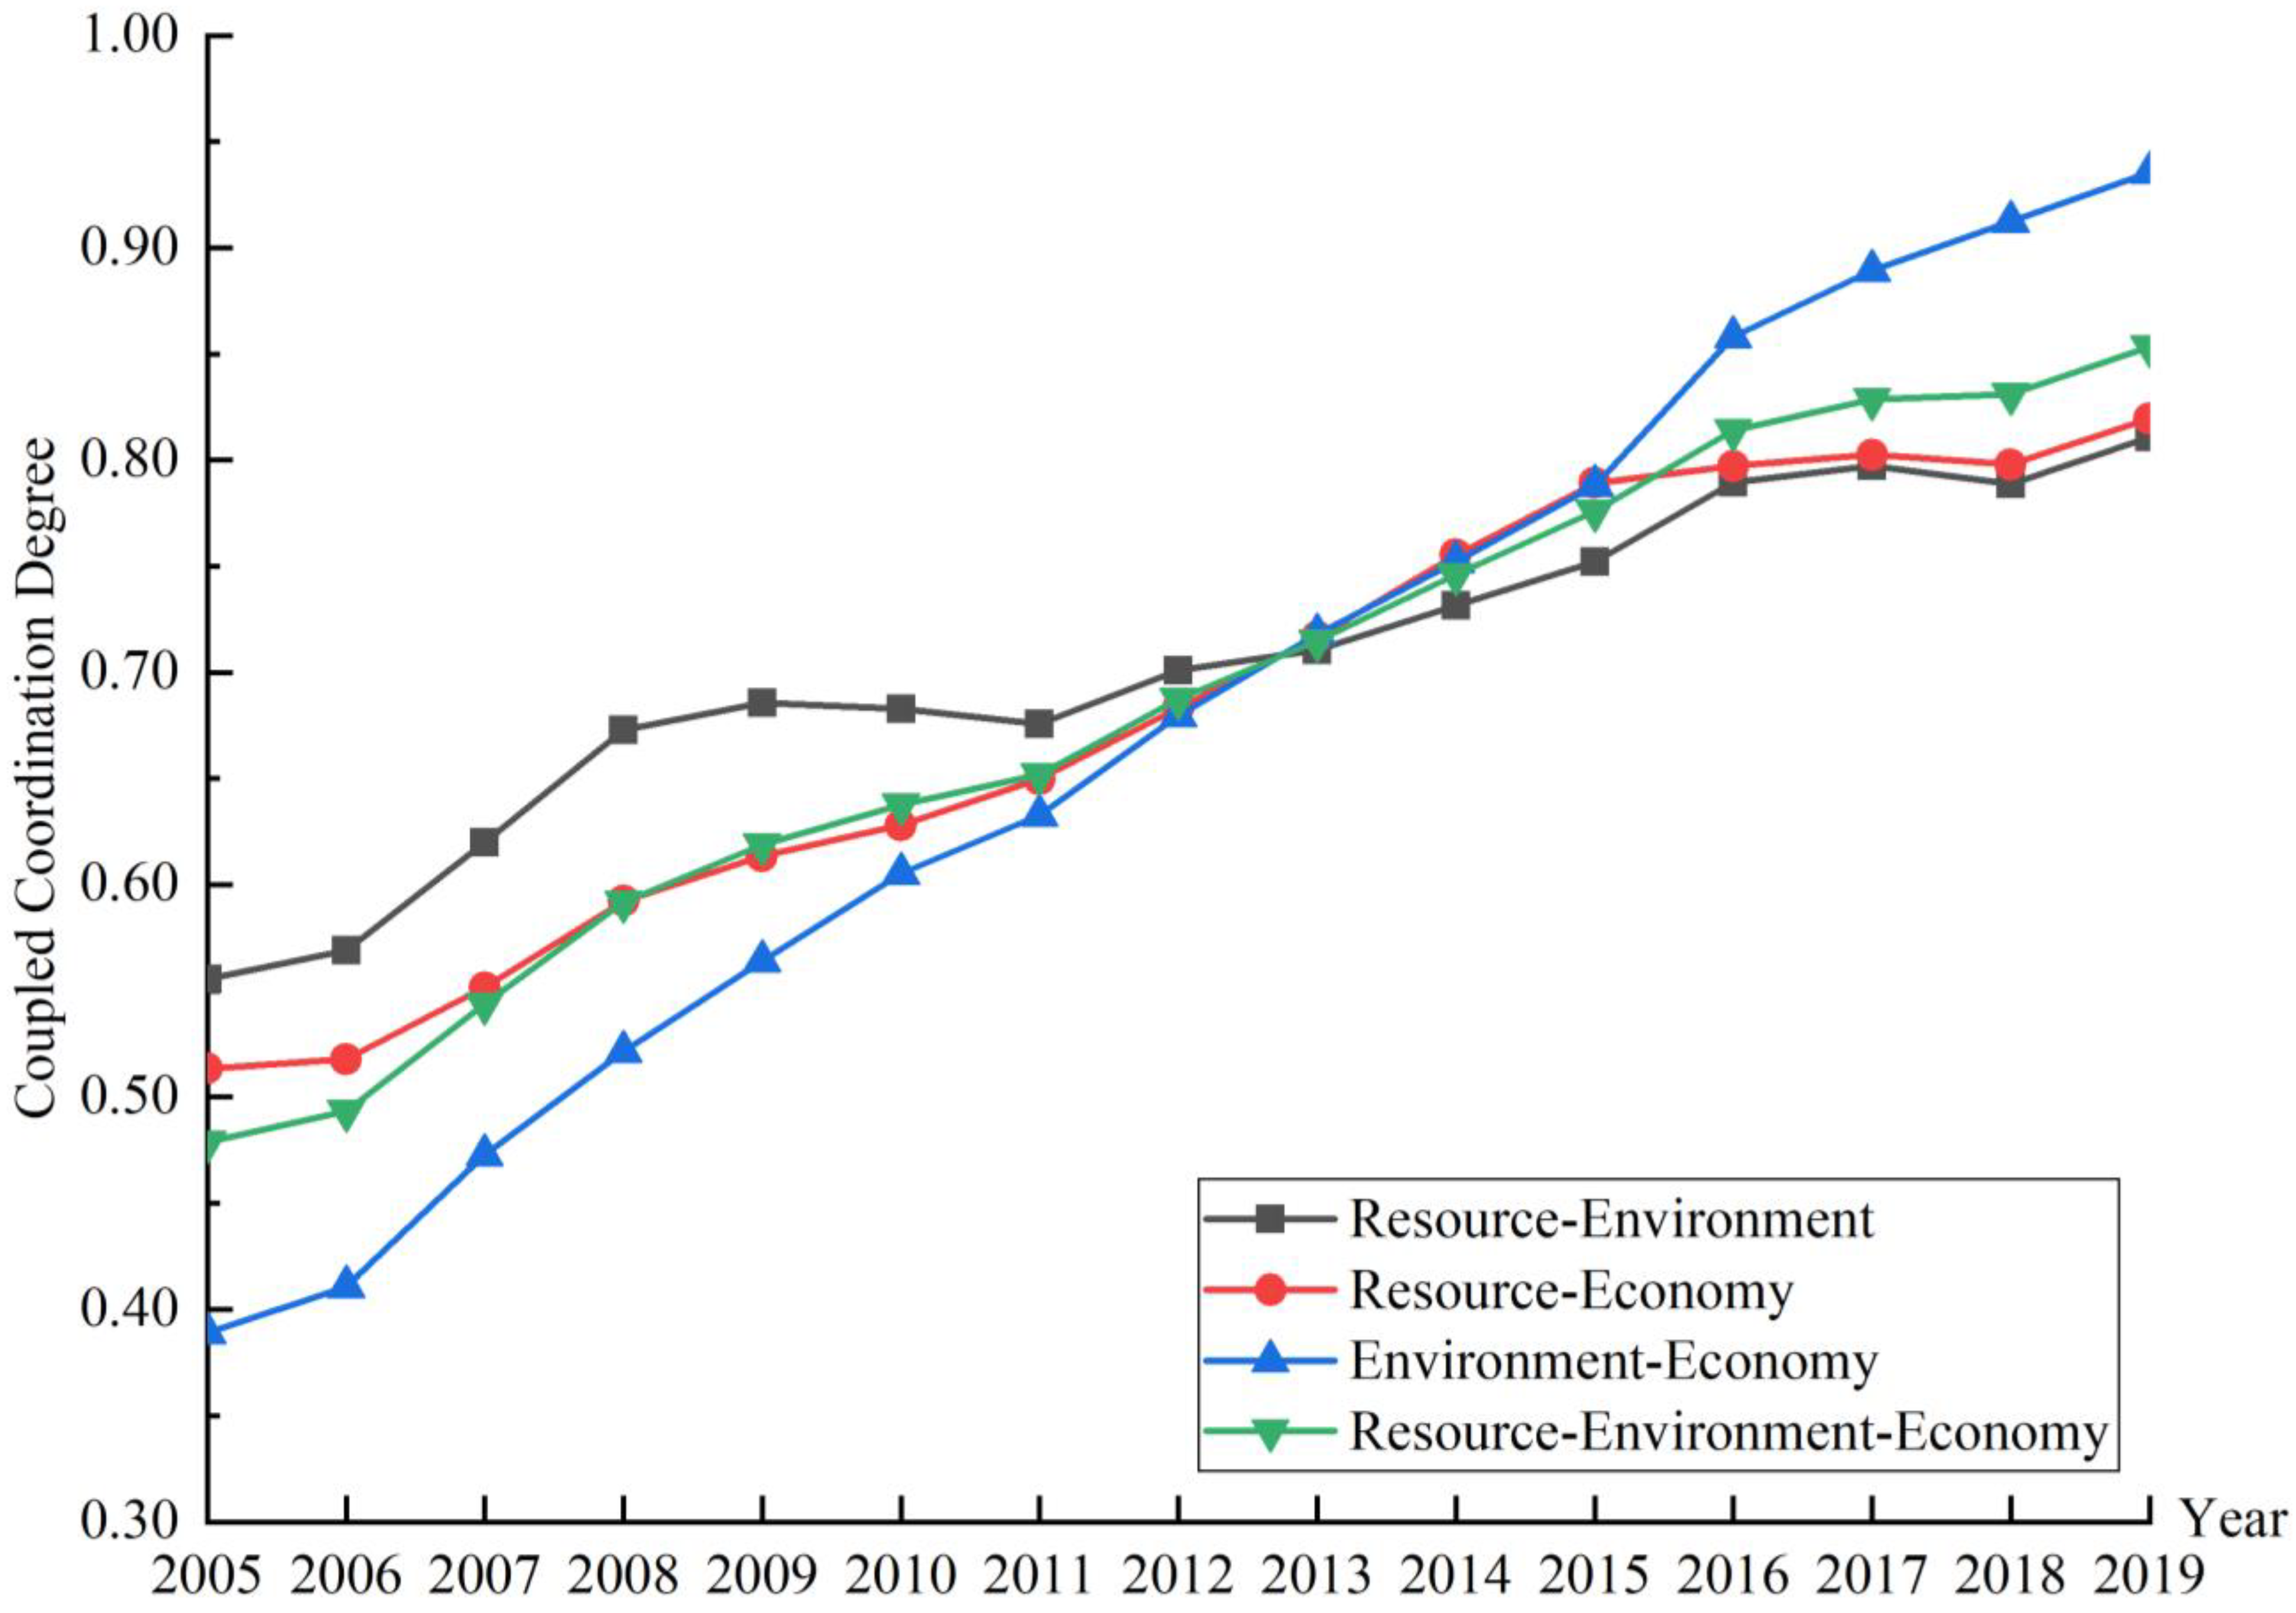
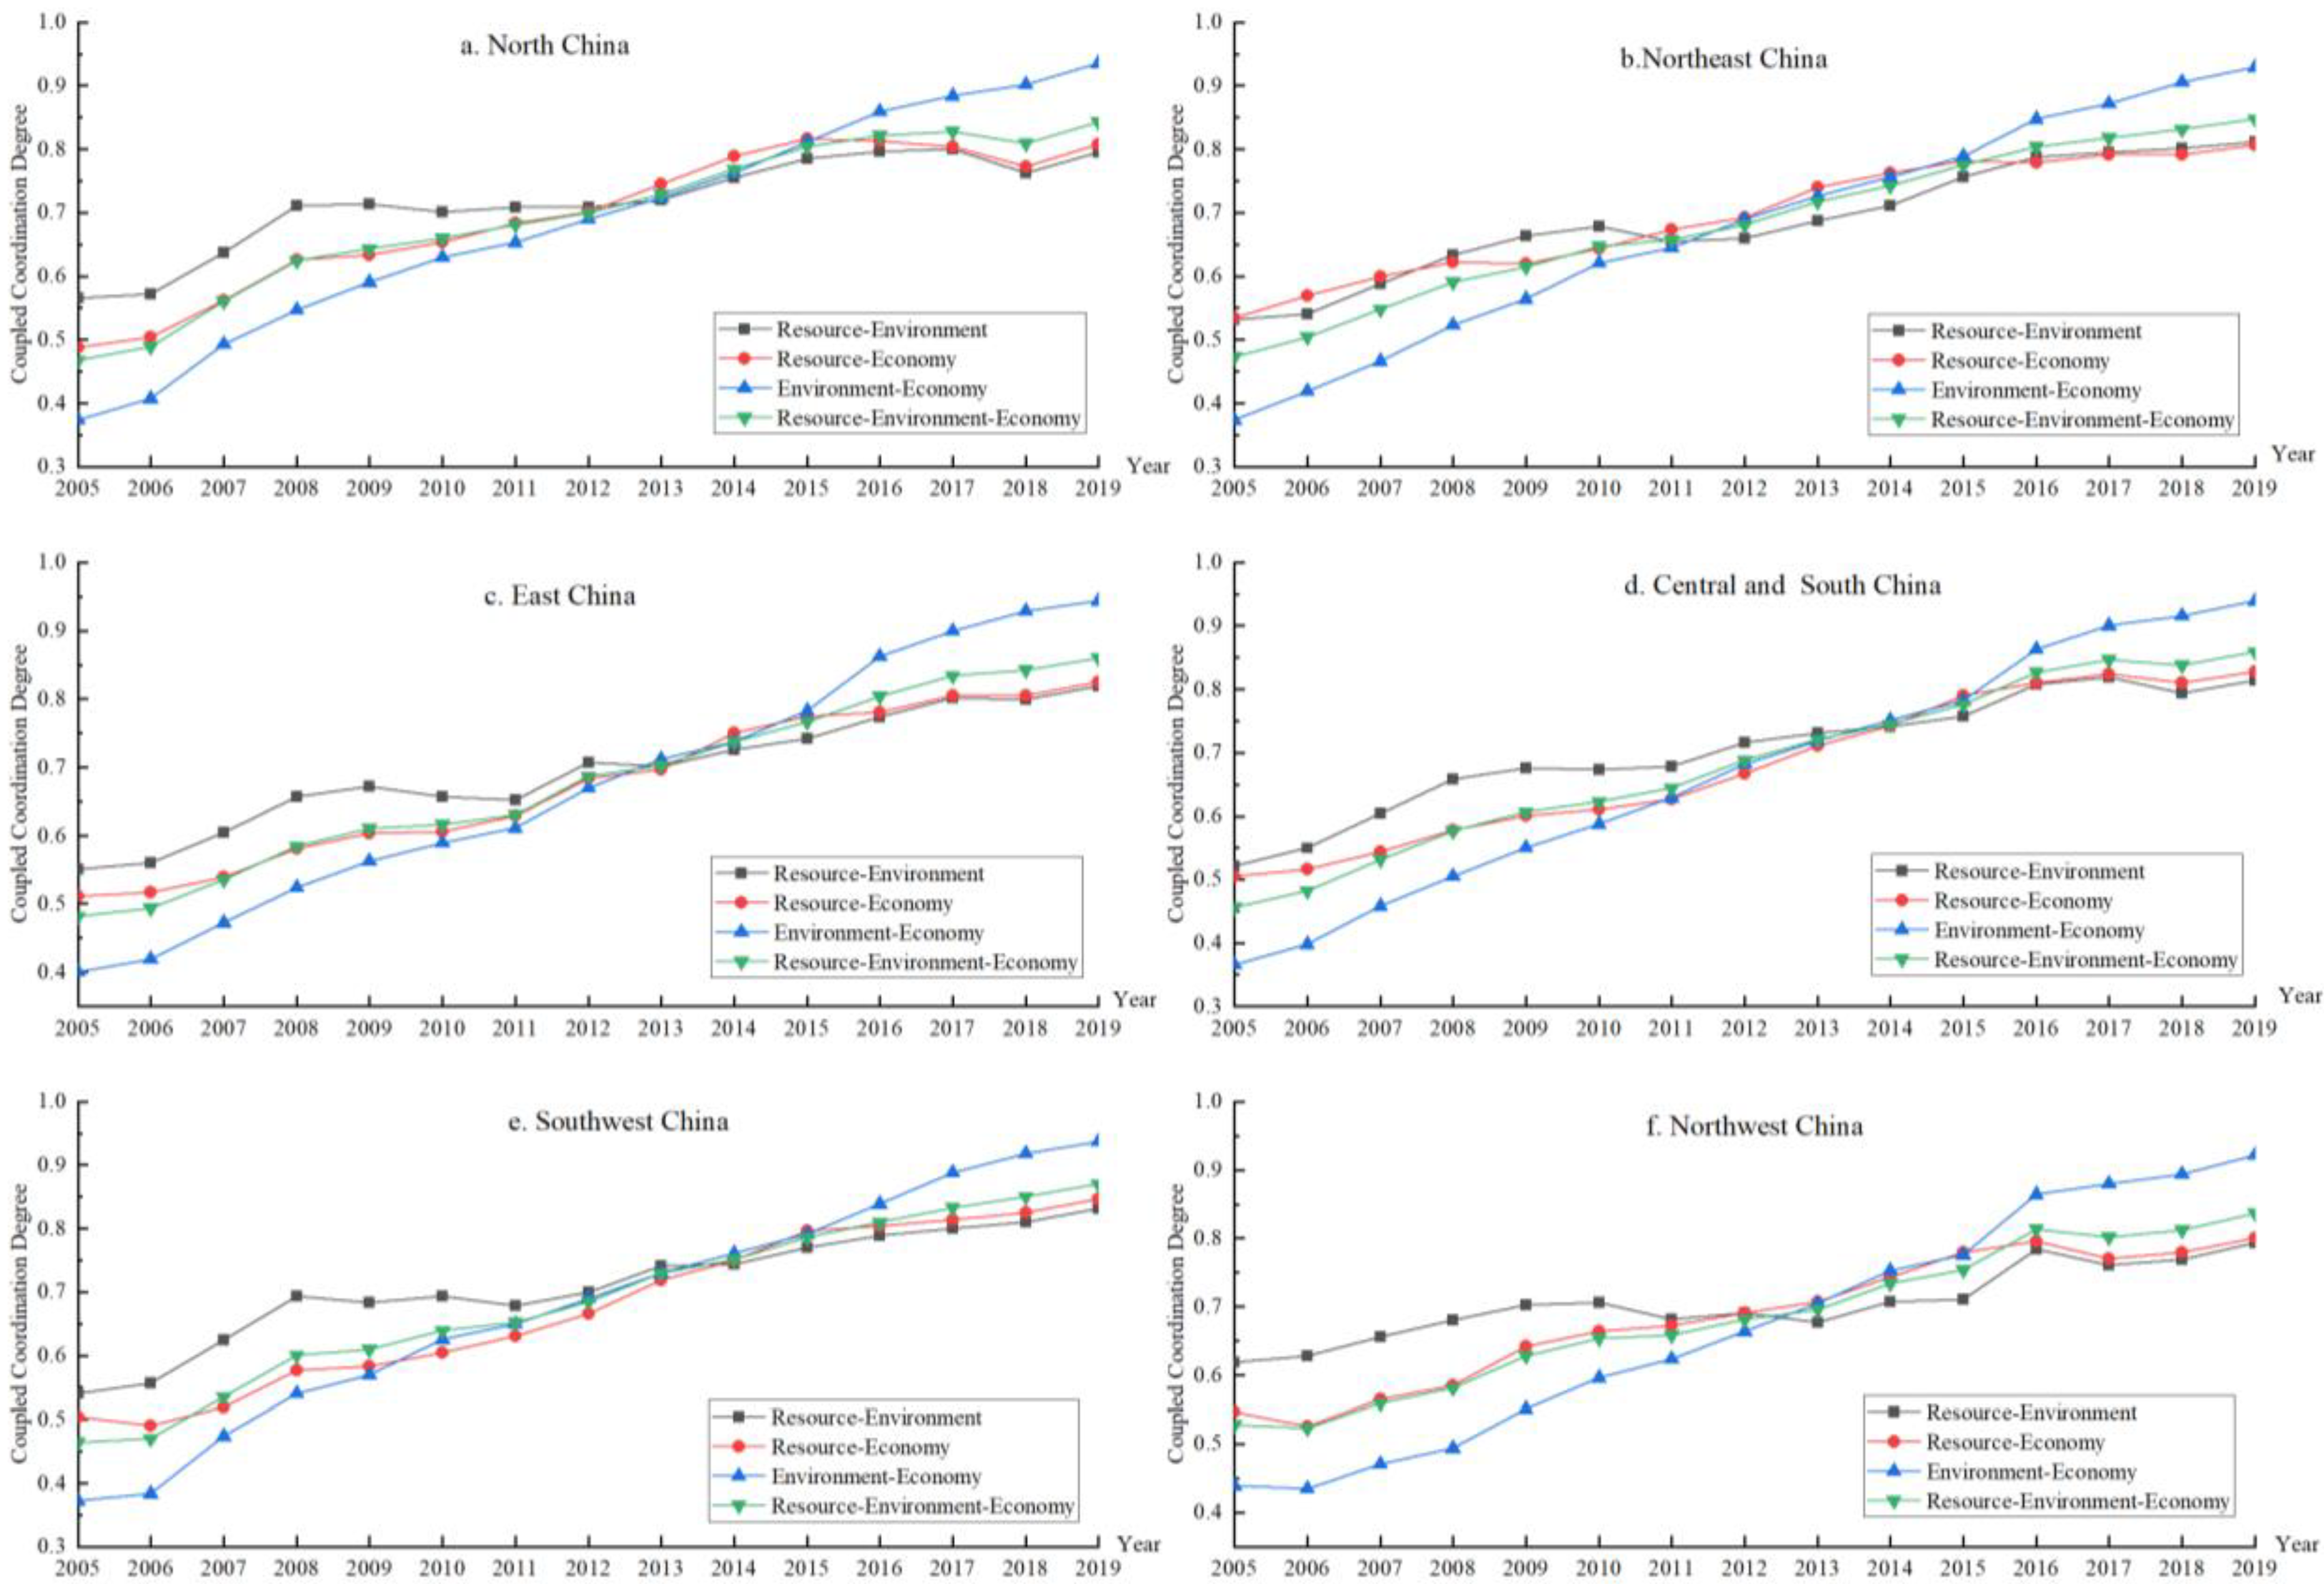
4.1. Analysis of Time-Series Evolutionary

At the overall level, the coupled coordination degree of the resource–environment–economy system in China’s provinces is on the rise from 2005 to 2019, as shown in Figure 1 and Table 3. In particular, the mean value of the coupled coordination of the three systems (resource–environment–economy) gradually increased from the stage of near dissonance (0.479) in 2005 to the stage of good coordination (0.853) in 2019. The coupled environment–economy coordination tends to rise faster than the other coupled coordination, indicating that the resource subsystem is more restricted. Before 2012, the coupling coordination of resource–environment was higher than that of the three systems, while environment–economy was lower than that of the three systems. On the one hand, this is reflected in the fact that before 2012, China’s economic development model was relatively backward and relied mainly on the high consumption of resources. On the other hand, due to limited and non-renewable resources, the consumption of resources brought about by economic development has increased, leading to a slow increase in the coupling coordination of resource–environment and resource–economy. Since 2012, with the implementation of the “New Development Concept”, the government has been vigorously promoting the optimization of economic structure and promoting energy conservation and emission reduction [57], such that the three systems in the provincial average have maintained an upward trend.
At the regional level, the coupled coordination of the resource–environment–economy system in the 6 regions showed an overall increase from 2005 to 2019, as shown in Figure 2. Since 2012, the resource, environment, and economy policies and measures promulgated and introduced by the government have had a significant influence on the coordinated development of resource, environment, and economy. Before 2012, China’s provincial economic development model relied mainly on resource inputs, and the coupling and coordination of resource, environment, and economy were all low. Since 2012, the government has attached great importance to the construction of ecological civilization, advocating green development, energy saving, emission reduction, and environmental protection, which has gradually improved the environmental quality of China’s provinces and regions. As China’s economy enters a new normal stage of “medium to high speed, new dynamics and excellent structure”, the capacity for innovation is constantly enhanced. The degree of resource, environment, and economy continues to maintain an upward trend because of the new energy development. By 2019, the six regions of China had all risen to a stage of good coordination.
It is also worth noting that in 2017 and 2018, the coupled coordination degree of resource–environment, resource–economy, and resource–environment–economy systems in North China, Central and South China, and Northwest China fell back. This is because the conversion speed of new and old kinetic energy was slow, leading to a lack of momentum in their development. In contrast, the level has been able to maintain a steady increase in East China and Southwest China [52]. The economic development of East China is dominated by high-value-adding, low-energy consumption tertiary industries and high-tech industries. Southwest China is rich in natural resources, with less resource consumption and a relatively good environment. With the “Belt and Road” and other strategic policies, the economy of the southwest region has been developing rapidly. As a result, the coordination of resource, environment, and economy in East China and Southwest China has increased.

4.2. Analysis of Spatial Distribution Characteristics

The years 2005, 2010, 2015, and 2019 were selected as the time sections, and ArcGIS software was used to visualize the spatial distribution characteristics of the coordinated development of resource, environment, and economy in 30 provinces in China [58]. Due to the limited space of this paper, only the spatial distribution characteristics of the environment–economy and resource–environment–economy are analyzed; the two other systems will not be analyzed in detail.

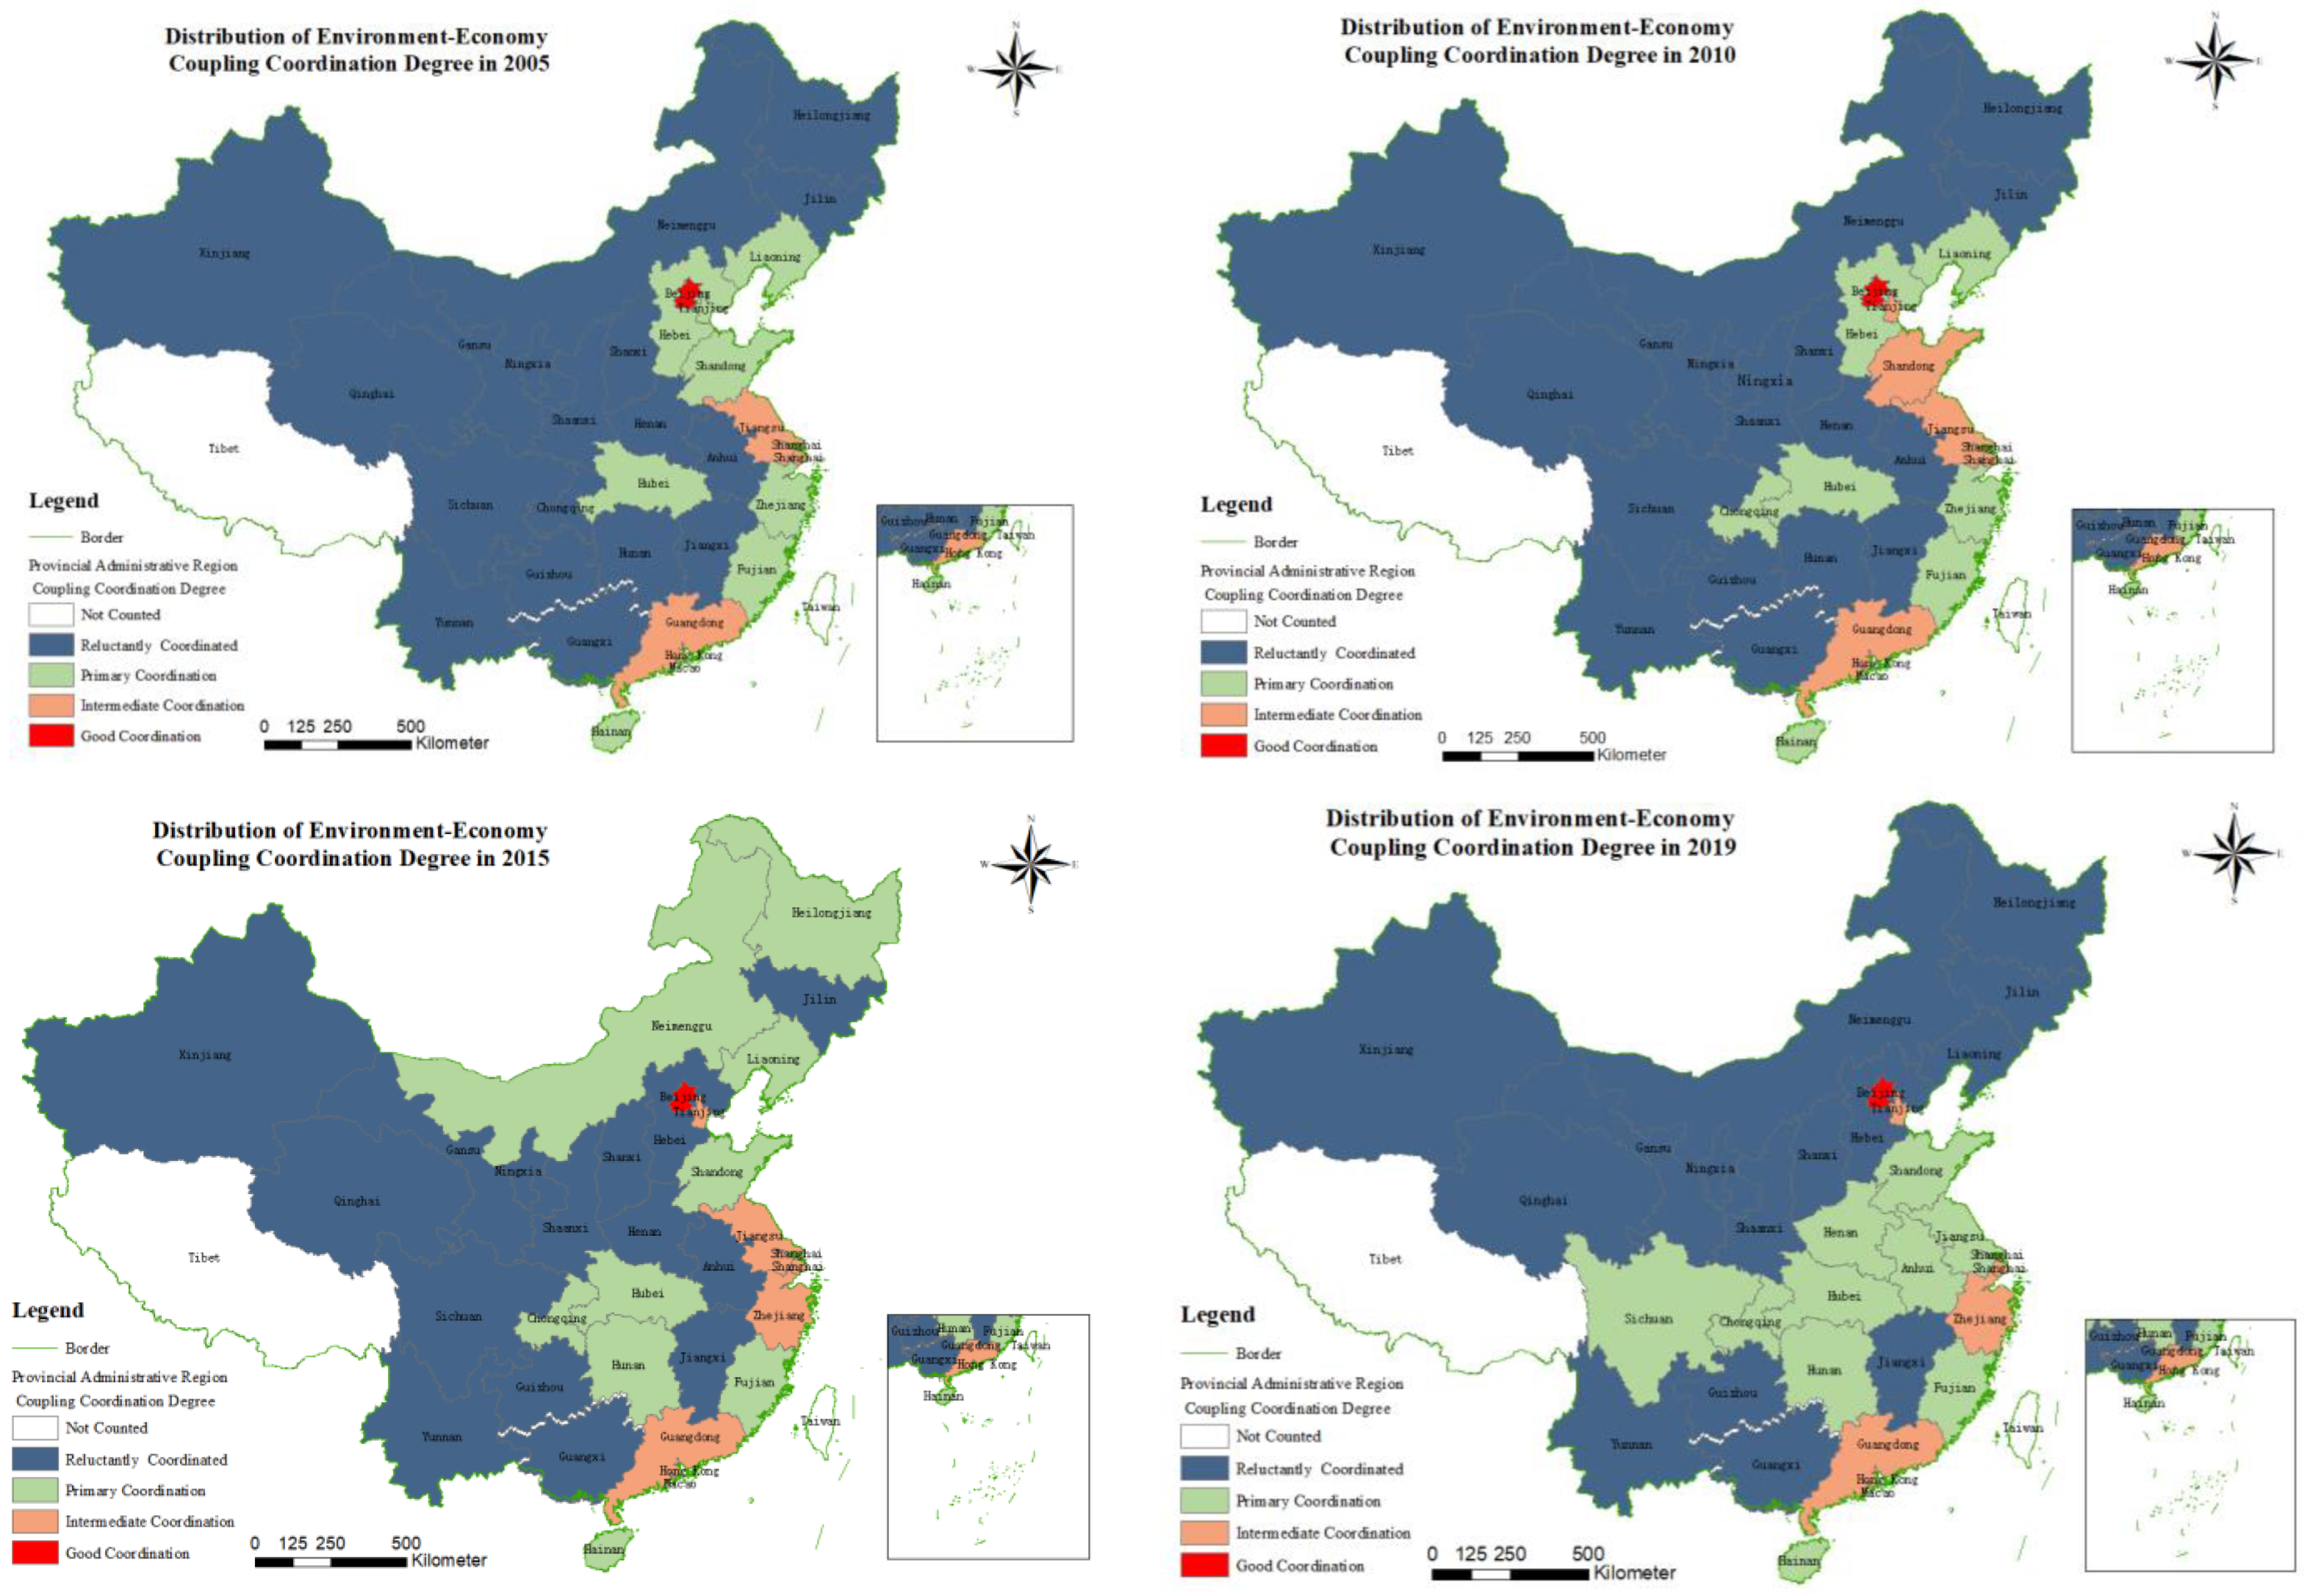
4.2.1. Analysis of the Spatial Distribution Characteristics of the Two Systems

Figure 3 shows that the coupled environment–economy coordination of China’s 30 provinces is generally low, with most of them at the barely coordinated stage and only Beijing at the well-coordinated stage. Most of the provinces with high coupling coordination are located in coastal areas, such as Jiangsu, Shanghai, and Guangdong [59], while in China’s inland areas, the coupling coordination is lower due to the relatively backward economic development of Xinjiang, Ningxia, Gansu, and Qinghai provinces. As the government advocates the “New Development Concept”, the coupled environment–economy coordination in the inland regions has also been rising.
The diagram also shows that there is a more obvious radiative development in the coupled environment–economy coordination between provinces. It can be seen that there is a spatial correlation between the coupling coordination degree of environment and economy. In Hubei, for example, with the radiating effect brought by Hubei, the economy, resources, and environment of neighboring provinces are also affected accordingly. In 2005, Hubei was at the primary coordination stage. In 2010, Chongqing also rose to the primary coordination stage. In 2015, Hunan also rose to the primary coordination stage. In 2019, the coupling coordination of environment–economy in Sichuan, Chongqing, Hunan, Henan, and Anhui all rose to the primary coordination stage.

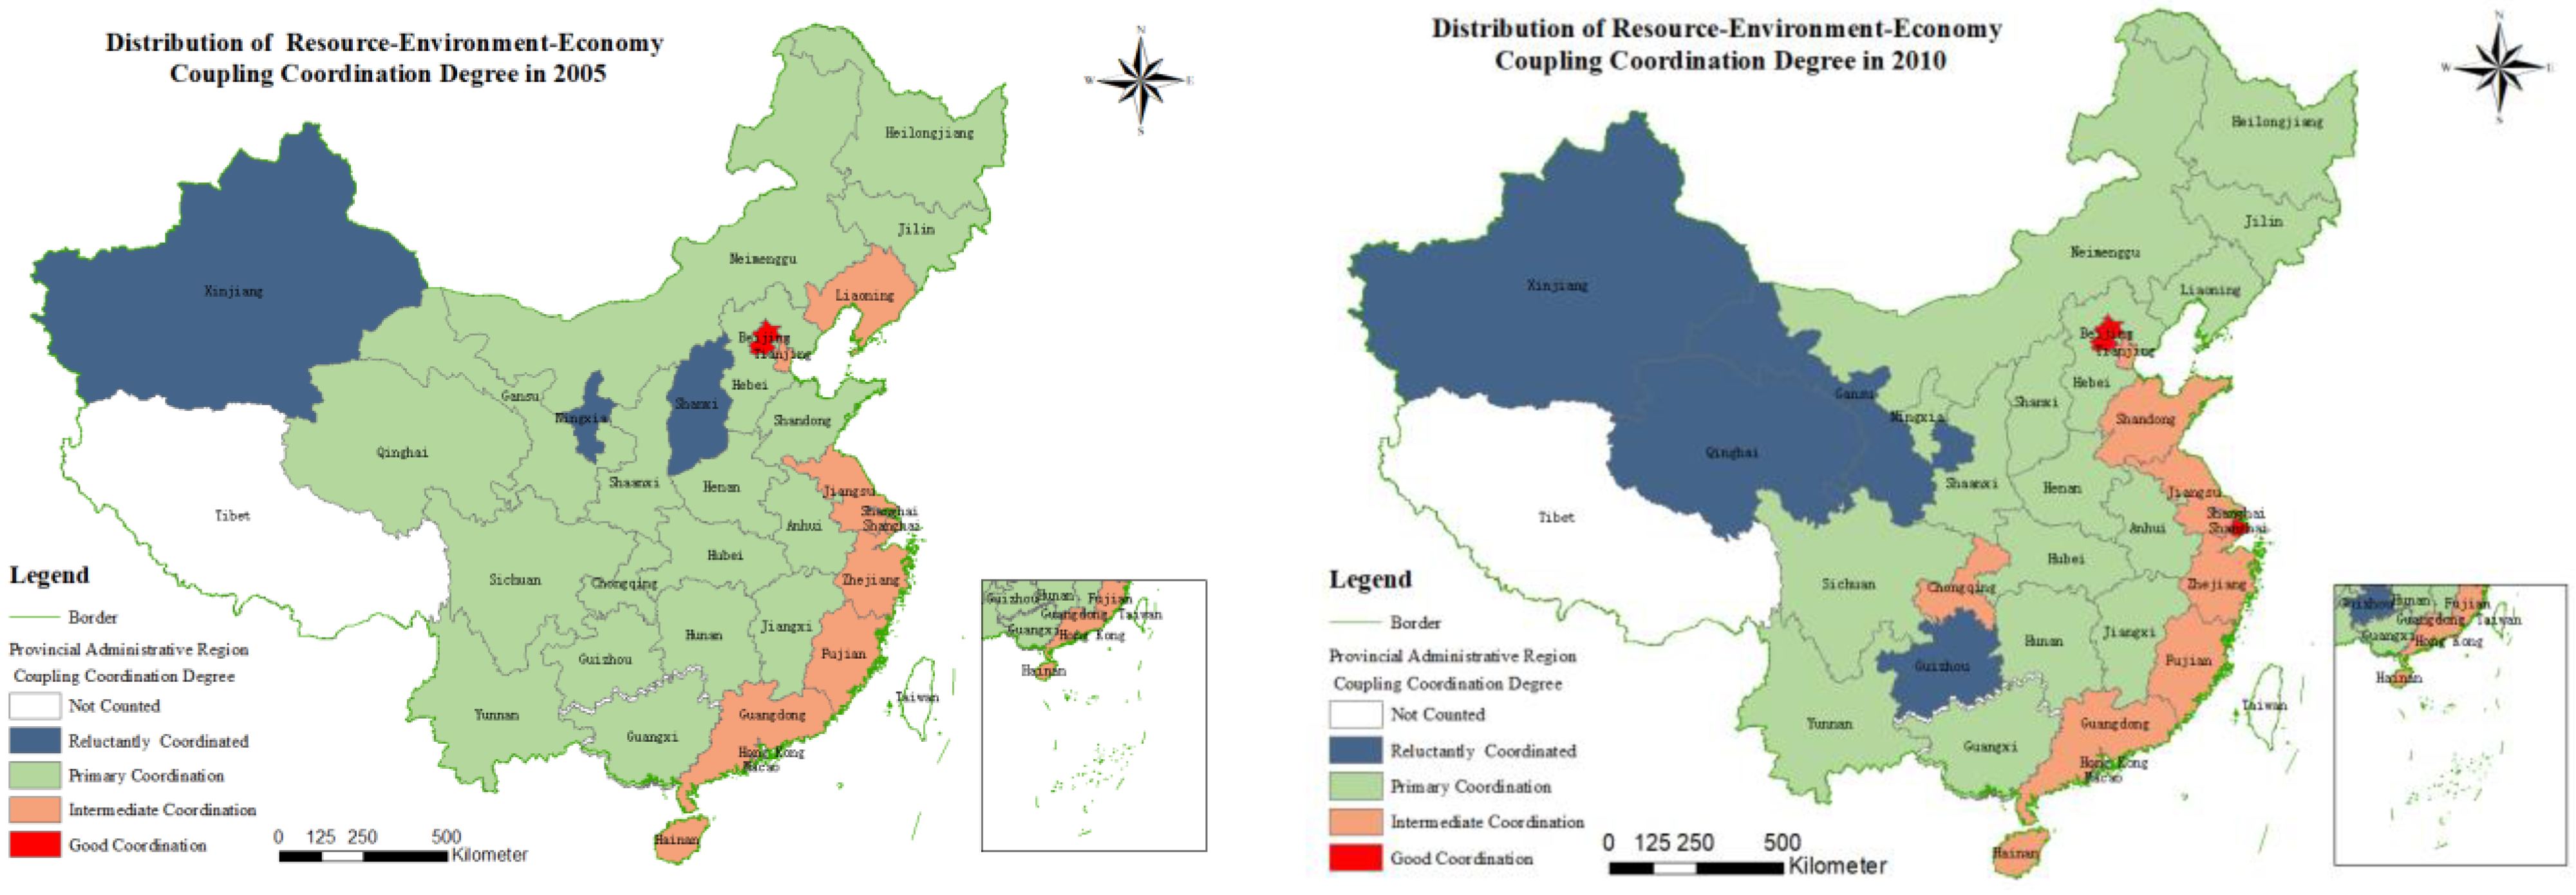
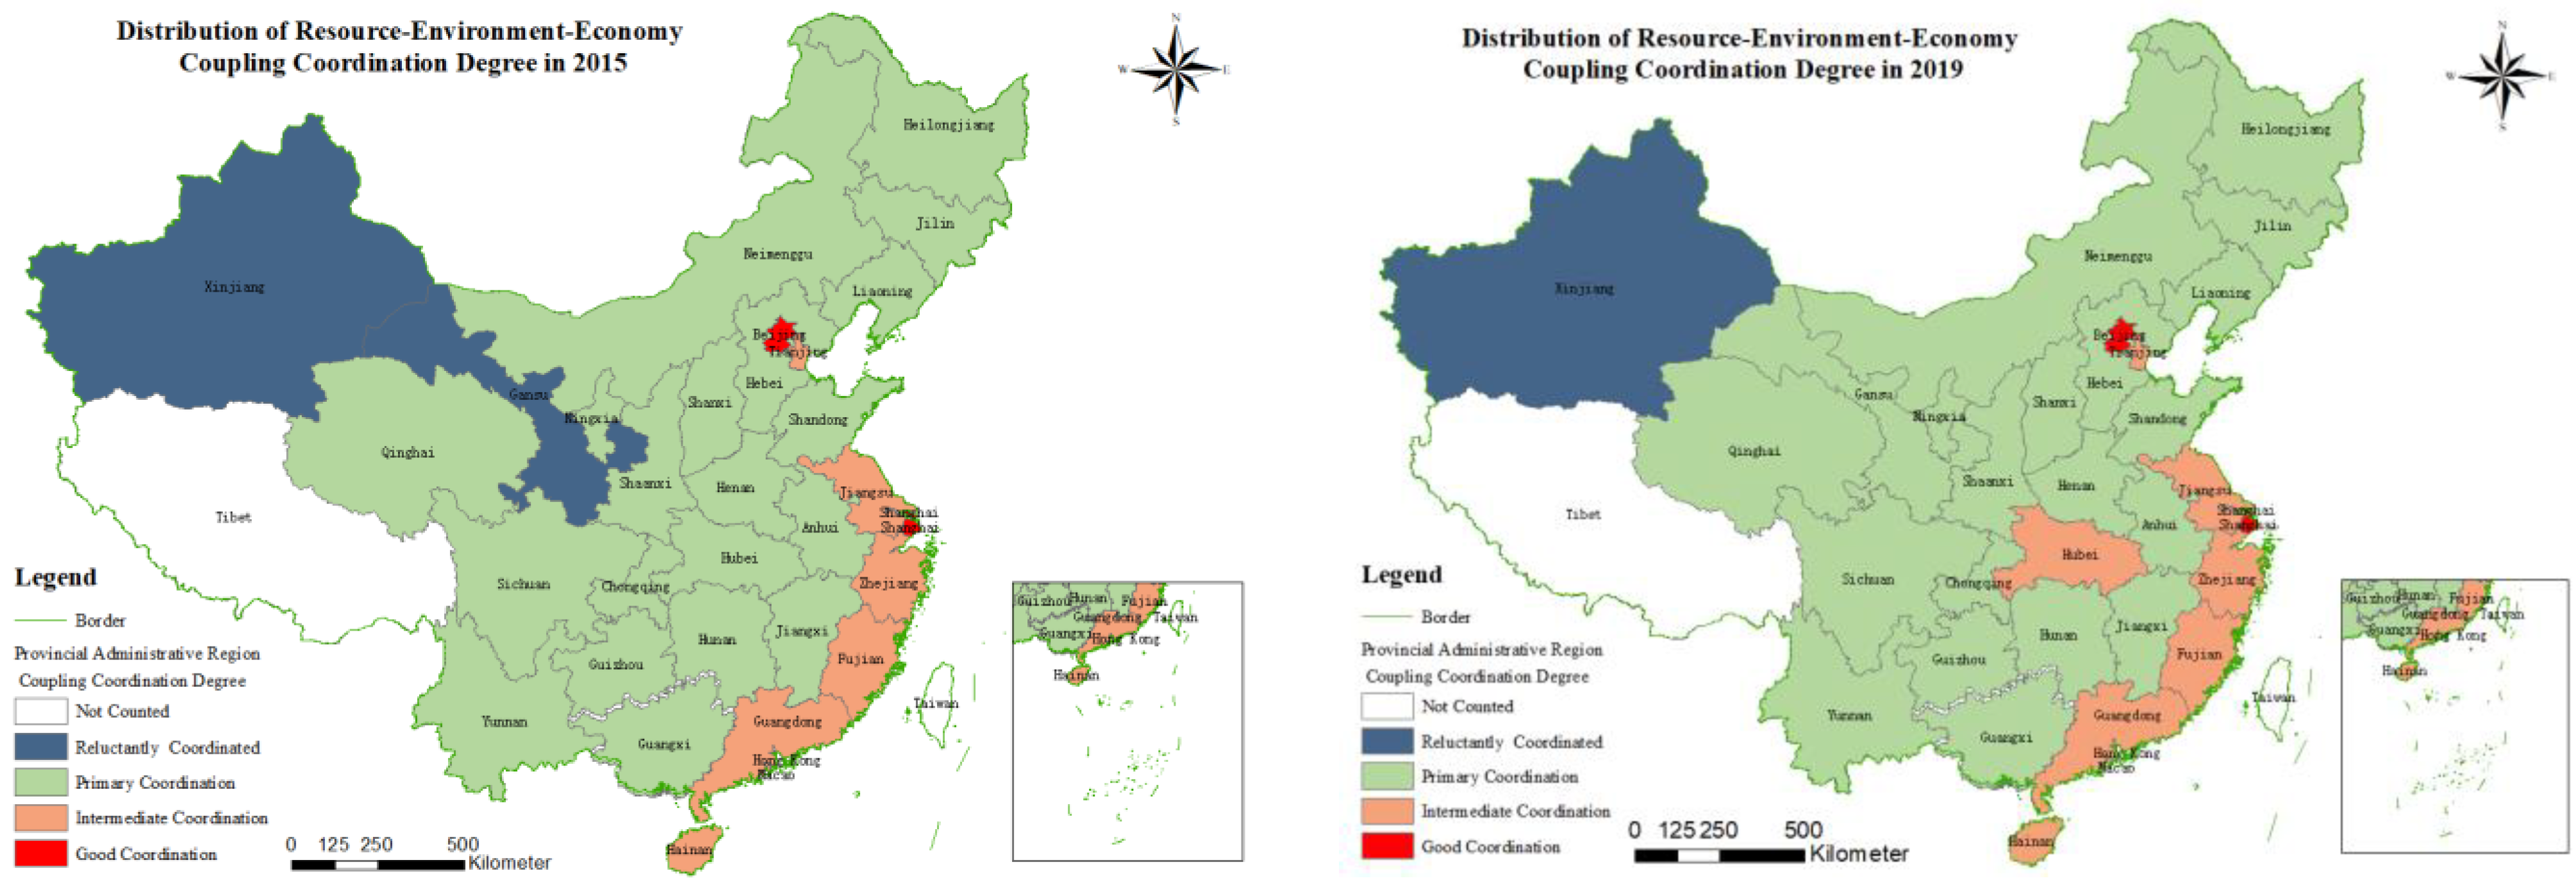
4.2.2. Analysis of the Spatial Distribution Characteristics of the Three Systems

The spatial distribution characteristics of the three-system (resource–environment–economy) coupling coordination degree are analyzed by combining the hierarchical classification of the three-system (resource–environment–economy) coupling coordination degree of 30 provincial regions in China at different time sections (Table 4). From Table 4 and Figure 4, it can be seen that most of the 30 provincial areas in China are at the primary coordination stage, and there are significant differences between the coastal provinces and inland provinces in terms of the degree of coordination of the three-system coupling [59]. The coastal provinces of Jiangsu, Shanghai, Zhejiang, and Guangdong are at an intermediate level of coupling and coordination. The coastal provinces are relatively more economically developed and densely populated and have fewer resources than the inland provinces, so the government encourages enterprises to vigorously develop high-tech industries and tertiary industries, thus making the economic development of the coastal areas less dependent on resource consumption and reducing the emission of pollutants [60]. Meanwhile, the economic development of Xinjiang, Qinghai, and Gansu provinces is more backward, and their economic development still relies on resource consumption, generating a large number of pollutants, thus making the coupling of their three systems less coordinated. The government has introduced strategies such as “Western Development” and “One Belt, One Road”, but due to the geographical location and inconvenient transportation, the transformation is slow, and the development momentum is insufficient. The economic development of the inland region is still at an underdeveloped level.
In addition, the three-system coupling in China has a certain spatial aggregation, which is similar to the environment–economy [61]. For example, in 2010, Xinjiang, Qinghai, Gansu, and Guizhou showed as being in the reluctantly coordinated stage, and they all clustered in the more backward areas of economic development in the west. Between 2005 and 2015, most of the provinces with a high degree of three-system coupling were located in China’s coastal regions, which are vigorously developing tertiary industries and high-tech industries, and these provinces have been transforming and upgrading their economies more rapidly, thus making their three-system coupling and coordination degree rise continuously. By 2019, the spatial distribution of the three systems gradually develops in the direction of random distribution.

4.3. Spatial Correlation Analysis

4.3.1. Global Moran’s I Test

This part is to further verify the spatial aggregation on the coupled coordination degree of environment–economy and resource–environment–economy of 30 provincial regions in China. The global Moran’s I test results for the coupled coordination degrees of the 30 provincial areas in the 4-time cross-sections were calculated, as shown in Table 5 and Table 6.
The Moran’s I index values for the global spatial autocorrelation of the coupled environment–economy and resource–environment–economy of the 30 provinces in China are all positive, and the z-values are all greater than 2.58, which are highly significant at the 99% confidence interval, as shown in Table 4 and Table 5. The spatially significant positive correlations were found among the 30 provinces in China. Furthermore, Moran’s I index was found to decrease gradually over time, indicating that the spatial correlation among provinces and regions in China has been decreasing over time. However, the coupling coordination degree between provinces and regions is influenced mainly by each province’s economy, environment, and resources; the spatial correlation between provinces weakens and gradually develops in the direction of random distribution.

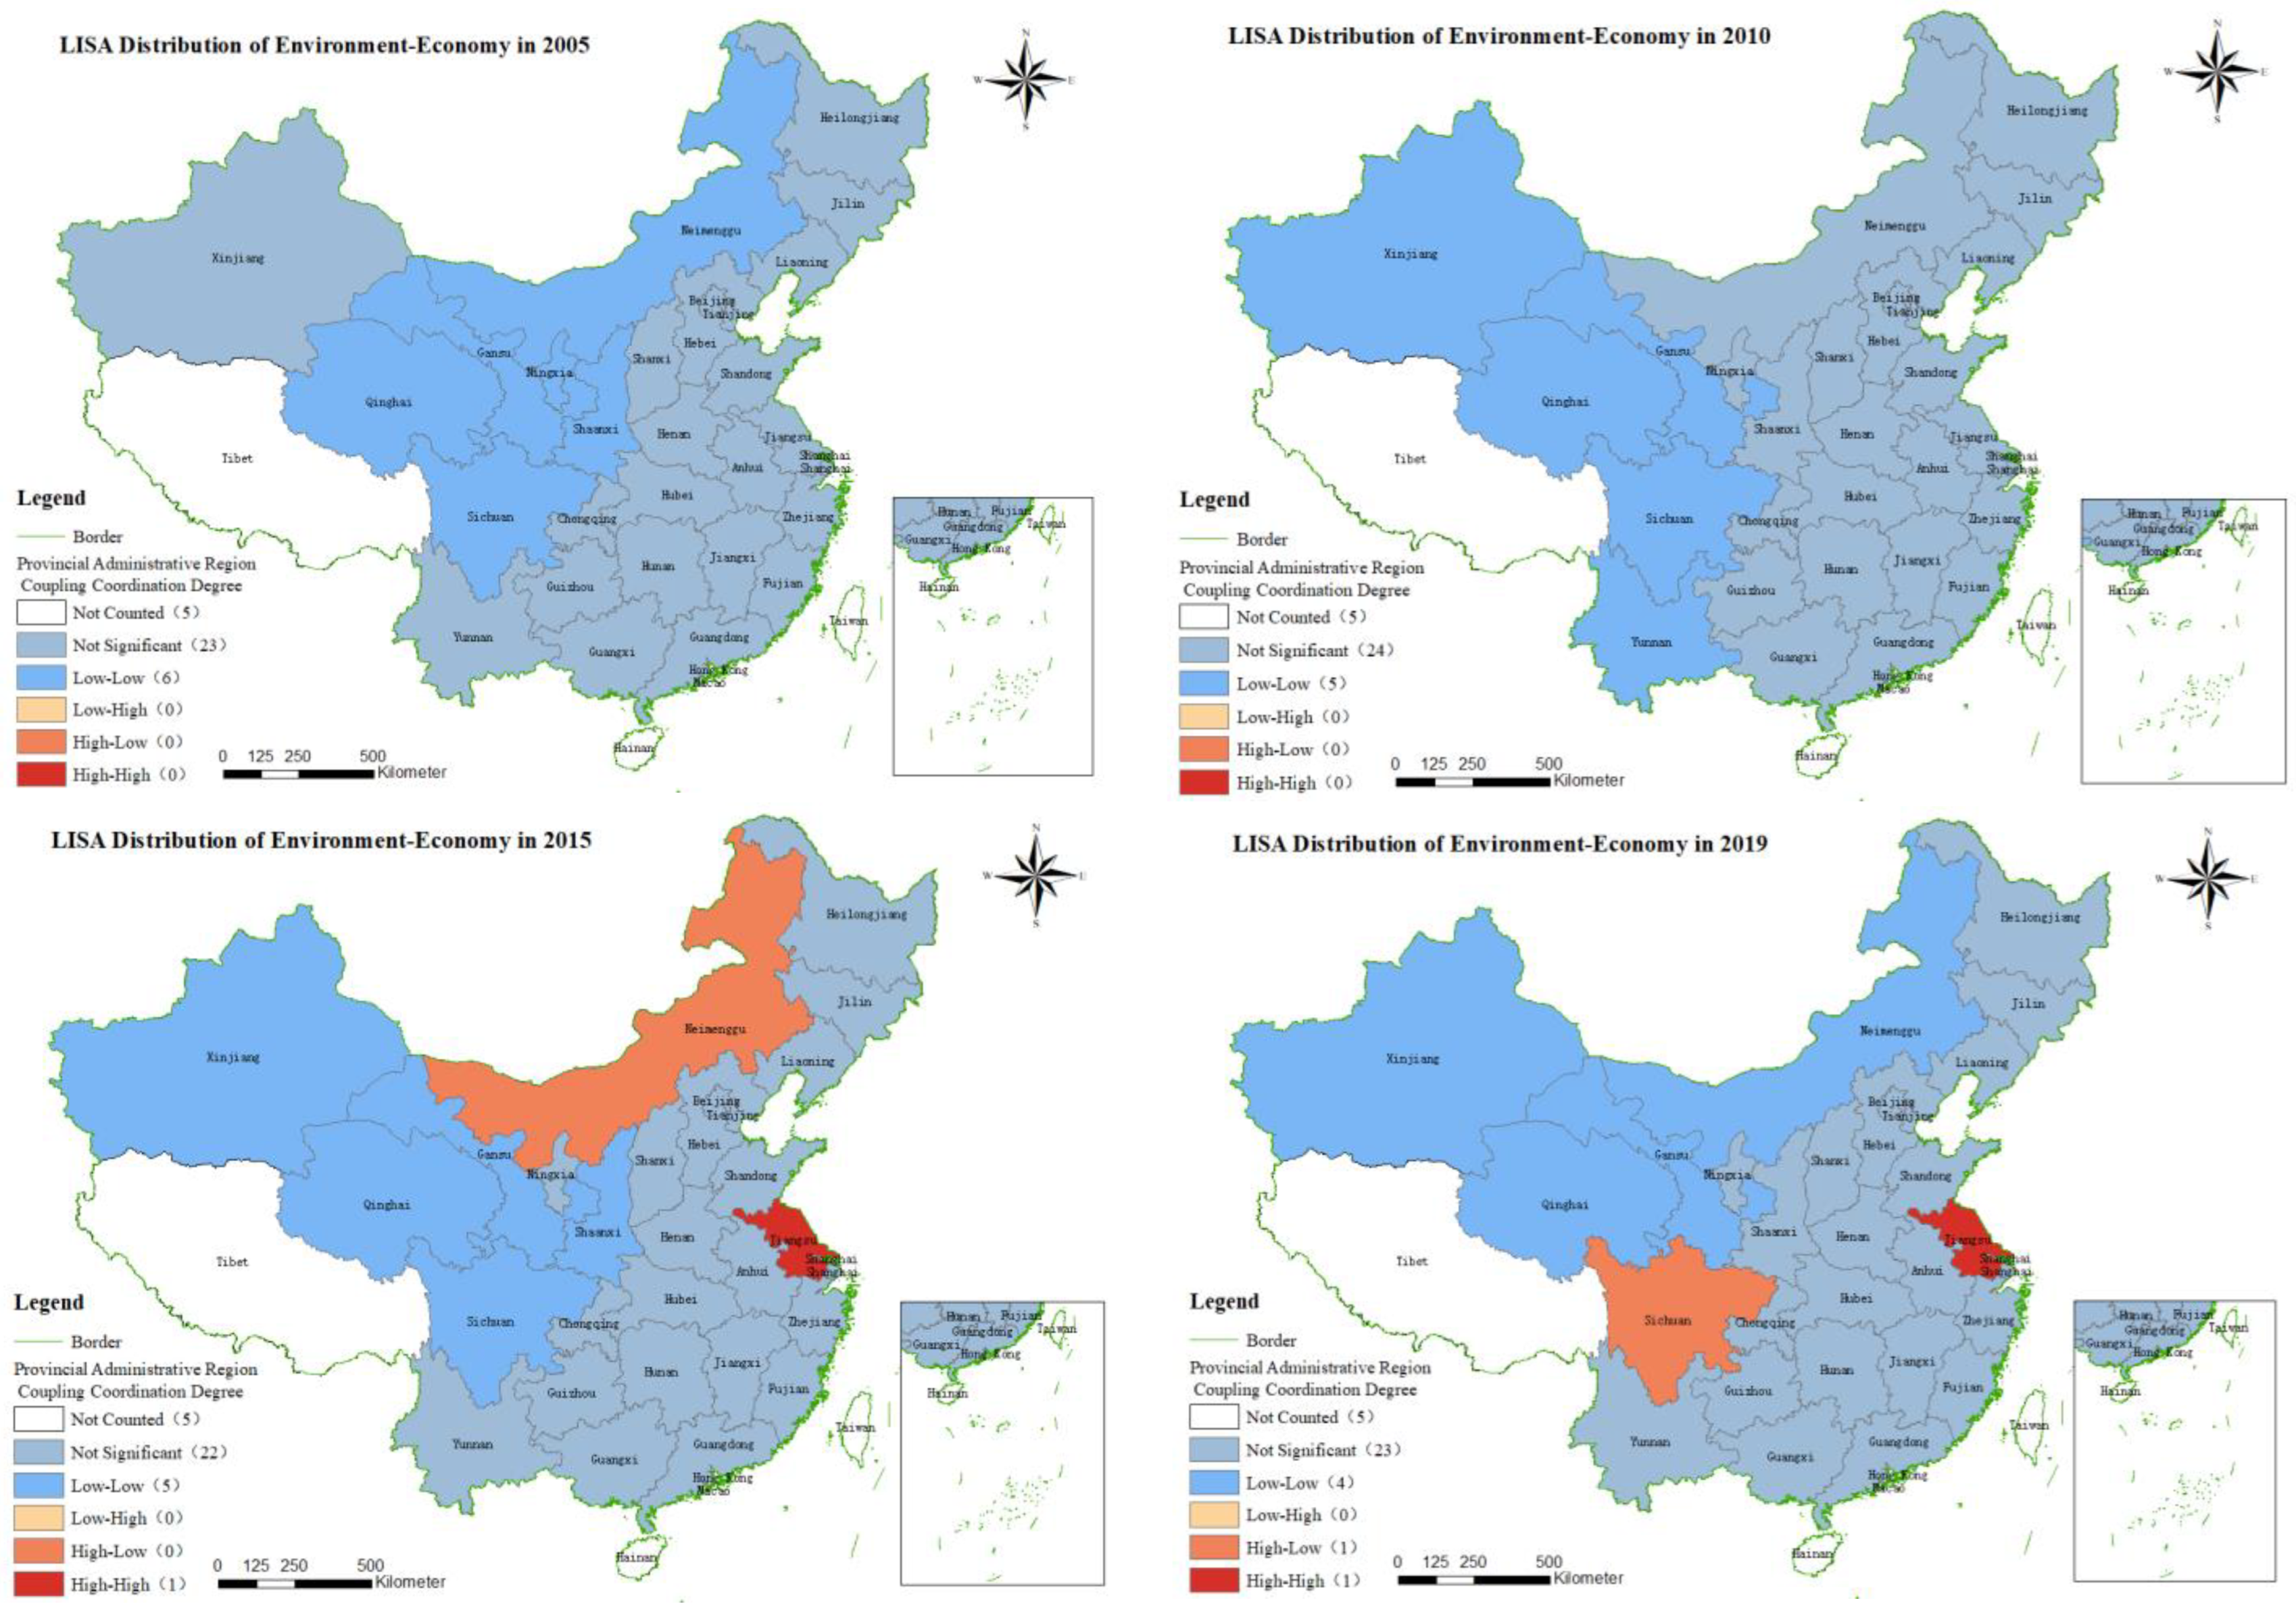
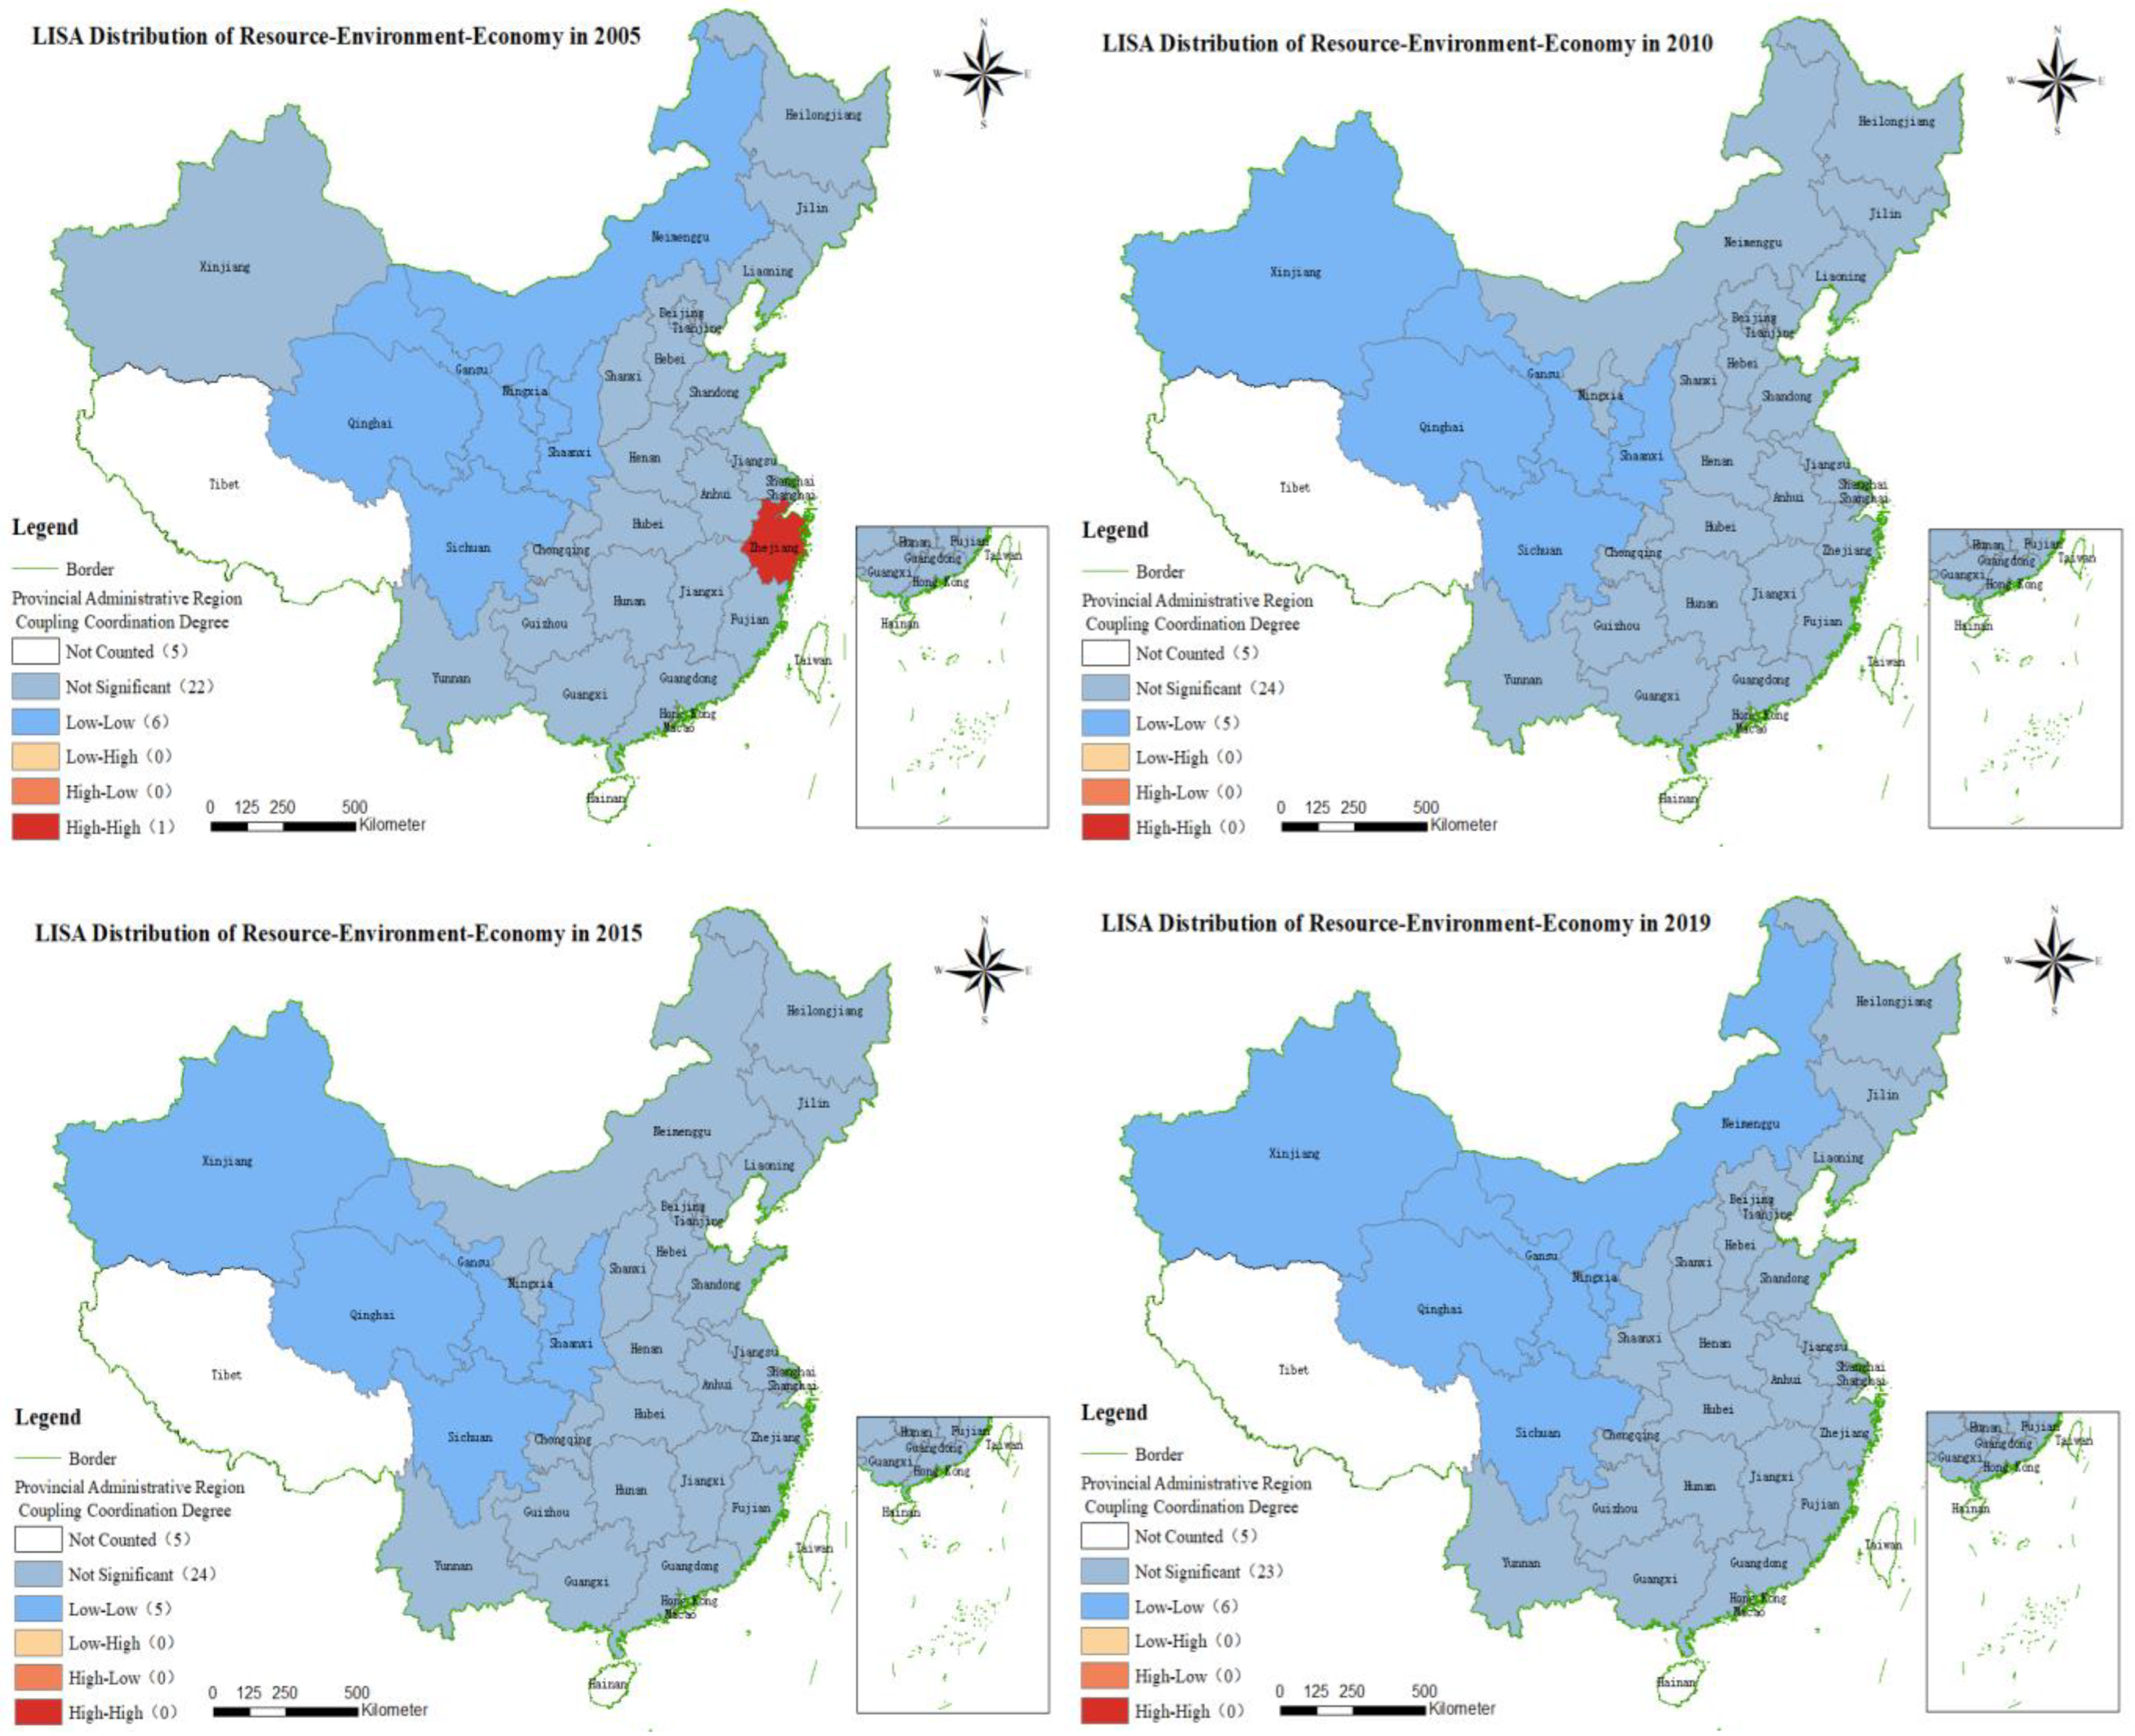
4.3.2. The LISA Diagram

Through the global spatial correlation analysis, the coupled coordination among the resource, environment, and economy of 30 provincial areas in China is spatially correlated but cannot illustrate the spatial correlation of local areas. The LISA diagram can visualize the specific effects of local spatial correlation through local spatial correlation analysis.
As can be seen from Figure 5, the local “low-low” clusters of environmental–economic coordination are more obvious. In 2005, six provinces in Qinghai, Gansu, Sichuan, Ningxia, Shaanxi, and Inner Mongolia were in the “low-low” aggregation category, while the other three provinces were in the “low-low” aggregation category. In 2015, Inner Mongolia’s environment–economy coupling coordination showed a “high-low” clustering category because Inner Mongolia vigorously developed its tertiary industry, mainly tourism, which led to economic growth and fewer pollution emissions. In 2015, Inner Mongolia’s environment–economy coupling coordination increased but was still lower than that of Xinjiang, Gansu, and Shaanxi, thus showing a “high-low” clustering category. In 2019, the environment–economy coupling coordination in Jiangsu was in the “high-high” aggregation category, indicating that the environment–economy coupling coordination in Jiangsu was high, and the environment–economy coupling coordination in its neighboring provinces such as Shanghai, Zhejiang, and Shandong were also high. In addition, in 2019, the environmental–economic coupling coordination in Sichuan was in the “high-low” aggregation category, indicating that the environmental–economic coupling coordination in Sichuan was high, while the environmental–economic coupling coordination in its neighboring provinces such as Qinghai, Yunnan, and Guizhou was low.
Figure 6 showed the local spatial coordination of the three systems (resource–environment–economy) coupling: a more obvious “low-low” aggregation category. Most of them are in the western region (e.g., Xinjiang, Qinghai, Sichuan). In 2005 and 2019, six provinces were in the “low-low” clustering category, and in 2010 and 2015, five provinces were in the “low-low” clustering category. The economic gap between the eastern and western regions is gradually increasing, and the economic development pattern of the western provinces is slow to change, resulting in a lower degree of the three systems. The spatial differences of the three systems in China’s provinces are obvious, with the economic development of the western provinces being more backward [62], resulting in a relatively low degree of coupling and coordination of the three systems. In addition, in 2005, the three-system coupling coordination in Zhejiang was in the “high-high” aggregation category, indicating that the three-system coupling coordination in Zhejiang is high, and the three-system coupling coordination in its neighboring provinces, such as Shanghai, Jiangsu, and Fujian, is also high. This is consistent with the spatial distribution characteristics of the coupling coordination degree in the above and further accurately verifies that the spatial distribution of the coordinated development of resource, environment, and economy is different, with the coupling coordination degree in coastal areas being higher and that in western areas being relatively lower.

5. Conclusions

This study measures the coordinated development of resource, environment, and economy in 30 provinces of China. The conclusions are the following:
(1) China’s resource–environment–economy system showed an overall upward trend in coordinated development from 2005 to 2019. Since 2012, the coupling coordination degree of environment–economy has shown a significant upward trend, surpassing the coupling coordination of resource–environment and resource–economy. In 2019, the resource–environment–economy system reached a good, coordinated stage.
(2) In terms of spatial distribution characteristics, there are significant differences between the coupled coordination of resource, environment, and economy in the 30 provinces of China. The degree of coupling coordination in coastal areas such as Shanghai, Guangdong, Zhejiang, and Jiangsu are already at an intermediate or good level, while the degree of coupling coordination in inland areas, especially in the northwest, is still at a minimal or elementary level. In addition, the coupling coordination between provinces is spatially aggregated.
(3) In the spatial correlation analysis, the Moran’s I index of the global spatial correlation analysis of the coupling coordination degree is positive, indicating that the coupling coordination degree is positively correlated in space. The local space shows a “low-low” aggregation category more obviously. The local spatial correlation analysis reveals that the coupling coordination in Jiangsu shows a “high-high” clustering category, while Xinjiang, Qinghai, Gansu, and Inner Mongolia show a “low-low” clustering category. The spatial correlation of the coupling coordination degree has been weakening over time, which indicates that the spatial distribution of resource, environment, and economic coordination development has developed in the direction of random distribution.

6. Discussion and Policy Recommendations

6.1. Limitations

(1) This study collected statistical data only from 2005 to 2019. However, as is well known, the COVID-19 pandemic has changed the economy, and the economic growth rate of most countries in the world has declined. The COVID-19 pandemic has also added pressure to environmental management and resource allocation [63]. The data under the pandemic situation in 2020–2022 are not comparable with the previous data. In the future, we should explore the coordinated development level of the resource–environment–economy system during the COVID-19 epidemic (2020–2022).
(2) General research indicators were used in this study, especially the environmental subsystem. However, the environmental system is a pluralistic and complex system. There should be differences in carbon emission intensity between different regions, which is an important research topic for sustainable development [64,65]. Future research can introduce relevant indicators of carbon emissions and explore the impact of greenhouse gases on climate change and economic development professionally.
(3) The subject of this study is a developing country, and the country has a global sustainable development strategy. However, due to the high degree of privatization and marketisation in developed countries internationally, there may be greater limitations in studying the resource–environment–economy system by administrative regional divisions. Future research could be based on government regional planning, with a focus on regional development, highlighting the impact of one pole of the system of economy, environment, and resource on the development of the region. Digital innovation of enterprises is an important aspect of economic sustainability transformation [66]. Future research can also consider the impact of the development strategies of leading enterprises within this system on the coordinated development of other regions of the country.

6.2. Policy Recommendations

Based on the results of the spatiotemporal measurement of the coordinated development of resource, environment, and economy, this paper proposes the following targeted recommendations.
(1) Vigorously develop new energy sources and improve the efficiency of resource use. For example, coastal provinces such as Beijing, Shanghai, Jiangsu, and Zhejiang have optimized their energy structures by vigorously developing renewable energy and new energy. Therefore, for provinces that rely excessively on resource consumption, they should actively promote the development of low-carbon and environmentally friendly fuels, wind, and solar energy projects; strictly control the growth of energy consumption in key industries; set upper limits on resource utilization; and comprehensively promote new energy vehicles to reduce energy consumption.
(2) Increase efforts to protect the environment and promote ecological civilization. For example, Shanghai is an economically developed region and also emits massive amounts of pollutants. Shanghai has exceeded its emission reduction targets and significantly reduced the emission of major pollutants, renovated and expanded urban sewage plants to enhance their sewage treatment capacity, and taken the lead in the country in implementing waste separation to reduce environmental pollution. Therefore, provinces with serious environmental pollution should learn from the experience of Shanghai and other provinces and establish an ecological civilization system based on prevention at source, process control, and accountability.
(3) Accelerate the transformation and upgrading of the economy and promote high-quality economic development. At present, Guangdong, Shanghai, Jiangsu, Zhejiang, and other provinces with more developed economies in China are taking the lead in developing new industries and optimizing their industrial structure, such that their economic transformation and upgrading are at an accelerated stage. For the more backward provinces such as Xinjiang, Gansu, Qinghai, and Ningxia, economic transformation and upgrading are at a slow start and need to accelerate the construction of a new “double-cycle” development pattern, deepen supply-side reform, implement green development, and adhere to the concept of coordinated development.
(4) Promote regional cooperation and coordinated development. China’s lack of balance is a major constraint on sustainable development. Policies in this regard should focus on strengthening regional cooperation and optimizing resource allocation. The government should promote the rural revitalization strategy and improve the economic strength of lagging regions.
These recommendations help promote the coordinated development of China’s provincial resource, environment, and economy, which are manifested mainly in improving resource utilization, living environment, and economic quality. Similar countries in the world can also draw lessons from this research.

Author Contributions

Conceptualization, H.W.; supervision, Y.Z.; investigation, Q.G.; resources, Q.G.; methodology, X.L.; writing—original draft preparation, X.L.; validation, X.L.; writing—review and editing, X.L. All authors have read and agreed to the published version of the manuscript.

Funding

This research received no external funding.

Institutional Review Board Statement

Not applicable.

Informed Consent Statement

Not applicable.

Data Availability Statement

Publicly available datasets were analyzed in this study. These data can be found here: http://www.stats.gov.cn/sj/ndsj/, http://nianjian.cnki.net/ (accessed on 1 March 2022).

Acknowledgments

Thanks to the anonymous reviewers and all the editors in the process of re-vision.

Conflicts of Interest

The authors declare no conflict of interest.

References

  1. He, J.; Wang, H. Economic structure, development policy and environmental quality: An empirical analysis of environmental Kuznets curves with Chinese municipal data. Ecol. Econ. 2012, 76, 49–59. [Google Scholar] [CrossRef]
  2. Lee, S.; Oh, D.-W. Economic growth and the environment in China: Empirical evidence using prefecture level data. China Econ. Rev. 2015, 36, 73–85. [Google Scholar] [CrossRef]
  3. Tyagi, S.; Garg, N.; Paudel, R. Environmental Degradation: Causes and Consequences. Eur. Res. 2014, 81, 1491. [Google Scholar] [CrossRef]
  4. Pata, U.K.; Erdogan, S.; Ozkan, O. Is reducing fossil fuel intensity important for environmental management and ensuring ecological efficiency in China? J. Environ. Manag. 2023, 329, 117080. [Google Scholar] [CrossRef]
  5. Chen, S. Environmental pollution emissions, regional productivity growth and ecological economic development in China. China Econ. Rev. 2015, 35, 171–182. [Google Scholar] [CrossRef]
  6. Pata, U.K.; Kumar, A. The Influence of Hydropower and Coal Consumption on Greenhouse Gas Emissions: A Comparison between China and India. Water 2021, 13, 1387. [Google Scholar] [CrossRef]
  7. Liu, K.; Lin, B. Research on influencing factors of environmental pollution in China: A spatial econometric analysis. J. Clean. Prod. 2019, 206, 356–364. [Google Scholar] [CrossRef]
  8. Li, Y.; Li, Y.; Zhou, Y.; Shi, Y.; Zhu, X. Investigation of a coupling model of coordination between urbanization and the environment. J. Environ. Manag. 2012, 98, 127–133. [Google Scholar] [CrossRef]
  9. Grossman, G.M.; Krueger, A.B. Environmental impacts of a North American free trade agreement. Soc. Sci. Electron. Publ. 1991, 8, 223–250. [Google Scholar]
  10. Erdogan, S. Analyzing the environmental Kuznets curve hypothesis: The role of disaggregated transport infrastructure investments. Sustain. Cities Soc. 2020, 61, 102338. [Google Scholar] [CrossRef]
  11. Baloch, M.A.; Ozturk, I.; Bekun, F.V.; Khan, D. Modeling the dynamic linkage between financial development, energy innovation, and environmental quality: Does globalization matter? Bus. Strategy Environ. 2020, 30, 176–184. [Google Scholar] [CrossRef]
  12. Wilfred, B. Economic growth and the environment: Whose growth? Whose environment? World Dev. 1992, 20, 481–496. [Google Scholar]
  13. Zhu, H.; Zheng, J.; Zhao, Q.; Kou, D. Economic growth, energy structure transformation and carbon dioxide emissions-empirical analysis based on panel data. Res. Econ. Manag. 2020, 41, 19–34. (In Chinese) [Google Scholar] [CrossRef]
  14. Zhou, Z.; Liu, Q.; Wang, W. Environmental Kuznets Curve Test of Relationship between Economic Growth and Industrial Environmental Pollution: Based on the Yangtze River Economic Belt Provincial Panel Measurement Model. J. Nanjing Technol. Univ. Soc. Sci. Ed. 2020, 19, 64–72+112. (In Chinese) [Google Scholar]
  15. Congregado, E.; Feria-Gallardo, J.; Golpe, A.A.; Iglesias, J. The environmental Kuznets curve and CO2 emissions in the USA. Environ Sci. Pollut. R. 2016, 23, 18407–18420. [Google Scholar] [CrossRef]
  16. Zambrano-Monserrate, M.A.; Fernandez, M.A. An Environmental Kuznets Curve for N2O emissions in Germany: An ARDL approach. Nat. Resour. Forum. 2017, 41, 119–127. [Google Scholar] [CrossRef]
  17. Oraby, T.; Bauch, C.T.; Anand, M. The environmental Kuznets curve fails in a globalized socio-ecological metapopulation: A sustainability game theory approach. Handb. Stat. 2018, 39, 315–341. [Google Scholar] [CrossRef]
  18. Maddison, D. Environmental Kuznets curves: A spatial econometric approach. J. Environ. Econ. Manag. 2006, 51, 218–230. [Google Scholar] [CrossRef]
  19. Cantele, M.; Bal, P.; Kompas, T.; Hadjikakou, M.; Wintle, B. Equilibrium Modeling for Environmental Science: Exploring the Nexus of Economic Systems and Environmental Change. Earths Future 2021, 9, e2020EF001923. [Google Scholar] [CrossRef]
  20. Yu, Y.; Nie, J.; Jahanger, A. An Evaluation of the Energy-Related Carbon Dioxide Emissions From China’s Light Sector to Achieve Sustainable Development Goals. Eval. Rev. 2023. [Google Scholar] [CrossRef]
  21. Yu, Y.; Hou, J.; Jahanger, A.; Cao, X.; Balsalobre-Lorente, D.; Radulescu, M.; Jiang, T. Decomposition analysis of China’s chemical sector energy-related CO2 emissions: From an extended SDA approach perspective. Energy Environ. 2023. [Google Scholar] [CrossRef]
  22. Gai, M.; Nie, C.; Ke, L. Carrying capacity and coordinated development of ERE system in the coastal area of Bohai Sea. Econ. Geogr. 2018, 38, 163–172. (In Chinese) [Google Scholar] [CrossRef]
  23. Hui, T.; Guo, X. Measuring the level of coordinated economic-resource-environmental development in the western region. Stat. Decis. 2019, 35, 124–128. (In Chinese) [Google Scholar] [CrossRef]
  24. Cao, Y.; Lin, W. Evaluation of Sustainable Development of Cities in Henan Province Based on Grey Correlation Analysis. Math. Pract. Theory 2019, 49, 18–24. (In Chinese) [Google Scholar]
  25. Zhang, C.; Zhong, C.; Jiang, T.; Li, X. Spatio-Temporal differentiation of regional coordinated development and its influencing factors in china. Econ. Geogr. 2020, 40, 15–26. [Google Scholar] [CrossRef]
  26. Gao, J.; An, T.; Shen, J.; Zhang, K.; Yin, Y.; Zhao, R.; He, G.; Hynes, S.; Jattak, Z.U. Development of a land-sea coordination degree index for coastal regions of China. Ocean. Coast. Manag. 2022, 230, 106370. [Google Scholar] [CrossRef]
  27. Yang, H.; Zhang, C. Research on the effective route of ecological civilization construction in Yunnan Province based on System Dynamics. China Popul. Resour. Environ. 2019, 29, 16–24. (In Chinese) [Google Scholar] [CrossRef]
  28. Peng, X.; Cheng, J.; Fang, C. Coordinated development of economy, resources and environment in the Yangtze River Economic Belt based on “Three Lines and One Order”. China Popul. Resour. Environ. 2021, 31, 163–173. (In Chinese) [Google Scholar] [CrossRef]
  29. Lu, J.; Chang, H.; Wang, Y. Dynamic evolution of provincial energy economy and environment coupling in China’s regions. China Popul. Resour. Environ. 2017, 27, 60–68. (In Chinese) [Google Scholar]
  30. Xing, L.; Xue, M.G.; Hu, M.S. Dynamic simulation and assessment of the coupling coordination degree of the economy-resource-environment system: Case of Wuhan City in China. J. Environ. Manag. 2019, 230, 474–487. [Google Scholar] [CrossRef]
  31. Yang, Z.; Zhan, J.; Wang, C.; Twumasi-Ankrah, M.J. Coupling coordination analysis and spatiotemporal heterogeneity between sustainable development and ecosystem services in Shanxi Province. China Sci. Total Environ. 2022, 836, 155625. [Google Scholar] [CrossRef]
  32. Liang, L.; Zhang, F.; Wu, F.; Chen, Y.X.; Qin, K.Y. Coupling coordination degree spatial analysis and driving factor between socio-economic and eco-environment in northern China. Ecol. Indic. 2022, 135, 108555. [Google Scholar] [CrossRef]
  33. Weng, Q.Q.; Lian, H.H.; Qin, Q.D. Spatial disparities of the coupling coordinated development among the economy, environment and society across China’s regions. Ecol. Indic. 2022, 143, 109364. [Google Scholar] [CrossRef]
  34. Shi, T.; Yang, S.; Zhang, W.; Zhou, Q. Coupling coordination degree measurement and spatiotemporal heterogeneity between economic development and ecological environment—Empirical evidence from tropical and subtropical regions of China. J. Clean. Prod. 2020, 244, 118739. [Google Scholar] [CrossRef]
  35. Yang, Y.; Hu, N. The spatial and temporal evolution of coordinated ecological and socioeconomic development in the provinces along the Silk Road Economic Belt in China. Sustain. Cities Soc. 2019, 47, 101466. [Google Scholar] [CrossRef]
  36. Xing, Q.; Guo, C. Empirical Analysis on Coordination Degree of China’s Energy, Economic and Environment(3E). J. Nanjing Univ. Financ. Econ. 2014, 186, 15–20. (In Chinese) [Google Scholar]
  37. Li, L.; Wang, B.; Xu, J. The analysis on the areal difference of coordinating degree between regional economy and ecological environment-based on comprehensive evaluation method. Sci. Technol. Manag. Res. 2014, 34, 36–41. (In Chinese) [Google Scholar] [CrossRef]
  38. Zhang, G.; Wang, J.; Wu, K.; Xu, Z. Spatial-temporal characteristics and influencing factors of coordination between economic and environmental development of three major urban agglomerations in China. Geogr. Res. 2020, 39, 272–288. (In Chinese) [Google Scholar] [CrossRef]
  39. Li, J.; Wang, Y.; Wang, Y. Decoupling analysis and influence factors between resource environment and economic growth in Beijing-Tianjin-Hebei region. Econ. Geogr. 2019, 39, 43–49. (In Chinese) [Google Scholar] [CrossRef]
  40. Zhang, K.; Zhong, Q.; Qu, P.; Yin, Y.; Zuo, Y. Grey Forecasting Model of rural water environment quality based on web search information. Chin. J. Manag. Sci. 2020, 28, 222–230. (In Chinese) [Google Scholar] [CrossRef]
  41. Han, R.; Tong, L.; Zhu, S.; Lu, Z. The coordinated development of economy and environment based on ARMA model in Shenyang Economic Zone. Sci. Geogr. Sin. 2014, 34, 32–39. (In Chinese) [Google Scholar] [CrossRef]
  42. Liu, W.; Zhou, W.; Lu, L. An innovative digitization evaluation scheme for Spatio-temporal coordination relationship between multiple knowledge driven rural economic development and agricultural ecological environment—Coupling coordination model analysis based on Guangxi. J. Innov. Knowl. 2022, 7, 100208. [Google Scholar] [CrossRef]
  43. Zhang, Y.; Khan, S.U.; Swallow, B.; Liu, W.; Zhao, M. Coupling coordination analysis of China’s water resources utilization efficiency and economic development level. J. Clean. Prod. 2022, 373, 133874. [Google Scholar] [CrossRef]
  44. Bildirici, M.; Ersin, O.O. Economic growth and CO2 emissions: An investigation with smooth transition autoregressive distributed lag models for the 1800-2014 period in the USA. Environ. Sci. Pollut. Res. Int. 2018, 25, 200–219. [Google Scholar] [CrossRef]
  45. Bildirici, M.; Ersin, O. Markov-switching vector autoregressive neural networks and sensitivity analysis of environment, economic growth and petrol prices. Environ. Sci. Pollut. Res. Int. 2018, 25, 31630–31655. [Google Scholar] [CrossRef]
  46. Tomal, M. Evaluation of coupling coordination degree and convergence behaviour of local development: A spatiotemporal analysis of all Polish municipalities over the period 2003–2019. Sustain. Cities Soc. 2021, 71, 102992. [Google Scholar] [CrossRef]
  47. Naikoo, M.W.; Shahfahad; Talukdar, S.; Ishtiaq, M.; Rahman, A. Modelling built-up land expansion probability using the integrated fuzzy logic and coupling coordination degree model. J. Environ. Manag. 2023, 325, 116441. [Google Scholar] [CrossRef]
  48. Ye, J.; Tian, L.; Zhou, Y. Regional Energy–Economy–Environment Coupling Coordinated Development System Driven by Carbon Peaking and Carbon Neutralization over 13 Cities in Jiangsu Province. Sustainability 2023, 15, 1588. [Google Scholar] [CrossRef]
  49. Lu, C.; Yang, J.; Li, H.; Jin, S.; Pang, M.; Lu, C. Research on the Spatial–Temporal Synthetic Measurement of the Coordinated Development of Population-Economy-Society-Resource-Environment (PESRE) Systems in China Based on Geographic Information Systems (GIS). Sustainability 2019, 11, 2877. [Google Scholar] [CrossRef]
  50. Xu, L.; Li, M. A Data preprocessing Method in Dynamic Comprehensive Evaluation. Chin. J. Manag. Sci. 2020, 28, 162–169. (In Chinese) [Google Scholar] [CrossRef]
  51. Chen, G.; Liu, X.; Jiang, S.; Ding, C.; Guo, Q.; Yang, L. Measurement and path selection of coupling and coordinated development of rural revitalization in Hunan Province. Econ. Geogr. 2019, 39, 191–197. (In Chinese) [Google Scholar] [CrossRef]
  52. Lu, C.Y.; Liu, X.W.; Zhang, T.; Huang, P.; Tang, X.L.; Wang, Y.J. Comprehensive Measurement of the Coordinated Development of China’s Economic Growth, Energy Consumption, and Environmental Conservation. Energies 2022, 15, 6149. [Google Scholar] [CrossRef]
  53. Zou, C.; Zhu, J.W.; Lou, K.L.; Yang, L. Coupling coordination and spatiotemporal heterogeneity between urbanization and ecological environment in Shaanxi Province, China. Ecol. Indic. 2022, 141, 109152. [Google Scholar] [CrossRef]
  54. He, Y.Q.; Pan, X.X.; Wang, Y.; Lei, S.Y. Evaluation and Analysis on Coupling Coordinated Development of Urban Resource, Environment and Economy in Jiangxi Province in China. Prog. Environ. Prot. Process. Resour. 2013, 295–298, 2457–2463. [Google Scholar] [CrossRef]
  55. Shen, W.; Lu, F.X.; Qin, Y.C.; Zhou, Y.S.; Xie, Z.X. The Spatial Quantitative Evaluation and Coupling Coordination Degree of Urban Ecosystem Carrying Capacity: A Case Study of the Urban Agglomeration in the Middle Reaches of the Yangtze River, China. Appl. Ecol. Environ. Res. 2019, 17, 15169–15190. [Google Scholar] [CrossRef]
  56. Chen, N.; Qin, F.; Zhai, Y.X.; Cao, H.P.; Zhang, R.; Cao, F.P. Evaluation of coordinated development of forestry management efficiency and forest ecological security: A spatiotemporal empirical study based on China’s provinces. J. Clean. Prod. 2020, 260, 121042. [Google Scholar] [CrossRef]
  57. Wen, S.; Lin, B.; Zhou, Y. Does financial structure promote energy conservation and emission reduction? Evidence from China. Int. Rev. Econ. Financ. 2021, 76, 755–766. [Google Scholar] [CrossRef]
  58. He, K.; Fan, C.; Zhong, M.; Cao, F.; Wang, G.; Cao, L. Evaluation of Habitat Suitability for Asian Elephants in Sipsongpanna under Climate Change by Coupling Multi-Source Remote Sensing Products with MaxEnt Model. Remote Sens. 2023, 15, 1047. [Google Scholar] [CrossRef]
  59. Wang, J.K.; Han, Q.; Wu, K.X.; Xu, Z.T.; Liu, P. Spatial-temporal patterns and evolution characteristics of the coordinated development of industrial economy, natural resources and environment in China. Resour. Policy 2022, 75, 102463. [Google Scholar] [CrossRef]
  60. Chen, Y.; Tian, W.; Zhou, Q.; Shi, T. Spatiotemporal and driving forces of Ecological Carrying Capacity for high-quality development of 286 cities in China. J. Clean. Prod. 2021, 293, 126186. [Google Scholar] [CrossRef]
  61. Guo, H.P.; Yi, X.; Pan, C.L.; Yang, B.M.; Li, Y. Analysis on the Temporal and Spatial Features of the Coupling and Coordination of Industrialization and Agricultural Green Development in China during 1990–2019. Int. J. Environ. Res. Public Health 2021, 18, 8320. [Google Scholar] [CrossRef] [PubMed]
  62. Liu, Y.B.; Liu, W.; Yan, Y.A.; Liu, C.Y. A perspective of ecological civilization: Research on the spatial coupling and coordination of the energy-economy-environment system in the Yangtze River Economic Belt. Environ. Monit. Assess. 2022, 194, 403. [Google Scholar] [CrossRef] [PubMed]
  63. Ongoma, V.; Epule, T.E.; Brouziyne, Y.; Tanarhte, M.; Chehbouni, A. COVID-19 response in Africa: Impacts and lessons for environmental management and climate change adaptation. Environ. Dev. Sustain. 2023, 1–23. [Google Scholar] [CrossRef] [PubMed]
  64. Cui, Y.; Khan, S.U.; Deng, Y.; Zhao, M. Spatiotemporal heterogeneity, convergence and its impact factors: Perspective of carbon emission intensity and carbon emission per capita considering carbon sink effect. Environ. Impact Assess. Rev. 2022, 92, 106699. [Google Scholar] [CrossRef]
  65. Wu, Y.; Tam, V.W.Y.; Shuai, C.; Shen, L.; Zhang, Y.; Liao, S. Decoupling China’s economic growth from carbon emissions: Empirical studies from 30 Chinese provinces (2001–2015). Sci. Total Environ. 2019, 656, 576–588. [Google Scholar] [CrossRef]
  66. Yin, S.; Zhang, N.; Ullah, K.; Gao, S. Enhancing Digital Innovation for the Sustainable Transformation of Manufacturing Industry: A Pressure-State-Response System Framework to Perceptions of Digital Green Innovation and Its Performance for Green and Intelligent Manufacturing. Systems 2022, 10, 72. [Google Scholar] [CrossRef]
Figure 1. Time series variation in the coupled coordination of resource, environment, and economy for the provincial mean.
Sustainability 15 06995 g001
Figure 2. Time series characteristics of the coupled resource, environment, and economic coordination of the six regions.
Sustainability 15 06995 g002
Figure 3. Characteristics of the spatial distribution of environment–economic coupling coordination.
Sustainability 15 06995 g003
Figure 4. Spatial distribution characteristics of resource–environment–economy coupling coordination.
Sustainability 15 06995 g004aSustainability 15 06995 g004b
Figure 5. LISA distribution of coupled environment–economy coordination.
Sustainability 15 06995 g005
Figure 6. LISA distribution of coupled resource–environment–economy coordination.
Sustainability 15 06995 g006
Table 1. Evaluation index system for coordinated resource–environment–economy development.
SystemsTier 1 IndicatorsTier 2 IndicatorsCodeUnitDirection
ResourceResource consumptionTotal energy consumptionX1million tons of standard coal-
Coal consumptionX2million tons-
Natural gas consumptionX3billion cubic meters-
Electricity consumptionX4billion kWh-
Water consumptionX5billion cubic meters-
Resource efficiencyEnergy consumption elasticity factorX6--
Electricity consumption elasticity factorX7--
Energy consumption per CNY 10,000 of GDPX8tons of standard coal/CNY 10,000-
Electricity consumption per CNY 10,000 of GDPX9kWh/million-
Water consumption per CNY 10,000 of GDPX10cubic meters/CNY 10,000-
EnvironmentEnvironmental pollutionSulfur dioxide emissionsY1ton-
Industrial fume emissionsY2ton-
Industrial wastewater dischargeY3million tons-
Respirable particulate matter PM10Y4mg/m3-
Environmental qualityGreenery coverageY5%+
Green space per capitaY6cubic meters per person+
Integrated industrial solid waste volumeY7million tons+
Annual completed investment in industrial pollution controlY8million+
Harmless disposal rate of domestic wasteY9%+
EconomyEconomy scaleGDP per capitaZ1billion+
Total investment in fixed assetsZ2billion+
Total retail sales of social consumer goodsZ3billion+
Total imports and exportsZ4billion+
General budget revenue of local financeZ5billion+
Economic qualityRatio of urban to rural disposable incomeZ6%-
Fixed asset input–output ratioZ7%+
Urbanization rateZ8%+
Economic structureGDP percentage of tertiary sectorZ9%+
GDP percentage of industryZ10%-
Construction as a share of GDPZ11%-
Scientific research expenditure as a percentage of GDPZ12%+
Table 2. Classification criteria for coupling coordination levels.
No.Coupling CoordinationGrade StageTypeStage Characteristics
1(0.0, 0.1]Extreme disordersTypes of dysfunctional declinePoorly developed inter-system coordination, complex systems in a dysfunctional decline stage
2(0.1, 0.2]Severe disorders
3(0.2, 0.3]Severe disorders
4(0.3, 0.4]Mild disorders
5(0.4, 0.5]On the verge of disorder
6(0.5, 0.6]Reluctantly coordinatedType of coordinated developmentThe system begins to enter a phase of coordinated development and synergies between systems begin to develop
7(0.6, 0.7]Primary coordination
8(0.7, 0.8]Intermediate coordination
9(0.8, 0.9]Good coordination
10(0.9, 1.0]Quality coordinationInter-system synergy development
Table 3. Coupling coordination value of resource–environment–economy system.
Provinces200520062007200820092010201120122013201420152016201720182019
Beijing0.4360.4870.5760.6400.6360.6670.7240.7300.7740.8060.8400.8190.8480.8180.862
Tianjin0.4670.5170.5610.6020.6290.6400.6720.6870.6960.7310.7780.8250.8410.8110.842
Hebei0.4500.4620.5320.5880.6150.6710.6740.6880.7190.7750.8170.8220.8500.8420.883
Shanxi0.4530.4740.5480.6440.6600.6420.6550.6880.7130.7360.7810.8080.7780.7810.824
Inner Mongolia0.5300.5070.5870.6460.6760.6810.6820.7050.7430.7940.8050.8360.8230.7960.803
Liaoning0.5320.5600.5650.6050.6280.6560.6660.7110.7320.7440.7710.7740.8220.8210.818
Jilin0.4810.5190.5690.5900.6030.6270.6200.6480.6780.7210.7590.8240.8240.8270.864
Heilongjiang0.4060.4350.5090.5780.6130.6590.6870.6830.7420.7620.7950.8140.8090.8450.860
Jiangsu0.4650.4750.5680.6160.5960.6270.6630.6950.7260.7620.8000.8160.8440.8610.864
Shanghai0.4690.5290.5600.6020.6510.6260.6410.6830.6730.7390.7320.7900.8190.8440.861
Zhejiang0.4100.4270.4530.5020.5650.5730.5980.6850.6890.7580.8090.8270.8390.8480.911
Anhui0.5400.5250.5510.5680.5700.5800.6020.6400.6700.7080.7290.8050.8460.8530.856
Fujian0.5460.5130.5490.5840.6210.5950.5540.6650.6830.6610.7490.7780.7880.7860.821
Jiangxi0.5090.4990.5370.6270.6520.6740.6690.7100.7240.7310.7540.7700.8200.8420.848
Shandong0.4320.4890.5290.5920.6200.6430.6860.7320.7560.8050.7920.8460.8820.8660.861
Hubei0.4960.5080.5610.5950.6000.6210.6090.6400.6980.7190.7420.8320.8440.8540.861
Henan0.4340.4410.4990.5300.5660.5750.6130.6600.6770.7320.7470.8250.8490.8490.883
Hunan0.4310.5100.5600.5930.6150.6390.6350.6700.7030.7330.7840.8030.8340.8270.861
Guangdong0.3440.3950.4680.5570.5860.6150.6470.7060.7410.7370.8080.8380.8610.8690.877
Guangxi0.4620.4980.5440.5850.6370.6270.6890.7300.7520.7750.8180.8470.8580.8300.868
Hainan0.5680.5400.5560.6030.6380.6590.6720.7240.7540.7750.7570.8160.8340.7980.801
Chongqing0.4110.4210.5500.6330.6260.6670.6940.7240.7710.7540.7950.8130.8500.8680.868
Sichuan0.4810.5070.5590.6030.5770.6150.6370.6740.7110.7420.7620.7940.8240.8410.858
Gansu0.4730.4950.5070.5640.6060.6010.6070.6500.6750.7010.7280.8300.7910.7930.858
Ningxia0.5420.5330.5580.5920.6190.6880.6390.7030.7390.7970.7700.8600.8190.8230.827
Shaanxi0.5440.5440.5700.6040.6500.6780.6820.6880.7140.7290.7680.7660.7770.8070.831
Qinghai0.5640.5580.5850.5570.6070.6260.6790.6950.6810.7390.7640.8160.7910.8000.837
Xinjiang0.5180.4840.5730.5880.6610.6760.6870.6710.6730.7060.7400.7960.8300.8390.831
Yunnan0.4780.4850.5490.5800.6320.6470.6470.6770.7200.7590.7960.8280.8410.8540.883
Guizhou0.4880.4680.4830.5840.6040.6300.6330.6650.7170.7510.7910.8050.8180.8380.872
Mean-value0.4790.4930.5440.5920.6190.6370.6520.6880.7150.7460.7760.8140.8280.8310.853
Table 4. Rank classification of three-system coupling coordination in 30 provinces in China.
Coupling Coordination Level2005201020152019
Reluctantly coordinatedXinjiang, Ningxia, ShanxiGuizhou, Xinjiang, Qinghai, GansuGansu, XinjiangXinjiang
Primary coordinationJilin, Hubei, Shandong, Hunan, Jiangxi, Anhui, Heilongjiang, Hebei, Guangxi, Sichuan, Henan, Chongqing, Shaanxi, Yunnan, Qinghai, Inner Mongolia, Guizhou, GansuShanxi, Henan, Yunnan, Guangxi, Ningxia, Sichuan, Inner Mongolia, Anhui, Hebei, Shaanxi, Heilongjiang, Jilin, Hunan, Jiangxi, Liaoning, HubeiHunan, Hubei, Heilongjiang, Chongqing, Liaoning, Anhui, Jilin, Shandong, Guangxi, Inner Mongolia, Sichuan, Hebei, Jiangxi, Shaanxi, Yunnan, Henan, Guizhou, Shanxi, Ningxia, QinghaiHunan, Anhui, Chongqing, Henan, Shandong, Jiangxi, Sichuan, Heilongjiang, Guangxi, Liaoning, Jilin, Shaanxi, Yunnan, Hebei, Shanxi, Guizhou, Inner Mongolia, Gansu, Ningxia, Qinghai
Intermediate coordinationGuangdong, Tianjin, Jiangsu, Fujian, Zhejiang, Hainan, LiaoningTianjin, Guangdong, Zhejiang, Jiangsu, Fujian, Hainan, Shandong, ChongqingTianjin, Zhejiang, Guangdong, Hainan, Fujian, JiangsuTianjin, Zhejiang, Guangdong, Hubei, Fujian, Hainan, Jiangsu
Good coordinationBeijing, ShanghaiBeijing, ShanghaiBeijing, ShanghaiBeijing, Shanghai
Table 5. Results of Moran’s I test for global autocorrelation of coupled environment–economy coordination.
2005201020152019
Moran’s I Index0.4750.4590.4520.432
Z-value4.1724.1144.0153.891
p-value0.0010.0010.0010.001
Table 6. Results of Moran’s I test for global autocorrelation of coupled resource–environment–economy coordination.
2005201020152019
Moran’s I Index0.4880.4890.4690.447
Z-value4.2534.3134.1663.973
p-value0.0010.0010.0010.001
Disclaimer/Publisher’s Note: The statements, opinions and data contained in all publications are solely those of the individual author(s) and contributor(s) and not of MDPI and/or the editor(s). MDPI and/or the editor(s) disclaim responsibility for any injury to people or property resulting from any ideas, methods, instructions or products referred to in the content.

